Embed Size (px)
Citation preview

Application of the derivative technique to our earlier data, obtained with lower S / N ratio, did indicate the presence of asymmetry in the band at about 2057 cm -~, but the noise level was higher, and the interpretation more difficult. This clearly demonstrates the importance of improving the S / N ratio in the spectrum by experi- mental means, such as R C smoothing and signal aver- aging.
ACKNOWLEDGMENTS
We thank the Science and Engineering Research Council for an equipment grant (GR/B/00817).
1. J. B. Gill, Pure Appl. Chem. 53, 1365 (1981). 2. W. F. Maddams, Appl. Spectrosc. 34, 245 (1980). 3. P. Gans and J. B. Gill, Anal. Chem. 52, 531 (1980). 4. J. R. Morrey, Anal. Chem. 40, 905 (1968}. 5. P. D. Willson and T. H. Edwards, Appl. Spectrosc. Rev. 12, 1 (1976). 6. A. Savitzky and M. J. E. Golay, Anal. Chem. 36, 1627 (1964); J. Steinier, Y.
Termonia, and J. Deltour, Anal. Chem. 44, 1906 (1972). 7. C. G. Enke and T. A. Nieman, Anal. Chem. 48, 705A {1976). 8. T. C. O'Haver and T. Begley, Anal. Chem. 53, 1876 (1981). 9. H. Ziegler, Appl. Spectrosc. 35, 88 (1981).
10. R. W. Hamming, Digital Filters (Prentice Hall Inc., Englewood Cliffs, NJ, 1977).
11. P. Gans, J. B. Gill, and M. Griffin, J. Am. Chem. Soc. 98, 4661 (1976).
A P P E N D I X
Algebraic solution of Eq. 1 leads, after simplification, to the following formulae for the weights for quadratic convolution functions.
Smoothing: W I v [3N 2 - 7 - 5(2p)2]/4 = N ( N 2 - 4)/3 (I)
(2p) First derivative: W2p = N ( N 2 _ 1)/6 (II)
with 2p = 1 - N, 3 - N, 5 - N . . . N - 3, N - 1. N m a y be either even or odd, but must be greater than 3. The formulae have been chosen so that both numerator and denominator are integers and can be calculated using integer arithmetic. Factors common to numerator and denominator can be removed from Eq. I as follows (a is an arbitrary positive integer):
N = 4a + 2; common factor is 2
N = 5a + 2 or 5a + 3; common factor is 5
A common factor of 2 is present in numerator and denominator of Eq. II when N is odd.
The weights for multipass functions can be built up by successive combination of pairs of functions of width N and N ' using the formula of Savitzky and Golay 6
i=n j=n' W£/,i+j = 2 2 WkiWkj ( I I I )
i=-n j=-n'
Note that since i + j is constant, Eq. III shows that the new weights are produced by convoluting together the old weights. To use Eq. III, accumulate the weights W " in parallel while running the two variables i andj through their summation ranges. This is equivalent to forming the N x N ' array of products and summing those prod- ucts for which i + j is constant.
Copies of our program MULTISMOOTH are available in extended BASIC and in FORTRAN. The program incorporates the formulae given above and the new cri- terion for selecting N. It enables a set of convolution weights to be constructed which are equivalent to P passes of a N point function and P ' passes of a N ' point function.
Implicit Apodization of Interferograms in Fourier Transform Spectroscopy
A S L A N BAGHDADI Semiconductor Materials and Processes Division, National Bureau of Standards, Washington, D. C. 20234
The removal of secondary and tertiary interferograms from the main interferogram in Fourier transform spectroscopy can lead to an implicit apodization of the specimen interferogram. This effect can result in the generation of unwanted artifacts in the specimen's transmittance or absorption spectrum. One approach for avoiding this problem is to use an apodization function on the background and reference interferograms which matches the function used on the specimen interfero- gram.
Index Headings: Infrared; Methods, analytical; Techniques, spectroscopic.
Received 16 Augus t 1982; revision received 25 October 1982.
520 Volume 37, Number 6, 1983
I N T R O D U C T I O N
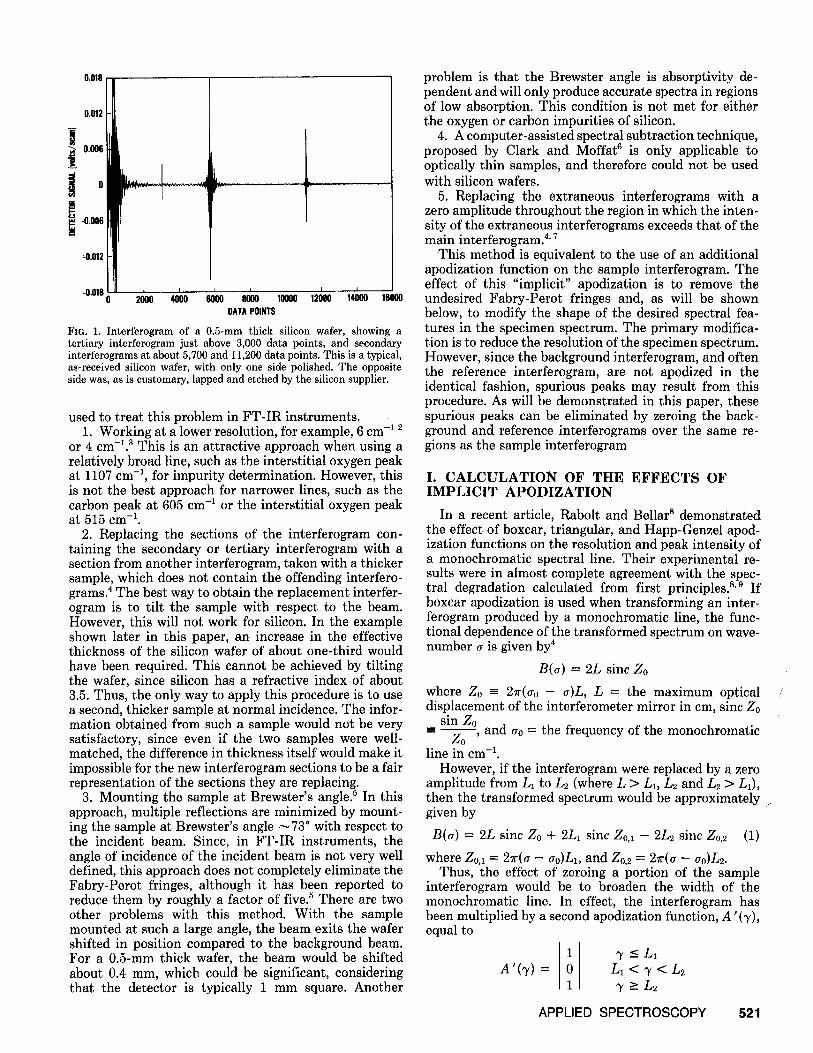
Infrared spectra of thin semiconductor wafers can contain Fabry-Perot fringes resulting from multiple passes, both within the wafer, and between its surfaces and the interferometer. 1 The fringes can obscure weak features in the spectra, as well as reduce the accuracy of quantitative measurements. In Fourier transform-in- frared spectrophotometry (FT-IR), the effects of multi- ple passes are evident upon the initial examination of the interferogram as a series of secondary and tertiary interferograms, superimposed upon the main interfero- gram, as shown in Fig. 1. Several methods have been
APPLIED SPECTROSCOPY
0.019
0.012
W ~ 0.005
i ° • - 0 . ~
~ 0 . 0 1 2
-0,018 0 I I I
2000 4000 6000 8000 10000 12000 14000 16000 DATA POINTS
FIG. 1. Interferogram of a 0.5-mm thick silicon wafer, showing a tertiary interferogram just above 3,000 data points, and secondary interferograms at about 5,700 and 11,200 data points. This is a typical, as-received silicon wafer, with only one side polished. The opposite side was, as is customary, lapped and etched by the silicon supplier.
used to treat this problem in FT-IR instruments. 1. Working at a lower resolution, for example, 6 cm -1 2
or 4 cm-~. 8 This is an attractive approach when using a relatively broad line, such as the interstitial oxygen peak at 1107 cm -', for impurity determination. However, this is not the best approach for narrower lines, such as the carbon peak at 605 cm -1 or the interstitial oxygen peak at 515 cm -1.
2. Replacing the sections of the interferogram con- taining the secondary or tertiary interferogram with a section from another interferogram, taken with a thicker sample, which does not contain the offending interfero- grams. 4 The best way to obtain the replacement interfer- ogram is to tilt the sample with respect to the beam. However, this will not work for silicon. In the example shown later in this paper, an increase in the effective thickness of the silicon wafer of about one-third would have been required. This cannot be achieved by tilting the wafer, since silicon has a refractive index of about 3.5. Thus, the only way to apply this procedure is to use a second, thicker sample at normal incidence. The infor- mation obtained from such a sample would not be very satisfactory, since even if the two samples were well- matched, the difference in thickness itself would make it impossible for the new interferogram sections to be a fair representation of the sections they are replacing.
3. Mounting the sample at Brewster's angle. 5 In this approach, multiple reflections are minimized by mount- ing the sample at Brewster's angle ~73 ° with respect to the incident beam. Since, in FT-IR instruments, the angle of incidence of the incident beam is not very well defined, this approach does not completely eliminate the Fabry-Perot fringes, although it has been reported to reduce them by roughly a factor of five. 5 There are two other problems with this method. With the sample mounted at such a large angle, the beam exits the wafer shifted in position compared to the background beam. For a 0.5-mm thick wafer, the beam would be shifted about 0.4 mm, which could be significant, considering that the detector is typically 1 mm square. Another
problem is that the Brewster angle is absorptivity de- pendent and will only produce accurate spectra in regions of low absorption. This condition is not met for either the oxygen or carbon impurities of silicon.
4. A computer-assisted spectral subtraction technique, proposed by Clark and Moffat 6 is only applicable to optically thin samples, and therefore could not be used with silicon wafers.
5. Replacing the extraneous interferograms with a zero amplitude throughout the region in which the inten- sity of the extraneous interferograms exceeds that of the main interferogram. 4' 7
This method is equivalent to the use of an additional apodization function on the sample interferogram. The effect of this "implicit" apodization is to remove the undesired Fabry-Perot fringes and, as will be shown below, to modify the shape of the desired spectral fea- tures in the specimen spectrum. The primary modifica- tion is to reduce the resolution of the specimen spectrum. However, since the background interferogram, and often the reference interferogram, are not apodized in the identical fashion, spurious peaks may result from this procedure. As will be demonstrated in this paper, these spurious peaks can be eliminated by zeroing the back- ground and reference interferograms over the same re- gions as the sample interferogram
I. C A L C U L A T I O N OF T HE E F F E C T S OF I M P L I C I T A P O D I Z A T I O N
In a recent article, Rabolt and Bellar s demonstrated the effect of boxcar, triangular, and Happ-Genzel apod- ization functions on the resolution and peak intensity of a monochromatic spectral line. Their experimental re- sults were in almost complete agreement with the spec- tral degradation calculated from first principles, s,9 If boxcar apodization is used when transforming an inter- ferogram produced by a monochromatic line, the func- tional dependence of the transformed spectrum on wave- number a is given by 4
B(a) = 2L sinc Zo
where Z o m 2r(a0 - g)L, L = the maximum optical displacement of the interferometer mirror in cm, sinc Z0
sin Zo, and fro = the frequency of the monochromatic
------ Zo line in cm -1.
However, if the interferogram were replaced by a zero amplitude from L1 to L2 (where L > L1, L2 and L2 > L1), then the transformed spectrum would be approximately given by
B(a) = 2L sinc Zo + 2L1 sinc Zo,1 - 2L2 sinc Zo,2 (1)
where Zo.1 = 2~r(~ - ~o)L1, and Zo.2 = 2~r(~ - ~o)L2. Thus, the effect of zeroing a portion of the sample
interferogram would be to broaden the width of the monochromatic line. In effect, the interferogram has been multiplied by a second apodization function, A '(~), equal to
1 7_<L1 A'(~) = 0 L i < ' y < L 2
1 ~_>L2
APPLIED SPECTROSCOPY 521
/
/

Extending this result, obtained for a single monochro- matic line, to polychromatic spectra is straightforward. 9 Let the amplitude of the signal at each frequency a~ be expressed as a 5 function spectrum ai~(a - a~). Then the total spectrum could be written as
ao
B(o) = ~ a iS (o - ai) i=O
This spectrum, for example, could represent the radia- tion emitted by the source in an FT-IR system.
Let us consider an example in which the background spectrum contains a monochromatic line at a = ~o. This line could be due to absorption by a window, beamsplit- ter, or infrared-active molecules in the spectrometer chamber. The sample spectrum contains one additional line, at ~ = a~. In order to remove a secondary interfer- ogram, a section of the sample interferogram is set to zero from ~ = L1 to L2. If the background interferogram is not similarly set to zero from L1 to L2, the transmit- tance spectrum would be given by:
BT(O) = 1 +
+
(Bb(o'))-I [i=~ ° (LlaisincZi,1
L2alsinc Zi,2) - Llbosinc Zo,1
Lzbosinc Zo,2 - Lblsinc Z1
Llblsinc Z1,1 + L2blsinc Z 1 , 2
+ ~(~1 - ao)bobdL sinc Zo
(2)
+ Llsinc Zo,1 - L2sinc Z0,2)]
where
Zi = 2~r(a - ai)L
Zj4 = 2~-(o - oj)Li (for j = 1,2) (3)
Z~,2 = 2 ~ ( o - o~)L2 However, if the background interferogram is also set to zero from ,y = L1 to L2, the transmittance spectrum of the sample would be given by
B T ' ( ~ ) = 1 + (Bb'(a))- l[-Lbls inc Z1
- Llblsinc Zi.1 + L2blsinc Z1,2
(4)
; 6(01 - oo)bobl(L sinc Zo
+ Llsinc Zo,1 - L2sinc Z0,2)]
At first glance, it may appear that the removal of a number of additional terms from the numerator in the expression for the transmittance spectrum (compare Eq. 4 to Eq. 2) has been accomplished at the cost of intro- ducing additional terms in the denominator, Bb'(O). However, the additional terms in Bb'(o) consist of the summation term, which only contributes to the base line, and -Llbosinc Zo,1 + L2bosinc Zo,2.
These two terms are only significant for a ~ oo, whereas the main additional terms in the numerator of Eq. 8, -L~blsinc Z l , 1 -~- L2bisinc Z1,2, are only significant
522 Volume 37, Number 6, 1983
for o ~ 0~. Thus, only when ffl ~ 00 do the additional terms in the numerator and denominator simultaneously have significant value. In this case, the additional terms contribute at the same frequency to both the numerator and denominator and thus tend to cancel each other out.
Thus, the additional terms in Eq. 2, compared to Eq. 4, would produce an erroneous signal in the sample's transmittance spectrum. The terms under the summa- tion would not have a significant effect, since they only contribute to the base line. The next two terms, which are proportional to b0 (the intensity of the background monochromatic line), would produce a series of extra- neous fringes. These extraneous fringes would introduce an error in a determination of the intensity of the sample monochromatic line at ol.
The extraneous fringes due to the implicit apodization would often be recognizable upon inspection of the spec- trum by an experienced spectroscopist. However, with the widespread use of computerized spectrophotometers, additional care must be taken to prevent the occurrence of unintended artifacts in the spectra. ~° Since the output of these instruments can often be data in tabular form rather than an actual spectrum, the instrument operator may never have the opportunity to inspect the spectrum and account for the existence of the extraneous fringes.
II. A P P L I C A T I O N TO I M P U R I T Y A B S O R P T I O N IN S I L I C O N W A F E R S
The importance of the additional terms in Eq. 2 de- pends on the quality of the background spectrum: sharp variations in that spectrum due to the source, detector, windows, beam splitter, or infrared-active molecules in the spectrophotometer would all produce extraneous fringes in the specimen's transmittance spectrum.
An example of this effect is demonstrated in Fig. 2, a and b. The absorbance peak at 515 cm -1 shown in this figure is due to the bending vibration mode of interstitial oxygen in silicon. 11 This peak is a sensitive indicator of the oxygen precipitation process in silicon. 12'~ (The much stronger oxygen peak at 1106 cm -1 is due to a stretching vibration mode, and is therefore less sensitive to the local atomic configuration than the bending mode at 515 cm-~.) The spectra shown in Fig. 2, a and b were
0.410
0.405
0.400
~ 0 .~
O.39O
0.3415
0'300490 i i
510 520 530 WAVENUMBERS
0.410 b
0.400
0.3115
0.3110
0.305
i i i 510 520
WAVENUMBERS 530
FIG. 2. Sample spectra obtained from the interferogram shown in Fig. 1. The spectrum shown in Fig. 2a was obtained by zero-filling the sample and background interferograms identically, while for the spec- trum shown in Fig. 2b, the zero filling was only applied to the sample interferogxam.

obtained in a vacuum spectrophotometer using a mer- cury-cadmium-telluride detector and a KBr beam split- ter. The sample interferogram is shown in Fig. 1. The secondary and tertiary interferograms were removed from the specimen interferogram by zeroing out those regions of that interferogram. For Fig. 2a, the background interferogram was apodized in an identical fashion, but for Fig. 2b, the background interferogram was apodized using the routine Happ-Genzel function only. Note that the fringes due to the uncorrected background interfer- ogram, shown in Fig. 2b, are larger by a factor of four than the residual Fabry-Perot fringes seen in Fig. 2a.
III. CONCLUSIONS
We have shown that removing secondary and tertiary interferograms obtained from semiconductor wafers can lead to the appearance of extraneous fringes in the ab- sorption spectrum. The apodization implicit in replacing large sections of a sample interferogram by a zero ampli- tude must be consistently applied to the background and, if necessary, to the reference interferograms in order to prevent the appearance of extraneous peaks in the proc- essed spectrum. This approach minimizes the distortions which might be created by zeroing out large sections of the main interferogram. Thus, the only penalty paid for removing the Fabry-Perot fringes in a typical silicon wafer is a modest ~25% decrease in the spectral reso- lution, without substantially affecting either the throughput or the convenience of the measurement. Fol-
lowing a consistent procedure is especially important with the development of computer algorithms, which are being used to determine automatically the impurity con- centrations of semiconductor wafers.
ACKNOWLEDGMENT
I would like to thank M. i. Bell for useful discussions regarding the calculation in this paper.
1. A. Baghdadi and R. A. Forman, Appl. Spectrosc. 35,473 (1981). 2. D. G. Mead and S. R. Lowry, Appl. Spectrosc. 34, 167 (1980). 3. M. V. Kulkarni, at a panel discussion on FTIR at the Semicon-West meeting,
May 1982. 4. T. Hirschfeld and A. W. Mantz, Appl. Spectrosc. 30, 552 (1976). 5. J. Leroueille, Appl. Spectrosc. 36, 153 (1982). 6. F. R. S. Clark and D. J. Moffat, Appl. Spectrosc. 32,547 (1978). 7. This is the method used by the Nicolet software for eliminating interference
fringes in spectra obtained from silicon wafers. Nicolet* Instrument Corpo- ration, Madison, WI. It is also the procedure outlined in the instruction manual for a Nicolet 7199 Fourier transform spectrophotometer.
8. J. F. Rabolt and R. Bellar, Appl. Spectrosc. 35, 132 (1981). 9. R. J. Bell, Introductory Fourier Transform Spectroscopy (Academic Press,
New York, 1972), p. 55. 10. J. G. Grasselli, P. R. Griffiths, and R. W. Hannah, Appl. Spectrosc. 36, 87
(1982). 11. H. J. Hrostowski and R. H. Kaiser, Phys. Rev. 107, 966 (1957). 12. P. E. Freeland, J. Electrochem. Soc. 127,754 (1980). 13. S. F. Shimura, Y. Ohnishi, and H. Tsuya, Appl. Phys. Lett. 38, 867 (1981).
* Cer ta in commercia l equipment , i n s t rumen t s , or mater ia ls are identi- fied in th is paper in order to adequately specify the exper imenta l procedure. Such identif icat ion does not imply recommenda t ion or endor semen t by the Nat ional Bureau of S tandards , nor does it imply t ha t the mater ia ls or equ ipment identified are necessari ly the best available for the purpose.
Chemical and Physical Influences of the Atmosphere upon the Spatial and Temporal Characteristics of Atomic Fluorescence in a Laser Microprobe Plume
ARNOLD L. LEWIS, II* and EDWARD H. PIEPMEIERt Department of Chemistry, Oregon State University, Corvallis, Oregon 97331
Atomic f l u o r e s c e n c e o b s e r v a t i o n s of Li and Cu in a l a s e r m i c r o - p r o b e plume w e r e made to s t u d y the chemica l and phys i ca l in f luences o f a reac t ive a t m o s p h e r e o f o x y g e n re la t ive to an a t m o s p h e r e o f argon. T ime and spat ia l ly re so lved f luorescence observa t ions s h o w a reg ion o f r e l a t i v e l y l o w concentra t ion o f L i in the center o f the p lume from a f i l m emuls ion sample , w h i c h is not present for Cu from an a luminum al loy sample . For both samples , the p lume appears to r i se as a b a l l above the sample , rather than fan out con t inuous ly throughout the at- mosphere .
Index Headings: Laser microprobe; Atomic f luorescence; Spat ia l maping; Lithium; Copper; A l u m i n u m a l loy ; C h e m i c a l inf lu- ences .
Received 28 J u n e 1982; revision received 12 February 1983. * P re sen t address: Exxon Nuclear Idaho, Idaho Falls, ID 83401. t Author to whom correspondence should be addressed.
Volume 37, Number 6, 1983
INTRODUCTION
The spatial and temporal characteristics of the plume produced by a laser microprobe are dependent upon the composition and the pressure of the atmosphere sur- rounding it. 1-~ However, relatively little is known about how the composition of the atmosphere chemically af- fects the plume species. When initial studies in our laboratory showed that the peak atomic absorbance sig- nal for aluminum increased by a factor of 7 and the temporal width at half height by a factor of 11 when a reducing atmosphere of propane instead of air was used, it became clear that the chemical composition of the atmosphere could be an important and controllable fac- tor by which analytical results could be improved. A systematic study of the influence of the chemical makeup
APPLIED SPECTROSCOPY 523