Embed Size (px)
Citation preview

www.eia.gov U.S. Energy Information Administration Independent Statistics & Analysis
Implications of the U.S. Shale Revolution
For US-Canada Energy Summit October 17, 2014 | Chicago, IL By Adam Sieminski, Administrator U.S. Energy Information Administration

0
5
10
15
20
25
30
0.0
10.0
20.0
30.0
40.0
50.0
60.0
U.S. is the largest producer of petroleum and natural gas in the world
US-Canada Energy Summit October 17, 2014 2
estimated U.S., Russia, and Saudi Arabia petroleum and natural gas production quadrillion Btu million barrels per day of oil equivalent
United States
Russia
Saudi Arabia
petro-leum
natural gas
2008 2009 2010 2011 2012 2013 2014e Source: U.S. Energy Information Administration Note: Petroleum production includes crude oil, natural gas liquids, condensates, refinery processing gain, and other liquids, including biofuels; barrels per day oil equivalent were calculated using a conversion factor of 1 barrel oil equivalent=5.55 million British thermal units (Btu)
3 US-Canada Energy Summit October 17, 2014

4 US-Canada Energy Summit October 17, 2014
These seven regions accounted for 95% of U.S. oil production growth and all U.S. natural gas production growth from 2011-2013
Source: EIA, Drilling Productivity Report

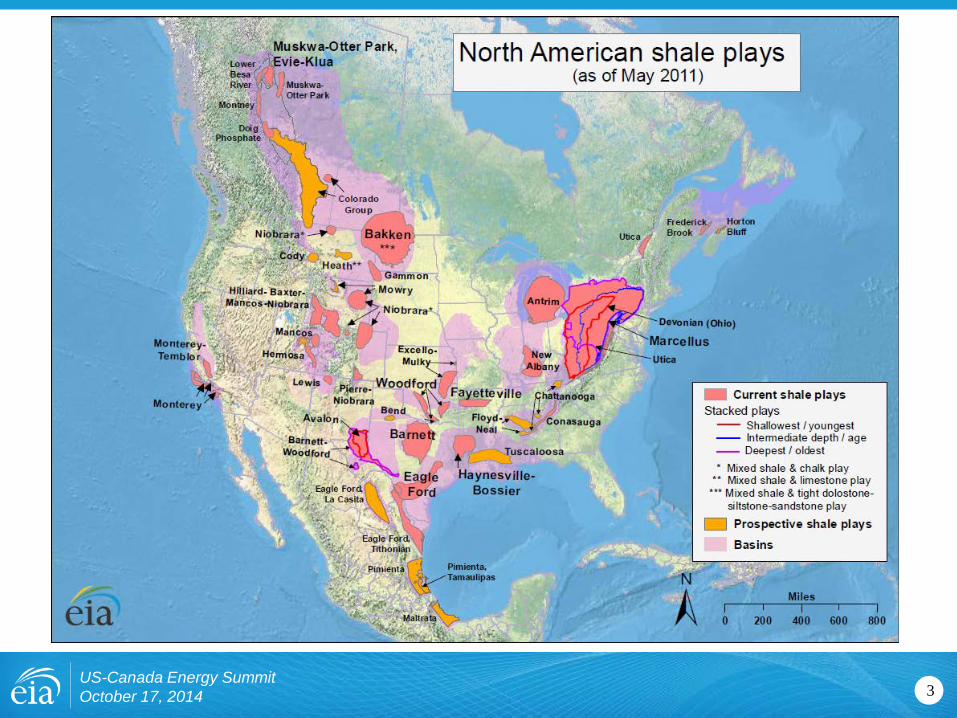
The U.S. has experienced a rapid increase in natural gas and oil production from shale and other tight resources
5
0.0
0.5
1.0
1.5
2.0
2.5
3.0
3.5
4.0
4.5
2000 2002 2004 2006 2008 2010 2012 2014
Eagle Ford (TX)Bakken (MT & ND)Spraberry (TX & NM Permian)Bonespring (TX & NM Permian)Wolfcamp (TX & NM Permian)Delaware (TX & NM Permian)Yeso-Glorieta (TX & NM Permian)Niobrara-Codell (CO, WY)HaynesvilleUtica (OH, PA & WV)MarcellusWoodford (OK)Granite Wash (OK & TX)Austin Chalk (LA & TX)Monterey (CA)
U.S. tight oil production million barrels of oil per day
0
5
10
15
20
25
30
35
40
2000 2002 2004 2006 2008 2010 2012 2014
Marcellus (PA & WV)
Haynesville (LA & TX)
Eagle Ford (TX)
Fayetteville (AR)
Barnett (TX)
Woodford (OK)
Bakken (ND)
Antrim (MI, IN, & OH)
Utica (OH, PA & WV)
Rest of US 'shale'
U.S. dry shale gas production billion cubic feet per day
Sources: EIA derived from state administrative data collected by DrillingInfo Inc. Data are through August 2014 and represent EIA’s official tight oil & shale gas estimates, but are not survey data. State abbreviations indicate primary state(s).
US-Canada Energy Summit October 17, 2014

U.S. shale gas leads growth in total gas production through 2040, when production exceeds 100 billion cubic feet per day
6
U.S. dry natural gas production trillion cubic feet
Source: EIA, Annual Energy Outlook 2014, Reference case
0
10
20
30
40
50
60
70
80
90
100
0
5
10
15
20
25
30
35
40
1990 1995 2000 2005 2010 2015 2020 2025 2030 2035 2040
Associated with oil Coalbed methane
Tight gas
Shale gas
Alaska Non-associated offshore
Non-associated onshore
projections history 2012
US-Canada Energy Summit October 17, 2014
billion cubic feet per day

7
0.0
5.0
10.0
15.0
20.0
25.0
30.0
35.0
2005 2012 2020 2025 2030 2035 2040
U.S. dry gas consumption trillion cubic feet
Source: EIA, Annual Energy Outlook 2014, Reference case
projections history
industrial*
electric power
commercial
residential
transportation**
11.2
4.1
1.7
11.0
3.6
9.1
4.2
0.7
8.5
2.9
*Includes combined heat-and-power and lease and plant fuel **Includes pipeline fuel
Natural gas consumption growth is driven by electric power, industrial, and transportation use
US-Canada Energy Summit October 17, 2014
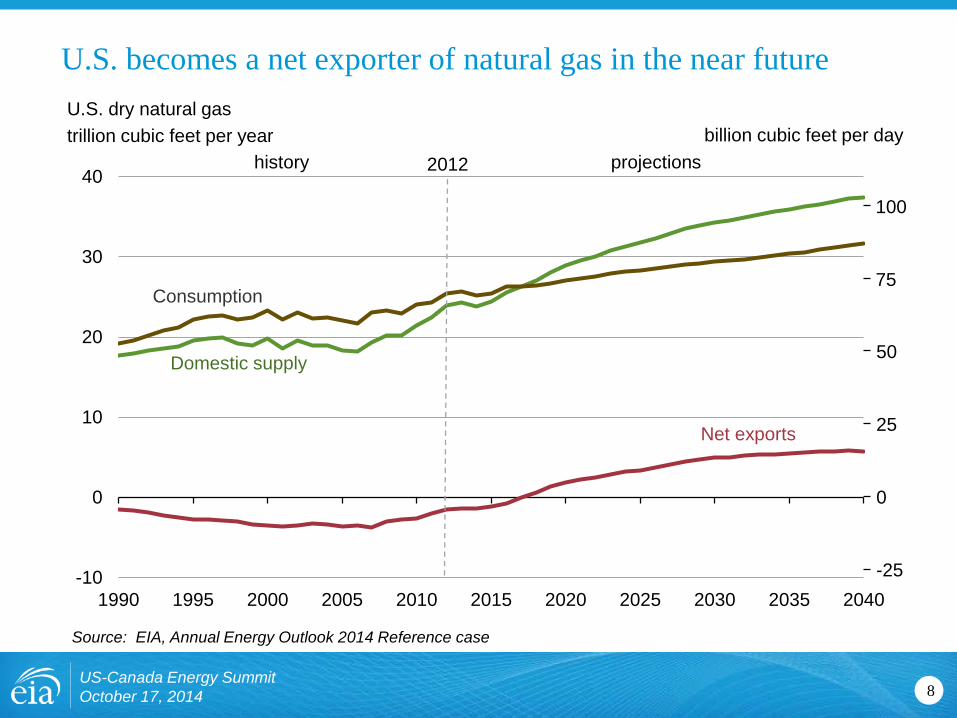
U.S. becomes a net exporter of natural gas in the near future
8
U.S. dry natural gas trillion cubic feet per year
Source: EIA, Annual Energy Outlook 2014 Reference case
US-Canada Energy Summit October 17, 2014
-10
0
10
20
30
40
1990 1995 2000 2005 2010 2015 2020 2025 2030 2035 2040
projections history 2012
Consumption
Domestic supply
Net exports
100
75
50
25
0
-25
billion cubic feet per day

Source: EIA, Annual Energy Outlook 2014, Reference case and High Oil and Gas Resource case
9 US-Canada Energy Summit October 17, 2014
-4
-2
0
2
4
6
8
2010 2015 2020 2025-4
-2
0
2
4
6
8
2010 2015 2020 2025
Projected U.S. natural gas trade depends on assumptions regarding resources and future technology advances
Reference case trillion cubic feet per year
exports to Mexico exports to Canada
lower 48 LNG exports
imports from Canada
LNG imports
High Oil and Gas Resource case trillion cubic feet per year
billion cubic feet per day
0
5
20
15
10
-5
-10

Shale gas in eastern Canada
10
Source: Advanced Resources International, “Technically Recoverable Shale Oil and Shale Gas Resources: An Assessment of 137 Shale Formations in 41 Countries Outside the United States”
US-Canada Energy Summit October 17, 2014
• Of the four shale plays in Eastern Canada, two have been assessed by ARI
– Utica in Quebec has 31.1 Tcf of technically recoverable resources
– Horton Bluff in Nova Scotia has 3.4 Tcf of technically recoverable resources
• These shale resource volumes are not included in NEB’s 2013 estimates
• Quebec enacted a hydraulic fracturing moratorium
in 2012 pending further research • New Brunswick permits hydraulic fracturing, but
has imposed strict rules surrounding it
• Nova Scotia, similar to Quebec, will not permit hydraulic fracturing until the completion of a review, due mid-2014
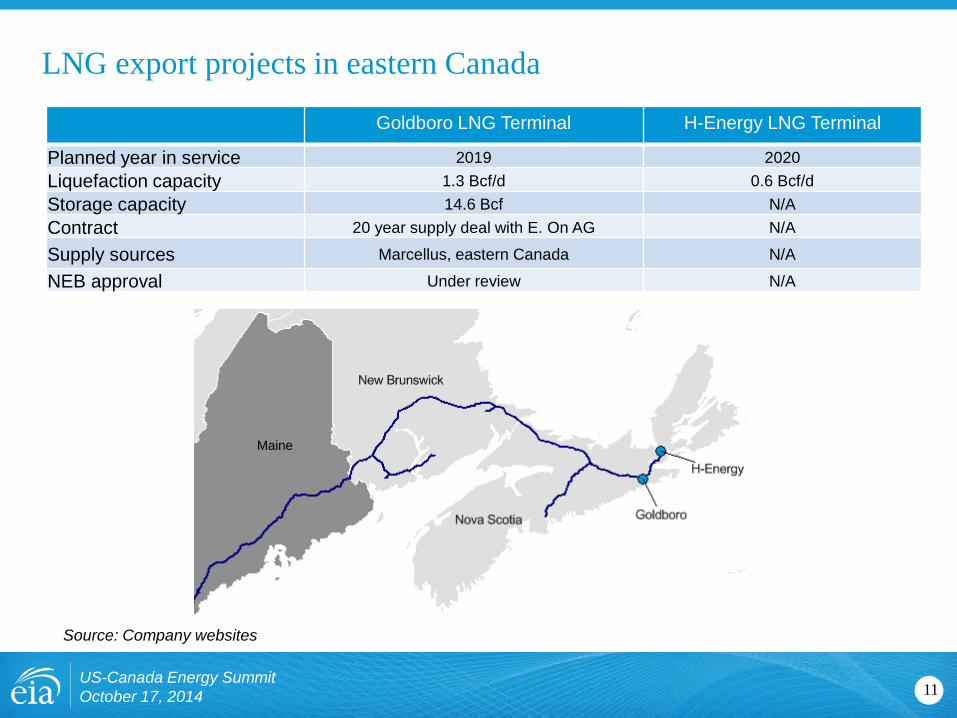
LNG export projects in eastern Canada
11
Source: Company websites
US-Canada Energy Summit October 17, 2014
Goldboro LNG Terminal H-Energy LNG Terminal
Planned year in service 2019 2020 Liquefaction capacity 1.3 Bcf/d 0.6 Bcf/d Storage capacity 14.6 Bcf N/A Contract 20 year supply deal with E. On AG N/A
Supply sources Marcellus, eastern Canada N/A
NEB approval Under review N/A
Maine
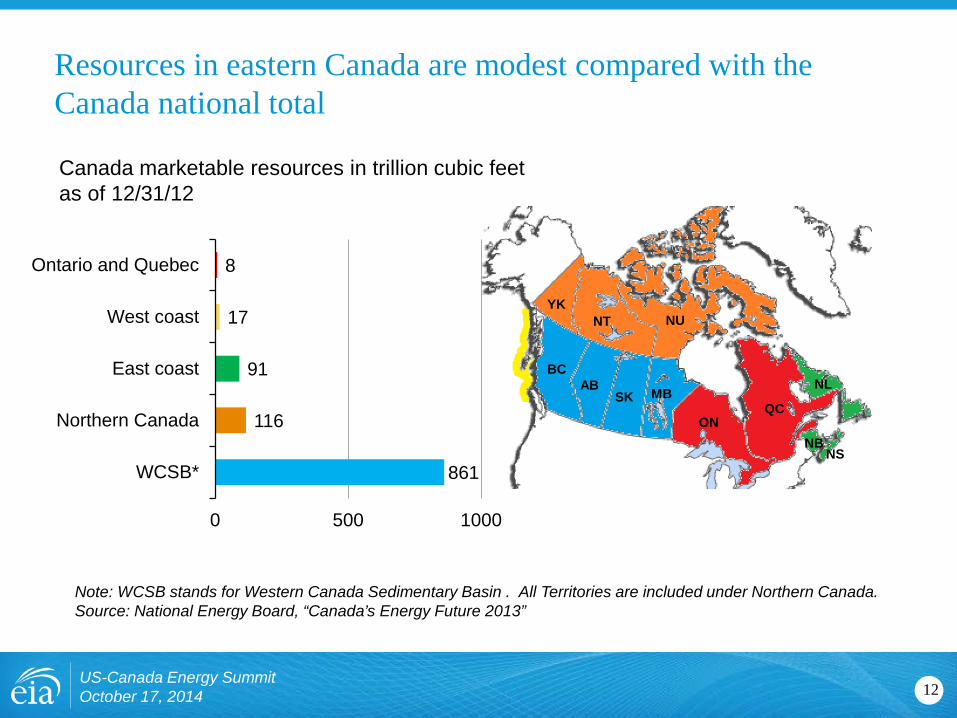
Resources in eastern Canada are modest compared with the Canada national total
Note: WCSB stands for Western Canada Sedimentary Basin . All Territories are included under Northern Canada. Source: National Energy Board, “Canada’s Energy Future 2013”
12
Canada marketable resources in trillion cubic feet as of 12/31/12
US-Canada Energy Summit October 17, 2014
861
116
91
17
8
WCSB*
Northern Canada
East coast
West coast
Ontario and Quebec
0 500 1000
BC AB
YK NT
SK MB
ON QC
NS NB
NL
NU

Resource and technology assumptions have major implications for projected U.S. crude oil production beyond the next few years
0
2
4
6
8
10
12
14
1990 2000 2010 20200
2
4
6
8
10
12
14
1990 2000 2010 2020
13
Source: EIA, Annual Energy Outlook 2014; Short Term Energy Outlook, October 2014
Alaska
tight oil
other lower 48 states onshore
lower 48 states offshore
STEO October 2014 U.S. crude oil projection
2012 projections history projections history
2012
Alaska
tight oil
other lower 48 states onshore
Reference case million barrels per day
High Oil and Gas Resource case million barrels per day
lower 48 states offshore
US-Canada Energy Summit October 17, 2014
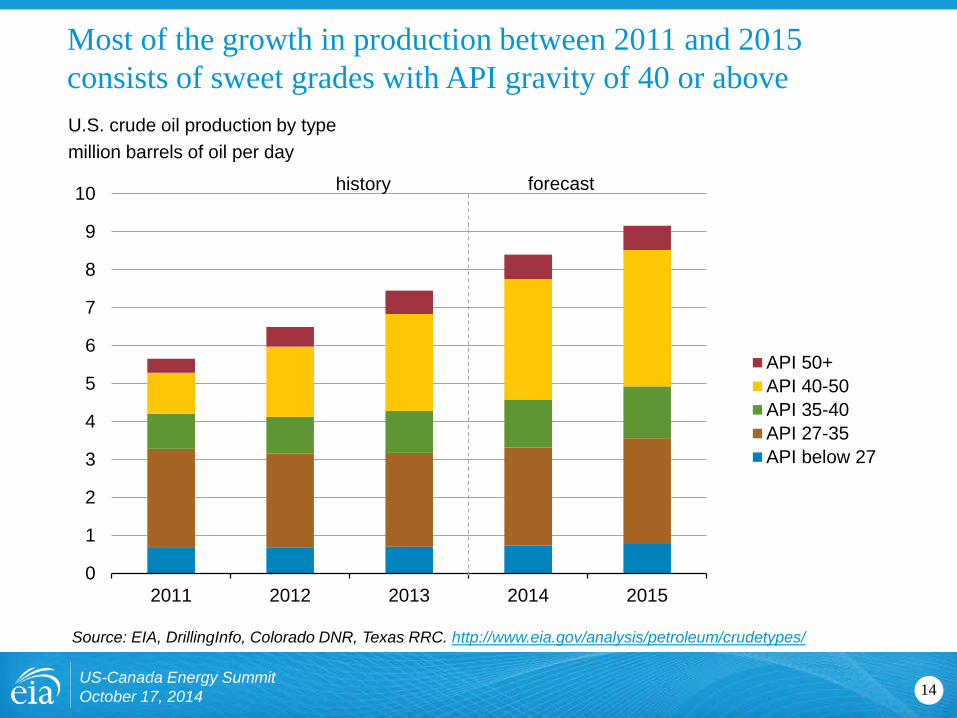
Most of the growth in production between 2011 and 2015 consists of sweet grades with API gravity of 40 or above
0
1
2
3
4
5
6
7
8
9
10
2011 2012 2013 2014 2015
API 50+API 40-50API 35-40API 27-35API below 27
U.S. crude oil production by type million barrels of oil per day
Source: EIA, DrillingInfo, Colorado DNR, Texas RRC. http://www.eia.gov/analysis/petroleum/crudetypes/
US-Canada Energy Summit October 17, 2014 14
forecast history

U.S. rail carloads of crude oil and petroleum products exceed 1.5 million b/d in 2014
US-Canada Energy Summit October 17, 2014 15
0
0.2
0.4
0.6
0.8
1
1.2
1.4
1.6
1.8
0
2,000
4,000
6,000
8,000
10,000
12,000
14,000
16,000
18,000
2006 2007 2008 2009 2010 2011 2012 2013 2014
number of rail carloads per week
Source: U.S. Energy Information Administration, based on Association of American Railroads
million barrels per day

U.S. petroleum product net exports million barrels per day
-3
-2
-1
0
1
2
3
1950 1960 1970 1980 1990 2000 2010
Source: EIA, Annual Energy Outlook 2014 Reference case and Short Term Energy Outlook
US-Canada Energy Summit October 17, 2014 16
U.S. is already a major net exporter of petroleum products
2015(e)

17 US-Canada Energy Summit October 17, 2014
Over 60% of U.S. petroleum product exports go to the Americas, with Mexico and Canada as its largest global trading partners
Source: EIA Americas Report
0
500
1000
1500
2000
2500
3000
3500
4000
2004 2005 2006 2007 2008 2009 2010 2011 2012 2013
U.S. petroleum product gross exports million barrels per day
Canada
Mexico
Other Americas
Other Global

Most significant contributors to non-OPEC crude and lease condensate production: Canada, Brazil, U.S., Kazakhstan, Russia
0
6
12
18
24
Canada United States Mexico Brazil Kazakhstan Russia Other
2010 2025 2040
non-OPEC crude and lease condensate production, Reference case million barrels per day
Source: EIA, International Energy Outlook 2014
US-Canada Energy Summit October 17, 2014 18

Tight oil production will spread to nations outside of the United States and Canada over the projection
0
1
2
3
4
5
6
7
8
United States Canada Mexico Russia Argentina China Rest of world
2010 2025 2040
tight oil production, Reference case million barrels per day
Source: EIA, International Energy Outlook 2014
US-Canada Energy Summit October 17, 2014 19
2.9 MMbbl/d in 2013
3.9 MMbbl/d in 2014 (STEO)
AEO2014 High Resource case
5.0 MMbbl/d in 2015 (STEO)

Growing U.S. oil production and rising demand in China have together made China the world’s largest net oil importer
US-Canada Energy Summit October 17, 2014 20
0
1
2
3
4
5
6
7
8
9
10
Jan-11 Jul-11 Jan-12 Jul-12 Jan-13 Jul-13 Jan-14 Jul-14 Jan-15 Jul-15
U.S. net imports
China net imports
net imports for China and the United States million barrels per day
Note: Net oil imports are defined as total liquid fuels consumption less domestic production Source: EIA, Short-Term Energy Outlook, October 2014
projections history
Aug-14
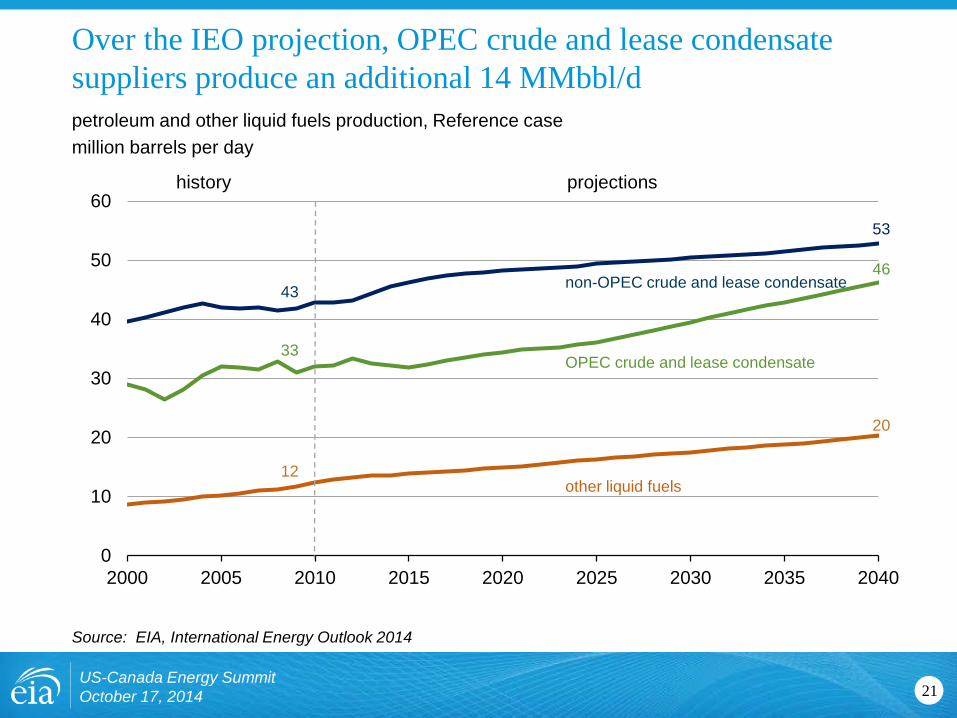
Over the IEO projection, OPEC crude and lease condensate suppliers produce an additional 14 MMbbl/d
0
10
20
30
40
50
60
2000 2005 2010 2015 2020 2025 2030 2035 2040
OPEC crude and lease condensate
non-OPEC crude and lease condensate
other liquid fuels
petroleum and other liquid fuels production, Reference case million barrels per day
Source: EIA, International Energy Outlook 2014
US-Canada Energy Summit October 17, 2014 21
projections history
43
33
12
53
46
20

Areas of uncertainty in the outlook
• China’s energy demand growth; particularly in transportation – EIA is working with MIT and others to upgrade the structural and macroeconomic
determinates of transportation demand in all regions for IEO2015
• Increasing global trade of natural gas and HGL in addition to oil – EIA is integrating the representation of oil and natural gas supply and other
hydrocarbons
• Global development of tight oil and shale gas resources – EIA is gathering geology and production information, and conducting outreach
• Impact of geopolitical tensions on energy supply – EIA exploring options for representing these uncertainties in the outlook
US-Canada Energy Summit October 17, 2014 22

For more information
US-Canada Energy Summit October 17, 2014 23
U.S. Energy Information Administration home page | www.eia.gov
Annual Energy Outlook | www.eia.gov/aeo
Short-Term Energy Outlook | www.eia.gov/steo
International Energy Outlook | www.eia.gov/ieo
Monthly Energy Review | www.eia.gov/mer
Today in Energy | www.eia.gov/todayinenergy
State Energy Portal | www.eia.gov/state
Drilling Productivity Report | www.eia.gov/petroleum/drilling/