Embed Size (px)
Citation preview

Implications of Public and Private Reporting of Quality Data: Mechanisms for Driving Quality Improvement
Deirdre E. Mylod, [email protected] President, Public PolicyPress Ganey Associates, Inc.June 27, 2006

Overview
Relationship between publicly benchmarked and private benchmark reports for measures of quality– Clinical, Safety, HCAHPS
Normative Rates of Change Year 1 to Year 2 for privately reported patient evaluations
Relationship between hospital characteristics and successful quality improvement using private reports
Relationship between hospital activities and quality improvement related to private measures of patient evaluations– Public Reporting of Leapfrog Data– Participation in IHI– Access and Use of Data

Private vs. Public Reporting
Are the two related?
• Private patient surveys are related to public clinical measures at the hospital-level.
Gesell, S.B., Clark, P.A., Mylod, D.E., Wolosin, R.J., Drain, M., Lanser, P., & Hall, M.F. (2005). Hospital-level correlation between clinical and service quality performance for heart failure treatment. Journal for Healthcare Quality, 27(6), 33-44.

Hospital-level correlation between heart failure patients’ overall satisfaction and percent of heart failure patients given assessment of left ventricular function.
100959085807570
Percent of Patients Given Assessment of LeftVentricular Function
90
85
80
75
70
Ove
rall
Pat
ien
t S
atis
fact
ion
N=31
r = .5p < .01

Hospital-level correlation between heart failure patients’ overall satisfaction and percent of heart failure patients given discharge instructions.
100806040200
Percent of Patients Given DischargeInstructions
90
85
80
75
70
Ove
rall
Pat
ien
t S
atis
fact
ion
N=26
r = .6p < .01

Private vs. Public Reporting
Are the two related?
• Private patient surveys are related to public safety measures at the hospital-level.

Hospitals willing to publicly report to Leapfrog have significantly higher patient satisfaction in private patient reports.
82.7
84.0

Private vs. Public Reporting
Are the two related?
• Private patient surveys are related to public patient surveys at the patient- and hospital-level.
Mylod, D.E., & McCaffrey, K. (2006, March). Assessment of Convergent Validity of HCAHPS® Using the Press Ganey Inpatient Survey. Poster presented at the 10th National CAHPS User Group Meeting, Baltimore, MD.
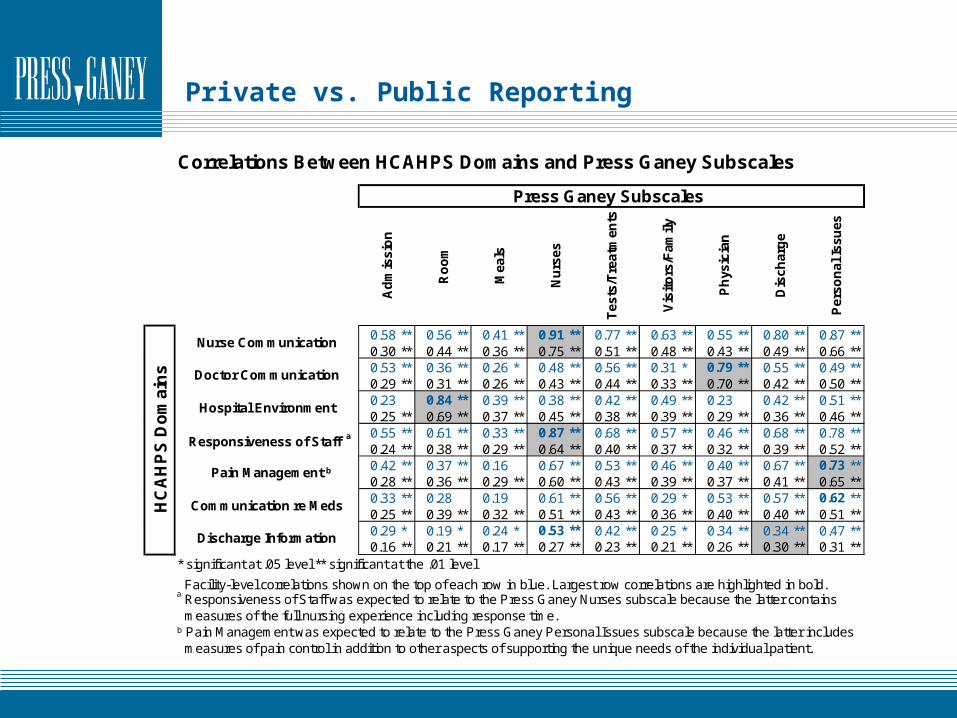
Private vs. Public Reporting
Correlations Between HCAHPS Domains and Press Ganey Subscales
0.58 ** 0.56 ** 0.41 ** 0.91 ** 0.77 ** 0.63 ** 0.55 ** 0.80 ** 0.87 **0.30 ** 0.44 ** 0.36 ** 0.75 ** 0.51 ** 0.48 ** 0.43 ** 0.49 ** 0.66 **0.53 ** 0.36 ** 0.26 * 0.48 ** 0.56 ** 0.31 * 0.79 ** 0.55 ** 0.49 **0.29 ** 0.31 ** 0.26 ** 0.43 ** 0.44 ** 0.33 ** 0.70 ** 0.42 ** 0.50 **0.23 0.84 ** 0.39 ** 0.38 ** 0.42 ** 0.49 ** 0.23 0.42 ** 0.51 **0.25 ** 0.69 ** 0.37 ** 0.45 ** 0.38 ** 0.39 ** 0.29 ** 0.36 ** 0.46 **0.55 ** 0.61 ** 0.33 ** 0.87 ** 0.68 ** 0.57 ** 0.46 ** 0.68 ** 0.78 **0.24 ** 0.38 ** 0.29 ** 0.64 ** 0.40 ** 0.37 ** 0.32 ** 0.39 ** 0.52 **0.42 ** 0.37 ** 0.16 0.67 ** 0.53 ** 0.46 ** 0.40 ** 0.67 ** 0.73 **0.28 ** 0.36 ** 0.29 ** 0.60 ** 0.43 ** 0.39 ** 0.37 ** 0.41 ** 0.65 **0.33 ** 0.28 0.19 0.61 ** 0.56 ** 0.29 * 0.53 ** 0.57 ** 0.62 **0.25 ** 0.39 ** 0.32 ** 0.51 ** 0.43 ** 0.36 ** 0.40 ** 0.40 ** 0.51 **0.29 * 0.19 * 0.24 * 0.53 ** 0.42 ** 0.25 * 0.34 ** 0.34 ** 0.47 **0.16 ** 0.21 ** 0.17 ** 0.27 ** 0.23 ** 0.21 ** 0.26 ** 0.30 ** 0.31 **
* significant at .05 level ** significant at the .01 level
Facility-level correlations shown on the top of each row in blue. Largest row correlations are highlighted in bold. a Responsiveness of Staff was expected to relate to the Press Ganey Nurses subscale because the latter contains
measures of the full nursing experience including response time.b Pain Management was expected to relate to the Press Ganey Personal Issues subscale because the latter includes
measures of pain control in addition to other aspects of supporting the unique needs of the individual patient.
Vis
ito
rs/F
amil
y
Ph
ysic
ian
Per
son
al Is
sues
Nurse Communication
Ad
mis
sio
n
Ro
om
Nu
rses
Tes
ts/T
reat
men
ts
HC
AH
PS
Do
mai
ns
Press Ganey Subscales
Communication re Meds
Discharge Information
Mea
ls
Dis
char
ge
Doctor Communication
Hospital Environment
Responsiveness of Staff a
Pain Management b
Correlations Between HCAHPS Domains and Press Ganey Subscales
0.58 ** 0.56 ** 0.41 ** 0.91 ** 0.77 ** 0.63 ** 0.55 ** 0.80 ** 0.87 **0.30 ** 0.44 ** 0.36 ** 0.75 ** 0.51 ** 0.48 ** 0.43 ** 0.49 ** 0.66 **0.53 ** 0.36 ** 0.26 * 0.48 ** 0.56 ** 0.31 * 0.79 ** 0.55 ** 0.49 **0.29 ** 0.31 ** 0.26 ** 0.43 ** 0.44 ** 0.33 ** 0.70 ** 0.42 ** 0.50 **0.23 0.84 ** 0.39 ** 0.38 ** 0.42 ** 0.49 ** 0.23 0.42 ** 0.51 **0.25 ** 0.69 ** 0.37 ** 0.45 ** 0.38 ** 0.39 ** 0.29 ** 0.36 ** 0.46 **0.55 ** 0.61 ** 0.33 ** 0.87 ** 0.68 ** 0.57 ** 0.46 ** 0.68 ** 0.78 **0.24 ** 0.38 ** 0.29 ** 0.64 ** 0.40 ** 0.37 ** 0.32 ** 0.39 ** 0.52 **0.42 ** 0.37 ** 0.16 0.67 ** 0.53 ** 0.46 ** 0.40 ** 0.67 ** 0.73 **0.28 ** 0.36 ** 0.29 ** 0.60 ** 0.43 ** 0.39 ** 0.37 ** 0.41 ** 0.65 **0.33
Correlations Between HCAHPS Domains and Press Ganey Subscales
0.58 ** 0.56 ** 0.41 ** 0.91 ** 0.77 ** 0.63 ** 0.55 ** 0.80 ** 0.87 **0.30 ** 0.44 ** 0.36 ** 0.75 ** 0.51 ** 0.48 ** 0.43 ** 0.49 ** 0.66 **0.53 ** 0.36 ** 0.26 * 0.48 ** 0.56 ** 0.31 * 0.79 ** 0.55 ** 0.49 **0.29 ** 0.31 ** 0.26 ** 0.43 ** 0.44 ** 0.33 ** 0.70 ** 0.42 ** 0.50 **0.23 0.84 ** 0.39 ** 0.38 ** 0.42 ** 0.49 ** 0.23 0.42 ** 0.51 **0.25 ** 0.69 ** 0.37 ** 0.45 ** 0.38 ** 0.39 ** 0.29 ** 0.36 ** 0.46 **0.55 ** 0.61 ** 0.33 ** 0.87 ** 0.68 ** 0.57 ** 0.46 ** 0.68 ** 0.78 **0.24 ** 0.38 ** 0.29 ** 0.64 ** 0.40 ** 0.37 ** 0.32 ** 0.39 ** 0.52 **0.42 ** 0.37 ** 0.16 0.67 ** 0.53 ** 0.46 ** 0.40 ** 0.67 ** 0.73 **0.28 ** 0.36 ** 0.29 ** 0.60 ** 0.43 ** 0.39 ** 0.37 ** 0.41 ** 0.65 **0.33 ** 0.28 0.19 0.61 ** 0.56 ** 0.29 * 0.53 ** 0.57 ** 0.62 **0.25 ** 0.39 ** 0.32 ** 0.51 ** 0.43 ** 0.36 ** 0.40 ** 0.40 ** 0.51 **0.29 * 0.19 * 0.24 * 0.53 ** 0.42 ** 0.25 * 0.34 ** 0.34 ** 0.47 **0.16 ** 0.21 ** 0.17 ** 0.27 ** 0.23 ** 0.21 ** 0.26 ** 0.30 ** 0.31 **
* significant at .05 level ** significant at the .01 level
Facility-level correlations shown on the top of each row in blue. Largest row correlations are highlighted in bold. a Responsiveness of Staff was expected to relate to the Press Ganey Nurses subscale because the latter contains
measures of the full nursing experience including response time.b Pain Management was expected to relate to the Press Ganey Personal Issues subscale because the latter includes
measures of pain control in addition to other aspects of supporting the unique needs of the individual patient.
Vis
ito
rs/F
amil
y
Ph
ysic
ian
Per
son
al Is
sues
Nurse Communication
Ad
mis
sio
n
Ro
om
Nu
rses
Tes
ts/T
reat
men
ts
HC
AH
PS
Do
mai
ns
Press Ganey Subscales
Communication re Meds
Discharge Information
Mea
ls
Dis
char
ge
Doctor Communication
Hospital Environment
Responsiveness of Staff a
Pain Management b

Hospital-level correlation between private patient surveys and public patient surveys
N=67
1009590858075
Press Ganey Question Mean Score
10
9
8
7
HC
AH
PS
Ave
rag
e R
atin
g (
0-10
)
Overall Rating of Care
r = .9p < .01

Normative Rates of Change- Five Year Outlook

Proportion of Hospitals Getting Better/Worse
45.5
54.5
40
42
44
46
48
50
52
54
56
Per
cen
t o
f In
crea
se/D
ecre
ase
Decrease
Increase

Proportion of Hospitals Significant Change
8.3
13.4
0
2
4
6
8
10
12
14
16
Perc
en
t o
f S
ign
ific
an
t In
cre
ase/D
ecre
ase
Significantly Worse
Significantly Better

Proportion of Hospitals Significant Change
8.3 78.3 13.4
0% 10% 20% 30% 40% 50% 60% 70% 80% 90% 100%
Significantly Worse
Similar
Significantly Better
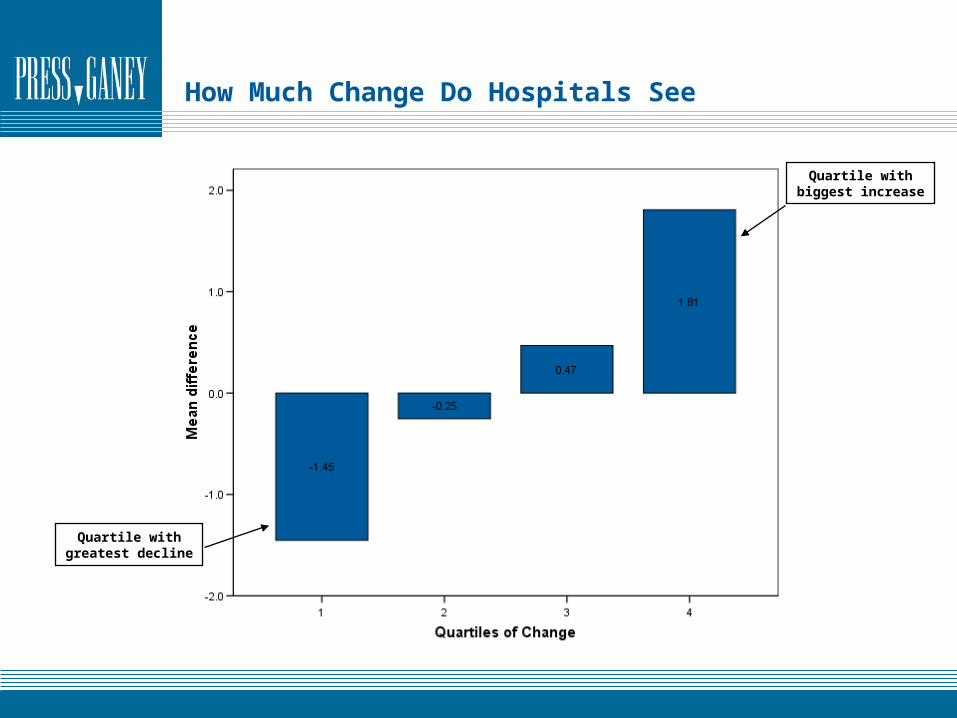
How Much Change Do Hospitals See
Quartile withgreatest decline
Quartile withbiggest increase
Facility Characteristics Not Systematically Related to Change
No consistent relationships between propensity to change and:
– Bed size
– Teaching status
– Region of the country

Facility Characteristics Related to Change
Starting Performance– Hospitals with lower patient satisfaction are more likely to
improve.
Patient Safety Journey– Hospitals that are wiling to submit data to Leapfrog are more
likely to improve.
– Hospitals active in their quality improvement journey toward safer care (IHI 100k).
Active Use of Patient Survey Data– Hospitals that analyze access online data more frequently,
generate more reports and give more users permission to use data improve more over a year.

With private patient surveys, the lower a hospital scored in 2004, the more likely it was to improve by 2005.
4321
2004 Quartile
0.75
0.50
0.25
0.00
-0.25
-0.50
Mea
n D
iffe
ren
ce
Error bars: 95% CI

Willing to Submit Data to Leapfrog

Hospitals identified by Leapfrog as showing Good Early Stage Effort achieve more positive change, and almost no negative change, in private patient surveys (2004-2005).
Fully ImplementedGood ProgressGood Early StageWilling to ReportDid Not Disclose
1.0
0.8
0.6
0.4
0.2
0.0
-0.2
Mea
n D
iffe
ren
ce
Error bars: 95% CI

In the presence of not being the best in patient satisfaction, willingness to report to Leapfrog is associated with more positive change in patient satisfaction.

100k Hospitals More likely to have significant improvement and less likely to have significant decline
0
2
4
6
8
10
12
14
16
Signif icantly Worse Signif icantly Better
Not 100K Hospital100K Hospital

Hospitals that access their private patient survey data via an online analysis tool more, improve more over one year.
1151+551-1150201-5500-200
Total Number of Logins
0.6
0.4
0.2
0.0
-0.2
Mea
n D
iffe
ren
ce

Hospitals that generate more custom reports of their private patient survey data, improve more over one year.
1001+451-1000201-4500-200
Number of Custom Reports
0.4
0.3
0.2
0.1
0.0
Mea
n D
iffe
ren
ce

Hospitals that give permission to more staff members to access to the private patient survey data, improve more over one year.
76+51-7521-500-20
Number of Users
0.6
0.4
0.2
0.0
-0.2
Mea
n D
iffe
ren
ce

Next Steps: Prospective Study of Characteristics of Culture and Activities Linked To Change
Overarching Framework
– Culture-wide concern/commitment about performance
– Culture of transparency
– Ongoing, in-depth analysis of data (not just collection)
– Behaviorist assessment of uses of feedback
– Infrastructure for quality improvement
– Activities of quality improvement