Embed Size (px)
Citation preview
"Implications of partitioned genetic diversity for linkage disequilibrium
mapping in elite UK cereal germplasm".
Donal O’Sullivan
SGC Meeting, JIC, 6-7th April 2006
Purpose
Why use ‘elite’ varieties?
• Most familiar and obvious material
• Reasonable levels of diversity present
• Relevant to current markets
• Obtainable in quantity
• Extensive ‘historic series’ of robust field data for most relevant phenotypes
To explore the prudent use of ‘populations’
of elite cereal varieties as LD mapping panels
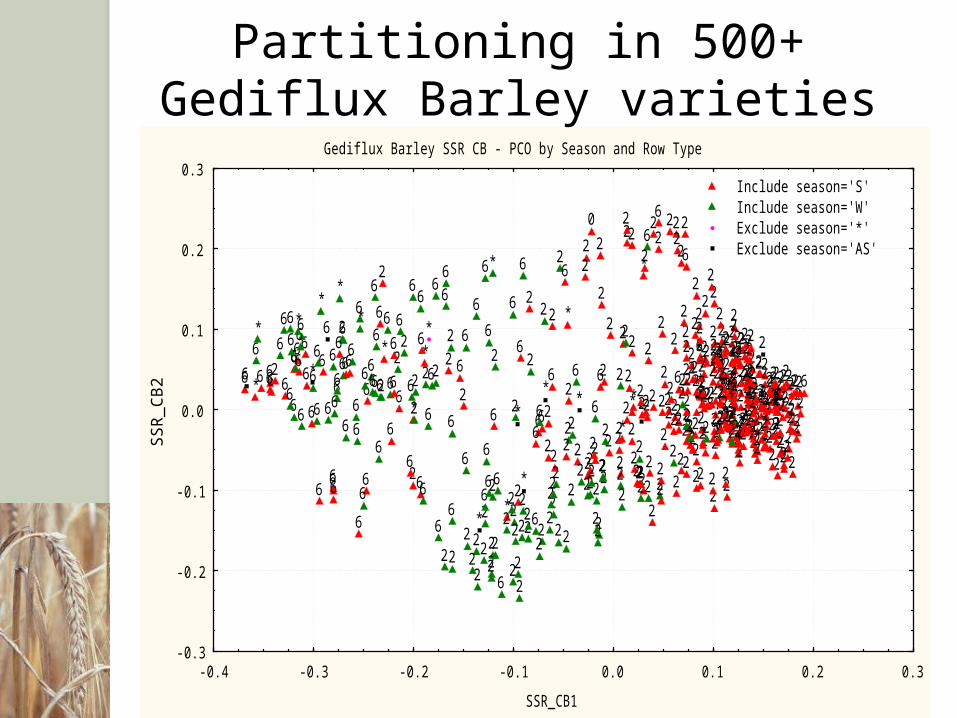
Gediflux Barley SSR CB - PCO by Season and Row Type
2
**
** ***
*
*
*
**
**
*
2
2
2
2
2
6
2
6
2 2
2
2
2
2 2
2
2
2
2
2
2
2 2
2
2
2
2222
2
22
2
2
2
22
2
2
2 2
222
22
2
2
2 22
2
2 2
2
22
2
22
2
222
22
2
22
2
2
2
2
2
2
22
2
2
222
2
2
*8?
2
2 22
22
2
2
2
22
2
22
2 22 2
2
2
22
2
2
6
6
6
6
6
6
6
6
6
66
6
66
66
66
6
6
6
6
66
8?*
*
*
*
*
*
*
2
*
2
2
2
2
2
22
2
2
2
2
22 2
2
2
22 2
2
2
2
2
22
2
66
66
6
6
6
6
6
6
66
6
6
6
6
6 6
*
0
2
2 2
2
2
2
2
2
2
22
2 22
2
222
22
2
2
2
2
2
2
2
22
2
22
2
2
2 22 2
222 2
22
2
2
22
2
222
2
2
2
2
6
6 6
6
62
2
2
2
22
2
22
22
6
66
6
2
2 2
2
2 2
2
2
22
2
2 2
2
22
22
2
2
22
2
2
2
2 22
2
2
6
6
6
6
2
2
2 2
22
2 2
2
2
2
2
6
6
6
62
2
6
6
622
2
2
2
2
2
2
22
2
62
22
2
2
2
2
22
2
22
2
2
2
2
2
2
2
2
2 2
2 2
2 2
2
2
2
2
2
2
2
222
22
2
2
2
2
2
2
2 2
2222
2
2
2
22
22
2
2
2
22
2
2
22 22
2
2 2
2
22
22
2
22
2
2
22
2
2
2
2
2
2
2
22
22
2 2
22
2
22
2
2
222
2
22
266
66
6
66
6
6
6
6
*
*
2
2
22
2
22
2
2
2
2 22
2
22
2
2
2
22
2 2
2
2
6
66
6
6
66
6
6
6
6
66
6
6
66
6
6
6
6
6
6
6
6 6
6
6
6
6
*
**
*
2
2
6
6
6 2 2
66
6666
6* *
-0.4 -0.3 -0.2 -0.1 0.0 0.1 0.2 0.3
SSR_CB1
-0.3
-0.2
-0.1
0.0
0.1
0.2
0.3S
SR
_CB
2
Include season='S' Include season='W' Exclude season='*' Exclude season='AS'
Partitioning in 500+ Gediflux Barley varieties
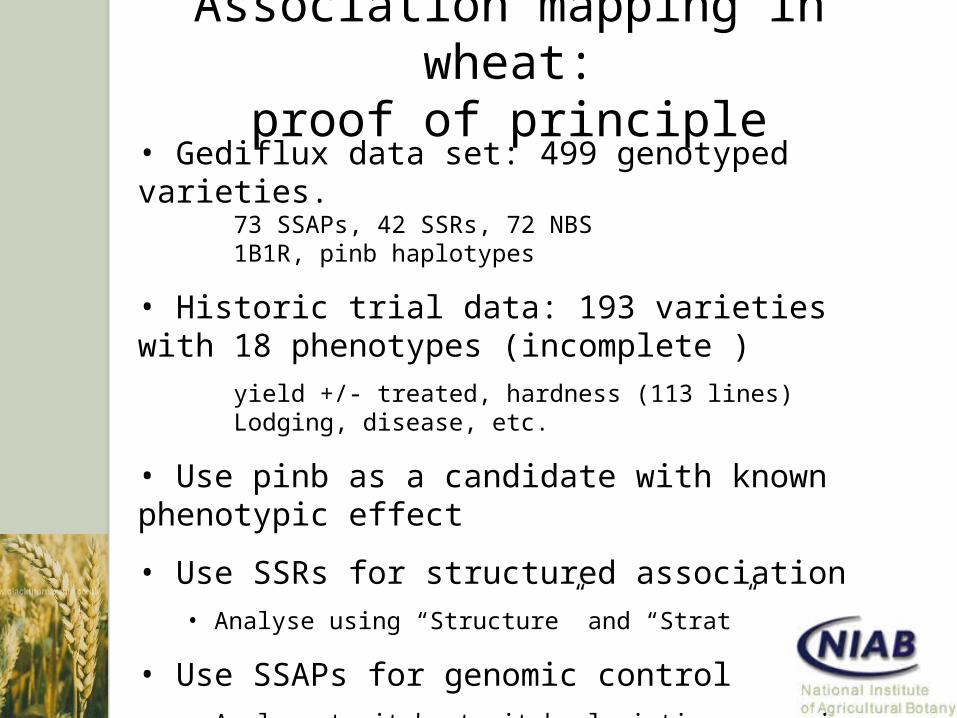
Association mapping in wheat:proof of principle
• Gediflux data set: 499 genotyped varieties.73 SSAPs, 42 SSRs, 72 NBS1B1R, pinb haplotypes
• Historic trial data: 193 varieties with 18 phenotypes (incomplete )
yield +/- treated, hardness (113 lines)Lodging, disease, etc.
• Use pinb as a candidate with known phenotypic effect
• Use SSRs for structured association• Analyse using “Structure” and “Strat”
• Use SSAPs for genomic control• Analyse trait by trait by logistic regression
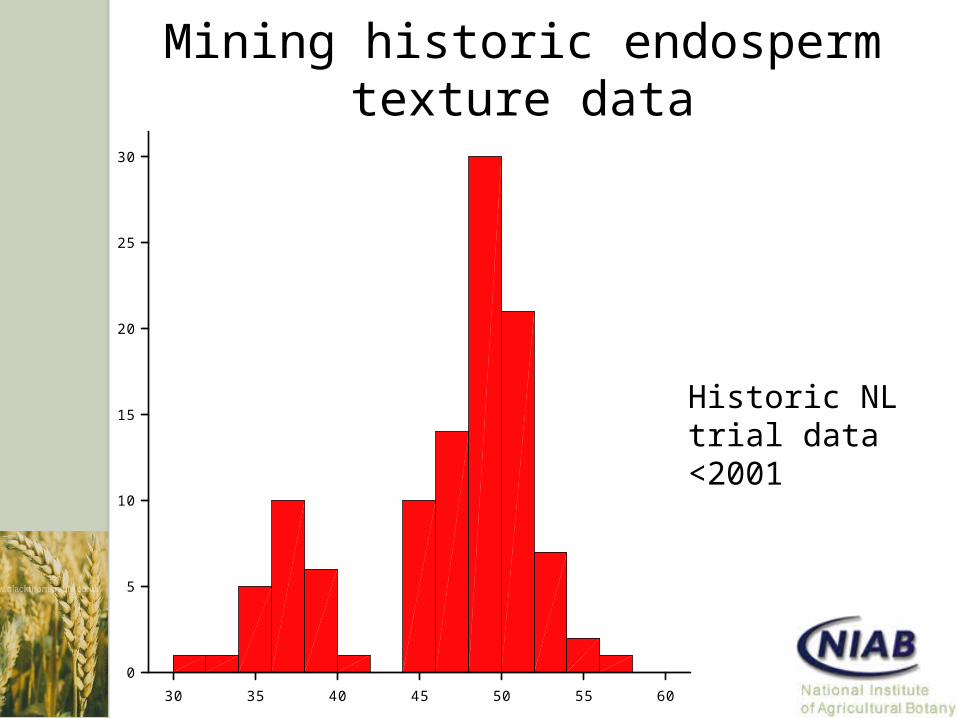
Mining historic endosperm texture data
30
25
30
5045
5
60
15
4035
20
055
10
Endosperm texture in Gedif lux
Historic NL trial data <2001
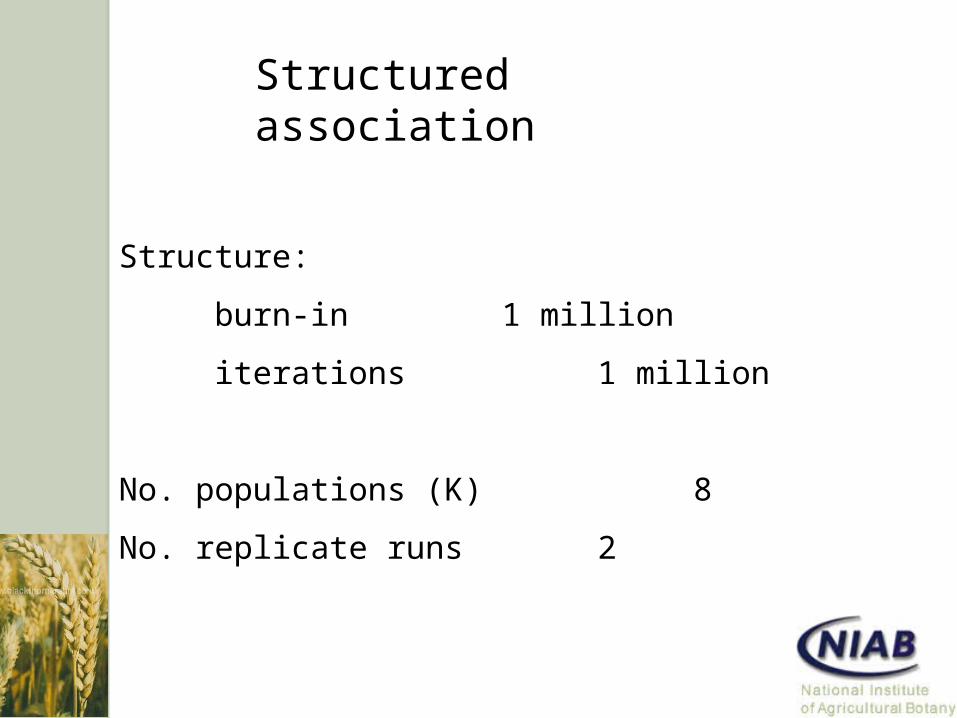
Structured association
Structure:
burn-in 1 million
iterations 1 million
No. populations (K) 8
No. replicate runs 2
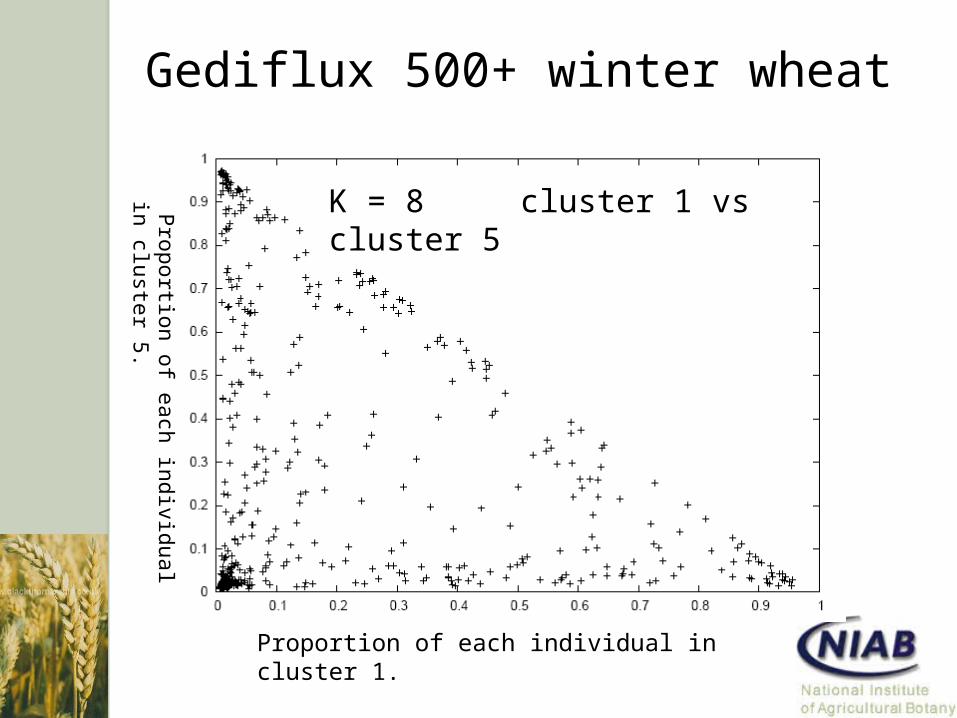
K = 8 cluster 1 vs cluster 5
Proportion of each individual in cluster 1.
Proportion of each individual in cluster 5.
Gediflux 500+ winter wheat
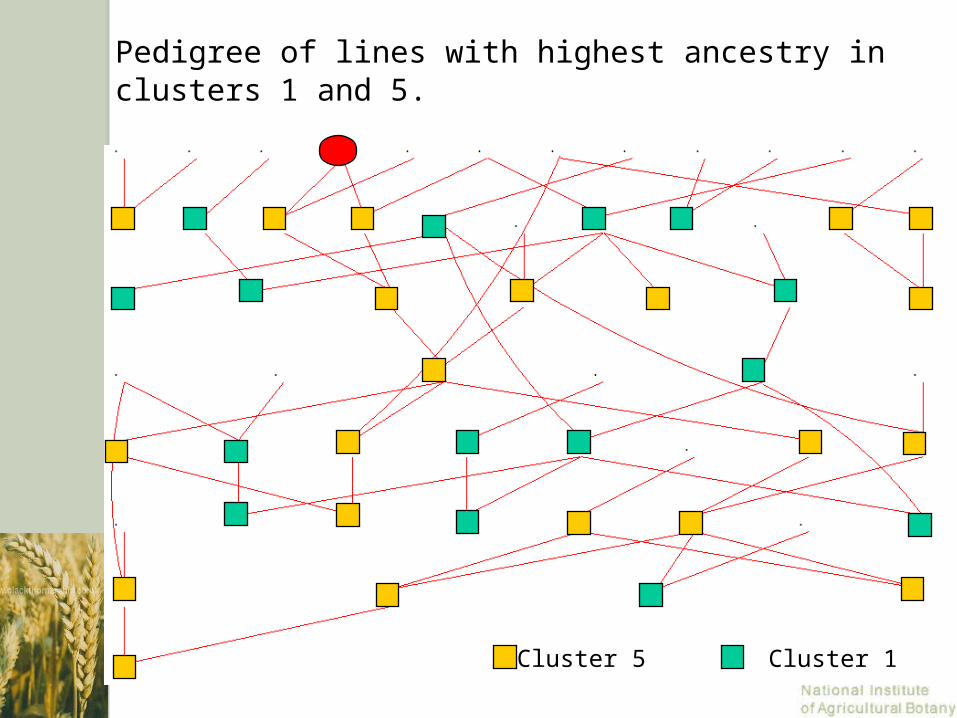
Pedigree of lines with highest ancestry in clusters 1 and 5.
Cluster 1Cluster 5
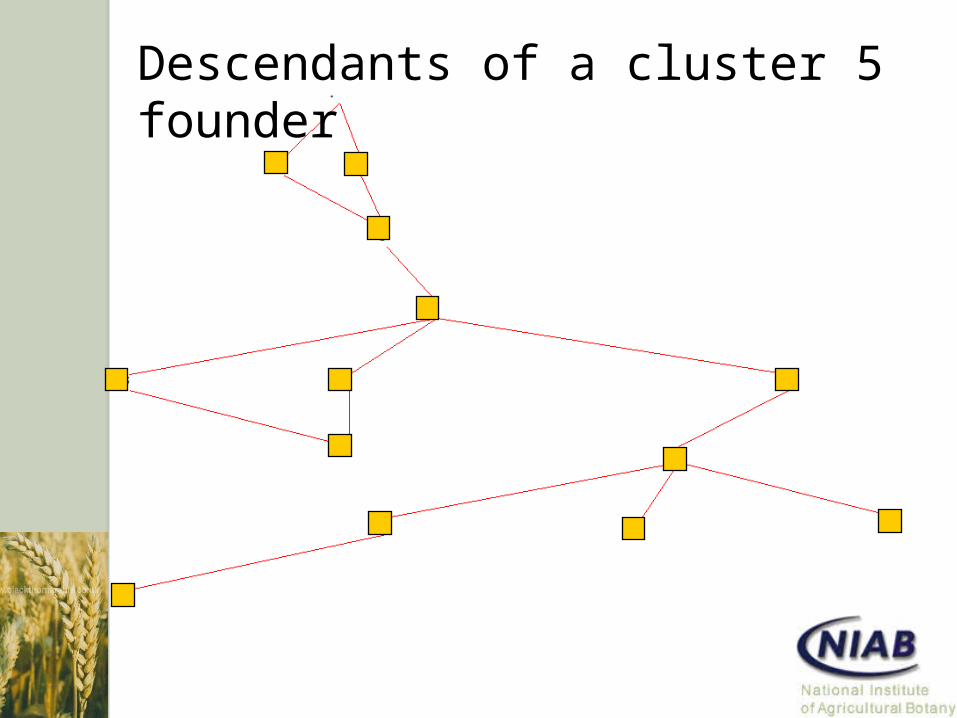
Descendants of a cluster 5 founder
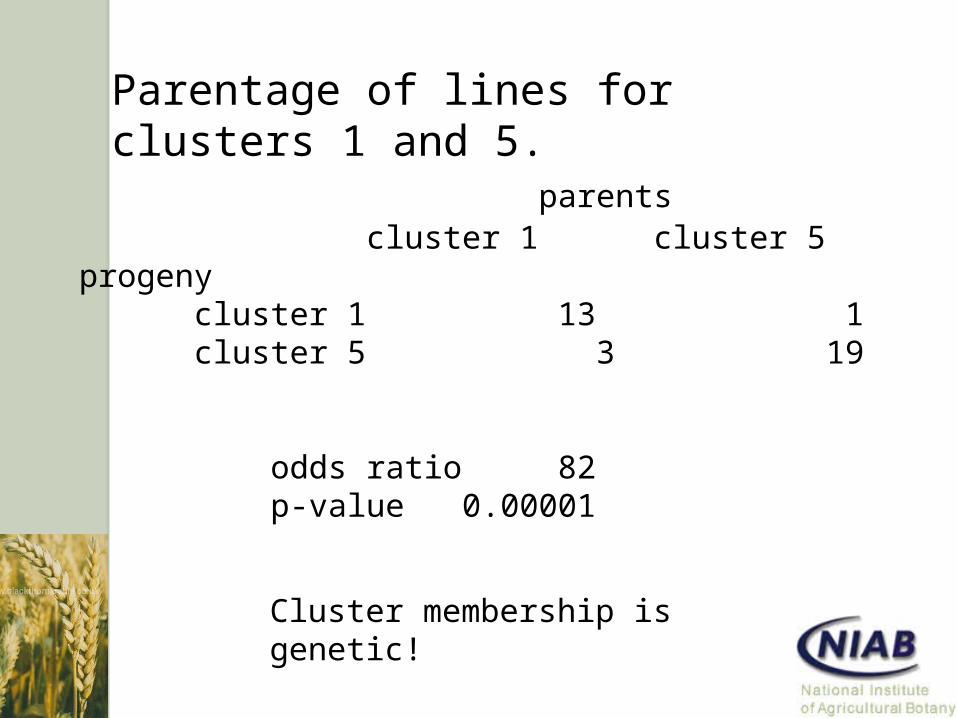
parents cluster 1 cluster 5
progeny cluster 1 13 1 cluster 5 3 19
odds ratio 82p-value 0.00001
Parentage of lines for clusters 1 and 5.
Cluster membership is genetic!
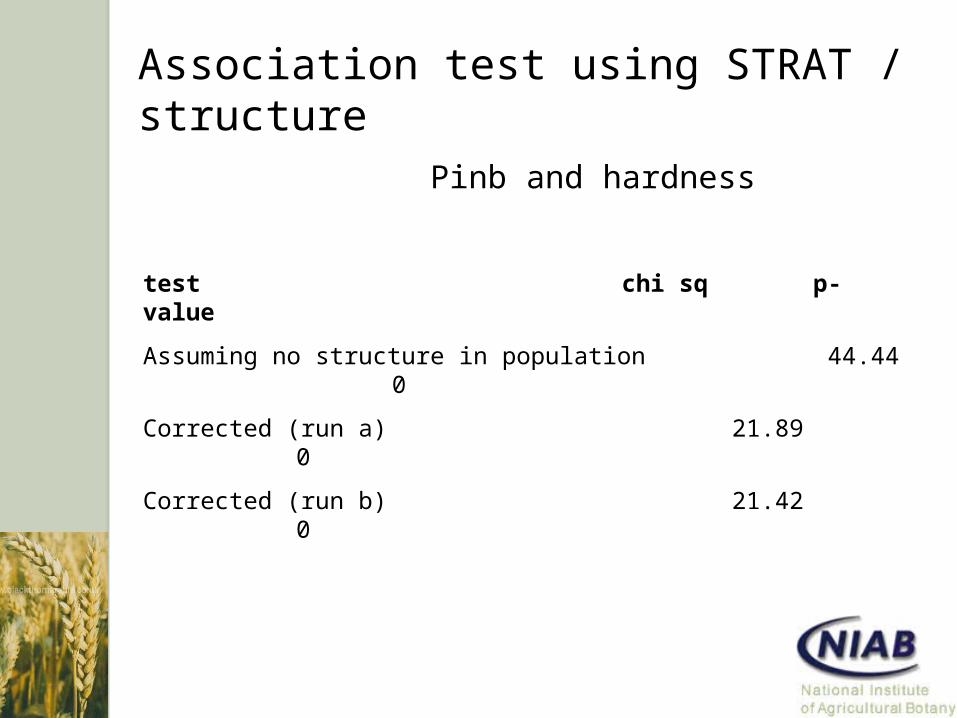
Association test using STRAT / structure
Pinb and hardness
test chi sq p-value
Assuming no structure in population 44.44 0
Corrected (run a) 21.89 0
Corrected (run b) 21.42 0
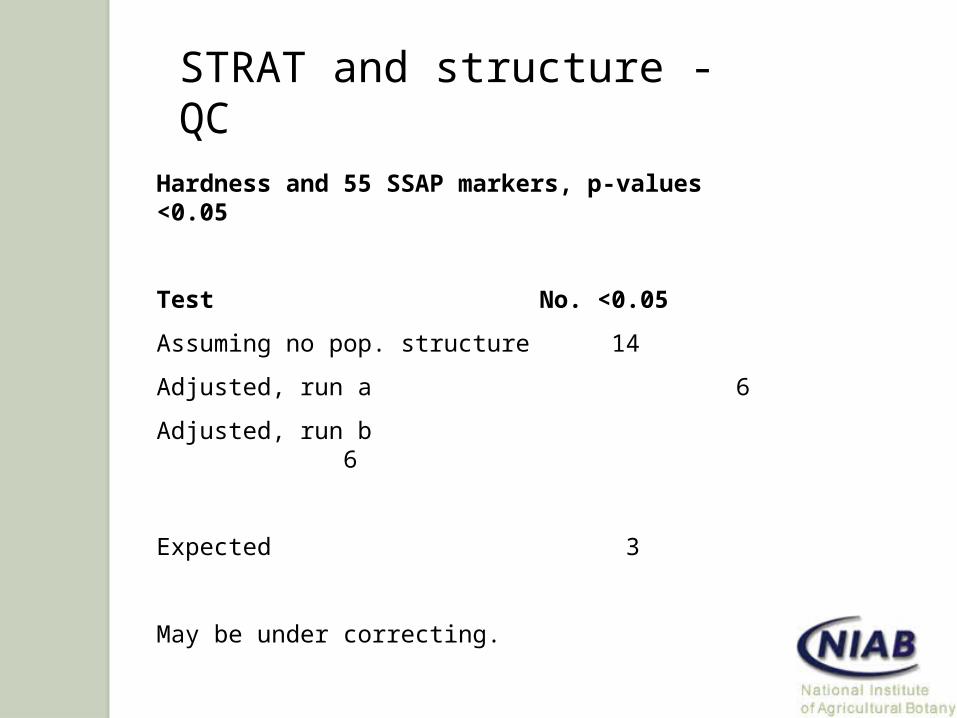
STRAT and structure - QC
Hardness and 55 SSAP markers, p-values <0.05
Test No. <0.05
Assuming no pop. structure 14
Adjusted, run a 6
Adjusted, run b 6
Expected 3
May be under correcting.
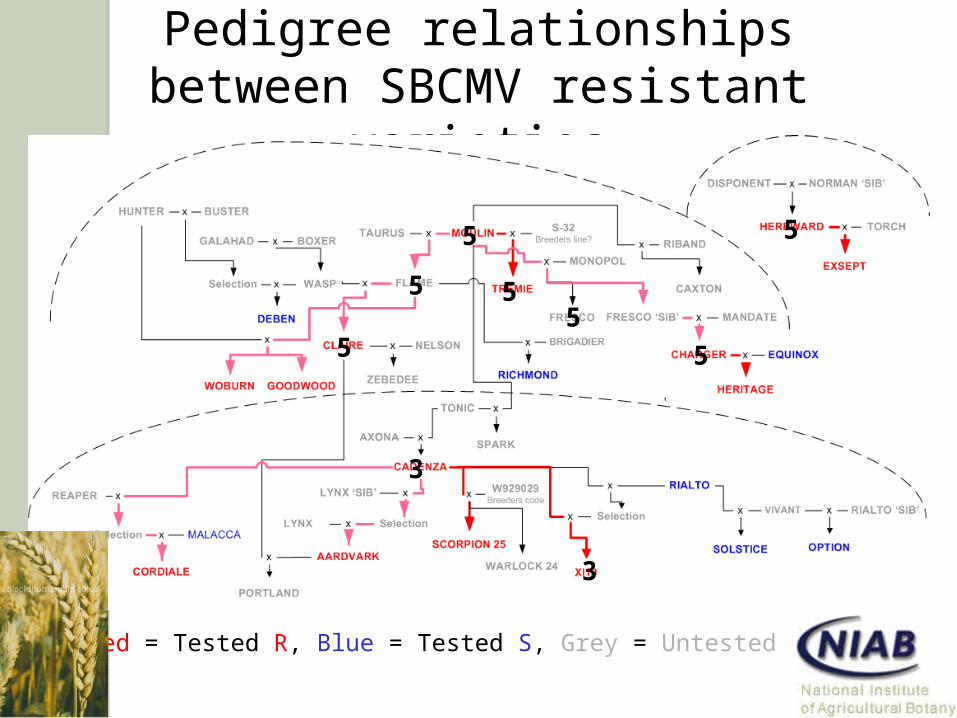
Pedigree relationships between SBCMV resistant varieties
5
5
5
55
5
5
3
3
Red = Tested R, Blue = Tested S, Grey = Untested
Genomic Control
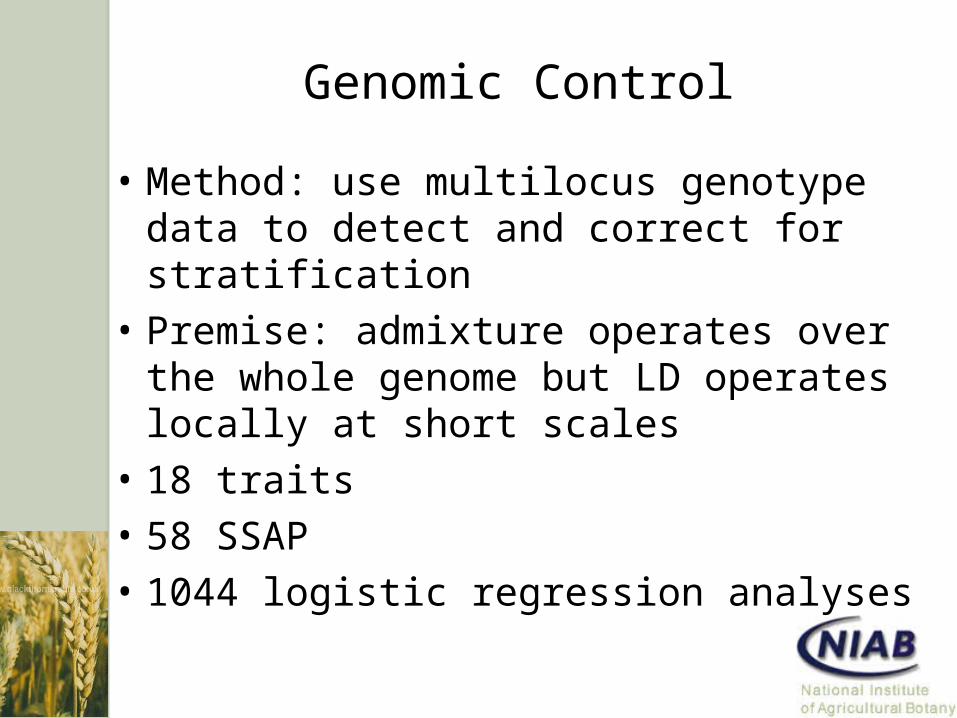
• Method: use multilocus genotype data to detect and correct for stratification
• Premise: admixture operates over the whole genome but LD operates locally at short scales
• 18 traits
• 58 SSAP
• 1044 logistic regression analyses
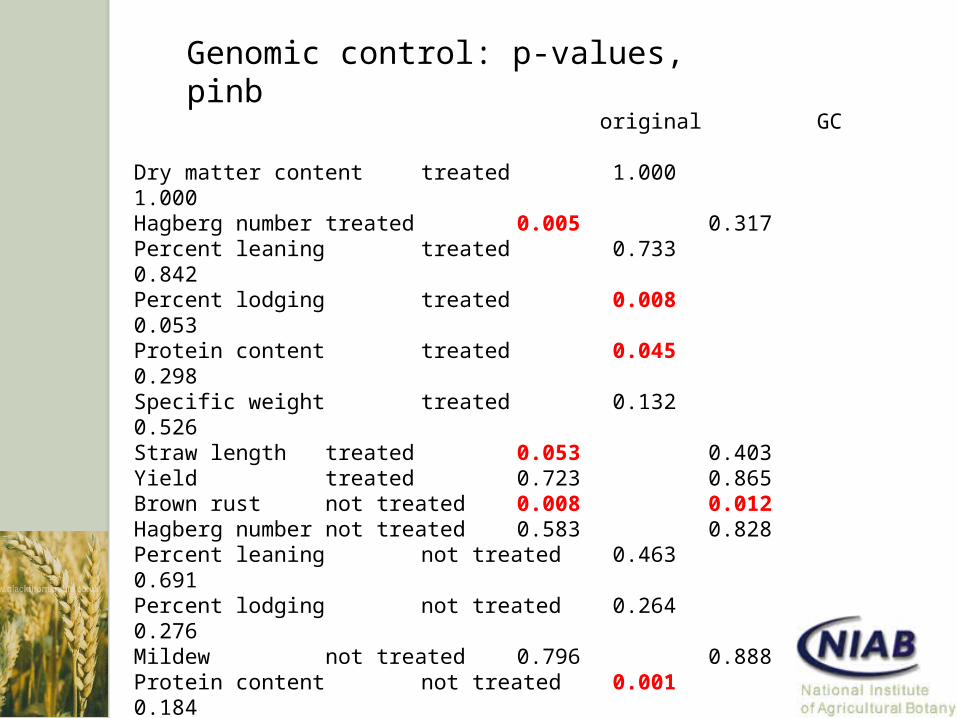
Genomic control: p-values, pinb
original GC Dry matter content treated 1.000 1.000Hagberg number treated 0.005 0.317Percent leaning treated 0.733 0.842Percent lodging treated 0.008 0.053Protein content treated 0.045 0.298Specific weight treated 0.132 0.526Straw length treated 0.053 0.403Yield treated 0.723 0.865Brown rust not treated 0.008 0.012Hagberg number not treated 0.583 0.828Percent leaning not treated 0.463 0.691Percent lodging not treated 0.264 0.276Mildew not treated 0.796 0.888Protein content not treated 0.001 0.184Septoria tritici not treated 0.091 0.426Specific weight not treated 0.080 0.288Straw length not treated 0.583 0.808Hardness 0.000 0.000
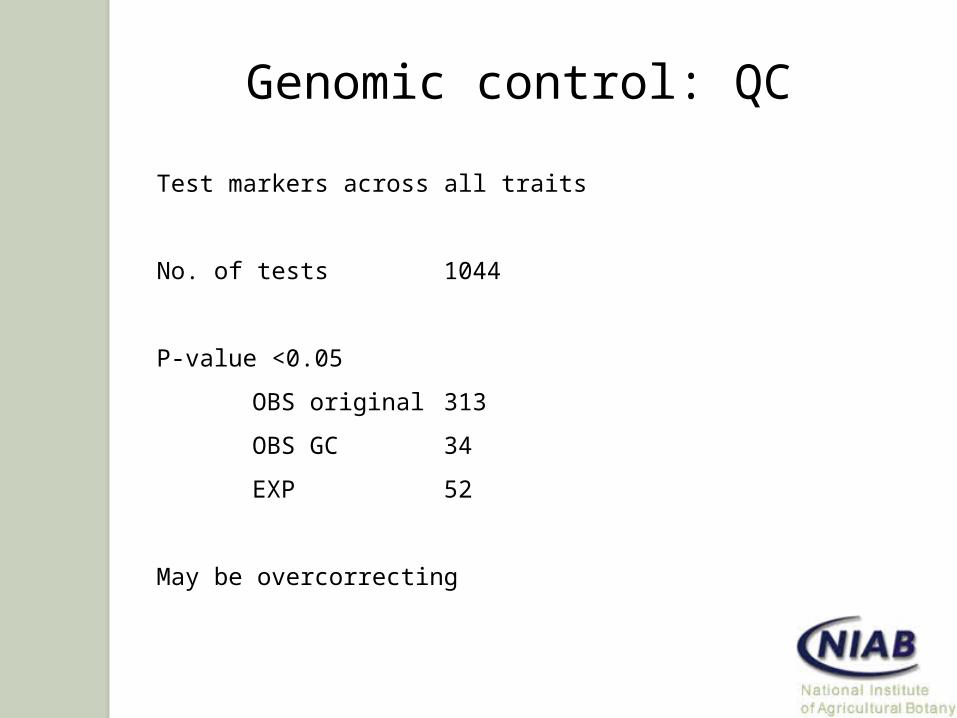
Test markers across all traits
No. of tests 1044
P-value <0.05
OBS original 313
OBS GC 34
EXP 52
May be overcorrecting
Genomic control: QC
Conclusions• Population structure may be evident e.g.
spring-winter/row number divide or less so– Carry out LD mapping within major sub-groups
• UK winter wheat shows cryptic population structure which groups varieties consistent with known pedigree
• Genomic control and/or structured association both effective in detecting known associations and reducing false +ves to realistic levels
• Roll on new phenotype and genotype data!
Acknowledgements
• NIAB– Fiona Leigh– John Law– Ian Mackay– Wayne Powell
• Gediflux Partners– Barley– Marion Roeder (IPK)– Wheat– Rob Koebner, Simon Orford (JIC)– Martin Ganal (Trait Genetics)