Embed Size (px)
Citation preview

Implications of Motor TP Pool &
Declined Risk Pool
Anurag Rastogi

Presentation Plan
Pre TP Pool Scenario
Formation of IMTPIP
Implications of TP Pool creation
IIB Actuary’s report on Pool liabilities
IRDA’s order on Pool liabilities
Implications of increase in pool liabilities
What Next?
Implications of further increase in pool reserves
Declined Risk Pool
Implications of Declined Risk Pool

Pre-TP Pool Scenario
High CV TP Loss ratios
No CV TP insurance
PSU Insurers
CV TP insurance burden Demand for CV TP insurance
Supply of CV TP insurance
G
a
p

Formation of CV TP Pool (IMTPIP)
TP premium rates increased w.e.f. 1st April 2007
IMTPIP for CV TP created w.e.f. 1st April 2007 by an order
of IRDA
Objective “Make available Third Party insurance to all
Commercial vehicles at reasonable rates and terms” (Source:
http://motorpool.co.in/)
Another objective was to enable the sharing of losses of
CV TP business amongst all insurers rather than by just
PSU insurers

IMTPIP-Salient Features
No refusal of any CV TP insurance
All CV TP premium to be ceded to the pool after
mandatory cession to GIC from underwriting year 2007-
08
Sharing of all premiums and claims by all insurers as per
their GDPI market share through retrocession
mechanism
GIC to become the pool administrator
Pool Ultimate Loss ratio estimated at 122% for 2007-08,
124% for 2008-09 and 127% for 2009-10

Implications of Pool creation

Implication on CV TP insurance availability
From a perceived demand supply gap, it became a buyers
market, albeit only for comprehensive cover
From a situation of Pick and choose CV business, TP
losses became a necessary tax for insurers
This prompted many to use this opportunity to play the
cash flow game and try to minimize CV TP losses with
some profits in Own Damage
This facilitated the easy availability of CV TP cover to all,
which was the objective of pool creation

Implications on Pricing and Underwriting
Insurers started looking at CV insurance sans TP, since TP was ceded to
pool
Some insurers started using it as an arbitrage for writing large amounts of
CV business by retaining the profitable OD component and ceding loss
making TP component into pool.
Source: Bajaj Allianz data
Motor underwriting took a back seat 2007-08 2008-09 2009-10 2010-11 2011-12 (half year)
Discount Trends in OD Premium
Pvt Car TW CV
Discounts started pouring
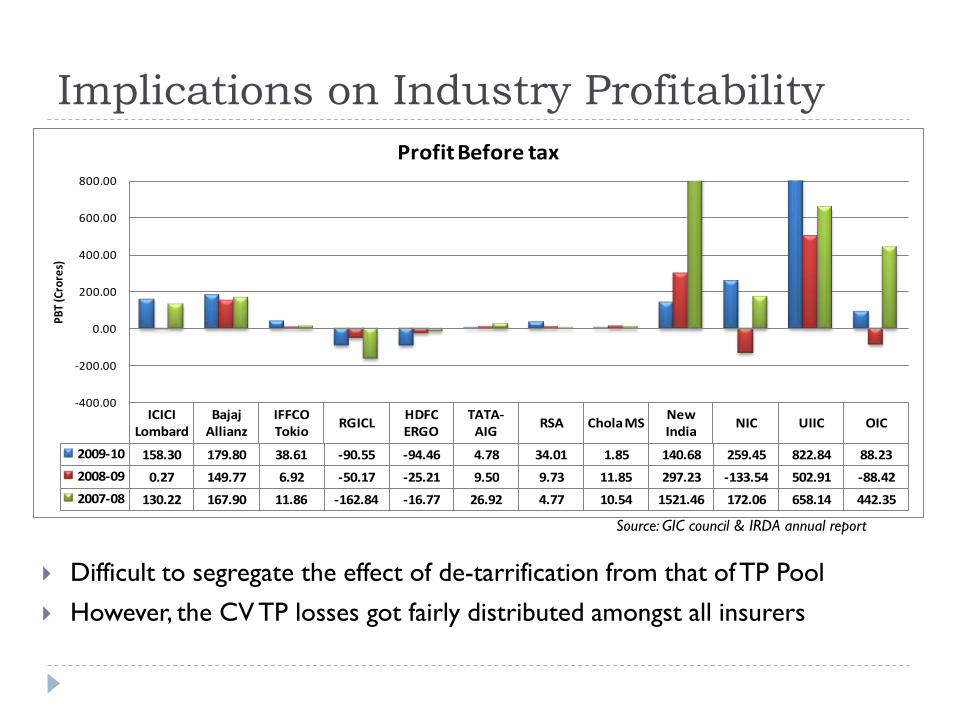
Implications on Industry Profitability
Difficult to segregate the effect of de-tarrification from that of TP Pool
However, the CV TP losses got fairly distributed amongst all insurers
ICICI Lombard
Bajaj Allianz
IFFCO Tokio
RGICLHDFC ERGO
TATA-AIG
RSA Chola MSNew India
NIC UIIC OIC
2009-10 158.30 179.80 38.61 -90.55 -94.46 4.78 34.01 1.85 140.68 259.45 822.84 88.23
2008-09 0.27 149.77 6.92 -50.17 -25.21 9.50 9.73 11.85 297.23 -133.54 502.91 -88.42
2007-08 130.22 167.90 11.86 -162.84 -16.77 26.92 4.77 10.54 1521.46 172.06 658.14 442.35
-400.00
-200.00
0.00
200.00
400.00
600.00
800.00
PB
T (C
rore
s)
Profit Before tax
Source: GIC council & IRDA annual report

Implications for TP Claims
Every insurer’s stake in a TP
claim was only to the
extent of its market share
in the industry
This is understood to have
bred inefficiency in pool
claims settlement and
possibly laxity in fraud
detection and prevention
CV TP
Claims
became
Nobody’s
baby

28th January, 2011
Late Mr. KP Sarma, Consulting Actuary, IIB, submits his
report on TP Pool provisions
The report cited under-provisioning in TP Pool and
recommended increasing the provisions as below:
Underwriting Year Ultimate Loss ratio
2007-08 172.3%
2008-09 181.81%
2009-10 194.15%
These Ultimate Loss ratios were contested by the
industry

12th March, 2011
IRDA declared that Ultimate Loss Ratio for pool business
should be provisionally taken at 153%
Pool provisions were to be immediately strengthened
assuming the above loss ratio for all the years
retrospectively
Solvency norms were relaxed to 130% for 2010-11 and
increasing to 150% in phases by 2013-14
In view of the lack of consensus on the pool ultimate loss
ratio estimate, it was decided to refer the actuarial
estimation of pool provisions for an actuarial peer review
The report of peer review from GAD, UK is awaited.
Implications of increase in Pool reserve

A
d
d
i
t
i
o
n
a
l
R
e
s
e
r
v
e
s
Implications on Balance sheet
Additional liability of nearly 2000 crores
provided for in March 2011 for years
2007-2010 by pool
An additional 900 crores(approx) in
excess of the “Budgeted”(@127%) liability
for 2010-11 also provided for in Mar 2011
The additional provision in 2010-11 was
more than 2.2 times the industry PBT in
2009-10 and 1.5 times during 2008-10
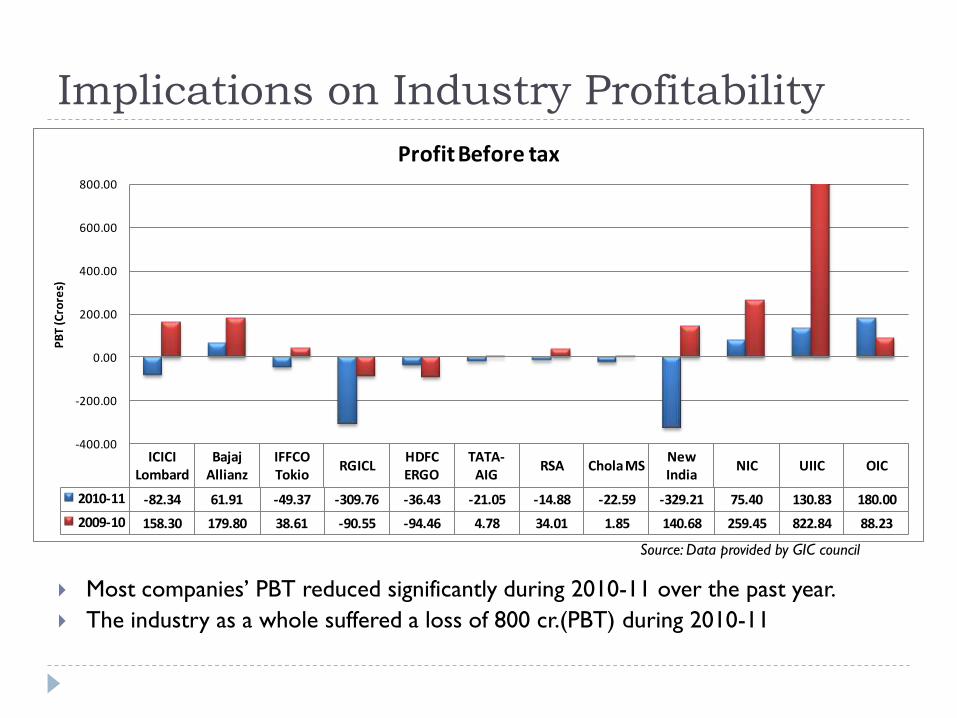
Implications on Industry Profitability
ICICI Lombard
Bajaj Allianz
IFFCO Tokio
RGICLHDFC ERGO
TATA-AIG
RSA Chola MSNew India
NIC UIIC OIC
2010-11 -82.34 61.91 -49.37 -309.76 -36.43 -21.05 -14.88 -22.59 -329.21 75.40 130.83 180.00
2009-10 158.30 179.80 38.61 -90.55 -94.46 4.78 34.01 1.85 140.68 259.45 822.84 88.23
-400.00
-200.00
0.00
200.00
400.00
600.00
800.00
PB
T (C
rore
s)
Profit Before tax
Most companies’ PBT reduced significantly during 2010-11 over the past year.
The industry as a whole suffered a loss of 800 cr.(PBT) during 2010-11
Source: Data provided by GIC council

Implications on Industry Solvency
ICICI Lombard
Bajaj Allianz
IFFCO Tokio
RGICLHDFC ERGO
TATA-AIG RSA Chola MSNew India
NIC UIIC OIC
2010-11 156% 173% 123% 115% 171% 168% 156% 161% 407% 134% 275% 134%
2009-10 210% 170% 176% 170% 179% 193% 158% 176% 463% 154% 341% 156%
0%
50%
100%
150%
200%
250%
300%
350%
400%
450%
500%
Co
mb
ine
d R
atio
s
Solvency ratios
Most companies’ solvency ratio reduced significantly and at least four companies’ ratio slipped below 150%
Source: Data provided by GIC council

What Next?
Uncertainty of pool ULR
Grapevine
estimates of
ULR at
175%-205%
It is understood that GAD, UK has submitted it’s actuarial
peer review report to IRDA but is not yet in public
domain
The findings of the report will decide the fate of industry

Implications of higher than 153% Pool ULR
At two extremes of pool ULR, the additional reserve that may have to be booked by pool could approximate to:
Ultimate Loss Ratio Additional Reserve (Cr.)
175% 2,672
205% 4,045
At 205% ULR, the additional pool reserve will exceed the
industry’s cumulative profit for the period 2007-2011 (3945 cr.
Excluding specialist companies)
Losses
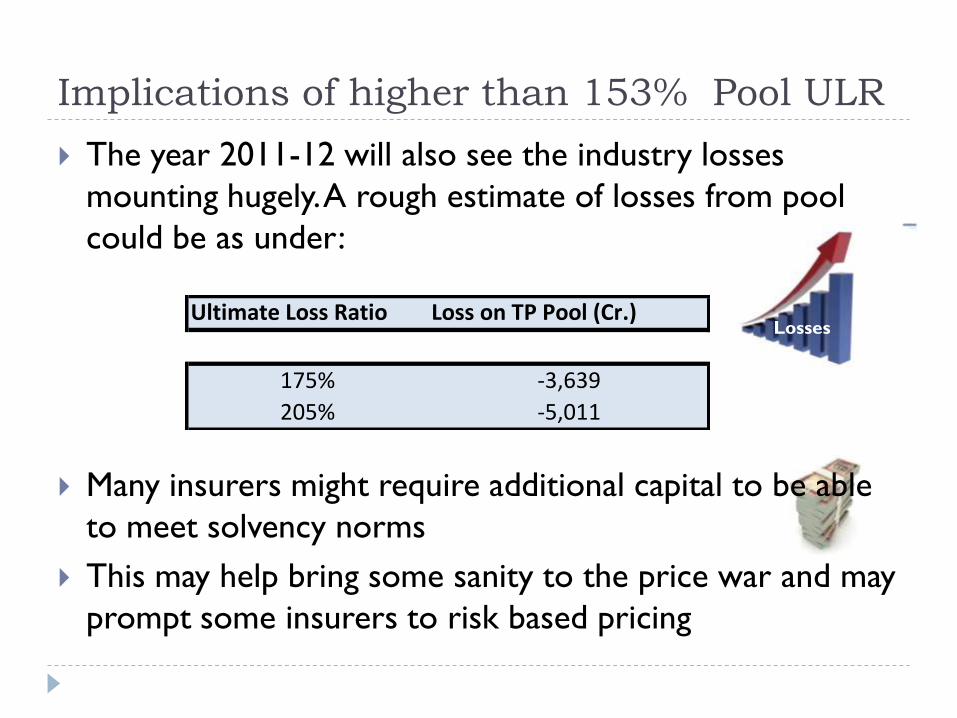
Implications of higher than 153% Pool ULR
The year 2011-12 will also see the industry losses
mounting hugely. A rough estimate of losses from pool
could be as under:
Many insurers might require additional capital to be able
to meet solvency norms
This may help bring some sanity to the price war and may
prompt some insurers to risk based pricing
Ultimate Loss Ratio Loss on TP Pool (Cr.)
175% -3,639
205% -5,011

Implications of higher than 153% Pool ULR
Already, some promoters have publicly expressed their
willingness to come out of non life business / dilute their
stake. Would this prove to be a spark for some other
promoters to think alike?
The debate around Pool liabilities has already brought to
fore the risks associated with long tail business and the
need to improve actuarial skills necessary to adequately
quantify these risks.
An important implication of the debate around TP Pool is
the new thought process of exploring options other than
Pool

Let’s move towards a more healthy,
profitable and orderly growth of general
insurance market…
This presentation has been made in my personal capacity as
a member of actuarial profession. The views expressed
herein are solely mine and in no way represent the views
of my employer Bajaj Allianz GIC.

Thanks
Questions???