Embed Size (px)
Citation preview
LUCID’s Land Use Change Analysis as an Approach
for Investigating Biodiversity Loss and Land Degradation Project
Miyuki Iiyama
University of Tokyo
Graduate School of Economics
7-3-1, Hongo, Bunkyo-ku
Tokyo 113-0033, Japan
December 2006
Implications of Crop-Livestock Integration on Changes
in Human Welfare and Environment
A Case Study from a Kerio River Basin Community
LUCID Working Paper Series Number 52
Address Correspondence to:
LUCID Project
International Livestock Research Institute
P.O. Box 30709
Nairobi, Kenya
E-mail: [email protected]
Tel. +254-20-630743
Fax. +254-20-631481/ 631499
Implications of Crop-Livestock Integration on Changes in
Human Welfare and Environment:
A Case Study from a Kerio River Basin Community
The Land Use Change, Impacts and Dynamics Project
Working Paper Number 52
Miyuki Iiyama
University of Tokyo
Graduate School of Economics
7-3-1, Hongo, Bunkyo-ku
Tokyo 113-0033, Japan
December 2006
Address Correspondence to:
LUCID Project
International Livestock Research Institute
P.O. Box 30709
Nairobi, Kenya
E-mail: [email protected]
Tel. +254-20-630743
Fax. +254-20-631481/ 631499

Copyright © 2006 by
University of Tokyo,
International Livestock Research Institute, and
Japan Foundation/International House of Japan.
All rights reserved.
Reproduction of LUCID Working Papers for non-commercial purposes is encouraged. Working papers
may be quoted or reproduced free of charge provided the source is acknowledged and cited.
Cite working paper as follows: Author. Year. Title. Land Use Change Impacts and Dynamics (LUCID)
Project Working Paper No. 52. Nairobi, Kenya: International Livestock Research Institute.
Working papers are available on www.lucideastafrica.org or by emailing [email protected].
ii
TABLE OF CONTENTS
PAGE
1. INTRODUCTION ……………………………………………………………………. 1
2. BACKGROUND AND RESEARCH METHODS…………………………………….. 2
2.1 Rokocho Valley Community, Kerio River Basin………………………………….. 2
2.2 Crop-Livestock System Integration in Rokocho……………………………………. 4
2.3 Research Methods………………………………………………………………….. 5
3. CROP-LIVESTOCK ACTIVITIES…………………………………………………….. 5
3.1 Overall Livelihoods Portfolios…………………………………………………… 6
3.2 Crop Production Activities……………………………………………………….. 6
3.3 Livestock Production Activities………………………………………………....... 8
3.4 Crop-Livestock Portfolios………………………………………………………... 10
4. CROP-LIVESTOCK DIVERSIFICATION PATTERNS AND THEIR
IMPLICATIONS ……………………………………………………………………… 12
4.1 Research Questions and Hypotheses……………………………………………….. 12
4.2 Crop-Livestock Diversification Patterns……………………………………………. 13
4.3 Implications on Welfare …………………………………………………………… 14
4.4 Implications on Environment………………………………………………………. 17
5. DISCUSSIONS AND CONCLUSIONS……………………………………………….. 19
6. REFERNCES…………………………………………………………………………. 21

iii
ACKNOWLEDGEMENT
This research was made possible through my fellowship program, sponsored by the Japan
Foundation and the International House of Japan, as well as the recipient institution, the
International Livestock Research Institute (ILRI). I would like to express special thanks to all the
Rokocho people, for their cooperated as well as my enumerators, Mathew Kiprono and Rueben
Kiprono during the study. Paul Kariuki helped us facilitate pre-survey. I also greatly appreciate
Joseph Kimeli and Sally Kimeli, Pastor Walter Kimutai and all the other AIC (African Inland
Church) staff for their warm welcome and company during my field research. I thank Patti
Kristjanson, Joseph Maitima and Patrick Kariuki of ILRI who gave invaluable advice while
Ianetta Mutie assisted with the data entry.

1. INTRODUCTION
Most rural households in semi-arid regions of sub-Saharan Africa practice mixed crop-livestock
farming (Kristjanson and Thornton 2004). Under the subsistent mode of economy with abundant
land, crop-livestock farmers have survived on consuming direct produces from crops and
livestock, while balancing allocation of natural resources for producing them. In areas where
infrastructural development and the introduction of education have transformed livelihoods from
a subsistent mode to one more involved in monetary economy, need to earn cash has
tremendously increased from both crop-livestock and off-farm activities, as lifestyle changes.
Such development is often accompanied by increase in scarcity of land for extensive grazing, as
population increases and more land is allocated exclusively for profitable crop production. This
process of rapid intensification does not take into account the social and environmental
considerations needed to ensure long-term sustainability of these new means of production. There
is need to ensure sustainable intensification1 and economically profitable integration of
crop-livestock farming to meet welfare and environmental goals for people in such a system.
But would crop-livestock diversification patterns always evolve in economically profitable and in
environmentally sustainable ways under rapidly changing socioeconomic circumstances? At
meso-level studies, it has been suggested that population pressure would promote automatic
technological intensification of crop-livestock systems (Bourn and Wint 1994). On the other hand,
real intensification processes could take more complicated and diversified ways at micro-levels,
often far from autonomous, depending on initial agroecological and socioeconomic conditions, as
well as on policy, institutional and technological options available at a particular location
(Williams et al., 1999).
One of the factors that make crop-livestock evolution pathways unpredictable is that different
types of crops and animals may play distinctive functions in dynamic processes, while African
farmers practicing mixed farming on their crop-livestock portfolios (Williams et. al.,1999). For
example, subsistent, exotic and commercial varieties have different economic returns and are
attached to different management incentives for intensification. Different types of varieties may,
furthermore, interact in complicated ways. If successfully integrated, crops and livestock would
not only contribute to higher productivity and income through mutually providing inputs
(manure/crop residues) but also better environmental management. Some combinations of
economically high-return crops and animals may be welfare enhancing, but if practiced
extensively without integration, such combinations might be environmentally unsustainable. In
such a case, some interventions to ensure both welfare and environmental goals are required.
Very few empirical studies to investigate socio-economic aspects of crop-livestock diversification
patterns have been carried out. An attempt to present an intensive case study based on
1 Agricultural intensification is defined as increased average inputs of labour, manure, draft power, crop residue, inorganic fertilizers,
feeds, veterinary drugs, pesticides, or capital, to increase the value of output per unit of land.

2
household-level survey data collected through complete enumeration of a community in Rift
Valley of Kenya which has been experiencing the following phenomena is made:
[1] perceived needs for alternative income sources due to population increase/education
[2] perceived serious environmental degradation due to overgrazing of indigenous animals
[3] introduction of new technologies (fruits, exotic, crossbreeds cattle, dairy goats)
This case study provides empirical evidences on conditions suitable for promoting sustainable
crop-livestock production to meet both welfare and environmental goals.
This Working Paper addresses the following research questions:
(1) do different crop/livestock types have different levels of economic returns, intensification, and
management incentives?
(2) what are the dominant crop-livestock diversification patterns from an integrated perspective?
(3) what are the implications of these crop-livestock diversification patterns on welfare (income)
and environment (through better management)?
(4) what policy interventions can make crop-livestock diversification patterns profitable and
sustainable?
Section 2 explains the backgrounds of the study. Section 3 describes differences in economic
returns, intensification level and management incentives attached to different crop/animal types,
and examines correlations between different activities. Section 4 identifies the dominant
crop-livestock diversification patterns and investigates their implications on welfare and
environment. Section 5 summarizes the findings and makes some suggestions for policy
interventions.
2. BACKGROUND AND RESEARCH METHODS
Section 2.1 defines the agroecological, socio-economic and institutional conditions of the study
area. Section 2.2 describes the perceived needs for crop-livestock intensification and
environmental concerns and describes drivers of development and introduction of new
technologies while Section 2.3 outlines the research methods.
2.1 Rokocho Valley Community, Kerio River Basin
Physical, Agro-Ecological, and Socio-Economic Conditions
Kerio Valley is in Keiyo district along the Basin of Kerio River which flows northwards to Lake
Turkana, in Rift Valley Province (see Figure 1). The valley is spanned by three agro-ecological
zones. The highlands (>2,500-3,000 m) lies in the west, the escarpment (1,300-2,500 m) on the
intermediate, and the lowland, or the Valley floor in the east (1,000-1,300 m) (Muchemi et al.,
2002; Iiyama 2006; SARDEP 2002).
3
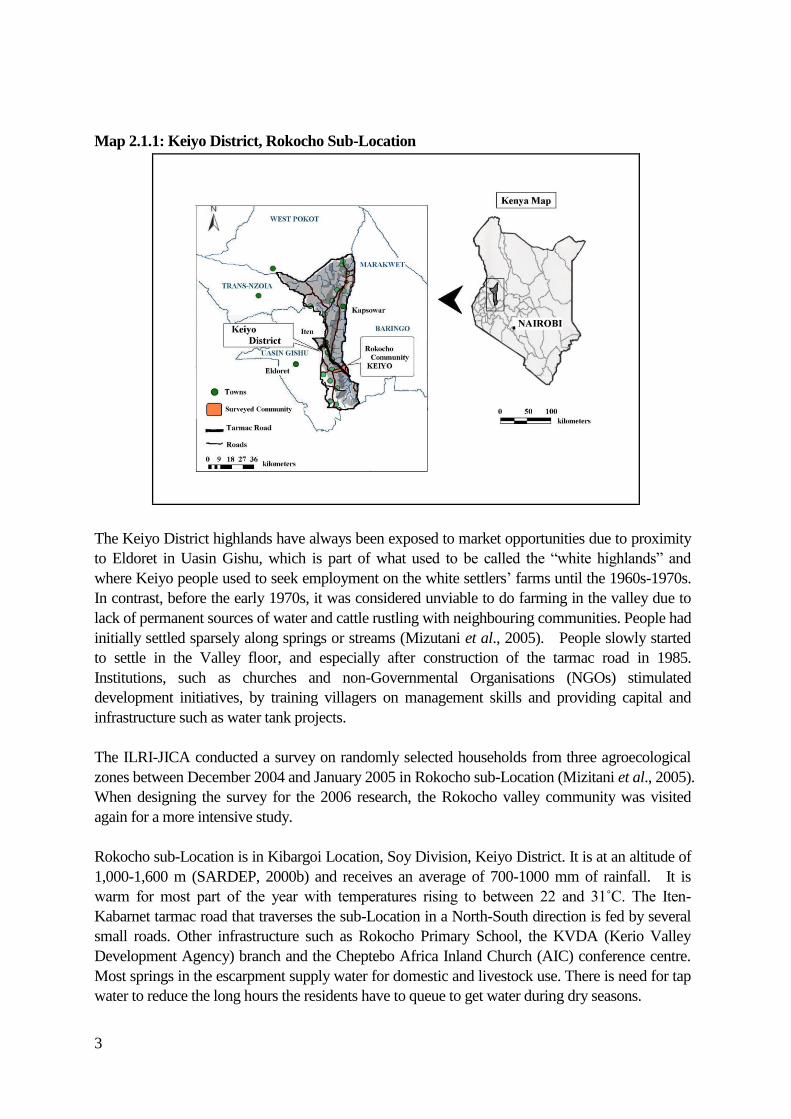
Map 2.1.1: Keiyo District, Rokocho Sub-Location
The Keiyo District highlands have always been exposed to market opportunities due to proximity
to Eldoret in Uasin Gishu, which is part of what used to be called the “white highlands” and
where Keiyo people used to seek employment on the white settlers‟ farms until the 1960s-1970s.
In contrast, before the early 1970s, it was considered unviable to do farming in the valley due to
lack of permanent sources of water and cattle rustling with neighbouring communities. People had
initially settled sparsely along springs or streams (Mizutani et al., 2005). People slowly started
to settle in the Valley floor, and especially after construction of the tarmac road in 1985.
Institutions, such as churches and non-Governmental Organisations (NGOs) stimulated
development initiatives, by training villagers on management skills and providing capital and
infrastructure such as water tank projects.
The ILRI-JICA conducted a survey on randomly selected households from three agroecological
zones between December 2004 and January 2005 in Rokocho sub-Location (Mizitani et al., 2005).
When designing the survey for the 2006 research, the Rokocho valley community was visited
again for a more intensive study.
Rokocho sub-Location is in Kibargoi Location, Soy Division, Keiyo District. It is at an altitude of
1,000-1,600 m (SARDEP, 2000b) and receives an average of 700-1000 mm of rainfall. It is
warm for most part of the year with temperatures rising to between 22 and 31˚C. The Iten-
Kabarnet tarmac road that traverses the sub-Location in a North-South direction is fed by several
small roads. Other infrastructure such as Rokocho Primary School, the KVDA (Kerio Valley
Development Agency) branch and the Cheptebo Africa Inland Church (AIC) conference centre.
Most springs in the escarpment supply water for domestic and livestock use. There is need for tap
water to reduce the long hours the residents have to queue to get water during dry seasons.
4
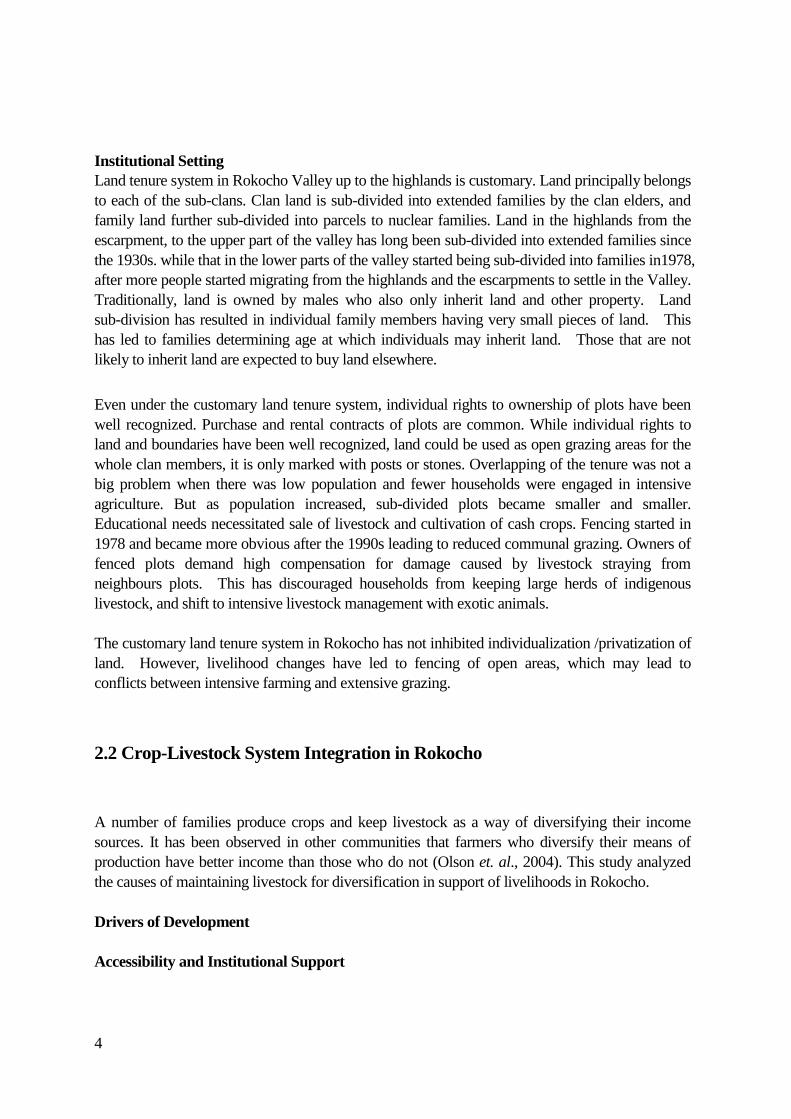
Institutional Setting
Land tenure system in Rokocho Valley up to the highlands is customary. Land principally belongs
to each of the sub-clans. Clan land is sub-divided into extended families by the clan elders, and
family land further sub-divided into parcels to nuclear families. Land in the highlands from the
escarpment, to the upper part of the valley has long been sub-divided into extended families since
the 1930s. while that in the lower parts of the valley started being sub-divided into families in1978,
after more people started migrating from the highlands and the escarpments to settle in the Valley.
Traditionally, land is owned by males who also only inherit land and other property. Land
sub-division has resulted in individual family members having very small pieces of land. This
has led to families determining age at which individuals may inherit land. Those that are not
likely to inherit land are expected to buy land elsewhere.
Even under the customary land tenure system, individual rights to ownership of plots have been
well recognized. Purchase and rental contracts of plots are common. While individual rights to
land and boundaries have been well recognized, land could be used as open grazing areas for the
whole clan members, it is only marked with posts or stones. Overlapping of the tenure was not a
big problem when there was low population and fewer households were engaged in intensive
agriculture. But as population increased, sub-divided plots became smaller and smaller.
Educational needs necessitated sale of livestock and cultivation of cash crops. Fencing started in
1978 and became more obvious after the 1990s leading to reduced communal grazing. Owners of
fenced plots demand high compensation for damage caused by livestock straying from
neighbours plots. This has discouraged households from keeping large herds of indigenous
livestock, and shift to intensive livestock management with exotic animals.
The customary land tenure system in Rokocho has not inhibited individualization /privatization of
land. However, livelihood changes have led to fencing of open areas, which may lead to
conflicts between intensive farming and extensive grazing.
2.2 Crop-Livestock System Integration in Rokocho
A number of families produce crops and keep livestock as a way of diversifying their income
sources. It has been observed in other communities that farmers who diversify their means of
production have better income than those who do not (Olson et. al., 2004). This study analyzed
the causes of maintaining livestock for diversification in support of livelihoods in Rokocho.
Drivers of Development
Accessibility and Institutional Support

5
People started to settle in the Valley after mid-1970 after cattle rusting and wild animals had been
eradicated. Infrastructural and educational development in the 1980s accelerated migration to
Rokocho and population growth. More development came especially after construction of the
tarmac road in 1985. The trend was enhanced by construction of the AIC pipeline in 1986,
construction of the community water tank by SARDEP in late 1990s and establishment of training
centres by the two agencies and the World Vision.
Needs for Cash Earning Opportunities and Environmental Concerns
The pastoralist way of life depended on extensive grazing of large number of indigenous animals,
supplemented by production of drought-resistant crops. The soils in the lower parts of the Valley
were seriously eroded and barren due to overgrazing. But as population grew and sub-divided
family land became small, it became necessary to shift grazing land to grow crops. Infrastructural
and educational developments gradually transformed the lifestyle of the inhabitants, and
substantially increased cash demand to meet educational needs. It became increasingly necessary
for the households to adopt alternative farm activities to yield higher economic values from
smaller land both for crops and livestock, without environmental costs.
Introduction of New Crop-Livestock Technologies
Development agencies tried to introduce fruits to meet both welfare (to augment income) and
environmental (to promote tree planting) goals. Exotic animals are recommended and introduced
by development institutions because they have higher production per animal, requiring less area
for grazing, thus reducing over-grazing. Fruits were introduced by AIC and initially adopted by
few farmers in Kamelgoi after 1986. SARDEP and AIC trained farmers in horticulture production
after 1996. Dairy goats were introduced by AIC after 2000.
2.3 Research Methods
A questionnaire designed to capture variables in aspects of livelihoods diversification by
households was administered on all the 177 households in the three villages that make the
Rokocho Valley community (high-return or subsistent crop and livestock activities, as well as
aspects of intensification). For livestock, information was collected on number, types, gross
income, cost of animals, how they were acquired and where they are grazed (Iiyama 2006).
3. CROP AND LIVESTOCK ACTIVITIES
Section 3.1 shows livelihoods portfolios of the surveyed households while Sections 3.2 and 3.3
describe differences in economic returns, intensification levels, and management incentives per
crop/ livestock type. Section 3.4 examines correlations between areas planted with certain types of
crops and ownership of particular type of livestock.

6
3.1 Overall Livelihoods Portfolios
The main activities as sources of income in Rokocho sub-Location are off-farm, crop production,
and livestock farming. An attempt is made to arrange households from higher total gross income
and categorize them into the income quintile groups (Table 3.1.1). Within Rokocho sub-location,
income levels are substantially different between households in Rokocho sub-Location. Higher
income groups derive substantially higher income from all of the off-farm, crop and livestock
activities. Contributions of each activity to the total gross income are not significantly different
between the groups, except crop income. Off-farm income accounts for 47-59%, crop income for
11-33% and livestock for 15-25% on average.
Table 3.1.1: Crop and Livestock Incomes in Relative to Total Income
quintile 1 quintile 2 quintile 3 quintile 4 quintile 5 Total F-value
Number of households 35 35 36 35 36 177
total income
mean 13,544 29,537 49,497 84,548 239,365 83,989 29.26 ***
standard deviation 5,183 4,682 5,379 20,460 105,554 95,235
total off-farm income
mean 8,288 18,655 23,283 42,509 122,569 43,398 38.67 ***
standard deviation 6,628 10,087 15,708 25,741 108,465 65,397
total crop income
mean 1,471 6,565 15,001 19,994 72,194 23,324 15.98 ***
standard deviation 3,674 8,273 10,110 22,708 54,433 37,251
total livestock income
mean 3,485 4,248 11,462 21,576 43,268 16,927 125.71 ***
standard deviation 5,360 6,604 11,888 20,355 48,632 28,508
ratio off-farm
mean 0.59 0.64 0.47 0.51 0.49 0.54 1.83
standard deviation 0.39 0.34 0.30 0.28 0.28 0.32
ratio crop income
mean 0.11 0.21 0.31 0.23 0.33 0.24 4.33 ***
standard deviation 0.26 0.27 0.22 0.24 0.25 0.26
ratio livestock income
mean 0.25 0.15 0.23 0.26 0.18 0.21 1.27
standard deviation 0.34 0.24 0.23 0.25 0.17 0.25
***.significant at<.01
3.2 Crop Production Activities
Crop Types
In Kerio River Basin, households plant various kinds of crops categorized as follows:
(a) Drought-resistant crops such as indigenous varieties such as sorghum, millet, and cassava.
(b) Staple crops such as maize, beans, cowpeas, green grams, groundnuts.
(c) Fruits such as mangoes, pawpaws, citrus, bananas, avocadoes.
(d) Commercial crops such as wheat, potatoes, carrots, mostly grown on plots in highlands.
7
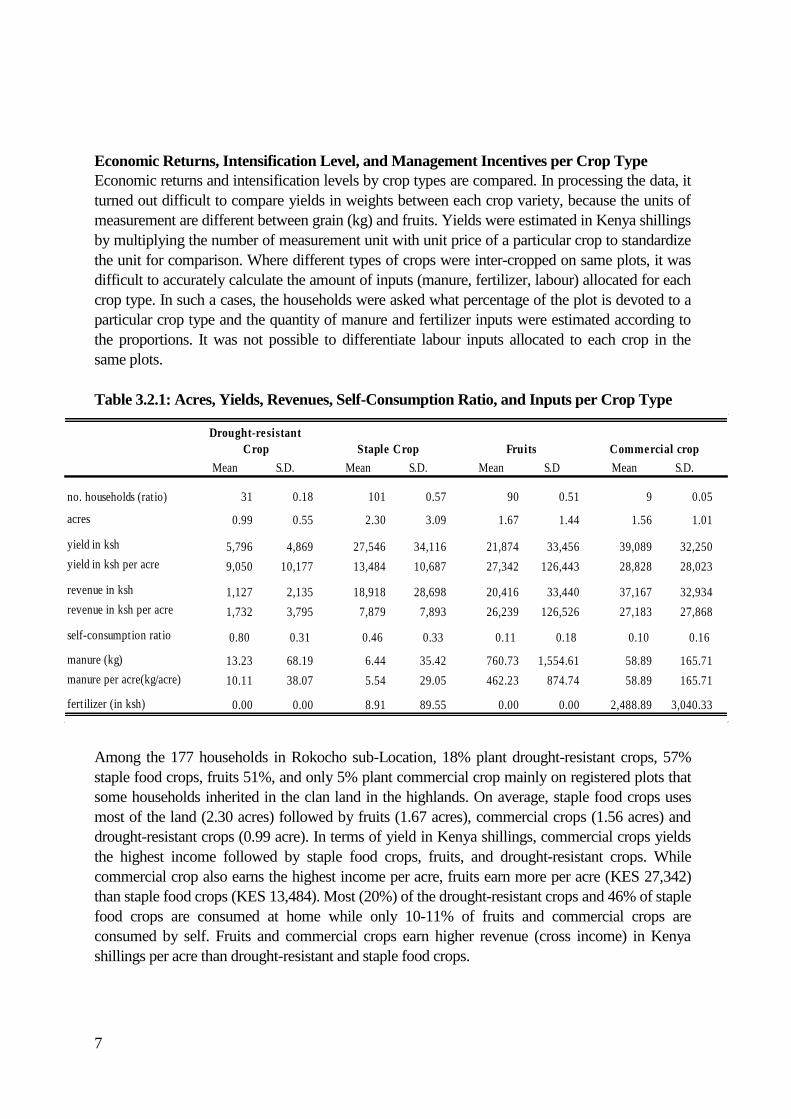
Economic Returns, Intensification Level, and Management Incentives per Crop Type
Economic returns and intensification levels by crop types are compared. In processing the data, it
turned out difficult to compare yields in weights between each crop variety, because the units of
measurement are different between grain (kg) and fruits. Yields were estimated in Kenya shillings
by multiplying the number of measurement unit with unit price of a particular crop to standardize
the unit for comparison. Where different types of crops were inter-cropped on same plots, it was
difficult to accurately calculate the amount of inputs (manure, fertilizer, labour) allocated for each
crop type. In such a cases, the households were asked what percentage of the plot is devoted to a
particular crop type and the quantity of manure and fertilizer inputs were estimated according to
the proportions. It was not possible to differentiate labour inputs allocated to each crop in the
same plots.
Table 3.2.1: Acres, Yields, Revenues, Self-Consumption Ratio, and Inputs per Crop Type
Mean S.D. Mean S.D. Mean S.D Mean S.D.
no. households (ratio) 31 0.18 101 0.57 90 0.51 9 0.05
acres 0.99 0.55 2.30 3.09 1.67 1.44 1.56 1.01
yield in ksh 5,796 4,869 27,546 34,116 21,874 33,456 39,089 32,250
yield in ksh per acre 9,050 10,177 13,484 10,687 27,342 126,443 28,828 28,023
revenue in ksh 1,127 2,135 18,918 28,698 20,416 33,440 37,167 32,934
revenue in ksh per acre 1,732 3,795 7,879 7,893 26,239 126,526 27,183 27,868
self-consumption ratio 0.80 0.31 0.46 0.33 0.11 0.18 0.10 0.16
manure (kg) 13.23 68.19 6.44 35.42 760.73 1,554.61 58.89 165.71
manure per acre(kg/acre) 10.11 38.07 5.54 29.05 462.23 874.74 58.89 165.71
fertilizer (in ksh) 0.00 0.00 8.91 89.55 0.00 0.00 2,488.89 3,040.33
Commercial crop
Drought-resistant
Crop Staple Crop Fruits
Among the 177 households in Rokocho sub-Location, 18% plant drought-resistant crops, 57%
staple food crops, fruits 51%, and only 5% plant commercial crop mainly on registered plots that
some households inherited in the clan land in the highlands. On average, staple food crops uses
most of the land (2.30 acres) followed by fruits (1.67 acres), commercial crops (1.56 acres) and
drought-resistant crops (0.99 acre). In terms of yield in Kenya shillings, commercial crops yields
the highest income followed by staple food crops, fruits, and drought-resistant crops. While
commercial crop also earns the highest income per acre, fruits earn more per acre (KES 27,342)
than staple food crops (KES 13,484). Most (20%) of the drought-resistant crops and 46% of staple
food crops are consumed at home while only 10-11% of fruits and commercial crops are
consumed by self. Fruits and commercial crops earn higher revenue (cross income) in Kenya
shillings per acre than drought-resistant and staple food crops.

8
Very few households in Kerio River Basin use either organic manure or inorganic fertilizer on
crops, while those planting commercial crops, mainly on plots in the highlands, apply some
chemical fertilizer. On average, fruits receive more manure (761 kg, or 462 kg/acre) than the other
crop types, though this amount might be too low. Some studies suggest that an annual application
of 5-6 t/ha (3-3.6/acres) of manure resulted in higher yields of maize in Kenya (cited in Bationo et
al., 2004), but staple food crops receives little (5.5 kg/acre) manure in the study area. Most plots
with staple food crops are far away from homesteads in the lower parts of the River Basin. When
we asked why manure application on staple food crops is so low, local people said that they
believe the soil is still fertile enough while others said that another reason may be that their plots
are too far away from homesteads and too large to apply manure.
Different crop types are associated with different economic returns, levels of intensification and
different management activities. Drought-resistant crops are mainly planted for subsistent purpose
while staple food crops generates income and food security. While staple food crops have high
economic return in yield (KES), they are rather planted extensively in larger areas without any
inputs because of the reasons given above. In contrast, fruits and commercial crops are intended
for market and planted for commercial purpose. Though little, manure is more likely to be applied
to fruits, usually planted on homestead plots, from livestock owned by households.
3.3 Livestock Production Activities
Animal Types
There are two categories of livestock:
(a) Exotic animals such as exotic-crossbreed cattle, dairy goats.
(b) Traditional animals such as indigenous cattle, sheep-goats [shoats].
Economic Returns, Intensification, Management Incentives per Animal Type
In order to compare economic cost and revenue per animal unit for different types of livestock,
the number of animal holdings was converted into the Total Livestock Unit (bull: 1.29 TLU, cow:
1TLU, calf: 0.7 TLU, sheep and goat: 0.11 TLU) (Table 3.3.1).
Livestock Holdings among Households, Mode of Acquisition
Exotic and crossbreed cattle kept by fewer households (21%, 3.78 TLU on average), than
indigenous cattle (45%, 6.04 TLU). Dairy goats are kept by even fewer families (10%, 0.30 TLU
or 2.76 animals). Most (65%) households own on average 2.52 TLU of shoats (22.93 animals) but
the standard deviation suggests a skewed distribution. Exotic animals were more likely
purchased by household themselves (95% for exotic and crossbreed cattle, 100 % for dairy goats).
On the other hand, 30-44% of indigenous cattle and shoats are inherited.
Grazing

9
Exotic animals are more likely to be semi-zero grazed (51% for exotic and crossbreed cattle and
47 % for dairy goats), or zero-grazed for dairy goats (24%). In contrary, traditional animals are
grazed on open, unfenced areas, mostly within own village or in neighbouring villages.
Milk Production and Revenue
Exotic and crossbreed cattle can produce as much as 2.60 L of milk while indigenous cattle can
produce 0.90 L a day, less than 1.00 L per day by a dairy goat. Exotic/crossbreed cattle and dairy
goats are mostly grazed near homesteads (semi-zero grazing on family farms). Some of the milk
is consumed by the household while some is sold to local kiosks or to neighbours at KES 25 L. A
household can earn KES 12,000 a year if it sold half (1.3 L) of milk from a cross bred cow.
Indigenous cattle produces very little milk, and are rarely milked and are left far away from
homesteads for extensive grazing. Dairy goats produce more milk than indigenous ones but little
is sold while most is consumed at home. Shoats are not considered for milk production.
Number of Animals Sold
More traditional animals are likely to be sold (indigenous cattle 1.25, shoats 4.04 per year) than
exotic animals (exotic/crossbreed cattle 0.59, dairy goats 0.71). The sold price per animal for
exotic / crossbreed cattle looks rather low, probably because young calves were sold. A dairy goat
can be sold at far higher price (KES 2,129) than a local shoat (KES 785).
Table 3.3.1: Acquisition, Grazing, Revenue, Costs and Income per Animal Type
mean S.D. mean S.D. mean S.D. mean S.D.
no. of households (ratio) 37 0.21 17 0.10 79 0.45 115 0.65
no. of animals 3.95 2.45 2.76 1.64 6.51 7.18 22.93 47.30
TLU 3.78 2.37 0.30 0.18 6.04 6.58 2.52 5.20
no. of adult females(for cattle/d.goats) 2.32 1.36 1.53 0.72 3.80 4.28
probability of inheritance 0.14 0.35 0 0 0.44 0.50 0.30 0.46
probability of purchase 0.95 0.23 1.00 0 0.58 0.50 0.75 0.44
% of open grazing 0.46 0.51 0.29 0.47 0.95 0.22 0.93 0.26
% of semi-zero grazing 0.51 0.51 0.47 0.51 0.05 0.22 0.07 0.26
% of zero grazing 0.05 0.22 0.24 0.44 0 0 0 0
milk produced per adult female (litt le/day) 2.60 1.99 1.00 0.75 0.90 0.98
milk revenue per adult female (ksh/year) 12,395 13,634 537 1,515 1,085 3,449
no.of animals sold during the past 12 months 0.59 0.80 0.71 0.99 1.25 1.80 4.04 8.10
revenue from selling animals (ksh) 5,786 7,698 3,600 4,927 8,626 11,228 4,187 8,109
sold price per animal (ksh/animal) 4,495 5,637 2,129 2,642 4,199 3,743 785 683
costs for feed per TLU (ksh/year) 1,159 1,181 107 441 0 0 3 37
total costs per TLU (ksh/year)* 1,417 1,234 7,592 7,296 676 612 1,526 1,126
gross income per TLU 7,406 6,538 15,838 27,068 2,567 4,678 1,885 2,267
net income per TLU 6,037 6,111 8,246 27,098 1,904 4,533 359 2,456
*total costs include costs for dipping, spraying, medecines, deworming, and feed.
exotic &
crosbreed cattle sheep & goats
indigenous
cattledairy goats
Feed and Veterinary Costs

10
While indigenous cattle are freely grazed on open areas, owners of exotic and crossbreed cattle
supplementary feed for nutrition. Money spent per TLU on dairy goats should be overvalued
(because a dairy goat is calculated as 0.11 TLU, the amount spent per animal could be a tenth of
that in TLU), but even so, dairy goats require intensive inputs than the local ones.
Differences in Management Levels between Exotic and Traditional Animals
Exotic and traditional animals have different economic returns as:
(a) Exotic: more productive asset to produce cash flow from milk
(b) Traditional: saving or asset to be easily liquidated in time of needs
While exotic animals may be kept for maximizing income, indigenous livestock are kept in
semi-arid rural Africa not necessarily to contribute to income flow, but for security reasons to
counter risks (Ashley and Nanyeenya 2005). Households may attach different values to exotic and
traditional animals, and adopt different management such as:
(a) Exotic: investment in quality….intensive semi-zero grazing, more external inputs
(b) Traditional: investment in quantity…extensive open grazing, less external inputs
Intensive management of animals also have some implications on crop intensification. Dung of
extensively grazed traditional animals is difficult to be collected, therefore rarely recycled as
organic manure. Manure from animals kept within own plots are easily collected and applied to
crops planted on plots nearer to bomas. Understanding implications of differences in management
incentives between animal types should be important in evaluating sustainability of crop-livestock
livelihoods evolutions and on economic returns on welfare.
3.4 Crop-Livestock Portfolios
The previous two sub-Sections have examined the adoption and management of particular crops/
animals by households. It is likely that there may be some patterns of adopting particular
combinations of crop-livestock activities, as most African agro-pastoralist diversify their
crop-livestock activities. Adopting a particular crop type (subsistent/commercial) could be
associated with the adoption of a particular animal type (traditional/exotic). There may be high
correlations between particular crop activities and ownership of certain animal types. As such
implications of crop-livestock activities on welfare and environment, not as mutually independent
activities but as particular diversification patterns with distinctive economic/management
incentives should be investigated.
Before investigating such patterns, correlations between particular crop/animal types are observed
Crop-livestock portfolios are defined as how households allocate land to particular types of crops
and which particular types of animals households own. The variables include the ratios of land
devoted to particular types of crops, total land used, the ratios of particular animal types held in
total TLU, and total TLU, and are standardized into the same units. Table 3.4.1 shows a
correlation matrix of standardized z-scores of the variables representing crop and livestock
portfolios.

11
The ratio of land with drought-resistant crop is negatively correlated with land with staple food
crops (-0.185) and fruits (-0.308). This shows that households devoting proportionally larger parts
of land to drought-resistant crops are less likely to practise intensive horticulture and staple food
crops cultivation. The ratio of land with staple food crops is highly negatively correlated with
fruits (-0.589) positive with total land used (0.254), percent of indigenous cattle in total TLU
(0.197), and total TLU (0.250). The ratio of land with fruits is positively correlated with percent of
exotic and crossbreed cattle in total TLU (0.237). In comparison, households engaged more in
fruits tend to keep improved breeds of livestock intensively, while those devoting more land to
staple food crops tend to use more land extensively and to own more indigenous livestock. The
ratio of exotic and crossbreed cattle in total TLU are negatively correlated with those of
indigenous cattle (-0.324) and sheep/goats (-0.235). The ratio of indigenous cattle in total TLU is
negatively correlated with that of sheep/goats (-0.442), but positively with total TLU (0.322). The
ratios of land with commercial crop and of dairy goats in total TLU do not have any correlation
with the other variables.
Table 3.4.1: Correlation Matrix
Z scores
drought-
resistant staple crop fruits commercial
total land
used
exotic /
crossbreed
cattle dairy goats
indigenous
cattle sheep/goats
total
livestock
Land Allocation
drought-resistant crop(%) 1
staple crop(%) -.185(*) 1
fruits(%) -.308(**) -.589(**) 1
commercial crop(%) -0.086 -0.097 -0.028 1
total land used (acres) -0.100 .254(**) 0.000 0.089 1
Animal Portfolio
exotic and crossbreed cattle(%) -0.133 -0.075 .237(**) 0.112 .236(**) 1
dairy goats(%) -0.043 0.066 -0.005 -0.024 -0.015 -0.044 1
indigenous cattle(%) -0.079 .197(**) -0.100 -0.057 -0.053 -.324(**) -0.083 1
sheep & goats(%) 0.003 -0.120 -0.013 -0.040 -0.027 -.235(**) -0.061 -.442(**) 1
total livestock (TLU) -0.143 .250(**) -0.146 -0.078 0.119 0.005 -0.072 .322(**) -0.040 1
*. Correlation is significant at the 0.05 level (2-tailed).
**. Correlation is significant at the 0.01 level (2-tailed).
The finding on correlations suggests that, rather than independently dealing with variables
representing engagement in each crop/livestock type, it is better to look at them in an integrated
manner, by creating a new set of variables without losing information contained in the original
variables. Furthermore, for later regression analyses on welfare and environment, we should have
fewer and simpler variables which are uncorrelated one another.
12
4. CROP-LIVESTOCK DIVERSIFICATION PATTERNS AND
THEIR IMPLICATIONS
Section 4 looks at crop-livestock diversification patterns and their implications on welfare and
environment from an integrated perspective.
4.1 Research Questions and Hypotheses
We define “crop-livestock diversification (CLD)” patterns as particular combinations of certain
crops and animal types adopted by households. As seen in Section 3, different crops/livestock
types have different economic returns and levels of intensification, as well as management
activities. If combined, some crop-livestock activities may be of simple diversification or of more
integrated systems. According to van Keulen and Schiere (2004), “diversification occurs where
components such as crops and animals co-exist rather independently on-farm. Their combination
reduces risks, but their interactions are minimal. Nutrient flows are rather linear, (this form of
mixing does not involve recycling of resources to a significant degree). Integration occurs where
the components of the farm are interdependent, (where animals providing dung while consuming
crop residues) (van Keulen and Schiere 2004, also citing Savadogo 2000).
The economic profitability and sustainable environmental integration of CLD patterns are
analysed and leads to the following questions:
(1) What are dominant CLD patterns?
(2) What are the level of integration and intensification?
(3) What are the implications of particular CLD patterns on income levels or welfare?
(4) What are the implications of particular CLD patterns on the environment?
Capital asset endowments of households, (human [labour, education] and financial capital [land,
labour]), and access to off-farm income would substantially affect the decisions by households to
choose profitable livelihood strategies (Freeman and Ellis, 2005) as well as to undertake
resource-conservation measures (Reardon and Vosti 1995; Barrett et al., 2002, Tittonell et al.,
2005). Along with capital asset variables and access to off-farm income. It is assumed that
different CDL patterns could have different implications on welfare and the environment through
different economic returns and management activities attached to particular crop/livestock types.
For example, staple food crops have high economic returns, but households have few incentives
to intensify and integrate them with animal production, applying only little manure. In contrast,
horticulture is profitable and owners are more likely to apply animal manure to fruits intensively,
potentially leading to better environmental consequences. The hypothesis here is that different
CLD patterns would affect income levels and resource management, along with variables
representing capital asset endowments of households (labour, education, etc.), and access to
off-farm income.
13
4.2 Crop-Livestock Diversification Patterns
In order to extract a new set of variables representing crop-livestock diversification patterns from
the independent crop-livestock portfolio variables, principal components analysis was employed.
Principal component analysis is a multivariate analytical tool used to describe the variation of a
set of multivariate data in a set of uncorrelated variables, each of which is a particular linear
combination of the original variables. The object of the analysis is to see whether the first few
components account for most of the variation in the original data. If so, they can be used to
summarize the data with little loss of information. A reduction in dimensionality is also desirable
in simplifying later analyses (Everitt and Dunn 2001).
Because the variables representing crop-livestock portfolios have different units (%, acres, TLU),
they were converted into standardized z scores (Table 3.4.1). Two criteria: (1) retain just enough
components to explain some specified, large percentage (between 70-90%) of the total variation
of the original variables, (2) exclude those principal components whose values are less than the
average or 1 for this case, as the components are extracted from the correlation matrix (Everitt and
Dunn 2001) were used when choosing the number of components. An attempt is made to interpret
each principal component from factor weights over 0.5 in absolute values, or less if deemed
necessary.
Table 4.2.1 summarizes the result of principal components analysis. Five principal components
were extracted from the original crop-livestock portfolio variables, and explain 71.19% of the
total variations of the data. Each of the five principal components are interpreted as follows:-.
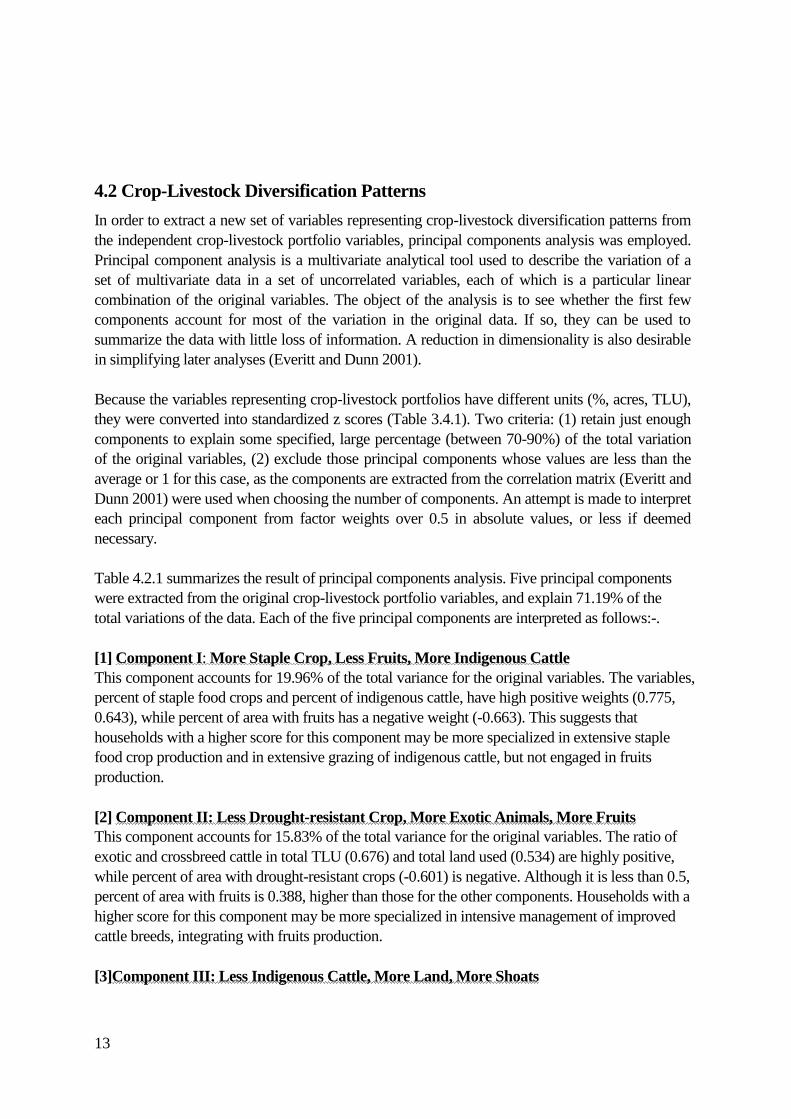
[1] Component I: More Staple Crop, Less Fruits, More Indigenous Cattle
This component accounts for 19.96% of the total variance for the original variables. The variables,
percent of staple food crops and percent of indigenous cattle, have high positive weights (0.775,
0.643), while percent of area with fruits has a negative weight (-0.663). This suggests that
households with a higher score for this component may be more specialized in extensive staple
food crop production and in extensive grazing of indigenous cattle, but not engaged in fruits
production.
[2] Component II: Less Drought-resistant Crop, More Exotic Animals, More Fruits
This component accounts for 15.83% of the total variance for the original variables. The ratio of
exotic and crossbreed cattle in total TLU (0.676) and total land used (0.534) are highly positive,
while percent of area with drought-resistant crops (-0.601) is negative. Although it is less than 0.5,
percent of area with fruits is 0.388, higher than those for the other components. Households with a
higher score for this component may be more specialized in intensive management of improved
cattle breeds, integrating with fruits production.
[3]Component III: Less Indigenous Cattle, More Land, More Shoats

14
This component accounts for 13.52% of the total variance for the original variables. The ratio of
indigenous cattle in TLU is negative (-0.643), while total land used is positive (0.491). The ratio
of shoats in TLU is 0.477, while the ratio of area with fruit is negative (-0.450). This implies that
households with a higher score for this component may diversify their livelihoods into more
cultivation and into grazing of sheep/goats, but not necessarily in integrated ways, while not
owning indigenous cattle.
[4]Principal Component IV: Less Shoats, More Drought-resistant Crop
This component accounts for 11.24% of the total variance for the original variables. The ratio of
sheep / goats in total TLU and total TLU are negative (-0.615, -0.390). The ratio of
drought-resistant crop is positive (0.542) while that of area with commercial crop is moderately
positive (0.361). Higher scores for this component suggest that households have few sheep and
goats and are engaged more in drought-resistant crop cultivation.
[5]Principal Component V: More Dairy Goats
This component accounts for 10.64% of the total variance for the original variables. The ratio of
dairy goats in total TLU is highly positive (0.915). Households with a higher score for this
component are more likely to adopt dairy goats.
Table 4.2.1: Crop-Livestock Diversification Patterns: Principal Component Analysis
I II III IV V
staple crop exotic/crossbreed staple crop
less fruits cattle, fruits, less cattle drought-resistant
indigenous cattls more land more shoats crop, less shoats dairy goats
Z-scores
% area with drought-resistant crop -0.028 -0.601 0.082 0.542 -0.264
% area with staple crop 0.775 0.124 0.420 -0.030 0.157
% area with fruits -0.663 0.388 -0.450 -0.271 0.080
% area with commercial crop -0.145 0.249 0.151 0.361 -0.216
total land used (acres) 0.151 0.534 0.491 0.003 -0.113
% of exotic, crossbreed cattle -0.326 0.676 0.213 0.271 -0.095
% of dairy goats -0.003 -0.019 0.103 0.144 0.915
% of indigenous cattle 0.643 0.075 -0.643 0.030 -0.061
% of sheep and goats -0.312 -0.424 0.477 -0.615 -0.103
total livestock unit (TLU) 0.543 0.258 -0.076 -0.390 -0.205
Total 2.00 1.58 1.35 1.12 1.06
% of Variance 19.96 15.83 13.52 11.24 10.64
Cumulative % 19.96 35.80 49.31 60.55 71.19
Component
4.3 Implications on Welfare

15
The determinants of total gross income, total gross crop income, and total gross livestock income
are estimated here. Total gross income includes total off-farm income (regular, casual, remittance),
total gross crop income (for drought-resistant, staple food crops, fruits and commercial crops,
revenue (KES), not excluding labour and inputs costs), and total gross livestock income (for
traditional and exotic animals, revenue (KES) from milk and from selling animals, not excluding
labour and medical/ veterinary costs). The independent variables representing household
characteristics to indicate capital asset endowments [such as labour, knowledge] (age, gender
dummy, education year of the head, participation years in farmers group, minute distance to a
local training center [AIC], and Adult Equivalent [family labour]), off-farm income dummies
(regular, casual, remittance), along with the factor scores for the five principal components are
included. Because the five principal component scores are uncorrelated, they can be included
without worrying about multi-co linearity, which might happen if the variables representing
crop-livestock portfolios independently were included.
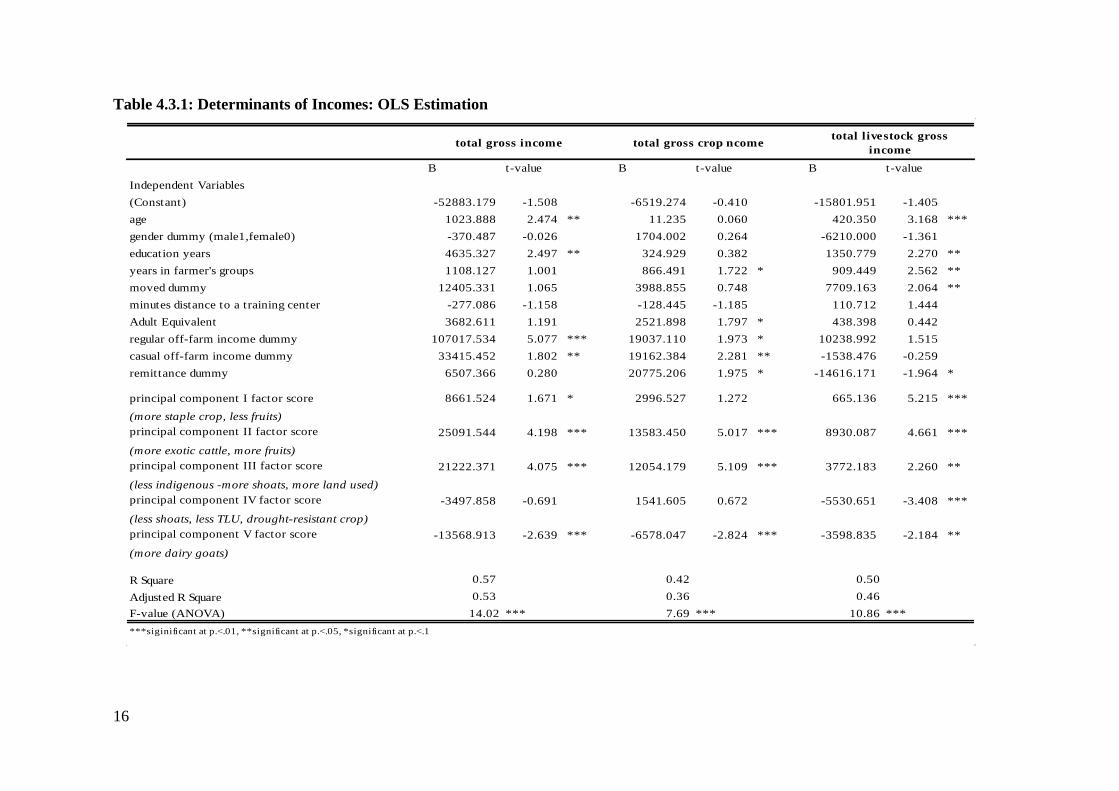
The results are shown in Table 4.3.1. The selected independent variables explain the variances in
the total gross income (53%), total gross crop income (36%), and total gross livestock income
(46%). Among the household variables, age and education years are significantly positive with
total gross income and livestock income. This suggests that more experienced and educated
people get higher total and livestock incomes. Years in participating in activities of a farmers
group is positive for total gross crop income and total gross livestock income. It probably means
that exposure to knowledge through participating in activities of a farmers‟ group is more likely to
contribute to earning higher livestock incomes. Moved dummy is positive on total gross livestock
income. The effect of having stayed outside the areas (mostly in the highlands or the neighbouring
districts) is less straightforward to interpret. One possible explanation is that those owning many
animals but having stayed in areas where land was getting scarce decided to move to settle in the
Kerio River Basin in search for grazing areas. Labour by adults resulted to positive total gross
income, suggesting more labour ability contributes to intensive engagement in agricultural activity
by households.
Among the off-farm income dummies, regular off-farm and casual income dummies positively
affect the total gross income and total gross crop income levels. Off-farm income accounts for
50% of the total gross income and higher income casual and crop income are more important for
lower income groups (Iiyama, 2006), because they do not keep enough livestock. Remittance
dummy is positive on total gross crop income but negative on total gross livestock income though
at 10% significance level, which is difficult to interpret at this stage of the analyses.
Among the principal component score variables, component I (more staple crop and indigenous
cattle, less fruits) is significantly positive for total gross income and total gross livestock income,
but not on total gross crop income. Component II (more exotic cattle, less shoats, more fruits)
score is significantly positive at 1% for all the total gross income, total gross crop income, and
total gross livestock income. Component II contributes to livestock income through exotic
animals and crop income, probably through better integration, in comparison to component I with
staple food crops and indigenous animals.
16
Table 4.3.1: Determinants of Incomes: OLS Estimation
B t-value B t-value B t-value
Independent Variables
(Constant) -52883.179 -1.508 -6519.274 -0.410 -15801.951 -1.405
age 1023.888 2.474 ** 11.235 0.060 420.350 3.168 ***
gender dummy (male1,female0) -370.487 -0.026 1704.002 0.264 -6210.000 -1.361
education years 4635.327 2.497 ** 324.929 0.382 1350.779 2.270 **
years in farmer's groups 1108.127 1.001 866.491 1.722 * 909.449 2.562 **
moved dummy 12405.331 1.065 3988.855 0.748 7709.163 2.064 **
minutes distance to a training center -277.086 -1.158 -128.445 -1.185 110.712 1.444
Adult Equivalent 3682.611 1.191 2521.898 1.797 * 438.398 0.442
regular off-farm income dummy 107017.534 5.077 *** 19037.110 1.973 * 10238.992 1.515
casual off-farm income dummy 33415.452 1.802 ** 19162.384 2.281 ** -1538.476 -0.259
remittance dummy 6507.366 0.280 20775.206 1.975 * -14616.171 -1.964 *
principal component I factor score 8661.524 1.671 * 2996.527 1.272 665.136 5.215 ***
(more staple crop, less fruits)
principal component II factor score 25091.544 4.198 *** 13583.450 5.017 *** 8930.087 4.661 ***
(more exotic cattle, more fruits)
principal component III factor score 21222.371 4.075 *** 12054.179 5.109 *** 3772.183 2.260 **
(less indigenous -more shoats, more land used)
principal component IV factor score -3497.858 -0.691 1541.605 0.672 -5530.651 -3.408 ***
(less shoats, less TLU, drought-resistant crop)
principal component V factor score -13568.913 -2.639 *** -6578.047 -2.824 *** -3598.835 -2.184 **
(more dairy goats)
R Square 0.57 0.42 0.50
Adjusted R Square 0.53 0.36 0.46
F-value (ANOVA) 14.02 *** 7.69 *** 10.86 ***
total gross income total gross crop ncometotal livestock gross
income
***siginificant at p.<.01, **significant at p.<.05, *significant at p.<.1

17
Component III (less indigenous cattle, but more land used with more sheep and goats) is positive
for crop and livestock income. Component IV (less shoats and less TLU) is significantly
negative on total gross livestock income. It is likely that they own fewer animals. Component V
(dairy goats) is significantly negative for all the total gross income, total gross crop income, and
total gross livestock income. This may be because goats are more likely to be adapted by low
income groups rather than their decreasing low incomes.
Overall, along with household / homestead specific variables and with off-farm income dummies,
crop-livestock diversification patterns seem to significantly affect income levels or welfare status
of households. Principal Components II and III significantly increase total crop and livestock
income levels, while Component I increases total and livestock income.
4.4 Implications on Environment
As indicated in Section 2, fencing and manure application are indirect indicators of crop-livestock
intensification in Kerio River Basin. Fenced plots are mainly used for intensive farming and rarely
for extensive grazing. The use of manure in live fences has made the Valley greener, increased
the number of trees and improves soil fertility (Iiyama 2006). However, it is virtually impossible
to measure changes in greenness at the household levels because the study area is too small to be
applied by high-resolution GIS data (NDVI).
Environmental implications of certain crop-livestock diversification were evaluated by assessing
their associations with fencing and manure use (ex. Clay et al., 2002; Tarawali et al., 2002). The
two types of fences (barbed wire and live-fence [planting thorn trees and bushes]), and application
of manure are used as indirect indicators.
Of the 177 households in Rokocho 44% have more than one plot fenced with barbed wire while
18% have more than one plot fenced with live-fences. Manure from own animals or from
neighbours was used by 46% of the households. A logistic regressions analysis was carried out
on fencing and manure (ex. Freeman and Coe, 2002; Place et al., 2002; Stall et al., .2002). The
independent variables (household/homestead characteristic variables, off-farm income dummies,
and principal component factor scores) are the same as previous analyses of OLS estimations on
determinants of incomes. The estimates are correct in predicting measures by 78.5% for barbed
wire fencing, 81.35% for live fencing and 84.7% for manure use.
For barbed wire, age, education years of the household head, and Components II (exotic animals
and fruits) and IV (less sheep and goats) are significantly positive, while casual off-farm dummy
and Component I (staple food crops, indigenous cattle, less fruits) are negative. This suggests that
households with old and educated household heads owning few indigenous animals and engaged
in fruit and exotic animal production more are likely to fence their plots with barbed wires than
those engaged in staple food crops with indigenous cattle.

18
Table 4.4.1: Determinants of Undertaking Fencing and Manure
B Exp(B) B Exp(B) B Exp(B)
households adopting 78 32 81
0.44 0.18 0.46
age 0.046 1.047 ** -0.034 0.967 0.009 1.009
gender dummy (male1,female0) 0.209 1.233 1.472 4.358 * 0.008 1.008
education years 0.235 1.264 *** -0.094 0.910 0.069 1.072
years in farmer's groups 0.049 1.051 -0.004 0.996 0.021 1.022
moved dummy 0.419 1.520 -0.849 0.428 0.420 1.522
minutes distance to a training center -0.021 0.979 -0.014 0.987 0.000 1.000
Adult Equivalent 0.022 1.022 0.062 1.064 0.393 1.481 ***
regular off-farm income dummy -0.737 0.479 -0.378 0.686 1.857 6.402 *
casual off-farm income dummy -2.143 0.117 *** 0.297 1.345 1.634 5.125
remittance dummy -0.717 0.488 0.688 1.989 1.472 4.357
principal component I factor score -0.853 0.426 *** -0.012 0.988 -1.035 0.355 ***
(more staple crop, less fruits)
principal component II factor score 0.738 2.092 ** 0.140 1.151 1.779 5.925 ***
(more exotic cattle, more fruits)
principal component III factor score -0.067 0.935 -0.555 0.574 ** -0.360 0.698
(less indigenous -more shoats, more land used)
principal component IV factor score 0.279 1.321 ** 0.334 1.397 -0.239 0.788
(less shoats, less TLU, drought-resistant crop)
principal component V factor score 0.123 1.131 -0.177 0.838 0.050 1.051
(more dairy goats)
Constant -2.366 0.094 -0.575 0.563 -4.147 0.016 **
Model Summary
-2 Log likelihood 151.055 142.793 133.804
Cox & Snell R Square 0.40 0.13 0.46
Nagelkerke R Square 0.54 0.21 0.62
Prediction
correct 0 83.84 97.24 86.46
correct 1 71.79 9.38 82.72
overall prediction 78.53 81.36 84.75
Barbed Wire Fence Live Fence Manure
***siginificant at p.<.01, **significant at p.<.05, *significant at p.<.1

For live-fence, gender dummy is significantly positive, while Component III (less indigenous cattle,
more shoats, more land) is negative. This implies that male-headed households are more likely to
fence their plots with thorn trees than those with less indigenous cattle but with more sheep and goats.
While households with a higher score for Component III own some exotic and crossbreed cattle than
indigenous cattle, they have little desire to fence their plots, probably because of being engaged in
staple food crops production, but rarely in horticulture
For manure, Adult Equivalent, regular off-farm income dummy, and Component II (more exotic
animals, more fruits) are significantly positive, while Component I (more staple crop and indigenous
cattle) is negative. Households with a higher score for Component II that tend to plant fruits on their
homestead plots with live-fence, and keep exotic and crossbreed cattle that are more likely to be
managed with zero/semi-zero grazing in enclosed homestead plots. Therefore, it is easier for
households to collect and apply manure on fruits from within the homesteads. In contrast,
households with a higher score for Component I rarely use manure on staple food crops, despite
owning many indigenous cattle. Indigenous cattle are more likely to be extensively grazed on open
areas, therefore their manure is difficult to collect.
In summary, Component II are associated with better resource management through better
crop-livestock integration which could have favourable environmental implications. However, while
components I and III enhance diversification into staple food crops with indigenous animals, they do
not seem to integrate their crop-livestock activities to improve the environment, at least by their low
use of manure and fencing. Both components I and III devote more land to staple crops and less to
fruits. Fruits cannot independently contribute to income without animals. On the other hand, the
combination of exotic animals with staple crops may be economically a high-return pathway, but has
little incentives for households to integrate them which might ultimately lead to better environment
management.
5. DISCUSSIONS AND CONCLUSIONS
After reviewing the crop-livestock activities separately and independent activities, an integrated
perspective was used to evaluate implications of crop-livestock diversification patterns or
intensification/integration pathways on welfare and environment. It gave us better insights on
crop-livestock evolution processes in the study area.
First, fruits are often associated with intensive management of more exotic animals and more manure
use. This combination has an inherent management incentive for mutual intensification. Fruits are
more likely to be planted on fenced homestead plots. Exotic animals are semi zero-grazed within

20
own plots because they have high economic values, therefore their dung is easily available for
applying to fruits. This combination of exotic animals and horticulture can be interpreted as an
integrative crop-livestock intensification pathway, It improves the welfare of the community and is
environmentally sustainable. Yet, so far, the quantity of manure application to fruits is too low while
few inorganic fertilizers are used. For example, animal manure production by zero-grazed cattle in
Kenya is 1-1.5 t per animal (Strobel, 1987 cited in Bationo et al., 2004). Use of manure should be
encouraged for sustainable horticulture.
Second, the pathways of staple food crops with indigenous cattle or shoats have high economic
returns, but do have few incentives to integrate their activities for potentially good environmental
impacts. Many households say they do not apply manure because the plots are often far away from
the homesteads. Traditional animals are extensively grazed on open areas because they have low
outputs, including little manure. Because staple food crops is both a source of income and for food
security, it is not recommend to shift to horticulture, before assessing profitability of horticulture
against that of food crops. Therefore, it is essential to sensitize households to integrate crop-livestock
activities for better manure management.
Economic gains from fruit trees can be achieved after some years because fruit trees do not start
bearing soon after planting. It may also take some time and expertise for farmers to integrate them
to livestock. Introduction of improved breeds may be faced with various constraints (Conelly 1998).
Dairy goat pathway is associated with lower incomes, while they have potentially better economic
returns than indigenous cattle and shoats. It is possible that lower income groups can incorporate
dairy goats relatively easily than exotic-crossbreed cattle. The selection of crop and livestock
activities may need to be compatible with household needs on food security/income and their initial
management capacity. A recommendation is to integrate crop-livestock activities through
sensitization. Sustainable crop-livestock livelihoods evolution can be successful only if come with
appropriate support on technology transfer and environmental education.
21
6. REFERENCES
Ashley S. and Nanyeenya W. (2005). „More than Income: Pro-Poor Livestock Development Policy‟, in Ellis and
Freeman (eds.), Rural Livelihoods and Poverty Reduction Policies. London and New York: Routledge.
pp.235-355.
Barrett C.B., Place F. and Aboud A.A. (2002). Natural Resources Management in African Agriculture:
Understanding and Improving Current Practices. Oxon and New York: CABI Publishing.
Bationo A., Nandwa S.M., Kimetu J.M., Kinyangi J.M., Bado B.V., Lompo F., Kimani S., Kihanda F. and Koala
S. (2004). „Sustainable Interaction of Crop-Livestock Systems through Manure Management in Eastern
and Western Africa: Lessons Learned and Emerging Research Opportunities‟, in Williams (eds.),
Sustainable Crop-Livestock Production for Improved Livelihoods and Natural Resource Management in
West Africa. Nairobi: International Livestock Research Institute. pp.173-198.
Bourn D. and Wint W. (1994). Livestock, Land Use and Agricultural Intensification in Sub-Saharan Africa.
Pastoral Development Network Working Paper 37a. Overseas Development Institute, London, UK.
Clay D.C., Kelly V., Mpyisi E. and Reardon T. (2002). „Input Use and Conservation Investments among Farm
Households in Rwanda: Patterns and Determinants‟, in Barrett, Place and Aboud (eds.), Natural
Resources Management in African Agriculture: Understanding and Improving Current Practices. Oxon
and New York: CABI Publishing. pp. 103-114.
Conelly W.T. (1998). „Colonial Era Livestock Development Policy: Introduction of Improved Dairy Cattle in
High-Potential Farming Areas of Kenya‟. World Development. 26 (9), 1733-1748.
Everitt B.S. and Dunn G. (2001). Applied Multivariate Data Analysis: Second Edition. London: Arnold.
Freeman A.H. and Coe R. (2002). „Smallholder Farmers‟ Use of Integrated Nutrient-Management Strategies:
Patterns and Possibilities in Machakos District of Eastern Kenya‟, in Barrett, Place and Aboud (eds.),
Natural Resources Management in African Agriculture: Understanding and Improving Current Practices.
Oxon and New York: CABI Publishing. pp. 143-154.
Freeman A. H. and Ellis F. (2005). „Implications of Livelihood Strategies for Agricultural Research: A Kenya
Case Study‟, in Ellis and Freeman (eds.), Rural Livelihoods and Poverty Reduction Policies. London
and New York: Routledge. pp. 198-212.
Iiyama M. (2006). Livelihoods Diversification Patterns among Households and their Implications on Poverty and
Resource Use: A Case Study from Kerio River Basin Community. LUCID Project Working Paper 51;
Nairobi, Kenya: International Livestock Research Institute.
Kristjanson P.M. and Thorton P.K. (2004). „Methodological Challenges in Evaluating Impact of Crop-Livestock
Interventions‟, in Williams (eds.), Sustainable Crop-Livestock Production for Improved Livelihoods and
Natural Resource Management in West Africa. Nairobi: International Livestock Research Institute. pp.
160-172.
Mizutani F., Kariuki P.C., Iiyama M., Matsumoto K., Kariuki P.N., Kiprono M., Cherwon K. and Kristjanson P.
(2005). Kerio Valley Baseline Survey: Advancing Capacity of the Community through the Baseline
Survey for Sustainable Rural Development in Marakwet and Keiyo Districts. Nairobi: International
Livestock Research Institute in collaboration with Japan International Cooperation Agency.
Muchemi J., Mwangi W. and Greijn H. (2002). „Participatory Land Use Planning towards Community- based
Natural Resource management in the Districts of Keiyo and Marakwet, Kenya: A GIS and Remote
Sensing Approach‟, mimeo. http://www.ermisafrica.org/doc/kmplup.pdf.
Olson J.M., Misana S., Campbell D.J., Mbonile M. and Mugisha S. (2004). The Spatial Patterns and
Root Causes of Land Use Change in East Africa. Land Use Change Impacts and Dynamics (LUCID)
Project Working Paper 47; Nairobi, Kenya: International Livestock Research Institute.
Place F., Franzel S., De Wolf J., Rommelse R., Kwesiga F., Niang A. and Jama B. (2002). „Agroforestry for
Soil-Fertility Replenishment: Evidence on Adoption Processes in Kenya and Zambia‟, in Barrett et al.
(eds.), Natural Resources Management in African Agriculture: Understanding and Improving Current Practices. Oxon and New York: CABI Publishing.. pp. 155-168.

22
Reardon T. and Vosti S.A. (1995). „Links between Rural Poverty and the Environment in Developing Countries:
Asset Categories and Investment Poverty‟. World Development. 23 (9), 1495-1506.
SARDEP. (2002) SARDEP Keiyo/Marakwet, Participatory Land Use Plans for Community-based Natural
Resource Management, Transect E. Iten: The Semi-Arid Development Programme.
Stall S.J., Baltenweck I., Waithaka M.M., de Wolff T. and Njoroge L. (2002). „Location and Uptake: Integrated
Household and GIS Analysis of Technology Adoption and Land Use, with Application to Smallholder
Dairy Farms in Kenya‟. Agricultural Economics. 27, 295-315.
Tarawali G. Douthwaite B. de Haan N.C. and Tarawali S.A. (2002). „Farmers as Co-Developers and Adopters of
Green-Manure Cover Crops in West and Central Africa.‟ in Barrett, Place and Aboud (eds.), Natural
Resources Management in African Agriculture: Understanding and Improving Current Practices. Oxon
and New York: CABI Publishing. pp. 65-76.
Tittonell P., Vanlauwe B., Leffelaar P.A., Rowe E.C. and Giller K.E. (2005). „Exploring Diversity in Soil Fertility
Management of Smallholder Farms in Western Kenya I. Heterogeneity at Region and Farm Scale‟.
Agriculture, Ecosystems and Environment. 110, 149-165.
Van Kuelen H. and Schiere H. (2004). „Crop-Livestock Systems: Old Wine in New Bottles?‟, Proceedings of the
4th International Crop Science Congress. 26 Sep-1 Oct 2004, Brisbane, Australia.
WilliamsTO., Hiernaux P. and Fernández-Rivera S. (1999). „Crop-Livestock Systems in Sub-Saharan Africa:
Determinants and Intensification Pathways‟, in McCarthy N., Swallow B., Kirk M. and Hazell P. (eds.),
Property Rights, Risk and Livestock Development in Africa. Washington D.C.:IFPRI , Nairobi: ILRI.
pp. 132-151.
Williams T.O., Tarawali S., Hiernaux P. and Fernández-Rivera S. eds. (2004). Sustainable Crop-Livestock
Production for Improved Livelihoods and Natural Resource Management in West Africa. Nairobi:
International Livestock Research Institute.