Embed Size (px)
Citation preview
Implications of Accounting Standard Changes for Financial
Reports: An Exploratory Study of the Transition to IFRS 16
GM1460 Master Degree Project Spring 2020
Master of Science in Accounting and Financial Management
Graduate School
Authors Victoria Quach and Lisa Tu
Supervisor
Mikael Cäker
2
Acknowledgements Firstly, we would like to take this opportunity to show our utmost gratitude towards our
supervisor Mikael Cäker from the School of Business, Economics and Law at the University
of Gothenburg who guided us throughout the whole thesis writing process. We are also very
thankful towards all participants of the seminars who provided us with valuable feedback that
improved our paper.
Last but not least, we would also like to thank our supervisor Johan Ekdahl at Volvo Cars
Corporation who gave us many ideas of research topics regarding IFRS 16 and for having
several meetings with us, which enhanced our understanding of the new leasing standard from
a corporate perspective.
Gothenburg, June 2020
Victoria Quach and Lisa Tu
3
Abstract
Lease accounting has for a long time been a highly controversial topic due to the way
operating leases are treated in the financial reporting. IFRS 16 is a new accounting standard
for leases that aims to increase transparency by requiring the majority of all leases to be
recognized on the balance sheet. However, within research, there is a lack of knowledge
regarding how new financial reporting requirements, such as IFRS 16, might influence
disclosure quality during the transition period. Hence, we attempt to fill in this gap by
investigating the following research question, ―How is the transition to IFRS 16, as disclosed
in financial reports of companies in the consumer industry, influencing the preconditions for
financial statement analysis?‖ In total, 17 companies are studied by analysing their financial
reports. In particular, we look at how the effects of IFRS 16 are disclosed and how the
disclosure varies between companies. To conclude, it was found that the preconditions for
conducting financial statement analysis at the transition to IFRS 16 could be distorted by
several factors. For instance, we noted that there were variations in the scope of disclosure
about the effect of IFRS 16 on financial metrics, targets and internal initiatives. This reduces
the comparability and transparency in the short run. Hence, we encourage stakeholders and
standard setters to pay attention to the accounting quality of the reports during
implementations of new accounting standards.
Key words: IFRS 16, leasing, operating leases, financial statement analysis, accounting
standard, accounting quality, disclosure
4
Table of contents Acknowledgements ................................................................................................................................. 2
Abstract ................................................................................................................................................... 3
List of definitions .................................................................................................................................... 6
1. Introduction ......................................................................................................................................... 7
1.1 Background ................................................................................................................................... 8
1.2 Problem discussion ........................................................................................................................ 8
1.3 Purpose of the paper .................................................................................................................... 10
1.4 Disposition................................................................................................................................... 10
2. Theoretical framework ...................................................................................................................... 10
2.1 The theory of asymmetric information ........................................................................................ 10
2.1.1 Information asymmetry when implementing new standards ................................................ 11
2.2 Incentives for disclosure .............................................................................................................. 12
2.2.1 Disclosure choices in the transition to new standards .......................................................... 13
2.3 IFRS 16 Leases ............................................................................................................................ 14
2.3.1 Transition options for IFRS 16 ............................................................................................. 14
2.3.2 The qualitative characteristics of IFRS 16 ........................................................................... 15
2.3.3 Alternative Performance Measures and changes due to capitalising leases ......................... 16
2.3.4 Effects of capitalising leases on company valuation and bonus systems ............................. 17
3. Method .............................................................................................................................................. 19
3.1 Selection of companies ................................................................................................................ 19
3.2 Material collection ....................................................................................................................... 20
3.3 Analysis of data ........................................................................................................................... 20
3.4 Limitations................................................................................................................................... 21
4. Empirical findings ............................................................................................................................. 21
4.1 IFRS 16 effect on total balance ................................................................................................... 21
Table 1 ........................................................................................................................................... 22
4.2 Disclosure of effects on financial metrics ................................................................................... 23
Table 2 ........................................................................................................................................... 24
Figure 1.......................................................................................................................................... 27
4.3 Initiatives made in response to IFRS 16 ...................................................................................... 28
4.3.1 Revising financial targets ..................................................................................................... 28
Table 3 ........................................................................................................................................... 30
4.3.2 Bonus programmes ............................................................................................................... 30
4.4 Historical profitability and leverage at the companies ................................................................ 31
Table 4 ........................................................................................................................................... 32
5
5. Analysis ............................................................................................................................................. 33
5.1 Effect of IFRS 16 on financial metrics ........................................................................................ 33
5.2 Restatements and disclosure choices about financial measures .................................................. 34
5.2.1 The influence of IFRS 16 effect, corporate governance, profitability and leverage on
disclosure ....................................................................................................................................... 35
5.2.2 Disclosure choices and the implications for accounting quality and financial statement
analysis .......................................................................................................................................... 37
5.3 IFRS 16 influence on internal processes ..................................................................................... 39
5.4 Influence of IFRS 16 on performance evaluation ....................................................................... 39
6. Discussion ......................................................................................................................................... 40
7. Conclusion ......................................................................................................................................... 42
References ............................................................................................................................................. 45
Appendix A ........................................................................................................................................... 53
6
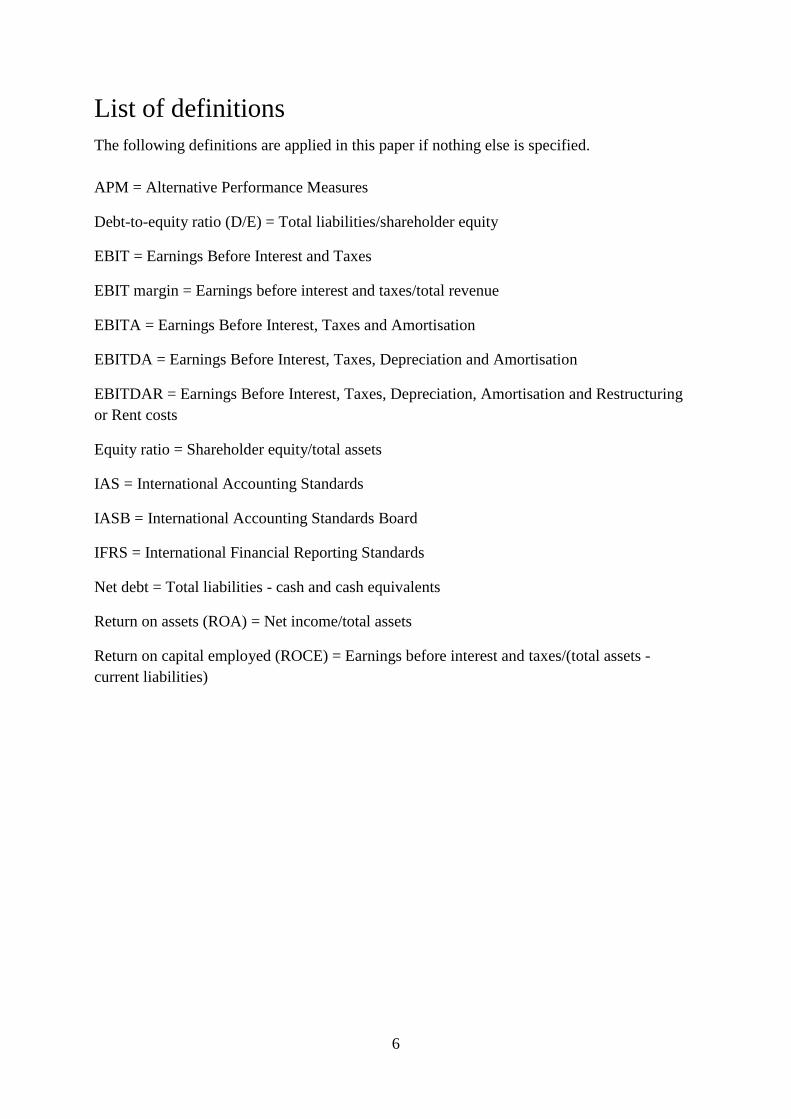
List of definitions The following definitions are applied in this paper if nothing else is specified.
APM = Alternative Performance Measures
Debt-to-equity ratio (D/E) = Total liabilities/shareholder equity
EBIT = Earnings Before Interest and Taxes
EBIT margin = Earnings before interest and taxes/total revenue
EBITA = Earnings Before Interest, Taxes and Amortisation
EBITDA = Earnings Before Interest, Taxes, Depreciation and Amortisation
EBITDAR = Earnings Before Interest, Taxes, Depreciation, Amortisation and Restructuring
or Rent costs
Equity ratio = Shareholder equity/total assets
IAS = International Accounting Standards
IASB = International Accounting Standards Board
IFRS = International Financial Reporting Standards
Net debt = Total liabilities - cash and cash equivalents
Return on assets (ROA) = Net income/total assets
Return on capital employed (ROCE) = Earnings before interest and taxes/(total assets -
current liabilities)
7
1. Introduction
Leasing is a practice that has been used by businesses for many centuries and it is widely
applied since it can serve as a convenient way for funding assets (Morales-Díaz & Zamora-
Ramírez, 2018). The use of operating leases has increased substantially over the past decades
(Cornaggia, Franzen & Simin, 2013) and companies can now lease essentially all types of
assets, including laptops, machinery and real estate (Morales-Díaz & Zamora-Ramírez, 2018).
However, the historical treatment of operating leases in the accounting has received much
criticism from academics, practitioners and users of financial reports because it allowed
companies to take advantage of a highly controversial accounting practice, known as off-
balance sheet financing (Morales-Díaz & Zamora-Ramírez, 2018). Recently, the International
Accounting Standards Board (IASB) issued a new accounting standard called IFRS 16
Leases. This standard came into effect in 1 January 2019 and can be considered as a project
made in response to a perceived lack of transparency about firms‘ lease obligations (IFRS
Foundation, 2016a). The old accounting standard for leases, IAS 17 Leases, distinguished
between finance leases and operating leases, but only finance leases had to be recognised as
assets and liabilities on the balance sheet (Magli, Nobolo & Ogliari, 2018). Consequently,
before the implementation of IFRS 16, a substantial amount of lease obligations did not
appear on the financial statements. The US Securities and Exchange Commission (2005)
estimated that there was a worth of nearly 1.25 trillion dollars off-balance sheet lease
obligations among US firms. The lack of information about companies‘ leases resulted in that
it could be difficult to make proper cross company analysis without adjusting for leases, as
numbers on the financial statements could differ substantially depending on whether assets
are leased or bought (IFRS Foundation, 2016a). Several authors (e.g., Elam, 1975; Wilkins &
Zimmer, 1983; Breton & Taffler, 1995) suggested that off-balance sheet lease obligations
might have a distorting effect on fundamental analysis. In order to facilitate valuation, IFRS
16 aims to ensure that all material information about leases is disclosed in the financial
statements, which is done by having companies capitalising their leases. Both lessors and
lessees need to account for lease contracts in the disclosures. However, since IFRS 16
essentially continues with the lessor accounting requirements found in the previous lease
accounting standard, IAS 17, the most notable changes will be for lessees (IFRS Foundation,
2019). The focus in this report will thus be on the lessee‘s accounting and how their financial
statements are affected.
The new leasing standard causes significant changes in the accounting and is expected to have
considerable economic consequences (Pardo & Giner, 2018). In the course of the period that
IFRS 16 is implemented, many financial metrics will be altered. In the disclosure, firms have
to decide whether they want to present the effect on the metrics, which could be done by
recalculating the numbers. In this paper, recalculations and restatements will be used to refer
to calculations that are based on a standard other than the valid standard the year the financial
numbers represent. For 2019 numbers, recalculations would then refer to metrics without
IFRS 16 effect (recalculated to be in accordance with IAS 17). While for years prior to IFRS
16 implementation, i.e., 2018 and backwards, recalculations would mean calculating numbers
with IFRS 16 effect. Exploring how information about the effects of IFRS 16 is presented in
8
financial reports is highly relevant in order to understand the implications for accounting
quality and the preconditions for making financial statement analysis. Because this year is the
first time IFRS 16 is applied, it is a good opportunity to examine how the financial position
and performance of lease intensive firms are affected by the accounting changes and how
these changes are disclosed at the transition.
1.1 Background
A large amount of shares are traded on a daily basis at the stock markets, and for the people
who make these transactions it is of utmost importance to know what the fair price is
(Penman, 2013). Since buying stocks means investing in the business of the firm, it is
necessary for investors to have a good understanding of how the business creates value and
generates returns. To enable valuation of firms, the business must be translated into numbers,
and this is done by financial statements as they translate the economics of firms into
accounting numbers. In order to understand the story behind the figures and make informed
decisions, analysing financial statements is therefore necessary (Penman, 2013; Revsine,
Soffer, Johnson, Collis & Mittelstaedt, 2017). When assessing how much the business is
worth, it is only the activities that actually create value that is relevant (Penman, 2013).
Increases or decreases in performance due to accounting standard effects do not create value,
and those effects should not be paid for. Therefore, in order to make correct company
valuation, it is important to understand which activities are value generating and which are
not.
According to the conceptual framework by IASB, the ultimate purpose of financial reporting
is to provide useful information to investors and creditors for decision-making (IFRS
Foundation, 2018). While investors use the information disclosed in financial statements to
make evaluation of firms and decide whether to invest, creditors use this information to
decide whether to provide capital (Penman, 2013). In addition to investors and creditors, there
are many other users of financial reports, including governments, regulators, employees,
senior managers and courts (Penman, 2013). They all need to understand financial statements
in order to set policies, control business activity, negotiate wage, evaluate the performance of
individuals and make assessments of damages in litigations. To aid them in those matters, it is
essential for each user to be able to understand the deficiencies of the financial statements,
what has been revealed and what has not. It is thus of value to increase the knowledge about
how accounting standard changes might affect the quality of financial reports.
1.2 Problem discussion
Financial accounting standards need to constantly change and adapt to different settings in
order to provide useful information for readers of financial reports (Runesson, 2015).
Although the change from IAS 17 to IFRS 16 aims to improve accounting quality and
facilitate analysis and valuation of companies, factors such as comparability might be affected
negatively during the transition period if financial numbers are not recalculated. Firms have
various choices to make when applying IFRS 16 in their financial reports and considerations
9
need to be made regarding what information to disclose. In addition to mandatory disclosures,
firms usually include loads of unregulated voluntary information in their financial reports and
substantial variations exist in how detailed reports are (Revsine et al., 2017). Some prefer to
disclose extensive information, while others only publish the most essential. A transition to a
new accounting standard could require companies to disclose more information than usual, as
it becomes important to separate between effects from operations and effects from changes in
reporting requirements. Since adopting a new accounting standard often results in that
financial measures are affected, analysis of financial reports could become more challenging.
If it is not clear how companies have calculated their numbers, and what accounting effects
there have been, it will be more difficult to evaluate performance and financial position.
Depending on how information is disclosed, the basis for investors to do correct estimations
varies. How companies manage disclosure about IFRS 16 could thus be expected to influence
the basis for performing adequate financial statement analysis. In order to understand how the
usefulness of financial reports is affected, we need to explore how information is disclosed in
the financial reports.
There are substantial amount of prior research investigating how different accounting
standards are expected to affect accounting quality in the long run, however, there is
considerably less knowledge regarding how accounting standards might affect the quality at
the transition. Hail, Leuz and Wysocki (2010) have looked into this matter to an extent as they
noted that when adopting IFRS, costs related to the transition occurs immediately and are
short-term while benefits in terms of comparability is obtained over a much longer period.
Other previous papers that have investigated accounting changes have mostly focused on
transition in accounting regimes, i.e. from local GAAP to IFRS (e.g., Sahut, Boulerne &
Teulon, 2011; Tan, Wang & Welker, 2011), rather than a specific accounting standard
change. Although there are many similarities between transition from national GAAP to
IFRS, and transition from a standard to another within IFRS, there are several differences as
well. For instance, first-time implementation of IFRS requires restatement of numbers for at
least one comparable year (Haller, Ernstberger & Froschhammer, 2009), whereas for the
transition to IFRS 16, recalculations of comparable numbers are not mandatory. Although
these papers regarding accounting regime transition provide useful insights, the differences
lead to that findings regarding accounting regime changes might not be applicable on changes
within a standard. Thus, more knowledge regarding these types of transitions is needed.
Moreover, much of the prior literature studies earnings quality in order to determine
accounting quality (e.g., Houqe, van Zijl, Dunstan, & Karim, 2012; Liu & Sun, 2015). In
contrast, our paper intends to have more focus on the disclosure choices firms make and the
restatements of information. Similar to Verriest, Gaeremynck and Thornton (2013), we look
at disclosure quality during transition and investigate how much information is provided in
financial reports, but we focus on a specific standard change rather than first-time IFRS
adoption. We believe that it is important to highlight and gain more knowledge about how
new accounting standards within IFRS are managed in financial reports, as IASB establish
new standards and amendments on a frequent basis. Accounting standards are continuously
updated and understanding of how it affects disclosure and accounting quality is needed.
10
1.3 Purpose of the paper
The purpose of the study is an exploratory one. By looking at how IFRS 16 has affected the
financial position and performance of firms in the consumer industry, we aim to improve the
understanding of how transitions to new accounting standards are managed. Moreover, since
IFRS 16 is a relatively new accounting standard, we also wish to contribute with suggestions
on future research that can benefit both academics and practitioners. When exploring how the
new lease accounting is implemented, we are particularly interested in how much and what is
disclosed. Companies within the consumer industry are of particular interest when
considering IFRS 16 as they tend to use leases more extensively. We strive to identify issues
related to the capitalisation of leases and the consequences for disclosure quality in order to
understand the magnitude of accounting standard change consequences. This in turn can lead
to interesting discoveries regarding why companies response similarly or differently to the
new accounting standard and by that, provide insights into how the preconditions for
analysing financial report information could be influenced. All this leads to the following
formulation of research question:
How is the transition to IFRS 16, as disclosed in financial reports of companies in the
consumer industry, influencing the preconditions for financial statement analysis?
1.4 Disposition
The paper is structured as follows: in the next section, a literature review on the theory of
asymmetric information together with a review on disclosure and IFRS 16 will be presented.
Under the method section, a thorough description of the methodology will be provided
including data collection, approach of the analysis, and the use and limitations of the chosen
method. In the fourth chapter, the empirical findings and accompanying tables regarding IFRS
16 disclosure will be presented, followed by an analysis of accounting quality in the fifth
chapter. In chapter six, a discussion about the ability of making own recalculations of metrics
from the perspective of stakeholders is made. In the final chapter, a conclusion will be
provided along with suggestions for future research.
2. Theoretical framework
2.1 The theory of asymmetric information
In order to understand the importance of adequate information disclosure and what role
financial reports have for stakeholders, it is of value to highlight the existence of information
asymmetry between companies and stakeholders. Information asymmetry exists between two
parties when one party has more information than the other (Akerlof, 1970). In his paper,
Akerlof (1970) describes an extreme asymmetric information scenario of a marketplace for
cars. Due to the asymmetric information, buyers of cars are unwilling to pay above the
average market price, which will drive out sellers of high quality cars while attracting sellers
11
of low quality cars. This further reduces the average market price for cars and in the most
extreme situation, it will eventually lead to market break down. In the case of financial
reporting, it is assumed that the preparers of financial reporting possess more information than
the users of financial reports (Runesson, Samani & Marton, 2018). Previously, it has been
revealed that firms tend to not disclose information that might be harmful for them if there is
no regulation (Runesson et al., 2018). Financial accounting only fulfills its purpose under the
assumption of incomplete information, because if there would be no information asymmetry,
financial accounting would not be needed (Fields, Lys & Vincent, 2001). In the presence of
information asymmetry, investors become less prone to invest because the value of the firm
cannot be assessed accurately (Runesson, 2015). This is because investors perceive an
information risk when the disclosures are insufficient (Runesson, 2015). A method that can
help with overcoming this problem is to increase disclosures (Welker, 1995; Healy, Hutton &
Palepu, 1999; Leuz & Verrecchia, 2000; Cormier, Ledous & Magnan, 2011; Bhattacharya,
Desai & Venkataraman, 2013). When information asymmetry is reduced, investors become
more active in making investments (Diamond & Verecchia, 1991; Kim & Verecchia, 1994).
The presence of information asymmetry could potentially explain why there are differences in
information provision, that is, why companies decide to disclose or disregard certain
information. It can be reasonable to assume that if possible, all firms strive to disclose as
much information as they can, considering that increase of disclosures facilitates investors in
distinguishing between good and bad firms (e.g., Welker, 1995). Any shortage of information
should then be due to the costs associated with collecting, providing and disseminating the
information. Included are also costs associated with the consequences of disclosing poor
performance. For instance, disclosing performance that is below what investors expect might
decrease the value of the stocks, which could be costly for the firm.
2.1.1 Information asymmetry when implementing new standards
In a study where IFRS adoption is examined, Wang and Welker (2011) established that
information asymmetry between firms and stakeholders increases in conjunction with the
transition. This is because the management in a firm possesses information about the effects
of the adoption before external stakeholders, as stakeholders receive the information first
when the financial reports are published. It was found that management seemingly exploits
this knowledge by adjusting their financing plans ahead of the change, as firms tend to
strategically time their equity issuance prior to the implementation of IFRS (Wang & Welker,
2011). The reason for this is that if the transition causes performance to appear worse,
management will have incentives to issue equity before the information is disclosed and in
that way exploit the relatively higher share price. Furthermore, Pope and McLeay (2011)
investigated management‘s discretion regarding information provision during IFRS transition.
Despite that first-time adoption of IFRS is regulated, it was found that changed recognitions
rules and measurements of ratios can result in that management obtain an opportunity to
manage financial numbers into showing better performance (Pope & McLeay, 2011).
Considering this, there is a probability that similar patterns might be found for IFRS 16
implementation. Since it can be expected that majority of firms are well aware of what effects
12
IFRS 16 can induce on the financial statements, firms could during the implementation
actively take actions that reduces effects they do not want to be made public.
Manipulation of accounting numbers is detrimental to the quality of accounting. One example
of earnings management is known as ―the big bath hypothesis‖, which usually is associated
with manager change. A new manager might be tempted to save earnings for the future by
recognising as much expenses as possible for the current year and blame the poor
performance on the previous manager (Runesson et al., 2018). It is not impossible that
changes in accounting standards might lead to similar results. Managers could, as an example,
increase the borrowings and blame the change in gearing ratio on IFRS 16. Another example
of how asymmetric information can be problematic is when the manager‘s compensation is
based on accounting numbers (Runesson et al., 2018). Since IFRS 16 alters financial metrics,
managers might engage in earnings management by for example using IFRS 16 as an excuse
to adjust targets to increase their chances of receiving rewards. Hence, apart from having a
good understanding of the implications of different accounting choices, stakeholders must
also understand the potential incentives managers could have (Revsine et al., 2017), and how
discretion over accounting might influence accounting quality during the transition to a new
accounting standard.
2.2 Incentives for disclosure
If there is no regulation for financial reporting, disclosure can only be justified if the benefits
of presenting the information are greater than the costs of supplying it (Revsine et al., 2017).
Hence, any differences found in the scope, timing and content of voluntary disclosure is due
to this consideration. Supplying information induce costs related to the collecting, processing
and disseminating of information. Sometimes, complicated calculations must be performed in
order to make accurate estimations, and more disclosure can also lead to increased audit costs.
Another aspect that must be considered when making cost-benefit analysis is that other
stakeholders, such as supplier and customers, can use the information to negotiate better
contracts (Revsine et al., 2017). For instance, Kim, Kraft and Ryan (2013) state that increased
comparability in financial statements results in that debt market participants better can assess
firms‘ credit risk. Although beneficial for creditors, it can be costly for companies. When
considering IFRS 16 in particular, more detailed information about leases could result in that
the true gearing ratio of firms is unfolded. Institutions such as banks and other creditors might
as a consequence require higher interest rates. However, the fact that firms commonly tend to
disclose more than required suggests that the benefits of providing information is believed to
outweigh the costs (Revsine et al., 2017). Karamanou and Nishiotis (2009) established that
there seems to be a positive relation between the amount of disclosure and firm value. In order
to attract investments, secure capital at low costs and be able to negotiate better contract terms
from supplier in a highly competitive market, firms are incentivised to release news that is
favorable for them (Revsine et al., 2017). Firms with good prospects wish to distinguish
themselves from bad firms by providing information to help stakeholders with the assessment
of risk and the estimation of future payoff. On the other hand, bad firms wish to disguise the
bad sides of them by reporting overly optimistic information (Revsine et al., 2017). However,
13
providing misleading information can damage the firms‘ reputation and lead to reduced
credibility, which might limit their ability to obtain capital.
2.2.1 Disclosure choices in the transition to new standards
Verriest et al. (2013) investigated companies‘ transition from local GAAP to IFRS and noted
that firms had a considerable amount of flexibility when deciding how much information they
wanted to disclose. In the study, disclosure and compliance choices that firms made at the
implementation of IFRS were examined and the quality of the disclosures were discussed. In
order to estimate disclosure quality and transparency of restatements, the authors looked at
companies‘ key value drivers, the numbers of years restated, the format of the restatements
and the relative importance of the restatements in the annual reports. Their results revealed
that the variation in disclosure and compliance when adopting IFRS were substantial among
firms. It was also established that although most firms were transparent about the restatement
process, the numbers of firms that restated information for multi-year comparisons were
rather low (Verriest et al., 2013). Additionally, it was found that companies with strong
corporate governance, including internal control mechanisms and risk management (Denis &
McConell, 2003; Gallery, Cooper and Sweeting, 2008), seemingly provided more transparent
information and had better disclosure quality (Verriest et al., 2013). In a similar manner,
Bishof (2009) found that when IFRS 7 Financial Instruments was adopted by firms, voluntary
disclosure that related to the standard increased in the annual reports for the transition year.
Gallery et al. (2008) investigated factors that affect the amount and the quality of disclosure
during IFRS adoption. In accordance with Verriest et al. (2013), they also noted a positive
relation between corporate governance and disclosure quality. In addition, they found that the
magnitude of the effects on financial measures, following a standard change, is a determinant
for the level of disclosure. In the study, the adoption of the Australian equivalent to IFRS
(AIFRS) was investigated. For the transition to AIFRS, it mainly had an effect on net income
and equity. It was established that a positive effect on these ratios due to transition should
result in that less disclosure is made, while a negative effect is followed by increased
disclosure (Gallery et al., 2008). Applying this on IFRS 16, disclosure regarding profitability
measures can be anticipated to be less than disclosure for leverage ratios, as IFRS Foundation
(2016a) states that profitability is expected to appear better while leverage appears worse.
In addition to the impact of accounting standards, it has been suggested that companies who
are profitable are more prone to have a higher amount of disclosure during transition (Palmer,
2005). Moreover, leverage is also an influencing factor, although, the role of leverage was
found to be less apparent. While firms that are highly leveraged could be incentivised to
extend their disclosures as a way to decrease monitoring costs, there is also a probability that
these firms might want to avoid public examining of their gearing levels (Palmer, 2005;
Gallery et al., 2008). Furthermore, in conjunction with complying with new requirements, it
might be unfolded for some firms that they have already violated terms in debt covenants
(Gallery et al., 2008). In those instances, it is difficult to predict how firms will react in their
disclosure choices (Gallery et al., 2008). Considering that IFRS 16 has an effect on both
14
profitability and leverage measures, it is possible that these factors can be determinants for
how disclosures are made in the adoption of IFRS 16.
2.3 IFRS 16 Leases
IFRS 16 determines the principles for recognition, measurement, presentation and disclosures
of leases (IFRS Foundation, 2019). The main objective of the standard is to ensure that
information about lease transactions are faithfully represented and that users of financial
statements can assess the amount, timing and uncertainty of cash flows arising from leases.
This means that lessees should, unless the lease is of low value, recognise assets and liabilities
for all leases that have a term of more than 12 months. As a result, essentially all leases now
have similar features as a purchase in the disclosures. The IFRS Foundation (2019) further
emphasises that it is the terms and conditions of contracts, together with all relevant facts and
circumstances, that should be considered when applying the standard. A contract contains a
lease if it conveys the right to control an asset for a period of time. The standard should be
applied consistently to all similar contracts.
The asset of a lease is representing the right-of-use value, while the liability represents the
obligation to make lease payments (IFRS Foundation, 2019). The right-of-use is measured in
a similar way as other non-financial assets, and liabilities for leases are measured similarly to
other financial liabilities. This results in that, as is the case for other non-financial assets and
financial liabilities, depreciation of the asset and interest for the liability also should be
recognised. As regarding the measurement of the assets and liabilities, these are initially
estimated on a present value basis which involves determining a discount-rate. The amount
should include non-cancellable lease payments and payments that are optional but with
reasonable certainty can be expected to be made, that is, when option to extend the lease are
intended to be exercised or option to terminate the lease are not exercised (IFRS Foundation,
2019). In subsequent measurements of the right-of-use asset, a cost model should commonly
be applied, which consists of estimating the cost of the asset less any accumulated
depreciation and impairment together with adjustments for any remeasurement of the lease
liability (IFRS Foundation, 2019). Similarly, subsequent measurements of lease liabilities
include increasing the carrying amount if the interest has increased or reducing the carrying
amount to reflect any payments that have been made (IFRS Foundation, 2019).
2.3.1 Transition options for IFRS 16
When companies apply IFRS 16 for the first time, they can choose to either use a full
retrospective approach or a modified retrospective approach in the application (IFRS
Foundation, 2016b). In essence, the full retrospective approach means that all financial
metrics used in comparative financial statements are restated, showing the numbers as if IFRS
16 would have been applied in previous periods. This method makes comparability between
years easier since it provides an overview of historical trends, but it requires quite substantial
work from the firms. The costs for lessees with large amounts of leases would be significant,
as large amounts of historical information and calculation are needed (Morales-Díaz and
15
Zamora-Ramírez, 2018). The IFRS Foundation (2016b) acknowledged that although this
approach is more informative, the costs associated with restating the numbers would be
difficult to justify. As a consequence, it was decided that the modified retrospective approach
should be available as an option when transition is made to IFRS 16. If using this approach,
restating comparative information is not needed. Instead, firms only have to disclose changes
in the asset and liability value of the leases (IFRS Foundation, 2016b).
2.3.2 The qualitative characteristics of IFRS 16
Pardo and Giner (2018), who investigated how IASB applied the conceptual framework in
developing IFRS 16, found that IASB kept referring to the overall objective of decision
usefulness. Other qualitative characteristics that were mentioned to justify the requirements of
IFRS 16 include relevance, faithful representation and comparability. Relevance and faithful
representations are two fundamental qualitative characteristics that are believed to be very
important for the usefulness of accounting (Runesson et al., 2018). Accounting information is
deemed as relevant if the information can support readers of financial statements in their
decision-making, while faithful representation refer to the ability of financial reports to reflect
the underlying economics of the business. Proponents of IFRS 16 believe that financial
reporting benefits from the new accounting standard since it improves the disclosure of the
underlying economics that arise from lease contracts (Pardo & Giner, 2018) More
specifically, when it comes to leases, faithful representation is achieved when financial
reporting reflects the right to use an asset and an obligation to make future lease payments
(Pardo & Giner, 2018). Comparability is an enhancing qualitative characteristic that refers to
comparability between firms, but also over time in a single firm (Runesson et al., 2018).
Comparability is suggested to increase with IFRS 16 since, by having most of the leases
capitalised on the balance sheet, it makes two companies that have similar operations appear
similar regardless of how they have chosen to finance their assets i.e., leasing or owning
(Pardo & Giner, 2018).
In addition, Tanase, Calota, and Oncioiu (2018) claim that IFRS 16 leads to increased
transparency, as leases are recognized as assets on the balance sheet instead of merely
disclosing the amount in a note, which improves decision-making under the assumption that
firm risk was not accurately assessed before. It is suggested that IFRS 16 allows different
stakeholders, including preparers of financial standards, investors, auditors and academics, to
better evaluate lease obligations and thus the total debt of the company (Pardo & Giner,
2018). The qualitative characteristics of IFRS 16 show how the new accounting standard is
supposed to improve the usefulness of accounting. However, if firms make different
disclosure choices regarding IFRS 16, there could be other consequences for the quality of
accounting. As might be indicated, although accounting quality is quite dependent on the
actual quality of the standards, it does not fully determine the result. Important to consider is
therefore also how firms choose to apply the standards, how they interpret them, and how they
disclose the effects of standards. These aspects could be even more critical for the accounting
quality. This is especially true for those parts of the disclosure where there is more flexibility,
such as presentation of performance measures.
16
2.3.3 Alternative Performance Measures and changes due to capitalising leases
The income statement, balance sheet, cash flow statement, statement of changes in equity and
accompanying notes are compulsory, with their content being regulated by IFRS. However, in
addition to these, it is common that firms choose to present supporting financial information,
Alternative Performance Measures (APM), to summarise their performance and financial
position (Magli, Nobolo & Ogliari, 2017). An APM can be defined as “a financial measure of
historical or future financial performance, financial position, or cash flows, other than a
financial measure defined or specified in the applicable financial reporting framework”
(ESMA, 2015, p. 45). APMs include metrics such as net debt, EBITDA and EBIT. The aim
with APMs is to increase the understanding of the firm‘s business (Magli et al., 2017).
Although not defined and regulated in the accounting standards by IASB, APMs are
commonly derived from the statutory financial statements. Moreover, as an attempt to
increase the quality, the European Securities and Markets Authority (ESMA) published
guidelines regarding APMs and how to disclose them (ESMA, 2015). Similar to IFRS, the
purpose with the guidelines is to enhance comparability, reliability and comprehensibility of
information. It is for example stated that when making disclosures regarding APMs,
definitions of them should be presented in a clear and readable way. In addition, APMs
preferably shall be accompanied by comparative numbers for previous periods. And for
facilitating reliability in the reporting, a firm‘s definitions and methods for calculations of
APMs should be consistent over time. But if a company does change the definition or
calculation of any APM, a description should be made regarding the changes and the cause to
the changes, while restated comparative numbers also should be provided. If it is not practical
to present comparatives, an explanation for it ought to be given (ESMA, 2015). Although
these guidelines set a framework for how firms preferably should disclose the information,
disclosures regarding APMs are still made on a voluntary basis. Which metrics that are used
and the degree of details given could thus vary substantially as firms can decide to what
extent they want to follow the guidelines. Since APMs are used extensively by firms in the
financial reports, it is equally important to investigate the impact of IFRS 16 on such
measures as it is for mandatory disclosure. Simultaneously, for lease intensive firms, the
capitalisation of leases is having a substantial effect on many of these measures (Imhoff, Lipe
& Wright, 1991; Morales-Díaz, & Zamora-Ramírez, 2018). Since APMs are not strictly
regulated, companies have even more flexibility in the disclosure of them as compared to the
mandatory disclosures. Therefore, while the presentation of mandatory information connected
to IFRS 16 disclosure can be anticipated to be rather uniform across firms‘ financial reports,
the disclosure of APMs presumably should vary to a larger extent.
Since IFRS 16 requires the majority of leases to be recognised as assets and liabilities, these
items will accordingly increase on the balance sheet. Consequently, APMs that are based on
numbers on the financial statements are also affected. Several authors have previously
investigated the effect of lease capitalisation on financial metrics (e.g., Ashton, 1985; Imhoff,
Lipe and Wright, 1997; Beattie, Edwards & Goodacre, 1998), with commonly studied ratios
being gearing ratios and various profit metrics. In addition, along with the release of the new
leasing standard, IFRS Foundation (2016a) made an effects analysis for frequently used
17
financial ratios where some notable metrics are D/E, asset turnover, EBITDA, EBIT and
operating cash flow. The impact of lease capitalisation on these ratios is that leverage ratio
increases due to increased financial liabilities, while asset turnover decreases as total assets
increases. As regarding EBITDA, the ratio increases since leases are no longer operating
expenses but instead classified as a depreciation cost. Due to the leasing expense being
divided into both depreciation and interest expense, EBIT also should increase slightly.
Finally, operating cash flow increases as a portion of the lease payments are classified as
financing cash flow instead, however, net cash flow remains unchanged.
Although there is a general anticipation of in what direction financial measures are affected,
Ashton (1985) states that findings related to the magnitude of the effects of lease
capitalisation on performance ratios and decision-making are rather mixed. It can broadly be
acknowledged that many financial metrics are affected by changing requirements in the
recognition of leases. But evidence regarding the level of impact on the ratios and whether the
changes results in any significant effect on decision-making is less clear. Imhoff et al. (1991)
found that there were notable effects on risk and returns measures such as D/E and ROA.
However, the average change in D/E was remarkably higher than the average change in ROA.
Also, the effect of capitalising leases was considerably larger for lease intensive firms than for
firms with low level of off-balance sheet leases. They concluded that the difference between
capitalising leases and having off-balance sheet leases indeed is material, but the scope of the
effects varied across industries, depending on how important off-balance sheet leases are for
that specific industry. Nevertheless, Ashton (1985) could only find statistically significant
support for the increase of the leverage ratio, while effects in measures such as profit and
asset turnover had no statistically significant impact. The study by Elam (1975) had some
similar results as no evidence could be found of that lease capitalisation and its effects on
financial ratios would enhance the predictive ability of firm bankruptcy. Fülbier, Silva and
Pferdehirt (2008) state that lease capitalisation mainly affects ratios that are based on the
numbers of the balance sheet although there are some minor effects on profitability measures.
It therefore seems that capitalising leases could have various levels of effects on companies‘
financial statements, and that how they choose to disclose financial numbers might vary
depending on the impact on performance measures.
2.3.4 Effects of capitalising leases on company valuation and bonus systems
Much research that has taken a market perspective has investigated market reactions to varied
line items (Ball & Brown, 1968; Beaver, 1968; Fama et al., 1969). Particularly, the relation
between changes in stock prices and financial information is commonly studied (Runesson,
2015). Accounting is considered value relevant if changes in accounting numbers influence
investors‘ evaluation of firm value. However, as regarding disclosures of leases and value
relevance, there have been some mixed results in prior research. Whilst some authors have
shown that market participants already consider operating liabilities in their assessment of risk
(Ling, Naranjo & Ryngaert, 2012; Altamuro, Johnston, Pandit & Zhang, 2014), other have
suggested that capitalisation of leases do lead to better decision-making (Cornaggia et al.
2013; Cotten, Schneider & McCarthy, 2013). Furthermore, Sengupta and Wang (2011) found
18
that liabilities recognized on the balance sheet have larger effects on valuation than liabilities
disclosed in the notes, while Lim, Mann and Mihov (2017) found no difference. Giner and
Pardo (2018) conducted a value relevance analysis on operating leases in an attempt to
measure the economic effect of IFRS 16. They investigated whether users of financial reports
take into account the disclosure of operating leases in the notes, and it turned out to be the
case for at least the retail industry. Their findings suggest that IFRS 16 will not have a large
impact on valuation from the user's perspective since investors are already aware of the
existence of lease liabilities. If the reality is as Giner and Pardo (2018) describes it, that is,
users of financial reports take into account the information disclosed in the notes for
valuation, then we would expect firms to put minimal effort in disclosing information
concerning IFRS 16.
Although changes in accounting standards should not result in changes in how firms are
valued (IFRS Foundation, 2019), it is still possible that the perception of risk and profitability
changes. Prior research (e.g., Ashton, 1985; Imhoff et al., 1991; Fülbier et al., 2008) have
shown that the impact of capitalising leases is large on firms‘ solvency and therefore might
lead to a new assessment of the overall risk of the firm. Since IFRS 16 increases leverage
ratio (IFRS Foundation, 2016a), the perception of a firm‘s risk could increase. Furthermore,
Hopper, Kirkham, Scapens, and Turley (1992) noted that financial accounting information
many times have to be modified in order to better accommodate the companies‘ bonus
systems. For instance, when it comes to performance evaluation, changed EBIT or EBITDA
might require new incentive programmes to better reflect actual performance since an
increase in these measures results in that there is a higher possibility for bonuses to be
granted, although the performance of the individuals has not improved (Morales-Díaz &
Zamora-Ramírez, 2018). In addition, if companies expect a new accounting standard to
increase the quality of certain measures, more emphasis will be put on those specific numbers
in the compensation contracts (Joos & Leung, 2013). An increased D/E ratio and EBITDA as
a result of lease capitalisation makes it relevant to study how companies deal with the possible
changed perception of risk and profitability in their financial reports.
There are several tools that can be used for financial statement analysis and the assessing of
firm value, such as trend analysis and financial ratios analysis (Revsine et al., 2017). Trend
analysis is useful for spotting changes in the cost structure, performance and financial
structure of the company. Similarly, analysis of financial ratios may be performed to assess
the company‘s financial performance and risk. Furthermore, understanding the business is
crucial when estimating value of firms (Penman, 2013). In general, firms are in involved in
three types of activities namely financing, investing and operating activities, where only the
last two are considered as value generating. Financing activities are associated with raising
capital, and the cash accumulated from these activities is then used for investing activities, for
instance to acquire assets. Eventually, the acquired assets are used for operating activities to
produce goods or services (Penman, 2013). Since IFRS 16 alters the classification of
operating and financing activities, firm value might be affected.
19
3. Method
Considering the research questions and the purpose of the study, which is to investigate how
IFRS 16 affects financial metrics of firms in the consumer industry, how such disclosure is
managed in the financial reports at transition and how this might affect the preconditions for
stakeholders‘ analysis, a descriptive approach was deemed suitable. This approach is
suggested to allow for obtaining new information by describing a particular phenomenon
(Collis & Hussey, 2013). Since IFRS 16 is a quite new accounting standard, the subject is still
relatively unexplored. Hence, to learn more about this topic, an exploratory research was
required. By conducting an exploratory research, we aimed to increase the familiarity with
this topic and contribute to research with new insights that can be used to assist future
research to make in-depth studies. As such, rather than providing deep investigations, our
study serves more as a guide for future research.
3.1 Selection of companies
In the selection of companies to study, we determined to use the lists Large Cap and Mid Cap
on the stock exchange Nasdaq Stockholm as the first step in limiting the scope of the research.
Listed firms were selected since most public companies use IFRS in their external reporting.
The reason for particularly choosing large companies is because they should be more
concerned about the effects of introducing IFRS 16 than small organisations, as Joseph,
Turley, Burns, Lewis, Scapens and Southworth (1996) argue that large companies seemingly
are more aware of investors‘ reactions to financial disclosures. According to IFRS Foundation
(2016a), the top four industries that will experience most impact on the balance sheet,
measured as the increase in assets put in relation to total assets, are airlines, retailers, travel
and leisure and transport. As these industries commonly are operating within the Business-to-
Consumer sector, we filtered Large Cap and Mid Cap by Business-to-Consumer firms. This
gave us a list with 54 companies (see Appendix A), but two companies were immediately
dropped because they do not apply IFRS. We also found that firms with a large impact would
be more relevant for our study. Since all top four industries with largest expected effect is
believed to experience a percentage change of 15 percent or more in assets (IFRS Foundation,
2016a), we decided to use 15 percent as a threshold and selection criteria. Only firms with an
equal or larger increase than the threshold were chosen to be further investigated. Each of the
firms‘ financial report was examined in order to attain the effect of IFRS 16 on assets. The
increase in the right-of-use value of the assets at the transition day of IFRS 16, which often is
stated on the notes of the financial statements, was put in relation to the company‘s total
balance the day before transition. Thus, if the company implemented IFRS 16 at 1 January
2019, the balance of 31 December 2018 was used in our calculations. Of the 54 companies,
we could establish that 17 firms had an impact ratio over 15 percent (see table 1 in section 4.1
for list of the companies).
20
3.2 Material collection
The data collection was based on studying annual reports. The annual reports were examined
thoroughly by using key words such as IFRS 16, leasing, leases and right-of-use assets to find
relevant information, since they usually contain hundreds of pages. Information about leasing
could be found anywhere in the report, but most of the information was presented under a
specific note dedicated to leasing, the first note describing the changes in accounting
principles and disclosures, the consolidated balance sheet and sometimes in the beginning of
the report connected to presentation of financial metrics and targets. Both numerical and non-
numerical data were collected from the annual reports because we strived for acquiring
information both about the impact of IFRS 16 on financial numbers and how firms manage
the implementation. Although we used the literature review to structure the material
collection, we still anticipated that much can be discovered as the annual reports were
examined. To ensure that our expectations would not limit us and be able to discover new
aspects of this issue, we strived to be as open as possible when reading the reports. Therefore,
not only direct effects of IFRS 16 were considered, but also, all actions that have been taken
by the organisation due to the transition to IFRS 16 were examined.
3.3 Analysis of data
Although being open and flexible during the material collection, when it comes to the analysis
of the collected data, creating a contextualisation is more useful and facilitates the analysis.
As Collis and Hussey (2013) suggest, qualitative data needs to be understood within a
context. It was important that an understanding of the topic and the companies had been
created beforehand. For instance, we have understood that within some industries, EBIT is
more commonly used than EBITDA and vice versa. This partly confirmed that variations in
disclosure across industries might need to be considered. Furthermore, the annual reports of
the companies were studied and the theoretical framework presented in the previous section
guided the study as it provided the context of which the data is interpreted and analysed. For
instance, it could sometimes be difficult to understand the different disclosure behaviour of
the firms by only looking at the gathered data. But by glancing at the existing theories, the
firms‘ disclosure choices could be understood and explained easier, as we in that way attained
something to compare with and could reflect on what the findings actually meant.
One of the main issues with analysing large amount of qualitative data is the lack of
instructions on how to structure data (Collis & Hussey, 2013). In order to manage thousands
of pages of data in a systematic manner, content analysis was performed to understand
underlying themes about disclosure. In particular, this process involved selecting,
summarizing and abstracting of data. Data was summarized in tables which facilitated the
analysis, and abstracting of data was done by classifying data into different categories.
Common categories that we found especially interesting for our study include restatements of
APMs, disclosure of financial targets, consistency of IFRS 16 application, indications of
disclosure incentives and other implications of IFRS 16. This process enabled us to make
21
conclusions about how changes in financial reporting requirements could affect accounting
usefulness and the preconditions of making financial statement analysis.
3.4 Limitations
IASB requires IFRS 16 to be applied for fiscal years starting in 2019. Since a few of the
studied companies do not have calendar year as their fiscal year (AcadeMedia, Clas Ohlson,
H&M, Internationella Engelska Skolan, SAS and SkiStar), the standard has not been adopted
yet in their most recent annual reports. For instance, the latest annual report from H&M is
regarding the period 1 December 2018 to 30 November 2019 (H&M, 2020). This means that
IFRS 16 was applied first in 1 December 2019 and will be accounted for in the annual report
covering period 2019/2020, published in 2021. However, even though the standard is not
affecting the financial statements in their current reports, all of the companies were
announcing future changes in accounting standards and hence described how IFRS 16 will
affect both their business and disclosures. SAS, for instance, have a rather thorough
explanation of the actions that have been taken in order to prepare for IFRS 16 and how they
adapted to the new requirements (SAS, 2020a). Moreover, quarterly reports published after
the companies‘ latest annual reports functioned as a complement since IFRS 16 became
accounted for in those communications. Although interim reports are not audited to the same
extent as annual reports, they could still serve similar functions. For instance, all the firms of
which quarterly reports have been used have chosen to follow IAS 34 Interim Financial
Reporting in their quarterly reports and the financial statements are prepared in accordance
with IFRS. Therefore, we believe that although the periods in the companies‘ fiscal years
vary, it did not affect our possibility to make adequate comparisons between the firms.
4. Empirical findings
4.1 IFRS 16 effect on total balance
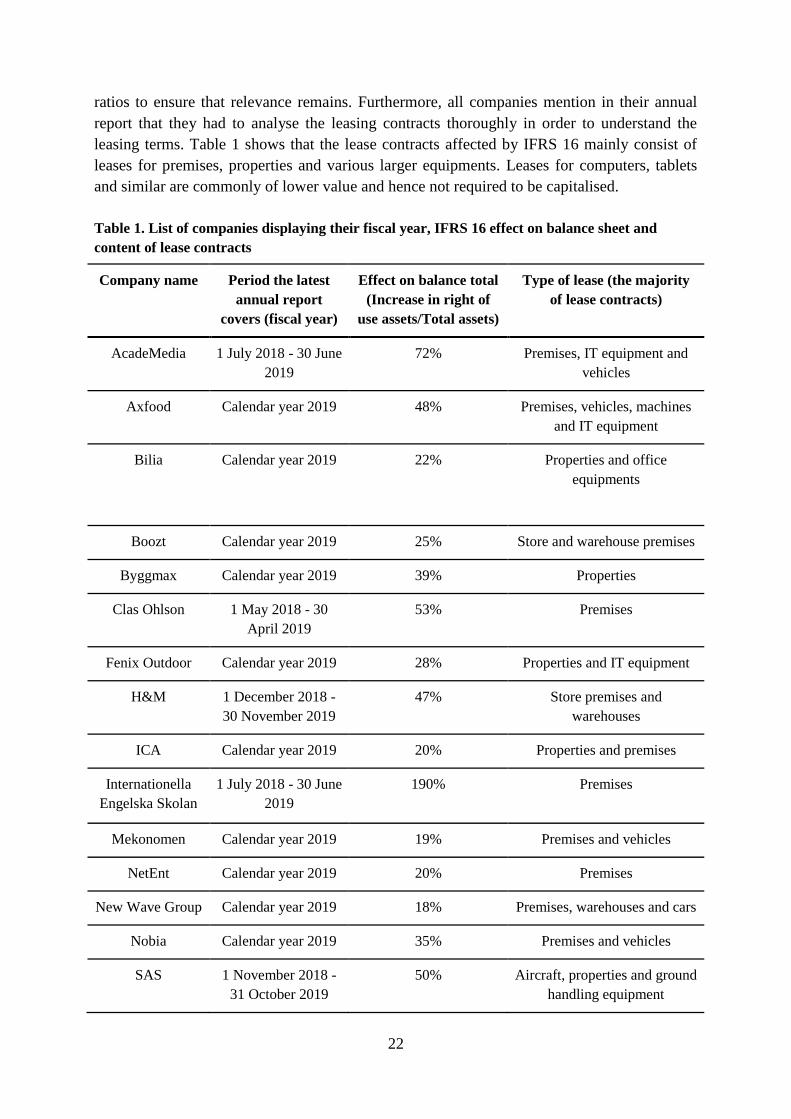
In the annual reports of the 17 firms, the change in total assets due to IFRS 16 implementation
can be detected. It could be established that the increase in total assets for the selected
companies varies between 16 and 190 percent (see table 1), which is quite a substantial range.
Most of the companies had already implemented IFRS 16 for fiscal year 2019 (those firms
having calendar year as fiscal year), however, some will account for IFRS 16 in next annual
report. Several of the firms describe what preparations have been made in order to ensure a
proper transition to IFRS 16. It appears that adequate preparations have been important to
most of the firms and consideration about the effects of the standard has been necessary. For
instance, Axfood work with risk assessment as a part of the internal control (Axfood, 2020).
In their risk review, they identified that processes and routines for the reporting and
monitoring of IFRS 16 was a particular risk factor. The implementation of the standard was
hence regarded as a factor especially important to consider in order to secure good internal
control and financial reporting. SAS (2020a) emphasised that since IFRS 16 has a notable
impact on their income statement and balance sheet, they have reviewed their key financial
22
ratios to ensure that relevance remains. Furthermore, all companies mention in their annual
report that they had to analyse the leasing contracts thoroughly in order to understand the
leasing terms. Table 1 shows that the lease contracts affected by IFRS 16 mainly consist of
leases for premises, properties and various larger equipments. Leases for computers, tablets
and similar are commonly of lower value and hence not required to be capitalised.
Table 1. List of companies displaying their fiscal year, IFRS 16 effect on balance sheet and
content of lease contracts
Company name Period the latest
annual report
covers (fiscal year)
Effect on balance total
(Increase in right of
use assets/Total assets)
Type of lease (the majority
of lease contracts)
AcadeMedia 1 July 2018 - 30 June
2019
72% Premises, IT equipment and
vehicles
Axfood Calendar year 2019 48% Premises, vehicles, machines
and IT equipment
Bilia Calendar year 2019 22% Properties and office
equipments
Boozt Calendar year 2019 25% Store and warehouse premises
Byggmax Calendar year 2019 39% Properties
Clas Ohlson 1 May 2018 - 30
April 2019
53% Premises
Fenix Outdoor Calendar year 2019 28% Properties and IT equipment
H&M 1 December 2018 -
30 November 2019
47% Store premises and
warehouses
ICA Calendar year 2019 20% Properties and premises
Internationella
Engelska Skolan
1 July 2018 - 30 June
2019
190% Premises
Mekonomen Calendar year 2019 19% Premises and vehicles
NetEnt Calendar year 2019 20% Premises
New Wave Group Calendar year 2019 18% Premises, warehouses and cars
Nobia Calendar year 2019 35% Premises and vehicles
SAS 1 November 2018 -
31 October 2019
50% Aircraft, properties and ground
handling equipment
23
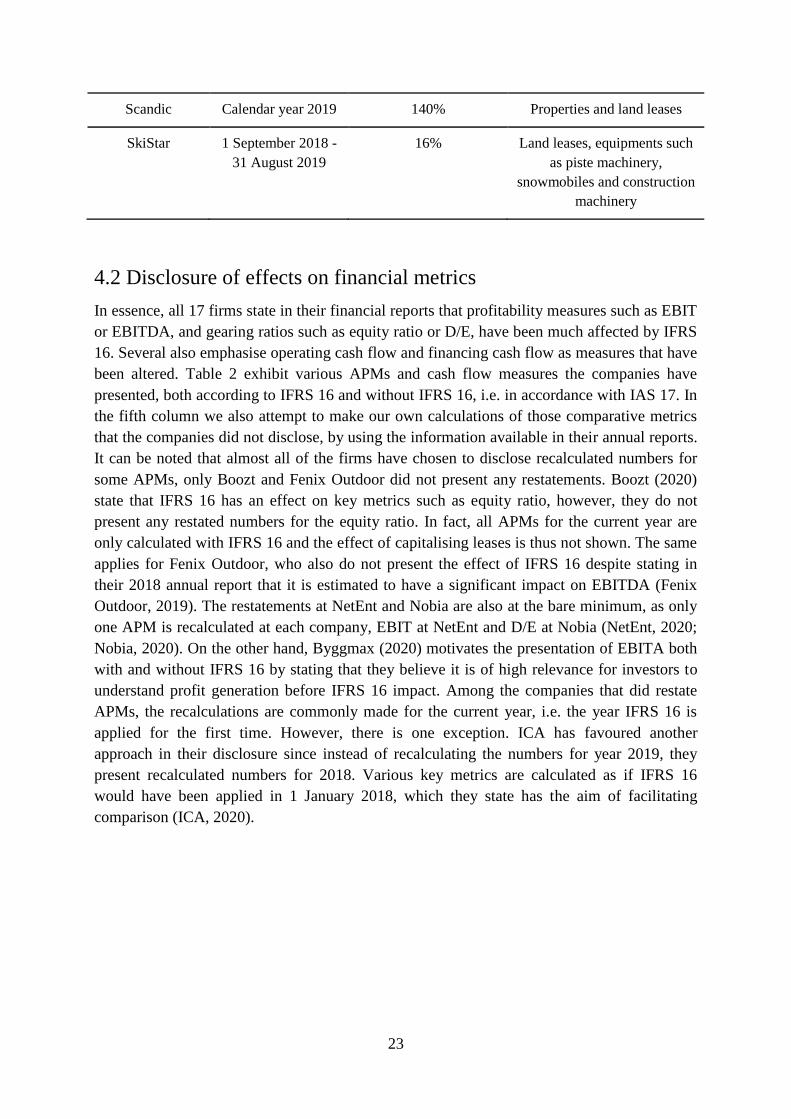
Scandic Calendar year 2019 140% Properties and land leases
SkiStar 1 September 2018 -
31 August 2019
16% Land leases, equipments such
as piste machinery,
snowmobiles and construction
machinery
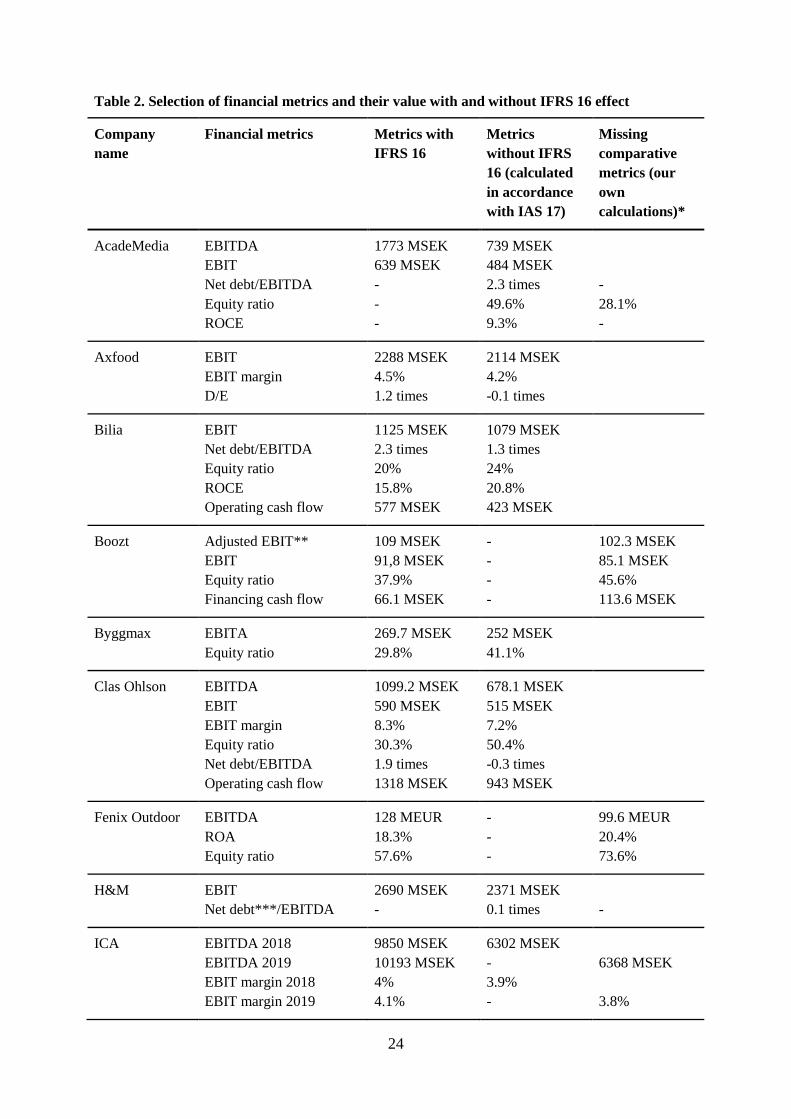
4.2 Disclosure of effects on financial metrics
In essence, all 17 firms state in their financial reports that profitability measures such as EBIT
or EBITDA, and gearing ratios such as equity ratio or D/E, have been much affected by IFRS
16. Several also emphasise operating cash flow and financing cash flow as measures that have
been altered. Table 2 exhibit various APMs and cash flow measures the companies have
presented, both according to IFRS 16 and without IFRS 16, i.e. in accordance with IAS 17. In
the fifth column we also attempt to make our own calculations of those comparative metrics
that the companies did not disclose, by using the information available in their annual reports.
It can be noted that almost all of the firms have chosen to disclose recalculated numbers for
some APMs, only Boozt and Fenix Outdoor did not present any restatements. Boozt (2020)
state that IFRS 16 has an effect on key metrics such as equity ratio, however, they do not
present any restated numbers for the equity ratio. In fact, all APMs for the current year are
only calculated with IFRS 16 and the effect of capitalising leases is thus not shown. The same
applies for Fenix Outdoor, who also do not present the effect of IFRS 16 despite stating in
their 2018 annual report that it is estimated to have a significant impact on EBITDA (Fenix
Outdoor, 2019). The restatements at NetEnt and Nobia are also at the bare minimum, as only
one APM is recalculated at each company, EBIT at NetEnt and D/E at Nobia (NetEnt, 2020;
Nobia, 2020). On the other hand, Byggmax (2020) motivates the presentation of EBITA both
with and without IFRS 16 by stating that they believe it is of high relevance for investors to
understand profit generation before IFRS 16 impact. Among the companies that did restate
APMs, the recalculations are commonly made for the current year, i.e. the year IFRS 16 is
applied for the first time. However, there is one exception. ICA has favoured another
approach in their disclosure since instead of recalculating the numbers for year 2019, they
present recalculated numbers for 2018. Various key metrics are calculated as if IFRS 16
would have been applied in 1 January 2018, which they state has the aim of facilitating
comparison (ICA, 2020).
24
Table 2. Selection of financial metrics and their value with and without IFRS 16 effect
Company
name
Financial metrics Metrics with
IFRS 16
Metrics
without IFRS
16 (calculated
in accordance
with IAS 17)
Missing
comparative
metrics (our
own
calculations)*
AcadeMedia EBITDA
EBIT
Net debt/EBITDA
Equity ratio
ROCE
1773 MSEK
639 MSEK
-
-
-
739 MSEK
484 MSEK
2.3 times
49.6%
9.3%
-
28.1%
-
Axfood EBIT
EBIT margin
D/E
2288 MSEK
4.5%
1.2 times
2114 MSEK
4.2%
-0.1 times
Bilia EBIT
Net debt/EBITDA
Equity ratio
ROCE
Operating cash flow
1125 MSEK
2.3 times
20%
15.8%
577 MSEK
1079 MSEK
1.3 times
24%
20.8%
423 MSEK
Boozt Adjusted EBIT**
EBIT
Equity ratio
Financing cash flow
109 MSEK
91,8 MSEK
37.9%
66.1 MSEK
-
-
-
-
102.3 MSEK
85.1 MSEK
45.6%
113.6 MSEK
Byggmax EBITA
Equity ratio
269.7 MSEK
29.8%
252 MSEK
41.1%
Clas Ohlson EBITDA
EBIT
EBIT margin
Equity ratio
Net debt/EBITDA
Operating cash flow
1099.2 MSEK
590 MSEK
8.3%
30.3%
1.9 times
1318 MSEK
678.1 MSEK
515 MSEK
7.2%
50.4%
-0.3 times
943 MSEK
Fenix Outdoor EBITDA
ROA
Equity ratio
128 MEUR
18.3%
57.6%
-
-
-
99.6 MEUR
20.4%
73.6%
H&M EBIT
Net debt***/EBITDA
2690 MSEK
-
2371 MSEK
0.1 times
-
ICA EBITDA 2018
EBITDA 2019
EBIT margin 2018
EBIT margin 2019
9850 MSEK
10193 MSEK
4%
4.1%
6302 MSEK
-
3.9%
-
6368 MSEK
3.8%

25
Net debt/EBITDA 2018
Net debt/EBITDA 2019
Operating cash flow 2018
Operating cash flow 2019
2.1 times
2 times
10326 MSEK
9748 MSEK
0.8 times
-
6802 MSEK
-
0.7 times
6265 MSEK
Internationella
Engelska
Skolan
EBITDA
EBIT
Net debt/EBITDA
Equity ratio
675 MSEK
283 MSEK
5 times
20%
293 MSEK
209 MSEK
-0.2 times
62%
Mekonomen EBIT
Net debt/EBITDA
Equity ratio
705 MSEK
3.59 times
34%
685 MSEK
3.68 times
39.3%
NetEnt EBIT
Equity ratio
529 MSEK
23%
468 MSEK
-
24.4%
New Wave
Group
EBITDA
D/E
Equity ratio
768 MSEK
78.6%
44.9%
632.1 MSEK
57.2%
49.7%
Nobia EBIT
EBIT margin
D/E
1132 MSEK
8.1%
89%
-
-
31%
1077 MSEK
7.7%
SAS EBIT
D/E
Net debt/EBITDAR****
-767 MSEK
4.75%
-
-836 MSEK
0.83%
4.1 times
-
Scandic EBITDAR****
EBITDA
Adjusted EBITDA*****
EBIT
Net debt/adjusted
EBITDA*****
-
5425 MSEK
-
2144 MSEK
-
7107 MSEK
2134 MSEK
2046 MSEK
1275 MSEK
1.7 times
-
-
-
SkiStar EBIT
Equity ratio
508 MSEK
43%
504 MSEK
46%
All numbers are retrieved from the companies‘ most recent annual reports except for AcadeMedia, Clas Ohlson,
H&M, SAS and SkiStar as IFRS 16 was not yet implemented for their latest annual reports. For AcadeMedia and
Clas Ohlson, the Q3 2019/2020 reports have been used, covering nine months of their fiscal year. For H&M and
SAS, the Q1 2019/2020 reports were used, covering three months of their fiscal year. For SkiStar, the Q2 report
was used, covering six months of their fiscal year.
Depending on how much is disclosed in each company‘s financial report, one or several profitability and
leverage measures are included. When applicable, operating or financing cash flow is also presented. Where
numbers are missing, indicated with (-), no comparable numbers have been given in the financial reports.
* Some comparative metrics could not be calculated with IFRS 16 because they are based on trailing 12-months
numbers, which are not available at the time of writing this paper.
** EBIT adjusted for share-based payments to employees and items affecting comparability.
*** Net debt is defined as pension liabilities plus interest-bearing liabilities less cash and cash equivalents and
26
short-term investments.
**** IFRS 16 does not affect EBITDAR as the measure is calculated before depreciation and rent costs.
***** IFRS 16 does not affect adjusted EBITDA as the measure is defined without the effect of finance leases.
H&M has a fiscal year starting at 1 December each year. As their most recent financial report
concerns 1 December 2018 to 30 November 2019, IFRS 16 effects will appear first in the
2019/2020 annual report. However, there was some information available about the upcoming
impact of IFRS 16. H&M (2020) stated that they will be dealing with the accounting
consequences by continuing to present the gearing ratios without the effect of IFRS 16 in the
coming financial reports. By doing so, they believe it provides a more accurate reflection of
the actual capital structure of the company, since the same figures are used for internal
monitoring in the organisation as well. Other financial ratios will be defined both with and
without the effect of IFRS 16. It is further stated that key ratios and indicators are used to
follow-up, analyse and govern the business, implying that these financial metrics are
important for internal accounting.
In AcadeMedia‘s presentation of key financial measures, the calculation is slightly varied as
some of the metrics include IFRS 16 and some do not (AcadeMedia, 2020). EBIT and
EBITDA are presented including IFRS 16, whereas equity ratio, ROCE and net debt/EBITDA
are calculated without (EBITDA is being adjusted for IFRS 16 in the calculation of net
debt/EBITDA). The reason for ROCE and net debt/EBITDA not being calculated with IFRS
16 effect is because the numbers for the previous fiscal year have not been revised, and they
use trailing 12-months numbers for these metrics in their quarterly report (AcadeMedia,
2020). The trailing 12-month approach is sometimes used in interim reports to be able to
compare quarterly numbers with full-year numbers. Due to that previous years‘ numbers have
not been restated, AcadeMedia must wait until the first fiscal year with IFRS 16 is complete
in order to calculate net debt/EBITDA and ROCE with IFRS 16 effect. SAS also base several
of their key ratios on trailing 12-month numbers. Since they first applied IFRS 16 in 1
November 2019, a full trailing 12-month income statement will be available earliest in the
beginning of fiscal year 2020/2021 (SAS, 2020a). Therefore, those number that are based on
trailing months will in the financial report for fiscal year 2019/2020 be based on numbers
without IFRS 16, while those ratios that are calculated on closing balances will be presented
with IFRS 16 effect.
Scandic have in their annual report for 2019 presented the metric EBITDAR (Scandic,
2020b). However, in their annual report for 2018 (Scandic, 2019), this measure was not
mentioned anywhere in the report. EBITDAR is in annual report 2019 displayed in a section
describing the effects of IFRS 16. It therefore seems that EBITDAR has been added as a key
performance measure as a consequence of IFRS 16. They state that rent cost makes a
significant part of their total costs and the metric is included in order to facilitate
comparability over time (Scandic, 2020a). However, throughout their report, it is largely
adjusted EBITDA that is used, which is presented without IFRS 16 effect. For instance, their
financial targets are based on adjusted EBITDA and five-year comparison graphs are used to
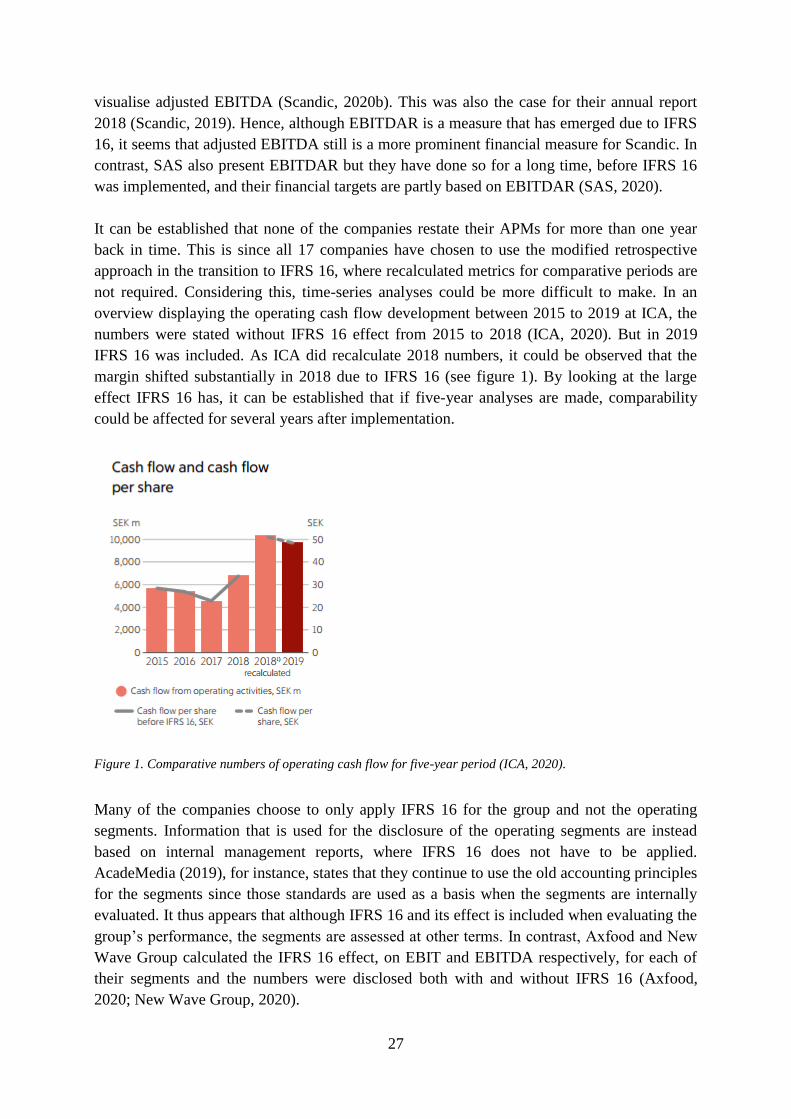
27
visualise adjusted EBITDA (Scandic, 2020b). This was also the case for their annual report
2018 (Scandic, 2019). Hence, although EBITDAR is a measure that has emerged due to IFRS
16, it seems that adjusted EBITDA still is a more prominent financial measure for Scandic. In
contrast, SAS also present EBITDAR but they have done so for a long time, before IFRS 16
was implemented, and their financial targets are partly based on EBITDAR (SAS, 2020).
It can be established that none of the companies restate their APMs for more than one year
back in time. This is since all 17 companies have chosen to use the modified retrospective
approach in the transition to IFRS 16, where recalculated metrics for comparative periods are
not required. Considering this, time-series analyses could be more difficult to make. In an
overview displaying the operating cash flow development between 2015 to 2019 at ICA, the
numbers were stated without IFRS 16 effect from 2015 to 2018 (ICA, 2020). But in 2019
IFRS 16 was included. As ICA did recalculate 2018 numbers, it could be observed that the
margin shifted substantially in 2018 due to IFRS 16 (see figure 1). By looking at the large
effect IFRS 16 has, it can be established that if five-year analyses are made, comparability
could be affected for several years after implementation.
Figure 1. Comparative numbers of operating cash flow for five-year period (ICA, 2020).
Many of the companies choose to only apply IFRS 16 for the group and not the operating
segments. Information that is used for the disclosure of the operating segments are instead
based on internal management reports, where IFRS 16 does not have to be applied.
AcadeMedia (2019), for instance, states that they continue to use the old accounting principles
for the segments since those standards are used as a basis when the segments are internally
evaluated. It thus appears that although IFRS 16 and its effect is included when evaluating the
group‘s performance, the segments are assessed at other terms. In contrast, Axfood and New
Wave Group calculated the IFRS 16 effect, on EBIT and EBITDA respectively, for each of
their segments and the numbers were disclosed both with and without IFRS 16 (Axfood,
2020; New Wave Group, 2020).

28
4.3 Initiatives made in response to IFRS 16
Similar to H&M, information about how IFRS 16 will be accounted for was disclosed in the
annual report from SAS. Nevertheless, the information at SAS was considerably more
detailed, as disclosure was made about several of their initiatives before the implementation
of IFRS 16. For instance, they announced that as a part of preparing for the changes, hybrid
bonds to a value of SEK 1.5 billion were issued with the purpose to strengthen the equity
position before adopting the new standard (SAS, 2020a). This indicates that they were well
aware of what consequences their financial position might encounter, and by that, took actions
to mitigate the effects.
A somewhat surprising finding, which seemingly has not been highlighted in previous lease
accounting literature, was that transition to IFRS 16 might result in increased exposure to
exchange-rate fluctuations. SAS (2020a) state that the new standard had a major effect on this
aspect as most of their lease liabilities needed to be recalculated from a foreign currency into
the currency used in their consolidated financial statements. In the first quarter of fiscal year
2019/2020, the exchange-rate difference due to IFRS 16 amounted to -31 MSEK (SAS,
2020b). As a direct consequence of this, their hedging policy was given more attention
internally and became adjusted in order to better manage the increased exchange-rate risk.
Another unexpected discovery was that goodwill could be affected due to the capitalisation of
leases. The D/E at Nobia experienced a significant increase as a consequence of IFRS 16,
from 31 percent to 89 percent, which affected the average cost of capital (Nobia, 2020). The
average cost of capital decreased due to the higher D/E, as equity commonly is more
expensive than debt. This, in turn, affects the estimation of write-off for goodwill since
average cost of capital is a critical component in those calculations. In addition, operational
cash flow is also needed for the estimation (Nobia, 2020). Since both of the factors are
affected by IFRS 16, the standard could have a large impact on goodwill. However, in the
case of Nobia the effect was positive, and no write-off was needed.
Mekonomen (2020) report that their borrowings at banks include debt covenants. However,
they estimate that IFRS 16 will not affect their ability to fulfill the terms found in the debt
covenants. It can further be noted in a footnote that it is net debt/EBITDA without IFRS 16
that is reported to the banks, and Mekonomen argue that these numbers are well within the
requirements in the covenants. It is also established that net debt/EBITDA is the main
financial ratio used by the board when assessing the firm‘s capital structure. Nevertheless,
their net debt/EBITDA actually decreased due to IFRS 16, from 3.68 times to 3.59 times,
meaning that including IFRS 16 adjustments would have decreased the financial risk in their
case.
4.3.1 Revising financial targets
Another aspect that most companies had to consider was the financial targets. The effects of
changed financial measures required several firms to revise their targets in order to keep them
relevant. Five companies either had or were planning to revise the targets (see table 3). For
instance, ICA decreased the target for ROCE from 10 percent in year 2018 (ICA, 2019), to
29
7.5 percent in the beginning of 2019 (ICA, 2020). Net debt/EBITDA was also changed, from
a target of below 2, to a target of below 3. Axfood also revised their financial target as a result
of IFRS 16 (Axfood, 2020). The target for equity ratio was set to 20 percent in 2019, as
compared to 25 percent in 2018 (Axfood, 2019). However, the target for EBIT margin
remained at 4 percent. The reason for this not being changed might be explained by the fact
that the effect of IFRS 16 on EBIT margin was rather small, with only a 0.3 percent unit
increase (see table 2). Especially notable is that Byggmax not only revised the numbers for
the target, but they also changed the performance measure from using EBITDA to instead
using EBITA (Byggmax, 2019). AcadeMedia made clear that the work for revising financial
targets due to IFRS 16 has started and new will be set for fiscal year 2019/2020 (AcadeMedia,
2019). SAS, who applied the standard from 1 November 2019, also plan to revise their
financial targets. They announce that the targets will be reviewed for fiscal year 2019/2020 in
order to ensure that they maintain relevance (SAS, 2020a).
Seven of the companies opted for another approach. These firms did not change their financial
targets, but instead, they evaluate firm performance by using measures without IFRS 16. For
example, Bilia established in their report that company performance should be evaluated
based on metrics before IFRS 16 effect (Bilia, 2020). Scandic (2020b) use adjusted EBITDA
margin and net debt/adjusted EBITDA for measuring their target fulfilment, where adjusted
EBITDA is calculated without IFRS 16. For Nobia, D/E is evaluated without IFRS 16 while
EBIT margin is evaluated with effect. Furthermore, Mekonomen (2020) state that follow-ups
are made continuously in the internal reporting and they have chosen to use metrics without
IFRS 16 effect when performance evaluation is made. Clas Ohlson (2020) also explain in
their Q3 report that their targets, including EBIT margin and net debt/EBITDA, will be
evaluated by using performance measures without IFRS 16. Evaluating targets achievement
by using performance indicators without IFRS 16 might be appropriate in cases when
financial targets are cumbersome to adjust.
Fenix Outdoor and New Wave Group did not change their targets either, however, they did
not state whether measures without IFRS 16 effect are used or not when evaluating
performance. Nevertheless, when looking at their financial targets, it can be noted that they
have a long-term approach, as New Wave Group evaluates their target achievement over a
whole economic cycle (New Wave Group, 2020). Evaluating performance over a longer
period results in that changes of performance measure, due to accounting alterations, in one
year might be less significant as the effects will be diluted over the measurement period. In
NetEnt‘s report for year 2019, no information regarding financial targets could be noted
(NetEnt, 2020), even though they included financial targets in their annual report for 2018
(NetEnt, 2019). Whether this remove of financial targets is due to IFRS 16 or not is uncertain,
although it is not impossible as their leverage ratio was substantially decreased in 2019,
compared to their historical ratio (see table 2 and 4).
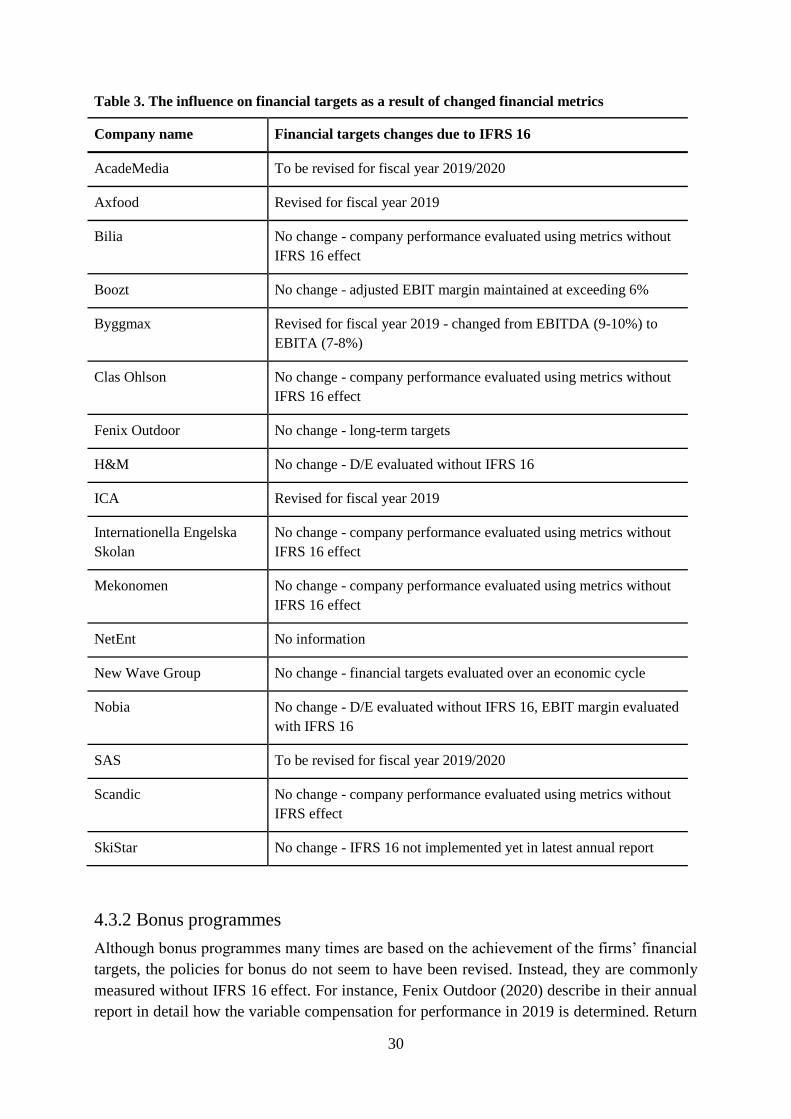
30
Table 3. The influence on financial targets as a result of changed financial metrics
Company name Financial targets changes due to IFRS 16
AcadeMedia To be revised for fiscal year 2019/2020
Axfood Revised for fiscal year 2019
Bilia No change - company performance evaluated using metrics without
IFRS 16 effect
Boozt No change - adjusted EBIT margin maintained at exceeding 6%
Byggmax Revised for fiscal year 2019 - changed from EBITDA (9-10%) to
EBITA (7-8%)
Clas Ohlson No change - company performance evaluated using metrics without
IFRS 16 effect
Fenix Outdoor No change - long-term targets
H&M No change - D/E evaluated without IFRS 16
ICA Revised for fiscal year 2019
Internationella Engelska
Skolan
No change - company performance evaluated using metrics without
IFRS 16 effect
Mekonomen No change - company performance evaluated using metrics without
IFRS 16 effect
NetEnt No information
New Wave Group No change - financial targets evaluated over an economic cycle
Nobia No change - D/E evaluated without IFRS 16, EBIT margin evaluated
with IFRS 16
SAS To be revised for fiscal year 2019/2020
Scandic No change - company performance evaluated using metrics without
IFRS effect
SkiStar No change - IFRS 16 not implemented yet in latest annual report
4.3.2 Bonus programmes
Although bonus programmes many times are based on the achievement of the firms‘ financial
targets, the policies for bonus do not seem to have been revised. Instead, they are commonly
measured without IFRS 16 effect. For instance, Fenix Outdoor (2020) describe in their annual
report in detail how the variable compensation for performance in 2019 is determined. Return
31
on total assets is one of the measured used, and it is made clear that total assets are defined
without the effect of IFRS 16. Even though Fenix Outdoor only present metrics including
IFRS 16 in their report (table 2), they base their incentive programmes on measures without
IFRS 16. The long-term bonus programme at ICA measures both relative and absolute
performance (ICA, 2020). The target to be achieved for the relative performance includes
achieving a certain level of EBIT margin compared to peers. This means that it does not
matter whether the targets are based on IFRS 16 or IAS 17 (with or without IFRS 16 effect),
as long as the measures used for performance evaluation are consistent for all peers. For the
absolute performance, EBIT margin is again a target that determines the bonus. However,
since absolute performance is based on fixed targets, the margin is measured without items
that affect comparability (ICA, 2020). This indicates that rather than changing the targets used
in incentive systems, old targets are kept and metrics without IFRS 16 influence are used
when evaluating performance. The policy for variable remuneration also remained at Axfood.
The remuneration is mainly based on the group‘s result (Axfood, 2020). In the section with
information about the terms for incentives it can be noted that, among other terms, the average
EBIT margin measured in a 3-year period should exceed 3.5 percent. This target has been
constant during 2017 to 2019. This, however, might be expected since the EBIT margin that
was set as a financial target for the group also remained at 4 percent. Naturally, the EBIT
margin target for remuneration is constant as well. H&M (2020) state that their variable
remuneration partly is based on the company‘s financial targets. However, as can be noted
from table 3, these targets have not been revised either.
4.4 Historical profitability and leverage at the companies
Table 4 displays what specific industry each company is operating within, along with their
profitability and leverage for three years prior to IFRS 16 implementation. Profitability is here
measured as the companies‘ EBIT margin while leverage is measured using equity ratio.
EBIT margin is a common measure to evaluate performance and has been used frequently in
research (e.g., Hu & Ansell, 2007; Becker-Blease, Kaen, Etebari & Baumann, 2010). The
metric has the advantage of allowing comparability across firms without considering their
financing policies. A high margin is preferable as it indicates the amount of sales that is
disposable for interest, taxes and dividends or investments in the firm. For the 17 firms, it
seems that Fenix Outdoor, NetEnt and SkiStar have the highest profitability as measured by
their EBIT margin. As regarding leverage, a high equity ratio means that the leverage is low,
while a low equity ratio indicates that leverage is high. Statistics from SCB (2019) shows that
the average equity ratios for firms within the industries retail, education, gaming and vehicle
service ranges between approximately 30-40 percent. The ratio is slightly lower for airline
and travel and leisure companies, with the average being 10-20 percent. Table 4 displays that
the equity ratio for many firms is around their industry average. However, for Boozt, Clas
Ohlson, Fenix Outdoor, H&M, Internationella Engelska Skolan, NetEnt, Nobia, Scandic and
SkiStar the ratio is a bit higher. It can also be noted that even though H&M historically have
had a rather high EBIT margin and equity ratio, these ratios have decreased steadily.
Similarly, it can be seen that the profitability at Byggmax also has decreased considerably
during the three past years.
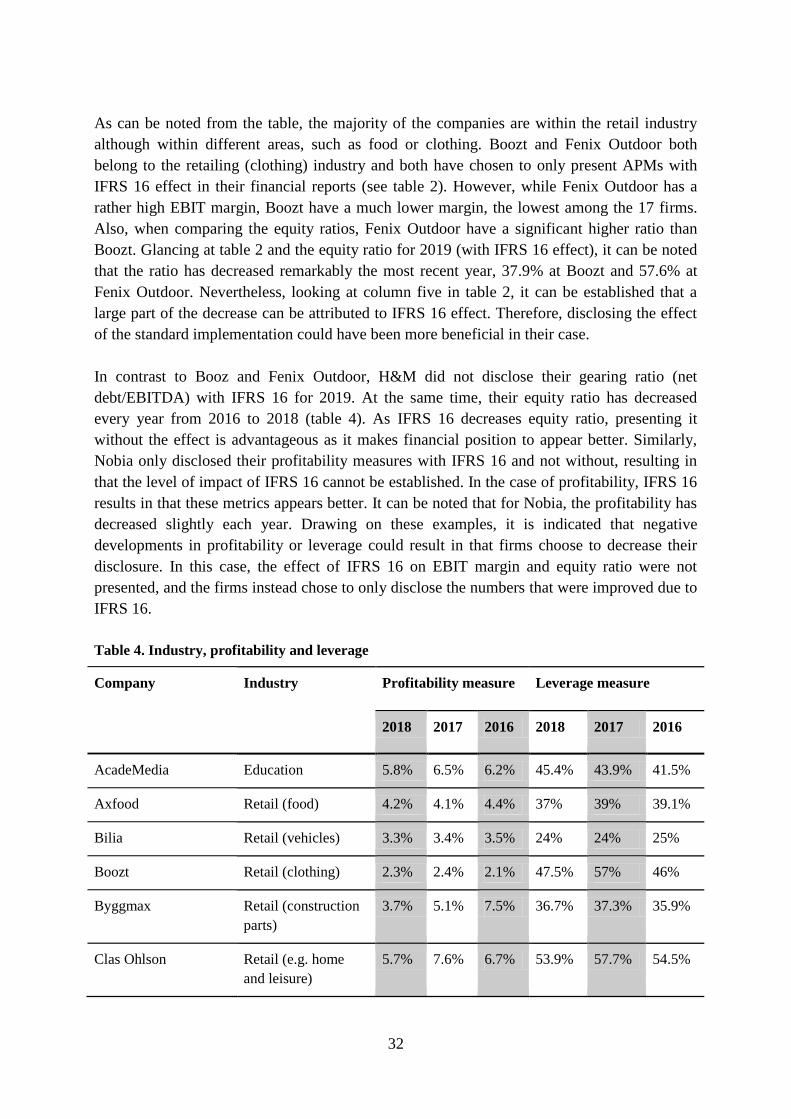
32
As can be noted from the table, the majority of the companies are within the retail industry
although within different areas, such as food or clothing. Boozt and Fenix Outdoor both
belong to the retailing (clothing) industry and both have chosen to only present APMs with
IFRS 16 effect in their financial reports (see table 2). However, while Fenix Outdoor has a
rather high EBIT margin, Boozt have a much lower margin, the lowest among the 17 firms.
Also, when comparing the equity ratios, Fenix Outdoor have a significant higher ratio than
Boozt. Glancing at table 2 and the equity ratio for 2019 (with IFRS 16 effect), it can be noted
that the ratio has decreased remarkably the most recent year, 37.9% at Boozt and 57.6% at
Fenix Outdoor. Nevertheless, looking at column five in table 2, it can be established that a
large part of the decrease can be attributed to IFRS 16 effect. Therefore, disclosing the effect
of the standard implementation could have been more beneficial in their case.
In contrast to Booz and Fenix Outdoor, H&M did not disclose their gearing ratio (net
debt/EBITDA) with IFRS 16 for 2019. At the same time, their equity ratio has decreased
every year from 2016 to 2018 (table 4). As IFRS 16 decreases equity ratio, presenting it
without the effect is advantageous as it makes financial position to appear better. Similarly,
Nobia only disclosed their profitability measures with IFRS 16 and not without, resulting in
that the level of impact of IFRS 16 cannot be established. In the case of profitability, IFRS 16
results in that these metrics appears better. It can be noted that for Nobia, the profitability has
decreased slightly each year. Drawing on these examples, it is indicated that negative
developments in profitability or leverage could result in that firms choose to decrease their
disclosure. In this case, the effect of IFRS 16 on EBIT margin and equity ratio were not
presented, and the firms instead chose to only disclose the numbers that were improved due to
IFRS 16.
Table 4. Industry, profitability and leverage
Company Industry Profitability measure Leverage measure
2018 2017 2016 2018 2017 2016
AcadeMedia Education 5.8% 6.5% 6.2% 45.4% 43.9% 41.5%
Axfood Retail (food) 4.2% 4.1% 4.4% 37% 39% 39.1%
Bilia Retail (vehicles) 3.3% 3.4% 3.5% 24% 24% 25%
Boozt Retail (clothing) 2.3% 2.4% 2.1% 47.5% 57% 46%
Byggmax Retail (construction
parts)
3.7% 5.1% 7.5% 36.7% 37.3% 35.9%
Clas Ohlson Retail (e.g. home
and leisure)
5.7% 7.6% 6.7% 53.9% 57.7% 54.5%
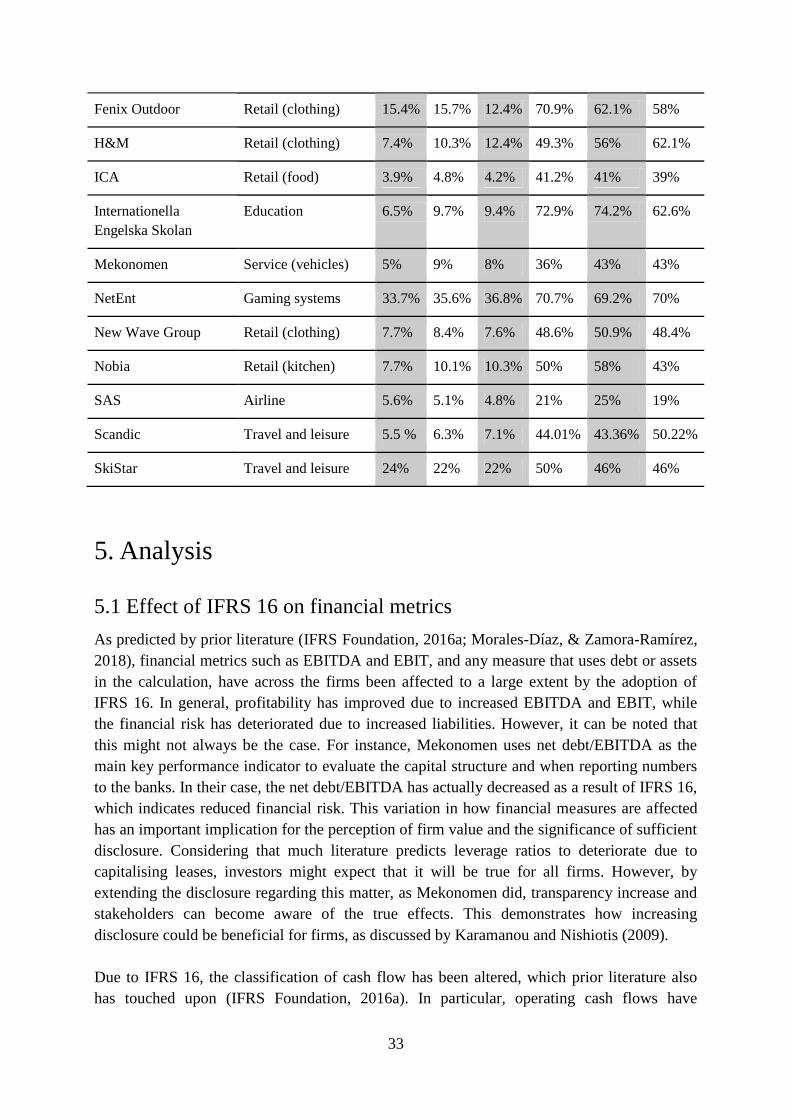
33
Fenix Outdoor Retail (clothing) 15.4% 15.7% 12.4% 70.9% 62.1% 58%
H&M Retail (clothing) 7.4% 10.3% 12.4% 49.3% 56% 62.1%
ICA Retail (food) 3.9% 4.8% 4.2% 41.2% 41% 39%
Internationella
Engelska Skolan
Education 6.5% 9.7% 9.4% 72.9% 74.2% 62.6%
Mekonomen Service (vehicles) 5% 9% 8% 36% 43% 43%
NetEnt Gaming systems 33.7% 35.6% 36.8% 70.7% 69.2% 70%
New Wave Group Retail (clothing) 7.7% 8.4% 7.6% 48.6% 50.9% 48.4%
Nobia Retail (kitchen) 7.7% 10.1% 10.3% 50% 58% 43%
SAS Airline 5.6% 5.1% 4.8% 21% 25% 19%
Scandic Travel and leisure 5.5 % 6.3% 7.1% 44.01% 43.36% 50.22%
SkiStar Travel and leisure 24% 22% 22% 50% 46% 46%
5. Analysis
5.1 Effect of IFRS 16 on financial metrics
As predicted by prior literature (IFRS Foundation, 2016a; Morales-Díaz, & Zamora-Ramírez,
2018), financial metrics such as EBITDA and EBIT, and any measure that uses debt or assets
in the calculation, have across the firms been affected to a large extent by the adoption of
IFRS 16. In general, profitability has improved due to increased EBITDA and EBIT, while
the financial risk has deteriorated due to increased liabilities. However, it can be noted that
this might not always be the case. For instance, Mekonomen uses net debt/EBITDA as the
main key performance indicator to evaluate the capital structure and when reporting numbers
to the banks. In their case, the net debt/EBITDA has actually decreased as a result of IFRS 16,
which indicates reduced financial risk. This variation in how financial measures are affected
has an important implication for the perception of firm value and the significance of sufficient
disclosure. Considering that much literature predicts leverage ratios to deteriorate due to
capitalising leases, investors might expect that it will be true for all firms. However, by
extending the disclosure regarding this matter, as Mekonomen did, transparency increase and
stakeholders can become aware of the true effects. This demonstrates how increasing
disclosure could be beneficial for firms, as discussed by Karamanou and Nishiotis (2009).
Due to IFRS 16, the classification of cash flow has been altered, which prior literature also
has touched upon (IFRS Foundation, 2016a). In particular, operating cash flows have
34
increased whereas financial cash flows have decreased. According to Penman (2013), only
operational and investing activities create value and not financial activities. The fact that the
operating cash flows have increased for many companies as a result of IFRS 16 (e.g. Bilia,
Clas Ohlson and ICA) might indicate that the old accounting standard IAS 17 underestimated
the value of operational activities, under the assumption that the classification according to
IFRS 16 is more correct than IAS 17. Thus, although changes in accounting principles do not
increase the underlying value of the firm, the transition to IFRS 16 can help financial report
readers distinguish between value generating and non-value generating activities through the
reclassification of cash flows, and in that way affect the estimation of firm value. With this
reasoning, adopting new accounting standards may in some instances, as in this case, lead to
higher estimations of firm value. It can be suggested that firms who use leases more
extensively might benefit more from IFRS 16 because they experience most increases in
operating cash flows.
IFRS Foundation (2016a) anticipated that the airline, retailing, travel and leisure and transport
industry would experience the largest effect on their balance sheet. However, AcadeMedia
and Internationella Engelska Skolan, who is operating within the education sector (see table 4
for industry grouping of the firms), seem to have had even higher impact on balance total. We
argue that these expectations of IFRS 16 effect could potentially influence disclosure. For
example, AcadeMedia only disclosed their equity ratio without IFRS 16. If stakeholders do
not expect the ratio to be severely affected, they might not bother with recalculating it. In that
way, firms that are not anticipated to be affected could intentionally be less transparent in
their disclosure, as stakeholders might not demand any additional information. But when we
calculated AcadeMedia‘s equity ratio into including IFRS 16, it could be established that it
decreased to a rather low 28.1 percent (table 2). This shows that knowing the effect of IFRS
16 could be even more material for financial report readers when the actual effect deviates
from the anticipated effect. In this case, the large effect on firms within education was not
anticipated.
5.2 Restatements and disclosure choices about financial measures
It can be established that, in general, displaying the effect of IFRS 16 on APMs seems to be of
value for majority of the firms as 15 of the 17 studied firms presented at least some
recalculated measures in their financial reports. Many of the firms thoroughly described the
increase or decrease in financial metrics for the fiscal year that IFRS 16 was implemented. An
understanding of how IFRS 16 affects key performance measures was hence made possible in
most cases. Nevertheless, all firms have chosen the modified retrospective approach when
applying IFRS 16. This restatement pattern found for IFRS 16 adoption thus seem to be in
accordance with what Verriet et al. (2013) noted for IFRS implementation, namely that firms
tend to be transparent about the changes but rarely present recalculated numbers for multi-
year comparisons. The reason why these firms chose to apply the retrospective method is
seemingly because they consider the cost of recalculating all historical numbers to be too
large. The amount of information disclosed is affected by the benefits and costs associated
with providing additional content, and additional content are only presented if the benefits
35
exceed the costs (Revsine et al., 2017). As such, recalculated numbers for historical years
does not seem to bring too large benefits. However, they seem to see benefits with
recalculating this year's financial metrics. This implies that firms are concerned about how
investors might perceive them, otherwise they would not have recalculated any metrics at all
as it requires much resources.
Although most firms recalculated their numbers, there were still some variations across the
firms as Boozt and Fenix Outdoor did not present any recalculated APMs at all. Since cost-
benefit analysis is necessary when deciding level of disclosure, any additional recalculated
financial metric should increase the cost for the firm. As such, those that do not present
recalculated numbers presumably assess that it is not necessary to clarify changes in financial
metrics that are caused by IFRS 16. A plausible explanation for not recalculating financial
metrics is that retail companies, such as Boozt and Fenix Outdoor, believe that financial
report readers can see through the accounting and that it hence is unnecessary to spend
additional resources on restatements. This could be in line with the findings of Giner and
Pardo (2018) who found that capitalisation of leases in the retail industry does not change
investors' assessment of firm value, because in investors‘ calculations, they have already
taken into account the operating leases by looking in the notes.
However, there were also findings that support the suggestions made by Sengupta and Wang
(2011), namely that liabilities disclosed on the balance sheet affects valuation more than
liabilities disclosed in the notes, and that capitalising leases hence is of value for readers of
financial reports. For instance, SAS decided to issue hybrid bonds in order to improve their
equity ratio. This was explained to be a direct consequence of IFRS 16 implementation. The
fact that SAS took measures to mitigate the effects of IFRS 16 suggests that they consider
disclosures in the balance sheet to have more significance than disclosures in the notes. If they
were not concerned about how financial report readers would perceive them after the adoption
of IFRS 16, they would not have been bothered to take such actions. Additionally,
Mekonomen stated that the numbers for their net debt/EBITDA is reported to their creditors
without IFRS 16 effect. Since the debt covenants are reported without lease liabilities, it
indicates that stakeholders such as banks do not concern liabilities disclosed in notes, and
instead agreed upon numbers on the financial statements only when the debt covenants were
signed. However, as IFRS 16 moves the lease liabilities from the notes to the financial
statements, creditors will presumably demand new terms in their debt covenants. As Revsine
et al. (2017) noted, stakeholders can use information in financial reports to negotiate better
contracts with firms. Considering that Mekonomen highlighted this issue in their report, it
indicates that there is an awareness of that IFRS 16 can result in changed probability of
violating debt covenants.
5.2.1 The influence of IFRS 16 effect, corporate governance, profitability and
leverage on disclosure
The lack of regulation for APMs results in that there is less uniformity regarding disclosure
for them. In addition to the cost-benefit explanation for the variation between firms, factors
36
such as the magnitude and direction of the effect of new accounting standards, and a
company‘s corporate governance, profitability and leverage might be particularly influencing
for APMs, which prior literature has discussed in connection to IFRS implementation.
As regarding the effect of IFRS 16, it was established that profitability ratios are positively
affected, while gearing ratios commonly are negatively affected. Considering the suggestions
by Gallery et al. (2008), more information about effects on leverage impact could therefore be
expected. However, examples of the opposite behaviour could be found among the firms. For
instance, NetEnt disclosed the effect of IFRS 16 for EBIT but not for the equity ratio. This is
contradicting since a thoroughly description of the IFRS 16 consequences and extensive
information about debt would be more beneficial. By highlighting IFRS 16 effect, firms can
show their stakeholders that changes in for example gearing ratios are solely due to the
accounting effect of IFRS 16 and not because of poor performance. However, there might be
a rational explanation behind NetEnt‘s behaviour. If a firm have unsatisfying leverage, they
could instead have incentives to decrease disclosures and transparency. If they want to
increase their borrowings and attribute it to the implementation of IFRS 16, similar to ―big
bath accounting‖ (Penman, 2013), it is wiser to not disclose the effect. If there is no
information about how large the impact of IFRS 16 is on the leverage ratio, firms could
increase their borrowings excessively and refer a part of it as ―increase in leverage due to
IFRS 16 effect‖, without the reader knowing how much of it actually is due to IFRS 16.
Moreover, instead of disclosing the effects on gearing ratios, firms could present more
information about profitability measures in order to shift the focus. In the case of NetEnt, their
equity ratio has historically been rather high compared to the industry, being around 70
percent (as can be seen in table 4). But the ratio has decreased substantially for year 2019, as
table 2 shows that their equity ratio (with IFRS 16 effect) decreased to 23 percent. Despite
this, they did not present the effects of capitalising leases. Such contradictions to the
anticipated disclosure choices should raise some awareness when analysing financial
statements, as management incentives might be the underlying reason for the disclosure
behaviour. In fact, as can be seen in column five in table 2, which comprises our own
calculations of the APMs, it is noted that even without IFRS 16 effect NetEnt‘s equity ratio is
still at a low 24.4 percent. When looking at their balance sheet in their annual report, it can
indeed be noted that they have increased their borrowings from banks by approximately 565%
in relation to previous year‘s total liabilities, which further strengthen the indication that big
bath accounting might not only be related to manager shifts, but also could be applicable in
conjunction with accounting standard transitions.
As for corporate governance and its impact on disclosure amount and quality, we found some
support for the relationship Verriest et al. (2013) and Gallery et al. (2008) described. Axfood
stated that they have reviewed IFRS 16 implementation in their internal control. At the same
time, they had rather extensive disclosure regarding effects on target setting and various
APMs. For instance, only Axfood and New Wave Group presented the effect of IFRS 16 on
profitability measures for their segments. It thus seems that for IFRS 16 adoption, corporate
governance could have an influencing role. But corporate governance comprises many
components, such as internal control and risk management. Hence, to enhance the
37
understanding of the relationship between corporate governance and accounting quality
during standard changes, investigating how each component is influential for disclosure
choices is needed.
Looking at the historical development of profitability or leverage might also explain
disclosure choices. Palmer (2005) states that profitable firms tend to have more disclosure
during standard transition as compared to less profitable firms. Less profitable firms might
want to hide certain numbers, and indications for this could be noted. For instance, Nobia can
be considered to have had a rather satisfying overall profitability during the past years.
However, as can be seen in table 2, the ratio has decreased each year, with a larger decreased
between 2017 and 2018. When presenting EBIT margin in the annual report for 2019, which
only is done including IFRS 16, the ratio first appears to have increased and the trend of
decreasing profitability is perceived to be reversed. However, when scrutinising their financial
numbers and calculating EBIT margin without IFRS 16 (see last column, table 2), it is clear
that the ratio is fixed at 7.7 percent, which is the same level as 2018. The same can be noted
for the leverage aspect. H&M did not present their leverage ratio with IFRS 16, and stated
that they would not do so for the financial reports in the near future. As was mentioned, their
equity ratio has decreased the past years. Thus, decreasing profitability or increasing leverage
in a firm could influence disclosure choices. These findings highlight the importance of
understanding firms‘ profitability and leverage trends in order to detect management
incentives of only disclosing positive numbers.
However, although IFRS 16 effect, profitability, leverage and corporate governance can partly
determine disclosure quality, it became somewhat apparent that these cannot be investigated
in isolation from each other as it would not fully explain the firms‘ disclosure choices. For
instance, Fenix Outdoor and SkiStar both have had quite high profitability and equity ratios
lately. But while SkiStar presented financial measures both with and without IFRS 16, Fenix
Outdoor did not. Similarly, while Boozt and Fenix Outdoor have similar disclosure patterns,
their profitability level was not too similar. Fenix Outdoor have recently had a quite strong
profitability compared to industry peers, whereas the measure for Boozt has been a bit lower.
Considering that Boozt and Fenix Outdoor have rather different profitability ratios, but still
share similar disclosure patterns, other factors than profitability might be more important in
their case. Indeed, as can be noted from table 4, they both have a quite high equity ratio.
Leverage therefore potentially could be a relatively stronger determinant for these two firms.
This calls for further investigation about how combinations of determinants, such as
profitability in combination with leverage, can influence disclosure. It is important to
incorporate all possible factors and weigh the importance of each aspect in order to
understand the relationship between these determinants and disclosure choices.
5.2.2 Disclosure choices and the implications for accounting quality and
financial statement analysis
As was described, comparability as an accounting quality comprises of both comparison
between firms, and within a firm over a time horizon (Runesson et al., 2018). By restating
38
APMs into numbers without IFRS 16 effect, time-series analyses are made possible as
historical numbers commonly are disclosed without IFRS 16. But even though the majority of
the companies are presenting recalculated financial metrics for the current year and enable
readers of financial reports to make some sort of comparisons over time, this is not the most
ideal approach. This is because a substantial part of the debts is disregarded in these financial
metrics, as they are based on IAS 17. Hence, we argue that faithful representation is
compromised when readers are not able to compare financial metrics with effect of IFRS 16
over time. In order to achieve both faithful representation and comparability, the financial
metrics for the past few years have to be recalculated according to IFRS 16. But none of the
firms recalculated historical metrics into including IFRS 16, as all applied the modified
retrospective approach. However, an exception was ICA who recalculated numbers for fiscal
year 2018. By stating the previous year‘s financial metrics according to IFRS 16, ICA makes
it possible for their financial report readers to make faithfully represented comparisons
between two years. This approach enables comparability, although for very short periods,
while allowing companies to be transparent about their lease liabilities. Nevertheless, as can
be established from ICA‘s five-year comparative graph for operating cash flow (figure 1),
IFRS 16 had a quite large effect on the numbers for 2018. These effects certainly make it
more difficult to assess the development of performance over time. Readers of financial
reports will need to make their own adjustments when analysing numbers from more than two
year backwards. But it is important to emphasise that these issues presumably only are issues
during the period of the accounting standard transition. For instance, five-years after IFRS 16
implementation, ICA‘s operating cash flow graph will naturally only contain numbers with
IFRS 16 effect.
In addition to time-series analysis, cross company analysis might also be distorted by the
change to IFRS 16. Pardo and Giner (2018) suggested that with all leases being capitalised,
performance should appear similar regardless of how the assets has been financed. However,
it can be noted that the disclosure of APMs did vary. For instance, H&M presented the metric
net debt/EBITDA without IFRS 16 effect, while Clas Ohlson, ICA, Internationella Engelska
Skolan and Mekonomen included IFRS 16 effect for the same ratio in their disclosures. As a
consequence of this variation, comparability between firms could become deteriorated during
the transition period. If some firms present their APMs with IFRS effect and some presents
them without, users of financial reports must be cautious and pay close attention to which
financial measures include IFRS 16 and which do not. Also, it is important to note that
financial metrics look better for the companies that have broken fiscal year, such as
Academedia and SAS, since EBITDA is presented with IFRS 16 effect, while leverage ratios
are presented without IFRS 16 effect. This is the case because IFRS 16 usually has a positive
effect on the former and a negative effect on the latter. As mentioned before, the calculations
of the metrics are different because the performance measures are based on trailing income
statements, which means that both companies will not be able to report these financial metrics
with IFRS 16 effect until fiscal year 2020/2021 as they have not recalculated historical
metrics to be in accordance with IFRS 16. This again requires financial report readers to pay
more attention to how APMs are calculated. Also, as regarding the segment reporting, only
Axfood and New Wave Group had APMs with IFRS 16 effect. The fact that other companies
39
do not report segments according to IFRS 16 can have implications for the accounting quality
since IFRS 16 is not consistently applied throughout the report. It is also important to note
that different ways of disclosing information about segments can make comparisons between
firms more difficult.
5.3 IFRS 16 influence on internal processes
IFRS 16 do not result in any actual change in the business, but merely changes the accounting
of leases and should therefore not affect firm value (Penman, 2013). However, it could be
noted that changed requirements in accounting standards might induce changes in internal
processes. As was discovered, SAS decided to put more focus and resources into their
exchange-rate hedging. The change in risk management at SAS could in a sense illustrate the
value of showing good performance on financial reports. Firms seemingly consider that how
they are displayed on financial statements is highly important, to the extent that they are ready
to spend more resources in order to improve financial measures. In the case of SAS, the
exchange-rate fluctuations have always been present, however, the difference is that the
effects are now more apparent. As a response to this, firms can choose to take measures to
mitigate the effects of adopting the new standard. The transition to IFRS 16 could thus cause
changes in resource disposition. With more effort being put on hedging exchange-rate, the
costs for SAS increase. Another interesting finding was that changes in financial reporting
requirements have reduced the average cost of capital at Nobia due to the increased debt. If
the same cost of capital is used for capital budgeting, it might have consequences for the
assessment of profitability. This in turn can affect the investment plans in the company, which
may also require more attention and resources by firms. This, in turn, could cause real effects
on firm value. Therefore, IFRS 16 can indirectly alter value creation and by that affecting
stakeholders‘ analysis of financial statement. Stakeholders need to be aware of that
accounting standards could alter firm value, and actively pay attention to these type of
disclosure in financial reports, in order to analyse and predict future performance.
Furthermore, an example of the behaviour Wang and Welker (2011) discussed, regarding
timing of equity issuance in advance of standard change, could also be found. SAS declared
that they issued bonds as a response to IFRS 16. As the risk of default partly influences the
price of bonds, and IFRS 16 increases financial risk, it can be considered that issuing bonds
before the implementation is more beneficial. This finding supports the suggestions that
information asymmetry increases in conjunction with standard transitions (Wang and Welker,
2011). However, it is important to reckon that SAS actually was transparent regarding this
matter. The information was stated in the annual report and investors could easily retrieve this
information. It can therefore instead be suggested that it is those firms that do not disclose this
type of information that stakeholders should be cautious about when conducting analyses.
5.4 Influence of IFRS 16 on performance evaluation
All companies have some type of targets that are used to evaluate performance. Since IFRS
16 has led to changes in several key financial metrics, it has also affected control activities in
40
the organisations. As we have seen, there are mainly two methods that can be used to deal
with IFRS 16 when it comes to performance evaluation. Five companies have adjusted or at
least planned to adjust their targets that are used for evaluation of firm performance, while
seven other companies have chosen to report targets without the effect of IFRS 16. The
advantage of presenting targets excluding IFRS 16 effect is that the targets are unchanged,
and stakeholders can be certain that the evaluation will be unaffected by the change in the
accounting standard, assuming that the performance is also measured without IFRS 16 effect.
Because, as might be expected, it can be very problematic if the targets are defined without
IFRS 16 effect while the performances are measured according to IFRS 16. However,
adjusting the targets could also be beneficial as measures with IFRS 16 effect should,
according to IASB, reflect the business better. Although, there is a risk that the adjustment
could be done unfairly when revising targets. For instance, companies can set lower targets
consciously so they can achieve the targets easier and meet the expectations of stakeholders.
IFRS 16 can thus be used as an excuse to adjust the targets, which may mislead stakeholders
in their estimation of firm value. Moreover, while Nobia‘s leverage targets are measured
without IFRS 16 effect, their profitability target is measured with IFRS 16. This creates an
inconsistency in how fulfillment of financial targets is evaluated and could complicate
stakeholders‘ evaluation of target achievement in firms. These issues can also be related to
what Pope and McLeay (2011) and Wang and Welker (2011) described, that information
asymmetry could be especially exploited during IFRS transition. A third method that can be
used to deal with performance evaluation, which is less popular among the companies, is
illustrated by Byggmax who changed their target from EBITDA to EBITA. In addition to the
change of measure, they also made changes to the target level. Considering that ESMA (2015)
advocates consistency for APMs, this change of target measure can result in that accounting
quality decreases.
Interestingly, even though most companies adjusted the targets at firm level, the targets for
bonus programmes were commonly not changed and performance was instead evaluated
based on measures without IFRS 16. Joos and Leung (2013) suggested that if firms perceive
standard changes to be enhancing quality of measures, these will be more extensively used in
bonus programmes. Bearing in mind that there were firms, such as Fenix Outdoor, who chose
to maintain old targets and instead measure performance with numbers without IFRS 16, it
indicates that some firms might not consider IFRS 16 implementation to increase the quality
of financial measures. A plausible explanation for the bonus programmes and evaluation
remaining unchanged is that firms strive to prevent management to act opportunistically when
asymmetrical information is likely to be present.
6. Discussion
In order to understand how IFRS 16 affects the financial performance and position of the
firms, disclosure about the effect of IFRS 16 on financial metrics is needed. However, as was
shown in table 2, many companies have chosen to not recalculate some of their performance
measures. Therefore, we attempted to make our own calculations of those missing metrics to

41
see if it is possible to compute them by ourselves. We managed to calculate all the metrics
except for those that use trailing numbers in their calculations (see table 2). Although all
information needed was available in the financial reports, the information was dispersed in
different parts of the report which made it difficult and time consuming to find all the
necessary information. Important to mention is that leasing that previously were categorized
as finance leases have no effect on the restatements of the financial metrics because they have
always been recognized as assets on the balance sheet, even prior to IFRS 16. This means that
the recalculations of some measures such as equity ratio and ROE can be inaccurate if the
companies have finance leases that they do not specify in their financial reports, because it is
presented as a lump sum incorporated in the total right of use assets. Along the same line, if
the amount of right of use assets that have been reclassified from certain items, such as
intangible fixed assets, is not disclosed in the financial reports, it will be difficult to know
how much of the asset increase that is due to IFRS 16, which can lead to incorrect
recalculations of for instance ROA. For measures such as EBIT and EBITDA, information
about the depreciation costs and interest expenses that are attributable to operating leases is
needed in order to make accurate recalculations. But this information might not be available if
the expenses for operating and finance leases are presented as a lump sum. It is therefore
especially important to pay attention to all the details regarding what the numbers are
composed of. However, under the assumption that the amount of finance leases is small and
that all reclassifications of right of use assets are specified in the financial reports, the
deviations are insignificant. In our case, this was less of a problem since no companies among
those we made recalculations for had a material amount of finance leases. This means that
when information about the effect of standard changes on APMs is not disclosed, users of
financial reports should in most cases be able to make their own calculations. However, it
could be slightly cumbersome while it also is necessary that some fundamental information
actually is available in the financial reports. One prerequisite is that definitions of APMs are
given, as the way APMs are calculated many times varies between firms and there is no solid
definition. It is important to understand how the measures are calculated in order to make
correct comparisons. A second prerequisite is that a rather deep understanding of how IFRS
16 affects the accounting is required to make these calculations since there are no clear
guidance on how to recalculate the measures.
All in all, we believe that analysts and professional investors who have sufficient knowledge
in accounting and the new standard will not be affected that much by companies not
recalculating all measures as they can utilise information from the financial statements.
Whereas for stakeholders that are not processing financial report information on a frequent
basis, more transparency and more comparable numbers could be quite necessary.
Nevertheless, the fact that it is rather cumbersome and time consuming to make own
recalculations, accounting quality could deteriorate to an extent if no recalculations of APMs
are presented by the firms even if there would be sufficient knowledge among readers of
financial reports. In our study, we have presumed that making recalculations induces cost.
Whether this cost is large or small is less clear. But it can be established that it is a cost that
do need to be accounted for, either by the firms or by their stakeholders, depending on who it
42
is that perform the recalculations. Thus, we believe that differences in disclosure need to be
considered despite that own recalculations many times are possible to carry through.
7. Conclusion
The initiating of new accounting standards aims to enhance accounting quality in a theoretical
sense, however, considering that implementing standards is quite a process, several
implications for disclosure might arise at the transition. This study has explored various
aspects associated with accounting standard implementation and has the purpose of examining
how transition to IFRS 16 might influence the preconditions to make adequate financial
statement analysis. Our findings show that accounting quality, particularly transparency and
comparability, is influenced by the level of disclosure firms make about the effect of IFRS 16.
For instance, we could establish that historical numbers rarely are recalculated into including
IFRS 16. In addition, even though a majority of firms present the effect of IFRS 16 on their
APMs, it was clear that there exist substantial variations in the scope of restatements. While
some firms recalculated in essence all APMs, others presented the effect of IFRS 16 more
inconsistently and, for instance, only showed the effect for leverage ratios. If companies
disclose in different ways, comparisons within and between companies become difficult.
However, this mainly affects those stakeholders who do not have sufficient knowledge of how
IFRS 16 affects the accounting as they might find it difficult to make their own calculations of
the missing metrics. Furthermore, we could see that the amount of information provided is
influenced by several factors. We found indications of that the costs and benefits of supplying
the information, the firm‘s profitability, leverage, corporate governance and the actual impact
of the new standards all potentially influence the level of disclosure made in financial reports.
This ultimately affects the preconditions for conducting analysis of financial statements.
Moreover, we noted that internal activities often are altered due to the transition to IFRS 16.
We found potential evidence of that management incentives could become prominent during
transition, with firms exploiting the increased information asymmetry that is associated with
implementing new accounting standards. It was found that the transition to IFRS 16 for
example can lead to increased borrowings. Therefore, disclosure regarding what actions firms
take when implementing new standards is especially valuable for readers of financial reports
during this period. Furthermore, financial targets and incentives programmes are also
influenced, but in different ways. While targets often were revised, bonus systems often were
not. This calls for close attention of how performance is evaluated as well as what possible
management incentives might be presence. As a financial report reader, it is important to have
an awareness of how these aspects are managed in order to understand the achievement of
targets and to make correct analysis. Finally, our results show that the new leasing standard
may have led to new allocation of resources in the organisation, which may have an indirect
impact on the firm value. If firm value changes as a result of IFRS 16, analysts do not only
need to understand the effects on accounting numbers, but also, they need to understand how
resource disposition changes in order to make correct valuations.

43
In conclusion, we argue that IFRS 16 optimises the preconditions for financial statement
analysis by distinguishing between value generating and non-value generating activities, and
by improving the accounting quality through enhanced transparency and long-term
comparability. However, the usefulness of IFRS 16 is somewhat offset by the decreased
ability to perform trend analysis and financial ratio analysis in the short term, as the
disclosures regarding IFRS 16 effects are quite inconsistent among the studied firms. Through
this study, we have gained insights into choices firms can make in the disclosure during the
transition to IFRS 16. By exploring how transition to a specific accounting standard is
disclosed in firms‘ financial reports, we contribute with new insights to the field of accounting
quality during adoption of new standards. In contrast to much of prior literature, we have
emphasised a specific standard change instead of an accounting regime change, which we
believe is of great value for practitioners in order to use financial reports optimally, but also
for researchers as this field needs more investigation and our paper can bring attention to
accounting standard transition and its related implications. Highlighting these matters could
raise awareness of that disclosure quality associated with transition to new standards is an
important aspect to consider in order to achieve improved overall accounting quality.
Considering the many factors that can influence the preconditions of making financial
statement analysis at transition, it can be established that disclosure quality is of particular
importance during implementation. Especially stakeholders and standard setter need to be
aware of this issue.
Our endeavour was to highlight possible issues regarding accounting standard transitions that
can be investigated further. Several potential areas for future research were found. Firstly, we
could find support for that factors such as profitability, leverage, corporate governance and
the direction of standard effect could influence disclosure quality. However, we were not able
to detect which factors that are most significant. Studying combinations of these influential
factors, for a large selection of companies, in order to see the relative importance of them
could provide useful insights to the prediction of firms‘ disclosure choices. Alternatively, a
study where interviews are conducted with preparers of financial reports would also be
insightful in order to understand the reasoning of disclosure decisions more in detail.
Secondly, it was apparent that financial targets have been altered for many companies. We
believe that interesting findings could be discovered by conducting an in-depth study of how
the evaluation of company performance has been influenced by IFRS 16. What could be
looked into more closely is how targets have changed, how the evaluation is made and the
logic behind these choices. Interesting is also to investigate how changes in the performance
evaluation, due to accounting standard changes, could affect the motivation of employees.
Thirdly, examining corporate initiatives taken to reduce the impact of accounting effects
needs more investigation in order to understand management incentives. This kind of study
would contribute with new knowledge regarding how companies respond to changes in
accounting and how their incentives can be detected. Lastly, it has been revealed that the cost
of capital could be affected by IFRS 16. The increased liabilities reduce the average cost of
capital as debt is cheaper than equity. If the same cost of capital is used for both financial
accounting and management accounting, IFRS 16 can have consequences for investment
calculations and other decisions made based on it. A suggestion for future research is

44
therefore to investigate how new financial reporting requirements may influence decision-
making in the organisation.
45
References
AcadeMedia. (2019). Delårsrapport juli 2019-mars 2020.
AcadeMedia. (2020). Årsredovisning 18/19.
Akerlof, G. A. (1970). The market for ―lemons‖: Quality uncertainty and the market
mechanism. Quarterly Journal of Economics, 84(3), 488-500.
Altamuro, J., Johnston, R., Pandit, S. and Zhang, H. 2014, ‗Operating Leases and Credit
Assessments‘, Contemporary Accounting Research, 31 (2): 551–80.
Ashton, R. K. (1985). Accounting for finance leases: a field test. Accounting and Business
Research, 15(59), 233-238.
Axfood. (2019). Års- och hållbarhetsredovisning 2018.
Axfood. (2020). Års- och hållbarhetsredovisning 2019.
Beattie, V., Edwards, K., & Goodacre, A. (1998). The impact of constructive operating lease
capitalisation on key accounting ratios. Accounting and Business Research, 28(4), 233-254.
Becker-Blease, J. R., Kaen, F. R., Etebari, A., & Baumann, H. (2010). Employees, firm size
and profitability of US manufacturing industries. Investment Management and Financial
Innovations.
Bhattacharya, N., Desai, H. & Venkataraman, K. (2013). Does earnings quality affect
information asymmetry? Evidence from trading costs. Contemporary Accounting Research,
30(2), 482-516.
Bilia. (2020). Årsredovisning 2019.
Boozt. (2020). Årsredovisning 2019.
46
Breton, G., & Taffler, R. J. (1995). Creative accounting and investment analyst response.
Accounting and Business Research, 25(98), 81-92.
Byggmax. (2019). Årsredovisning 2018.
Byggmax. (2020). Årsredovisning 2019.
Clas Ohlson. (2019). Niomånadersrapport 2019/20.
Clas Ohlson. (2020). Års- och hållbarhetsredovisning 2018/19.
Collis, J., & Hussey, R. (2013). Business Research: A Practical Guide for Undergraduate and
Postgraduate students. Palgrave Macmillan.
Cornaggia, K. J., Franzen, L.A., & Simin, T. T. (2013). Bringing leased assets onto the
balance sheet. Journal of Corporate Finance, 22, 345-360.
Cormier, D., Ledous, M. J., & Magnan, M. (2011). The informational contribution of social
and environmental disclosures for investors. Management Decision, 49(8), 1276-1304.
Cotten, B. D., Schneider, D. K., & McCarthy. (2013). Capitalisation of Operating Leases and
Credit Ratings. Journal of Applied Research in Accounting and Finance, 7(1), 2–17.
Denis, D., & McConnell, J. (2003). International Corporate Governance. Journal of Financial
and Quantitative Analysis, 38(1), 1-36.
Elam, R. (1975). The effect of lease data on the predictive ability of financial ratios. The
Accounting Review, 50(1), 25-43.
ESMA. (2015). ESMA Guidelines on Alternative Performance Measures. European Securities
and Markets Authority.
Fenix Outdoor. (2019). Annual report 2018.
Fenix Outdoor. (2020). Annual report 2019.
47
Fields, T. D., Lys, T. Z., & Vincent, L. (2001). Empirical research on accounting choice.
Journey of accounting and economics, 31(1), 255-307.
Fülbier, R. U., Silva, J. L., & Pferdehirt, M. H. (2008). Impact of lease capitalization on
financial ratios of listed German companies. Schmalenbach Business Review, 60(2), 122-144.
Gallery, G., Cooper, E., & Sweeting, J. (2008). Corporate disclosure quality: lessons from
Australian companies on the impact of adopting International Financial Reporting Standards.
Australian Accounting Review, 18(3), 257-273.
Giner, B., & Pardo, F. (2018). The Value Relevance of Operating Lease Liabilities: Economic
Effects of IFRS 16. Australian Accounting Review, 28(4), 496-511.
H&M. (2020). Årsredovisning 2019.
Hail, L., Leuz, C., & Wysocki, P. (2010). Global accounting convergence and the potential
adoption of IFRS by the US (Part I): Conceptual underpinnings and economic analysis.
Accounting Horizons, 24(3), 355-394.
Haller, A., Ernstberger, J., & Froschhammer, M. (2009). Implications of the mandatory
transition from national GAAP to IFRS—Empirical evidence from Germany. Advances in
Accounting, 25(2), 226-236.
Healy, P. M., Hutton, A. P., & Palepu, K. G. (1999). Stock performance and intermediation
changes surrounding sustained increase in disclosure. Contemporary Accounting Research,
16(3), 485-520.
Hopper, T., Kirkham, L., Scapens, R. W., & Turley, S. (1992). Does financial accounting
dominate management accounting—a research note. Management Accounting Research, 3(4),
307-311.
Houqe, M. N., van Zijl, T., Dunstan, K., & Karim, A. W. (2012). The effect of IFRS adoption
and investor protection on earnings quality around the world. The International journal of
accounting, 47(3), 333-355.
48
Hu, Y. C., & Ansell, J. (2007). Measuring retail company performance using credit scoring
techniques. European Journal of Operational Research, 183(3), 1595-1606.
ICA. (2019). Annual report 2018.
ICA. (2020). Annual report 2019.
IFRS Foundation. (2016a). IFRS 16 Leases. Effects Analysis. London: International
Accounting Standards Board.
IFRS Foundation. (2016b). IFRS 16 Leases. Project Summary and Feedback Statement.
London: International Accounting Standards Board.
IFRS Foundation. (2018). Conceptual Framework for Financial Reporting. London:
International Accounting Standards Board.
IFRS Foundation. (2019). IFRS 16 Leases. London: International Accounting Standards
Board.
Imhoff Jr, E. A., Lipe, R. C., & Wright, D. W. (1991). Operating leases: Impact of
constructive capitalization. Accounting Horizons, 5(1), 51.
Imhoff Jr, E. A., Lipe, R. C., & Wright, D. W. (1997). Operating leases: Income effects of
constructive capitalization. Accounting Horizons, 11(2), 12.
Internationella Engelska Skolan. (2019). Årsredovisning 2018/2019.
Joos, Philip P.M., & Leung, Edith. (2013). Investor perceptions of potential IFRS adoption in
the United States. Accounting Review, 88(2), 577-609.
Joseph, N., Turley, S., Burns, J., Lewis, L., Scapens, R., & Southworth, A. (1996). External
financial reporting and management information: A survey of U.K. management accountants.
Management Accounting Research, 7(1), 73-93.
49
Karamanou, I., & Nishiotis, G. P. (2009). Disclosure and the cost of capital: Evidence from
the market's reaction to firm voluntary adoption of IAS. Journal of Business Finance &
Accounting, 36(7‐8), 793-821.
Kim, S., Kraft, P., & Ryan, S. G. (2013). Financial statement comparability and credit risk.
Review of Accounting Studies, 18(3), 783-823.
Leuz, C., & Verrecchia, R. (2000). The economic consequences of increased disclosure.
Journal of Accounting Research, 38(1), 91-124.
Lim, S. C., Mann, S. C., & Mihov, V. T. (2017). Do Operating Leases Expand Credit
Capacity? Evidence from Borrowing Costs and Credit Ratings. Journal of Corporate Finance,
42, 100-114.
Ling, D. C., Naranjo, A., & Ryngaert, M. (2012). Real Estate Ownership, Leasing Intensity,
and Value: Do Stock Returns Reflect a Firm‘s Real Estate Holdings? Journal of Real Estate
Finance and Economics, 44(1–2), 184-202.
Liu, G., & Sun, J. (2015). Did the mandatory adoption of IFRS affect the earnings quality of
Canadian firms?. Accounting Perspectives, 14(3), 250-275.
Magli, F., Nobolo, A., & Ogliari, M. (2017). Alternative Performance Measures and ESMA
Guidelines: Improving Stakeholders‘ Communication. International Journal of Business and
Management, 12(12), 15-28.
Magli, F., Nobolo, A., & Ogliari, M. (2018). The Effects on Financial Leverage and
Performance: The IFRS 16. International Business Research, 11(8), 76.
Mekonomen. (2020). Årsredovisning 2019.
Morales-Díaz, J., & Zamora-Ramírez, C. (2018). The Impact of IFRS 16 on Key Financial
Ratios: A New Methodological Approach. Accounting in Europe, 15(1), 105-133.
50
NetEnt. (2019). Årsredovisning 2018.
NetEnt. (2020). Årsredovisning 2019.
New Wave Group. (2020). Årsredovisning 2019.
Nobia. (2020). Årsredovisning 2019.
Palmer, P. D. (2005). The impact of adopting AIFRS in Australia: The extent and quality of
disclosures, and their relationship to corporate characteristics. School of Commerce,
Flinders University.
Pardo, F., & Giner, B. (2018). The capitalization of operating leases: Analysis of the impact
on the IBEX 35 companies. Intangible Capital, 14(3), 445-483.
Penman, S. H. (2007). Financial reporting quality: is fair value a plus or a minus? Accounting
and business research, 37(1), 33-44.
Penman, S. (2013). Financial statement analysis and security valuation (5th ed.).
Pope, P. F., & McLeay, S. J. (2011). The European IFRS experiment: Objectives, research
challenges and some early evidence. Accounting and business research, 41(3), 233-266.
Revsine, L., Soffer, L., Johnson, W., Collins, D., & Mittelstaedt, F. (2017). Financial
reporting and analysis (Seventh ed.).
Runesson, E. (2015). Disclosures and judgment in financial reporting essays on accounting
quality under International Financial Reporting Standards. Göteborg: BAS, School of
Business, Economics and Law, University of Gothenburg.
Runesson, E., Samani, N., & Marton, J. (2018). Financial accounting theory: An accounting
quality approach (1st ed.).
51
Sahut, J. M., Boulerne, S., & Teulon, F. (2011). Do IFRS provide better information about
intangibles in Europe?. Review of Accounting and Finance.
SAS. (2020a). Års- och hållbarhetsredovisning 2018/2019.
SAS. (2020b). Kvartalsresultat i linje med guidning 2020.
Scandic. (2019). Års- och hållbarhetsredovisning 2018.
Scandic. (2020a). Definitioner. Available at
https://www.scandichotelsgroup.com/sv/investerare/finansiell-data/definitioner/ (Retrieved:
2020-06-05).
Scandic. (2020b). Års- och hållbarhetsredovisning 2019.
SCB. (2019). Soliditet (procent) efter näringsgren SNI 2007, storleksklass, kvartil och år.
Stockholm: Statistiska Centralbyrån.
Sengupta, P., & Wang, Z. (2011). Pricing of Off-balance Sheet Debt: How Do Bond Market
Participants Use the Footnote Disclosures on Operating Leases and Postretirement Benefit
Plans?. Accounting & Finance, 51(3), 787–808.
SkiStar. (2019). Årsredovisning 2018/2019.
Tan, H., Wang, S., & Welker, M. (2011). Analyst following and forecast accuracy after
mandated IFRS adoptions. Journal of accounting research, 49(5), 1307-1357.
Tanase, A., Calota, T., & Oncioiu, F. (2018). The Impact of IFRS 16 on the Companies' Key
Performance Indicators: Limits, Advantages and Drawbacks. Academic Journal of Economic
Studies, 4(1), 54-59.
US Securities and Exchange Commission. (2005). Report and Recommendations Pursuant to
Section 401(c) of the Sarbanes-Oxley Act of 2002 On Arrangements with Off-Balance Sheet
52
Implications, Special Purpose Entities, and Transparency of Filings by Issuers. Washington:
US Securities and Exchange Commission.
Verriest, A., Gaeremynck, A., & Thornton, D. B. (2013). The impact of corporate governance
on IFRS adoption choices. European accounting review, 22(1), 39-77.
Wang, S., & Welker, M. (2011). Timing equity issuance in response to information
asymmetry arising from IFRS adoption in Australia and Europe. Journal of Accounting
Research, 49(1), 257-307.
Welker, M. (1995). Disclosure policy, information asymmetry, and liquidity in equity
markets. Contemporary Accounting Research, 11(2), 801-827.
Wilkins, T., & Zimmer, I. (1983). The effects of alternative methods of accounting for leases–
an experimental study. Abacus, 19(1), 64-75.

53
Appendix A List of companies from Large cap and Mid cap within consumer industry at Stockholm
Nasdaq, with the effect of IFRS 16 on balance total.
Company IFRS 16 effect on balance total (Increase in right of use
assets/Total assets)
1 AAK 3%
2 AcadeMedia 72%
3 Autolive Not applicable
4 Axfood 48%
5 Betsson 1%
6 Better Collective 2%
7 BHG Group (Bygghemma) 7%
8 Bilia 22%
9 Bonava 2%
10 Boozt 25%
11 Bulten 10%
12 Byggmax 39%
13 Catena Media 2%
14 Clas Ohlson 53%
15 Cloetta 2%
16 Dometic 2%
17 Duni 4%
18 Dustin 5%
19 Electrolux 3%
20 Essity 2%
21 Evolution gaming 9%
22 Fenix Outdoor 28%
23 Gränges 6%
24 H&M 47%
25 Haldex 12%
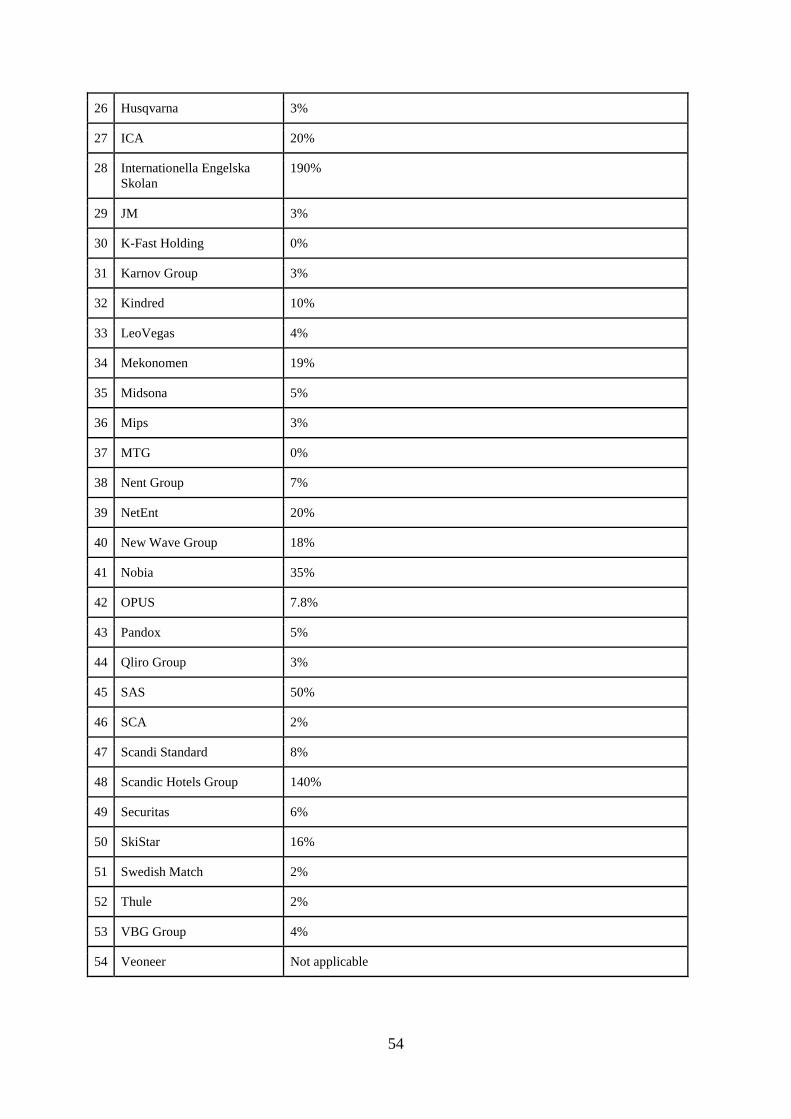
54
26 Husqvarna 3%
27 ICA 20%
28 Internationella Engelska
Skolan 190%
29 JM 3%
30 K-Fast Holding 0%
31 Karnov Group 3%
32 Kindred 10%
33 LeoVegas 4%
34 Mekonomen 19%
35 Midsona 5%
36 Mips 3%
37 MTG 0%
38 Nent Group 7%
39 NetEnt 20%
40 New Wave Group 18%
41 Nobia 35%
42 OPUS 7.8%
43 Pandox 5%
44 Qliro Group 3%
45 SAS 50%
46 SCA 2%
47 Scandi Standard 8%
48 Scandic Hotels Group 140%
49 Securitas 6%
50 SkiStar 16%
51 Swedish Match 2%
52 Thule 2%
53 VBG Group 4%
54 Veoneer Not applicable