Embed Size (px)
Citation preview
Implementing Singapore Implementing Singapore Math in Elementary Math in Elementary
SchoolsSchools
Implementing Singapore Implementing Singapore Math in Elementary Math in Elementary
SchoolsSchoolsJames BadgerJames BadgerDianna SpenceDianna SpenceGregg VelatiniGregg Velatini
Georgia Mathematics Conference Georgia Mathematics Conference 20092009
Friday, October 16Friday, October 16
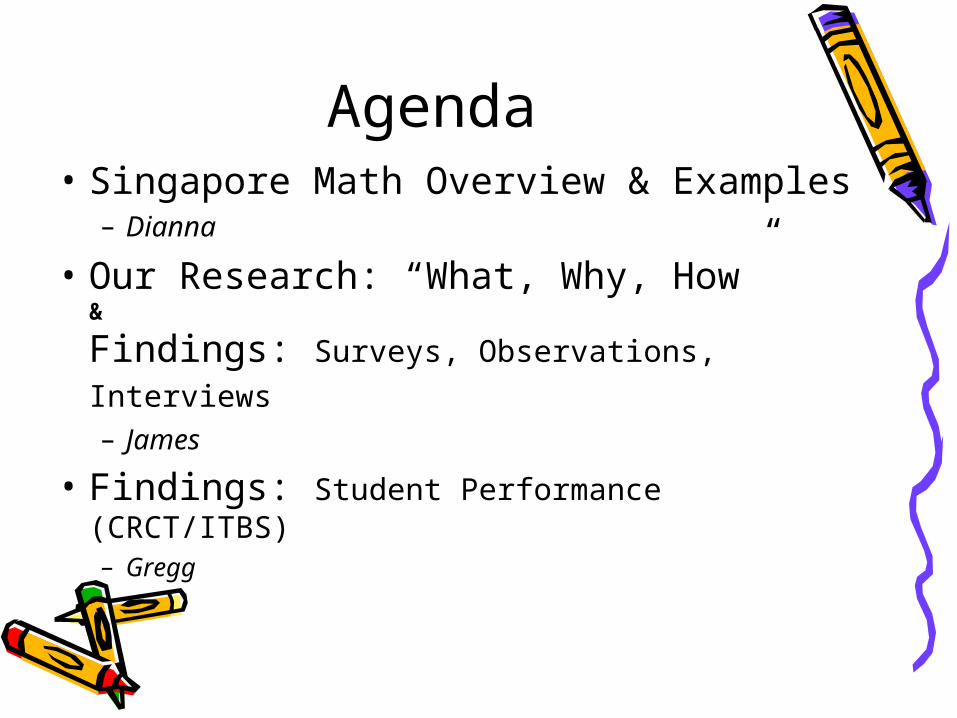
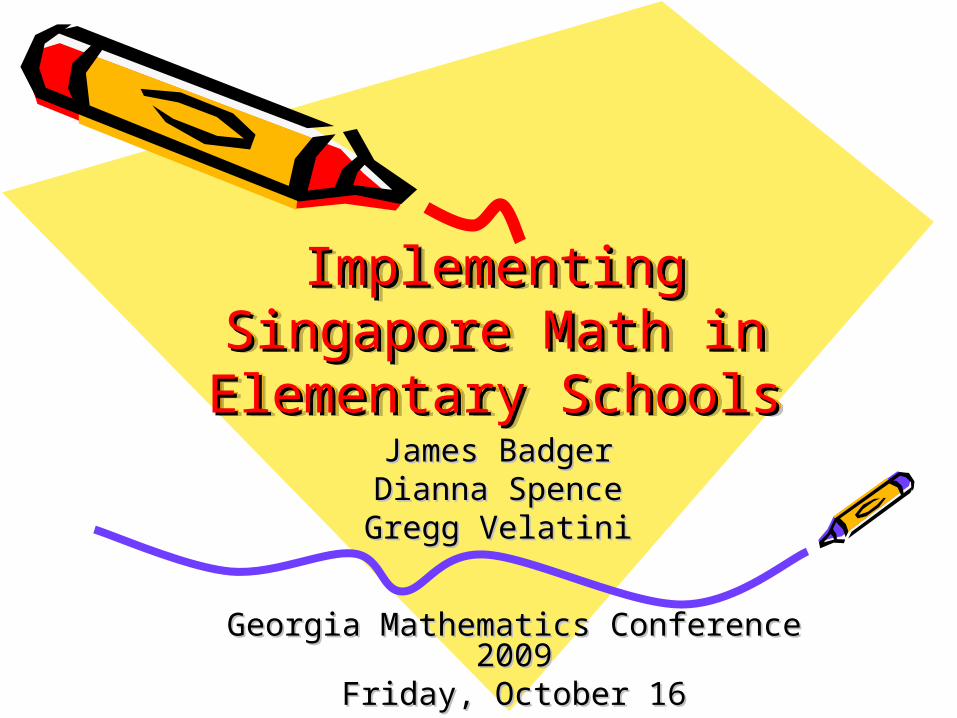
Agenda• Singapore Math Overview & Examples
– Dianna
• Our Research: “What, Why, How”&
Findings: Surveys, Observations, Interviews – James
• Findings: Student Performance (CRCT/ITBS)– Gregg
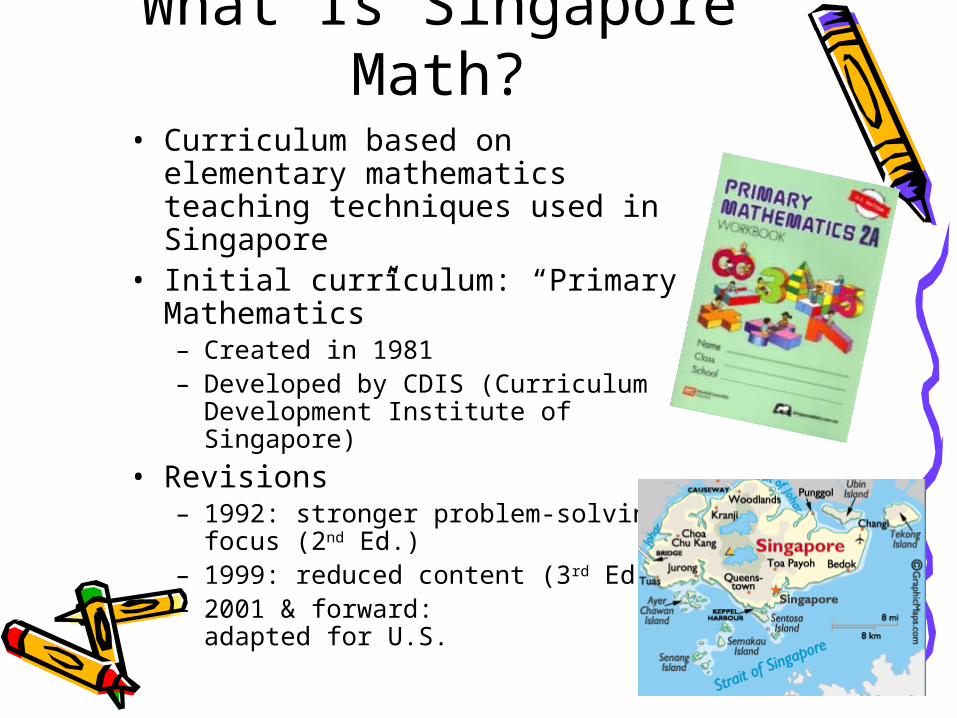
What Is Singapore Math?• Curriculum based on elementary
mathematics teaching techniques used in Singapore
• Initial curriculum: “Primary Mathematics”– Created in 1981– Developed by CDIS (Curriculum
Development Institute of Singapore)
• Revisions – 1992: stronger problem-solving
focus (2nd Ed.)– 1999: reduced content (3rd Ed.)– 2001 & forward:
adapted for U.S.
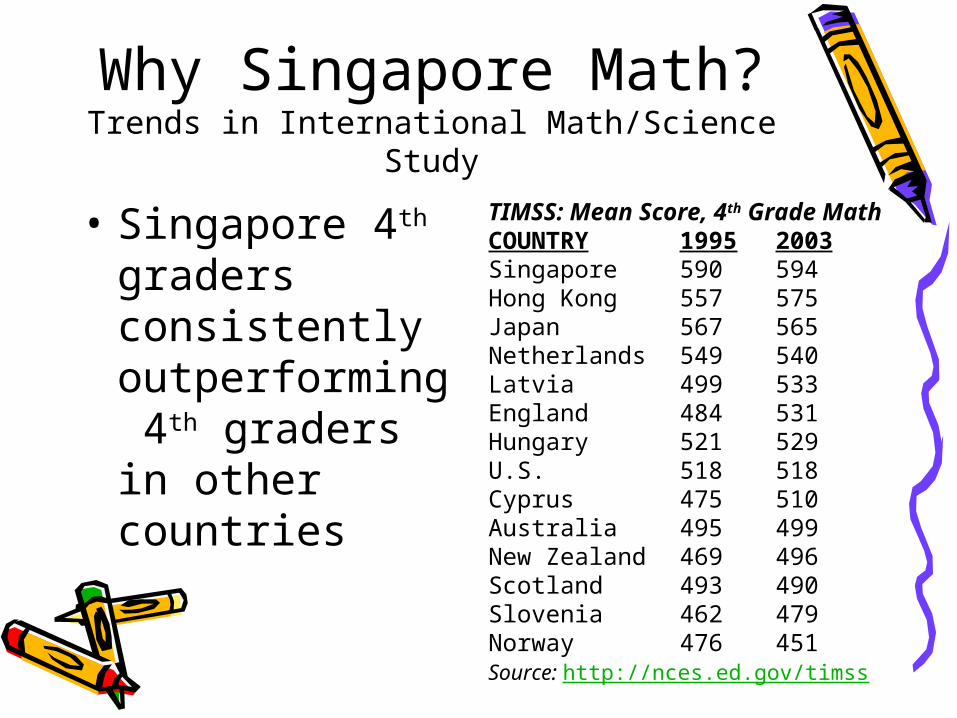
Why Singapore Math?Trends in International Math/Science Study
• Singapore 4th graders consistently outperforming 4th graders in other countries
TIMSS: Mean Score, 4th Grade MathCOUNTRY 1995 2003Singapore 590 594Hong Kong 557 575Japan 567 565Netherlands 549 540Latvia 499 533England 484 531Hungary 521 529U.S. 518 518Cyprus 475 510Australia 495 499New Zealand 469 496Scotland 493 490Slovenia 462 479Norway 476 451Source: http://nces.ed.gov/timss
Characteristics of Singapore Math
• Concrete pictorial abstract approach for each concept
• Strong emphasis on place value• Repetitive drill minimized: topics are
sequenced to reinforce/apply skills • Problem solving based on conceptual
approach rather than memorization of rules, “clue words”
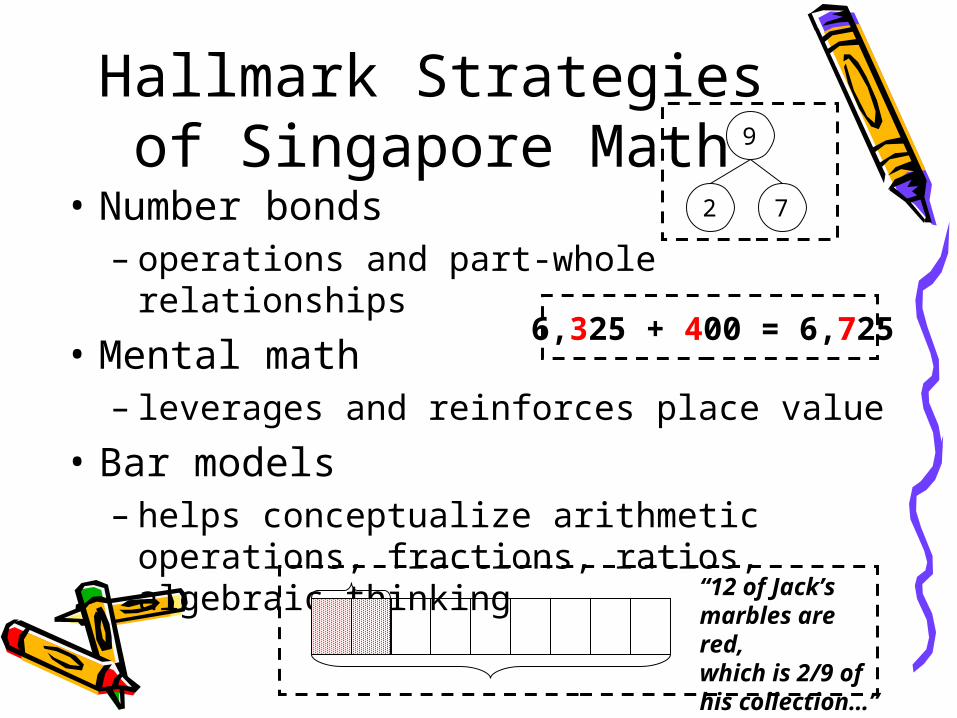
Hallmark Strategies of Singapore Math
• Number bonds– operations and part-whole relationships
• Mental math– leverages and reinforces place value
• Bar models– helps conceptualize arithmetic
operations, fractions, ratios, algebraic thinking
9
2 7
6,325 + 400 = 6,725
“12 of Jack’s marbles are red,which is 2/9 ofhis collection…”
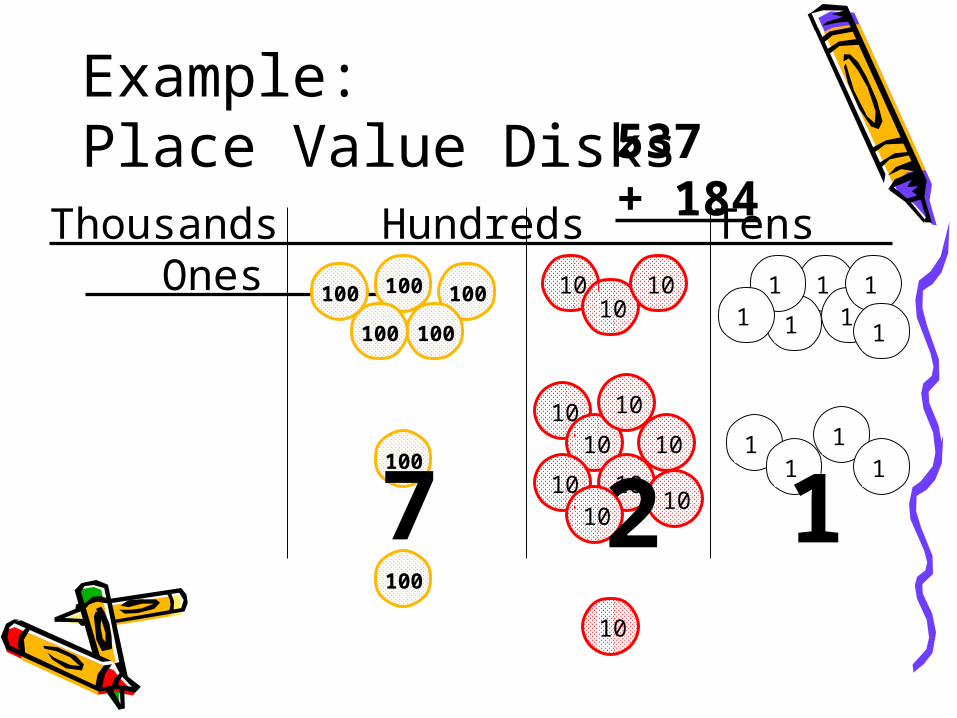
Example: Place Value Disks
Thousands Hundreds Tens Ones . 110100
11
1 1
11
111 1
537+ 184
1010
1010
10
10
10
1010
10
100
100
100100
100
10
100
27 1
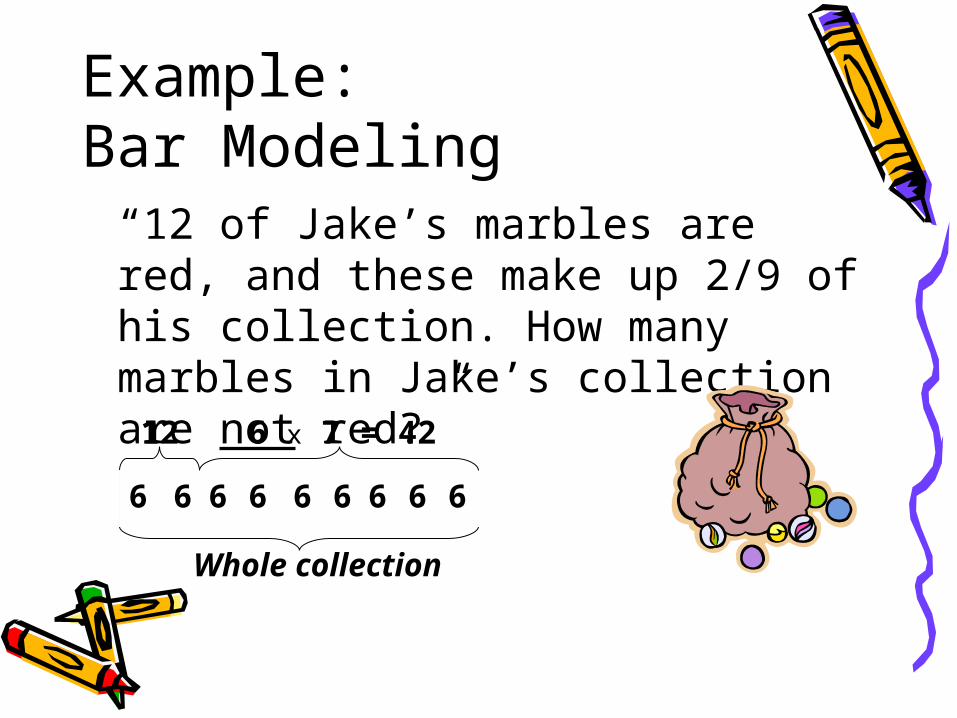
Example:Bar Modeling
“12 of Jake’s marbles are red, and these make up 2/9 of his collection. How many marbles in Jake’s collection are not red?”
666666666
12 6 x 7 = 42
Whole collection
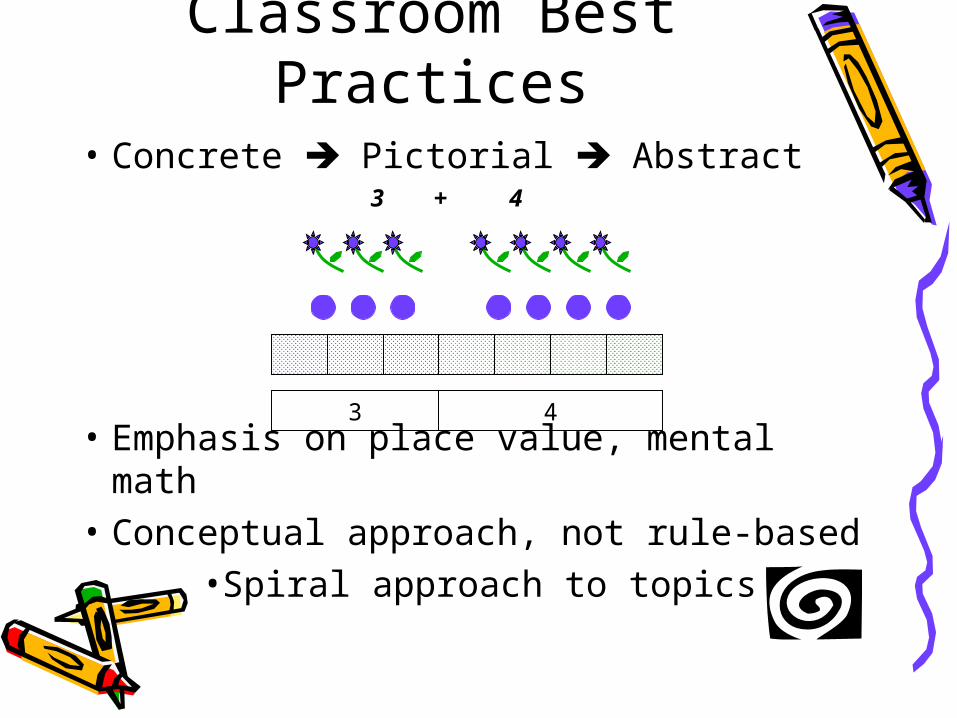
Classroom Best Practices
• Concrete Pictorial Abstract
• Emphasis on place value, mental math
• Conceptual approach, not rule-based•Spiral approach to topics
3 + 4
3 4
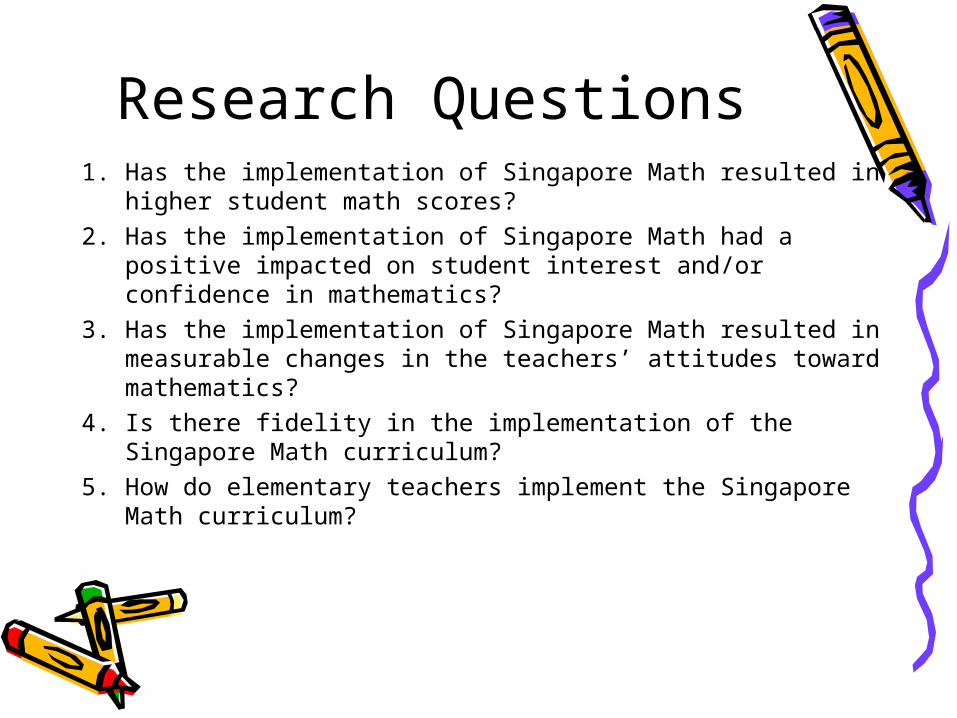
Research Questions1. Has the implementation of Singapore Math resulted in
higher student math scores?2. Has the implementation of Singapore Math had a positive
impacted on student interest and/or confidence in mathematics?
3. Has the implementation of Singapore Math resulted in measurable changes in the teachers’ attitudes toward mathematics?
4. Is there fidelity in the implementation of the Singapore Math curriculum?
5. How do elementary teachers implement the Singapore Math curriculum?
Research Design• County-wide implementation in a
school district in the south-east of the U.S.
• 21 (experimental) and 3 (control) elementary schools– One teacher from each of the 24
schools in K-4 volunteer to participate (first year)
Qualitative and Quantitative Data
i. Interviews with teachers & studentsii. Participating teachers’ journals (4 times)iii. Classroom observationsiv. Teacher and student survey – fall/springv. Video-taping of Singapore Math lesson (4
times) – analysis using TPR (Teaching Performance Record)
vi. End-of-year test scores: CRCT & ITBS
1. Survey Results• Teachers, Kindergarten in particular,
indicated a stronger affinity for and liked teaching mathematics at the end of the 2008-2009 school year than they had previously reported.
• Content knowledge of mathematics is important for effective teaching: teachers report some degree of understanding and confidence in teaching mathematics.
Survey Results, cont.
• A degree of satisfaction with the training and resources for mathematics teaching in 2009 – i.e. Singapore Math training and mentoring initiatives were apparently noticed and appreciated by many teachers.– Echoed in interview and journal data
2. Interview Results• A fluid integration of the new curriculum:
a consequence of the training provided by the county and ongoing support delivered by school administration
• Teachers reported manipulatives frequently integrated in the classroom
- value discs and number bonds cited as fostering learning
Interview Results, cont.
• Teachers report students possessed a deeper understanding of mathematical concepts with the Singapore Math curriculum.
• Teachers claimed that they have higher expectations of students in Singapore Math.
Interview Results, cont.
• Parents’ reactions to Singapore Math ranged from enthusiasm to frustration.
3. Journal Results• Teachers wrote that students liked
using place value disks– a helpful hands-on manipulative to assist
students grasp the concept of place value.
• Teachers wrote that students enjoyed activities, games, and manipulatives.
- the students showed enthusiasm in class.- Students described these parts of math
class as “fun”.
4. Classroom Observation
• Some teachers – tended to emphasize low-level cognitive
processes in their instruction – rarely asked students to draw associations to
real-world contexts• accountability pressure and time constraints?• preponderance of teacher instruction at the
expense of higher cognitive instruction, deeper questioning, and more occasions for cooperative student learning?
Second Year, 2009-2010
• No design changes in the second year of the study – i.e. same data collection instruments, teachers volunteer to participate, fifth grade classes added, compare first and second year data.
• Data collected in the second year will - Determine student comprehension and
achievement, fidelity of curriculum implementation.
Student Performance: Things to Keep in Mind
• Testing occurred during most teachers’ first year using new curriculum
• Most students in higher grades (e.g., 3rd and 4th) had not previously been taught Singapore Math
• Data we are really interested in will not be available for 3-4 more years.

Student Performance: CRCTSchool Mean Math Score by Grade
Change in CRCT Math Mean ScoreGrade 1
Increased80%
Decreased20%
Change in CRCT Math Mean ScoreGrade 2
Increased85%
Decreased15%
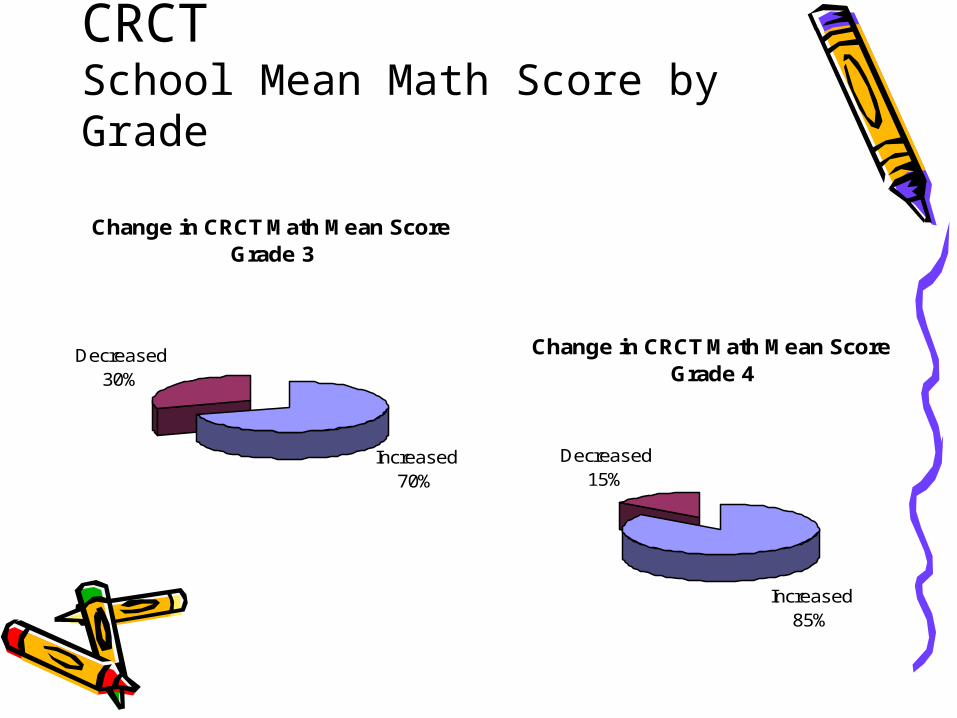
Student Performance: CRCTSchool Mean Math Score by Grade
Change in CRCT Math Mean ScoreGrade 3
Increased70%
Decreased30%
Change in CRCT Math Mean ScoreGrade 4
Increased85%
Decreased15%
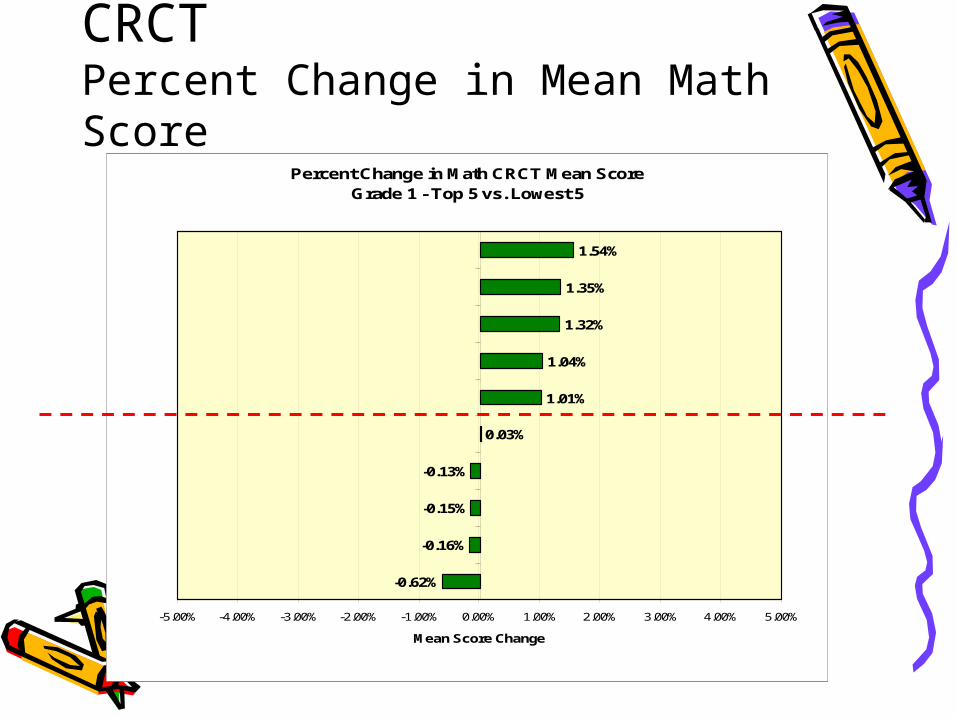
Student Performance: CRCTPercent Change in Mean Math Score
Percent Change in Math CRCT Mean ScoreGrade 1 - Top 5 vs. Lowest 5
-0.62%
-0.16%
-0.15%
-0.13%
0.03%
1.01%
1.04%
1.32%
1.35%
1.54%
-5.00% -4.00% -3.00% -2.00% -1.00% 0.00% 1.00% 2.00% 3.00% 4.00% 5.00%
Mean Score Change
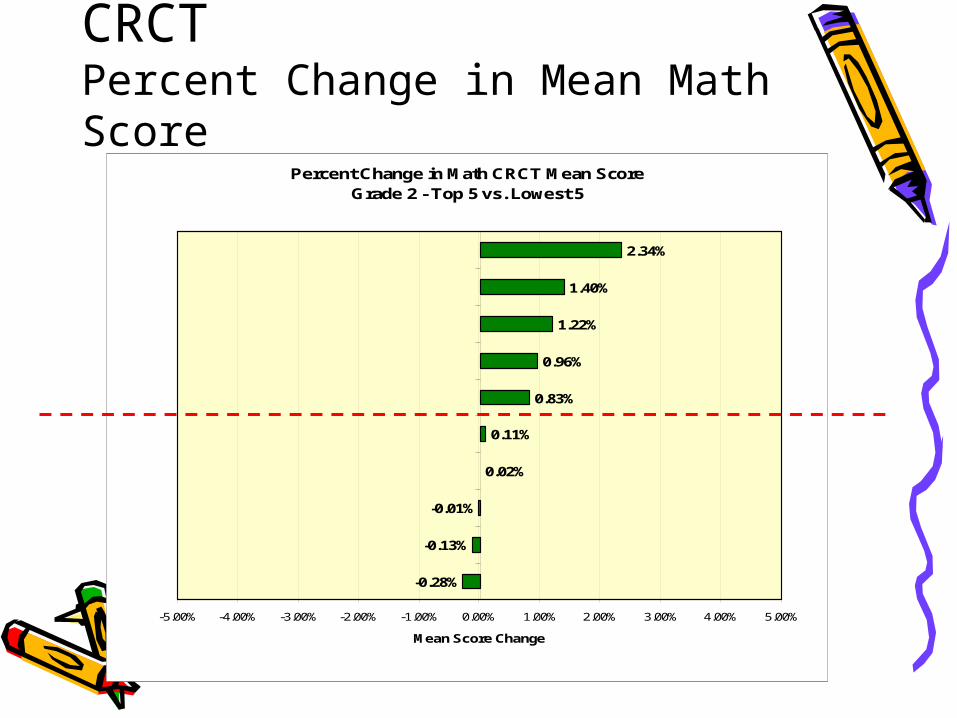
Student Performance: CRCTPercent Change in Mean Math Score
Percent Change in Math CRCT Mean ScoreGrade 2 - Top 5 vs. Lowest 5
-0.28%
-0.13%
-0.01%
0.02%
0.11%
0.83%
0.96%
1.22%
1.40%
2.34%
-5.00% -4.00% -3.00% -2.00% -1.00% 0.00% 1.00% 2.00% 3.00% 4.00% 5.00%
Mean Score Change
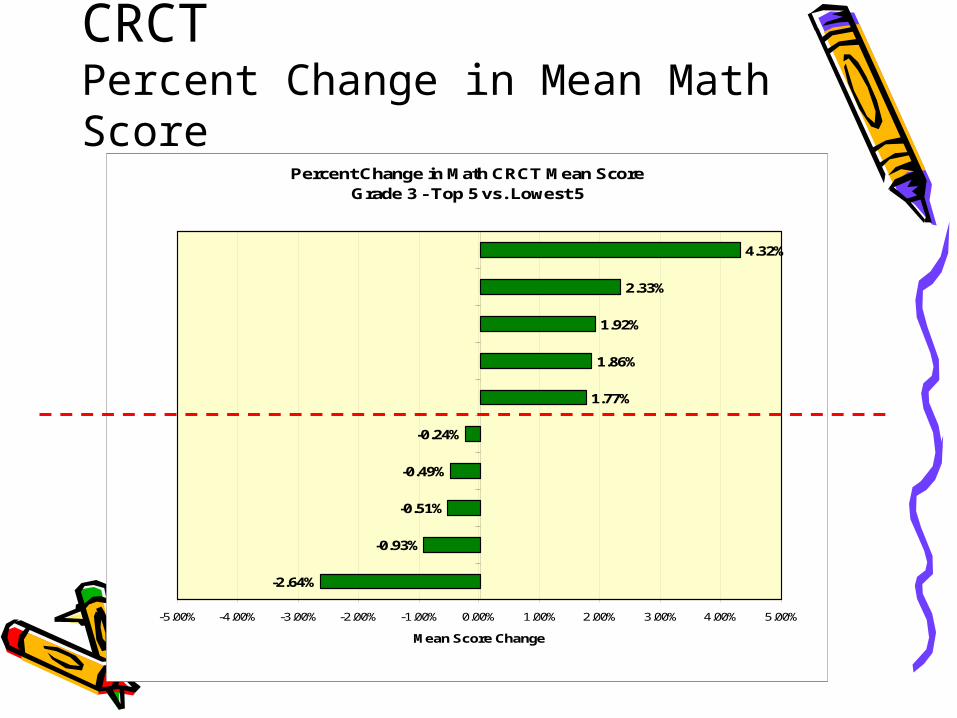
Percent Change in Math CRCT Mean ScoreGrade 3 - Top 5 vs. Lowest 5
-2.64%
-0.93%
-0.51%
-0.49%
-0.24%
1.77%
1.86%
1.92%
2.33%
4.32%
-5.00% -4.00% -3.00% -2.00% -1.00% 0.00% 1.00% 2.00% 3.00% 4.00% 5.00%
Mean Score Change
Student Performance: CRCTPercent Change in Mean Math Score
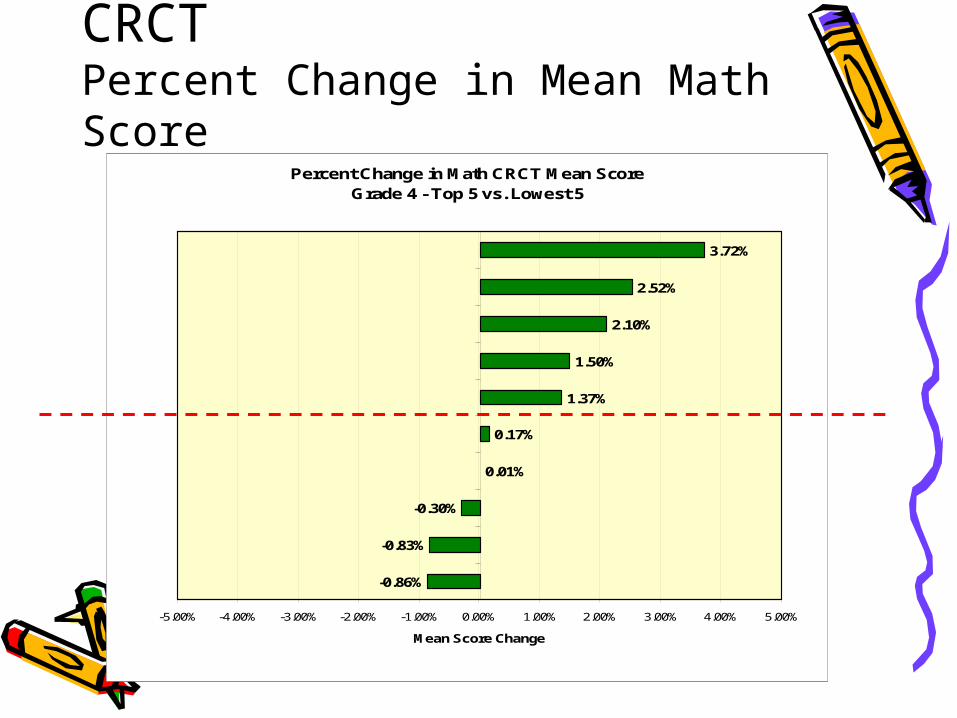
Percent Change in Math CRCT Mean ScoreGrade 4 - Top 5 vs. Lowest 5
-0.86%
-0.83%
-0.30%
0.01%
0.17%
1.37%
1.50%
2.10%
2.52%
3.72%
-5.00% -4.00% -3.00% -2.00% -1.00% 0.00% 1.00% 2.00% 3.00% 4.00% 5.00%
Mean Score Change
Student Performance: CRCTPercent Change in Mean Math Score
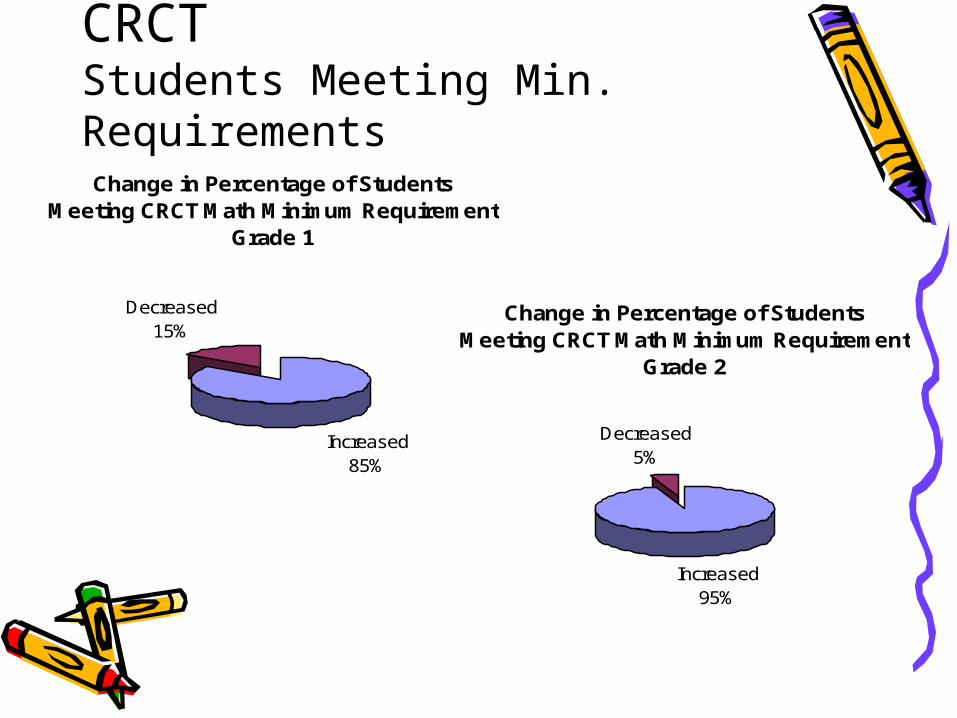
Student Performance: CRCTStudents Meeting Min. RequirementsChange in Percentage of Students
Meeting CRCT Math Minimum RequirementGrade 1
Increased85%
Decreased15%
Change in Percentage of Students Meeting CRCT Math Minimum Requirement
Grade 2
Increased95%
Decreased5%
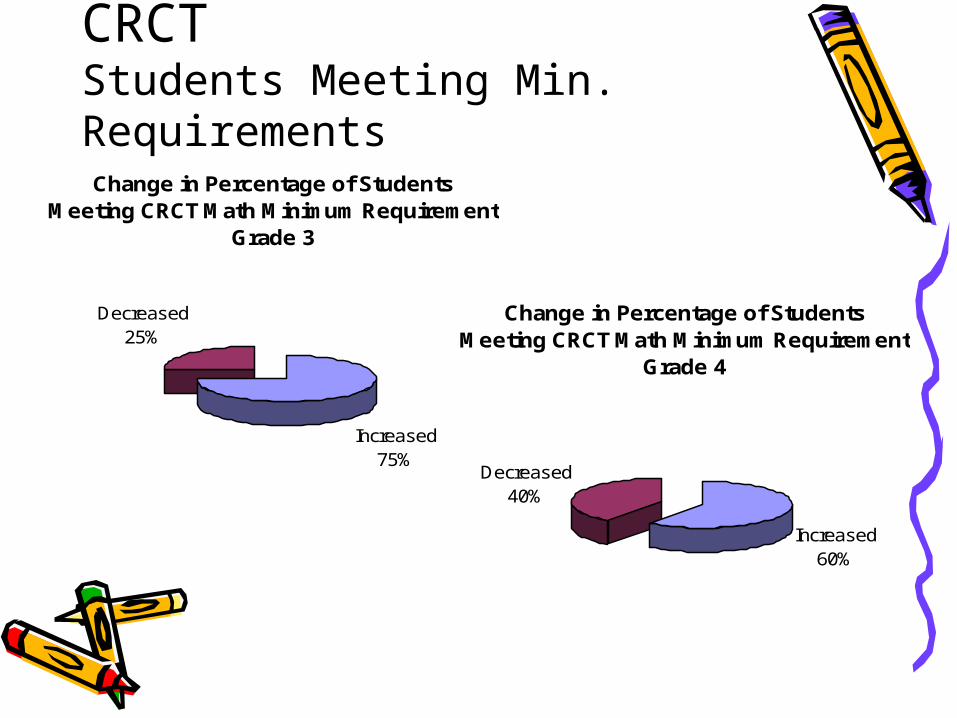
Student Performance: CRCTStudents Meeting Min. RequirementsChange in Percentage of Students
Meeting CRCT Math Minimum RequirementGrade 3
Increased75%
Decreased25%
Change in Percentage of Students Meeting CRCT Math Minimum Requirement
Grade 4
Increased60%
Decreased40%
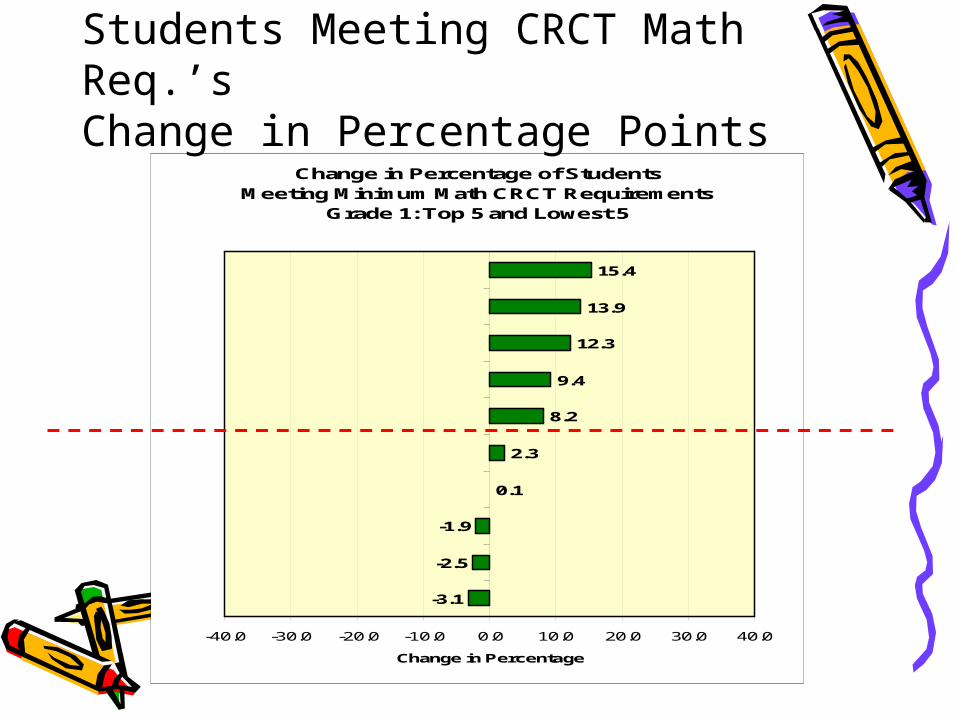
Change in Percentage of Students Meeting Minimum Math CRCT Requirements
Grade 1: Top 5 and Lowest 5
-3.1
-2.5
-1.9
0.1
2.3
8.2
9.4
12.3
13.9
15.4
-40.0 -30.0 -20.0 -10.0 0.0 10.0 20.0 30.0 40.0
Change in Percentage
Students Meeting CRCT Math Req.’sChange in Percentage Points
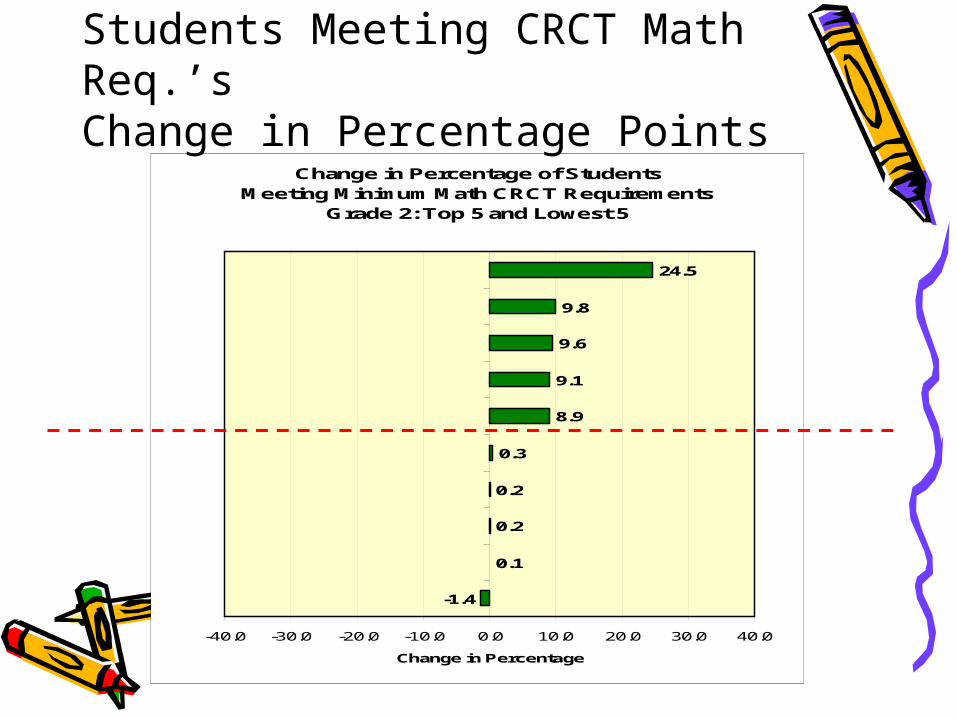
Change in Percentage of Students Meeting Minimum Math CRCT Requirements
Grade 2: Top 5 and Lowest 5
-1.4
0.1
0.2
0.2
0.3
8.9
9.1
9.6
9.8
24.5
-40.0 -30.0 -20.0 -10.0 0.0 10.0 20.0 30.0 40.0
Change in Percentage
Students Meeting CRCT Math Req.’sChange in Percentage Points
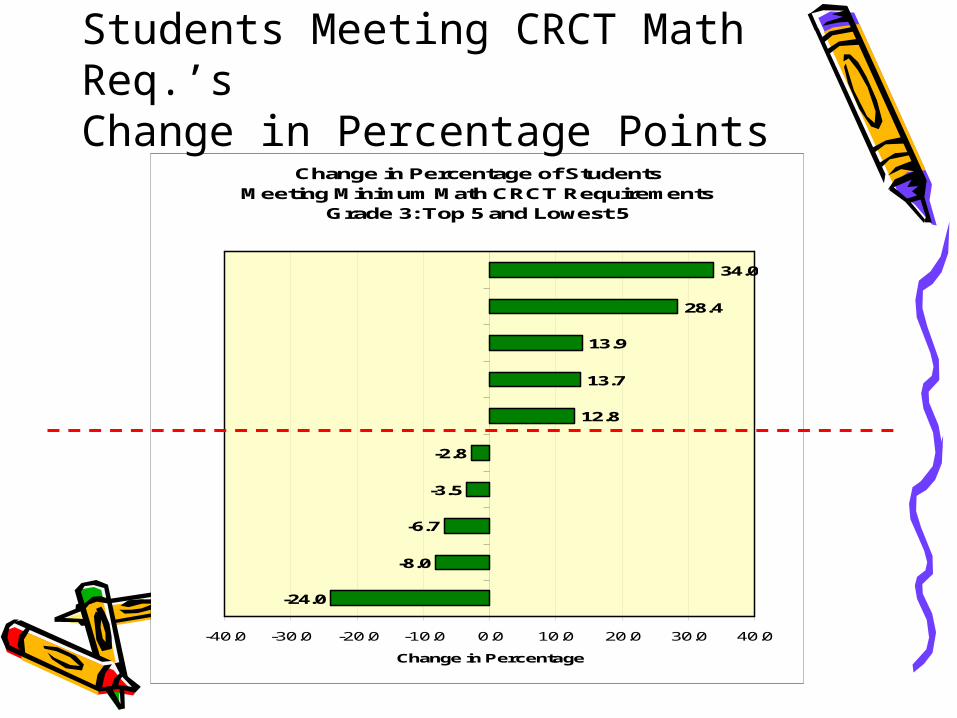
Change in Percentage of Students Meeting Minimum Math CRCT Requirements
Grade 3: Top 5 and Lowest 5
-24.0
-8.0
-6.7
-3.5
-2.8
12.8
13.7
13.9
28.4
34.0
-40.0 -30.0 -20.0 -10.0 0.0 10.0 20.0 30.0 40.0
Change in Percentage
Students Meeting CRCT Math Req.’sChange in Percentage Points
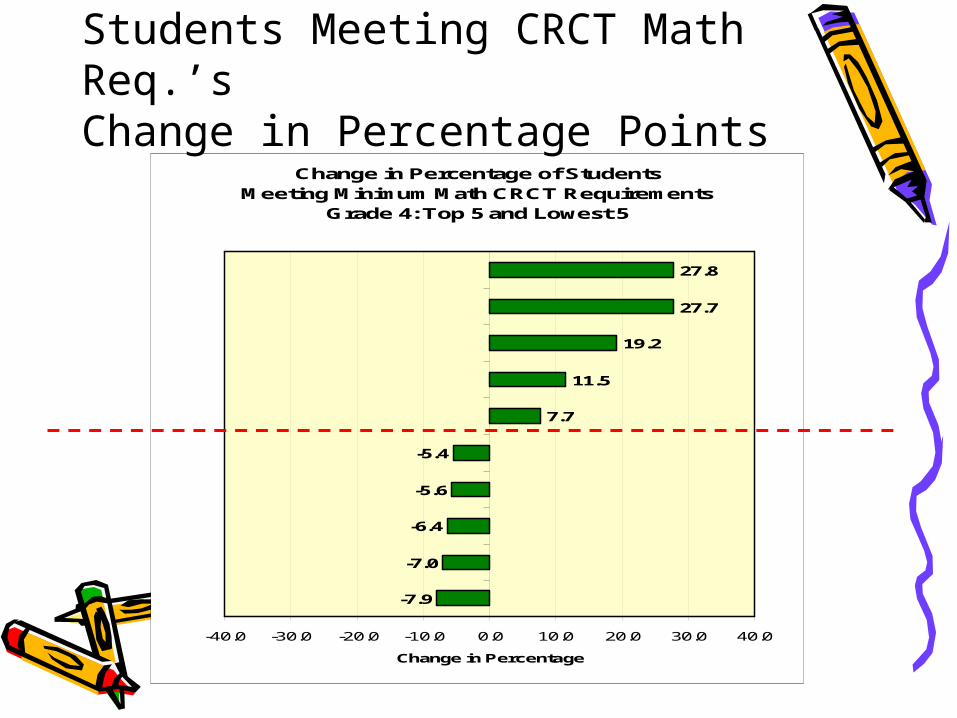
Change in Percentage of Students Meeting Minimum Math CRCT Requirements
Grade 4: Top 5 and Lowest 5
-7.9
-7.0
-6.4
-5.6
-5.4
7.7
11.5
19.2
27.7
27.8
-40.0 -30.0 -20.0 -10.0 0.0 10.0 20.0 30.0 40.0
Change in Percentage
Students Meeting CRCT Math Req.’sChange in Percentage Points
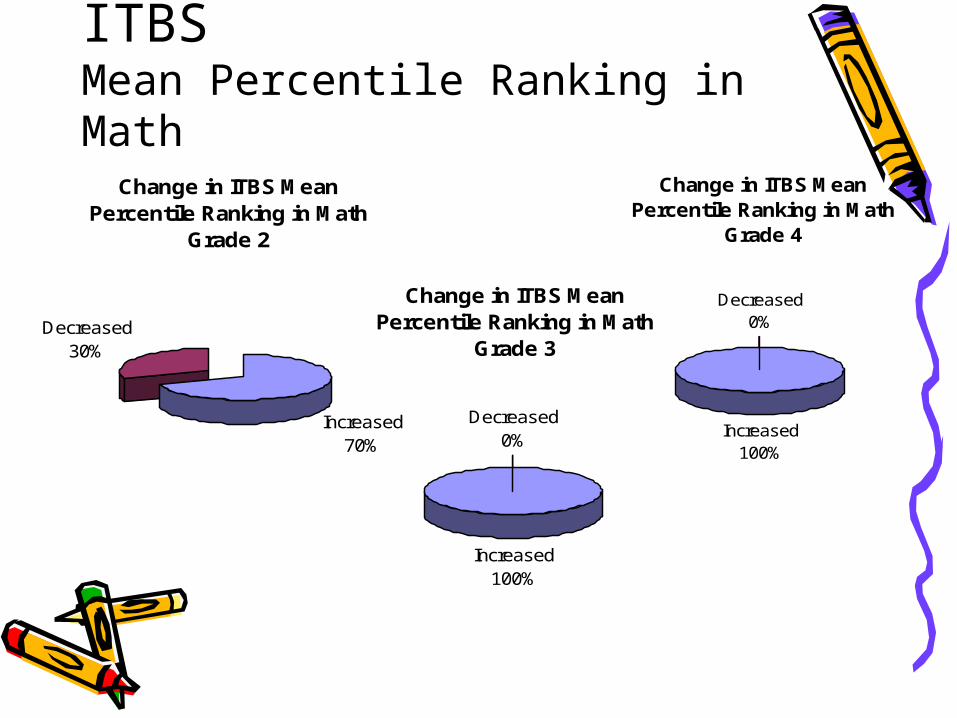
Student Performance: ITBSMean Percentile Ranking in Math
Change in ITBS Mean Percentile Ranking in Math
Grade 2
Increased70%
Decreased30%
Change in ITBS Mean Percentile Ranking in Math
Grade 3
Increased100%
Decreased0%
Change in ITBS Mean Percentile Ranking in Math
Grade 4
Increased100%
Decreased0%
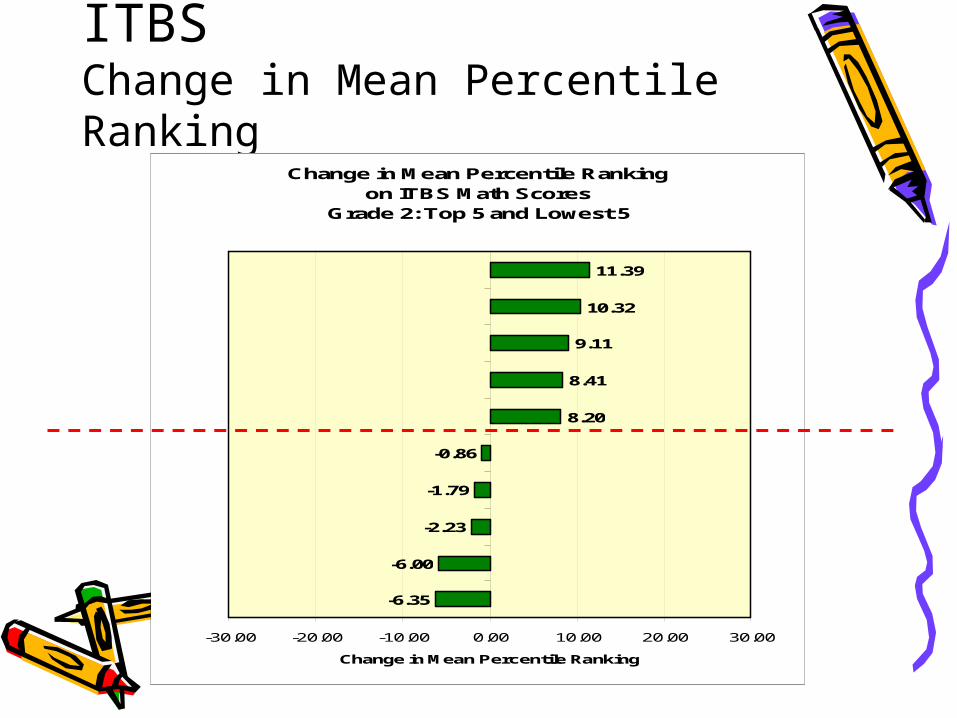
Student Performance: ITBSChange in Mean Percentile Ranking
Change in Mean Percentile Ranking on ITBS Math Scores
Grade 2: Top 5 and Lowest 5
-6.35
-6.00
-2.23
-1.79
-0.86
8.20
8.41
9.11
10.32
11.39
-30.00 -20.00 -10.00 0.00 10.00 20.00 30.00
Change in Mean Percentile Ranking
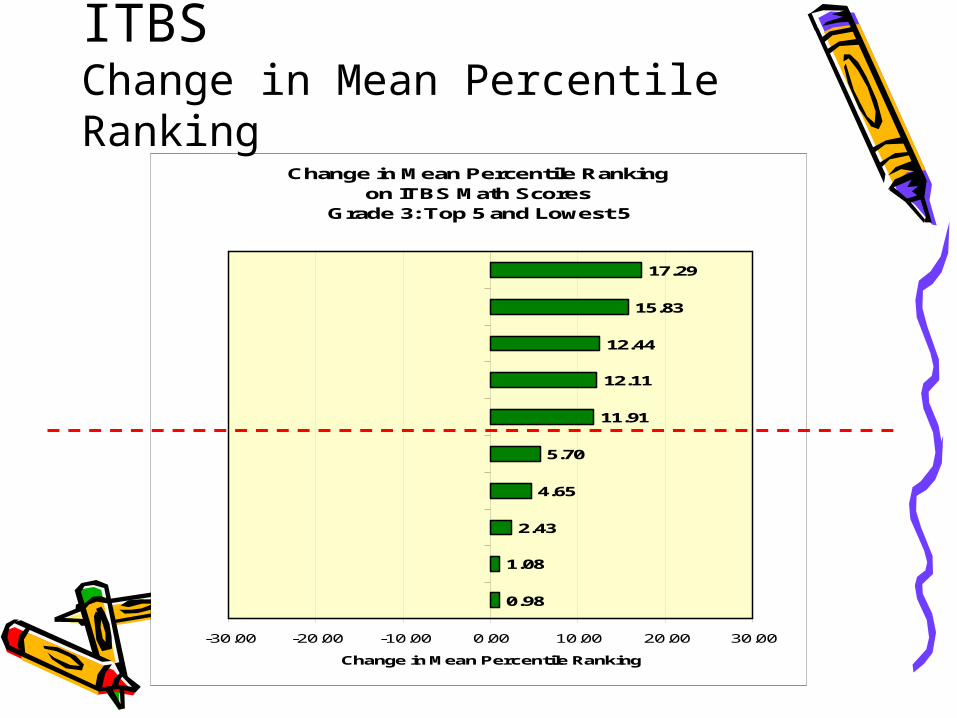
Change in Mean Percentile Ranking on ITBS Math Scores
Grade 3: Top 5 and Lowest 5
0.98
1.08
2.43
4.65
5.70
11.91
12.11
12.44
15.83
17.29
-30.00 -20.00 -10.00 0.00 10.00 20.00 30.00
Change in Mean Percentile Ranking
Student Performance: ITBSChange in Mean Percentile Ranking
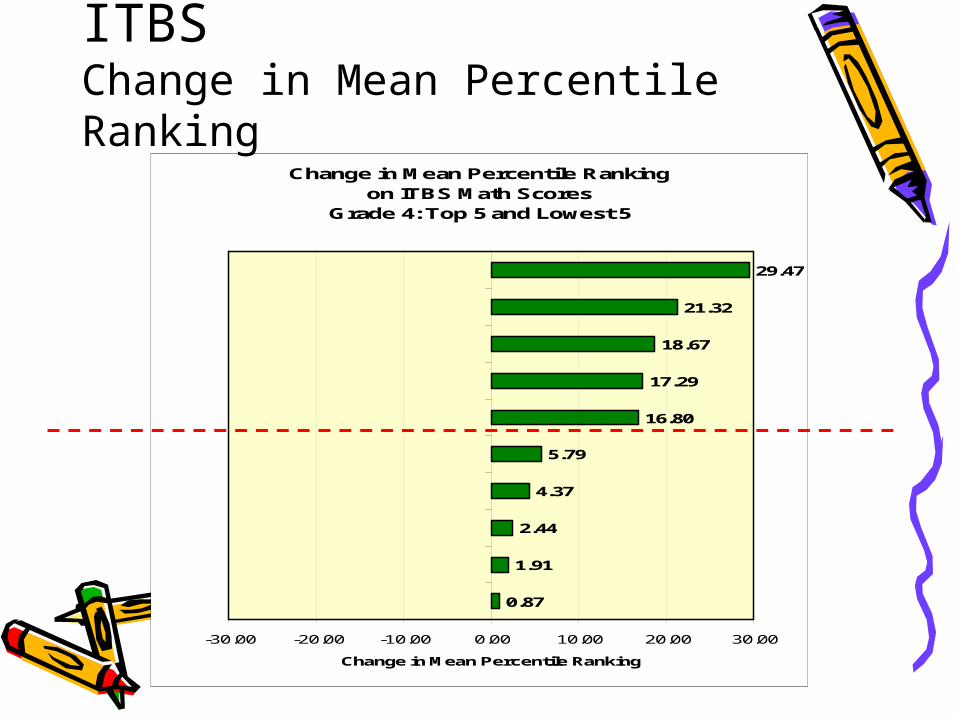
Change in Mean Percentile Ranking on ITBS Math Scores
Grade 4: Top 5 and Lowest 5
0.87
1.91
2.44
4.37
5.79
16.80
17.29
18.67
21.32
29.47
-30.00 -20.00 -10.00 0.00 10.00 20.00 30.00
Change in Mean Percentile Ranking
Student Performance: ITBSChange in Mean Percentile Ranking
Concluding Thoughts
• Teacher training and supportare essential
• Not a “drop-in” solution, especially at higher grades (need phased approach)
• Parent “buy-in” is important • Will take time to see full impact