Embed Size (px)
Citation preview
8/12/2019 Implementing Lean Six Sigma Throughout the Supply Chain
http://slidepdf.com/reader/full/implementing-lean-six-sigma-throughout-the-supply-chain 1/278
8/12/2019 Implementing Lean Six Sigma Throughout the Supply Chain
http://slidepdf.com/reader/full/implementing-lean-six-sigma-throughout-the-supply-chain 2/278
Implementing Lean
Six Sigma throughout
the Supply Chain
The Comprehensive and
Transparent Case Study

8/12/2019 Implementing Lean Six Sigma Throughout the Supply Chain
http://slidepdf.com/reader/full/implementing-lean-six-sigma-throughout-the-supply-chain 3/278
8/12/2019 Implementing Lean Six Sigma Throughout the Supply Chain
http://slidepdf.com/reader/full/implementing-lean-six-sigma-throughout-the-supply-chain 4/278
Implementing Lean
Six Sigma throughout
the Supply Chain
The Comprehensive and
Transparent Case Study
Elizabeth A. Cudney • Rodney Kestle
8/12/2019 Implementing Lean Six Sigma Throughout the Supply Chain
http://slidepdf.com/reader/full/implementing-lean-six-sigma-throughout-the-supply-chain 5/278
Productivity PressTaylor & Francis Group270 Madison AvenueNew York, NY 10016
© 2011 by Taylor and Francis Group, LLCProductivity Press is an imprint of Taylor & Francis Group, an Informa business
No claim to original U.S. Government works
Printed in the United States of America on acid-free paper10 9 8 7 6 5 4 3 2 1
International Standard Book Number: 978-1-4398-2814-4 (Paperback)
This book contains information obtained from authentic and highly regarded sources. Reasonable efforts have beenmade to publish reliable data and information, but the author and publisher cannot assume responsibility for the valid-ity of all materials or the consequences of their use. The authors and publishers have attempted to trace the copyrightholders of all material reproduced in this publication and apologize to copyright holders if permission to publish in thisform has not been obtained. If any copyright material has not been acknowledged please write and let us know so we mayrectify in any future reprint.
Except as permitted under U.S. Copyright Law, no part of this book may be reprinted, reproduced, transmitted, or uti-
lized in any form by any electronic, mechanical, or other means, now known or hereafter invented, including photocopy-ing, microfilming, and recording, or in any information storage or retrieval system, without written permission from thepublishers.
For permission to photocopy or use material electronically from this work, please access www.copyright.com (http://www.copyright.com/) or contact the Copyright Clearance Center, Inc. (CCC), 222 Rosewood Drive, Danvers, MA 01923,978-750-8400. CCC is a not-for-profit organization that provides licenses and registration for a variety of users. Fororganizations that have been granted a photocopy license by the CCC, a separate system of payment has been arranged.
Trademark Notice: Product or corporate names may be trademarks or registered trademarks, and are used only foridentification and explanation without intent to infringe.
Library of Congress Cataloging-in-Publication Data
Cudney, Elizabeth A.Implementing lean six sigma throughout the supply chain : the comprehensive and transparent case
study / Elizabeth A. Cudney, Rodney Kestle.p. cm.
Includes index.ISBN 978-1-4398-2814-4 (pbk. : alk. paper)1. Six sigma (Quality control standard)--Case studies. 2. Business logistics--Quality control--Case
studies. 3. Business logistics--Management--Case studies. I. Kestle, Rodney. II. Title.
HD38.5.C856 2011658.7--dc22 2010034679
Visit the Taylor & Francis Web site athttp://www.taylorandfrancis.com
and the Productivity Press Web site at
http://www.productivitypress.com

8/12/2019 Implementing Lean Six Sigma Throughout the Supply Chain
http://slidepdf.com/reader/full/implementing-lean-six-sigma-throughout-the-supply-chain 6/278
Dedication
My greatest appreciation goes to my family for supporting me, believing
in me, and their love. Without such appreciated support, fulfilling this
dream would not have been possible. My husband, Brian, and our two
wonderful children, Caroline and Josh, bring me the greatest joy.
Elizabeth A. Cudney
This book is dedicated to my wife Kimberly and children Isabella,
Madeline, and Caroline. Thank you for your support and patience and
for inspiring me to reach further.
Rodney Kestle

8/12/2019 Implementing Lean Six Sigma Throughout the Supply Chain
http://slidepdf.com/reader/full/implementing-lean-six-sigma-throughout-the-supply-chain 7/278
8/12/2019 Implementing Lean Six Sigma Throughout the Supply Chain
http://slidepdf.com/reader/full/implementing-lean-six-sigma-throughout-the-supply-chain 8/278
vii
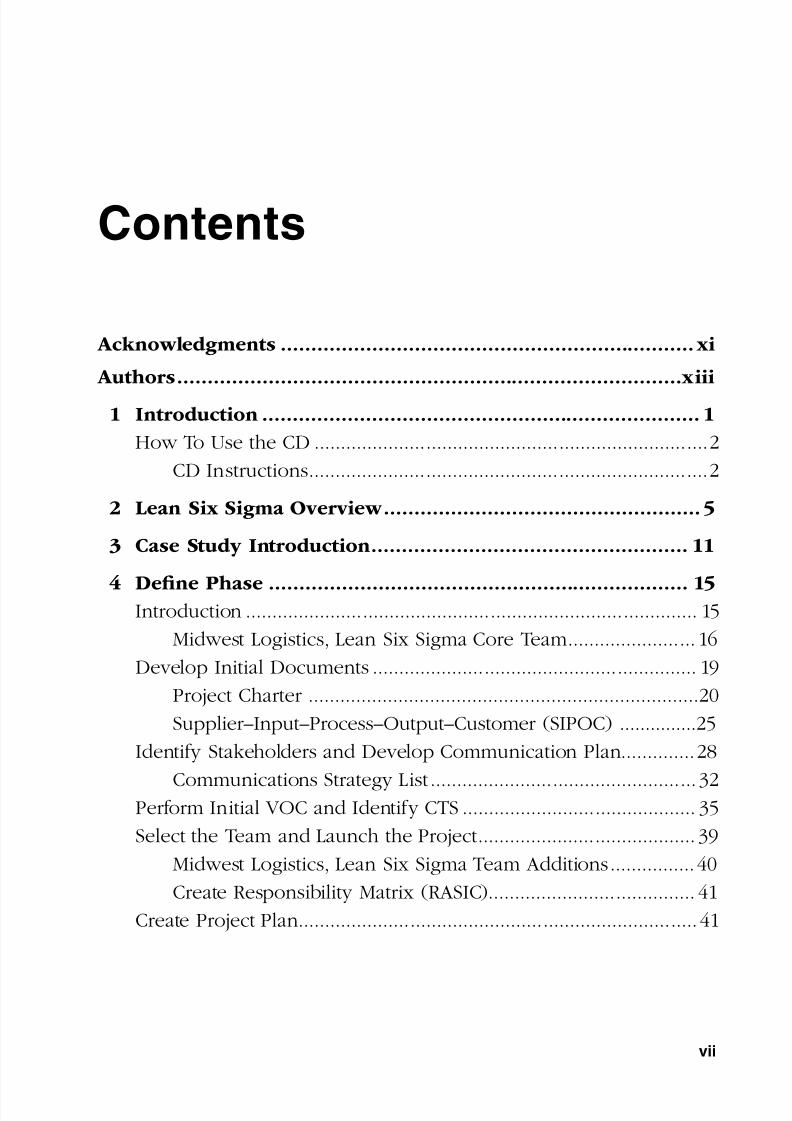
Contents
Acknowledgments .................................................................... xi
Authors ...................................................................................xiii
1 Introduction ........................................................................ 1
How To Use the CD ..........................................................................2
CD Instructions ...........................................................................2
2 Lean Six Sigma Overview ....................................................5
3 Case Study Introduction .................................................... 11
4 Define Phase ..................................................................... 15Introduction ..................................................................................... 15
Midwest Logistics, Lean Six Sigma Core Team ........................ 16
Develop Initial Documents ............................................................. 19
Project Charter ..........................................................................20
Supplier–Input–Process–Output–Customer (SIPOC) ...............25
Identify Stakeholders and Develop Communication Plan ..............28
Communications Strategy List .................................................. 32Perform Initial VOC and Identify CTS ............................................ 35
Select the Team and Launch the Project ......................................... 39
Midwest Logistics, Lean Six Sigma Team Additions ................40
Create Responsibility Matrix (RASIC) ....................................... 41
Create Project Plan ........................................................................... 41
8/12/2019 Implementing Lean Six Sigma Throughout the Supply Chain
http://slidepdf.com/reader/full/implementing-lean-six-sigma-throughout-the-supply-chain 9/278
viii ◾ Contents
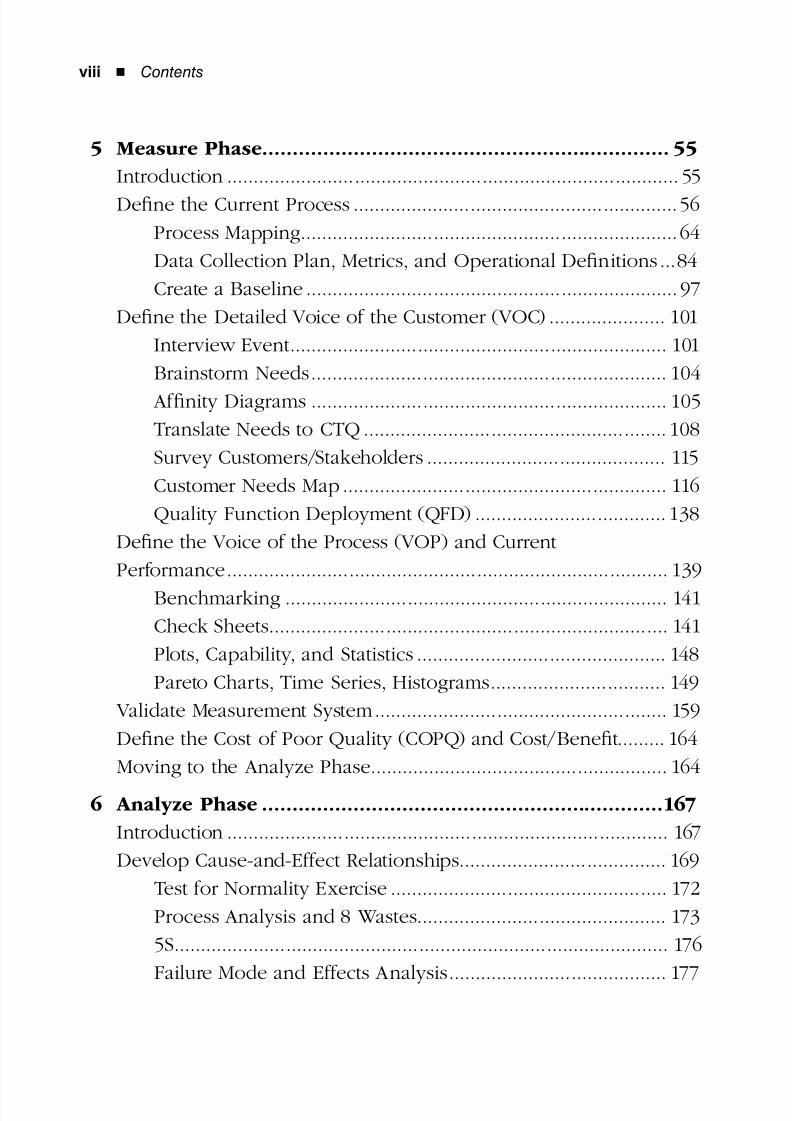
5 Measure Phase ................................................................... 55
Introduction ..................................................................................... 55
Define the Current Process .............................................................56
Process Mapping .......................................................................64
Data Collection Plan, Metrics, and Operational Definitions ...84
Create a Baseline ...................................................................... 97
Define the Detailed Voice of the Customer (VOC) ...................... 101
Interview Event ....................................................................... 101
Brainstorm Needs ................................................................... 104
Affinity Diagrams ................................................................... 105
Translate Needs to CTQ ......................................................... 108
Survey Customers/Stakeholders ............................................. 115
Customer Needs Map ............................................................. 116
Quality Function Deployment (QFD) .................................... 138
Define the Voice of the Process (VOP) and Current
Performance ................................................................................... 139
Benchmarking ........................................................................ 141
Check Sheets ........................................................................... 141
Plots, Capability, and Statistics ............................................... 148
Pareto Charts, Time Series, Histograms ................................. 149
Validate Measurement System ....................................................... 159
Define the Cost of Poor Quality (COPQ) and Cost/Benefit......... 164
Moving to the Analyze Phase........................................................ 164
6 Analyze Phase ..................................................................167
Introduction ................................................................................... 167
Develop Cause-and-Effect Relationships ....................................... 169
Test for Normality Exercise .................................................... 172
Process Analysis and 8 Wastes ............................................... 173
5S ............................................................................................. 176
Failure Mode and Effects Analysis ......................................... 177
8/12/2019 Implementing Lean Six Sigma Throughout the Supply Chain
http://slidepdf.com/reader/full/implementing-lean-six-sigma-throughout-the-supply-chain 10/278
Contents ◾ ix
Determine and Validate Root Causes ........................................... 181
Regression Analysis ................................................................ 196
Hypothesis Test....................................................................... 196
Develop Process Capability ........................................................... 196
Process Capability ................................................................... 199
7 Improve Phase ................................................................. 207
Introduction ...................................................................................207
Identify Breakthrough and Select Practical Approaches ..............208
Action (Pilot) Plan ................................................................... 210Perform Cost/Benefit Analysis ...................................................... 211
Design Future State ....................................................................... 212
Establish Performance Targets and Project Scorecard .................. 214
Gain Approval to Implement, Then Implement ........................... 222
Train and Execute .......................................................................... 222
8 Control Phase .................................................................. 231
Introduction ................................................................................... 231Measure Results and Manage Change .......................................... 232
Report Scorecard Data and Create Process Control Plan ............. 235
FMEA and Control Plan .......................................................... 235
Process Capability/DPMO ...................................................... 237
Apply P-D-C-A Process.................................................................. 240
Identify Replication Opportunities ................................................ 242
Develop Future Plans .................................................................... 244
9 Conclusions ..................................................................... 247
Lean Six Sigma Glossary ....................................................... 249
Index ..................................................................................... 261

8/12/2019 Implementing Lean Six Sigma Throughout the Supply Chain
http://slidepdf.com/reader/full/implementing-lean-six-sigma-throughout-the-supply-chain 11/278
8/12/2019 Implementing Lean Six Sigma Throughout the Supply Chain
http://slidepdf.com/reader/full/implementing-lean-six-sigma-throughout-the-supply-chain 12/278
xi
Acknowledgments
We are indebted to the colleagues who we have had the fortune to work
with and learn from. They have challenged our thinking and showed us
what Lean Six Sigma is truly about. We are extremely thankful to the Productivity Press for all their help
and for making this a remarkable experience for us. In particular, we
would like to thank Michael Sinocchi, senior acquisitions editor, and
Lara Zoble, assistant editor and project coordinator. We are also grateful
to Prudence Board, project editor, for her development edits.

8/12/2019 Implementing Lean Six Sigma Throughout the Supply Chain
http://slidepdf.com/reader/full/implementing-lean-six-sigma-throughout-the-supply-chain 13/278
8/12/2019 Implementing Lean Six Sigma Throughout the Supply Chain
http://slidepdf.com/reader/full/implementing-lean-six-sigma-throughout-the-supply-chain 14/278
xiii
Authors
Elizabeth Cudney , PhD, is an assistant professor at Missouri University
of Science and Technology in the Engineering Management and Systems
Engineering Department. She received her B.S. in industrial engineer-ing from North Carolina State University, her Master of Engineering in
mechanical engineering with a manufacturing specialization and Master
of Business Administration from the University of Hartford; and she
received her doctorate in engineering management from the University
of Missouri–Rolla.
Prior to returning to school for her doctorate, she worked for seven
years in the automotive industry in various roles including Six SigmaBlack Belt, quality/process engineer, quality auditor, senior manufactur-
ing engineer, and manufacturing manager. In 2010, Beth was inducted
into the International Academy for Quality. Beth received the 2007
ASQ A. V. Feigenbaum Medal and the 2006 SME Outstanding Young
Manufacturing Engineering Award. Beth is an ASQ-certified Six Sigma
Black Belt, certified quality engineer, manager of quality/operational
excellence, certified quality inspector, certified quality improvementassociate, certified quality technician, and certified quality process ana-
lyst. Beth is currently faculty advisor for the ASEM/IIE student chapter
at Missouri University of Science and Technology. Beth cochaired the
2009 IIE Operational Excellence Conference. She served as cochair of
the 2008 IIE Operational Excellence Conference and cochair of the 2007
IIE/ASQ Lean and Quality Conference. Beth also served as cochair of the
2006 IIE/ASQ Quality Drives Lean Conference and cochair of the 2004
8/12/2019 Implementing Lean Six Sigma Throughout the Supply Chain
http://slidepdf.com/reader/full/implementing-lean-six-sigma-throughout-the-supply-chain 15/278
xiv ◾ Authors
and 2005 IIE Lean Management Solutions Conferences. She served on the
conference committee for the 2008, 2009, and IIE Annual Conferences.
Beth also recently completed a two-year term as the president of the
IIE Lean Division. She is president of the Rotary Club of Rolla, Missouri.
Beth is a member of the American Society of Engineering Management
(ASEM), American Society of Mechanical Engineers (ASME), American
Society for Quality (ASQ), Institute of Industrial Engineers (IIE), and
Society of Automotive Engineers (SAE). Beth’s major areas of interest are in
quality engineering and Lean enterprise, more specifically Mahalanobis-
Taguchi System, robust design, Lean enterprise, and Six Sigma. She cur-
rently teaches EMgt 266 Quality Philosophies and Methods, EMgt 309
Six Sigma, and EMgt 409 Design for Six Sigma. Beth has published
more than 50 papers, 11 journal papers, and has four additional journal
papers waiting for publication. In addition, her first book, Using Hoshin
Kanri to Improve the Value Stream, was released in March 2009 through
Productivity Press, a division of Taylor and Francis.
Rodney Kestle completed his BS degree at Purdue University’s School
of Technology in 1997. While a student at Purdue University, he com-
pleted internships with Modine Manufacturing and Honeywell. After
graduation in 1997, he took a position with the Intel Corporation as a
manufacturing equipment technician at their Chandler, Arizona facility.
There he became the equipment owner for the metrology tools, which
made him responsible for the maintenance user specifications and thetraining of other equipment technicians for this tool set. In July 1998,
he left Intel and took a position as an industrial engineer at Thomas
Engineering Inc., located in Hoffman Estates, Illinois. During the next
six and a half years, Rodney became an expert on tablet tooling manu-
facturing and design. Early in his stay, he took on the responsibility as
Thomas Engineering’s quality manager and implemented their first formal
quality system for all divisions of the company. In January 2005, Rodneyjoined Brown and Sharpe as an applications engineer for coordinate
8/12/2019 Implementing Lean Six Sigma Throughout the Supply Chain
http://slidepdf.com/reader/full/implementing-lean-six-sigma-throughout-the-supply-chain 16/278
Authors ◾ xv
measuring machines (CMM). While at their Elgin, Illinois office, he spent
most of his time in the classroom teaching their customers about the use
and operation of CMMs and the PC-based software that operated the
equipment. This class time motivated him to return to school to further
his education, with the goal being a PhD.
In August 2006, Rodney began his course work at Missouri University of
Science and Technology under the School of Engineering’s Manufacturing
Engineering Masters program. With the completion of his thesis, he was
granted a Master of Science in manufacturing engineering in December
2008. Rodney is now pursuing his doctorate in engineering manage-
ment at Missouri University of Science and Technology.

8/12/2019 Implementing Lean Six Sigma Throughout the Supply Chain
http://slidepdf.com/reader/full/implementing-lean-six-sigma-throughout-the-supply-chain 17/278
8/12/2019 Implementing Lean Six Sigma Throughout the Supply Chain
http://slidepdf.com/reader/full/implementing-lean-six-sigma-throughout-the-supply-chain 18/278
8/12/2019 Implementing Lean Six Sigma Throughout the Supply Chain
http://slidepdf.com/reader/full/implementing-lean-six-sigma-throughout-the-supply-chain 19/278
2 ◾ Implementing Lean Six Sigma Throughout the Supply Chain
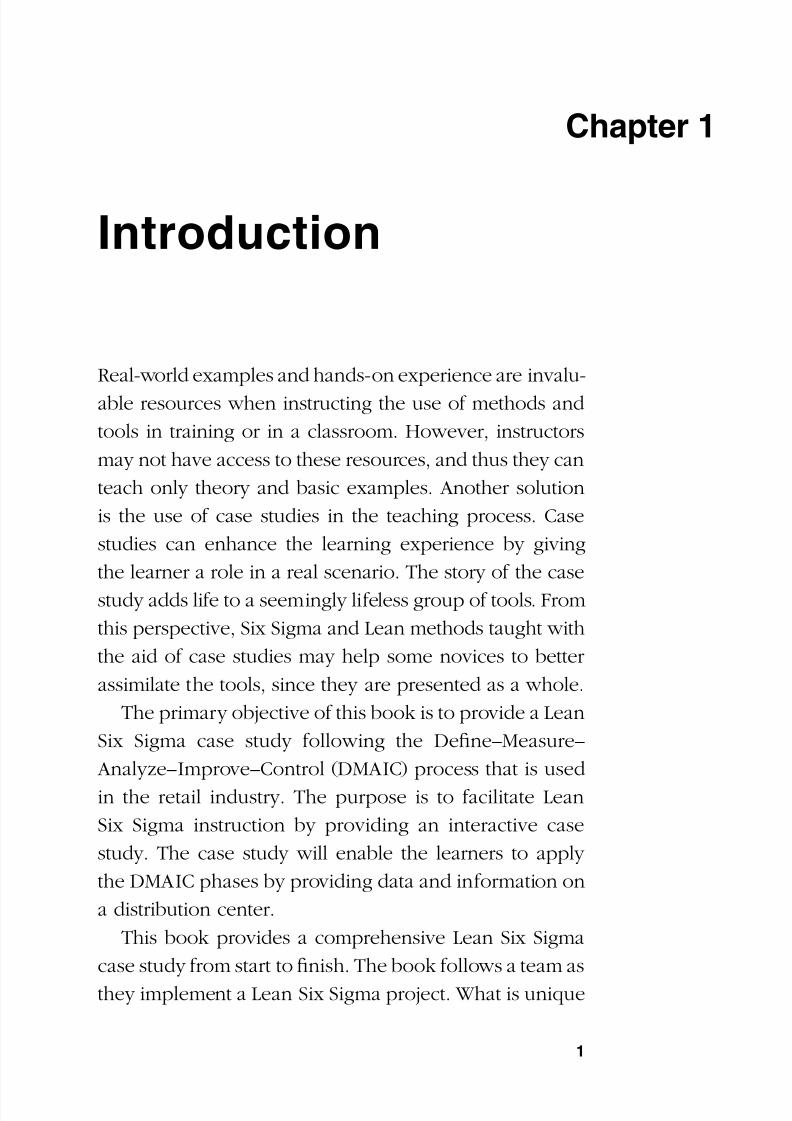
about this book is that it presents all the necessary infor-
mation to clearly show how and why the team made the
decisions they made. Current published case studies are
very brief and only give a high-level overview of what
the team did. This in-depth case study presents all of the
data used by the team, which is also given in the CD that
accompanies this book, and comprehensively explains
how the team drew their conclusions. Thus the reader
can use the data to make the same analyses and conclu-
sions. There is a clear linkage between all of the Lean
Six Sigma tools that provides numerous threads from all
the necessary tools.
How To Use the CD
Throughout the book, numerous graphs and charts are
presented, and data analysis is provided. The data for
these charts and graphs can be found on the CD included
at the back of the book. These data sets are designed to
help you plan and execute your Lean Six Sigma journey.
In addition, a series of presentation slides are provided
to supplement the instruction of the case study. The fol-
lowing section describes the CD contents and user infor-
mation. We hope you find the data sets, training slides,
and tools useful in your Lean Six Sigma deployment.
CD Instructions
The CD that accompanies this book contains several files
that include data sets, training slides, and tools for your
Lean Six Sigma journey.
8/12/2019 Implementing Lean Six Sigma Throughout the Supply Chain
http://slidepdf.com/reader/full/implementing-lean-six-sigma-throughout-the-supply-chain 20/278
Introduction ◾ 3
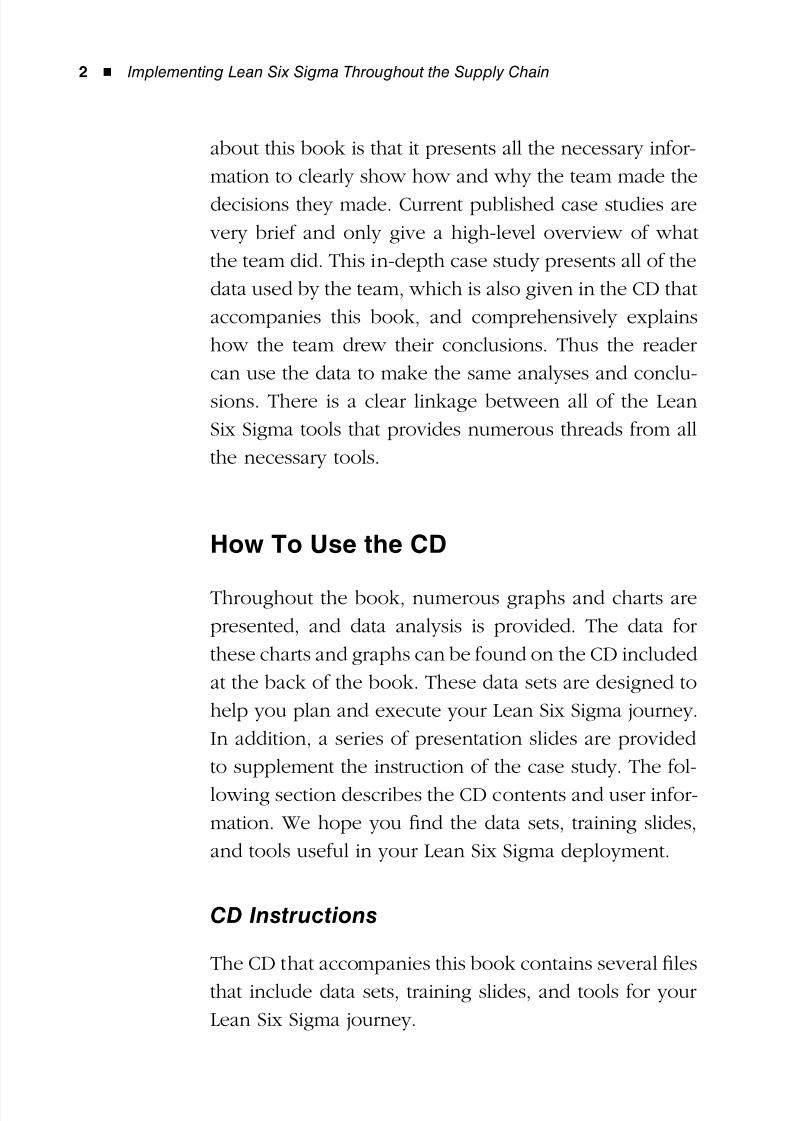
The CD files are:
Data sets ◾ (Excel files): Each data set is named to corre-
spond with a Figure or Table in the book. For example,
the data for Figure 4.4 is named “Data Figure 4.4.”
Training slides ◾ (PowerPoint files): These files corre-
spond to the DMAIC methodology used throughout
the book. All figures that are used in the book are
included in these files to provide training documents
to teach the case.
Glossary ◾ : This file is a reference guide that also
appears at the end of the book and contains com-
monly used Six Sigma and Lean definitions.
We hope you enjoy your journey to becoming a Lean
Six Sigma organization!

8/12/2019 Implementing Lean Six Sigma Throughout the Supply Chain
http://slidepdf.com/reader/full/implementing-lean-six-sigma-throughout-the-supply-chain 21/278
8/12/2019 Implementing Lean Six Sigma Throughout the Supply Chain
http://slidepdf.com/reader/full/implementing-lean-six-sigma-throughout-the-supply-chain 22/278
5
2Chapter
Lean Six SigmaOverview
Lean and Six Sigma (6σ) are powerful philosophies
backed by several tools for improving quality, productiv-
ity, profitability, and market competitiveness for any cor-
poration. Lean philosophies focus on eliminating waste
and improving flow using various proven methods ini-
tially pioneered by the Toyota Manufacturing Company
under the banner of the Toyota Production System (TPS).Six Sigma is focused on reducing process variation using
problem-solving and statistical tools. It was first perfected
by the Motorola Company and most notably deployed by
Jack Welch during his tenure as CEO of General Electric
(GE). Both methods, when used independently, can pro-
duce positive results for the user, but when applied in a
holistic manner, they complement each other well andprovide more dramatic gains.
Again, Lean emphasizes the elimination of waste and
creation of flow within an enterprise. Lean’s primary
focus is on the customer, to address value-added (VA) and
non-value-added (NVA) tasks. Value-added tasks are the
only operations for which the customer is ready or willing
to pay. Typically, these are processes that transform the
8/12/2019 Implementing Lean Six Sigma Throughout the Supply Chain
http://slidepdf.com/reader/full/implementing-lean-six-sigma-throughout-the-supply-chain 23/278
6 ◾ Implementing Lean Six Sigma Throughout the Supply Chain
product or service based on customer requirements. The
idea of creating flow in Lean is to deliver products and
services just in time (JIT), in the right amounts, and at the
right quality levels at the right place. This necessitates that
products and services be produced and delivered only
when a pull is exerted by the customer through a signal
in the form of a purchase. A well-designed Lean system
allows for an immediate and effective response to fluctuat-
ing customer demands and requirements. Lean tools that
are most commonly used to eliminate waste and achieve
flow are value-stream mapping (VSM), standard work, 5S
(sort, set in order, shine, standardize, sustain), single-min-
ute exchange of dies (SMED), and visual management.
Like Lean, Six Sigma is also a customer-focused
improvement strategy. At the core of the method, Six
Sigma utilizes a discipline that strives to minimize defects
and variation of critical variables toward an achievement
of 3.4 defects per million opportunities in product design,
production, and administrative processes. Customer sat-
isfaction and cost reduction can be realized by reducing
variation in processes that produce the products and ser-
vices that they use. While focused on reducing variation,
the Six Sigma methodology uses a well-defined problem-
solving approach with the application of statistical tools.
The methodology uses five phases: Define–Measure–
Analyze–Improve–Control (DMAIC). The purpose of the
five phases is to define the problem, measure the process
performance, analyze the process for root causes, improve
the process by eliminating or reducing root causes, and
control the improved process to hold the gains.
The goals of Six Sigma include developing a world-
class culture, developing leaders, and supporting
8/12/2019 Implementing Lean Six Sigma Throughout the Supply Chain
http://slidepdf.com/reader/full/implementing-lean-six-sigma-throughout-the-supply-chain 24/278
Lean Six Sigma Overview ◾ 7
long-range objectives. There are numerous benefits of
Six Sigma, including a stronger knowledge of products
and processes, a reduction in defects, an increased cus-
tomer satisfaction level that generates business growth
and improves profitability, an increase in communication
and teamwork, and a common set of tools.
Six Sigma is commonly credited to Bill Smith, an
engineer at Motorola, who coined the term in 1984. The
concept was originally developed as a safety margin of
50% in design for product-performance specifications.
This safety margin was equivalent to a Six Sigma level
of capability. Since its first introduction, Six Sigma has
continued to evolve over time and has been adopted
throughout the world as a standard business practice.
When Lean or Six Sigma is deployed independently,
only a few companies have shown strong improvements.
This book demonstrates a synergistic merger of the tools
in a Lean Six Sigma case study to be used for train-
ing or course instruction. By using the Six Sigma tool of
DMAIC, the two methods can be merged based on the
time of implementation. An integrated approach to pro-
cess improvement using Lean and Six Sigma principles is
required, since both Lean and Six Sigma represent more
of a cultural change in the way that a company does
business rather than one-time tools to be used for quick
improvement. Without a model to allow merging of the
tools, the proper understanding of the tools may be lost.
The case study presented in this book was developed
from a composite of experiences, and it centers on a
fictitious company called “CJMart,” which is a global
retail store with numerous distribution centers. The case
study has been constructed to focus on a breakthrough
8/12/2019 Implementing Lean Six Sigma Throughout the Supply Chain
http://slidepdf.com/reader/full/implementing-lean-six-sigma-throughout-the-supply-chain 25/278
8 ◾ Implementing Lean Six Sigma Throughout the Supply Chain
in trailer utilization for a distribution center. Trailer uti-
lization is a metric used by supply-chain management
to monitor the efficiency of trailer use. The case study
begins with an introduction of the company and its needfor the breakthrough. The book then steps through the
Six Sigma phases of Define–Measure–Analyze–Improve–
Control to illustrate how a team implemented Lean Six
Sigma. The timing of the integration of Lean tools within
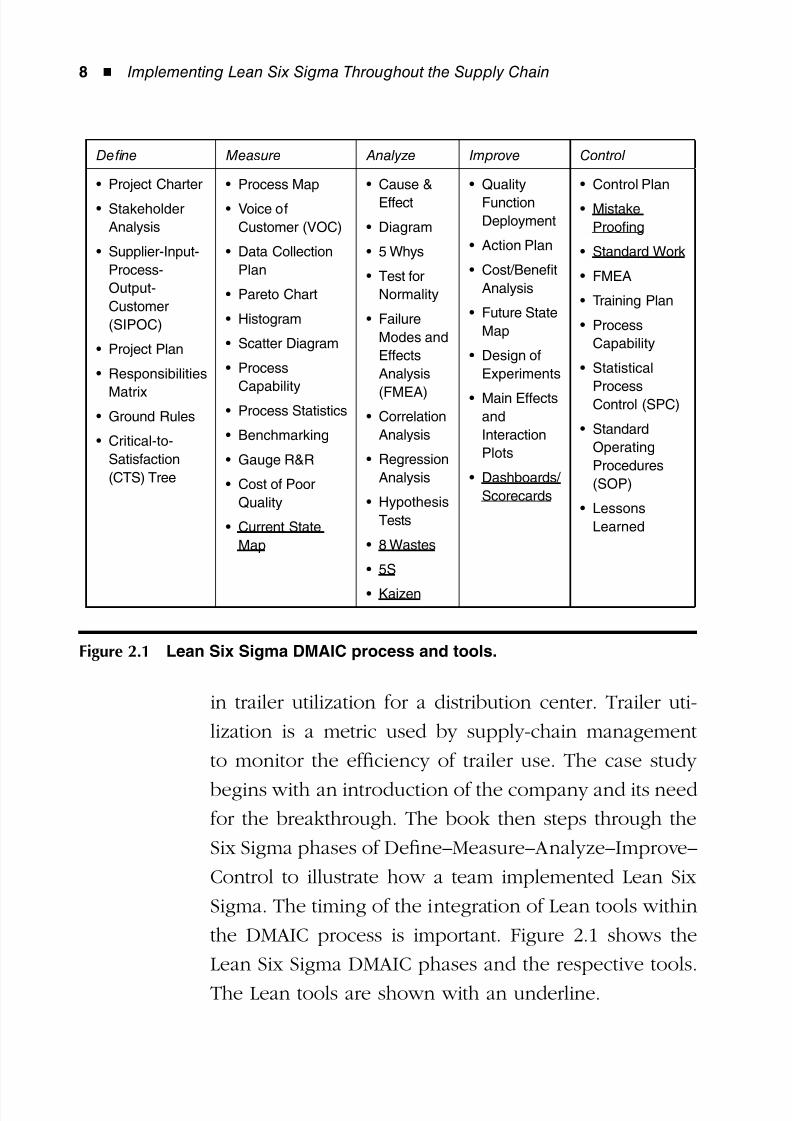
the DMAIC process is important. Figure 2.1 shows the
Lean Six Sigma DMAIC phases and the respective tools.
The Lean tools are shown with an underline.
Define Measure Analyze Improve Control
Project Charter•
Stakeholder•
Analysis
Supplier-Input-•
Process-
Output-
Customer
(SIPOC)
Project Plan•
Responsibilities•
MatrixGround Rules•
Critical-to-•
Satisfaction
(CTS) Tree
Process Map•
Voice of•
Customer (VOC)
Data Collection•
Plan
Pareto Chart•
Histogram•
Scatter Diagram•
Process•
CapabilityProcess Statistics•
Benchmarking•
Gauge R&R•
Cost of Poor•
Quality
Current State•
Map
Cause &•
Effect
Diagram•
5 Whys•
Test for•
Normality
Failure•
Modes and
Effects
Analysis
(FMEA)Correlation•
Analysis
Regression•
Analysis
Hypothesis•
Tests
8 Wastes•
5S•
Kaizen•
Quality•
Function
Deployment
Action Plan•
Cost/Benefit•
Analysis
Future State•
Map
Design of•
Experiments
Main Effects•
and
Interaction
Plots
Dashboards/•
Scorecards
Control Plan•
Mistake•
Proofing
Standard Work•
FMEA•
Training Plan•
Process•
Capability
Statistical•
ProcessControl (SPC)
Standard•
Operating
Procedures
(SOP)
Lessons•
Learned
Figure 2.1 Lean Six Sigma DMAIC process and tools.
8/12/2019 Implementing Lean Six Sigma Throughout the Supply Chain
http://slidepdf.com/reader/full/implementing-lean-six-sigma-throughout-the-supply-chain 26/278
Lean Six Sigma Overview ◾ 9
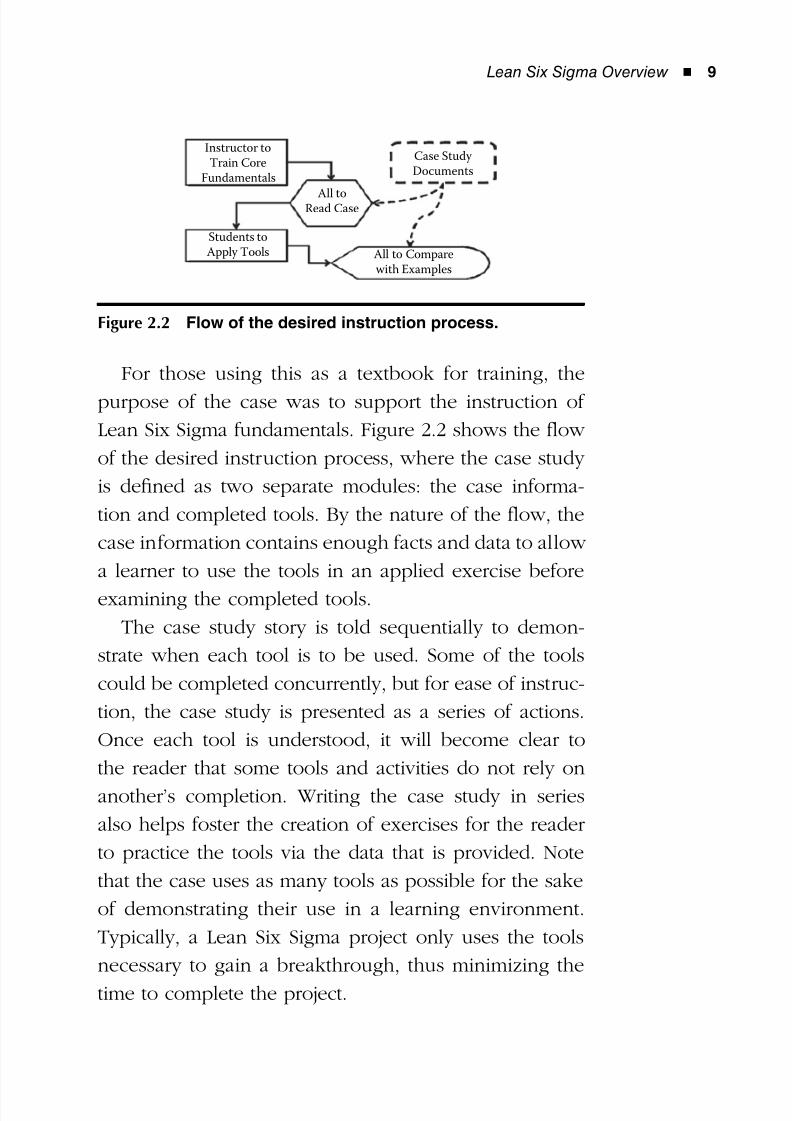
For those using this as a textbook for training, the
purpose of the case was to support the instruction of
Lean Six Sigma fundamentals. Figure 2.2 shows the flow
of the desired instruction process, where the case study
is defined as two separate modules: the case informa-
tion and completed tools. By the nature of the flow, the
case information contains enough facts and data to allow
a learner to use the tools in an applied exercise before
examining the completed tools.
The case study story is told sequentially to demon-
strate when each tool is to be used. Some of the tools
could be completed concurrently, but for ease of instruc-
tion, the case study is presented as a series of actions.
Once each tool is understood, it will become clear to
the reader that some tools and activities do not rely on
another’s completion. Writing the case study in series
also helps foster the creation of exercises for the reader
to practice the tools via the data that is provided. Note
that the case uses as many tools as possible for the sake
of demonstrating their use in a learning environment.
Typically, a Lean Six Sigma project only uses the tools
necessary to gain a breakthrough, thus minimizing the
time to complete the project.
Instructor toTrain Core
Fundamentals
Students toApply Tools
All toRead Case
Case Study Documents
All to Comparewith Examples
Figure 2.2 Flow of the desired instruction process.

8/12/2019 Implementing Lean Six Sigma Throughout the Supply Chain
http://slidepdf.com/reader/full/implementing-lean-six-sigma-throughout-the-supply-chain 27/278
8/12/2019 Implementing Lean Six Sigma Throughout the Supply Chain
http://slidepdf.com/reader/full/implementing-lean-six-sigma-throughout-the-supply-chain 28/278
11
3Chapter
Case StudyIntroduction
CJMart is a U.S.-based global distribution company.
After the most recent board meeting, the CEO revealed
the company strategy for the coming year. To help
meet shareholders’ demands and reduce costs, the CEO
declared that the company must reduce operating costs
by 15% to ensure the increase of annual profits by 10%.
Though this task was spread across the entire company,the senior vice president (SVP) of logistics aligned all
teams and challenged them to develop a list of projects
along with financial savings and resource requirements
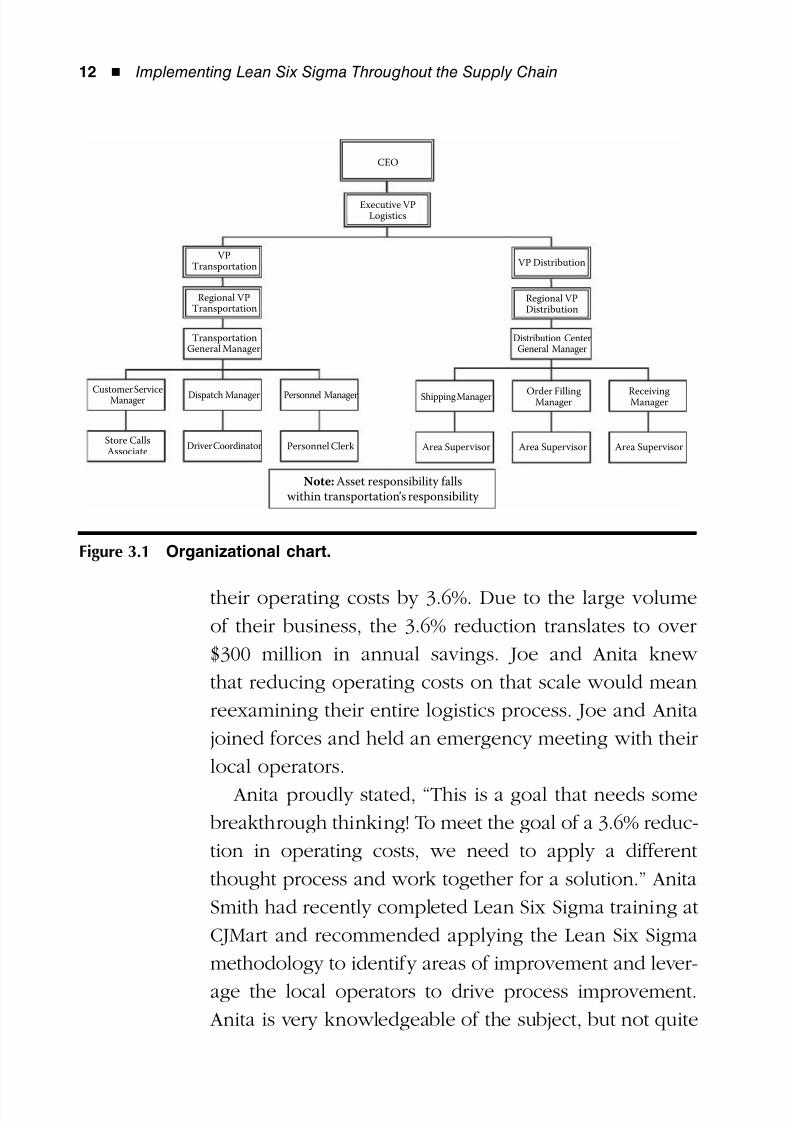
tied to each. Once this task was completed, the various
departments presented their findings to the Logistics
Executive Team (see Figure 3.1 for organizational chart).
After many hours of negotiation, the team was able tojointly set an achievable objective to reduce their inter-
nal operating costs by 10%. This cost reduction goal was
spread throughout all logistics regions and to the local
operating staff.
Joe Thompson, Midwest distribution vice president
(VP), and Anita Smith, Midwest transportation VP, both
received an e-mail requesting an agreement to reduce
8/12/2019 Implementing Lean Six Sigma Throughout the Supply Chain
http://slidepdf.com/reader/full/implementing-lean-six-sigma-throughout-the-supply-chain 29/278
12 ◾ Implementing Lean Six Sigma Throughout the Supply Chain
their operating costs by 3.6%. Due to the large volume
of their business, the 3.6% reduction translates to over
$300 million in annual savings. Joe and Anita knew
that reducing operating costs on that scale would mean
reexamining their entire logistics process. Joe and Anita
joined forces and held an emergency meeting with their
local operators.
Anita proudly stated, “This is a goal that needs some
breakthrough thinking! To meet the goal of a 3.6% reduc-
tion in operating costs, we need to apply a different
thought process and work together for a solution.” Anita
Smith had recently completed Lean Six Sigma training at
CJMart and recommended applying the Lean Six Sigma
methodology to identify areas of improvement and lever-
age the local operators to drive process improvement.
Anita is very knowledgeable of the subject, but not quite
Note: Asset responsibility fallswithin transportation’s responsibility
Personnel Manager
Distribution CenterGeneral Manager
Driver Coordinator
CEO
Executive VPLogistics
VPTransportation
Regional VPTransportation
TransportationGeneral Manager
Customer ServiceManager Dispatch Manager
Personnel Clerk
Shipping Manager
Area Supervisor Area Supervisor Area Supervisor
ReceivingManager
Order FillingManager
Store CallsAssociate
VP Distribution
Regional VPDistribution
Figure 3.1 Organizational chart.
8/12/2019 Implementing Lean Six Sigma Throughout the Supply Chain
http://slidepdf.com/reader/full/implementing-lean-six-sigma-throughout-the-supply-chain 30/278
Case Study Introduction ◾ 13
an expert. Her experience of 17 years in retail and distri-
bution will be an asset to the project.
Joe mentioned, “We need to assemble a team with
the help of an expert in Lean Six Sigma.” From there, Joe
and Anita knew what to do. Joe formulated a reply to
the Logistics Executive Team’s e-mail stating that he and
Ms. Smith would take the challenge of reducing their oper-
ating costs, but that they would need a Lean Six Sigma spe-
cialist to help direct their efforts. Jim Pulls, a Master Black
Belt (MBB), was then assigned to help all logistics regions
throughout the country with their cost-reduction goals.
Back in the Midwest, a core team was being formed,
which included Joe, Anita, and Jim. They met and dis-
cussed the list of opportunities developed by the logistics
engineering teams and identified which ideas to apply
to their business region. They agreed that driving utility
into their trailer equipment could be a quick way to impact
the bottom line. In order to drive utility into the equip-
ment, they must reduce the number of days that trailers
sit idle at distribution centers, behind stores, and at ven-
dors, and increase the number of turns of trailers in tran-
sit between locations. The team agreed that the measure
of a trailer’s utility would be defined as trailer utilization
(what percentage of time a trailer is in use versus sitting
idle). Therefore, to improve it, they would need up-to-
date trailer status data that would feed into an optimized
dispatch plan. The following is a summary of the case.
CEO requests 15% reduction of operating costs for◾
company.
This translates to a 10% reduction of operating costs◾
for the Logistics division.
8/12/2019 Implementing Lean Six Sigma Throughout the Supply Chain
http://slidepdf.com/reader/full/implementing-lean-six-sigma-throughout-the-supply-chain 31/278
14 ◾ Implementing Lean Six Sigma Throughout the Supply Chain
The Midwest region of Logistics is requested to reduce◾
operating costs by 3.6% to meet CEO’s requests.
Midwest region forms a Lean Six Sigma team.◾
Lean Six Sigma team chooses trailer utilization as the◾
process to be improved with a goal of cost reduction.
The Lean Six Sigma team now had an objective: to
investigate and identify changes in trailer utilization that
would result in a 3.6% reduction of the Midwest logis-
tics operating costs within a 4–6 month time period. As
another requirement, a final report to the SVP of logistics
should summarize all of the options available, the poten-
tial savings for each option, and supporting evidence
based on the Lean Six Sigma analysis process. During the
investigation, the Lean Six Sigma team will have access
to any member within the transportation and distribu-
tion groups. The access will be arranged ahead of time
and will be conducted in a professional and unobtrusive
manner. The goal is to help the Midwest logistics group
meet the company’s strategic goals.
Now that the project and goals have been selected, the
team moves forward with following the DMAIC method-
ology to improve trailer utilization. In the next chapter,
the team begins the Define phase to identify the custom-
ers for the process and their requirements.
8/12/2019 Implementing Lean Six Sigma Throughout the Supply Chain
http://slidepdf.com/reader/full/implementing-lean-six-sigma-throughout-the-supply-chain 32/278
15
4Chapter
Define Phase
Introduction
While in the Define phase, the Lean Six Sigma team
needs to establish the cause of their problem and set
the boundaries of the problem. The team should use the
Define phase to picture the process over time and pro-
vide insight about where the focus of improvement
efforts should be. In this case, we already know that the
improvement should be about trailer utilization, but what
are the other factors that relate to trailer utilization? During
the Define phase, it is critical to define who the custom-
ers are, what their requirements for trailer utilization are,
and what their expectations are. These requirements and
expectations are also known as the critical-to-satisfaction
(CTS) characteristics. By using a high-level process map,
the Supplier–Input–Process–Output–Customer (SIPOC)
diagram, they will also define the project’s boundaries,
the process(es) to improve, and what to improve. So, let’s
get back to the case.
As Anita and Jim begin the project, they start by meet-
ing with Senior Dispatch Manager Robert Quincy, Sr.
8/12/2019 Implementing Lean Six Sigma Throughout the Supply Chain
http://slidepdf.com/reader/full/implementing-lean-six-sigma-throughout-the-supply-chain 33/278
16 ◾ Implementing Lean Six Sigma Throughout the Supply Chain
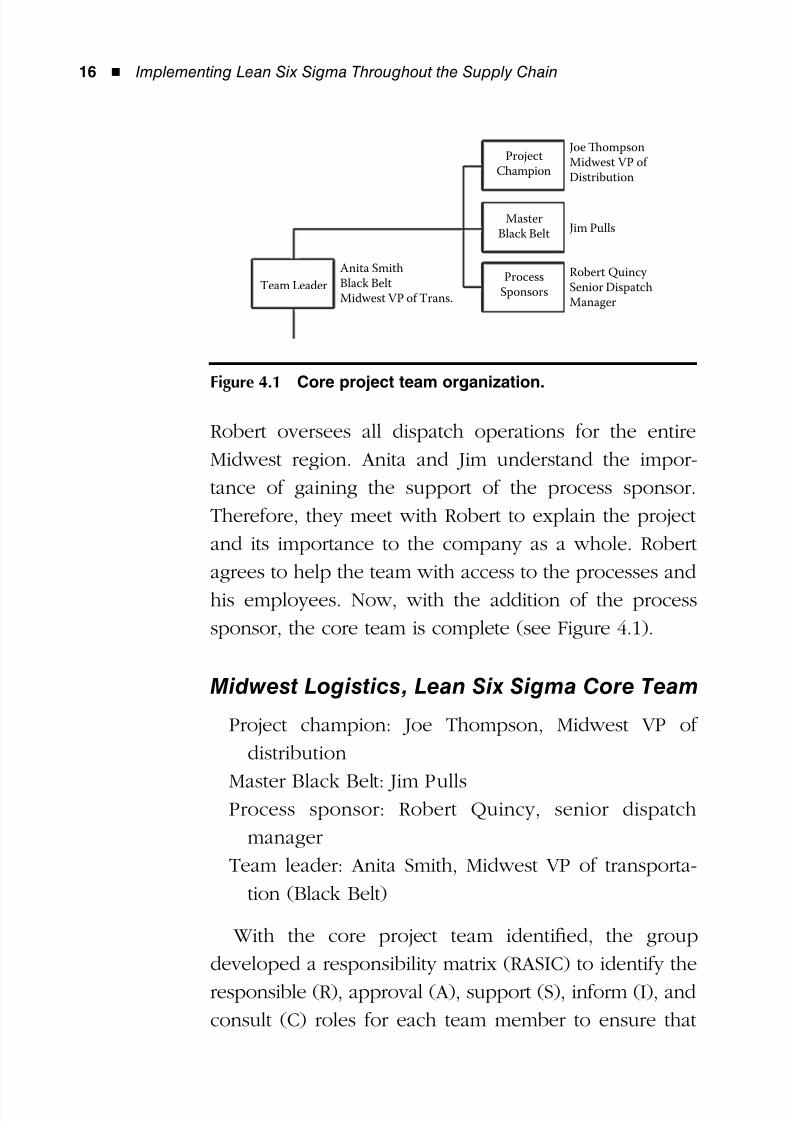
Robert oversees all dispatch operations for the entire
Midwest region. Anita and Jim understand the impor-
tance of gaining the support of the process sponsor.
Therefore, they meet with Robert to explain the project
and its importance to the company as a whole. Robert
agrees to help the team with access to the processes and
his employees. Now, with the addition of the process
sponsor, the core team is complete (see Figure 4.1).
Midwest Logistics, Lean Six Sigma Core Team
Project champion: Joe Thompson, Midwest VP of
distribution
Master Black Belt: Jim PullsProcess sponsor: Robert Quincy, senior dispatch
manager
Team leader: Anita Smith, Midwest VP of transporta-
tion (Black Belt)
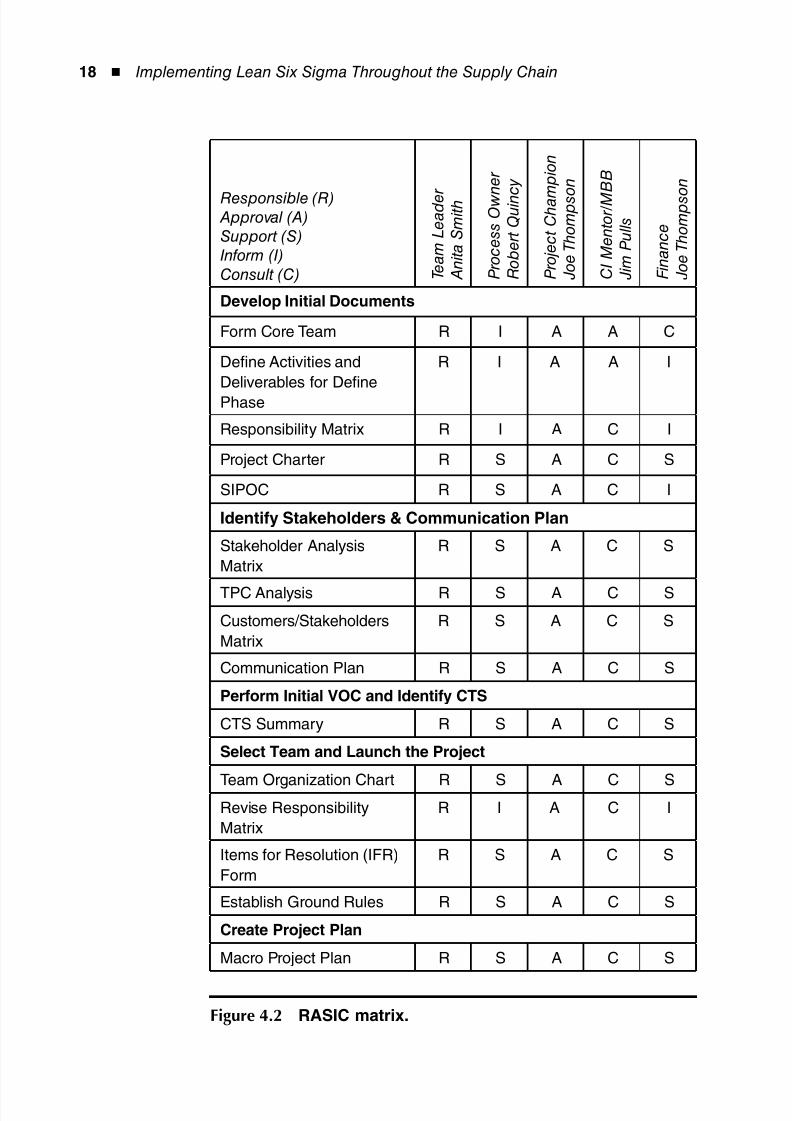
With the core project team identified, the group
developed a responsibility matrix (RASIC) to identify the
responsible (R), approval (A), support (S), inform (I), and
consult (C) roles for each team member to ensure that
ProjectChampion
MasterBlack Belt
ProcessSponsors
Joe ompsonMidwest VP of Distribution
Jim Pulls
Robert Quincy Senior DispatchManager
Anita SmithBlack BeltMidwest VP of Trans.
Team Leader
Figure 4.1 Core project team organization.
8/12/2019 Implementing Lean Six Sigma Throughout the Supply Chain
http://slidepdf.com/reader/full/implementing-lean-six-sigma-throughout-the-supply-chain 34/278
Define Phase ◾ 17
they understood their role(s) and responsibilities. The
RASIC matrix is shown in Figure 4.2.
With the roles defined for the team, it was now time
for the team to ask some critical questions to lay the
framework of the project. These questions would help
solidify the need, goals, deliverables, and deadlines for
the project and get the entire team moving in the same
direction. These questions included:
Why must this project be done now?◾
What is the business case of this project?◾
Who is the customer?◾
What is the current state?◾
What will be the future state?◾
What is the scope of the project?◾
What are the tangible deliverables?◾
What is the due date?◾
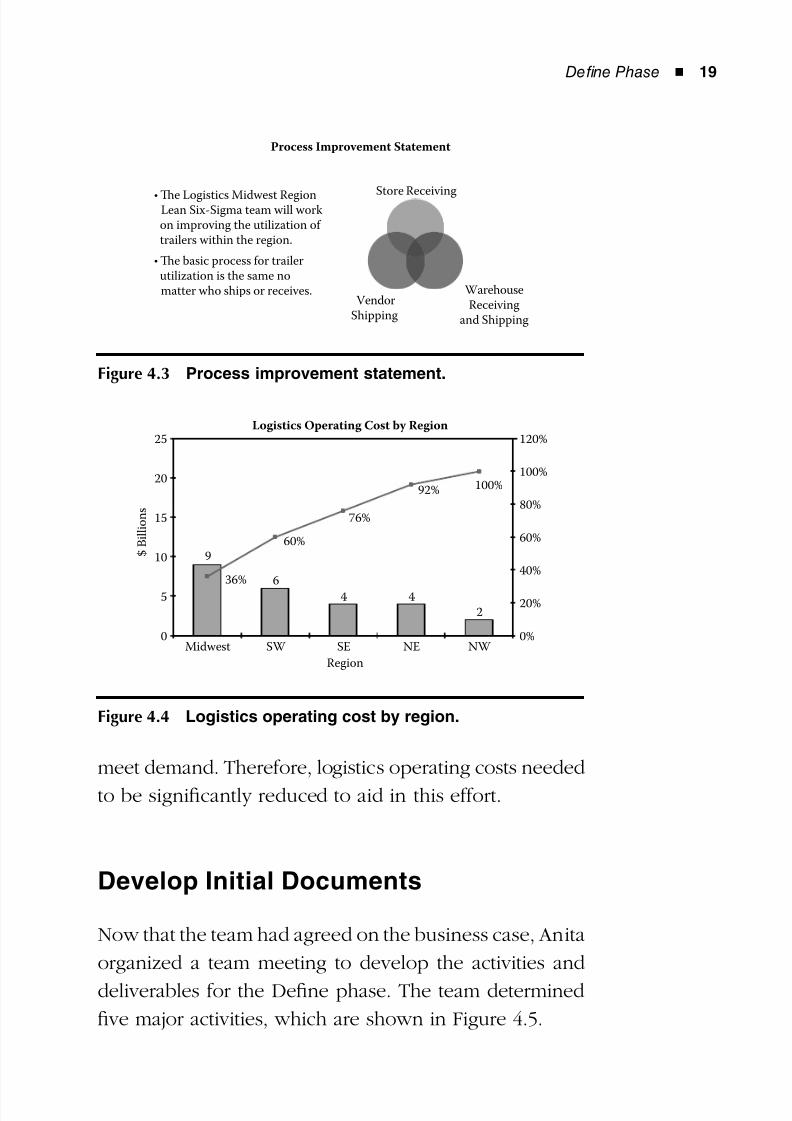
Using this information, the team formed a high-level
process-improvement statement, as shown in Figure 4.3,
to get the core team focusing on the same goal.
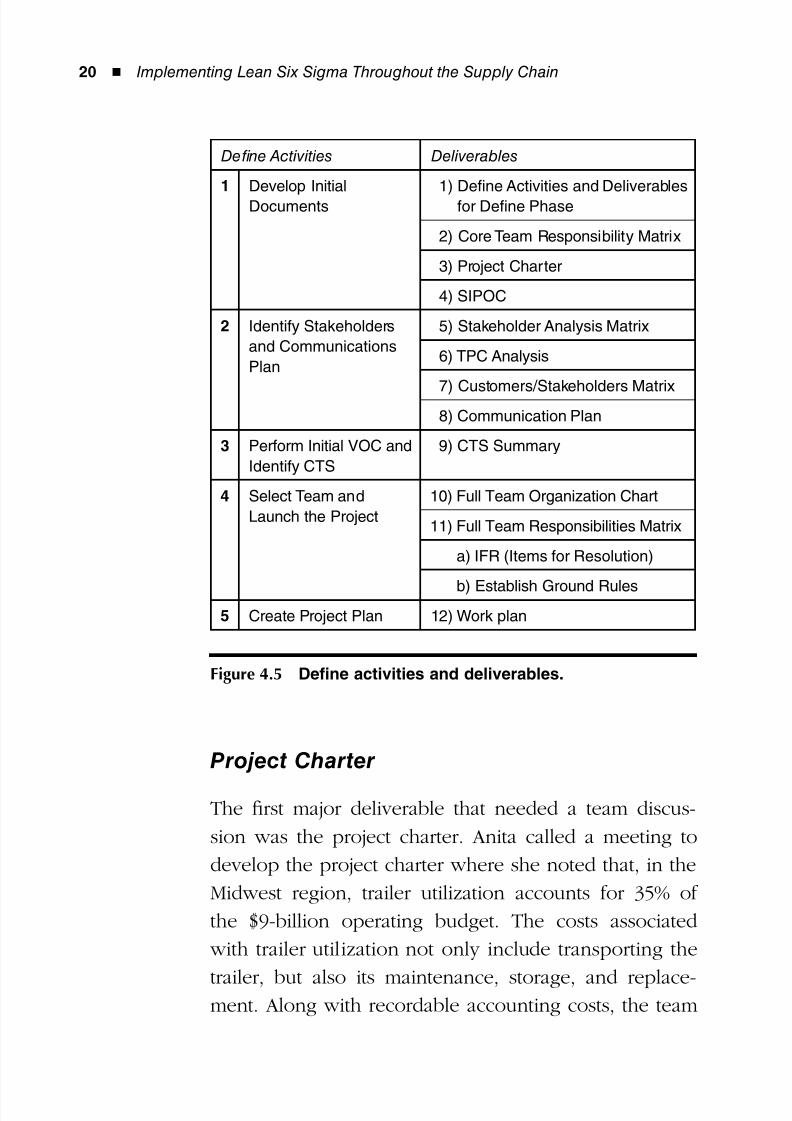
Joe Thompson, the project champion, began the next
meeting by restating the immediate need for this proj-
ect. Joe explained to the team that, with the decreasing
demand and increased competition, it was necessary for
the company to reduce operating costs by 15% for the
overall company. The Logistics division had agreed to
reduce their operating costs by 10%, which trickled down
to a 3.6% reduction in operating costs for the Midwest
region based on historical data as a baseline. The break-
down by region is given in Figure 4.4 (Data Figure 4.4).
With decreasing demand, customers were also hit
hard, so product sales prices needed to be lowered to
8/12/2019 Implementing Lean Six Sigma Throughout the Supply Chain
http://slidepdf.com/reader/full/implementing-lean-six-sigma-throughout-the-supply-chain 35/278
18 ◾ Implementing Lean Six Sigma Throughout the Supply Chain
Responsible (R) Approval (A)Support (S)Inform (I)Consult (C) T e
a m L e a d e r
A n i t a S m i t h
P r o c e s s O w n e r
R o b e r t Q u i n c
y
P r o j e c t C h a m
p i o n
J o e T h o m p s o
n
C I M e n t o r / M B B
J i m P u l l s
F i n a n c e
J o e T h o m p s o
n
Develop Initial Documents
Form Core Team R I A A C
Define Activities and
Deliverables for Define
Phase
R I A A I
Responsibility Matrix R I A C I
Project Charter R S A C S
SIPOC R S A C I
Identify Stakeholders & Communication Plan
Stakeholder Analysis
Matrix
R S A C S
TPC Analysis R S A C S
Customers/Stakeholders
Matrix
R S A C S
Communication Plan R S A C S
Perform Initial VOC and Identify CTS
CTS Summary R S A C S
Select Team and Launch the Project
Team Organization Chart R S A C SRevise Responsibility
Matrix
R I A C I
Items for Resolution (IFR)
Form
R S A C S
Establish Ground Rules R S A C S
Create Project Plan
Macro Project Plan R S A C S
Figure 4.2 RASIC matrix.
8/12/2019 Implementing Lean Six Sigma Throughout the Supply Chain
http://slidepdf.com/reader/full/implementing-lean-six-sigma-throughout-the-supply-chain 36/278
Define Phase ◾ 19
meet demand. Therefore, logistics operating costs needed
to be significantly reduced to aid in this effort.
Develop Initial Documents
Now that the team had agreed on the business case, Anita
organized a team meeting to develop the activities and
deliverables for the Define phase. The team determined
five major activities, which are shown in Figure 4.5.
Process Improvement Statement
• Te Logistics Midwest Region Lean Six-Sigma team will work on improving the utilization of trailers within the region.
• Te basic process for trailer utilization is the same no matter who ships or receives.
Store Receiving
WarehouseReceiving
and Shipping
VendorShipping
Figure 4.3 Process improvement statement.
Logistics Operating Cost by Region
9
6
2
36%
60%
76%
92% 100%
0
5
10
15
20
25
Region
$
B i l l i o n s
0%
20%
40%
60%
80%
100%
120%
Midwest SW SE NE NW
4 4
Figure 4.4 Logistics operating cost by region.
8/12/2019 Implementing Lean Six Sigma Throughout the Supply Chain
http://slidepdf.com/reader/full/implementing-lean-six-sigma-throughout-the-supply-chain 37/278
20 ◾ Implementing Lean Six Sigma Throughout the Supply Chain
Project Charter
The first major deliverable that needed a team discus-
sion was the project charter. Anita called a meeting to
develop the project charter where she noted that, in the
Midwest region, trailer utilization accounts for 35% of
the $9-billion operating budget. The costs associated
with trailer utilization not only include transporting the
trailer, but also its maintenance, storage, and replace-ment. Along with recordable accounting costs, the team
Define Activities Deliverables
1 Develop Initial
Documents
1) Define Activities and Deliverables
for Define Phase
2) Core Team Responsibility Matrix
3) Project Charter
4) SIPOC
2 Identify Stakeholders
and Communications
Plan
5) Stakeholder Analysis Matrix
6) TPC Analysis
7) Customers/Stakeholders Matrix 8) Communication Plan
3 Perform Initial VOC and
Identify CTS
9) CTS Summary
4 Select Team and
Launch the Project
10) Full Team Organization Chart
11) Full Team Responsibilities Matrix
a) IFR (Items for Resolution)
b) Establish Ground Rules5 Create Project Plan 12) Work plan
Figure 4.5 Define activities and deliverables.
8/12/2019 Implementing Lean Six Sigma Throughout the Supply Chain
http://slidepdf.com/reader/full/implementing-lean-six-sigma-throughout-the-supply-chain 38/278
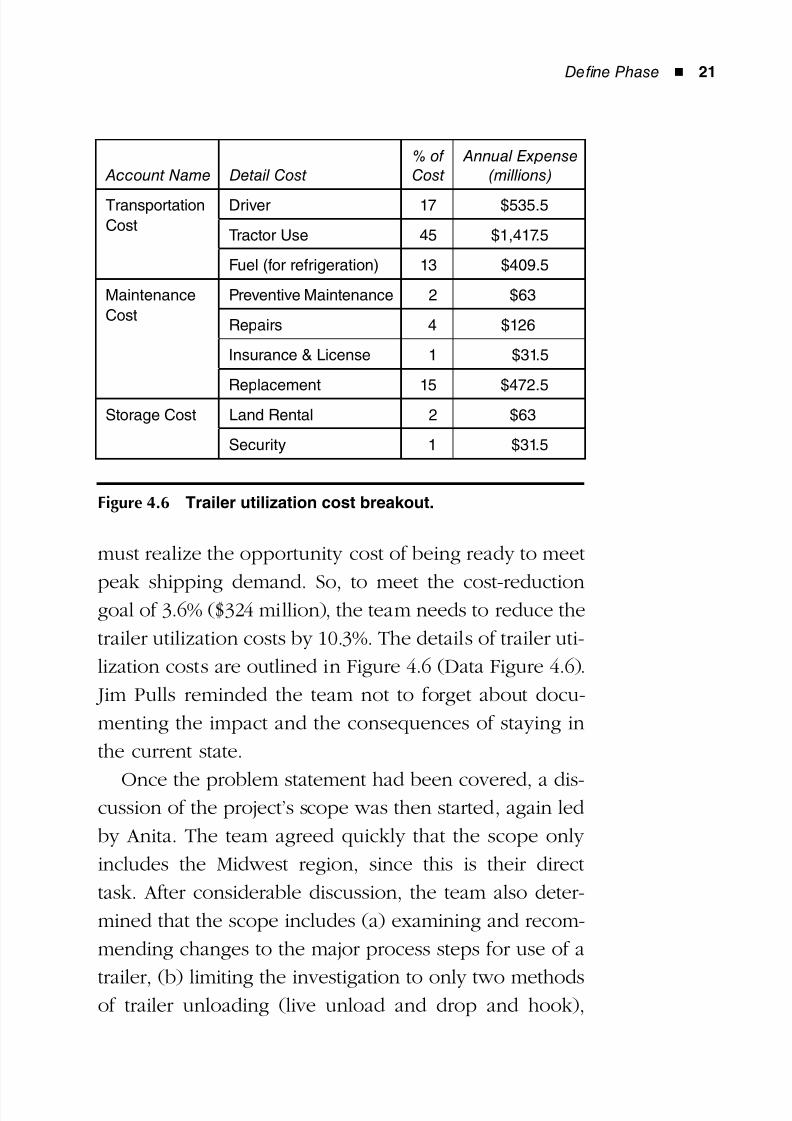
Define Phase ◾ 21
must realize the opportunity cost of being ready to meet
peak shipping demand. So, to meet the cost-reductiongoal of 3.6% ($324 million), the team needs to reduce the
trailer utilization costs by 10.3%. The details of trailer uti-
lization costs are outlined in Figure 4.6 (Data Figure 4.6).
Jim Pulls reminded the team not to forget about docu-
menting the impact and the consequences of staying in
the current state.
Once the problem statement had been covered, a dis-cussion of the project’s scope was then started, again led
by Anita. The team agreed quickly that the scope only
includes the Midwest region, since this is their direct
task. After considerable discussion, the team also deter-
mined that the scope includes (a) examining and recom-
mending changes to the major process steps for use of a
trailer, (b) limiting the investigation to only two methodsof trailer unloading (live unload and drop and hook),
Account Name Detail Cost % ofCost
Annual Expense(millions)
Transportation
Cost
Driver 17 $535.5
Tractor Use 45 $1,417.5
Fuel (for refrigeration) 13 $409.5
Maintenance
Cost
Preventive Maintenance 2 $63
Repairs 4 $126
Insurance & License 1 $31.5
Replacement 15 $472.5Storage Cost Land Rental 2 $63
Security 1 $31.5
Figure 4.6 Trailer utilization cost breakout.
8/12/2019 Implementing Lean Six Sigma Throughout the Supply Chain
http://slidepdf.com/reader/full/implementing-lean-six-sigma-throughout-the-supply-chain 39/278
22 ◾ Implementing Lean Six Sigma Throughout the Supply Chain
and (c) deciding that unloading may occur at a distribu-
tion center or store.
The next step of developing the charter was to deter-
mine the customers/stakeholders and their critical-to-
success factors. For this discussion, Anita asked Jim Pulls to
help move the team in the right direction. An initial brain-
storming list of the customers/stakeholders included:
Driver◾
Transportation personnel◾
Warehouse receiving and shipping personnel◾
Store receiving personnel◾
Vendor shipping personnel◾
Now that the customers/stakeholders had been identi-
fied, a very lengthy discussion was held to develop an
initial list of factors that are critical to success. These fac-tors include:
1. Up-to-date trailer status
2. Optimized trailer dispatch plan
3. Open communication of critical or jeopardy events
4. Realistic process time estimates
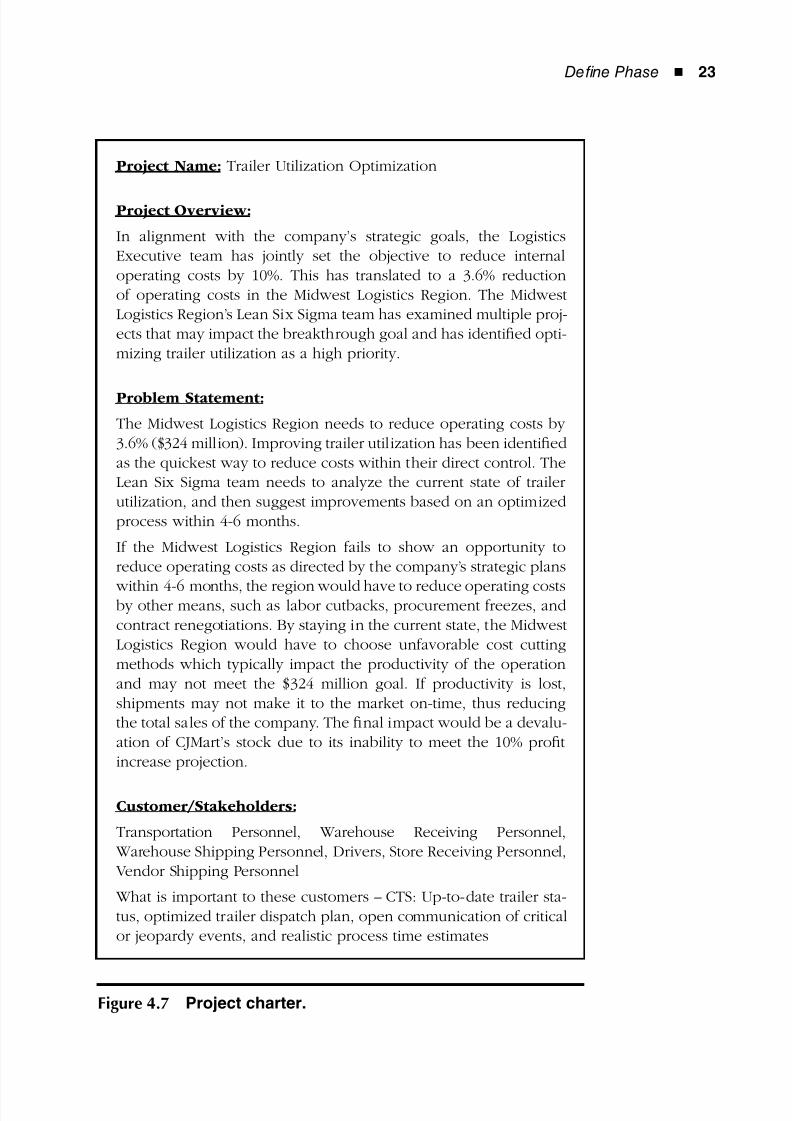
The project goal, the scope, and the financial benefit
of the project had been determined in previous meetings,
so Anita restated each item and asked for final approval
from the team. The team then finalized the project char-
ter, as shown in Figure 4.7, and submitted it to the senior
vice president (SVP) for management approval and signa-
tures. This ensures that the team has complete support
from top management. Then Jim Pulls asked the team
about risk management for the project.
8/12/2019 Implementing Lean Six Sigma Throughout the Supply Chain
http://slidepdf.com/reader/full/implementing-lean-six-sigma-throughout-the-supply-chain 40/278
Define Phase ◾ 23
Project Name: Trailer Utilization Optimization
Project Overview:
In alignment with the company’s strategic goals, the LogisticsExecutive team has jointly set the objective to reduce internaloperating costs by 10%. This has translated to a 3.6% reductionof operating costs in the Midwest Logistics Region. The MidwestLogistics Region’s Lean Six Sigma team has examined multiple proj-ects that may impact the breakthrough goal and has identified opti-mizing trailer utilization as a high priority.
Problem Statement:
The Midwest Logistics Region needs to reduce operating costs by3.6% ($324 million). Improving trailer utilization has been identifiedas the quickest way to reduce costs within their direct control. TheLean Six Sigma team needs to analyze the current state of trailerutilization, and then suggest improvements based on an optimizedprocess within 4-6 months.
If the Midwest Logistics Region fails to show an opportunity toreduce operating costs as directed by the company’s strategic plans
within 4-6 months, the region would have to reduce operating costsby other means, such as labor cutbacks, procurement freezes, andcontract renegotiations. By staying in the current state, the MidwestLogistics Region would have to choose unfavorable cost cuttingmethods which typically impact the productivity of the operationand may not meet the $324 million goal. If productivity is lost,shipments may not make it to the market on-time, thus reducingthe total sales of the company. The final impact would be a devalu-ation of CJMart’s stock due to its inability to meet the 10% profitincrease projection.
Customer/Stakeholders:
Transportation Personnel, Warehouse Receiving Personnel, Warehouse Shipping Personnel, Drivers, Store Receiving Personnel, Vendor Shipping Personnel
What is important to these customers – CTS: Up-to-date trailer sta-tus, optimized trailer dispatch plan, open communication of criticalor jeopardy events, and realistic process time estimates
Figure 4.7 Project charter.
8/12/2019 Implementing Lean Six Sigma Throughout the Supply Chain
http://slidepdf.com/reader/full/implementing-lean-six-sigma-throughout-the-supply-chain 41/278
24 ◾ Implementing Lean Six Sigma Throughout the Supply Chain
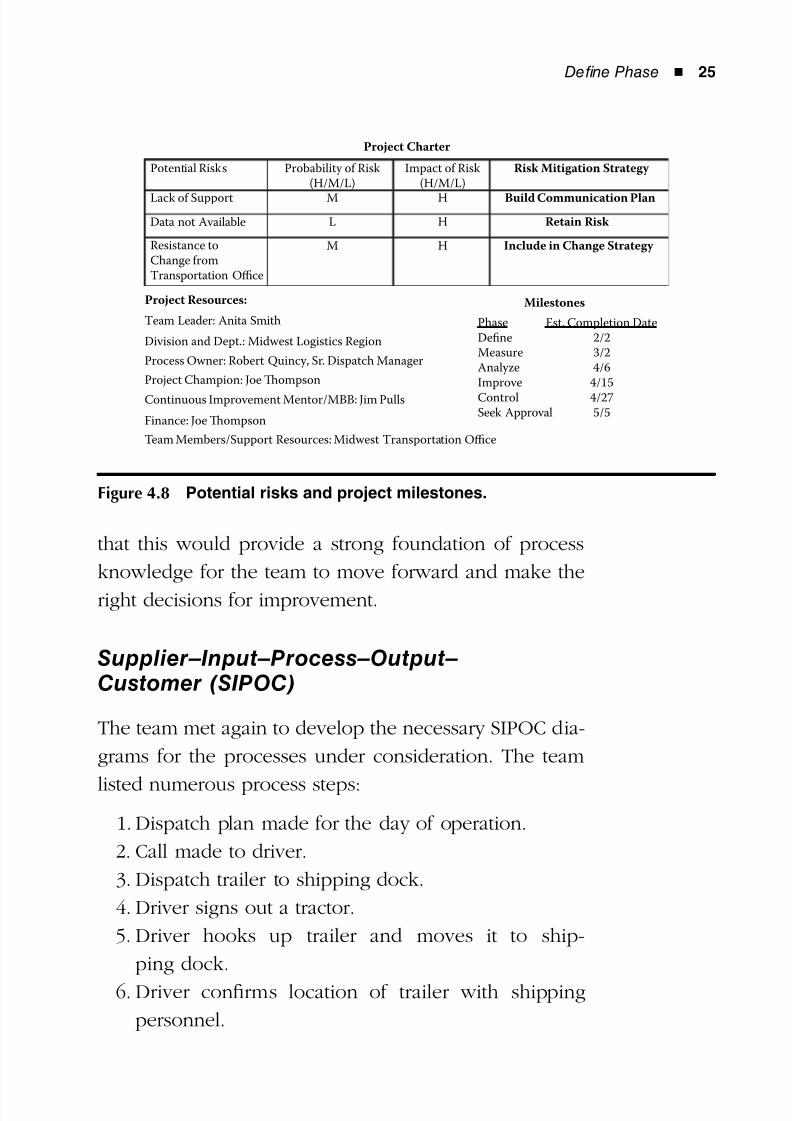
Jim advised the team to manage risk by anticipating
problems. Planning for problems is the best way to reduce
or even avoid them. Even at this early point of the proj-
ect, many risk events can be defined, and strategies to
respond to them can be planned. Anita finalized the team
charter by adding potential risks and project milestones,
as shown in Figure 4.8. She ended the meeting by sched-
uling the next team meeting to develop SIPOC diagrams.
(Meeting side notes): Robert Quincy suggested the
team make an assumption on the partnership between
transportation, warehouse, store, and vendor personnel.
He stated that the overall success of the project would
depend heavily on these areas working closely together.
Anita stressed the need for a complete process map to
gather and analyze the process. She also felt strongly
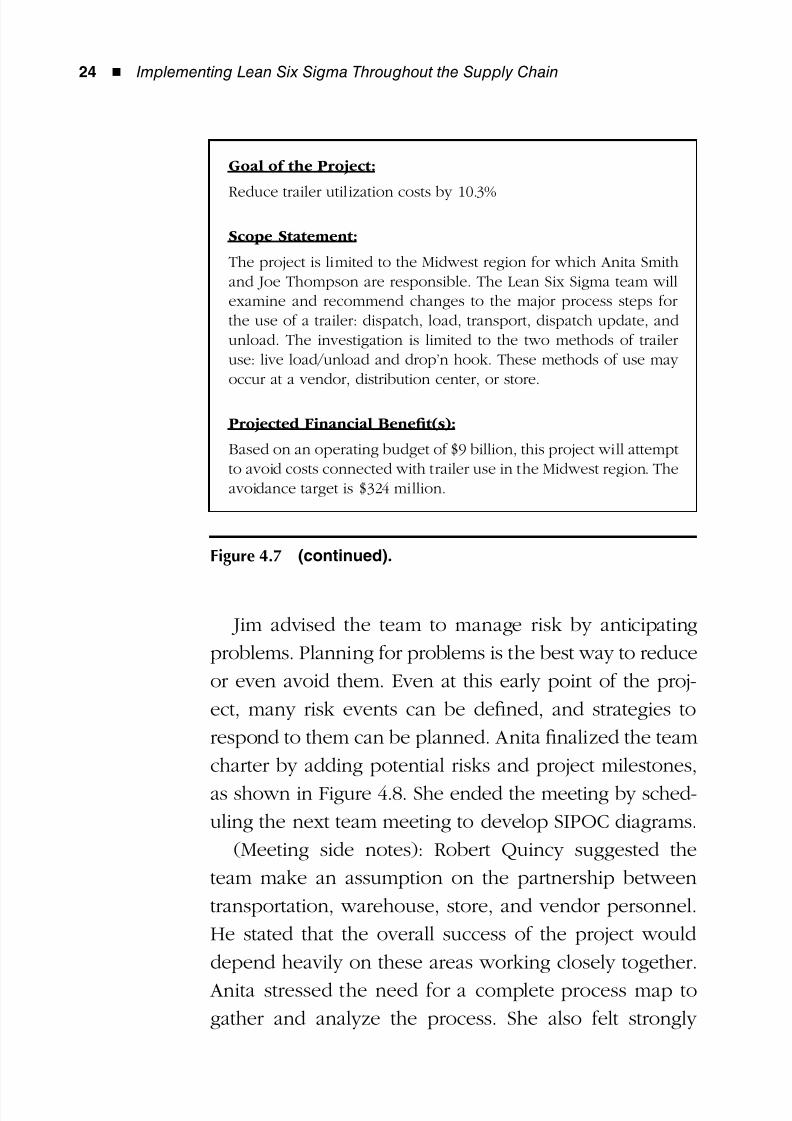
Goal of the Project:
Reduce trailer utilization costs by 10.3%
Scope Statement:
The project is limited to the Midwest region for which Anita Smithand Joe Thompson are responsible. The Lean Six Sigma team willexamine and recommend changes to the major process steps forthe use of a trailer: dispatch, load, transport, dispatch update, andunload. The investigation is limited to the two methods of traileruse: live load/unload and drop’n hook. These methods of use mayoccur at a vendor, distribution center, or store.
Projected Financial Benefit(s):
Based on an operating budget of $9 billion, this project will attemptto avoid costs connected with trailer use in the Midwest region. Theavoidance target is $324 million.
Figure 4.7 (continued).
8/12/2019 Implementing Lean Six Sigma Throughout the Supply Chain
http://slidepdf.com/reader/full/implementing-lean-six-sigma-throughout-the-supply-chain 42/278
Define Phase ◾ 25
that this would provide a strong foundation of process
knowledge for the team to move forward and make the
right decisions for improvement.
Supplier–Input–Process–Output– Customer (SIPOC)
The team met again to develop the necessary SIPOC dia-
grams for the processes under consideration. The team
listed numerous process steps:
1. Dispatch plan made for the day of operation.
2. Call made to driver.
3. Dispatch trailer to shipping dock.
4. Driver signs out a tractor.
5. Driver hooks up trailer and moves it to ship-
ping dock.
6. Driver confirms location of trailer with shipping
personnel.
Project Charter
Potential Risks
Lack of Support
Resistance toChange fromTransportation Office
Probability of Risk(H/M/L)
Impact of Risk(H/M/L)
Risk Mitigation Strategy
Build Communication Plan
Retain Risk
Include in Change Strategy
M
M
L
H
H
H
Project Resources: Milestones
PhaseDefineMeasureAnalyzeImprove
ControlSeek Approval
Est. Completion Date2/23/24/6
4/15
4/275/5
Team Leader: Anita Smith
Division and Dept.: Midwest Logistics Region
Process Owner: Robert Quincy, Sr. Dispatch Manager
Project Champion: Joe ompson
Continuous Improvement Mentor/MBB: Jim Pulls
Finance: Joe ompson
Team Members/Support Resources: Midwest Transportation Office
Data not Available
Figure 4.8 Potential risks and project milestones.
8/12/2019 Implementing Lean Six Sigma Throughout the Supply Chain
http://slidepdf.com/reader/full/implementing-lean-six-sigma-throughout-the-supply-chain 43/278
26 ◾ Implementing Lean Six Sigma Throughout the Supply Chain
7. Load product on trailer.
8. Driver picks up paperwork and secures load.
9. Transport trailer to store staging zone.
10. Driver reports status to transportation coordinator
via cell phone.
11. Driver receives dispatch update.
12. Trailer arrives at receiving dock.
13. Driver presents paperwork to receiving dock (either
waits for unload or drops off trailer).
14. Product unloaded.
15. Trailer dispatched to another shipping dock (this
could be at a vendor or at a warehouse).
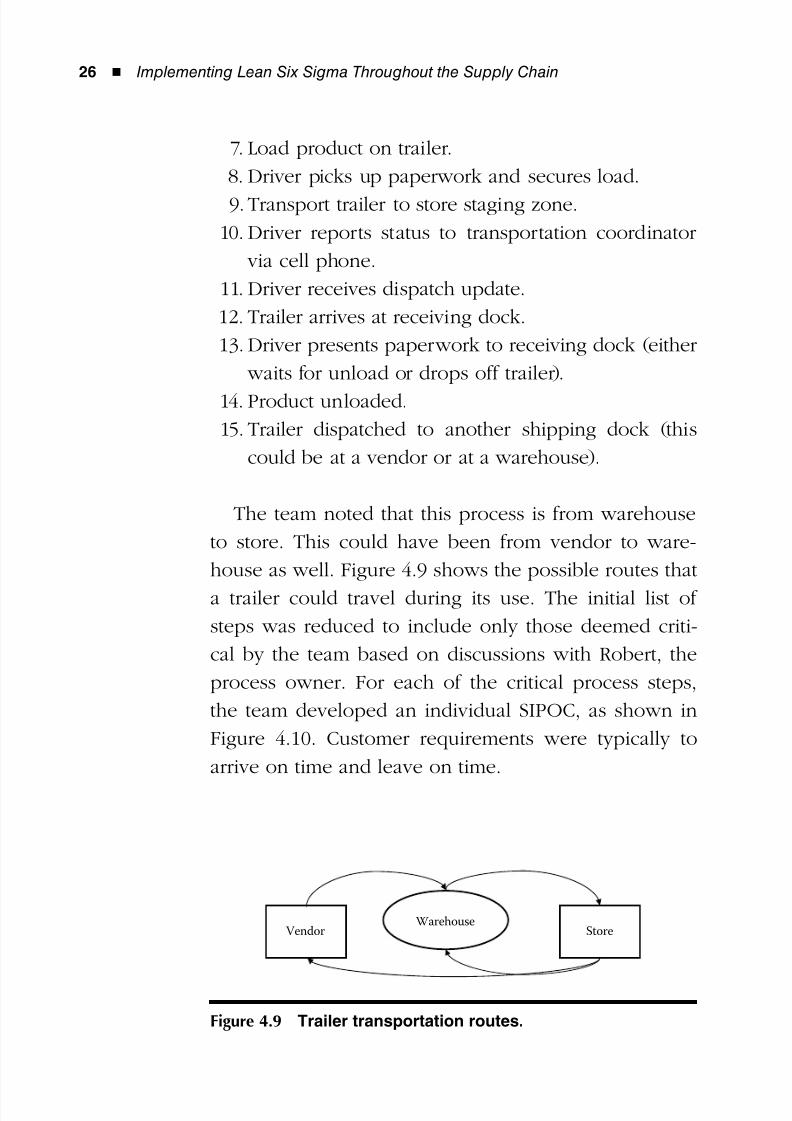
The team noted that this process is from warehouse
to store. This could have been from vendor to ware-
house as well. Figure 4.9 shows the possible routes that
a trailer could travel during its use. The initial list of
steps was reduced to include only those deemed criti-
cal by the team based on discussions with Robert, the
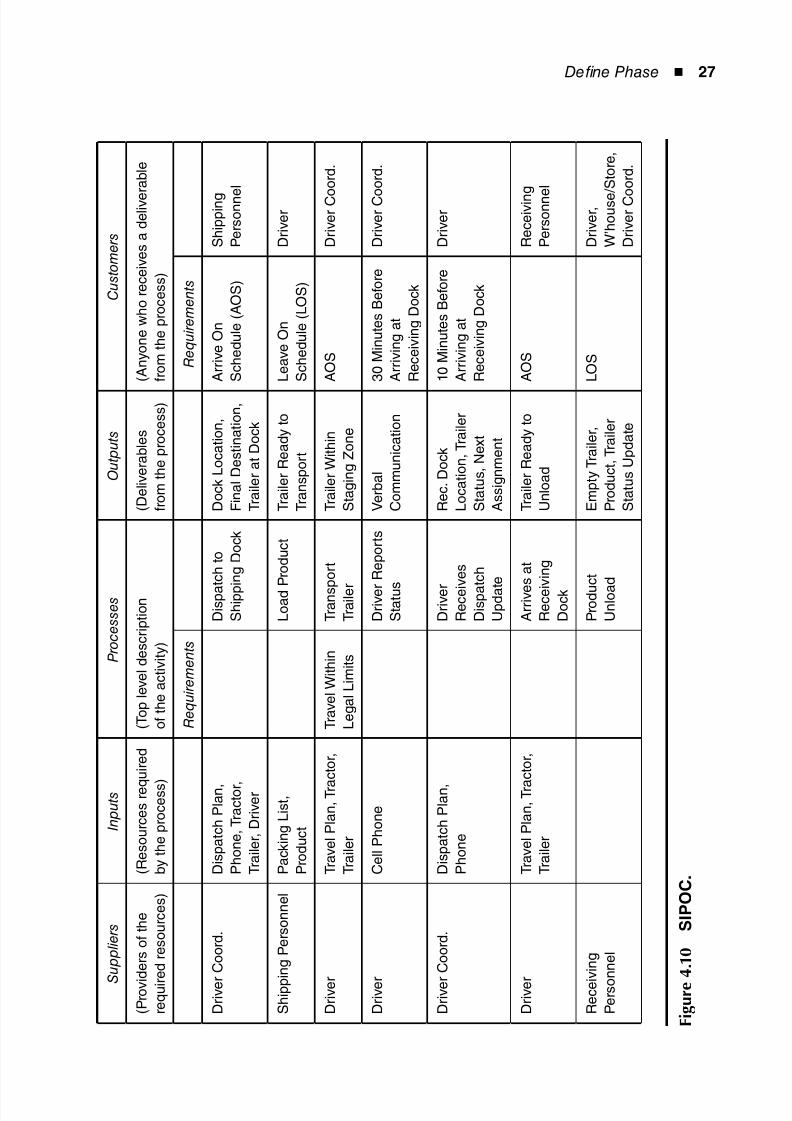
process owner. For each of the critical process steps,
the team developed an individual SIPOC, as shown in
Figure 4.10. Customer requirements were typically to
arrive on time and leave on time.
WarehouseVendor Store
Figure 4.9 Trailer transportation routes.
8/12/2019 Implementing Lean Six Sigma Throughout the Supply Chain
http://slidepdf.com/reader/full/implementing-lean-six-sigma-throughout-the-supply-chain 44/278
Define Phase ◾ 27
S
u p p l i e r s
I n p u t s
P r o c e s s e s
O u t p u t s
C u s t o m e r s
( P r o v i d e r s o f t h e
r e q u i r e d r e s o u r c e s )
( R e s o u r c e s r e q
u i r e d
b y t h e p r o c e s s )
( T o p l e v e l d e s c r i p t i o n
o f t h e a c t i v i t y )
( D e l i v e r a b l e s
f r o m t h e p r o c e s s )
( A n y o n e w h o r e c e i v e s a d e l i v e r a b l e
f r o m t h e p r o c e s s )
R e q u i r e m e n t s
R e q u i r e m e n t s
D r i v e r C o o r d .
D i s p a t c h P l a n ,
P h o n e , T r a c t o r ,
T r a i l e r , D r i v e r
D i s p a t c h t o
S h i p p i n g D o c k
D o c k L o c a t i o n ,
F i n a l D e s t i n a t i o n ,
T r a i l e r a t D o c k
A r r i v e O n
S c h e d u l e ( A O S )
S h i p p i n g
P e r s o n n e l
S h i p p
i n g P e r s o n n e l
P a c k i n g L i s t ,
P r o d u c t
L o a d P r o d u c t
T r a i l e r R e a d y t o
T r a n s p o r t
L e a v e O n
S c h e d u l e ( L O S )
D r i v e r
D r i v e r
T r a v e l P l a n , T r a
c t o r ,
T r a i l e r
T r a v e l W i t h i n
L e g a l L i m i t s
T r a n s p o r t
T r a i l e r
T r a i l e r W i t h i n
S t a g i n g Z o n e
A O S
D r i v e r C o
o r d .
D r i v e r
C e l l P h o n e
D r i v e r R e p o r t s
S t a t u s
V e r b a l
C o m m u n i c a t i o n
3 0 M i n u t e s B e f o r e
A r r i v i n g a t
R e c e i v i n g D o c k
D r i v e r C o
o r d .
D r i v e r C o o r d .
D i s p a t c h P l a n ,
P h o n e
D r i v e r
R e c e i v e s
D i s p a t c h
U p d a t e
R e c . D o c k
L o c a t i o n , T r a i l e r
S t a t u s , N e x t
A s s i g n m e n t
1 0 M i n u t e s B e f o r e
A r r i v i n g a t
R e c e i v i n g D o c k
D r i v e r
D r i v e r
T r a v e l P l a n , T r a
c t o r ,
T r a i l e r
A r r i v e
s a t
R e c e i v i n g
D o c k
T r a i l e r R e a d y t o
U n l o a d
A O S
R e c e i v i n g
P e r s o n n e l
R e c e i v i n g
P e r s o
n n e l
P r o d u
c t
U n l o a
d
E m p t y T r a i l e r ,
P r o d u c t , T r a i l e r
S t a t u s U p d a t e
L O S
D r i v e r ,
W ’ h o u s e / S t o r e ,
D r i v e r C o
o r d .
F i g u r e
4 . 1
0
S I P O C .
8/12/2019 Implementing Lean Six Sigma Throughout the Supply Chain
http://slidepdf.com/reader/full/implementing-lean-six-sigma-throughout-the-supply-chain 45/278
28 ◾ Implementing Lean Six Sigma Throughout the Supply Chain
Identify Stakeholders and DevelopCommunication Plan
In the next step, Anita led the team in identifying the
stakeholders and developing a communication plan. The
team decided to start by developing a stakeholder analy-
sis matrix to address the potential impact or concerns of
the stakeholders. The team broke down the stakeholders
that were outlined in the project charter as follows:
Transportation personnel◾
General manager
Dispatch manager
Driver coordinator
Driver (any driver of a CJMart trailer)◾
Warehouse and receiving/shipping personnel◾
Warehouse manager
Receiving manager
Shipping manager
Dock personnel
Vendor and shipping personnel◾
Operations manager
Shipping managerDock personnel
Store receiving personnel◾
Store manager
Receiving-dock personnel
Robert Quincy made sure the team noted that, within
a region, there were multiple transportation offices and
warehouses. Therefore, the stakeholder analysis and
8/12/2019 Implementing Lean Six Sigma Throughout the Supply Chain
http://slidepdf.com/reader/full/implementing-lean-six-sigma-throughout-the-supply-chain 46/278
Define Phase ◾ 29
communication plan must be a generalization of the
positions referenced.
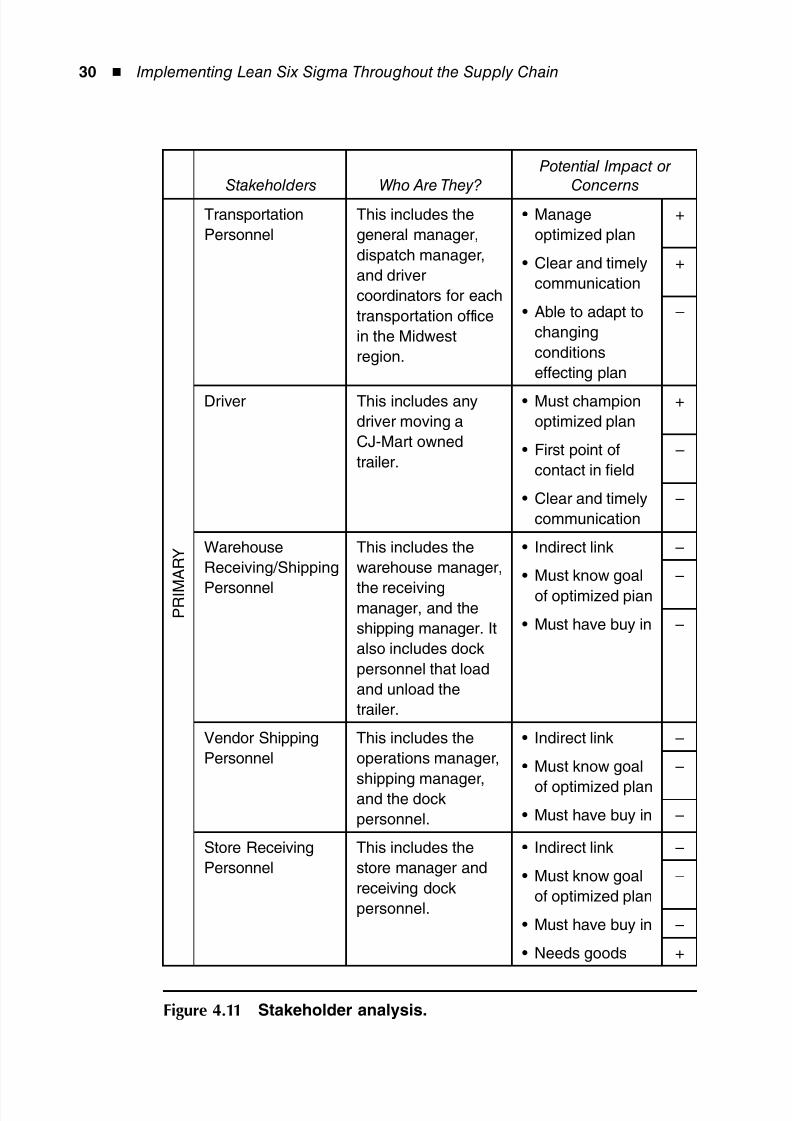
Once the stakeholder analysis matrix was completed,
as shown in Figure 4.11, the team began to look at the
sources of resistance that would make change difficult
within the project scope. The team performed a TPC
analysis (Technical, Political, or Cultural) for each stake-
holder group to figure out how to influence change.
Again, the stakeholders were generalizations of the pop-
ulations that each represented. The team also agreed to
do a TPC analysis for a single person if any individuals
were found to show more resistance than anticipated.
Some of the examples of resistance for each stakeholder
that the team brainstormed are listed here:
Transportation personnel
Learn a new dispatch planning and execution◾
process
Why fix what isn’t broke◾
Lean Six Sigma team doesn’t know my process◾
Driver (any driver of a CJMart trailer)
Doesn’t want to be watched so closely ◾
Thinks the schedule may become too rigid◾
Doesn’t want performance data tied to merit◾
increases
Warehouse and receiving/shipping personnel
Forced to work faster loading or unloading; may◾
be unsafe and reduce quality
Reduced number of personnel per load or◾
unload event
Not happy to have transportation pushing ware-◾
house personnel
8/12/2019 Implementing Lean Six Sigma Throughout the Supply Chain
http://slidepdf.com/reader/full/implementing-lean-six-sigma-throughout-the-supply-chain 47/278
30 ◾ Implementing Lean Six Sigma Throughout the Supply Chain
Stakeholders Who Are They?Potential Impact or
Concerns
P R I M
A R Y
Transportation
Personnel
This includes the
general manager,
dispatch manager,
and driver
coordinators for each
transportation office
in the Midwest
region.
Manage•
optimized plan
+
Clear and timely•
communication
+
Able to adapt to•
changing
conditions
effecting plan
–
Driver This includes any
driver moving a
CJ-Mart owned
trailer.
Must champion•
optimized plan
+
First point of•
contact in field
–
Clear and timely•
communication
–
Warehouse
Receiving/Shipping
Personnel
This includes the
warehouse manager,
the receivingmanager, and the
shipping manager. It
also includes dock
personnel that load
and unload the
trailer.
Indirect link• –
Must know goal•
of optimized pian
–
Must have buy in• –
Vendor Shipping
Personnel
This includes the
operations manager,
shipping manager,and the dock
personnel.
Indirect link• –
Must know goal•
of optimized plan
–
Must have buy in• –
Store Receiving
Personnel
This includes the
store manager and
receiving dock
personnel.
Indirect link• –
Must know goal•
of optimized plan
–
Must have buy in• –
Needs goods• +
Figure 4.11 Stakeholder analysis.
8/12/2019 Implementing Lean Six Sigma Throughout the Supply Chain
http://slidepdf.com/reader/full/implementing-lean-six-sigma-throughout-the-supply-chain 48/278
Define Phase ◾ 31
Vendor and shipping personnel
Worried that trailers will be taken at unpredict-◾
able or inconsistent times
Store receiving personnel
Afraid new standards will be set for unloading◾
trailers that are too difficult and dangerous
This enabled Anita to help the team understand the
nature of the resistance they may face with implement-
ing the project. The team also assigned percentages for
the resistance based on whether they felt it would be
technical, political, or cultural. In addition, this helped
the team identify strategies and apply influence pressure
to overcome resistance.
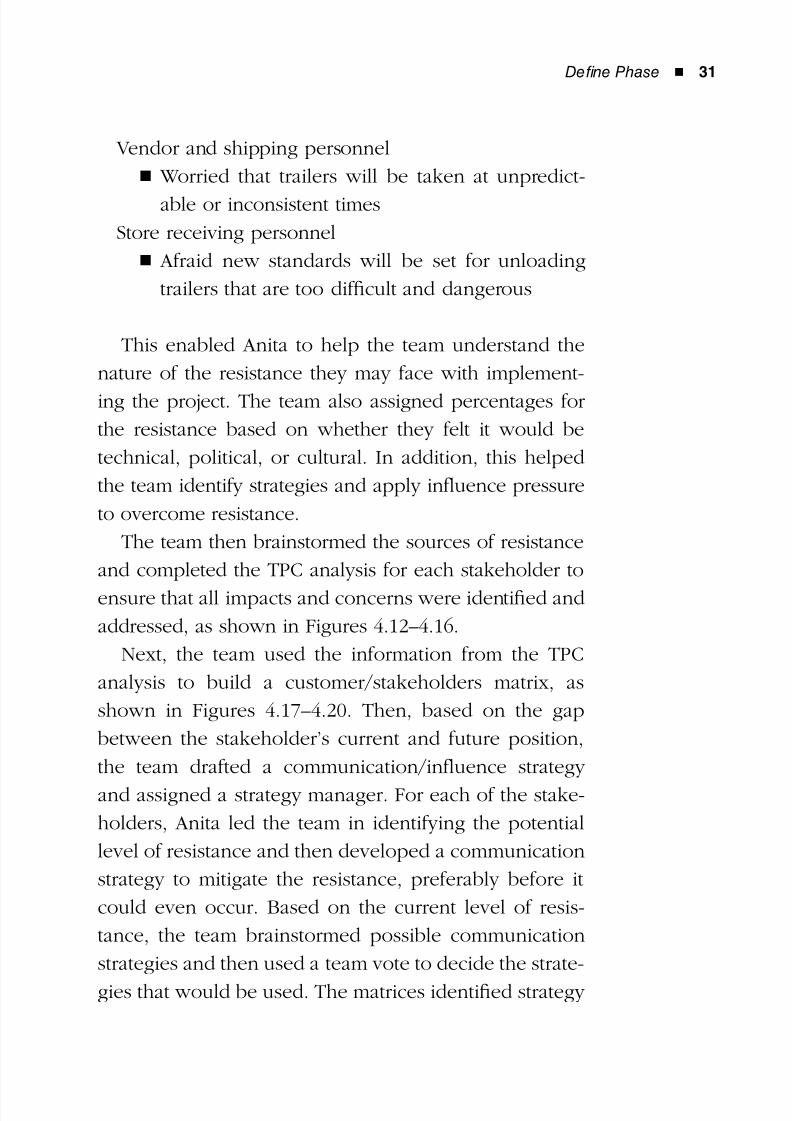
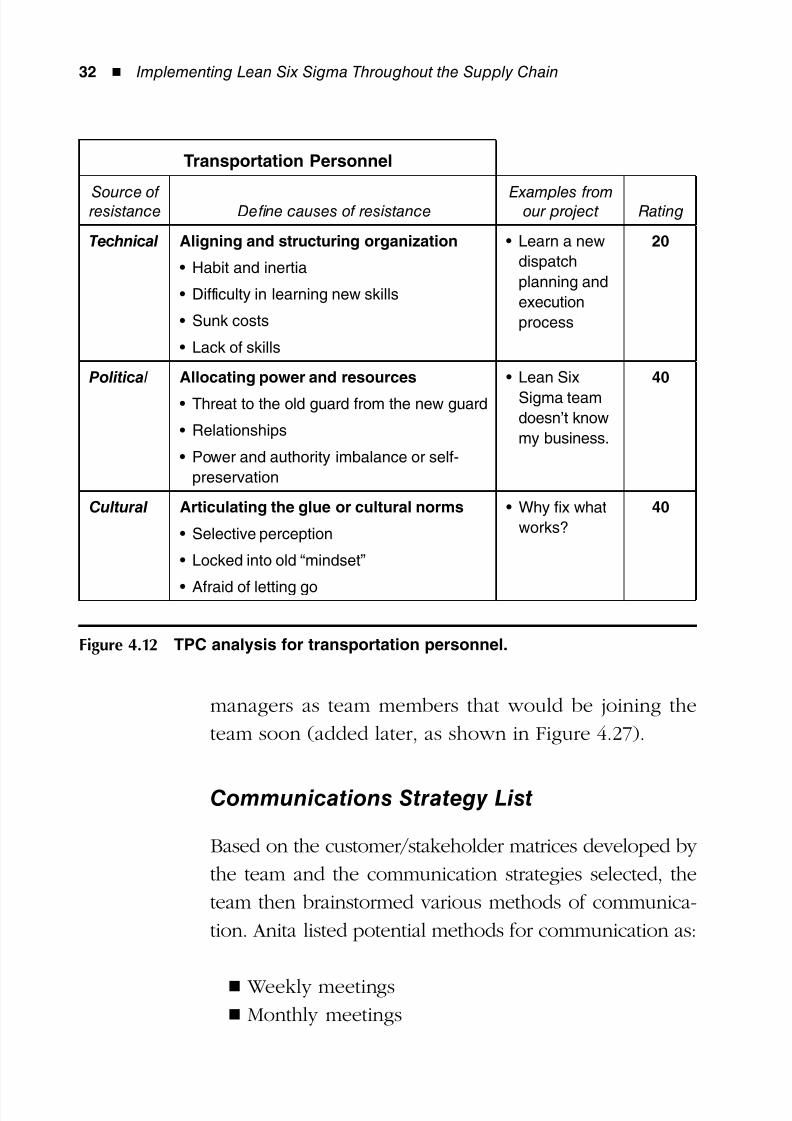
The team then brainstormed the sources of resistance
and completed the TPC analysis for each stakeholder to
ensure that all impacts and concerns were identified and
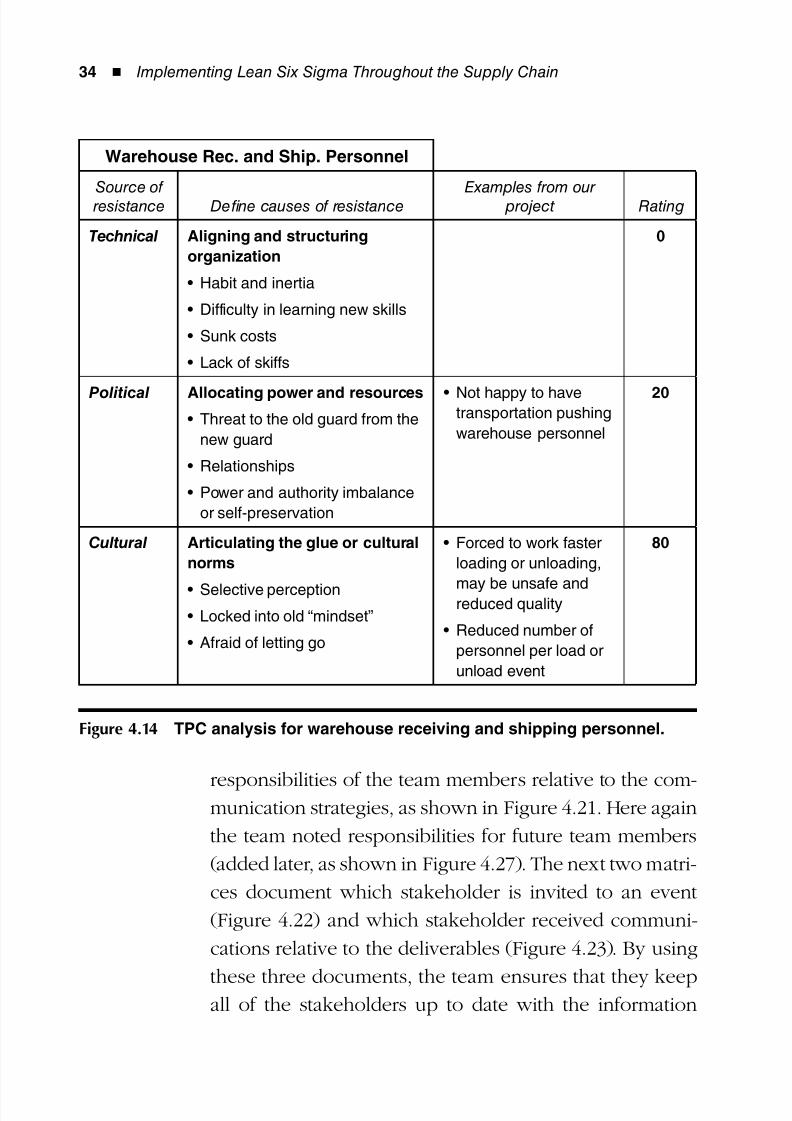
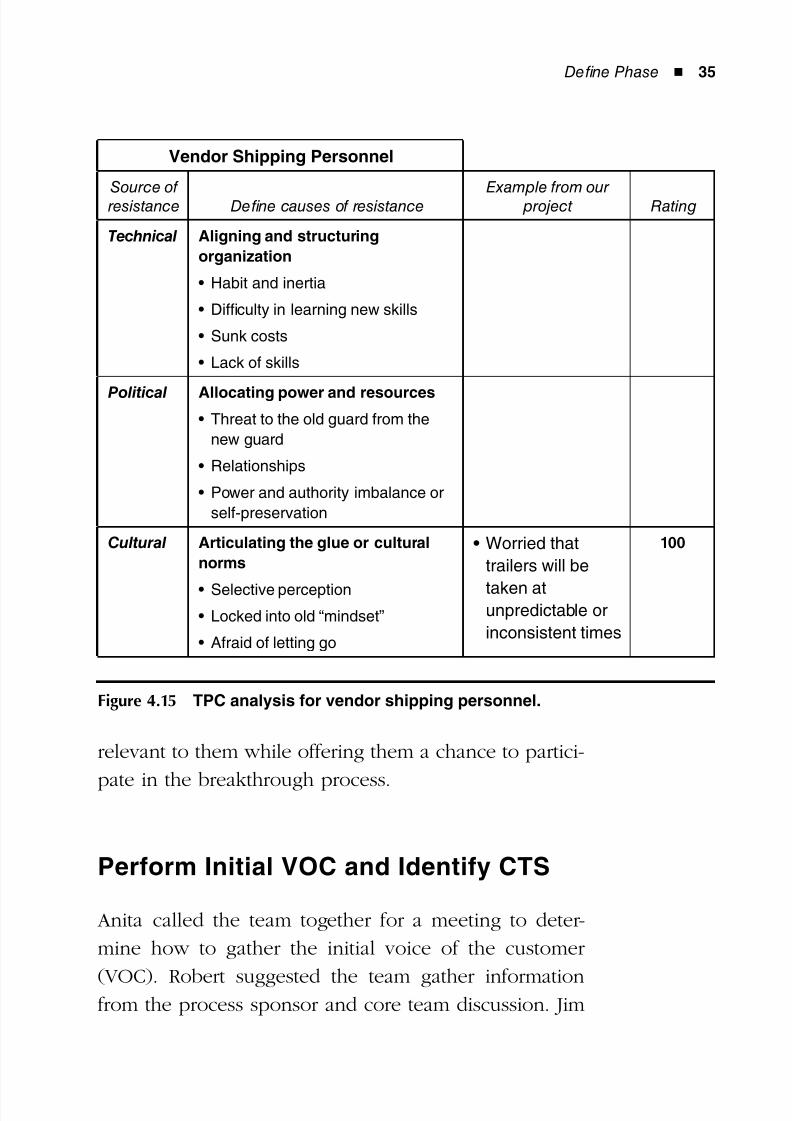
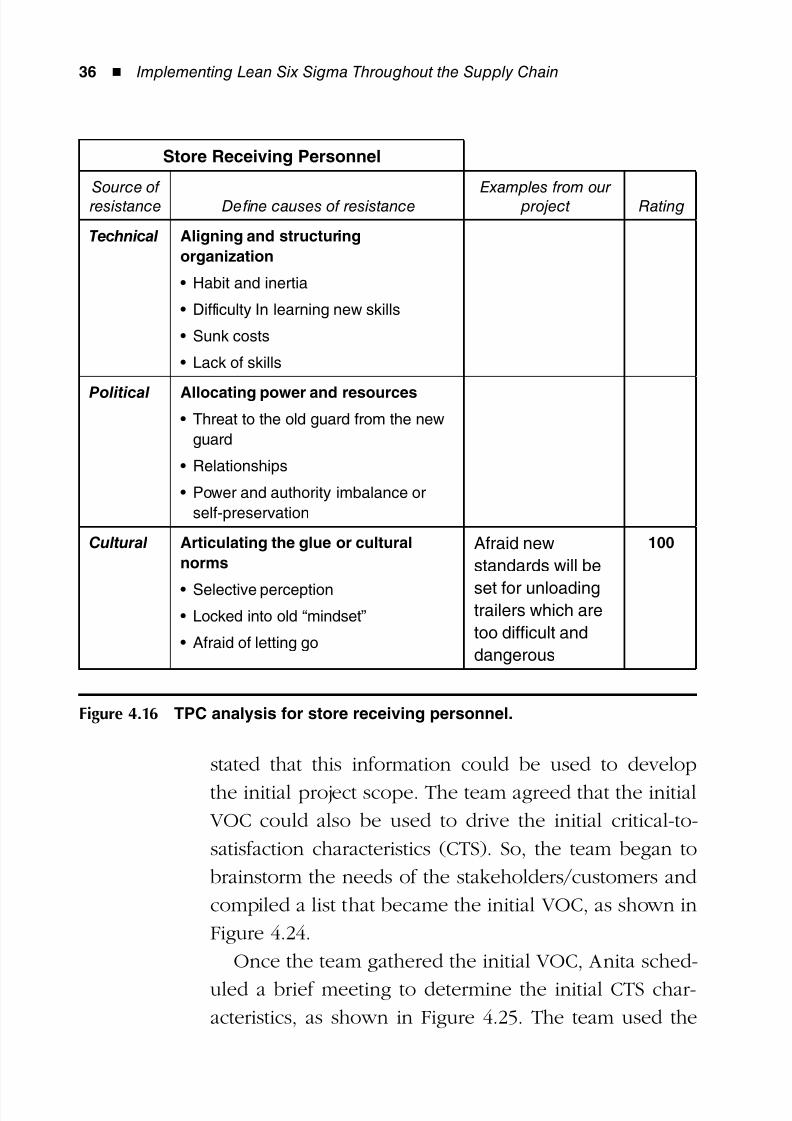
addressed, as shown in Figures 4.12–4.16.
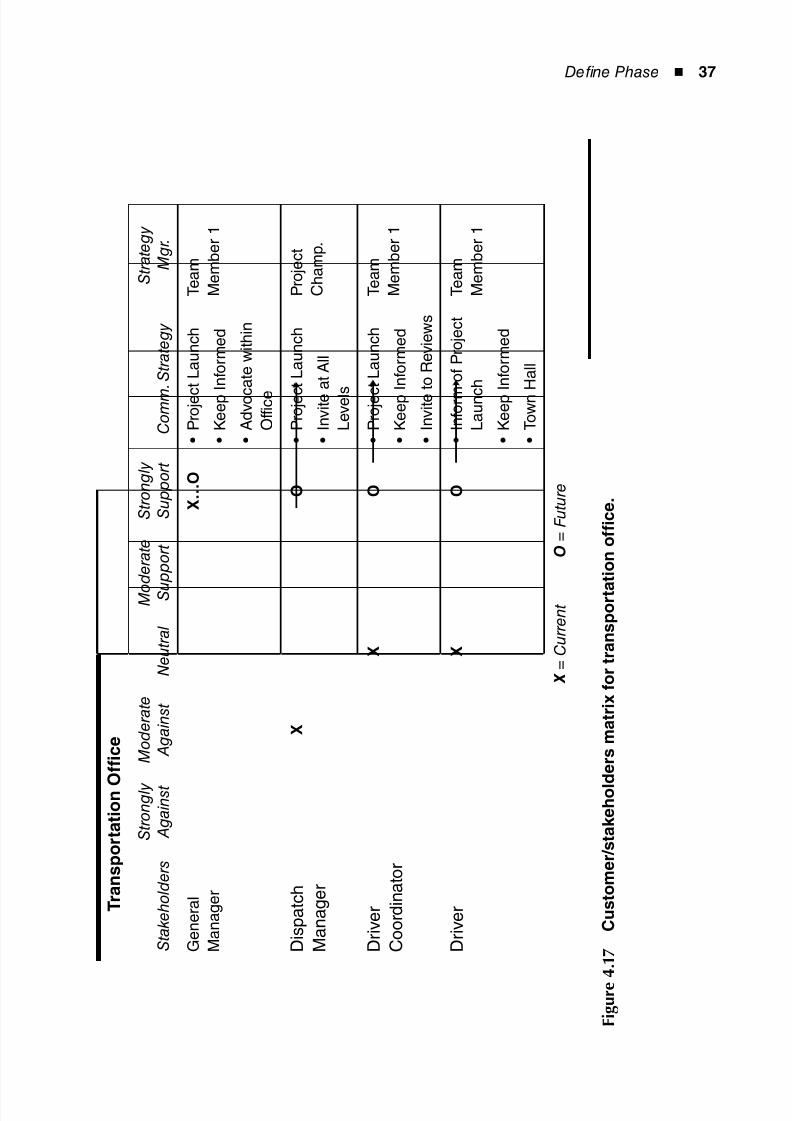
Next, the team used the information from the TPC
analysis to build a customer/stakeholders matrix, as
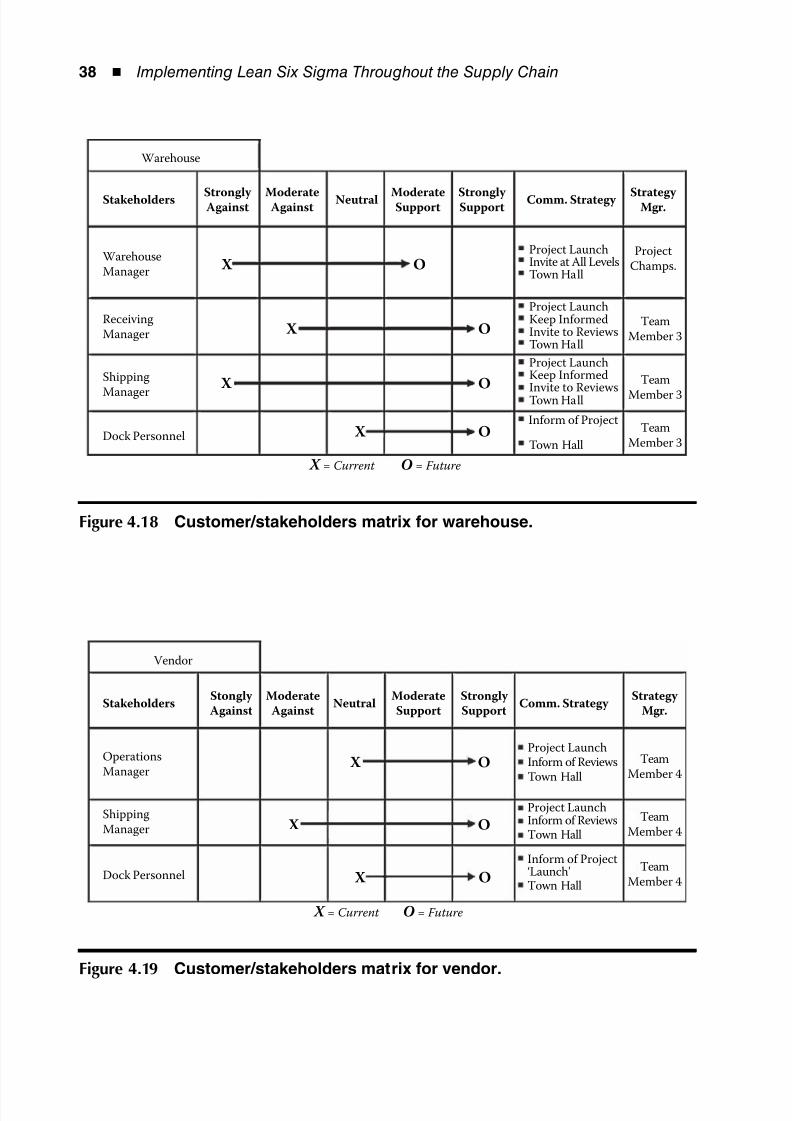
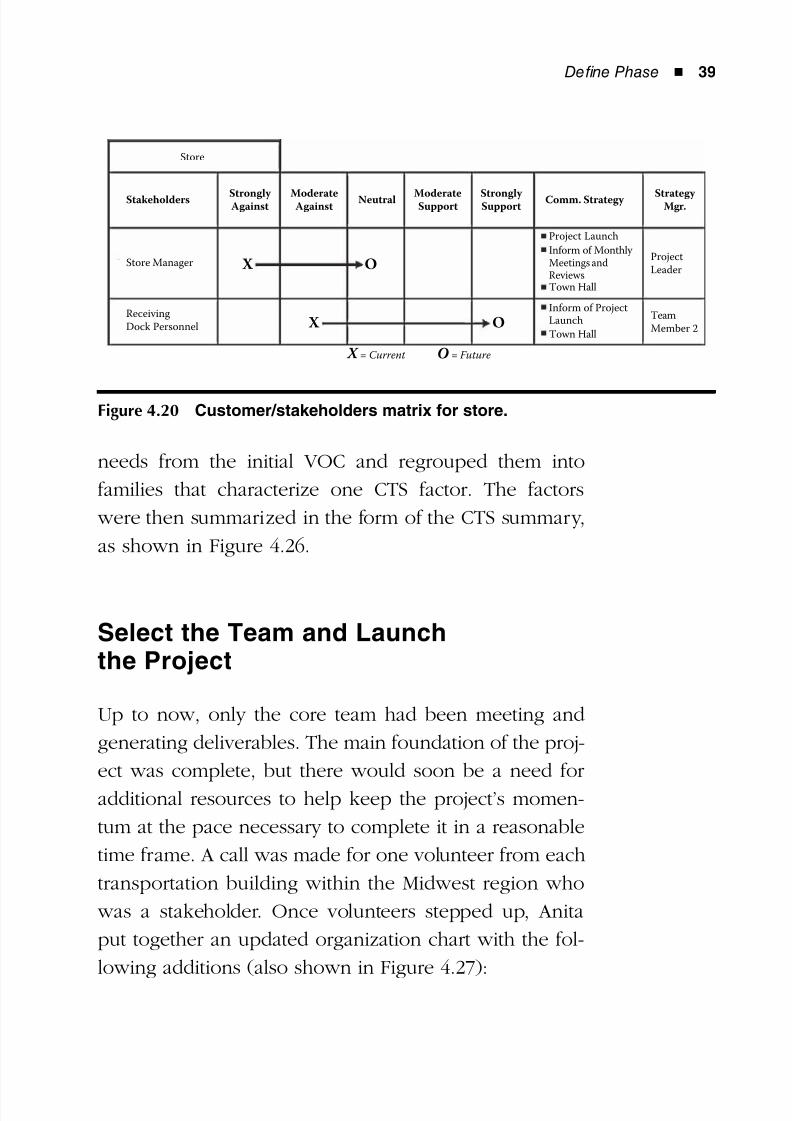
shown in Figures 4.17–4.20. Then, based on the gap
between the stakeholder’s current and future position,
the team drafted a communication/influence strategy
and assigned a strategy manager. For each of the stake-
holders, Anita led the team in identifying the potential
level of resistance and then developed a communication
strategy to mitigate the resistance, preferably before it
could even occur. Based on the current level of resis-
tance, the team brainstormed possible communication
strategies and then used a team vote to decide the strate-
gies that would be used. The matrices identified strategy
8/12/2019 Implementing Lean Six Sigma Throughout the Supply Chain
http://slidepdf.com/reader/full/implementing-lean-six-sigma-throughout-the-supply-chain 49/278
32 ◾ Implementing Lean Six Sigma Throughout the Supply Chain
managers as team members that would be joining the
team soon (added later, as shown in Figure 4.27).
Communications Strategy List
Based on the customer/stakeholder matrices developed by
the team and the communication strategies selected, the
team then brainstormed various methods of communica-
tion. Anita listed potential methods for communication as:
Weekly meetings◾
Monthly meetings◾
Transportation Personnel
Source ofresistance Define causes of resistance
Examples fromour project Rating
Technical Aligning and structuring organization
Habit and inertia•
Difficulty in learning new skills•
Sunk costs•
Lack of skills•
Learn a new•
dispatch
planning and
execution
process
20
Politica l Allocating power and resources
Threat to the old guard from the new guard•
Relationships•
Power and authority imbalance or self-•
preservation
Lean Six•
Sigma teamdoesn’t know
my business.
40
Cultural Articulating the glue or cultural norms
Selective perception•
Locked into old “mindset”•
Afraid of letting go•
Why fix what•
works?
40
Figure 4.12 TPC analysis for transportation personnel.
8/12/2019 Implementing Lean Six Sigma Throughout the Supply Chain
http://slidepdf.com/reader/full/implementing-lean-six-sigma-throughout-the-supply-chain 50/278
Define Phase ◾ 33
Milestone review ◾
Project launch meeting◾
Town hall for drivers◾
Town hall for store receiving personnel◾
Town hall for warehouse receiving/shipping◾
personnel
Town hall for vendor shipping personnel◾
This information was then used to develop a proj-
ect communication plan. The plan consisted of threematrices. First was the RASIC, which documents the
Driver
Source ofresistance Define causes of resistance
Examples fromour project Rating
Technical Aligning and structuring organization
Habit and inertia•
Difficulty in learning new skills•
Sunk costs•
Lack of skills•
0
Political Allocating power and resources
Threat to the old guard from the new•
guard
Relationships•
Power and authority imbalance or•
self-preservation
Doesn’t want to•
be watched soclosely
Thinks the•
schedule may
become too rigid
60
Cultural Articulating the glue or cultural
norms
Selective perception•
Locked into old “mindset”•
Afraid of letting go•
Doesn’t want•
performance data
tied to merit
increases
40
Figure 4.13 TPC analysis for driver.
8/12/2019 Implementing Lean Six Sigma Throughout the Supply Chain
http://slidepdf.com/reader/full/implementing-lean-six-sigma-throughout-the-supply-chain 51/278
34 ◾ Implementing Lean Six Sigma Throughout the Supply Chain
responsibilities of the team members relative to the com-munication strategies, as shown in Figure 4.21. Here again
the team noted responsibilities for future team members
(added later, as shown in Figure 4.27). The next two matri-
ces document which stakeholder is invited to an event
(Figure 4.22) and which stakeholder received communi-
cations relative to the deliverables (Figure 4.23). By using
these three documents, the team ensures that they keepall of the stakeholders up to date with the information
Warehouse Rec. and Ship. Personnel
Source ofresistance Define causes of resistance
Examples from our project Rating
Technical Aligning and structuring
organization
Habit• and inertia
Difficulty in• learning new skills
Sunk costs•
Lack of skiffs•
0
Political Allocating power and resources
Threat to the old guard from the•
new guard
Relationships•
Power and authority imbalance•
or self-preservation
Not happy to have•
transportation pushing
warehouse personnel
20
Cultural Articulating the glue or cultural
norms
Selective perception•
Locked into old “mindset”•
Afraid of letting go•
Forced to work faster•
loading or unloading,
may be unsafe andreduced quality
Reduced number of•
personnel per load or
unload event
80
Figure 4.14 TPC analysis for warehouse receiving and shipping personnel.
8/12/2019 Implementing Lean Six Sigma Throughout the Supply Chain
http://slidepdf.com/reader/full/implementing-lean-six-sigma-throughout-the-supply-chain 52/278
Define Phase ◾ 35
relevant to them while offering them a chance to partici-
pate in the breakthrough process.
Perform Initial VOC and Identify CTS
Anita called the team together for a meeting to deter-
mine how to gather the initial voice of the customer
(VOC). Robert suggested the team gather informationfrom the process sponsor and core team discussion. Jim
Vendor Shipping Personnel
Source ofresistance Define causes of resistance
Example from our project Rating
Technical Aligning and structuring
organization
Habit and inertia•
Difficulty in learning new skills•
Sunk costs•
Lack of skills•
Political Allocating power and resources
Threat to the old guard from the•
new guard
Relationships•
Power and authority imbalance or•
self-preservation
Cultural Articulating the glue or cultural
norms
Selective perception•
Locked into old “mindset”•
Afraid of letting go•
Worried that•
trailers will be
taken atunpredictable or
inconsistent times
100
Figure 4.15 TPC analysis for vendor shipping personnel.
8/12/2019 Implementing Lean Six Sigma Throughout the Supply Chain
http://slidepdf.com/reader/full/implementing-lean-six-sigma-throughout-the-supply-chain 53/278
36 ◾ Implementing Lean Six Sigma Throughout the Supply Chain
stated that this information could be used to develop
the initial project scope. The team agreed that the initial
VOC could also be used to drive the initial critical-to-
satisfaction characteristics (CTS). So, the team began to
brainstorm the needs of the stakeholders/customers and
compiled a list that became the initial VOC, as shown in
Figure 4.24.
Once the team gathered the initial VOC, Anita sched-
uled a brief meeting to determine the initial CTS char-
acteristics, as shown in Figure 4.25. The team used the
Store Receiving Personnel
Source ofresistance Define causes of resistance
Examples from our project Rating
Technical Aligning and structuring
organization
Habit and inertia•
Difficulty In learning new skills•
Sunk costs•
Lack of skills•
Political Allocating power and resources
Threat to the old guard from the new•
guard
Relationships•
Power and authority imbalance or•
self-preservation
Cultural Articulating the glue or cultural
norms
Selective perception•
Locked into old “mindset”•
Afraid of letting go•
Afraid new
standards will be
set for unloadingtrailers which are
too difficult and
dangerous
100
Figure 4.16 TPC analysis for store receiving personnel.
8/12/2019 Implementing Lean Six Sigma Throughout the Supply Chain
http://slidepdf.com/reader/full/implementing-lean-six-sigma-throughout-the-supply-chain 54/278
8/12/2019 Implementing Lean Six Sigma Throughout the Supply Chain
http://slidepdf.com/reader/full/implementing-lean-six-sigma-throughout-the-supply-chain 55/278
38 ◾ Implementing Lean Six Sigma Throughout the Supply Chain
Warehouse
Stakeholders
WarehouseManager
ReceivingManager
Shipping
Manager
Dock Personnel
Inform of Project
Town Hall
Project Launch
Project Launch
Project Launch ProjectChamps.
Strategy Mgr.
Comm. Strategy Strongly Support
ModerateSupport
ModerateAgainst
Strongly Against
Neutral
Invite at All Levels
Keep Informed
Keep Informed
Invite to Reviews
Invite to Reviews
Town Hall
Town Hall
Town Hall
TeamMember 3
Team
Member 3
TeamMember 3
X
X
X
X
O
O
O
O
O = Future X = Current
Figure 4.18 Customer/stakeholders matrix for warehouse.
Vendor
Stakeholders
OperationsManager
ShippingManager
Dock Personnel
Stongly
Against
Moderate
Against Neutral
Moderate
Support
Strongly
Support Comm. Strategy
Strategy
Mgr.
Project Launch
Inform of Project‘Launch’
Inform of Reviews
Inform of ReviewsProject Launch
Town Hall
Town Hall
Town Hall
X
X
X
X = Current O = Future
O
O
O
TeamMember 4
TeamMember 4
TeamMember 4
Figure 4.19 Customer/stakeholders matrix for vendor.
8/12/2019 Implementing Lean Six Sigma Throughout the Supply Chain
http://slidepdf.com/reader/full/implementing-lean-six-sigma-throughout-the-supply-chain 56/278
Define Phase ◾ 39
needs from the initial VOC and regrouped them into
families that characterize one CTS factor. The factors
were then summarized in the form of the CTS summary,
as shown in Figure 4.26.
Select the Team and Launchthe Project
Up to now, only the core team had been meeting and
generating deliverables. The main foundation of the proj-
ect was complete, but there would soon be a need for
additional resources to help keep the project’s momen-
tum at the pace necessary to complete it in a reasonable
time frame. A call was made for one volunteer from each
transportation building within the Midwest region who
was a stakeholder. Once volunteers stepped up, Anita
put together an updated organization chart with the fol-
lowing additions (also shown in Figure 4.27):
Store Manager
Receiving
Dock Personnel
Strongly Against
ModerateAgainst
Neutral ModerateSupport
Strongly Support
Comm. Strategy Strategy Mgr.
X
X
X = Current O = Future
O
O
Stakeholders
Store
Inform of ProjectLaunch
Inform of Monthly Meetings andReviews
Project Launch
Town Hall
Town Hall
Project
Leader
Team
Member 2
Figure 4.20 Customer/stakeholders matrix for store.
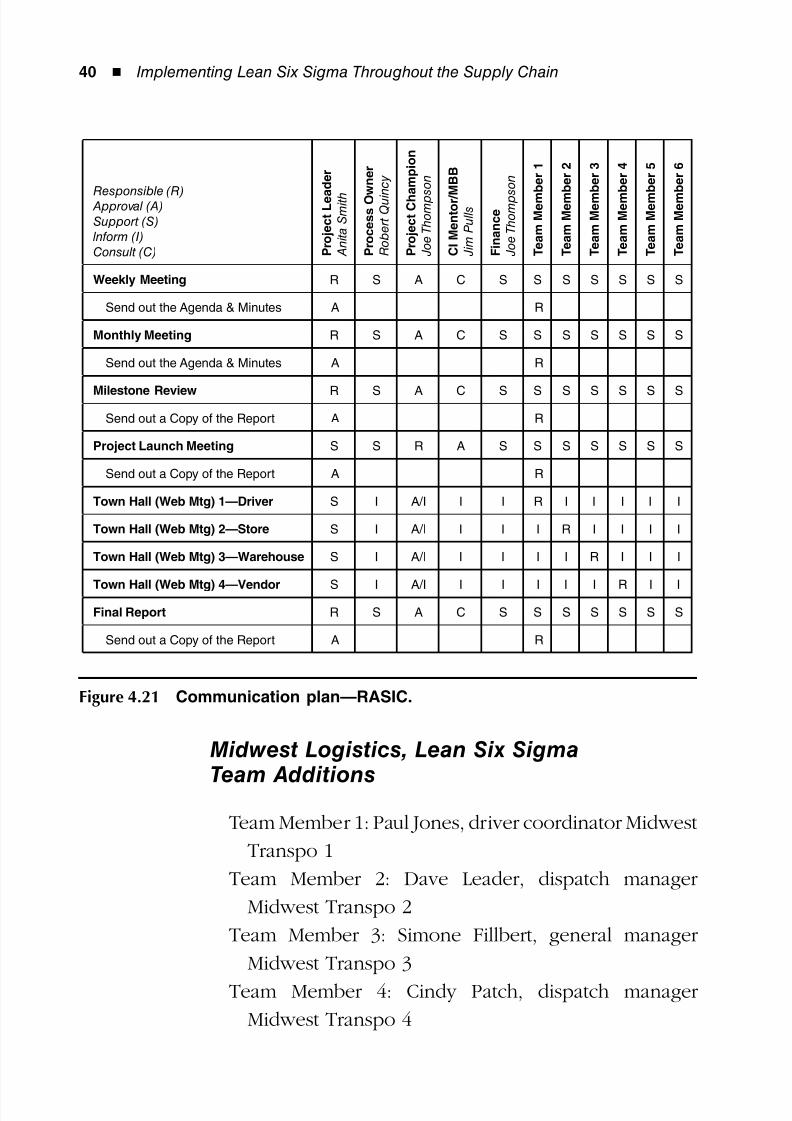
8/12/2019 Implementing Lean Six Sigma Throughout the Supply Chain
http://slidepdf.com/reader/full/implementing-lean-six-sigma-throughout-the-supply-chain 57/278
40 ◾ Implementing Lean Six Sigma Throughout the Supply Chain
Midwest Logistics, Lean Six Sigma
Team Additions
Team Member 1: Paul Jones, driver coordinator Midwest
Transpo 1
Team Member 2: Dave Leader, dispatch manager
Midwest Transpo 2
Team Member 3: Simone Fillbert, general manager
Midwest Transpo 3
Team Member 4: Cindy Patch, dispatch manager
Midwest Transpo 4
Responsible (R) Approval (A)Support (S) lnform (I)Consult (C) P
r o j e c t L e a
d e r
A n i t a S m i t h
P r o c e s s O w n e r
R o b e r t Q u i n
c y
P r o j e c t C h a m p i o n
J o e T h o m p s
o n
C I M e n t o r / M B B
J i m P u l l s
F i n a n c e
J o e T h o m p s
o n
T e a m M e m
b e r 1
T e a m M e m
b e r 2
T e a m M e m
b e r 3
T e a m M e m
b e r 4
T e a m M e m
b e r 5
T e a m M e m
b e r 6
Weekly Meeting R S A C S S S S S S S
Send out the Agenda & Minutes A R
Monthly Meeting R S A C S S S S S S S
Send out the Agenda & Minutes A R
Milestone Review R S A C S S S S S S S
Send out a Copy of the Report A R
Project Launch Meeting S S R A S S S S S S S
Send out a Copy of the Report A R
Town Hall (Web Mtg) 1—Driver S I A/I I I R I I I I I
Town Hall (Web Mtg) 2—Store S I A/I I I I R I I I I
Town Hall (Web Mtg) 3—Warehouse S I A/I I I I I R I I I
Town Hall (Web Mtg) 4—Vendor S I A/I I I I I I R I I
Final Report R S A C S S S S S S S
Send out a Copy of the Report A R
Figure 4.21 Communication plan—RASIC.
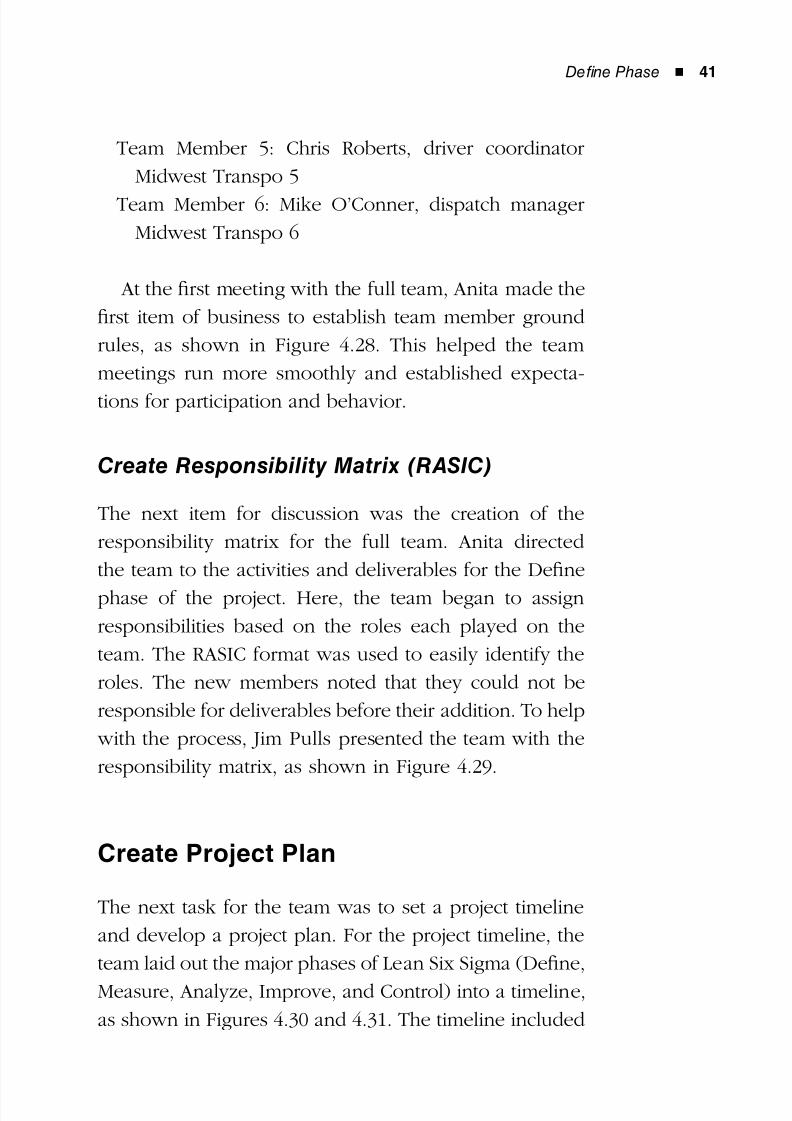
8/12/2019 Implementing Lean Six Sigma Throughout the Supply Chain
http://slidepdf.com/reader/full/implementing-lean-six-sigma-throughout-the-supply-chain 58/278
Define Phase ◾ 41
Team Member 5: Chris Roberts, driver coordinator
Midwest Transpo 5
Team Member 6: Mike O’Conner, dispatch manager
Midwest Transpo 6
At the first meeting with the full team, Anita made the
first item of business to establish team member ground
rules, as shown in Figure 4.28. This helped the team
meetings run more smoothly and established expecta-
tions for participation and behavior.
Create Responsibility Matrix (RASIC)
The next item for discussion was the creation of the
responsibility matrix for the full team. Anita directed
the team to the activities and deliverables for the Define
phase of the project. Here, the team began to assign
responsibilities based on the roles each played on the
team. The RASIC format was used to easily identify the
roles. The new members noted that they could not be
responsible for deliverables before their addition. To help
with the process, Jim Pulls presented the team with the
responsibility matrix, as shown in Figure 4.29.
Create Project Plan
The next task for the team was to set a project timeline
and develop a project plan. For the project timeline, the
team laid out the major phases of Lean Six Sigma (Define,
Measure, Analyze, Improve, and Control) into a timeline,
as shown in Figures 4.30 and 4.31. The timeline included
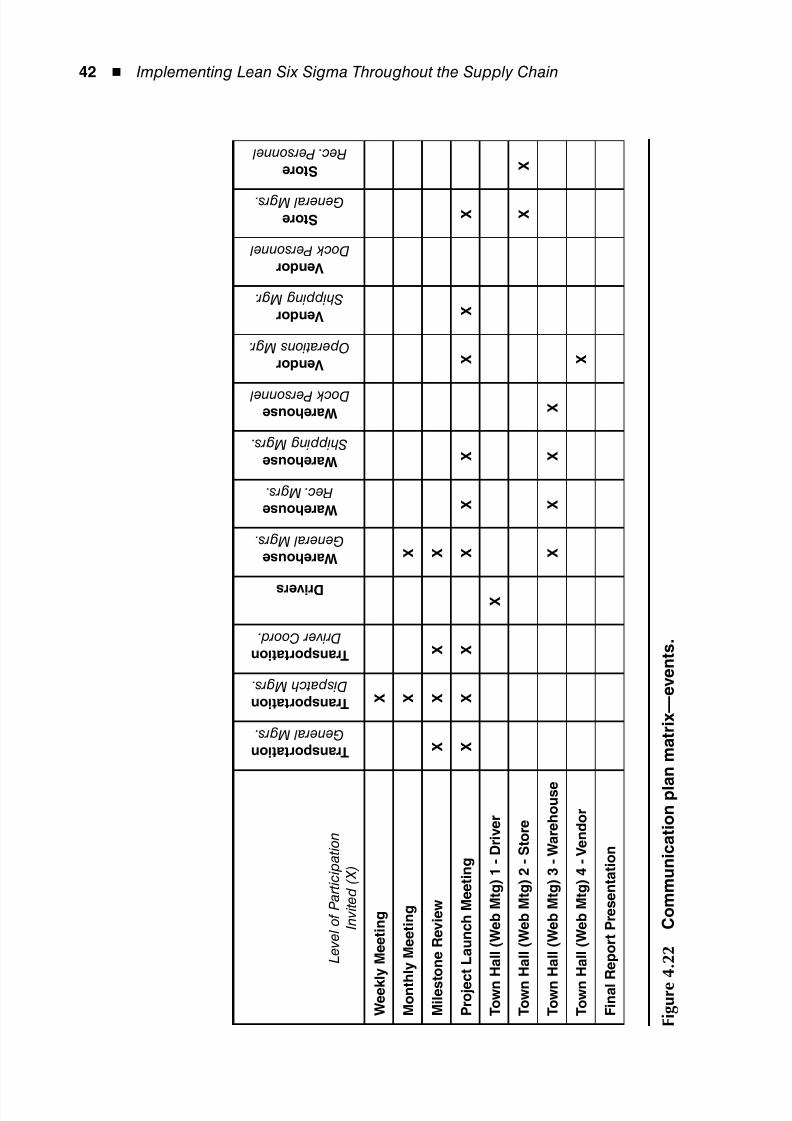
8/12/2019 Implementing Lean Six Sigma Throughout the Supply Chain
http://slidepdf.com/reader/full/implementing-lean-six-sigma-throughout-the-supply-chain 59/278
42 ◾ Implementing Lean Six Sigma Throughout the Supply Chain
L e v e l o f P a r t i c i p a t i o n
I n v i t e d ( X )
T r a n s p o r t a t i o n
G e n e r a l M g r s .
T r a n s p o r t a t i o n
D i s p a t c h M g r s .
T r a n s p o r t a t i o n
D r i v e r C o o r d .
D r i v e r s
W a r e h o u s e
G e n e r a l M g r s .
W a r e h o u s e
R e c . M g r s .
W a r e h o u s e
S h i p p i n g M g r s .
W a r e h o u s e D o c k P e r s o n n e l
V e n d o r
O p e r a t i o n s M g r .
V e n d o r
S h i p p i n g M g r .
V e n d o r
D o c k P e r s o n n e l
S t o r e G e n e r a l M g r s .
S t o r e
R e c . P e r s o n n e l
W e e k l y M e e t i n g
X
M o n t h
l y M e e t i n g
X
X
M i l e s t o n e R e v i e w
X
X
X
X
P r o j e c t L a u n c h M e e t i n g
X
X
X
X
X
X
X
X
X
T o w n
H a l l ( W e b M t g ) 1 - D r i v e r
X
T o w n
H a l l ( W e b M t g ) 2 - S t o r e
X
X
T o w n
H a l l ( W e b M t g ) 3 - W a r e h o u s e
X
X
X
X
T o w n
H a l l ( W e b M t g ) 4 - V e n d o r
X
F i n a l R e p o r t P r e s e n t a t i o n
F i g u r e
4 . 2
2
C o m m u n i c a t i o n p l a
n m a t r i x — e v e n t s .
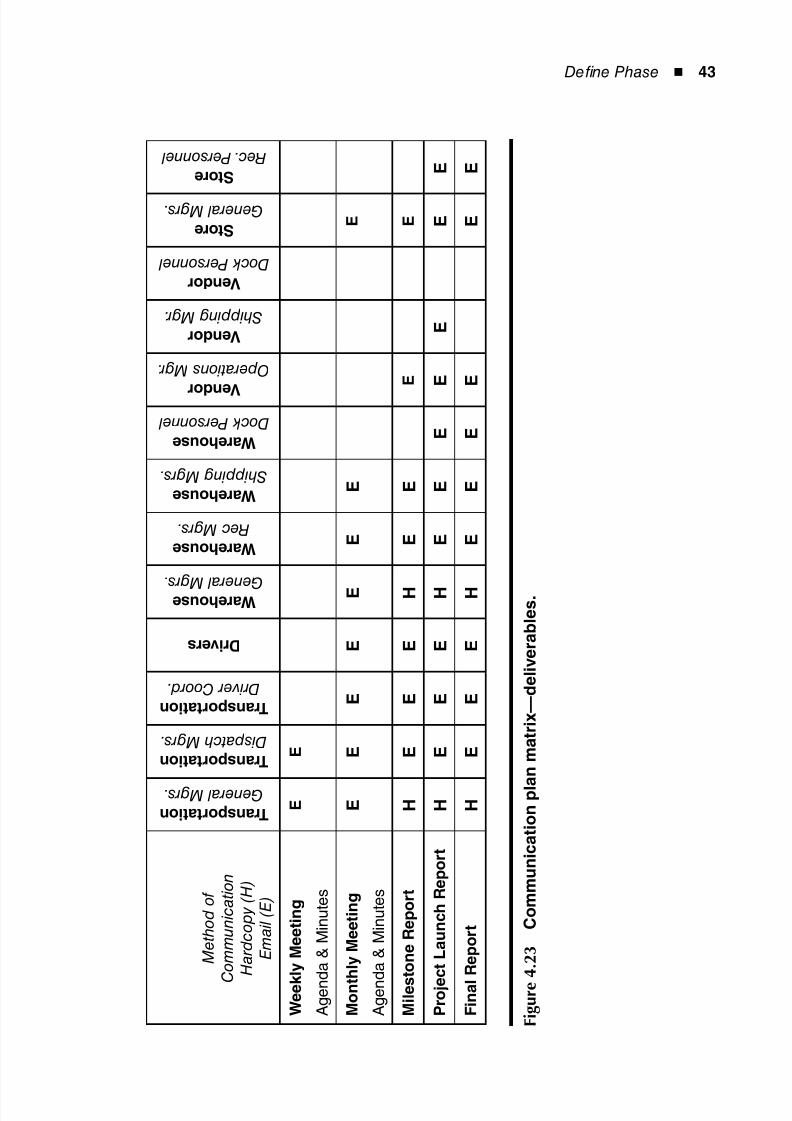
8/12/2019 Implementing Lean Six Sigma Throughout the Supply Chain
http://slidepdf.com/reader/full/implementing-lean-six-sigma-throughout-the-supply-chain 60/278
Define Phase ◾ 43
M e t h o d o f
C
o m m u n i c a t i o n
H a r d c o p y ( H )
E m a i l ( E )
T r a n s p o r t a t i o n
G e n e r a l M g r s .
T r a n s p o r t a t i o n
D i s p a t c h M g r s .
T r a n s p o r t a t i o n
D r i v e r C o o r d .
D r i v e r s
W a r e h o u s e
G e n e r a l M g r s .
W a r e h o u s e
R e c M g r s .
W a r e h o u s e
S h i p p i n g M g r s .
W a r e h o u s e
D o c k P e r s o n n e l
V e n d o r
O p e r a t i o n s M g r .
V e n d o r
S h i p p i n g M g r .
V e n d o r
D o c k P e r s o n n e l
S t o r e
G e n e r a l M g r s .
S t o r e
R e c . P e r s o n n e l
W e e k
l y M e e t i n g
A g e n d a & M i n u t e s
E
E
M o n t h l y M e e t i n g
A g e n d a & M i n u t e s
E
E
E
E
E
E
E
E
M i l e s
t o n e R e p o r t
H
E
E
E
H
E
E
E
E
P r o j e
c t L a u n c h R e p o r t
H
E
E
E
H
E
E
E
E
E
E
E
F i n a l
R e p o r t
H
E
E
E
H
E
E
E
E
E
E
F i g u r e
4 . 2
3
C o m m u n i c a t i o n p l a
n m a t r i x — d e l i v e r a b l e s .
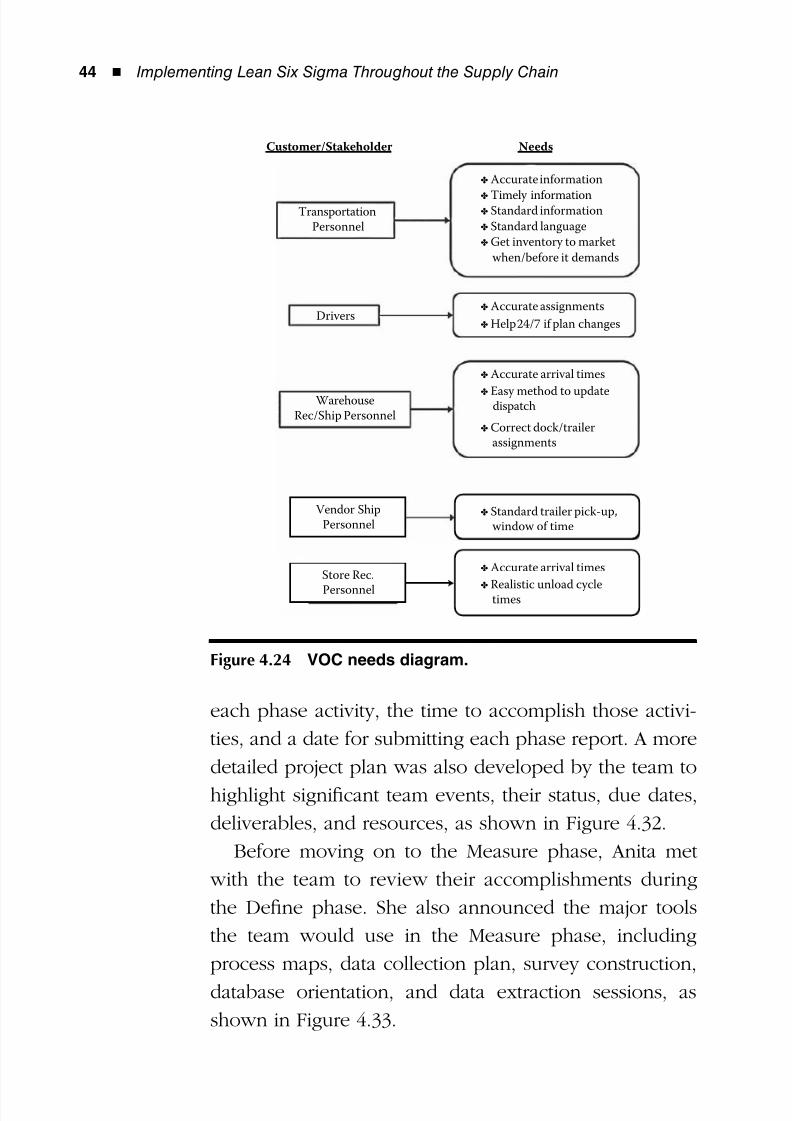
8/12/2019 Implementing Lean Six Sigma Throughout the Supply Chain
http://slidepdf.com/reader/full/implementing-lean-six-sigma-throughout-the-supply-chain 61/278
44 ◾ Implementing Lean Six Sigma Throughout the Supply Chain
each phase activity, the time to accomplish those activi-
ties, and a date for submitting each phase report. A more
detailed project plan was also developed by the team to
highlight significant team events, their status, due dates,
deliverables, and resources, as shown in Figure 4.32.
Before moving on to the Measure phase, Anita met
with the team to review their accomplishments during
the Define phase. She also announced the major tools
the team would use in the Measure phase, including
process maps, data collection plan, survey construction,
database orientation, and data extraction sessions, as
shown in Figure 4.33.
Customer/Stakeholder Needs
TransportationPersonnel
Drivers
WarehouseRec/Ship Personnel
Accurate assignments
Accurate arrival times
Easy method to update dispatch
Correct dock/trailer assignments
Help 24/7 if plan changes
Accurate information
Timely informationStandard information
Standard language
Get inventory to market
when/before it demands
Store Rec.
Personnel
Vendor ShipPersonnel
Standard trailer pick-up, window of time
Accurate arrival times
Realistic unload cycle times
Figure 4.24 VOC needs diagram.
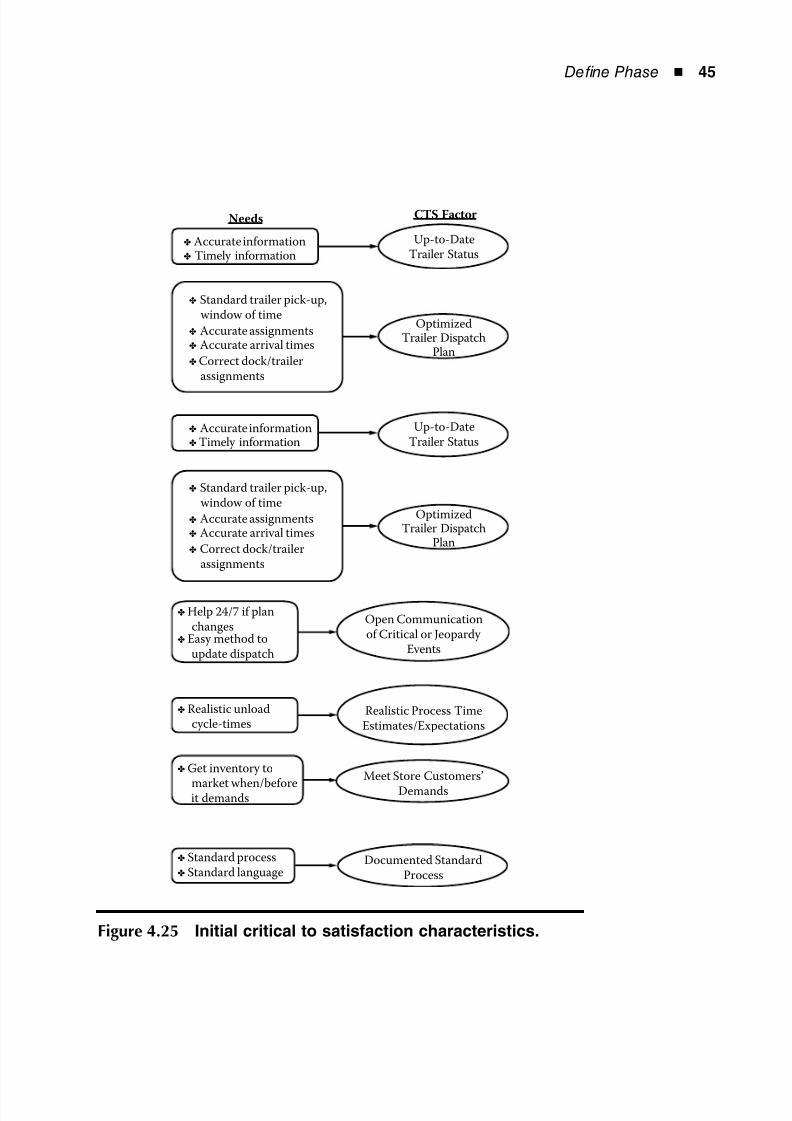
8/12/2019 Implementing Lean Six Sigma Throughout the Supply Chain
http://slidepdf.com/reader/full/implementing-lean-six-sigma-throughout-the-supply-chain 62/278
Define Phase ◾ 45
Needs CTS Factor
Accurate information Timely information
Accurate informationTimely information
Standard trailer pick-up, window of time
Accurate assignments Accurate arrival times
Correct dock/trailer assignments
Standard trailer pick-up, window of time
Accurate assignments Accurate arrival times
Correct dock/trailer assignments
OptimizedTrailer Dispatch
Plan
OptimizedTrailer Dispatch
Plan
Up-to-DateTrailer Status
Up-to-DateTrailer Status
Help 24/7 if plan changesEasy method to update dispatch
Realistic unload cycle-times
Get inventory to
market when/before it demands
Standard processStandard language
Documented StandardProcess
Meet Store Customers’Demands
Realistic Process TimeEstimates/Expectations
Open Communicationof Critical or Jeopardy
Events
Figure 4.25 Initial critical to satisfaction characteristics.
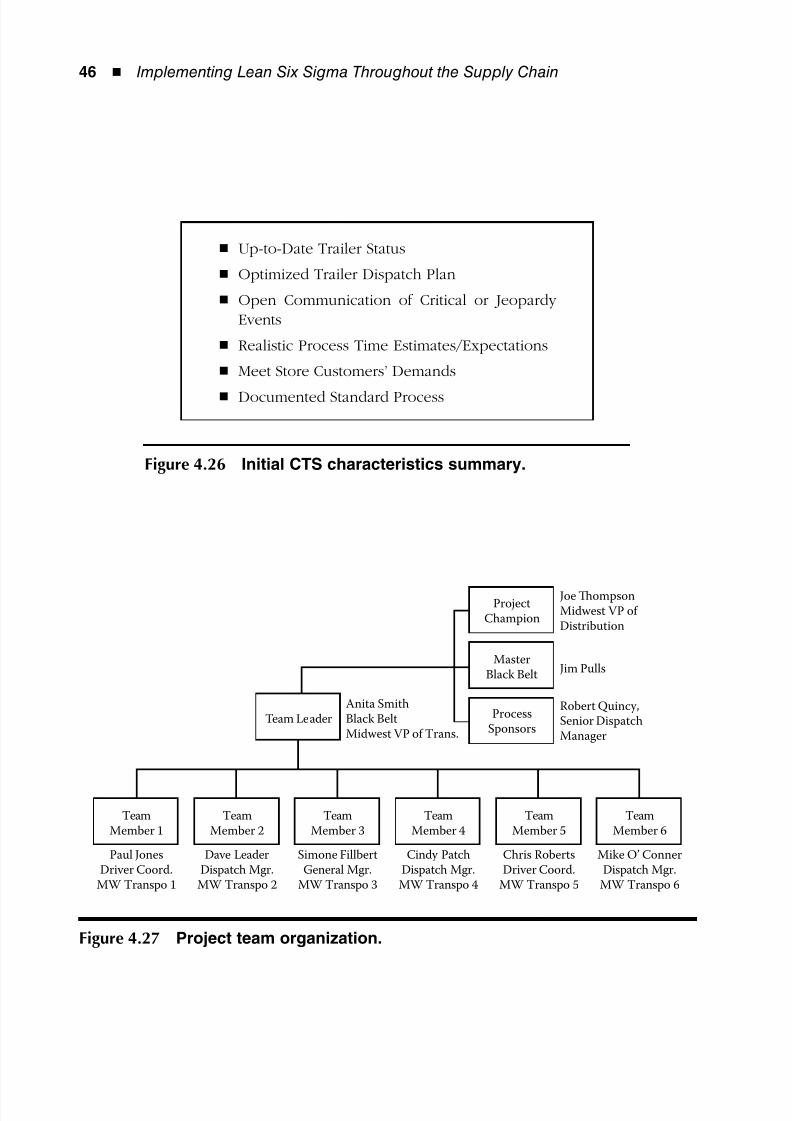
8/12/2019 Implementing Lean Six Sigma Throughout the Supply Chain
http://slidepdf.com/reader/full/implementing-lean-six-sigma-throughout-the-supply-chain 63/278
46 ◾ Implementing Lean Six Sigma Throughout the Supply Chain
Up-to-Date Trailer Status◾
Optimized Trailer Dispatch Plan◾
Open Communication of Critical or Jeopardy◾
Events
Realistic Process Time Estimates/Expectations◾
Meet Store Customers’ Demands◾
Documented Standard Process◾
Figure 4.26 Initial CTS characteristics summary.
TeamMember 1
Team LeaderAnita SmithBlack BeltMidwest VP of Trans.
TeamMember 2
TeamMember 3
TeamMember 4
TeamMember 5
TeamMember 6
Mike O’ ConnerDispatch Mgr.
MW Transpo 6
Chris RobertsDriver Coord.
MW Transpo 5
Cindy PatchDispatch Mgr.
MW Transpo 4
Simone FillbertGeneral Mgr.
MW Transpo 3
Dave LeaderDispatch Mgr.
MW Transpo 2
Paul JonesDriver Coord.
MW Transpo 1
ProjectChampion
MasterBlack Belt
ProcessSponsors
Robert Quincy,Senior DispatchManager
Jim Pulls
Joe ompsonMidwest VP of Distribution
Figure 4.27 Project team organization.
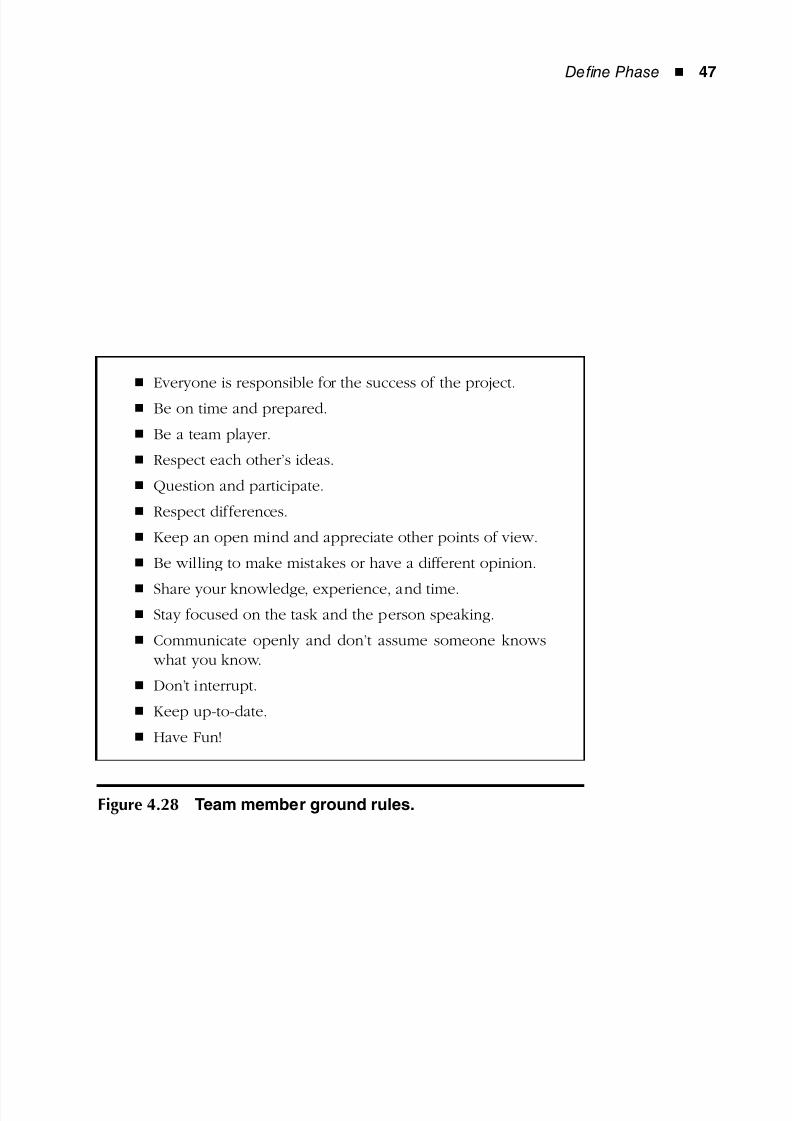
8/12/2019 Implementing Lean Six Sigma Throughout the Supply Chain
http://slidepdf.com/reader/full/implementing-lean-six-sigma-throughout-the-supply-chain 64/278
Define Phase ◾ 47
Everyone is responsible for the success of the project.◾
Be on time and prepared.◾
Be a team player.◾
Respect each other’s ideas.◾
Question and participate.◾
Respect differences.◾
Keep an open mind and appreciate other points of view.◾
Be willing to make mistakes or have a different opinion.◾
Share your knowledge, experience, and time.◾
Stay focused on the task and the person speaking.◾
Communicate openly and don’t assume someone knows◾
what you know.
Don’t interrupt.◾
Keep up-to-date.◾
Have Fun!◾
Figure 4.28 Team member ground rules.
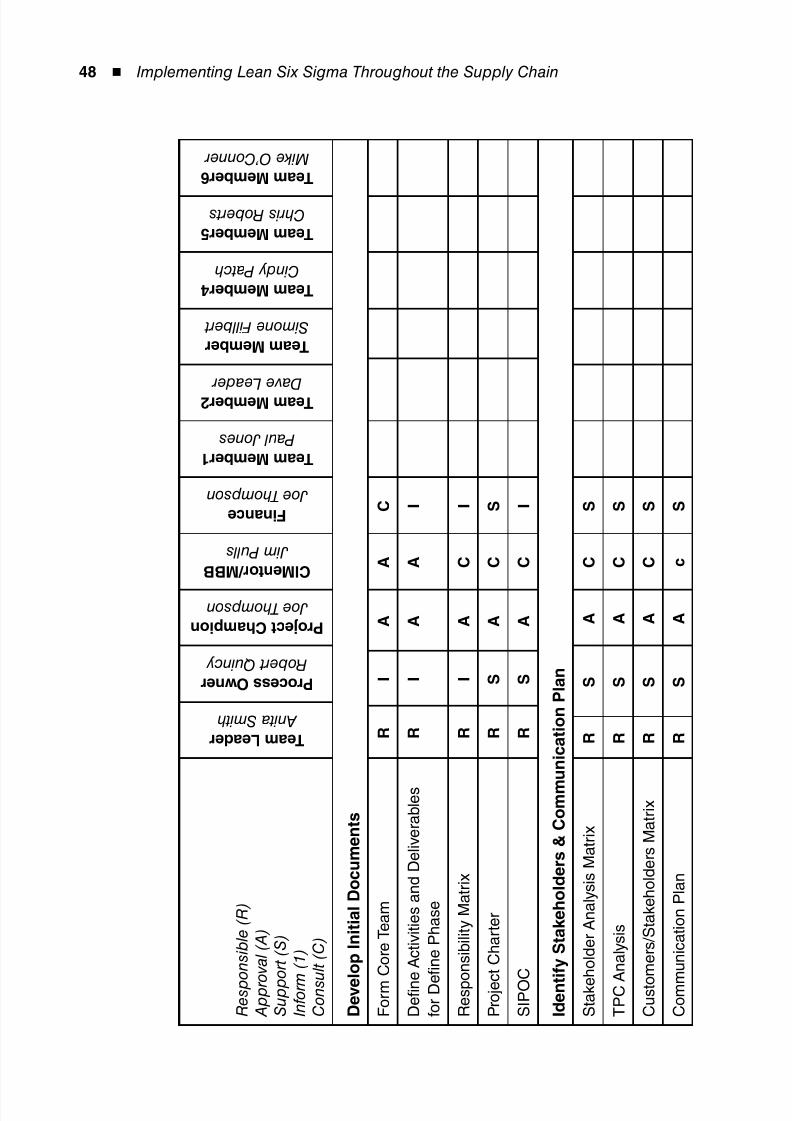
8/12/2019 Implementing Lean Six Sigma Throughout the Supply Chain
http://slidepdf.com/reader/full/implementing-lean-six-sigma-throughout-the-supply-chain 65/278
48 ◾ Implementing Lean Six Sigma Throughout the Supply Chain
R e s p o n s i b l e ( R )
A p p r o
v a l ( A )
S u p p o r t ( S )
I n f o r m
( 1 )
C o n s u l t ( C )
T e a m L e a d e r
A n i t a S m i t h
P r o c e s s O w n e r
R o b e r t Q u i n c y
P r o j e c t C h a m p i o n
J o e T h o m p s o n
C l M e n t o r / M B B
J i m P u l l s
F i n a n c e
J o e T h o m p s o n
T e a m M e m b e r 1
P a u l J o n e s
T e a m M e m b e r 2
D a v e L e a d e r
T e a m M e m b e r
S i m o n e F i l l b e r t
T e a m M e m b e r 4
C i n d y P a t c h
T e a m M e m b e r 5
C h r i s R o b e r t s
T e a m M e m b e r 6
M i k e O ’ C o n n e r
D e v e l o p I n i t i a l D o c u m e n t s
F o r m
C o r e T e a m
R
I
A
A
C
D e fi n e A c t i v i t i e s a n d D e l i v e r a b l e s
f o r D e
fi n e P h a s e
R
I
A
A
I
R e s p o n s i b i l i t y M a t r i x
R
I
A
C
I
P r o j e c t C h a r t e r
R
S
A
C
S
S I P O C
R
S
A
C
I
I d e n t i f y S t a k e h o l d e r s & C o m m
u n i c a t i o n P l a n
S t a k e
h o l d e r A n a l y s i s M a t r i x
R
S
A
C
S
T P C A n a l y s i s
R
S
A
C
S
C u s t o
m e r s / S t a k e h o l d e r s M a t r i x
R
S
A
C
S
C o m m
u n i c a t i o n P l a n
R
S
A
c
S
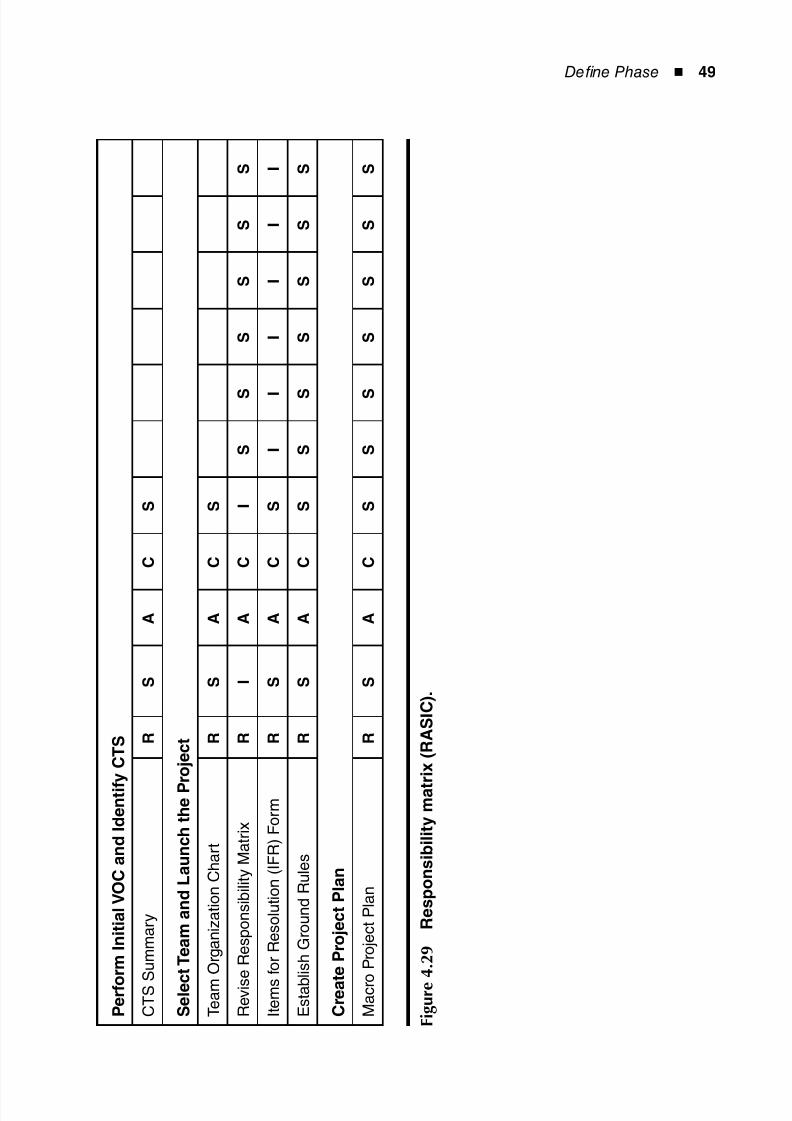
8/12/2019 Implementing Lean Six Sigma Throughout the Supply Chain
http://slidepdf.com/reader/full/implementing-lean-six-sigma-throughout-the-supply-chain 66/278
Define Phase ◾ 49
P e r f o
r m I n i t i a l V O C a n d I d e n t i f y C T S
C T S S u m m a r y
R
S
A
C
S
S e l e c
t T e a m a n d L a u n c h t h e P r o j e c t
T e a m
O r g a n i z a t i o n C h a r t
R
S
A
C
S
R e v i s e R e s p o n s i b i l i t y M a t r i x
R
I
A
C
I
S
S
S
S
S
S
I t e m s
f o r R e s o l u t i o n ( I F R ) F o r m
R
S
A
C
S
I
I
I
I
I
I
E s t a b
l i s h G r o u n d R u l e s
R
S
A
C
S
S
S
S
S
S
S
C r e a t e P r o j e c t P l a n
M a c r o
P r o j e c t P l a n
R
S
A
C
S
S
S
S
S
S
S
F i g u r e
4 . 2
9
R e s p o n s i b i l i t y m a t r i x ( R A S I C ) .
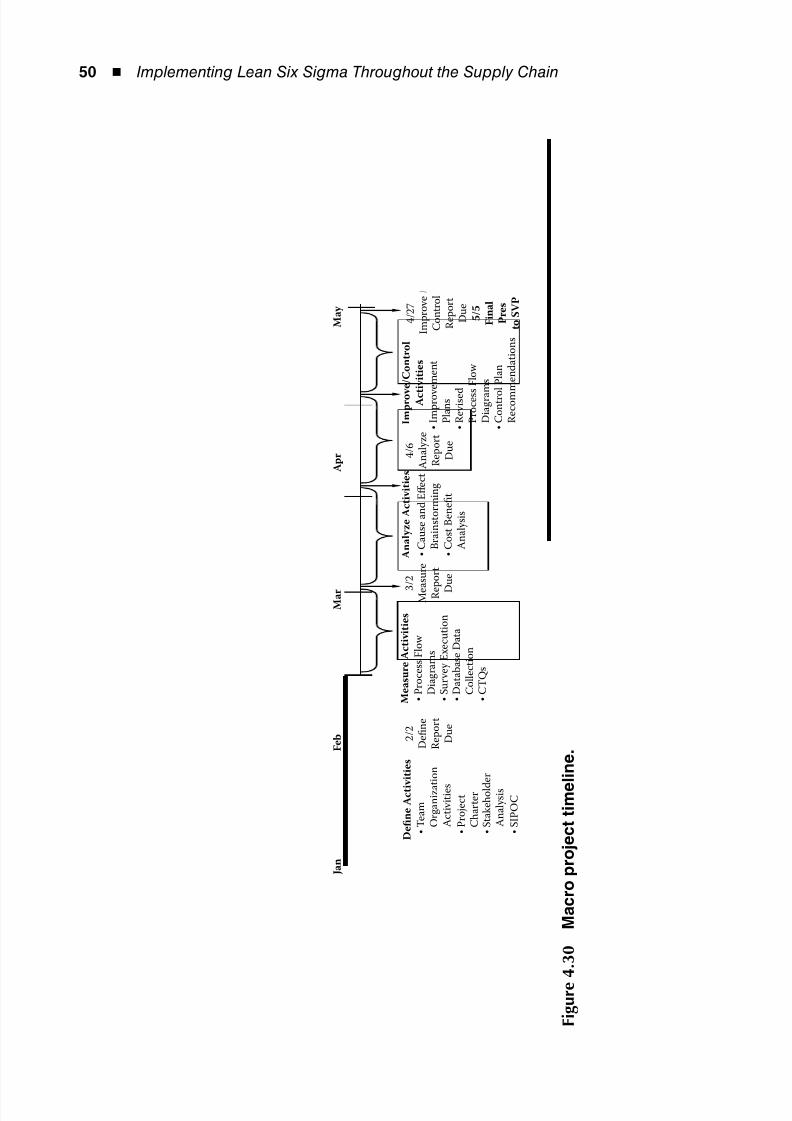
8/12/2019 Implementing Lean Six Sigma Throughout the Supply Chain
http://slidepdf.com/reader/full/implementing-lean-six-sigma-throughout-the-supply-chain 67/278
50 ◾ Implementing Lean Six Sigma Throughout the Supply Chain
4 / 2 7
I m p r o v e
C o n t r o
l
R e p o r t
D u e
5 / 5
F i n a l
P r e s
t o S V P
• S
I P O C
2 / 2
D e fi n e
R e p o r t
D u e
3
/ 2
M e a s u r e
R e p o r t
D
u e
4 / 6
A n a l y z e
R e p o r t
D u e
J a n
F e b
M a r
A p r
M a y
D e fi n e A c t i v i t i e s
• T
e a m
O r g a n i z a t i o n
A c t i v i t i e s
• P
r o j e c t
C h a r t e r
• S
t a k e h o l d
e r
A n a l y s i s
• C
o s t B e n e fi t
A n a l y s i s
• C
a u s e a n
d E ff e c t
B r a i n s t o r m i n g
A n a l y z e A c t i v i t i e s
• P
r o c e s s F l o w
D i a g r a m s
• S
u r v e y E x e c u t i o n
• D
a t a b a s e D a t a
C o
l l e c t i o n
• C
T Q s
M e a s u r e A c t i v i t i e s
I m p r o v
e / C o n t r o l
A c t
i v i t i e s
• I m
p r o v
e m e n t
P l a n s
• R
e v i s e d
P r o c e s s
F l o w
D i a g r a m s
• C
o n t r o l P l a n
R e c o m m e n
d a t i o n s
F i g u r e
4 . 3
0
M a c r o p r o j e c t t i m e l i n e .
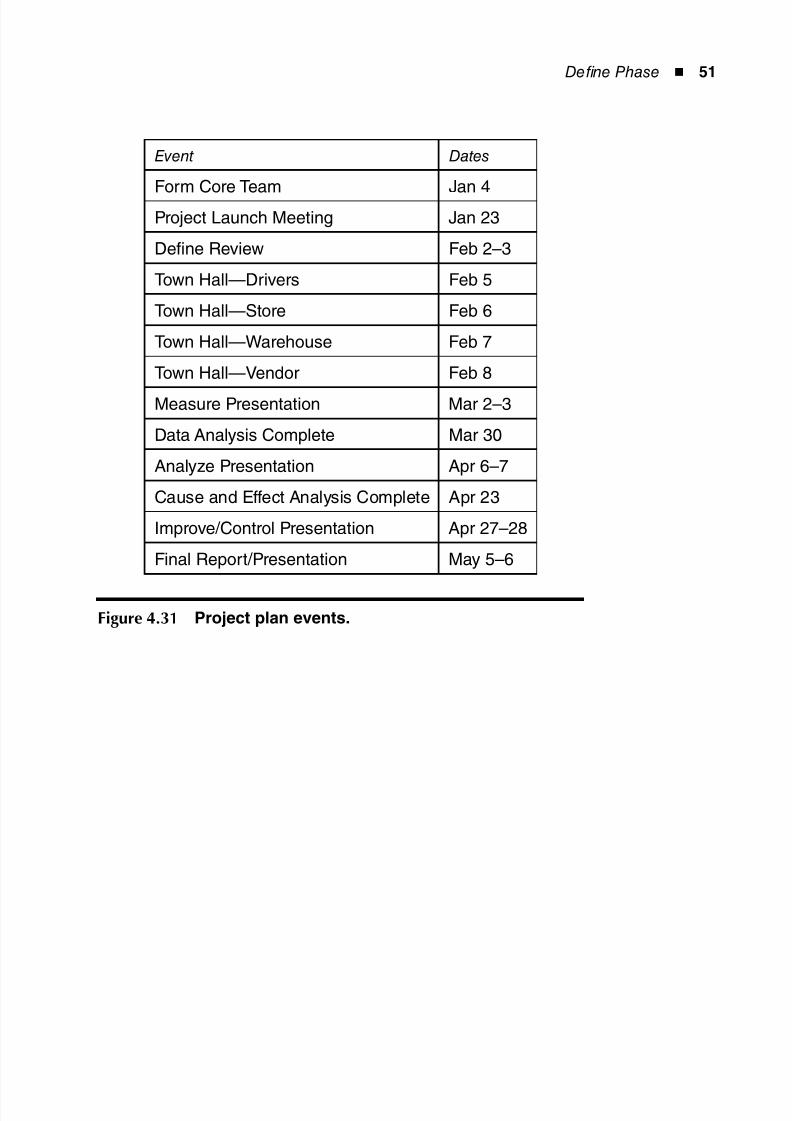
8/12/2019 Implementing Lean Six Sigma Throughout the Supply Chain
http://slidepdf.com/reader/full/implementing-lean-six-sigma-throughout-the-supply-chain 68/278
Define Phase ◾ 51
Event Dates
Form Core Team Jan 4
Project Launch Meeting Jan 23
Define Review Feb 2–3
Town Hall—Drivers Feb 5
Town Hall—Store Feb 6
Town Hall—Warehouse Feb 7
Town Hall—Vendor Feb 8
Measure Presentation Mar 2–3
Data Analysis Complete Mar 30
Analyze Presentation Apr 6–7
Cause and Effect Analysis Complete Apr 23
Improve/Control Presentation Apr 27–28
Final Report/Presentation May 5–6
Figure 4.31 Project plan events.
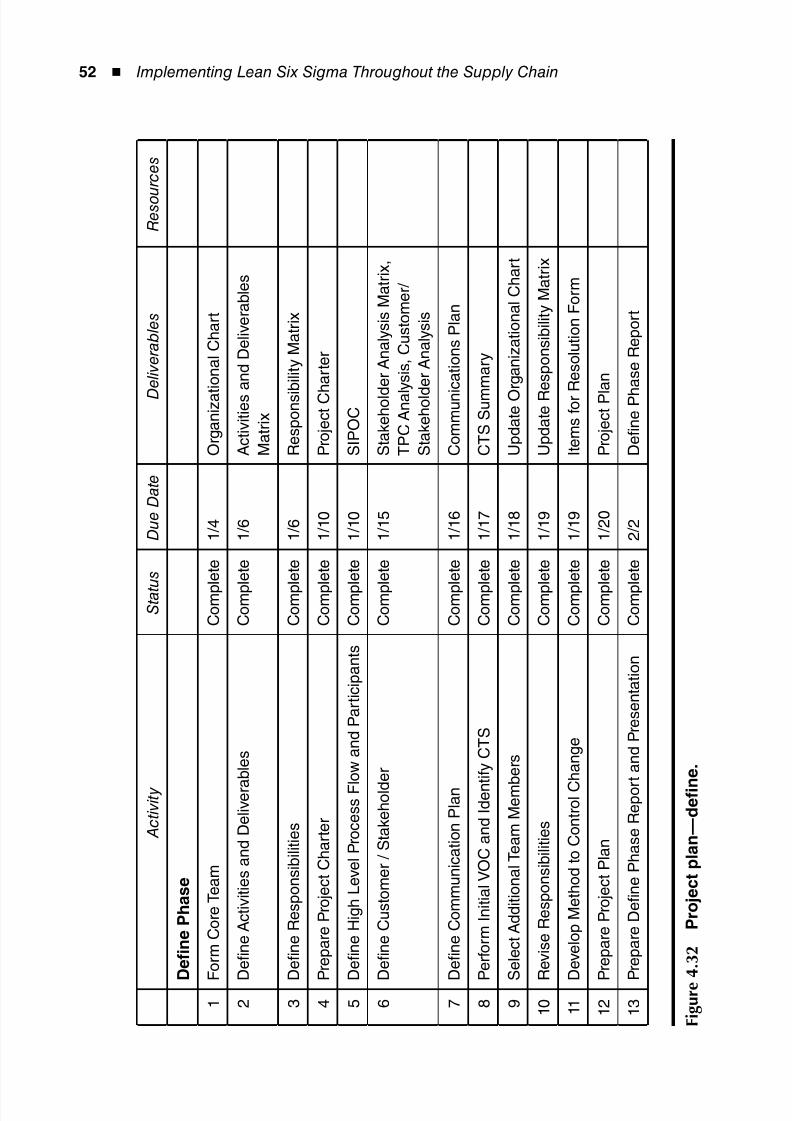
8/12/2019 Implementing Lean Six Sigma Throughout the Supply Chain
http://slidepdf.com/reader/full/implementing-lean-six-sigma-throughout-the-supply-chain 69/278
52 ◾ Implementing Lean Six Sigma Throughout the Supply Chain
A c t i v i t y
S t a t u s
D u e D a t e
D e l i v e r a b l e s
R e s o u
r c e s
D e fi n e P h a s e
1
F o r m C o r e T e a m
C o m p
l e t e
1 / 4
O r g a n i z a t i o n a l C h a r t
2
D e fi n e A c t i v i t i e s a n d D e l i v e r a
b l e s
C o m p
l e t e
1 / 6
A c t i v i t i e s a n d D e l i v e r a b l e s
M a t r i x
3
D e fi n e R e s p o n s i b i l i t i e s
C o m p
l e t e
1 / 6
R e s p o n s i b i l i t y M a t r i x
4
P r e p a r e P r o j e c t C h a r t e r
C o m p
l e t e
1 / 1 0
P r o j e c t C h
a r t e r
5
D e fi n e H i g h L e v e l P r o c e s s F l o w a n d P a r t i c i p a n t s
C o m p
l e t e
1 / 1 0
S I P O C
6
D e fi n e C u s t o m e r / S t a k e h o l d e r
C o m p
l e t e
1 / 1 5
S t a k e h o l d
e r A n a l y s i s M a t r i x ,
T P C A n a l y s i s , C u s t o m e r /
S t a k e h o l d
e r A n a l y s i s
7
D e fi n e C o m m u n i c a t i o n P l a n
C o m p
l e t e
1 / 1 6
C o m m u n i c a t i o n s P l a n
8
P e r f o r m I n i t i a l V O C a n d I d e n t i f y C T S
C o m p
l e t e
1 / 1 7
C T S S u m
m a r y
9
S e l e c t A d d i t i o n a l T e a m M e m b e r s
C o m p
l e t e
1 / 1 8
U p d a t e O r g a n i z a t i o n a l C h a r t
1 0
R e v i s e R e s p o n s i b i l i t i e s
C o m p
l e t e
1 / 1 9
U p d a t e R e s p o n s i b i l i t y M a t r i x
1 1
D e v e l o p M e t h o d t o C o n t r o l C
h a n g e
C o m p
l e t e
1 / 1 9
I t e m s f o r R e s o l u t i o n F o r m
1 2
P r e p a r e P r o j e c t P l a n
C o m p
l e t e
1 / 2 0
P r o j e c t P l a n
1 3
P r e p a r e D e fi n e P h a s e R e p o r
t a n d P r e s e n t a t i o n
C o m p
l e t e
2 / 2
D e fi n e P h
a s e R e p o r t
F i g u r e
4 . 3
2
P r o j e c t p l a n — d e fi n
e .
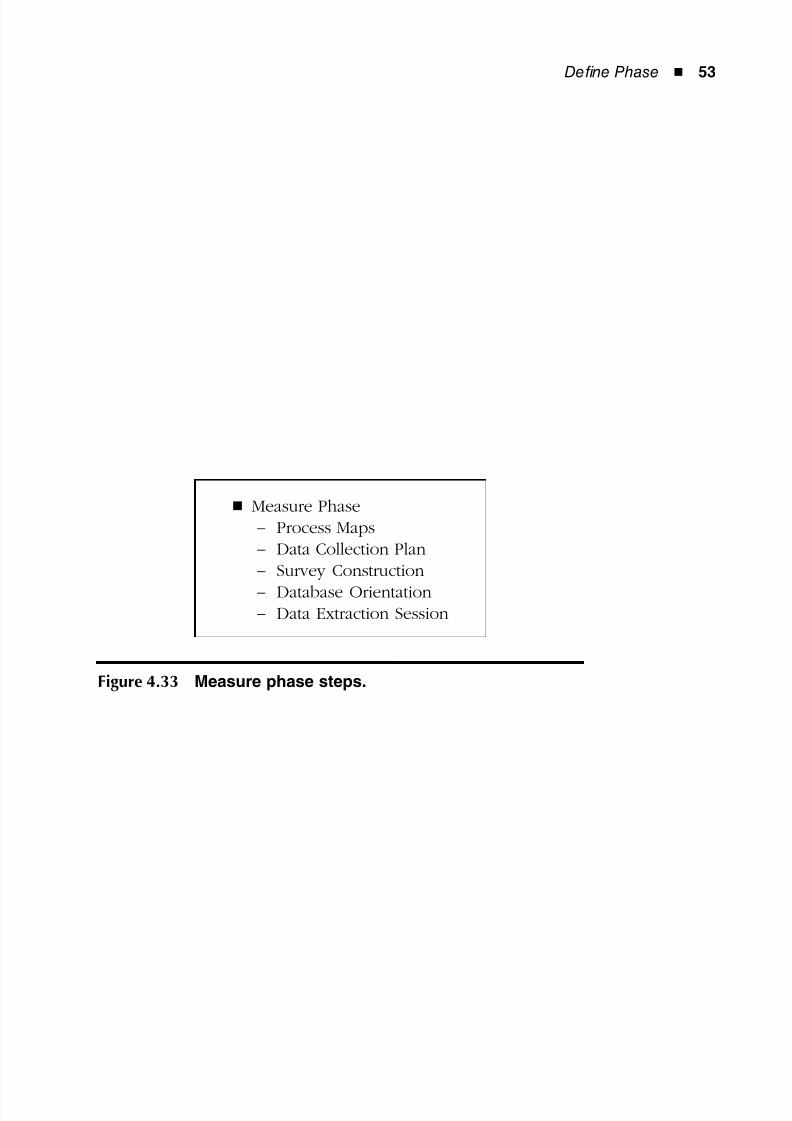
8/12/2019 Implementing Lean Six Sigma Throughout the Supply Chain
http://slidepdf.com/reader/full/implementing-lean-six-sigma-throughout-the-supply-chain 70/278
Define Phase ◾ 53
Measure Phase◾
Process Maps−
Data Collection Plan−
Survey Construction−
Database Orientation−
Data Extraction Session−
Figure 4.33 Measure phase steps.

8/12/2019 Implementing Lean Six Sigma Throughout the Supply Chain
http://slidepdf.com/reader/full/implementing-lean-six-sigma-throughout-the-supply-chain 71/278
8/12/2019 Implementing Lean Six Sigma Throughout the Supply Chain
http://slidepdf.com/reader/full/implementing-lean-six-sigma-throughout-the-supply-chain 72/278
55
5Chapter
Measure Phase
Introduction
With the Define phase complete, the Lean Six Sigma team
now had a clear understanding of what was to be done,
how they were going to do it, and who was responsible for
getting it done. The team had also developed a valuable
understanding of the stakeholders and their level of resis-tance to the change. In addition, there was a communica-
tions plan to ensure that all members and stakeholders had
opportunities to exchange ideas and allow for the voice of
the customer to be heard. Now it was time to move on.
Within the Measure phase, the team must further
define the processes that it is going to study, so that a
plan can be built that covers what data exists within theprocess and what data they must collect. Concurrently,
the team will collect the voice of the customer, which is
impacted by the trailer utilization process. Through inter-
views, focus groups, and surveys, the VOC will appear.
Then, once the data has been collected, the voice of
the process (VOP) is defined, which sets the baseline
for the process. To ensure that the data collected is notbiased by the collection instrument or methods, they will
8/12/2019 Implementing Lean Six Sigma Throughout the Supply Chain
http://slidepdf.com/reader/full/implementing-lean-six-sigma-throughout-the-supply-chain 73/278
56 ◾ Implementing Lean Six Sigma Throughout the Supply Chain
need to validate the instruments and methods that were
used. So, let’s get back to the case.
As preparation for the first meeting of the Measure
phase, Anita sent the team members a list of questions
that she used as a basis for the meeting’s discussion.
What are the key metrics for the business process?◾
Are the metrics valid and reliable?◾
Do we have adequate data on this process?◾
How will we measure progress?◾
How will we measure ultimate success?◾
The team’s next effort was to document the current
process. This included the process itself and all inputs and
outputs as they were at the time of recording. Validation
of the measurement process was also necessary. Jim
Pulls had helped Anita put together a list of deliverablesrelative to the activities that were planned for this phase.
Figure 5.1 shows each item as planned. One of the team
members, Simone Fillbert, asked why they were doing
a survey. Wouldn’t the data from the Logistics depart-
ment be enough? Anita and Joe both agreed that the data
only shows some of the areas for improvement. They
explained that knowing the voice of the customer wasimportant for finding variation, but it can also lead to
discoveries that the database data does not document.
Define the Current Process
Cindy Patch, Chris Roberts, and Anita were tasked withdefining the current process. Before they started to
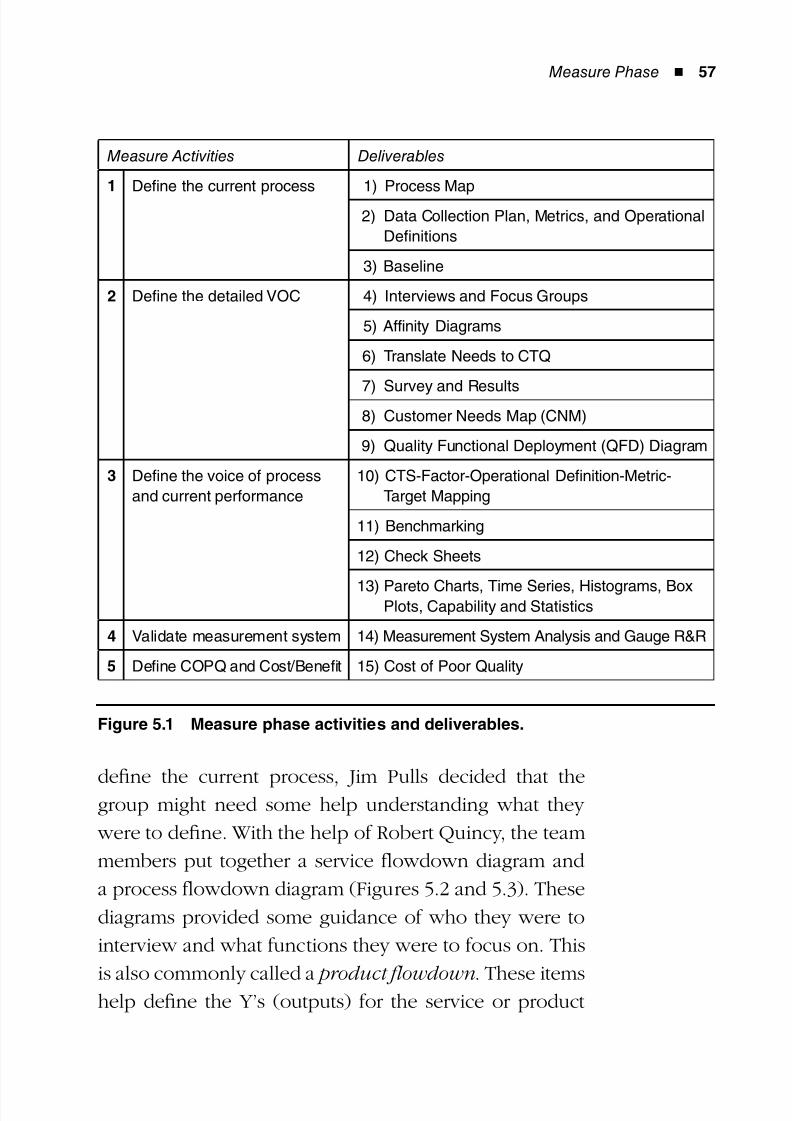
8/12/2019 Implementing Lean Six Sigma Throughout the Supply Chain
http://slidepdf.com/reader/full/implementing-lean-six-sigma-throughout-the-supply-chain 74/278
Measure Phase ◾ 57
define the current process, Jim Pulls decided that thegroup might need some help understanding what they
were to define. With the help of Robert Quincy, the team
members put together a service flowdown diagram and
a process flowdown diagram (Figures 5.2 and 5.3). These
diagrams provided some guidance of who they were to
interview and what functions they were to focus on. This
is also commonly called a product flowdown. These itemshelp define the Y’s (outputs) for the service or product
Measure Activities Deliverables
1 Define the current process 1) Process Map
2) Data Collection Plan, Metrics, and Operational
Definitions
3) Baseline
2 Define the detailed VOC 4) Interviews and Focus Groups
5) Affinity Diagrams
6) Translate Needs to CTQ
7) Survey and Results 8) Customer Needs Map (CNM)
9) Quality Functional Deployment (QFD) Diagram
3 Define the voice of process
and current performance
10) CTS-Factor-Operational Definition-Metric-
Target Mapping
11) Benchmarking
12) Check Sheets
13) Pareto Charts, Time Series, Histograms, BoxPlots, Capability and Statistics
4 Validate measurement system 14) Measurement System Analysis and Gauge R&R
5 Define COPQ and Cost/Benefit 15) Cost of Poor Quality
Figure 5.1 Measure phase activities and deliverables.
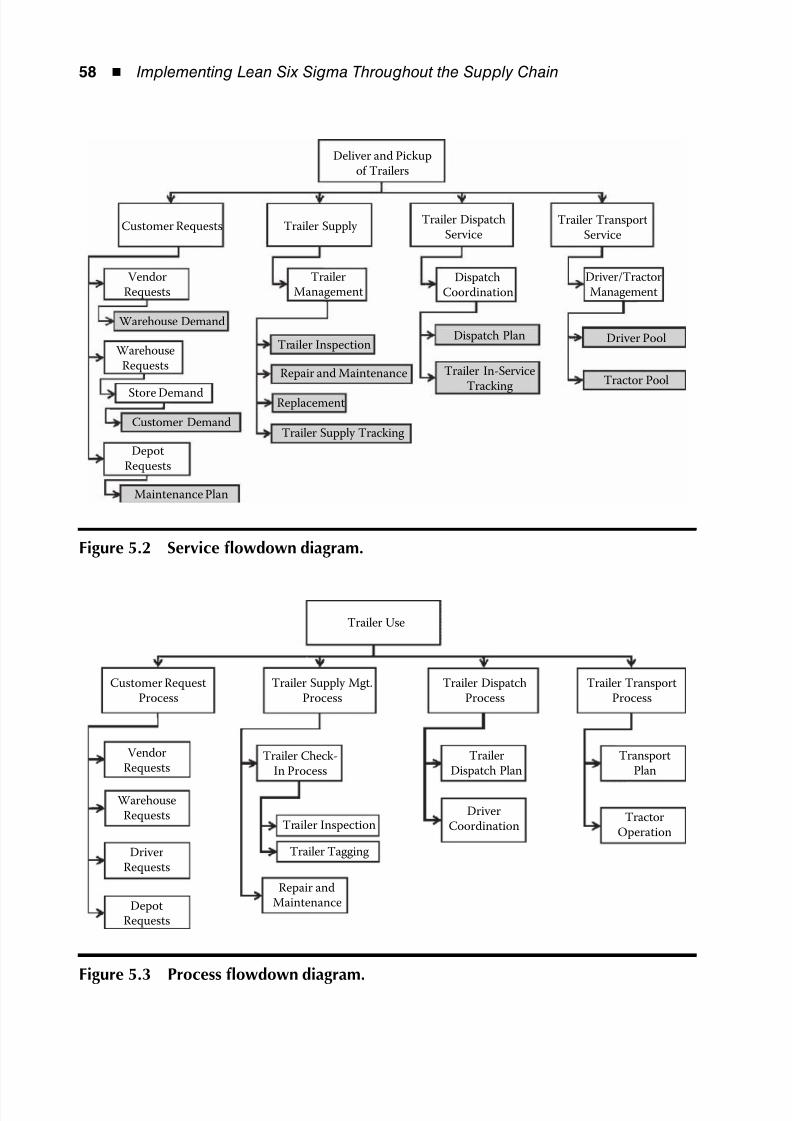
8/12/2019 Implementing Lean Six Sigma Throughout the Supply Chain
http://slidepdf.com/reader/full/implementing-lean-six-sigma-throughout-the-supply-chain 75/278
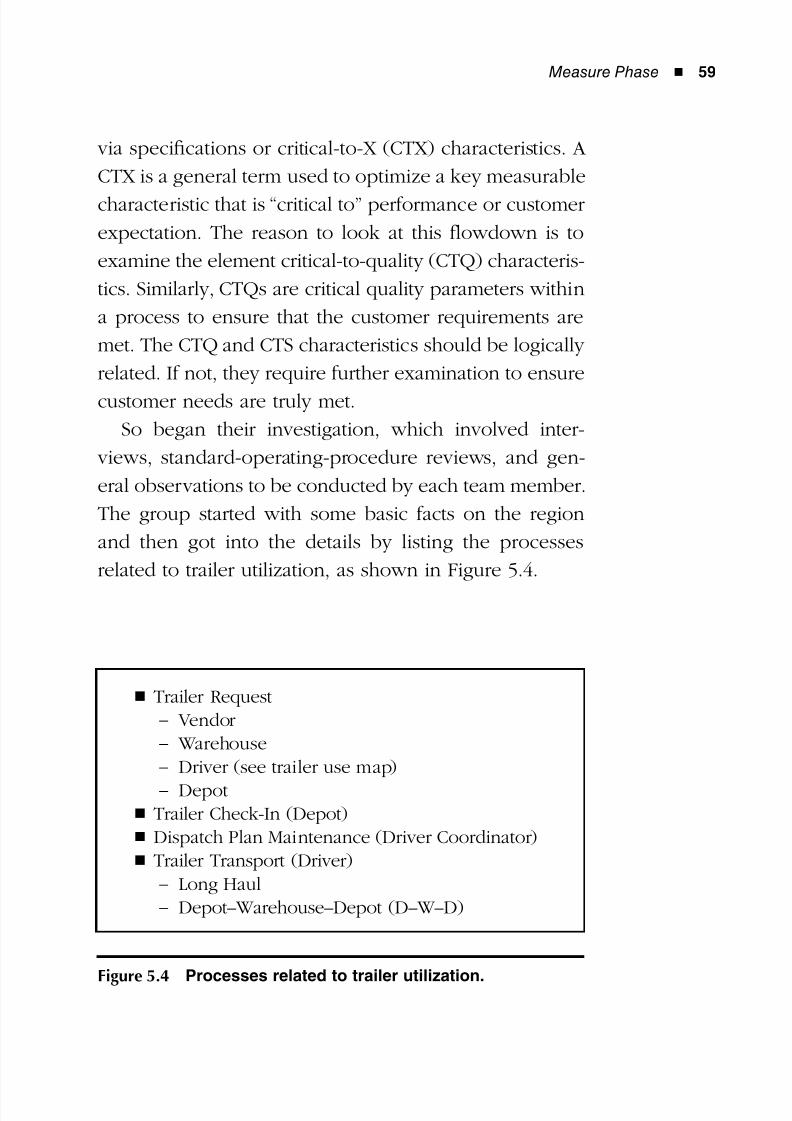
8/12/2019 Implementing Lean Six Sigma Throughout the Supply Chain
http://slidepdf.com/reader/full/implementing-lean-six-sigma-throughout-the-supply-chain 76/278
Measure Phase ◾ 59
via specifications or critical-to-X (CTX) characteristics. A
CTX is a general term used to optimize a key measurable
characteristic that is “critical to” performance or customer
expectation. The reason to look at this flowdown is to
examine the element critical-to-quality (CTQ) characteris-
tics. Similarly, CTQs are critical quality parameters within
a process to ensure that the customer requirements are
met. The CTQ and CTS characteristics should be logically
related. If not, they require further examination to ensure
customer needs are truly met.
So began their investigation, which involved inter-
views, standard-operating-procedure reviews, and gen-
eral observations to be conducted by each team member.
The group started with some basic facts on the region
and then got into the details by listing the processes
related to trailer utilization, as shown in Figure 5.4.
Trailer Request◾
Vendor−
Warehouse−
Driver (see trailer use map)−
Depot−
Trailer Check-In (Depot)◾
Dispatch Plan Maintenance (Driver Coordinator)◾
Trailer Transport (Driver)◾
Long Haul−
Depot–Warehouse–Depot (D–W–D)−
Figure 5.4 Processes related to trailer utilization.
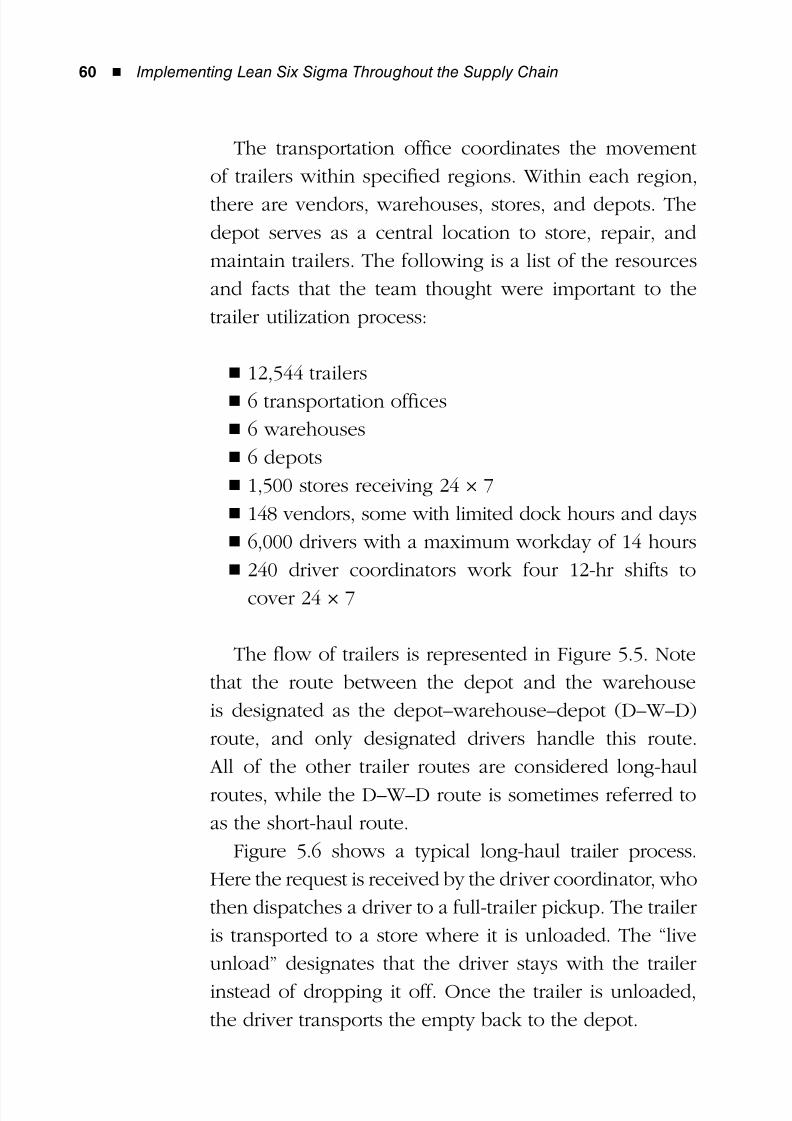
8/12/2019 Implementing Lean Six Sigma Throughout the Supply Chain
http://slidepdf.com/reader/full/implementing-lean-six-sigma-throughout-the-supply-chain 77/278
60 ◾ Implementing Lean Six Sigma Throughout the Supply Chain
The transportation office coordinates the movement
of trailers within specified regions. Within each region,
there are vendors, warehouses, stores, and depots. The
depot serves as a central location to store, repair, and
maintain trailers. The following is a list of the resources
and facts that the team thought were important to the
trailer utilization process:
12,544 trailers◾
6 transportation offices◾
6 warehouses◾
6 depots◾
1,500 stores receiving 24 × 7◾
148 vendors, some with limited dock hours and days◾
6,000 drivers with a maximum workday of 14 hours◾
240 driver coordinators work four 12-hr shifts to◾
cover 24 × 7
The flow of trailers is represented in Figure 5.5. Note
that the route between the depot and the warehouse
is designated as the depot–warehouse–depot (D–W–D)
route, and only designated drivers handle this route.
All of the other trailer routes are considered long-haul
routes, while the D–W–D route is sometimes referred to
as the short-haul route.
Figure 5.6 shows a typical long-haul trailer process.
Here the request is received by the driver coordinator, who
then dispatches a driver to a full-trailer pickup. The trailer
is transported to a store where it is unloaded. The “live
unload” designates that the driver stays with the trailer
instead of dropping it off. Once the trailer is unloaded,
the driver transports the empty back to the depot.
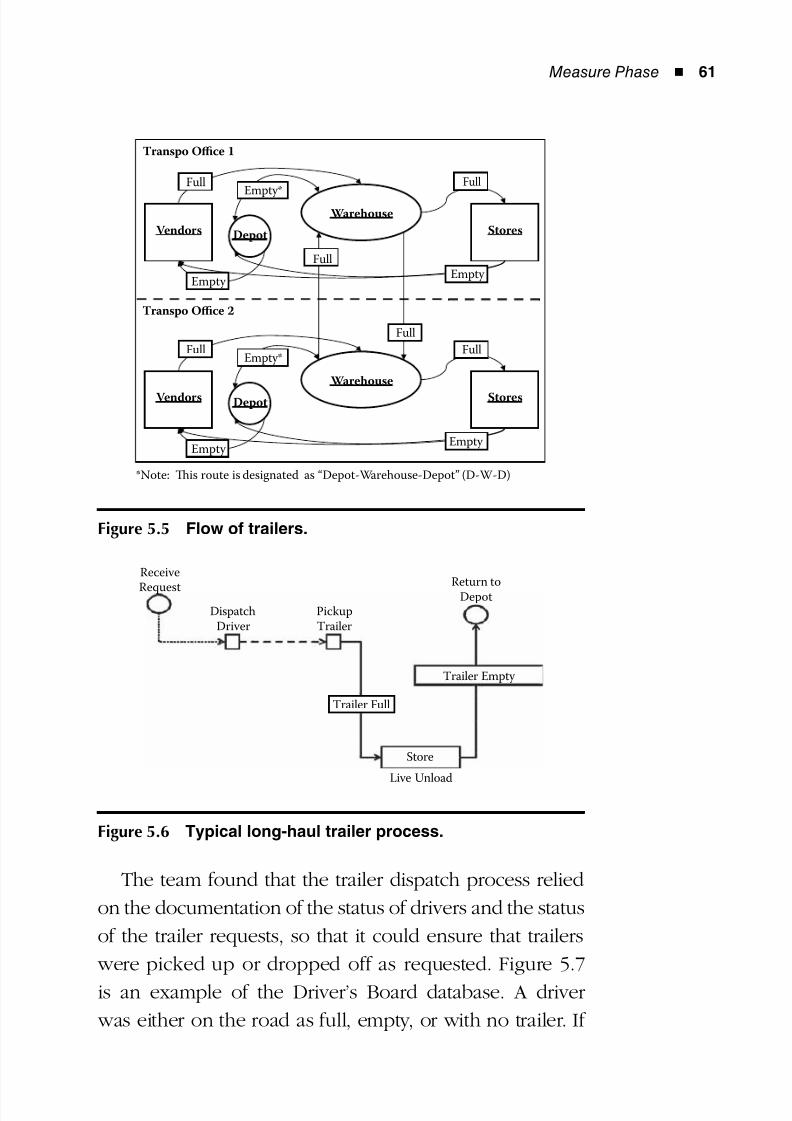
8/12/2019 Implementing Lean Six Sigma Throughout the Supply Chain
http://slidepdf.com/reader/full/implementing-lean-six-sigma-throughout-the-supply-chain 78/278
Measure Phase ◾ 61
The team found that the trailer dispatch process relied
on the documentation of the status of drivers and the status
of the trailer requests, so that it could ensure that trailers
were picked up or dropped off as requested. Figure 5.7
is an example of the Driver’s Board database. A driver
was either on the road as full, empty, or with no trailer. If
*Note: Tis route is designated as “Depot-Warehouse-Depot” (D-W-D)
Warehouse
Vendors StoresDepot
Full
Empty
Warehouse
Vendors StoresDepot
Full
Empty
Full
Full
Full
Full
Empty*
Empty
Empty
Empty*
Transpo Office 2
Transpo Office 1
Figure 5.5 Flow of trailers.
Receive
Request
DispatchDriver
PickupTrailer
Trailer Full
Live Unload
Store
Trailer Empty
Return toDepot
Figure 5.6 Typical long-haul trailer process.
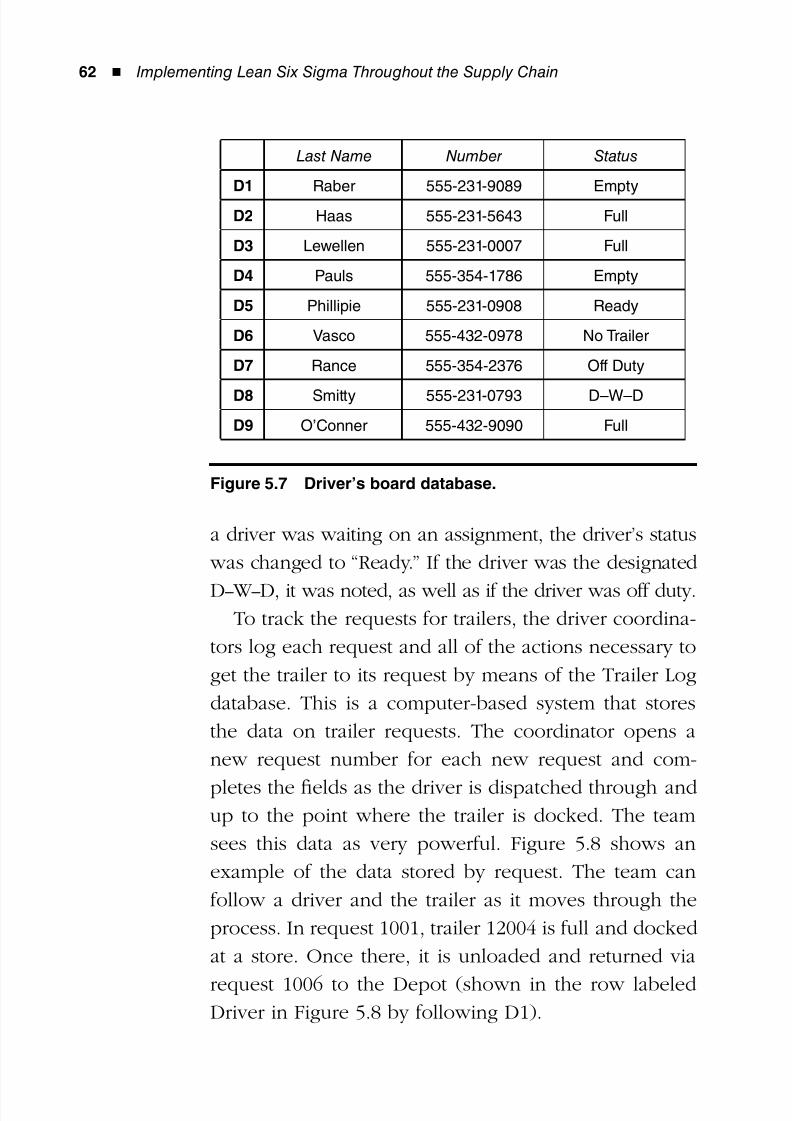
8/12/2019 Implementing Lean Six Sigma Throughout the Supply Chain
http://slidepdf.com/reader/full/implementing-lean-six-sigma-throughout-the-supply-chain 79/278
62 ◾ Implementing Lean Six Sigma Throughout the Supply Chain
a driver was waiting on an assignment, the driver’s status
was changed to “Ready.” If the driver was the designated
D– W –D, it was noted, as well as if the driver was off duty.To track the requests for trailers, the driver coordina-
tors log each request and all of the actions necessary to
get the trailer to its request by means of the Trailer Log
database. This is a computer-based system that stores
the data on trailer requests. The coordinator opens a
new request number for each new request and com-
pletes the fields as the driver is dispatched through andup to the point where the trailer is docked. The team
sees this data as very powerful. Figure 5.8 shows an
example of the data stored by request. The team can
follow a driver and the trailer as it moves through the
process. In request 1001, trailer 12004 is full and docked
at a store. Once there, it is unloaded and returned via
request 1006 to the Depot (shown in the row labeledDriver in Figure 5.8 by following D1).
Last Name Number Status
D1 Raber 555-231-9089 Empty
D2 Haas 555-231-5643 Full
D3 Lewellen 555-231-0007 Full
D4 Pauls 555-354-1786 Empty
D5 Phillipie 555-231-0908 Ready
D6 Vasco 555-432-0978 No Trailer
D7 Rance 555-354-2376 Off Duty
D8 Smitty 555-231-0793 D–W–D
D9 O’Conner 555-432-9090 Full
Figure 5.7 Driver’s board database.
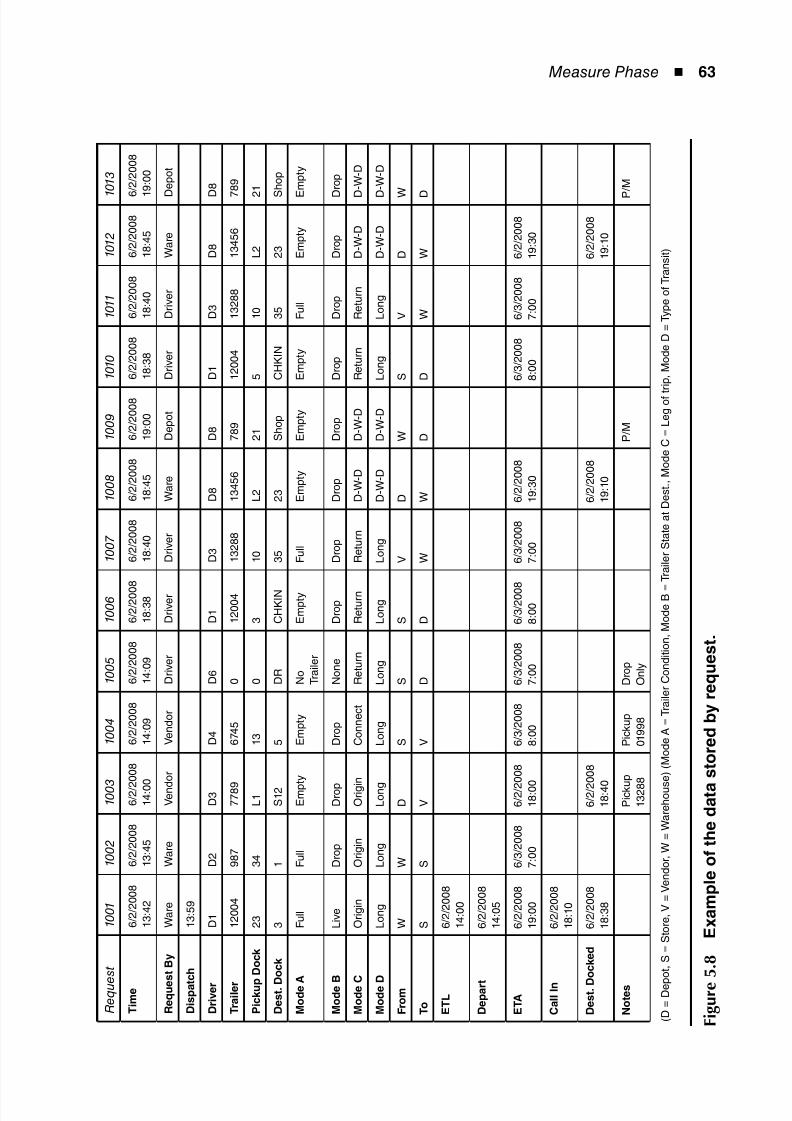
8/12/2019 Implementing Lean Six Sigma Throughout the Supply Chain
http://slidepdf.com/reader/full/implementing-lean-six-sigma-throughout-the-supply-chain 80/278
Measure Phase ◾ 63
R e q u e
s t
1 0 0 1
1 0 0 2
1 0 0 3
1 0 0 4
1 0 0 5
1 0 0 6
1 0 0 7
1 0 0 8
1 0 0 9
1 0 1 0
1 0 1 1
1 0 1 2
1
0 1 3
T i m e
6 / 2 / 2 0 0 8
1 3 : 4 2
6 / 2 / 2 0 0 8
1 3 : 4 5
6 / 2 / 2
0 0 8
1 4 : 0 0
6 / 2 / 2 0 0 8
1 4 : 0 9
6 / 2 / 2 0 0 8
1 4 : 0 9
6 / 2 / 2 0 0 8
1 8 : 3 8
6 / 2 / 2 0 0 8
1 8 : 4 0
6 / 2 / 2 0 0 8
1 8 : 4 5
6 / 2 / 2 0 0 8
1 9 : 0 0
6 / 2 / 2 0 0 8
1 8 : 3 8
6 / 2 / 2 0 0 8
1 8 : 4 0
6 / 2 / 2 0 0 8
1 8 : 4 5
6
/ 2 / 2 0 0 8
1
9 : 0 0
R e q u e s t B y
W a r e
W a r e
V e n d
o r
V e n d o r
D r i v e r
D r i v e r
D r i v e r
W a r e
D e p o t
D r i v e r
D r i v e r
W a r e
D
e p o t
D i s p a t c h
1 3 : 5 9
D r i v e r
D 1
D 2
D 3
D 4
D 6
D 1
D 3
D 8
D 8
D 1
D 3
D 8
D
8
T r a i l e r
1 2 0 0 4
9 8 7
7 7 8 9
6 7 4 5
0
1 2 0 0 4
1 3 2 8 8
1 3 4 5 6
7 8 9
1 2 0 0 4
1 3 2 8 8
1 3 4 5 6
7
8 9
P i c k u p
D o c k
2 3
3 4
L 1
1 3
0
3
1 0
L 2
2 1
5
1 0
L 2
2
1
D e s t . D
o c k
3
1
S 1 2
5
D R
C H K I N
3 5
2 3
S h o p
C H K I N
3 5
2 3
S
h o p
M o d e A
F u l l
F u l l
E m p t y
E m p t y
N o T r a i l e r
E m p t y
F u l l
E m p t y
E m p t y
E m p t y
F u l l
E m p t y
E
m p t y
M o d e B
L i v e
D r o p
D r o p
D r o p
N o n e
D r o p
D r o p
D r o p
D r o p
D r o p
D r o p
D r o p
D
r o p
M o d e C
O r i g i n
O r i g i n
O r i g i n
C o n n e c t
R e t u r n
R e t u r n
R e t u r n
D - W - D
D - W - D
R e t u r n
R e t u r n
D - W - D
D
- W - D
M o d e D
L o n g
L o n g
L o n g
L o n g
L o n g
L o n g
L o n g
D - W - D
D - W - D
L o n g
L o n g
D - W - D
D
- W - D
F r o m
W
W
D
S
S
S
V
D
W
S
V
D
W
T o
S
S
V
V
D
D
W
W
D
D
W
W
D
E T L
6 / 2 / 2 0 0 8
1 4 : 0 0
D e p a r t
6 / 2 / 2 0 0 8
1 4 : 0 5
E T A
6 / 2 / 2 0 0 8
1 9 : 0 0
6 / 3 / 2 0 0 8
7 : 0 0
6 / 2 / 2
0 0 8
1 8 : 0 0
6 / 3 / 2 0 0 8
8 : 0 0
6 / 3 / 2 0 0 8
7 : 0 0
6 / 3 / 2 0 0 8
8 : 0 0
6 / 3 / 2 0 0 8
7 : 0 0
6 / 2 / 2 0 0 8
1 9 : 3 0
6 / 3 / 2 0 0 8
8 : 0 0
6 / 3 / 2 0 0 8
7 : 0 0
6 / 2 / 2 0 0 8
1 9 : 3 0
C a l l I n
6 / 2 / 2 0 0 8
1 8 : 1 0
D e s t . D
o c k e d
6 / 2 / 2 0 0 8
1 8 : 3 8
6 / 2 / 2
0 0 8
1 8 : 4 0
6 / 2 / 2 0 0 8
1 9 : 1 0
6 / 2 / 2 0 0 8
1 9 : 1 0
N o t e s
P i c k u
p
1 3 2 8 8
P i c k u p
0 1 9 9 8
D r o p
O n l y
P / M
P
/ M
( D = D e p
o t , S = S t o r e , V = V e n d o r , W = W a r e h o u s
e ) ( M o d e A = T r a i l e r C o n d i t i o n , M o d e B =
T r a i l e r S t a t e a t D e s t . , M o d e C = L e g o f t r i p , M o d e D = T y p e o f T r a n s i t )
F i g u r e
5 . 8
E x a m p l e o f t h e d a t a
s t o r e d b y r e q u e s t .
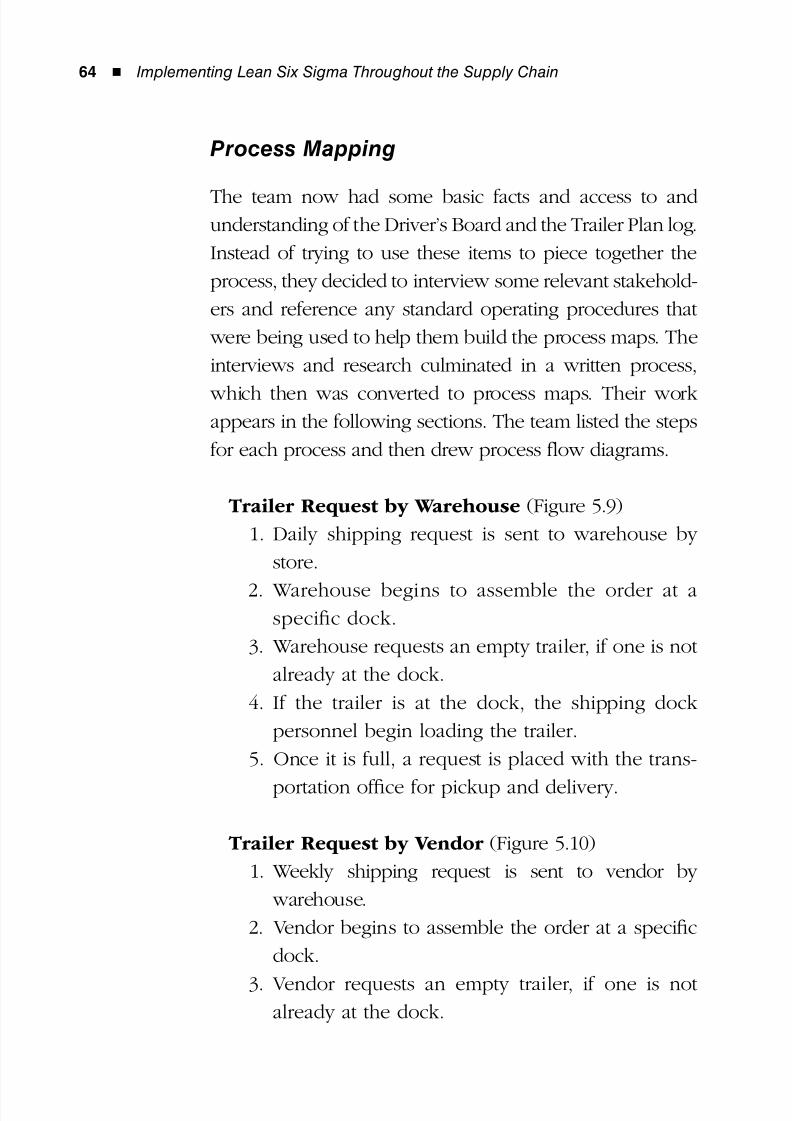
8/12/2019 Implementing Lean Six Sigma Throughout the Supply Chain
http://slidepdf.com/reader/full/implementing-lean-six-sigma-throughout-the-supply-chain 81/278
64 ◾ Implementing Lean Six Sigma Throughout the Supply Chain
Process Mapping
The team now had some basic facts and access to andunderstanding of the Driver’s Board and the Trailer Plan log.
Instead of trying to use these items to piece together the
process, they decided to interview some relevant stakehold-
ers and reference any standard operating procedures that
were being used to help them build the process maps. The
interviews and research culminated in a written process,
which then was converted to process maps. Their workappears in the following sections. The team listed the steps
for each process and then drew process flow diagrams.
Trailer Request by Warehouse (Figure 5.9)
1. Daily shipping request is sent to warehouse by
store.
2. Warehouse begins to assemble the order at aspecific dock.
3. Warehouse requests an empty trailer, if one is not
already at the dock.
4. If the trailer is at the dock, the shipping dock
personnel begin loading the trailer.
5. Once it is full, a request is placed with the trans-
portation office for pickup and delivery.
Trailer Request by Vendor (Figure 5.10)
1. Weekly shipping request is sent to vendor by
warehouse.
2. Vendor begins to assemble the order at a specific
dock.
3. Vendor requests an empty trailer, if one is notalready at the dock.
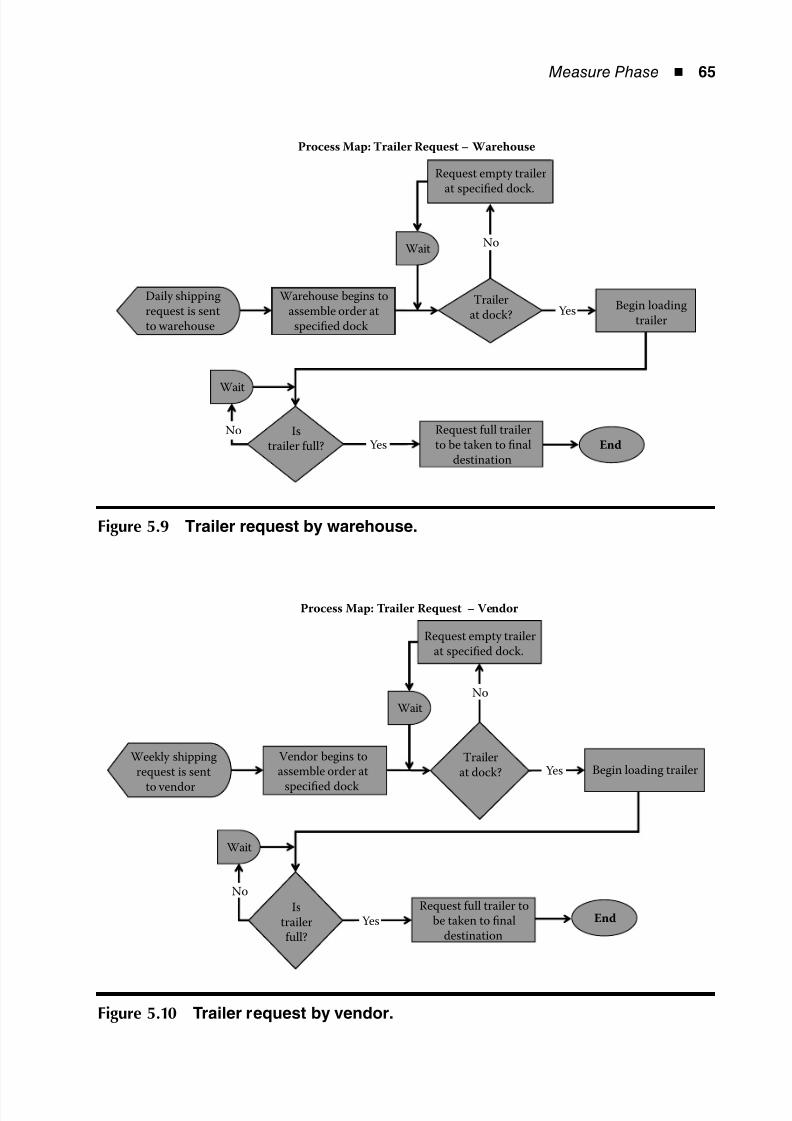
8/12/2019 Implementing Lean Six Sigma Throughout the Supply Chain
http://slidepdf.com/reader/full/implementing-lean-six-sigma-throughout-the-supply-chain 82/278
Measure Phase ◾ 65
Process Map: Trailer Request – Warehouse
Request empty trailerat specified dock.
Wait
Daily shippingrequest is sentto warehouse
Warehouse begins toassemble order atspecified dock
Trailerat dock?
Begin loadingtrailer
Wait
EndIs
trailer full?
Request full trailerto be taken to final
destination
No
Yes
YesNo
Figure 5.9 Trailer request by warehouse.
Process Map: Trailer Request – Vendor
Request empty trailerat specified dock.
Wait
Weekly shippingrequest is sent
to vendor
Vendor begins toassemble order at
specified dock
Trailerat dock? Begin loading trailer
EndIs
trailerfull?
Request full trailer tobe taken to final
destination
No
Yes
Yes
Wait
No
Figure 5.10 Trailer request by vendor.
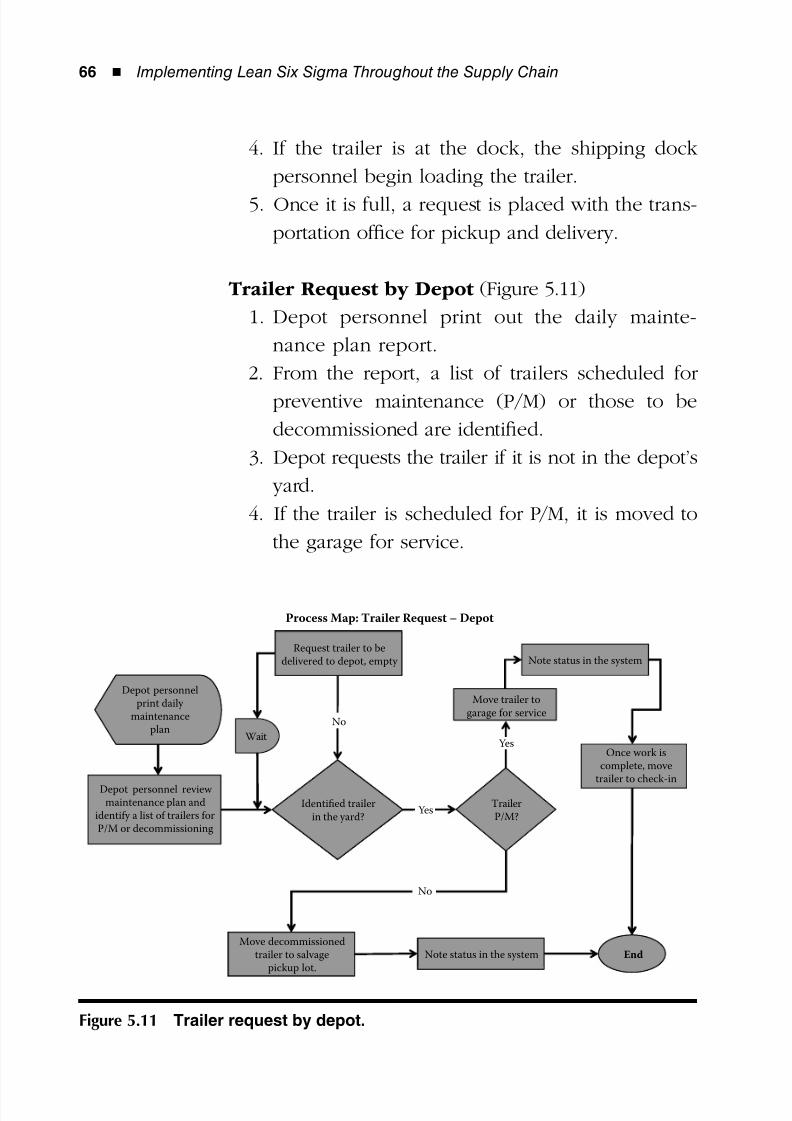
8/12/2019 Implementing Lean Six Sigma Throughout the Supply Chain
http://slidepdf.com/reader/full/implementing-lean-six-sigma-throughout-the-supply-chain 83/278
66 ◾ Implementing Lean Six Sigma Throughout the Supply Chain
4. If the trailer is at the dock, the shipping dock
personnel begin loading the trailer.
5. Once it is full, a request is placed with the trans-
portation office for pickup and delivery.
Trailer Request by Depot (Figure 5.11)
1. Depot personnel print out the daily mainte-
nance plan report.
2. From the report, a list of trailers scheduled for
preventive maintenance (P/M) or those to be
decommissioned are identified.
3. Depot requests the trailer if it is not in the depot’s
yard.
4. If the trailer is scheduled for P/M, it is moved to
the garage for service.
Move trailer to
garage for service
Process Map: Trailer Request – Depot
Depot personnel
print daily
maintenance
plan
Request trailer to be
delivered to depot, empty Note status in the system
Wait
Once work is
complete, move
trailer to check-inDepot personnel review
maintenance plan and
identify a list of trailers for
P/M or decommissioning
Identified trailer
in the yard?
Trailer
P/M?
End
Move decommissioned
trailer to salvage
pickup lot.
Note status in the system
No
Yes
Yes
No
Figure 5.11 Trailer request by depot.
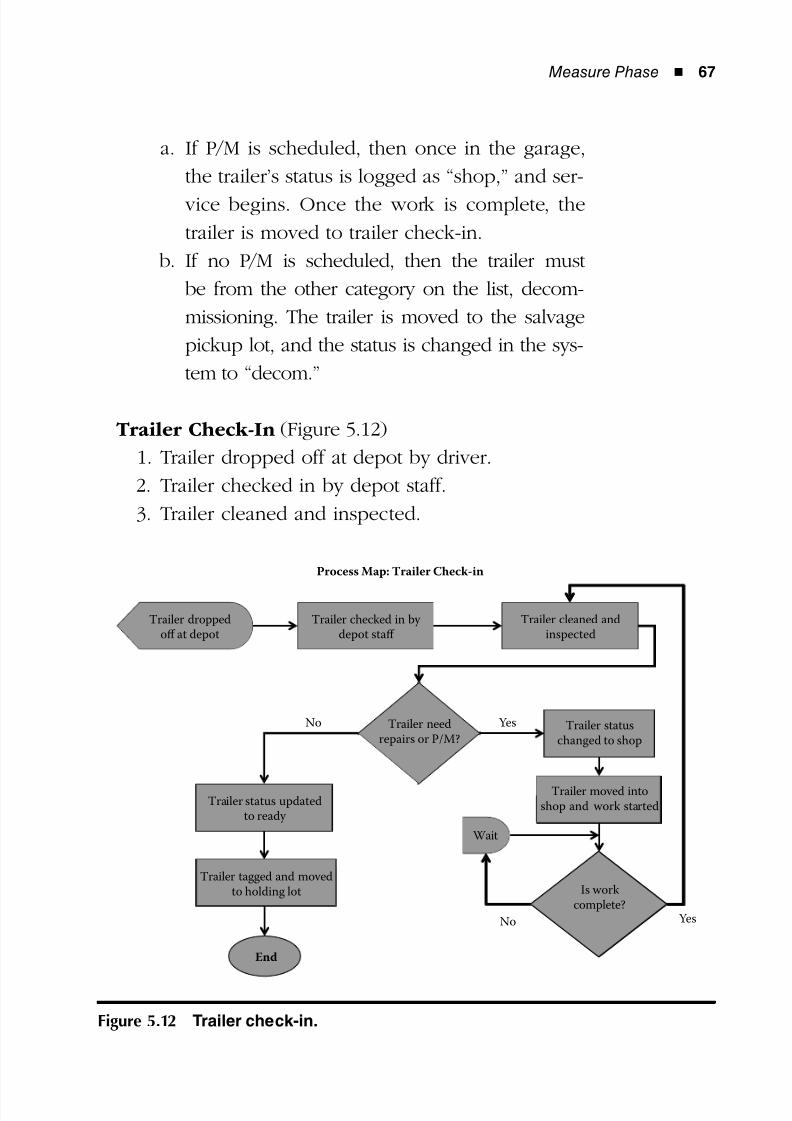
8/12/2019 Implementing Lean Six Sigma Throughout the Supply Chain
http://slidepdf.com/reader/full/implementing-lean-six-sigma-throughout-the-supply-chain 84/278
Measure Phase ◾ 67
a. If P/M is scheduled, then once in the garage,
the trailer’s status is logged as “shop,” and ser-
vice begins. Once the work is complete, the
trailer is moved to trailer check-in.
b. If no P/M is scheduled, then the trailer must
be from the other category on the list, decom-
missioning. The trailer is moved to the salvage
pickup lot, and the status is changed in the sys-
tem to “decom.”
Trailer Check-In (Figure 5.12)
1. Trailer dropped off at depot by driver.
2. Trailer checked in by depot staff.
3. Trailer cleaned and inspected.
hdk
Process Map: Trailer Check-in
Trailer droppedoff at depot
Trailer checked in by depot staff
Trailer cleaned andinspected
Trailer needrepairs or P/M?
YesNo Trailer statuschanged to shop
Trailer moved intoshop and work startedTrailer status updated
to ready
Wait
Is workcomplete?
No Yes
Trailer tagged and movedto holding lot
End
Figure 5.12 Trailer check-in.
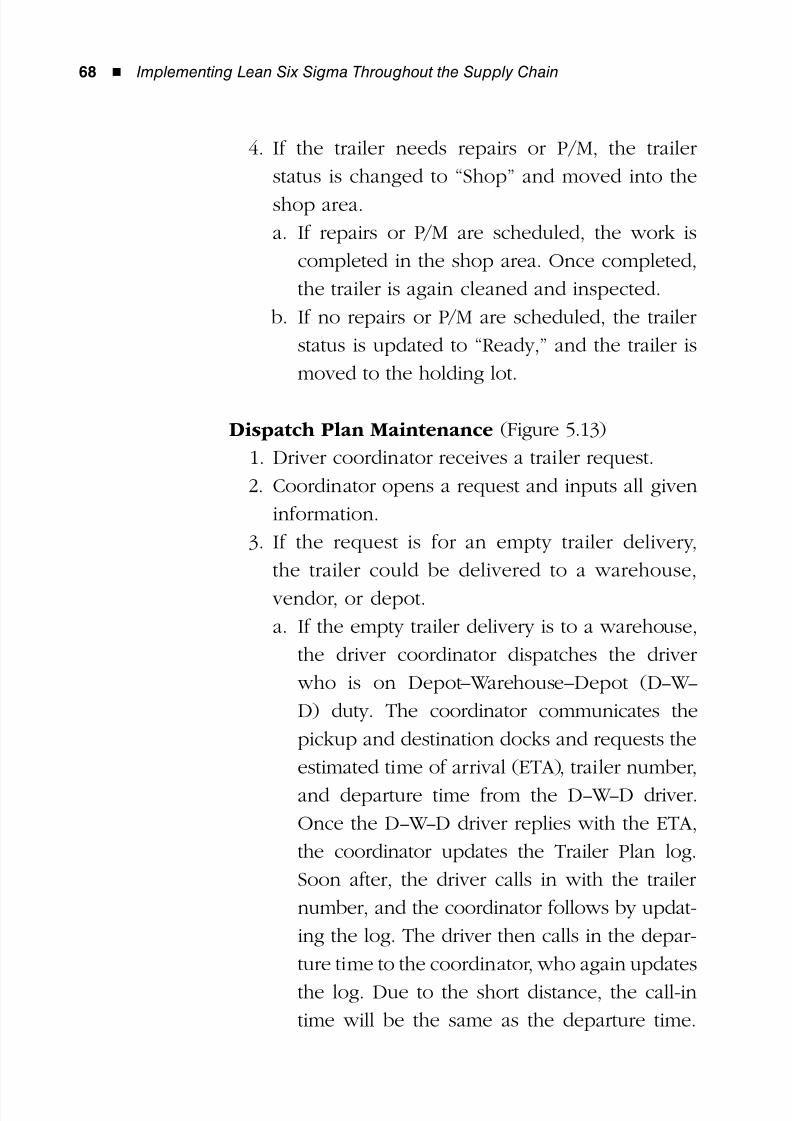
8/12/2019 Implementing Lean Six Sigma Throughout the Supply Chain
http://slidepdf.com/reader/full/implementing-lean-six-sigma-throughout-the-supply-chain 85/278
68 ◾ Implementing Lean Six Sigma Throughout the Supply Chain
4. If the trailer needs repairs or P/M, the trailer
status is changed to “Shop” and moved into the
shop area.
a. If repairs or P/M are scheduled, the work is
completed in the shop area. Once completed,
the trailer is again cleaned and inspected.
b. If no repairs or P/M are scheduled, the trailer
status is updated to “Ready,” and the trailer is
moved to the holding lot.
Dispatch Plan Maintenance (Figure 5.13)
1. Driver coordinator receives a trailer request.
2. Coordinator opens a request and inputs all given
information.
3. If the request is for an empty trailer delivery,
the trailer could be delivered to a warehouse,
vendor, or depot.
a. If the empty trailer delivery is to a warehouse,
the driver coordinator dispatches the driver
who is on Depot–Warehouse–Depot (D– W –
D) duty. The coordinator communicates the
pickup and destination docks and requests the
estimated time of arrival (ETA), trailer number,
and departure time from the D– W –D driver.
Once the D– W –D driver replies with the ETA,
the coordinator updates the Trailer Plan log.
Soon after, the driver calls in with the trailer
number, and the coordinator follows by updat-
ing the log. The driver then calls in the depar-
ture time to the coordinator, who again updates
the log. Due to the short distance, the call-in
time will be the same as the departure time.
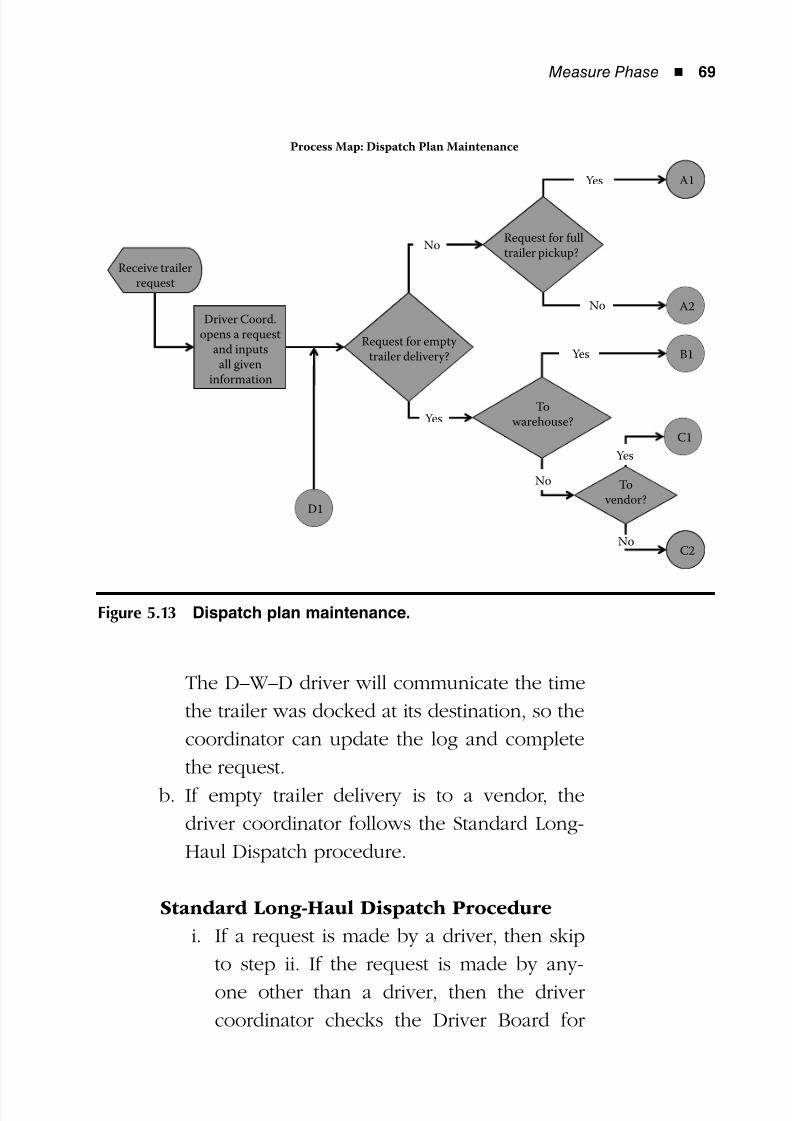
8/12/2019 Implementing Lean Six Sigma Throughout the Supply Chain
http://slidepdf.com/reader/full/implementing-lean-six-sigma-throughout-the-supply-chain 86/278
Measure Phase ◾ 69
The D–W–D driver will communicate the time
the trailer was docked at its destination, so the
coordinator can update the log and complete
the request.
b. If empty trailer delivery is to a vendor, the
driver coordinator follows the Standard Long-
Haul Dispatch procedure.
Standard Long-Haul Dispatch Procedure
i. If a request is made by a driver, then skip
to step ii. If the request is made by any-
one other than a driver, then the driver
coordinator checks the Driver Board for
Process Map: Dispatch Plan Maintenance
A1Yes
Receive trailerrequest
NoRequest for fulltrailer pickup?
Request for empty trailer delivery?
No A2Driver Coord.
opens a requestand inputs
all giveninformation
B1Yes
Towarehouse?
C1
Yes
Yes
To vendor?
No
D1
C2No
Figure 5.13 Dispatch plan maintenance.
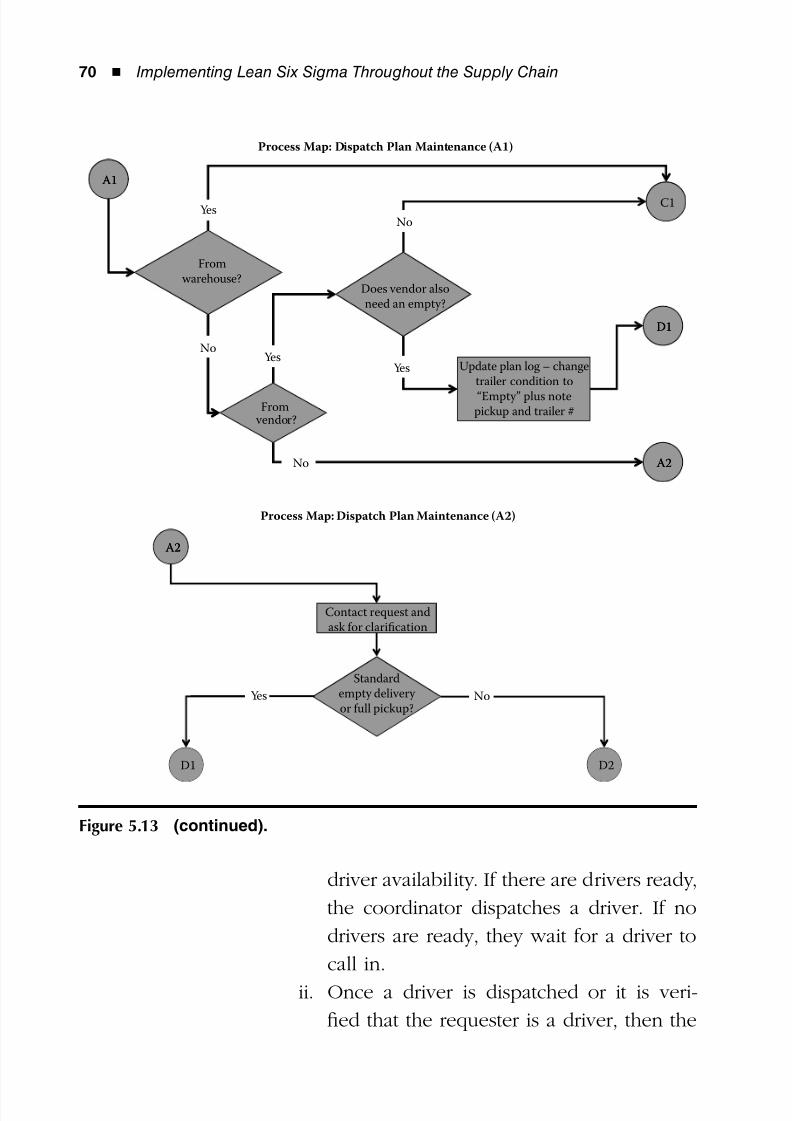
8/12/2019 Implementing Lean Six Sigma Throughout the Supply Chain
http://slidepdf.com/reader/full/implementing-lean-six-sigma-throughout-the-supply-chain 87/278
70 ◾ Implementing Lean Six Sigma Throughout the Supply Chain
driver availability. If there are drivers ready,
the coordinator dispatches a driver. If no
drivers are ready, they wait for a driver to
call in.
ii. Once a driver is dispatched or it is veri-
fied that the requester is a driver, then the
Process Map: Dispatch Plan Maintenance (A1)
A1
No
C1
A1
Yes
Fromwarehouse?
Does vendor alsoneed an empty?
D1
YesUpdate plan log – change
trailer condition to
“Empty” plus notepickup and trailer #
No
Yes
D1
From vendor?
A2No A2
Process Map: Dispatch Plan Maintenance (A2)
A2A2
Contact request andask for clarification
Standardempty delivery or full pickup?
NoYes
D2D1
Figure 5.13 (continued).
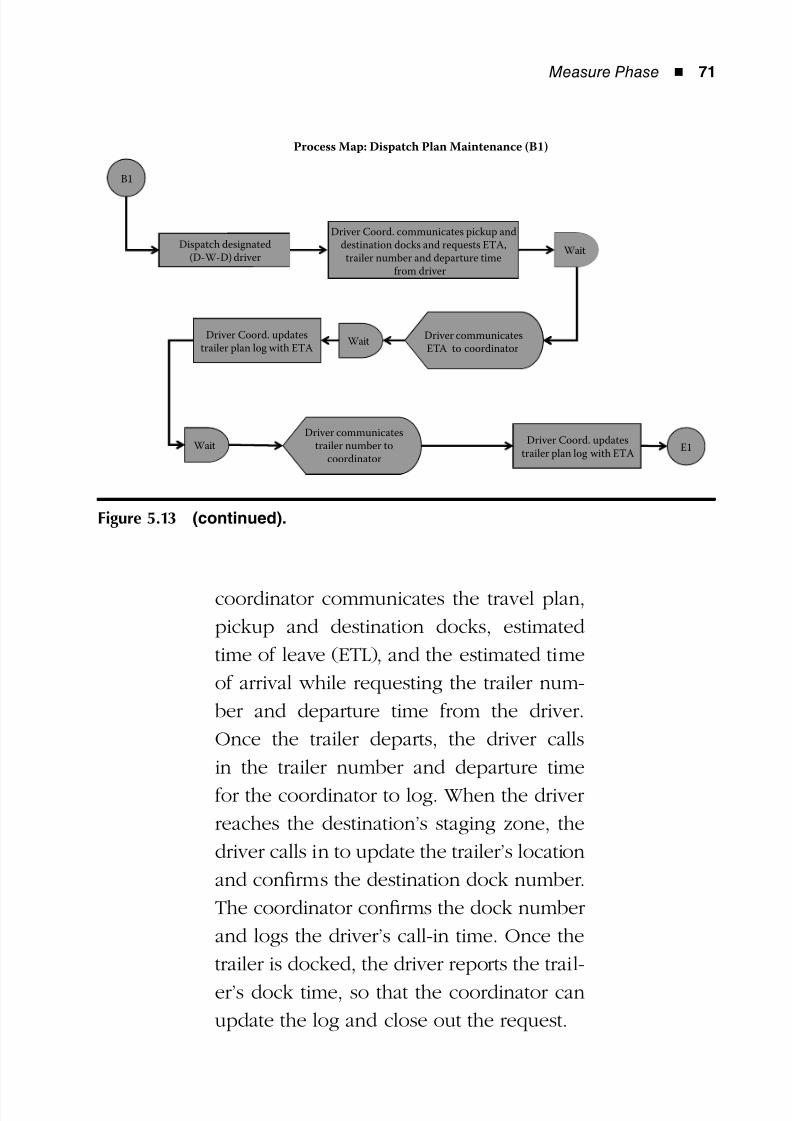
8/12/2019 Implementing Lean Six Sigma Throughout the Supply Chain
http://slidepdf.com/reader/full/implementing-lean-six-sigma-throughout-the-supply-chain 88/278
Measure Phase ◾ 71
coordinator communicates the travel plan,
pickup and destination docks, estimated
time of leave (ETL), and the estimated time
of arrival while requesting the trailer num-
ber and departure time from the driver.
Once the trailer departs, the driver calls
in the trailer number and departure time
for the coordinator to log. When the driver
reaches the destination’s staging zone, the
driver calls in to update the trailer’s location
and confirms the destination dock number.
The coordinator confirms the dock number
and logs the driver’s call-in time. Once the
trailer is docked, the driver reports the trail-
er’s dock time, so that the coordinator can
update the log and close out the request.
TrailerNumberandDeparturetimeD)Driver
Process Map: Dispatch Plan Maintenance (B1)
B1
Driver Coord. communicates pickup anddestination docks and requests ETA,trailer number and departure time
from driver
Dispatch designated(D-W-D) driver
Wait
Driver communicatesETA to coordinator
Driver Coord. updatestrailer plan log with ETA
Wait
E1
Driver communicatestrailer number to
coordinator
Driver Coord. updatestrailer plan log with ETA
Wait
Figure 5.13 (continued).
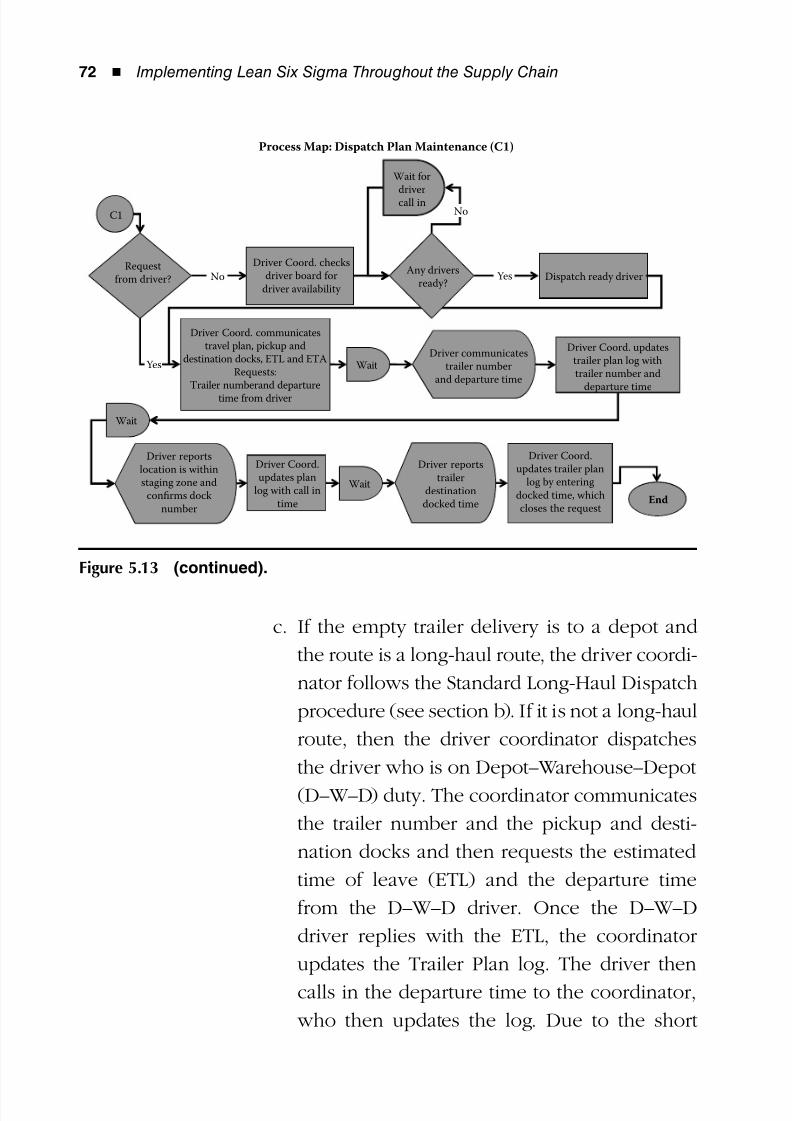
8/12/2019 Implementing Lean Six Sigma Throughout the Supply Chain
http://slidepdf.com/reader/full/implementing-lean-six-sigma-throughout-the-supply-chain 89/278
72 ◾ Implementing Lean Six Sigma Throughout the Supply Chain
c. If the empty trailer delivery is to a depot and
the route is a long-haul route, the driver coordi-
nator follows the Standard Long-Haul Dispatch
procedure (see section b). If it is not a long-haul
route, then the driver coordinator dispatches
the driver who is on Depot–Warehouse–Depot
(D–W–D) duty. The coordinator communicates
the trailer number and the pickup and desti-
nation docks and then requests the estimated
time of leave (ETL) and the departure time
from the D–W–D driver. Once the D–W–D
driver replies with the ETL, the coordinator
updates the Trailer Plan log. The driver then
calls in the departure time to the coordinator,
who then updates the log. Due to the short
Process Map: Dispatch Plan Maintenance (C1)
C1
Dispatch ready driver
Driver Coord. checks
driver board for
driver availability
Request
from driver?
Driver Coord. updates
trailer plan log with
trailer number and
departure time
Wait
Wait
Driver reports
trailer
destination
docked time
Driver reports
location is within
staging zone and
confirms dock
number
Driver Coord.
updates plan
log with call in
time
Driver Coord.
updates trailer plan
log by entering
docked time, which
closes the request
Wait
End
Driver Coord. communicates
travel plan, pickup and
destination docks, ETL and ETA
Requests:
Trailer numberand departure
time from driver
Yes
No
Driver communicates
trailer number
and departure time
Any drivers
ready?Yes
No
Wait for
driver
call in
Figure 5.13 (continued).
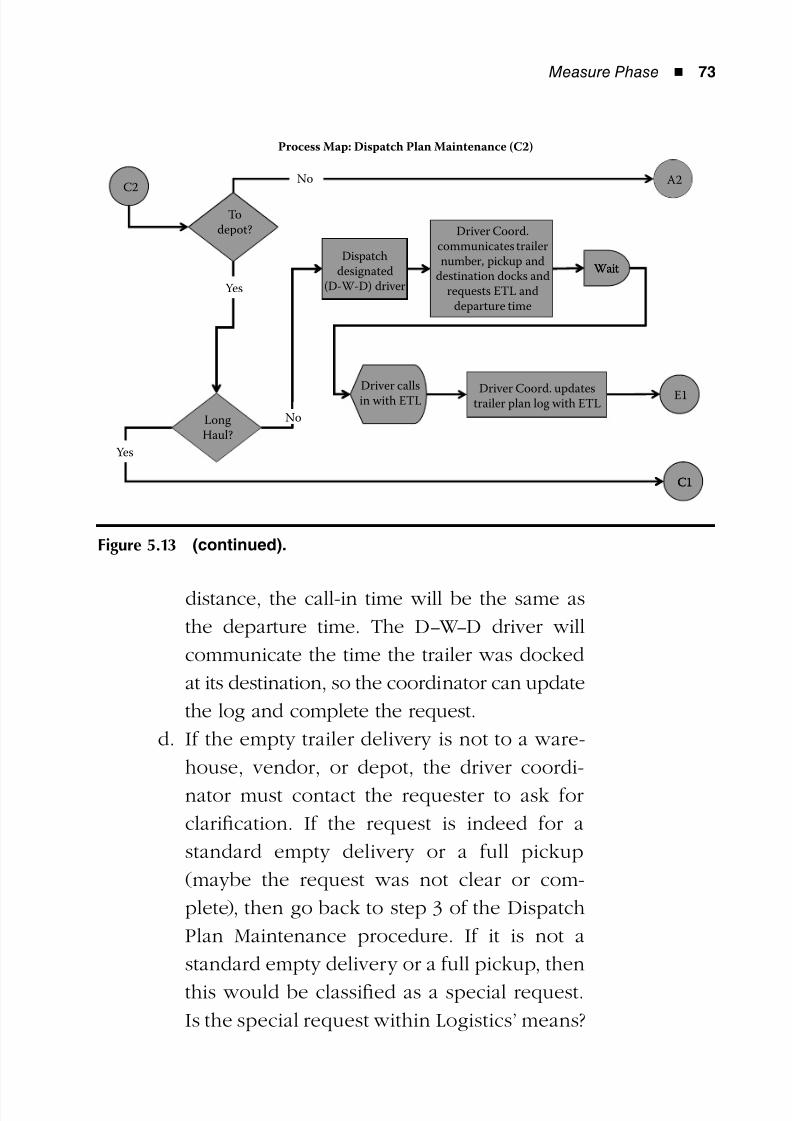
8/12/2019 Implementing Lean Six Sigma Throughout the Supply Chain
http://slidepdf.com/reader/full/implementing-lean-six-sigma-throughout-the-supply-chain 90/278
Measure Phase ◾ 73
distance, the call-in time will be the same as
the departure time. The D– W –D driver will
communicate the time the trailer was docked
at its destination, so the coordinator can update
the log and complete the request.
d. If the empty trailer delivery is not to a ware-
house, vendor, or depot, the driver coordi-
nator must contact the requester to ask for
clarification. If the request is indeed for a
standard empty delivery or a full pickup
(maybe the request was not clear or com-
plete), then go back to step 3 of the Dispatch
Plan Maintenance procedure. If it is not a
standard empty delivery or a full pickup, then
this would be classified as a special request.
Is the special request within Logistics’ means?
Process Map: Dispatch Plan Maintenance (C2)
C2No A2
Todepot?
Wait
Driver Coord.communicates trailernumber, pickup and
destination docks andrequests ETL and
departure time
Dispatchdesignated
(D-W-D) driverYes
Wait
Driver Coord. updatestrailer plan log with ETL
Driver callsin with ETL E1
LongHaul?
No
C1
Yes
C1
Figure 5.13 (continued).
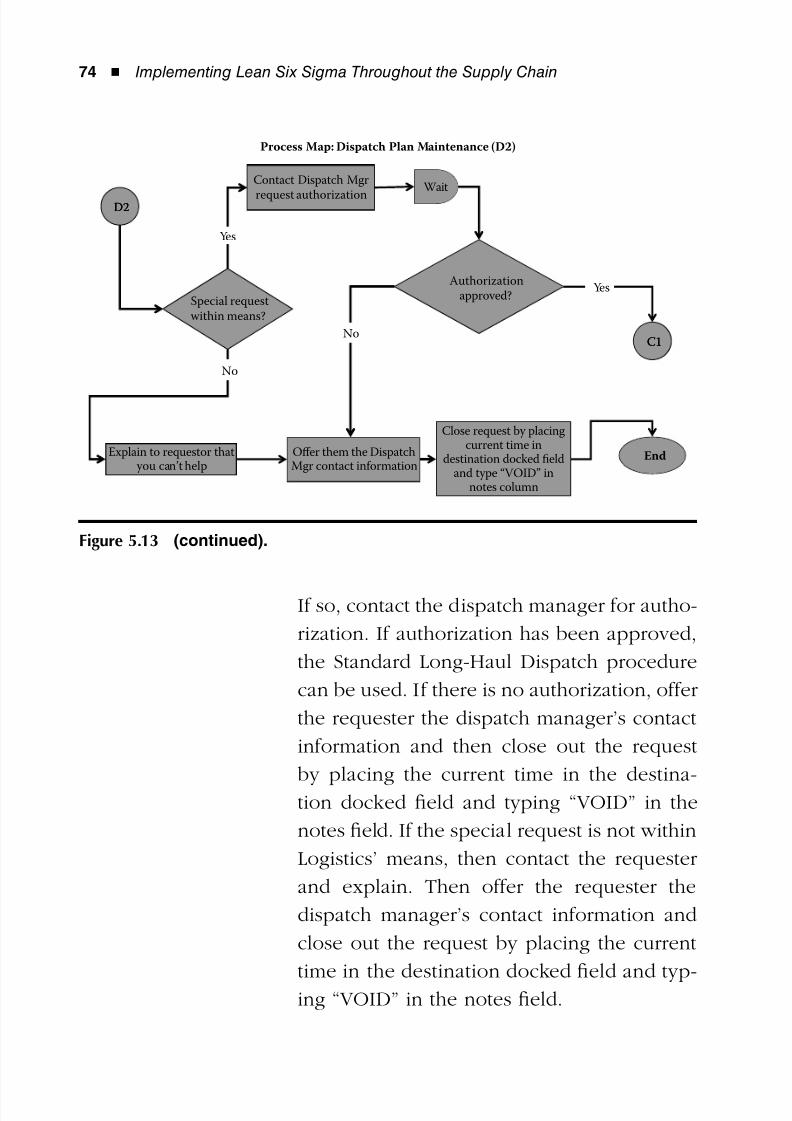
8/12/2019 Implementing Lean Six Sigma Throughout the Supply Chain
http://slidepdf.com/reader/full/implementing-lean-six-sigma-throughout-the-supply-chain 91/278
74 ◾ Implementing Lean Six Sigma Throughout the Supply Chain
If so, contact the dispatch manager for autho-
rization. If authorization has been approved,
the Standard Long-Haul Dispatch procedure
can be used. If there is no authorization, offer
the requester the dispatch manager’s contact
information and then close out the request
by placing the current time in the destina-
tion docked field and typing “VOID” in the
notes field. If the special request is not within
Logistics’ means, then contact the requester
and explain. Then offer the requester the
dispatch manager’s contact information and
close out the request by placing the current
time in the destination docked field and typ-ing “VOID” in the notes field.
Process Map: Dispatch Plan Maintenance (D2)
D2
Contact Dispatch Mgr
request authorizationWait
D2
Yes
C1
Special requestwithin means?
Authorizationapproved?
Yes
NoC1
No
Explain to requestor that you can’t help
Offer them the DispatchMgr contact information
End
Close request by placingcurrent time in
destination docked fieldand type “VOID” in
notes column
Figure 5.13 (continued).
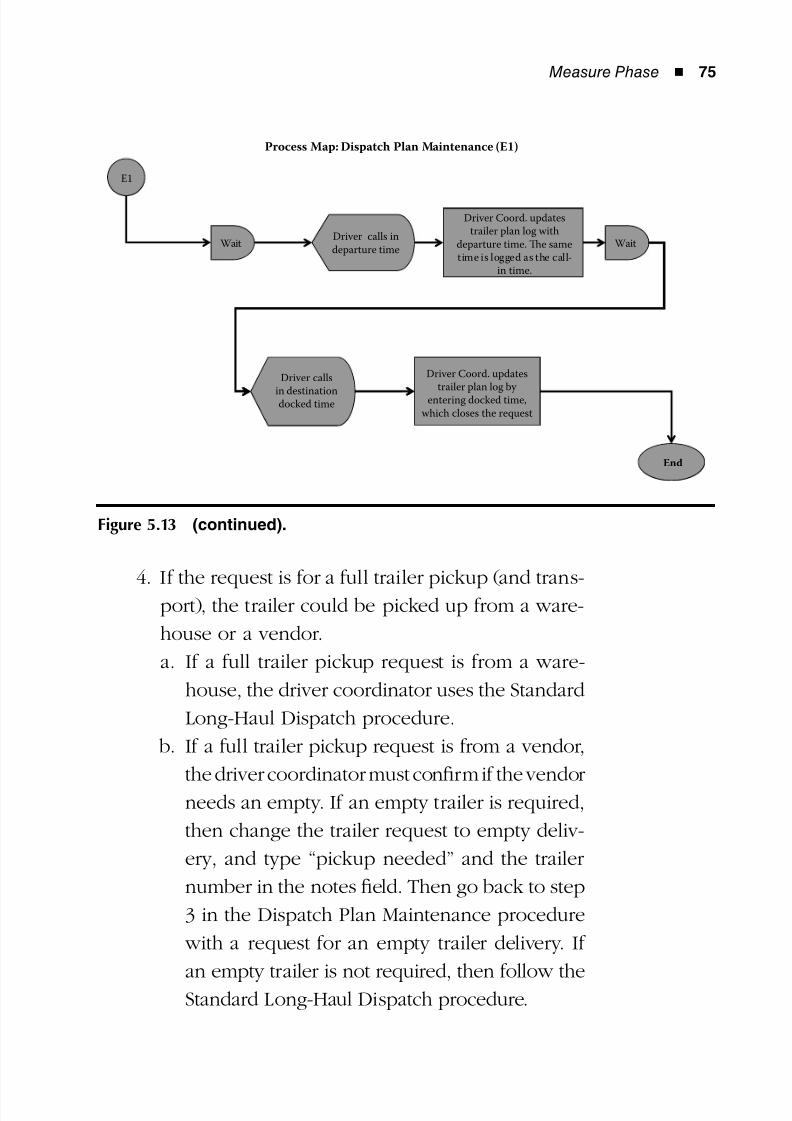
8/12/2019 Implementing Lean Six Sigma Throughout the Supply Chain
http://slidepdf.com/reader/full/implementing-lean-six-sigma-throughout-the-supply-chain 92/278
Measure Phase ◾ 75
4. If the request is for a full trailer pickup (and trans-
port), the trailer could be picked up from a ware-
house or a vendor.
a. If a full trailer pickup request is from a ware-
house, the driver coordinator uses the Standard
Long-Haul Dispatch procedure.
b. If a full trailer pickup request is from a vendor,
the driver coordinator must confirm if the vendor
needs an empty. If an empty trailer is required,
then change the trailer request to empty deliv-
ery, and type “pickup needed” and the trailer
number in the notes field. Then go back to step
3 in the Dispatch Plan Maintenance procedure
with a request for an empty trailer delivery. If
an empty trailer is not required, then follow theStandard Long-Haul Dispatch procedure.
Process Map: Dispatch Plan Maintenance (E1)
E1
WaitDriver calls in
departure time
Driver Coord. updates
trailer plan log with
departure time. Te same
time is logged as the call-
in time.
Wait
Driver calls
in destinationdocked time
Driver Coord. updates
trailer plan log by entering docked time,
which closes the request
End
Figure 5.13 (continued).
8/12/2019 Implementing Lean Six Sigma Throughout the Supply Chain
http://slidepdf.com/reader/full/implementing-lean-six-sigma-throughout-the-supply-chain 93/278
76 ◾ Implementing Lean Six Sigma Throughout the Supply Chain
c. If a full-trailer pickup request is not from a ware-
house or a vendor, the driver coordinator must
contact the requester to ask for clarification.
If the request is indeed for a standard empty
delivery or a full pickup (maybe the request
was not clear or complete), then go back to
step 3 of the Dispatch Plan Maintenance pro-
cedure. If it is not a standard empty delivery or
a full pickup, then this would be classified as
a special request. Is the special request within
Logistics’ means? If so, contact the dispatch
manager for authorization. If authorization
has been approved, the Standard Long-Haul
Dispatch procedure can be used. If there is
no authorization, offer the requester the dis-
patch manager’s contact information and then
close out the request by placing the current
time in the destination docked field and typ-
ing “VOID” in the notes field. If the special
request is not within Logistics’ means, then
contact the requester and explain. Then offer
the requester the dispatch manager’s contact
information and close out the request by plac-
ing the current time in the destination docked
field and typing “VOID” in the notes field.
5. If the request is not for an empty trailer delivery
or a full trailer pickup (and transport), then the
driver coordinator must contact the requester to
ask for clarification. If the request is indeed for a
standard empty delivery or a full pickup (maybe
the request was not clear or complete), then go
back to step 3 of the Dispatch Plan Maintenance
8/12/2019 Implementing Lean Six Sigma Throughout the Supply Chain
http://slidepdf.com/reader/full/implementing-lean-six-sigma-throughout-the-supply-chain 94/278
Measure Phase ◾ 77
procedure. If it is not a standard empty delivery
or a full pickup, then this would be classified as
a special request. Is the special request within
Logistics’ means? If so, contact the dispatch man-
ager for authorization. If authorization has been
approved, the Standard Long-Haul Dispatch pro-
cedure can be used. If there is no authorization,
offer the requester the dispatch manager’s contact
information and then close out the request by
placing the current time in the destination docked
field and typing “VOID” in the notes field. If the
special request is not within Logistics’ means, then
contact the requester and explain. Then offer the
requester the dispatch manager’s contact infor-
mation and close out the request by placing the
current time in the destination docked field and
typing “VOID” in the notes field.
Trailer Long-Haul Process (Figure 5.14)
1. Driver is ready for dispatch.
2. Driver coordinator communicates travel plan,
pickup and destination docks, estimated time to
leave, and estimated time to arrive, and requests
trailer number and departure time from the driver.
3. If the trailer is not ready, the driver contacts
the driver coordinator and provides an update
on the delay. Once the trailer is ready, then the
driver secures the load and picks up the shipping
documents.
4. The driver confirms the shipping documents are
complete and then communicates the trailer num-
ber and departure time to the driver coordinator.
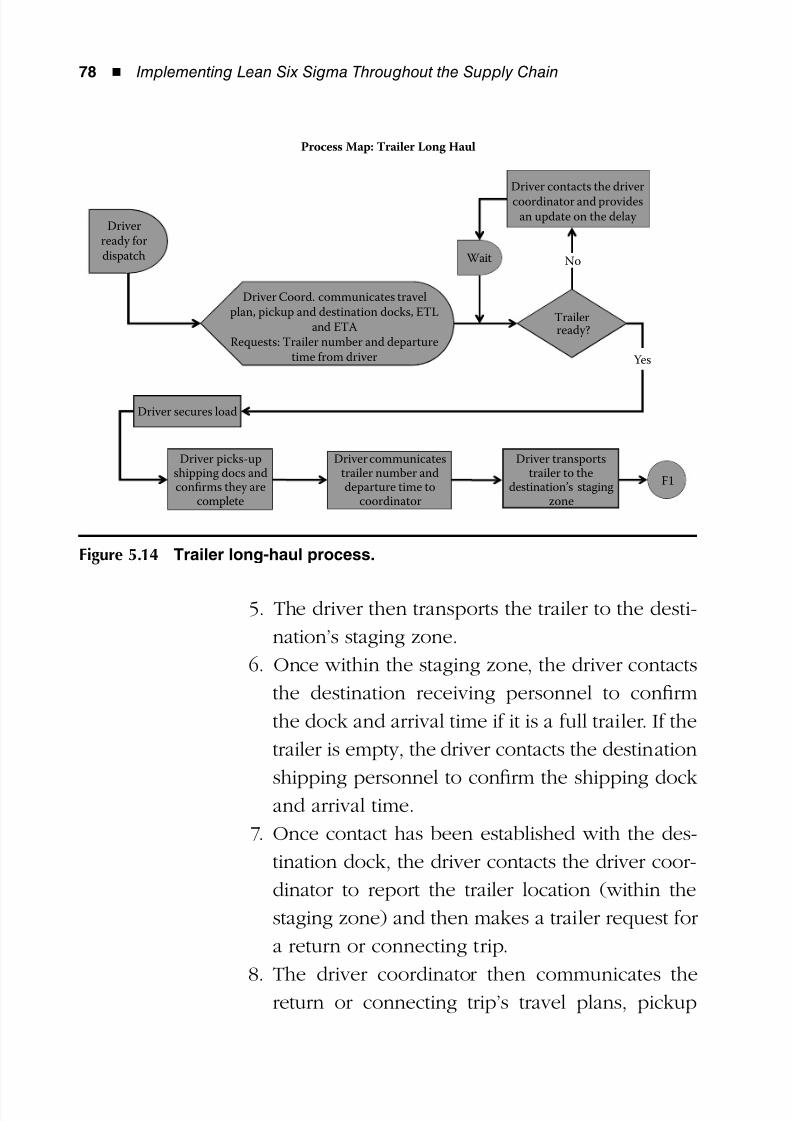
8/12/2019 Implementing Lean Six Sigma Throughout the Supply Chain
http://slidepdf.com/reader/full/implementing-lean-six-sigma-throughout-the-supply-chain 95/278
78 ◾ Implementing Lean Six Sigma Throughout the Supply Chain
5. The driver then transports the trailer to the desti-
nation’s staging zone.
6. Once within the staging zone, the driver contacts
the destination receiving personnel to confirm
the dock and arrival time if it is a full trailer. If the
trailer is empty, the driver contacts the destination
shipping personnel to confirm the shipping dockand arrival time.
7. Once contact has been established with the des-
tination dock, the driver contacts the driver coor-
dinator to report the trailer location (within the
staging zone) and then makes a trailer request for
a return or connecting trip.
8. The driver coordinator then communicates thereturn or connecting trip’s travel plans, pickup
Process Map: Trailer Long Haul
Driver contacts the drivercoordinator and provides
an update on the delay Driver
ready fordispatch Wait
Trailerready?
Yes
Driver secures load
F1
Driver Coord. communicates travelplan, pickup and destination docks, ETL
and ETARequests: Trailer number and departure
time from driver
Driver picks-upshipping docs andconfirms they are
complete
Driver transportstrailer to the
destination’s stagingzone
Driver communicatestrailer number anddeparture time to
coordinator
No
Figure 5.14 Trailer long-haul process.
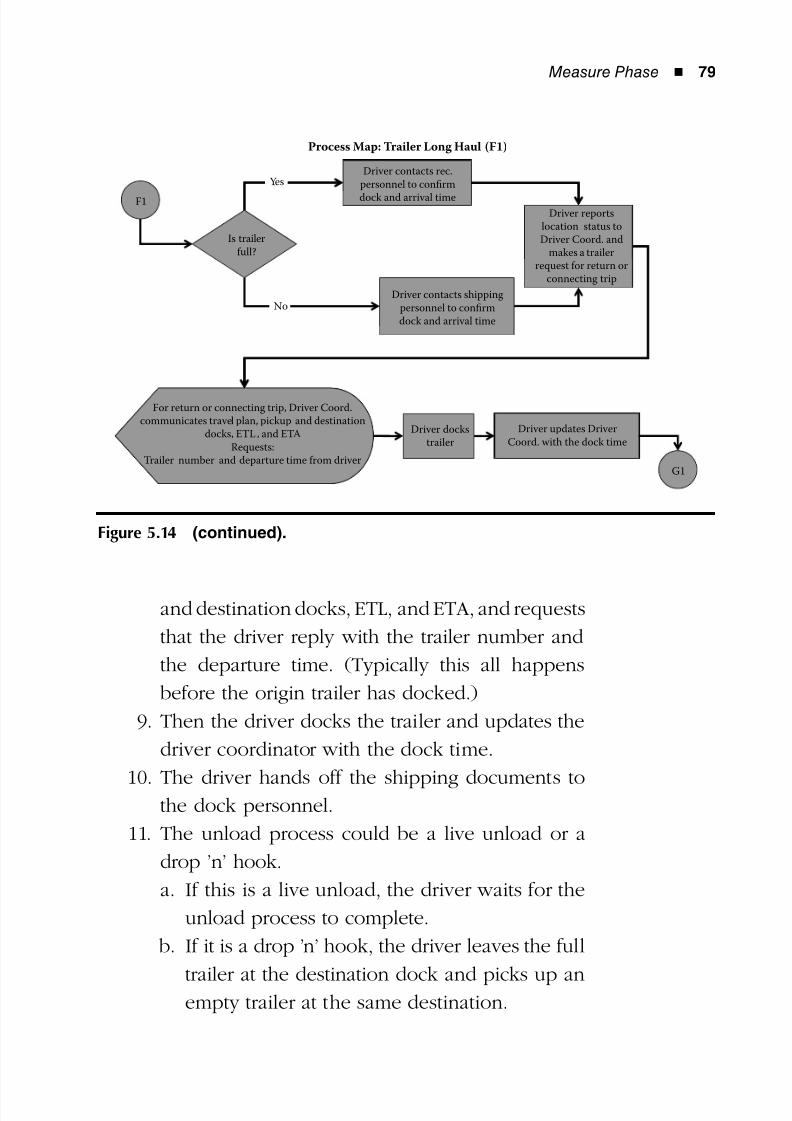
8/12/2019 Implementing Lean Six Sigma Throughout the Supply Chain
http://slidepdf.com/reader/full/implementing-lean-six-sigma-throughout-the-supply-chain 96/278
Measure Phase ◾ 79
and destination docks, ETL, and ETA, and requests
that the driver reply with the trailer number and
the departure time. (Typically this all happens
before the origin trailer has docked.)
9. Then the driver docks the trailer and updates the
driver coordinator with the dock time.
10. The driver hands off the shipping documents tothe dock personnel.
11. The unload process could be a live unload or a
drop ’n’ hook.
a. If this is a live unload, the driver waits for the
unload process to complete.
b. If it is a drop ’n’ hook, the driver leaves the full
trailer at the destination dock and picks up anempty trailer at the same destination.
Process Map: Trailer Long Haul (F1)
Driver contacts rec.
personnel to confirm
dock and arrival time
Is trailer
full?
Driver reports
location status to
Driver Coord. and
makes a trailer
request for return or
connecting trip
F1
Driver contacts shipping
personnel to confirm
dock and arrival time
Driver docks
trailer
Driver updates Driver
Coord. with the dock time
G1
Yes
No
For return or connecting trip, Driver Coord.
communicates travel plan, pickup and destination
docks, ETL, and ETA
Requests:
Trailer number and departure time from driver
Figure 5.14 (continued).
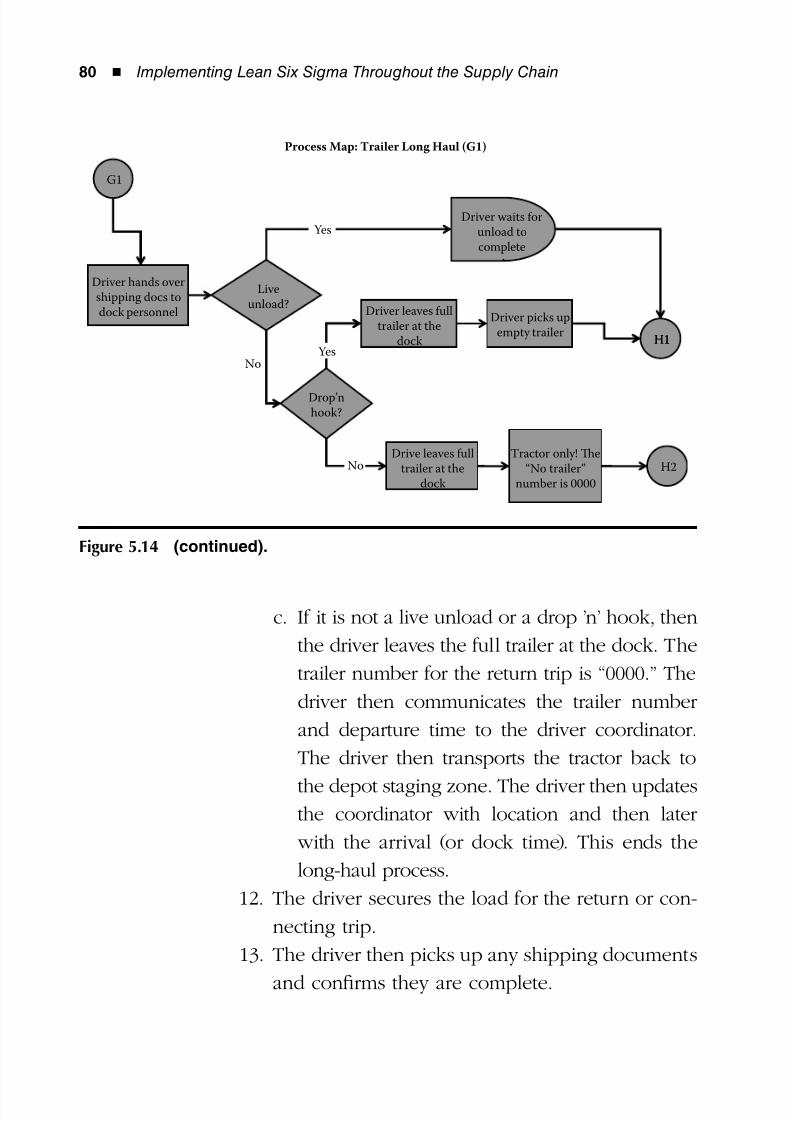
8/12/2019 Implementing Lean Six Sigma Throughout the Supply Chain
http://slidepdf.com/reader/full/implementing-lean-six-sigma-throughout-the-supply-chain 97/278
80 ◾ Implementing Lean Six Sigma Throughout the Supply Chain
c. If it is not a live unload or a drop ’n’ hook, then
the driver leaves the full trailer at the dock. The
trailer number for the return trip is “0000.” The
driver then communicates the trailer number
and departure time to the driver coordinator.
The driver then transports the tractor back to
the depot staging zone. The driver then updatesthe coordinator with location and then later
with the arrival (or dock time). This ends the
long-haul process.
12. The driver secures the load for the return or con-
necting trip.
13. The driver then picks up any shipping documents
and confirms they are complete.
Process Map: Trailer Long Haul (G1)
G1
Driver waits forunload tocomplete
Liveunload?
Driver picks upempty trailer
Driver leaves fulltrailer at the
dock H1
Driver hands overshipping docs todock personnel
No
H1
Drop’nhook?
Drive leaves fulltrailer at the
dock
Tractor only! e“No trailer”
number is 0000
H2No
Yes
Yes
Figure 5.14 (continued).
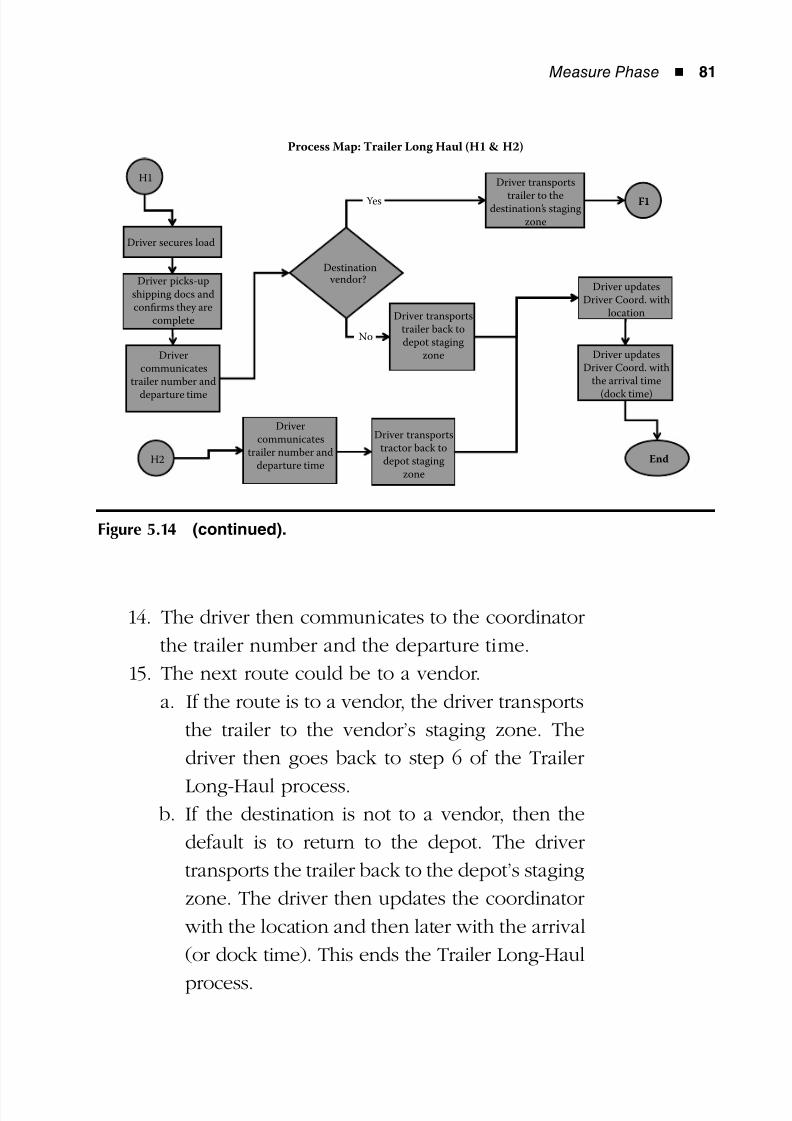
8/12/2019 Implementing Lean Six Sigma Throughout the Supply Chain
http://slidepdf.com/reader/full/implementing-lean-six-sigma-throughout-the-supply-chain 98/278
Measure Phase ◾ 81
14. The driver then communicates to the coordinator
the trailer number and the departure time.
15. The next route could be to a vendor.
a. If the route is to a vendor, the driver transports
the trailer to the vendor’s staging zone. The
driver then goes back to step 6 of the Trailer
Long-Haul process. b. If the destination is not to a vendor, then the
default is to return to the depot. The driver
transports the trailer back to the depot’s staging
zone. The driver then updates the coordinator
with the location and then later with the arrival
(or dock time). This ends the Trailer Long-Haul
process.
Process Map: Trailer Long Haul (H1 & H2)
H1 Driver transports
trailer to thedestination’s staging
zone
F1
Driver secures load
F1
Destination vendor?
Driver updatesDriver Coord. with
location
Drivercommunicates
trailer number and
departure time
Driver updatesDriver Coord. with
the arrival time
(dock time)
Driver transportstractor back todepot staging
zone
Drivercommunicates
trailer number anddeparture time
EndH2
Driver picks-upshipping docs andconfirms they are
complete Driver transportstrailer back todepot staging
zone
No
Yes
Figure 5.14 (continued).
8/12/2019 Implementing Lean Six Sigma Throughout the Supply Chain
http://slidepdf.com/reader/full/implementing-lean-six-sigma-throughout-the-supply-chain 99/278
82 ◾ Implementing Lean Six Sigma Throughout the Supply Chain
Trailer Depot–Warehouse–Depot (D–W–D) Process
(Figure 5.15)
1. The driver is ready for dispatch or is in the pro-
cess of completing a request.
2. The driver coordinator dispatches the D– W –D
driver to deliver an empty trailer to the ware-
house or to the depot.
a. If delivery of the empty trailer is to the ware-
house, the driver coordinator communicates
the pickup and destination docks and requests
the trailer number, ETA, and departure time
from the driver. The driver replies with an
ETA, and once at the depot yard, the driver can
communicate the trailer number. The driver
secures the trailer and then communicates the
departure time to the coordinator. The trailer
is transported to the destination dock, and
then the driver communicates the destination
time once the trailer is docked. This ends the
Trailer D– W –D process.
b. If the delivery of the empty trailer is not to the
warehouse, then assume it is to the depot. The
driver coordinator communicates the trailer
number and pickup and destination docks and
requests the driver to call in with the ETL and
departure time. The driver calls back with the
ETL and then proceeds to the pickup dock. The
driver secures the trailer and then calls in the
departure time. The driver transports the trailer
to the depot check-in location. Once at the
depot, the driver calls in the destination dock
time. This ends the Trailer D–W–D process.
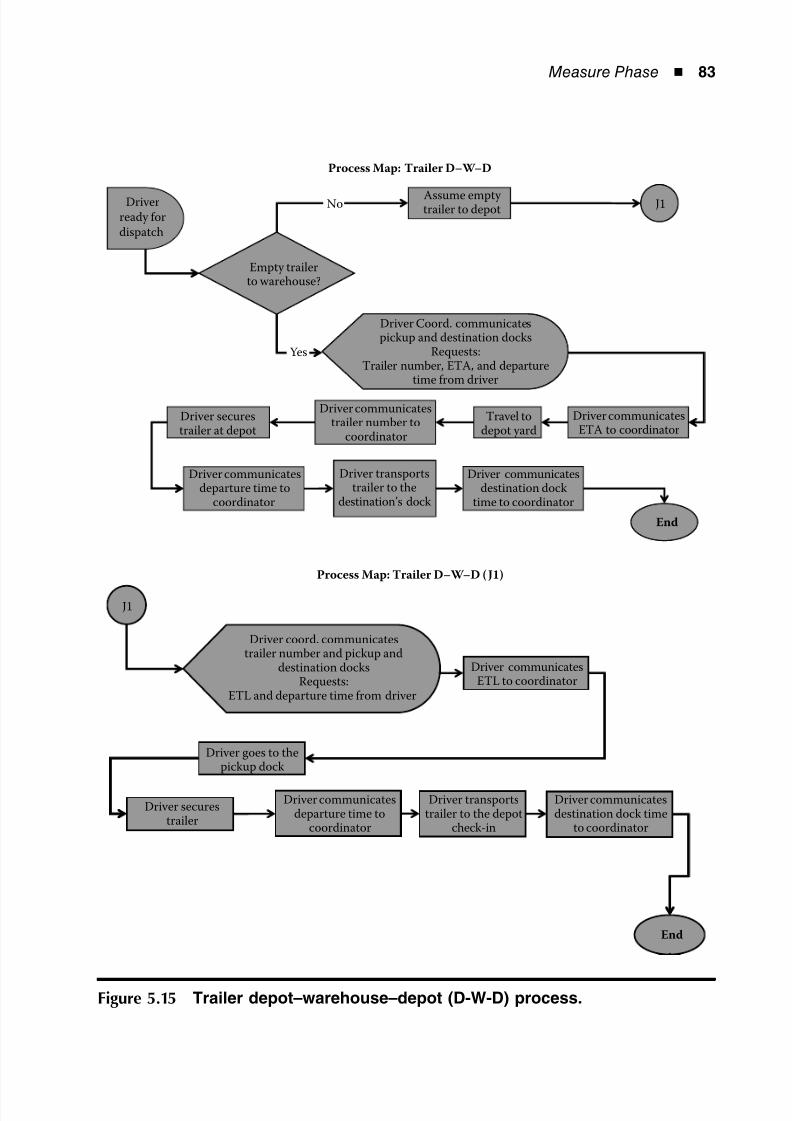
8/12/2019 Implementing Lean Six Sigma Throughout the Supply Chain
http://slidepdf.com/reader/full/implementing-lean-six-sigma-throughout-the-supply-chain 100/278
Measure Phase ◾ 83
Driverready fordispatch
J1
End
Process Map: Trailer D–W–D
No
Yes
Assume empty trailer to depot
Empty trailerto warehouse?
Driver Coord. communicatespickup and destination docks
Requests:Trailer number, ETA, and departure
time from driver
Driver securestrailer at depot
Driver communicatesETA to coordinator
Driver communicatestrailer number to
coordinator
Travel todepot yard
Driver transportstrailer to the
destination’s dock
Driver communicatesdeparture time to
coordinator
Driver communicatesdestination dock
time to coordinator
J1
No
End
Process Map: Trailer D–W–D (J1)
Driver coord. communicatestrailer number and pickup and
destination docksRequests:
ETL and departure time from driver
Driver communicatesETL to coordinator
Driver goes to thepickup dock
Driver securestrailer
Driver transportstrailer to the depot
check-in
Driver communicatesdeparture time to
coordinator
Driver communicatesdestination dock time
to coordinator
Figure 5.15 Trailer depot–warehouse–depot (D-W-D) process.
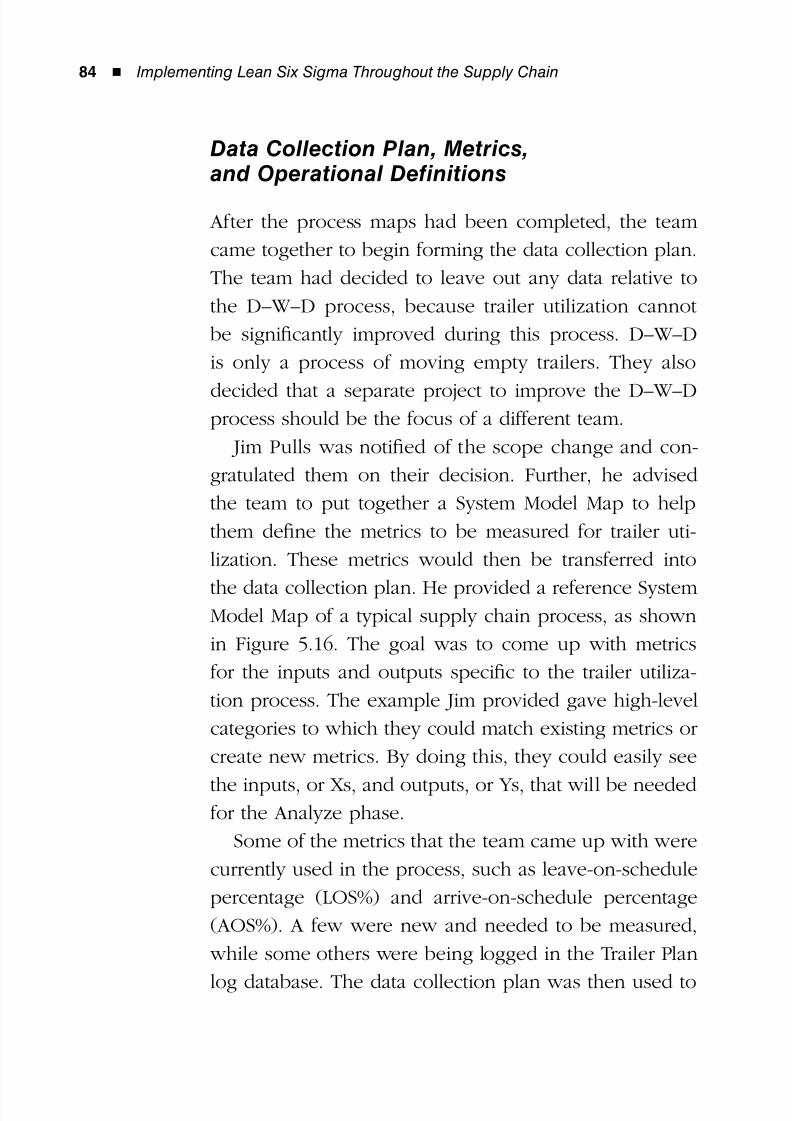
8/12/2019 Implementing Lean Six Sigma Throughout the Supply Chain
http://slidepdf.com/reader/full/implementing-lean-six-sigma-throughout-the-supply-chain 101/278
84 ◾ Implementing Lean Six Sigma Throughout the Supply Chain
Data Collection Plan, Metrics,and Operational Definitions
After the process maps had been completed, the team
came together to begin forming the data collection plan.
The team had decided to leave out any data relative to
the D–W–D process, because trailer utilization cannot
be significantly improved during this process. D–W–D
is only a process of moving empty trailers. They also
decided that a separate project to improve the D–W–Dprocess should be the focus of a different team.
Jim Pulls was notified of the scope change and con-
gratulated them on their decision. Further, he advised
the team to put together a System Model Map to help
them define the metrics to be measured for trailer uti-
lization. These metrics would then be transferred into
the data collection plan. He provided a reference SystemModel Map of a typical supply chain process, as shown
in Figure 5.16. The goal was to come up with metrics
for the inputs and outputs specific to the trailer utiliza-
tion process. The example Jim provided gave high-level
categories to which they could match existing metrics or
create new metrics. By doing this, they could easily see
the inputs, or Xs, and outputs, or Ys, that will be neededfor the Analyze phase.
Some of the metrics that the team came up with were
currently used in the process, such as leave-on-schedule
percentage (LOS%) and arrive-on-schedule percentage
(AOS%). A few were new and needed to be measured,
while some others were being logged in the Trailer Plan
log database. The data collection plan was then used to
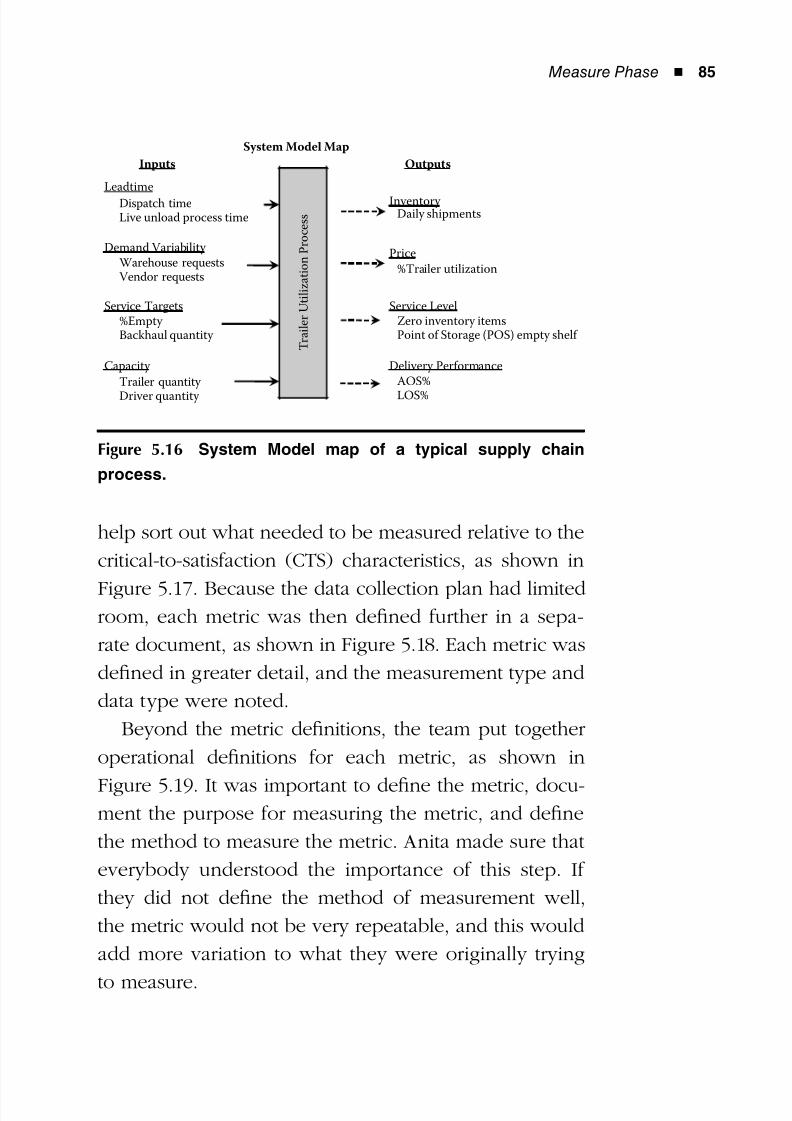
8/12/2019 Implementing Lean Six Sigma Throughout the Supply Chain
http://slidepdf.com/reader/full/implementing-lean-six-sigma-throughout-the-supply-chain 102/278
Measure Phase ◾ 85
help sort out what needed to be measured relative to the
critical-to-satisfaction (CTS) characteristics, as shown in
Figure 5.17. Because the data collection plan had limitedroom, each metric was then defined further in a sepa-
rate document, as shown in Figure 5.18. Each metric was
defined in greater detail, and the measurement type and
data type were noted.
Beyond the metric definitions, the team put together
operational definitions for each metric, as shown in
Figure 5.19. It was important to define the metric, docu-ment the purpose for measuring the metric, and define
the method to measure the metric. Anita made sure that
everybody understood the importance of this step. If
they did not define the method of measurement well,
the metric would not be very repeatable, and this would
add more variation to what they were originally trying
to measure.
System Model Map
T r a i l e r U t i l i z a t i o n P r o c e s s
Zero inventory itemsPoint of Storage (POS) empty shelf
Leadtime
Demand Variability
Service Targets
Capacity
Warehouse requestsVendor requests
%Empty Backhaul quantity
Trailer quantity
Driver quantity
Daily shipments
%Trailer utilization
Inventory
Delivery Performance
Price
Inputs Outputs
AOS%
LOS%
Service Level
Dispatch timeLive unload process time
Figure 5.16 System Model map of a typical supply chain
process.
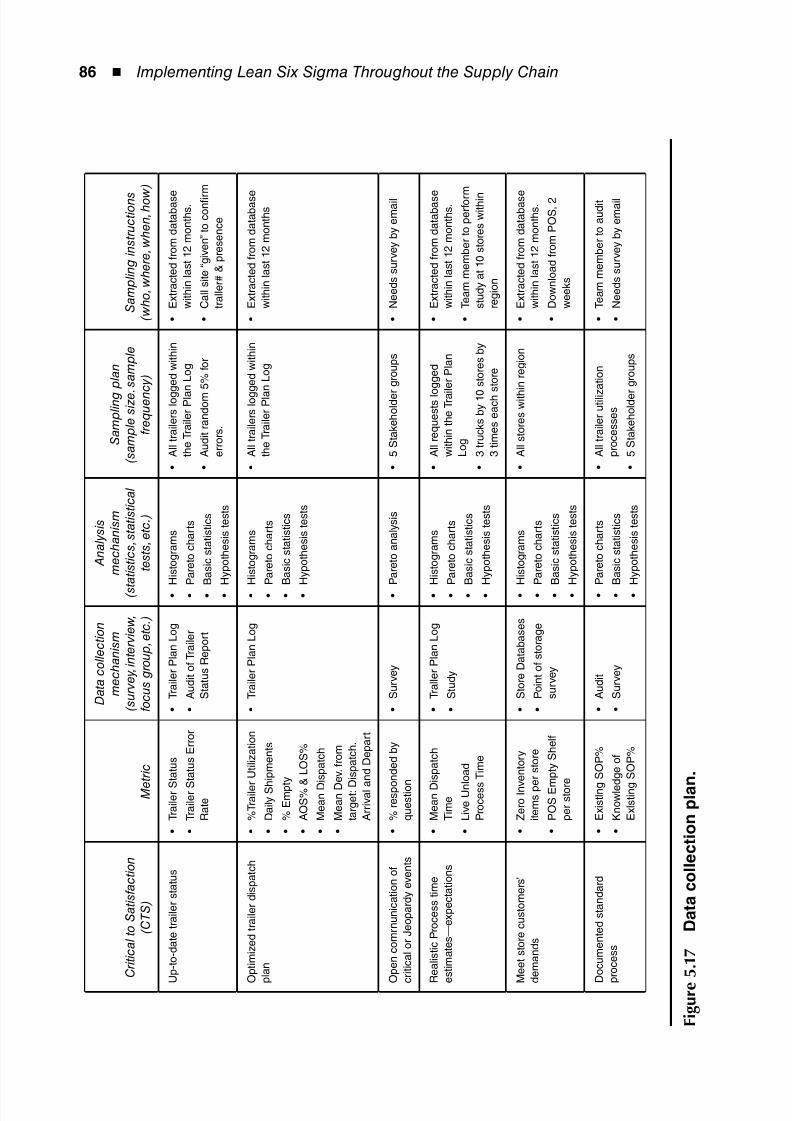
8/12/2019 Implementing Lean Six Sigma Throughout the Supply Chain
http://slidepdf.com/reader/full/implementing-lean-six-sigma-throughout-the-supply-chain 103/278
86 ◾ Implementing Lean Six Sigma Throughout the Supply Chain
C r i t i c a l t o S a t i s f a c t i o n
( C T S )
M e
t r i c
D a t a c o l l e c t i o n
m e c h a n i s m
( s u r v e y , i n t e r v i e w ,
f o c u s g r o u p , e t c . )
A n a l y s i s
m e c h a n i s m
( s t a t i s t i c s , s t a t i s t i c a l
t e s t s , e t c . )
S a m p l i n g
p l a n
( s a m p l e s i z e .
s a m p l e
f r e q u e n c
y )
S a m p l i n g i n s t r u c t i o n s
( w h o , w h e r e , w h e n , h o w
)
U
p - t o - d a t e t r a i l e r s t a t u s
T r a i l e r S
t a t u s
•
T r a i l e r S
t a t u s E r r o r
•
R a t e
T r a i l e r P l a n L o g
•
A u d i t o f T r a i l e r
•
S t a t u s R e p o r t
H i s t o g r a m s
•
P a r e t o c h a r t s
•
B a s i c s t a t i s t i c s
•
H y p o t h e s i s t e s t s
•
A l l t r a i l e r s l o g g e d w i t h i n
•
t h e T r a i l e r P l a n L o g
A u d i t r a n d o m
5 % f o r
•
e r r o r s .
E x t r a c t e d f r o m d a t a b a s e
•
w i t h i n l a s t 1 2 m o n t h s .
C a l l s i t e “ g i v e n ” t o c o n fi r m
•
t r a l l e r # & p r e s e n c e
O
p t i m i z e d t r a i l e r d i s p a t c h
p
l a n
% T r a i l e r U t i l i z a t i o n
•
D a i l y S h
i p m e n t s
•
% E m p t y
•
A O S % & L O S %
•
M e a n D
i s p a t c h
•
M e a n D
e v . f r o m
•
t a r g e t : D
i s p a t c h .
A r r i v a l a
n d D e p a r t
T r a i l e r P l a n L o g
•
H i s t o g r a m s
•
P a r e t o c h a r t s
•
B a s i c s t a t i s t i c s
•
H y p o t h e s i s t e s t s
•
A l l t r a i l e r s l o g g e d w i t h i n
•
t h e T r a i l e r P l a n L o g
E x t r a c t e d f r o m d a t a b a s e
•
w i t h i n l a s t 1 2 m o n t h s
O
p e n c o m r n u n i c a t i o n o f
c
r i t i c a l o r J e o p a r d y e v e n t s
% r e s p o
n d e d b y
•
q u e s t i o n
S u r v e y
•
P a r e t o a n a l y s i s
•
5 S t a k e h o l d e r
g r o u p s
•
N e e d s s u r v e y b y e m a i l
•
R
e a l i s t i c P r o c e s s t i m e
e
s t i m a t e s — e x p e c t a t i o n s
M e a n D
i s p a t c h
•
T i m e
L i v e U n l o a d
•
P r o c e s s
T i m e
T r a l l e r P l a n L o g
•
S t u d y
•
H i s t o g r a m s
•
P a r e t o c h a r t s
•
B a s i c s t a t i s t i c s
•
H y p o t h e s i s t e s t s
•
A l l r e q u e s t s l o
g g e d
•
w i t h i n t h e T r a i l e r P l a n
L o g
3 t r u c k s b y 1 0
s t o r e s b y
•
3 t i m e s e a c h s t o r e
E x t r a c t e d f r o m d a t a b a s e
•
w i t h i n l a s t 1 2 m o n t h s .
T e a m m e m b e r t o p e r f o r m
•
s t u d y a t 1 0 s t o r e s w i t h i n
r e g i o n
M
e e t s t o r e c u s t o m e r s ’
d
e m a n d s
Z e r o I n v
e n t o r y
•
i t e m s p e r s t o r e
P O S E m
p t y S h e l f
•
p e r s t o r e
S t o r e D a t a b a s e s
•
P o i n t o f s t o r a g e
•
s u r v e y
H i s t o g r a m s
•
P a r e t o c h a r t s
•
B a s i c s t a t i s t i c s
•
H y p o t h e s i s t e s t s
•
A l l s t o r e s w i t h
i n r e g i o n
•
E x t r a c t e d f r o m d a t a b a s e
•
w i t h i n l a s t 1 2 m o n t h s .
D o w n l o a d f r o m P O S , 2
•
w e e k s
D
o c u m e n t e d s t a n d a r d
p
r o c e s s
E x i s t l n g
S O P %
•
K n o w l e d g e o f
•
E x l s t i n g
S O P %
A u d i t
•
S u r v e y
•
P a r e t o c h a r t s
•
B a s i c s t a t i s t i c s
•
H y p o t h e s i s t e s t s
•
A l l t r a i l e r u t i l i z
a t i o n
•
p r o c e s s e s
5 S t a k e h o l d e r
g r o u p s
•
T e a m m e m b e r t o a u d i t
•
N e e d s s u r v e y b y e m a i l
•
F i g u r e
5 . 1
7
D a t a c o l l e c t i o n p l a n
.
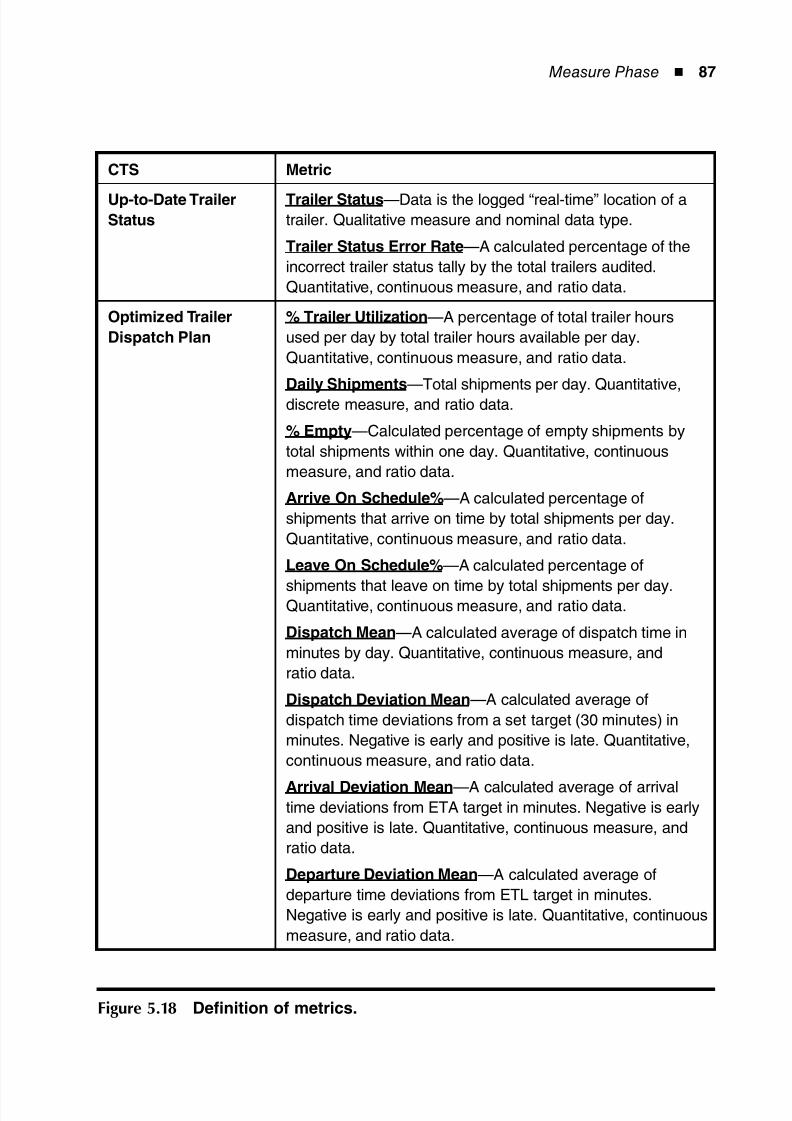
8/12/2019 Implementing Lean Six Sigma Throughout the Supply Chain
http://slidepdf.com/reader/full/implementing-lean-six-sigma-throughout-the-supply-chain 104/278
Measure Phase ◾ 87
CTS Metric
Up-to-Date TrailerStatus
Trailer Status—Data is the logged “real-time” location of atrailer. Qualitative measure and nominal data type.
Trailer Status Error Rate—A calculated percentage of the
incorrect trailer status tally by the total trailers audited.
Quantitative, continuous measure, and ratio data.
Optimized Trailer
Dispatch Plan
% Trailer Utilization—A percentage of total trailer hours
used per day by total trailer hours available per day.
Quantitative, continuous measure, and ratio data.
Daily Shipments—Total shipments per day. Quantitative,discrete measure, and ratio data.
% Empty—Calculated percentage of empty shipments by
total shipments within one day. Quantitative, continuous
measure, and ratio data.
Arrive On Schedule%—A calculated percentage of
shipments that arrive on time by total shipments per day.
Quantitative, continuous measure, and ratio data.
Leave On Schedule%—A calculated percentage of
shipments that leave on time by total shipments per day.Quantitative, continuous measure, and ratio data.
Dispatch Mean—A calculated average of dispatch time in
minutes by day. Quantitative, continuous measure, and
ratio data.
Dispatch Deviation Mean—A calculated average of
dispatch time deviations from a set target (30 minutes) in
minutes. Negative is early and positive is late. Quantitative,
continuous measure, and ratio data.
Arrival Deviation Mean—A calculated average of arrivaltime deviations from ETA target in minutes. Negative is early
and positive is late. Quantitative, continuous measure, and
ratio data.
Departure Deviation Mean—A calculated average of
departure time deviations from ETL target in minutes.
Negative is early and positive is late. Quantitative, continuous
measure, and ratio data.
Figure 5.18 Definition of metrics.
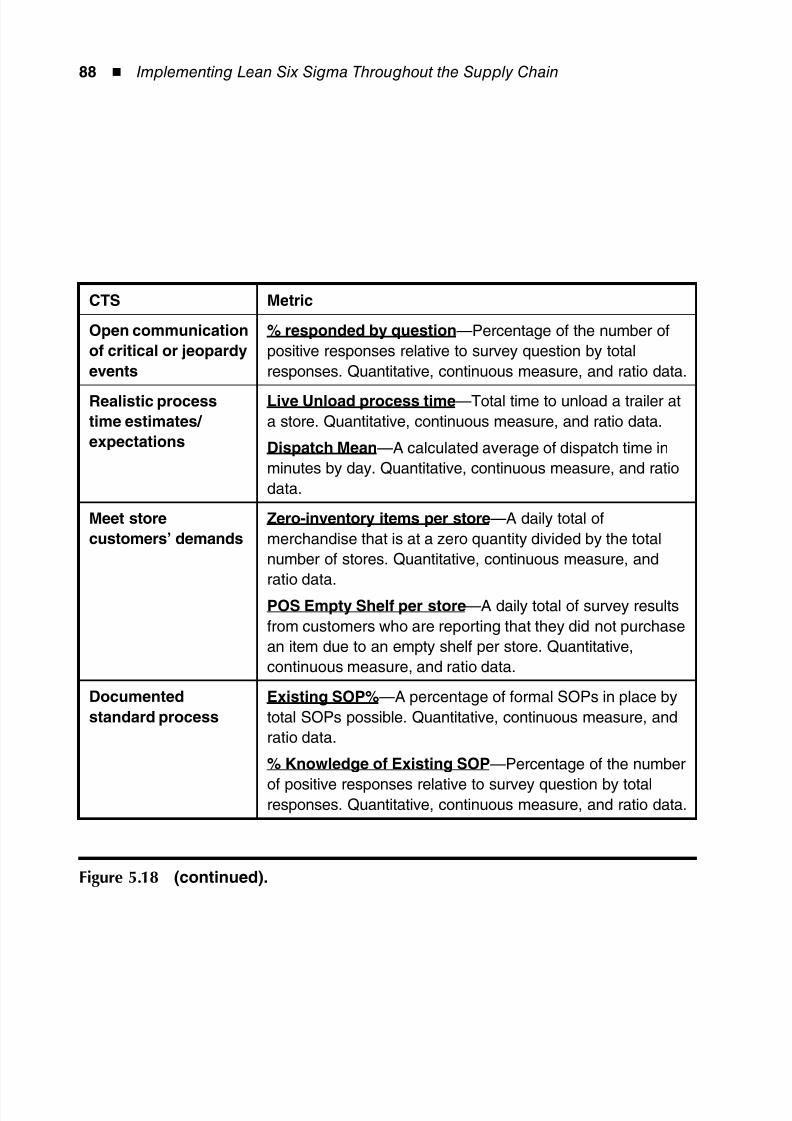
8/12/2019 Implementing Lean Six Sigma Throughout the Supply Chain
http://slidepdf.com/reader/full/implementing-lean-six-sigma-throughout-the-supply-chain 105/278
88 ◾ Implementing Lean Six Sigma Throughout the Supply Chain
CTS Metric
Open communication
of critical or jeopardy
events
% responded by question—Percentage of the number of
positive responses relative to survey question by total
responses. Quantitative, continuous measure, and ratio data.
Realistic process
time estimates/
expectations
Live Unload process time—Total time to unload a trailer at
a store. Quantitative, continuous measure, and ratio data.
Dispatch Mean—A calculated average of dispatch time in
minutes by day. Quantitative, continuous measure, and ratio
data.
Meet store
customers’ demands
Zero-inventory items per store—A daily total of
merchandise that is at a zero quantity divided by the total
number of stores. Quantitative, continuous measure, and
ratio data.
POS Empty Shelf per store—A daily total of survey results
from customers who are reporting that they did not purchase
an item due to an empty shelf per store. Quantitative,
continuous measure, and ratio data.
Documented
standard process
Existing SOP%—A percentage of formal SOPs in place by
total SOPs possible. Quantitative, continuous measure, and
ratio data.
% Knowledge of Existing SOP—Percentage of the number
of positive responses relative to survey question by totalresponses. Quantitative, continuous measure, and ratio data.
Figure 5.18 (continued).
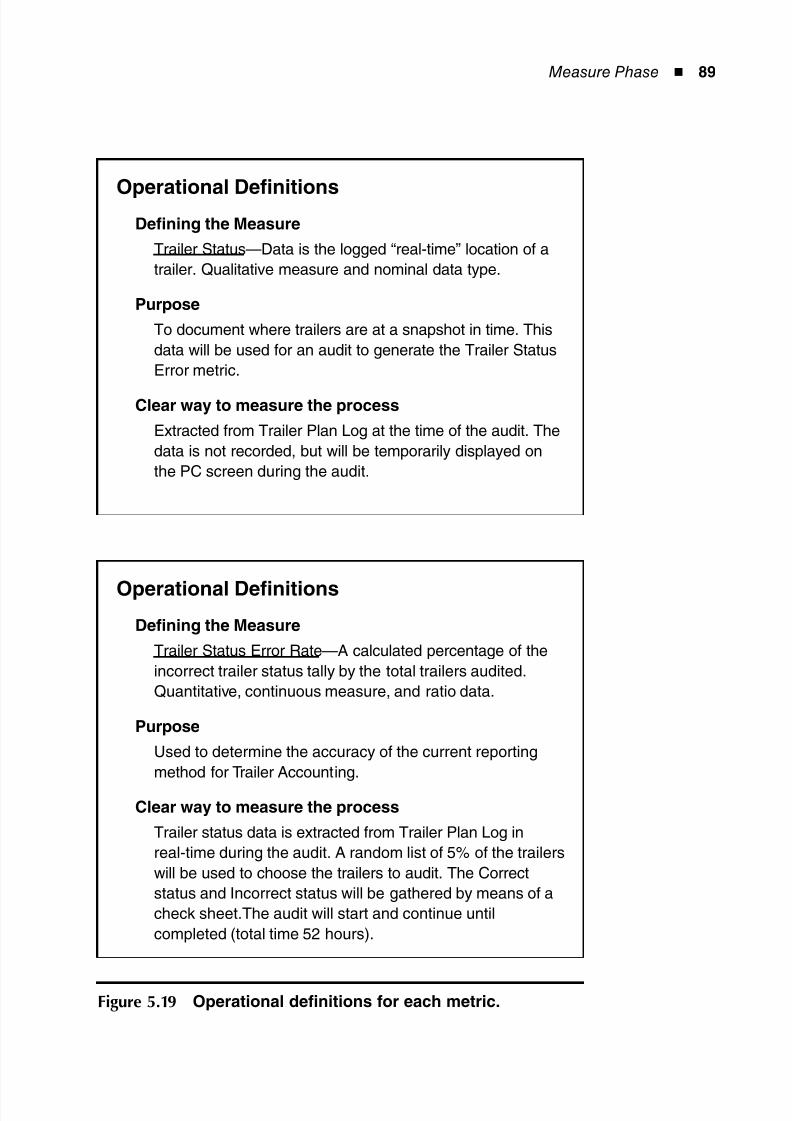
8/12/2019 Implementing Lean Six Sigma Throughout the Supply Chain
http://slidepdf.com/reader/full/implementing-lean-six-sigma-throughout-the-supply-chain 106/278
Measure Phase ◾ 89
Operational DefinitionsDefining the Measure
Trailer Status—Data is the logged “real-time” location of a
trailer. Qualitative measure and nominal data type.
Purpose
To document where trailers are at a snapshot in time. This
data will be used for an audit to generate the Trailer Status
Error metric.
Clear way to measure the process
Extracted from Trailer Plan Log at the time of the audit. The
data is not recorded, but will be temporarily displayed on
the PC screen during the audit.
Operational Definitions
Defining the Measure
Trailer Status Error Rate—A calculated percentage of the
incorrect trailer status tally by the total trailers audited.
Quantitative, continuous measure, and ratio data.
Purpose
Used to determine the accuracy of the current reporting
method for Trailer Accounting.
Clear way to measure the process
Trailer status data is extracted from Trailer Plan Log in
real-time during the audit. A random list of 5% of the trailers
will be used to choose the trailers to audit. The Correct
status and Incorrect status will be gathered by means of a
check sheet.The audit will start and continue until
completed (total time 52 hours).
Figure 5.19 Operational definitions for each metric.
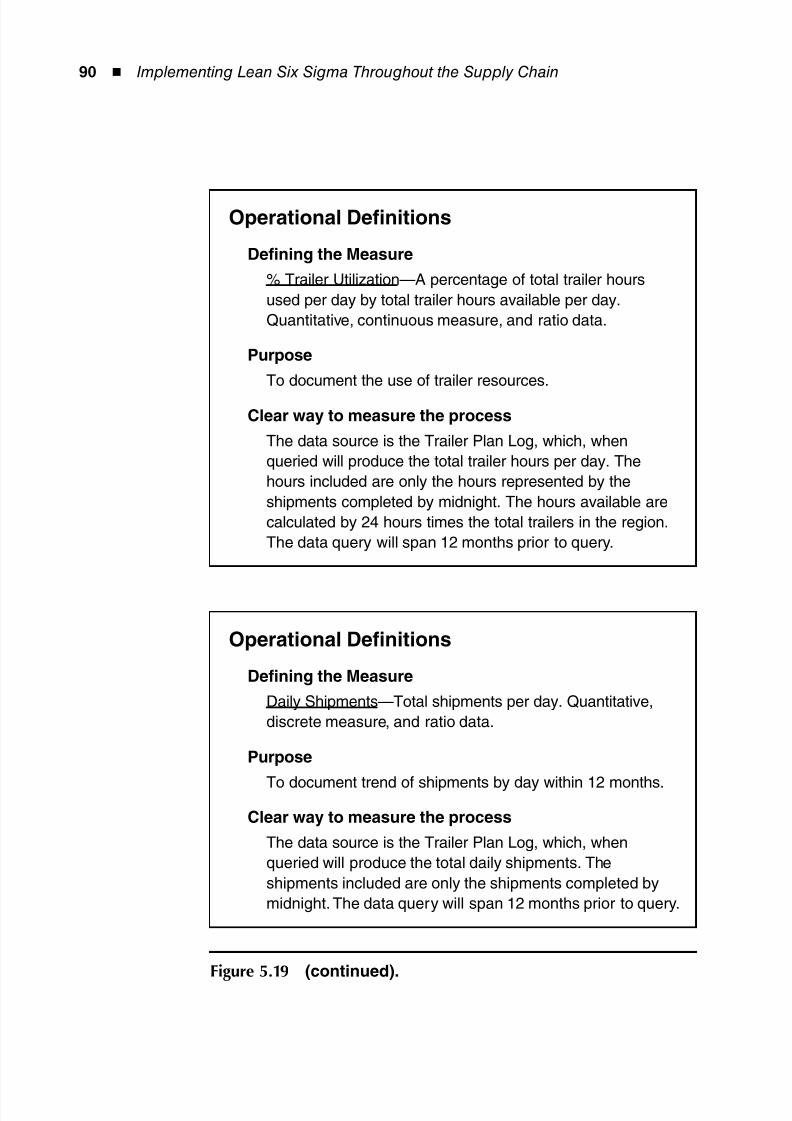
8/12/2019 Implementing Lean Six Sigma Throughout the Supply Chain
http://slidepdf.com/reader/full/implementing-lean-six-sigma-throughout-the-supply-chain 107/278
90 ◾ Implementing Lean Six Sigma Throughout the Supply Chain
Operational Definitions
Defining the Measure
% Trailer Utilization—A percentage of total trailer hours
used per day by total trailer hours available per day.
Quantitative, continuous measure, and ratio data.
Purpose
To document the use of trailer resources.
Clear way to measure the process
The data source is the Trailer Plan Log, which, when
queried will produce the total trailer hours per day. The
hours included are only the hours represented by the
shipments completed by midnight. The hours available are
calculated by 24 hours times the total trailers in the region.
The data query will span 12 months prior to query.
Operational Definitions
Defining the Measure
Daily Shipments—Total shipments per day. Quantitative,
discrete measure, and ratio data.
Purpose
To document trend of shipments by day within 12 months.
Clear way to measure the process
The data source is the Trailer Plan Log, which, when
queried will produce the total daily shipments. The
shipments included are only the shipments completed by
midnight. The data query will span 12 months prior to query.
Figure 5.19 (continued).
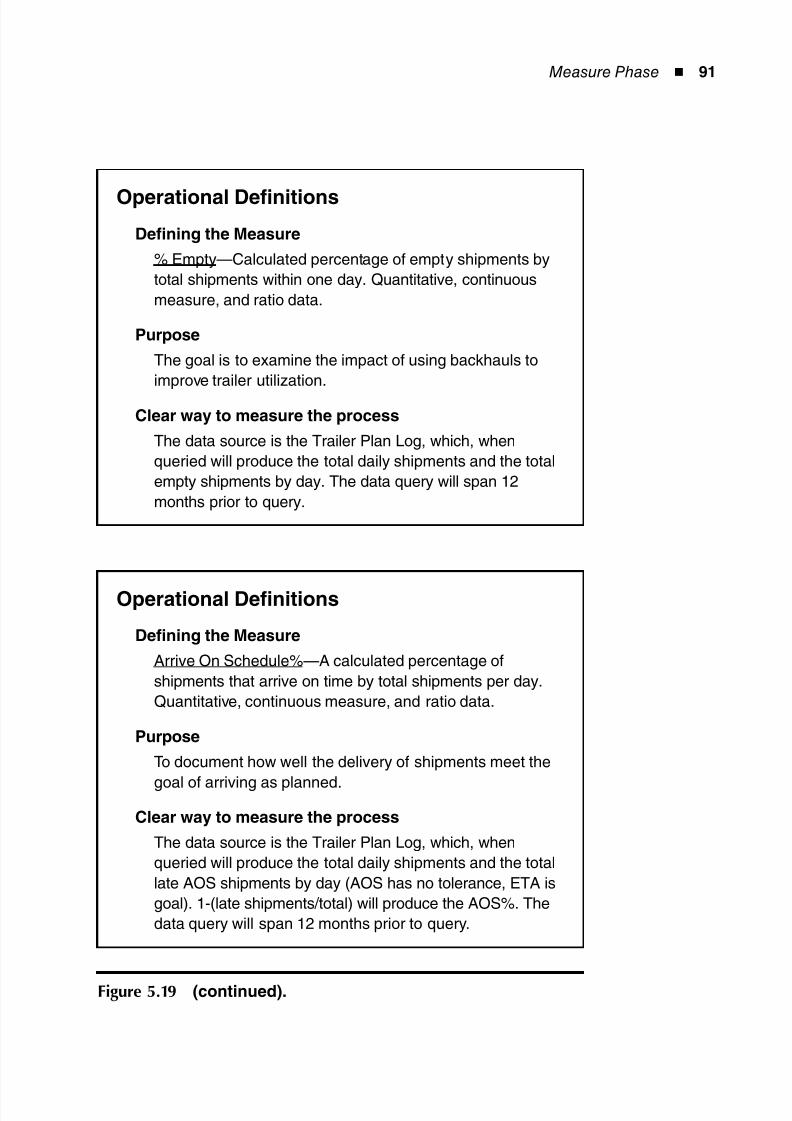
8/12/2019 Implementing Lean Six Sigma Throughout the Supply Chain
http://slidepdf.com/reader/full/implementing-lean-six-sigma-throughout-the-supply-chain 108/278
Measure Phase ◾ 91
Operational Definitions
Defining the Measure
% Empty—Calculated percentage of empty shipments by
total shipments within one day. Quantitative, continuous
measure, and ratio data.
Purpose
The goal is to examine the impact of using backhauls to
improve trailer utilization.
Clear way to measure the process
The data source is the Trailer Plan Log, which, when
queried will produce the total daily shipments and the total
empty shipments by day. The data query will span 12
months prior to query.
Operational Definitions
Defining the Measure
Arrive On Schedule%—A calculated percentage of
shipments that arrive on time by total shipments per day.
Quantitative, continuous measure, and ratio data.
Purpose
To document how well the delivery of shipments meet the
goal of arriving as planned.
Clear way to measure the process
The data source is the Trailer Plan Log, which, when
queried will produce the total daily shipments and the total
late AOS shipments by day (AOS has no tolerance, ETA is
goal). 1-(late shipments/total) will produce the AOS%. The
data query will span 12 months prior to query.
Figure 5.19 (continued).
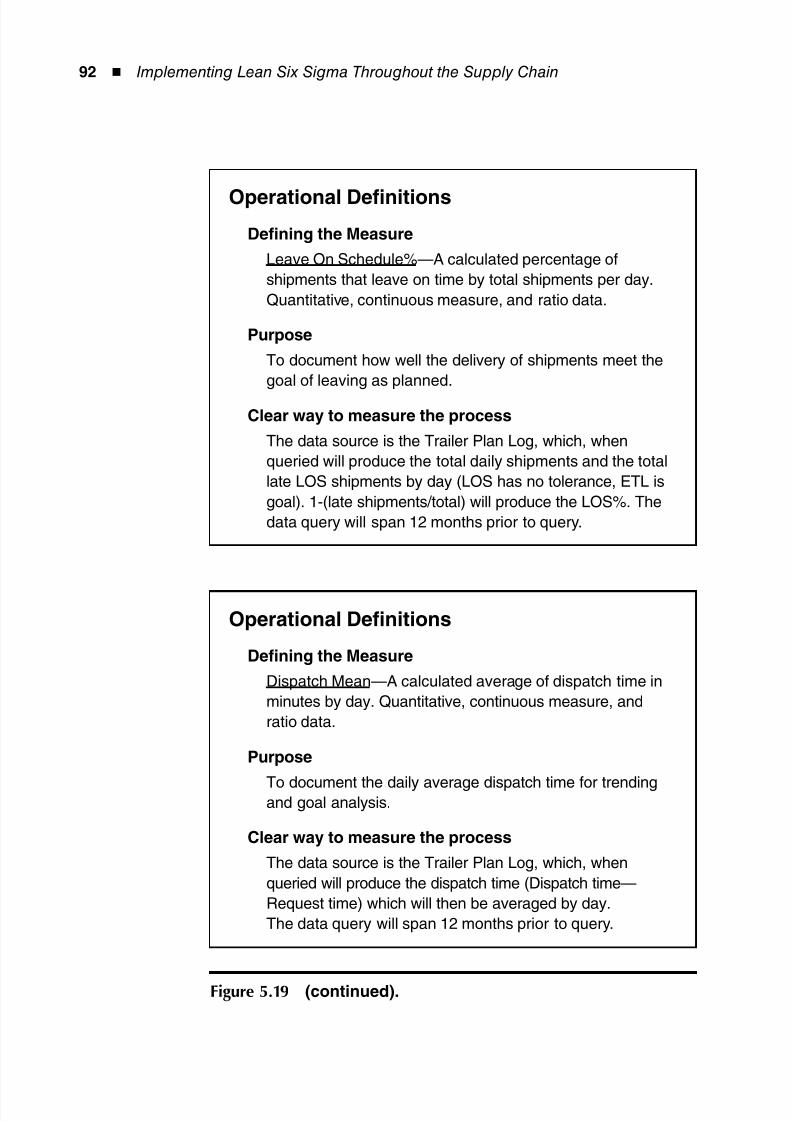
8/12/2019 Implementing Lean Six Sigma Throughout the Supply Chain
http://slidepdf.com/reader/full/implementing-lean-six-sigma-throughout-the-supply-chain 109/278
92 ◾ Implementing Lean Six Sigma Throughout the Supply Chain
Operational Definitions
Defining the Measure
Leave On Schedule%—A calculated percentage of
shipments that leave on time by total shipments per day.
Quantitative, continuous measure, and ratio data.
Purpose
To document how well the delivery of shipments meet the
goal of leaving as planned.
Clear way to measure the process
The data source is the Trailer Plan Log, which, when
queried will produce the total daily shipments and the total
late LOS shipments by day (LOS has no tolerance, ETL is
goal). 1-(late shipments/total) will produce the LOS%. The
data query will span 12 months prior to query.
Operational Definitions
Defining the Measure
Dispatch Mean—A calculated average of dispatch time in
minutes by day. Quantitative, continuous measure, and
ratio data.
Purpose
To document the daily average dispatch time for trendingand goal analysis.
Clear way to measure the process
The data source is the Trailer Plan Log, which, when
queried will produce the dispatch time (Dispatch time—
Request time) which will then be averaged by day.
The data query will span 12 months prior to query.
Figure 5.19 (continued).
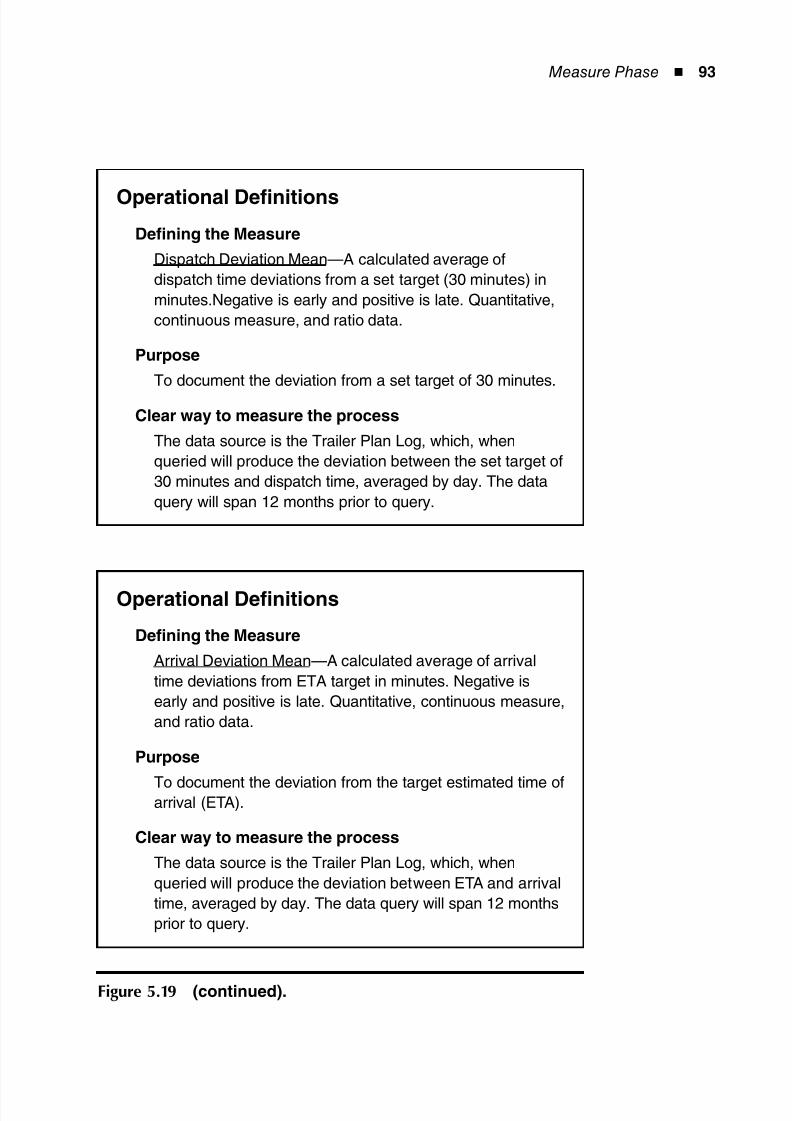
8/12/2019 Implementing Lean Six Sigma Throughout the Supply Chain
http://slidepdf.com/reader/full/implementing-lean-six-sigma-throughout-the-supply-chain 110/278
Measure Phase ◾ 93
Operational Definitions
Defining the Measure
Dispatch Deviation Mean—A calculated average of
dispatch time deviations from a set target (30 minutes) in
minutes.Negative is early and positive is late. Quantitative,
continuous measure, and ratio data.
Purpose
To document the deviation from a set target of 30 minutes.
Clear way to measure the process
The data source is the Trailer Plan Log, which, when
queried will produce the deviation between the set target of
30 minutes and dispatch time, averaged by day. The data
query will span 12 months prior to query.
Operational Definitions
Defining the Measure
Arrival Deviation Mean—A calculated average of arrival
time deviations from ETA target in minutes. Negative is
early and positive is late. Quantitative, continuous measure,
and ratio data.
Purpose
To document the deviation from the target estimated time ofarrival (ETA).
Clear way to measure the process
The data source is the Trailer Plan Log, which, when
queried will produce the deviation between ETA and arrival
time, averaged by day. The data query will span 12 months
prior to query.
Figure 5.19 (continued).
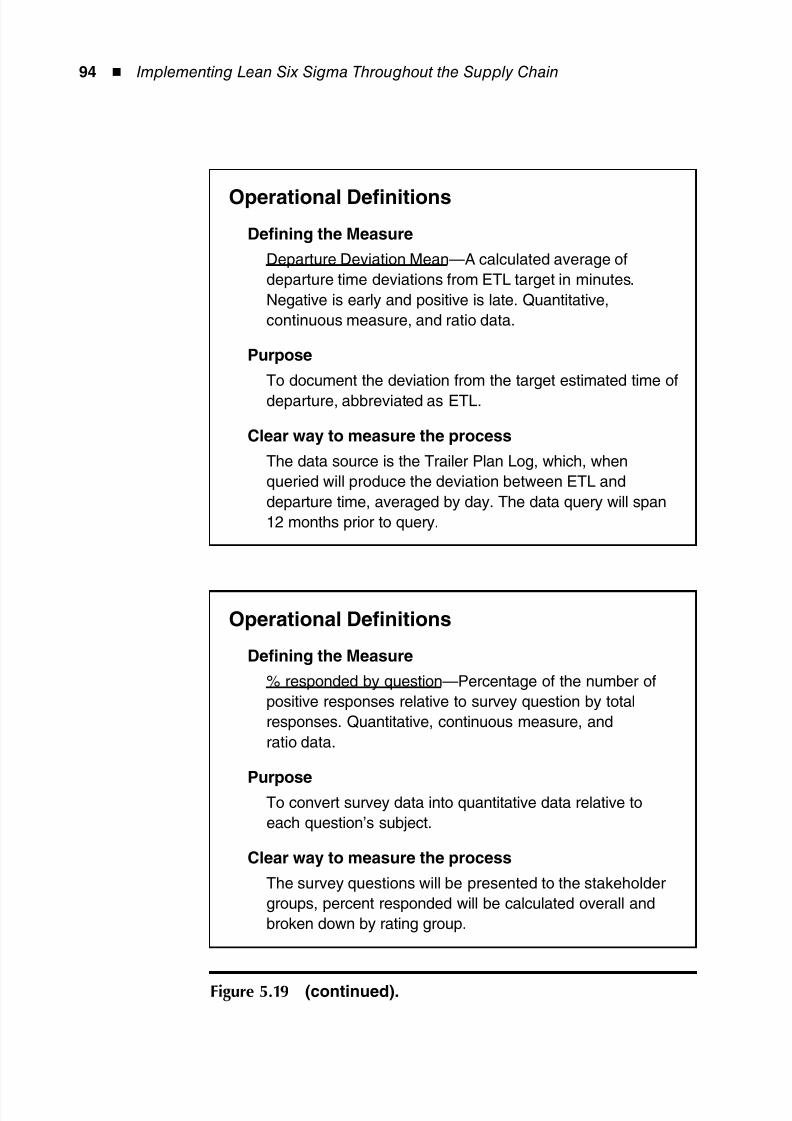
8/12/2019 Implementing Lean Six Sigma Throughout the Supply Chain
http://slidepdf.com/reader/full/implementing-lean-six-sigma-throughout-the-supply-chain 111/278
94 ◾ Implementing Lean Six Sigma Throughout the Supply Chain
Operational Definitions
Defining the Measure
Departure Deviation Mean—A calculated average of
departure time deviations from ETL target in minutes.
Negative is early and positive is late. Quantitative,
continuous measure, and ratio data.
Purpose
To document the deviation from the target estimated time of
departure, abbreviated as ETL.
Clear way to measure the process
The data source is the Trailer Plan Log, which, when
queried will produce the deviation between ETL and
departure time, averaged by day. The data query will span
12 months prior to query.
Operational Definitions
Defining the Measure
% responded by question—Percentage of the number of
positive responses relative to survey question by total
responses. Quantitative, continuous measure, and
ratio data.
PurposeTo convert survey data into quantitative data relative to
each question’s subject.
Clear way to measure the process
The survey questions will be presented to the stakeholder
groups, percent responded will be calculated overall and
broken down by rating group.
Figure 5.19 (continued).
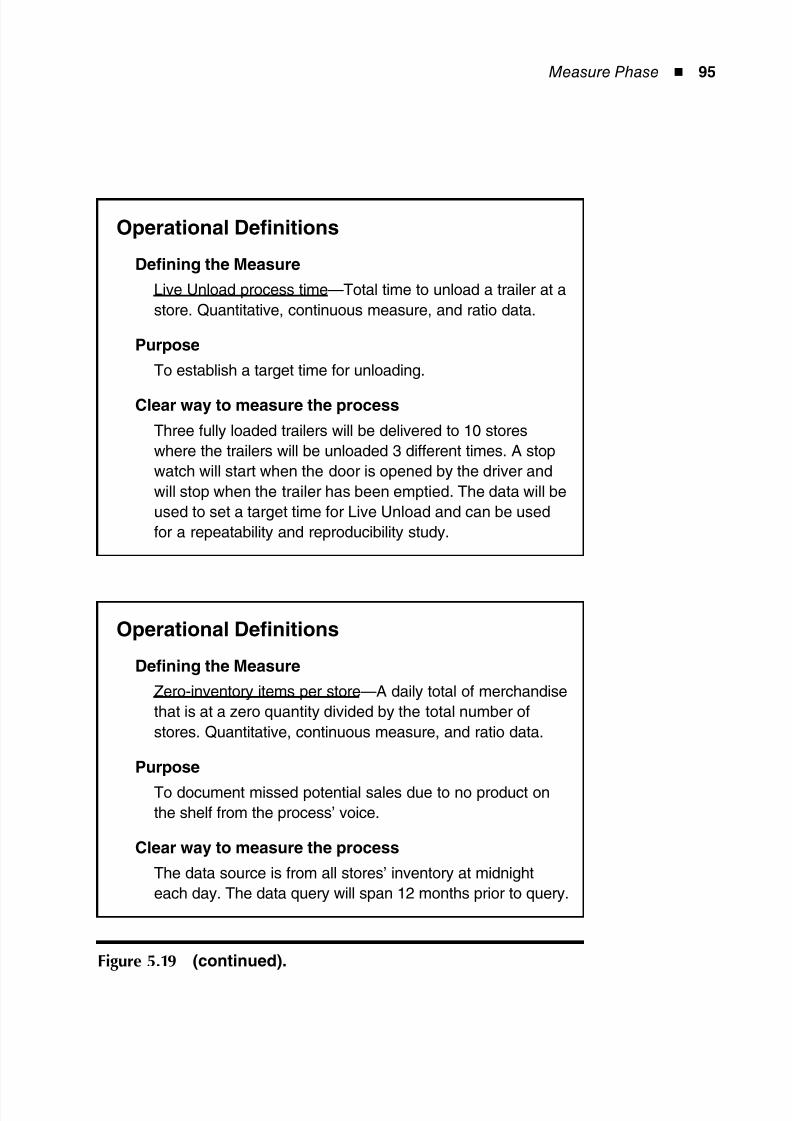
8/12/2019 Implementing Lean Six Sigma Throughout the Supply Chain
http://slidepdf.com/reader/full/implementing-lean-six-sigma-throughout-the-supply-chain 112/278
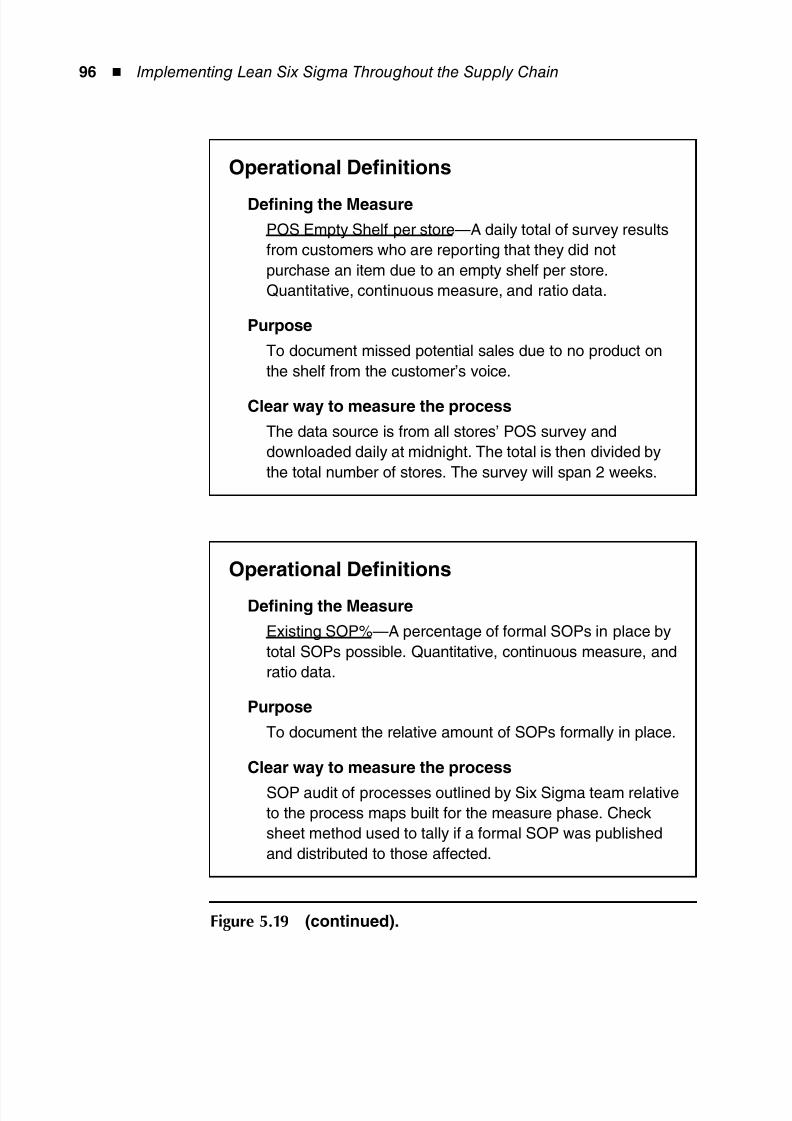
8/12/2019 Implementing Lean Six Sigma Throughout the Supply Chain
http://slidepdf.com/reader/full/implementing-lean-six-sigma-throughout-the-supply-chain 113/278
96 ◾ Implementing Lean Six Sigma Throughout the Supply Chain
Operational Definitions
Defining the Measure
POS Empty Shelf per store—A daily total of survey results
from customers who are reporting that they did not
purchase an item due to an empty shelf per store.
Quantitative, continuous measure, and ratio data.
Purpose
To document missed potential sales due to no product on
the shelf from the customer’s voice.
Clear way to measure the process
The data source is from all stores’ POS survey and
downloaded daily at midnight. The total is then divided by
the total number of stores. The survey will span 2 weeks.
Operational Definitions
Defining the Measure
Existing SOP%—A percentage of formal SOPs in place by
total SOPs possible. Quantitative, continuous measure, and
ratio data.
Purpose
To document the relative amount of SOPs formally in place.
Clear way to measure the process
SOP audit of processes outlined by Six Sigma team relative
to the process maps built for the measure phase. Check
sheet method used to tally if a formal SOP was published
and distributed to those affected.
Figure 5.19 (continued).
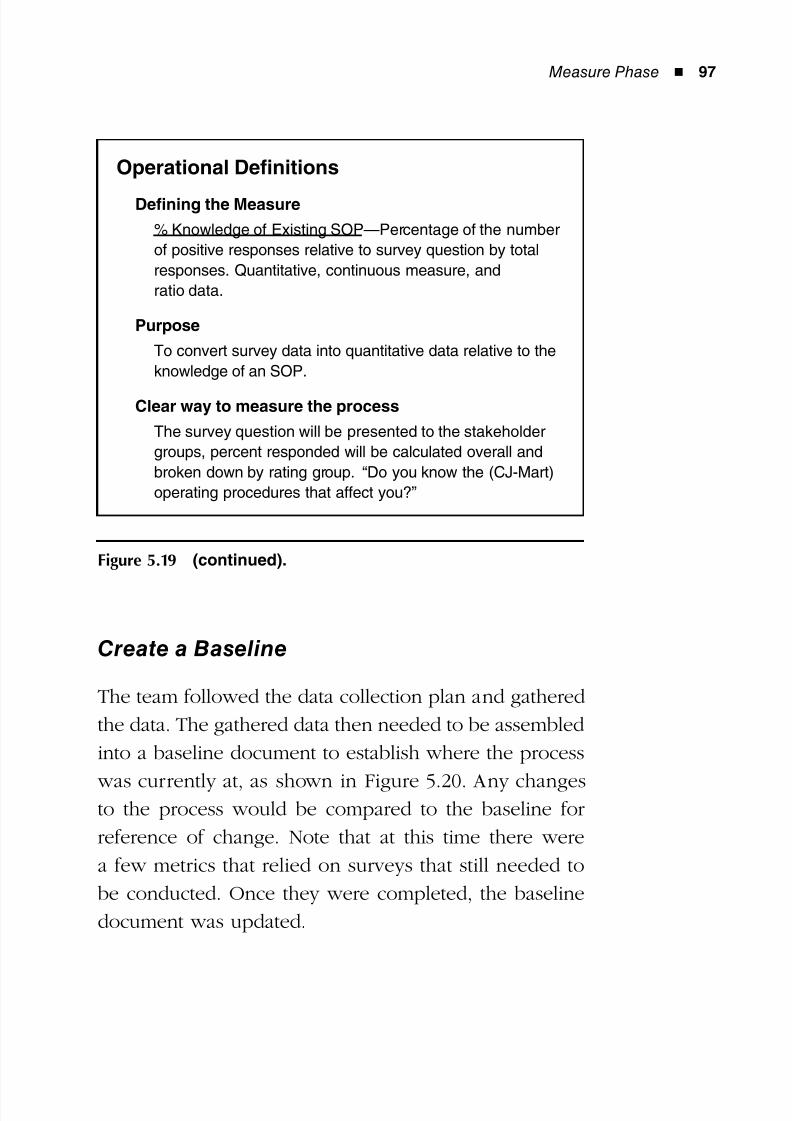
8/12/2019 Implementing Lean Six Sigma Throughout the Supply Chain
http://slidepdf.com/reader/full/implementing-lean-six-sigma-throughout-the-supply-chain 114/278
Measure Phase ◾ 97
Create a Baseline
The team followed the data collection plan and gathered
the data. The gathered data then needed to be assembled
into a baseline document to establish where the process
was currently at, as shown in Figure 5.20. Any changesto the process would be compared to the baseline for
reference of change. Note that at this time there were
a few metrics that relied on surveys that still needed to
be conducted. Once they were completed, the baseline
document was updated.
Operational Definitions
Defining the Measure
% Knowledge of Existing SOP—Percentage of the number
of positive responses relative to survey question by total
responses. Quantitative, continuous measure, and
ratio data.
Purpose
To convert survey data into quantitative data relative to the
knowledge of an SOP.
Clear way to measure the process
The survey question will be presented to the stakeholder
groups, percent responded will be calculated overall and
broken down by rating group. “Do you know the (CJ-Mart)
operating procedures that affect you?”
Figure 5.19 (continued).
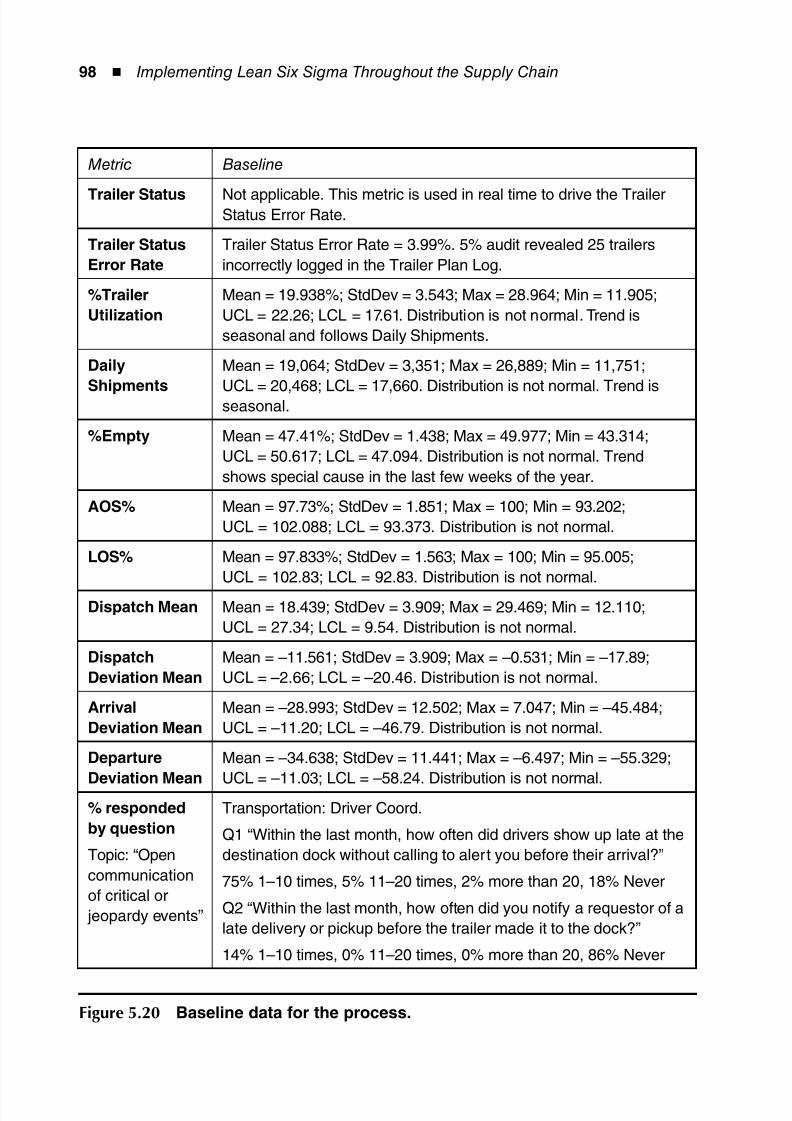
8/12/2019 Implementing Lean Six Sigma Throughout the Supply Chain
http://slidepdf.com/reader/full/implementing-lean-six-sigma-throughout-the-supply-chain 115/278
98 ◾ Implementing Lean Six Sigma Throughout the Supply Chain
Metric Baseline
Trailer Status Not applicable. This metric is used in real time to drive the TrailerStatus Error Rate.
Trailer Status
Error Rate
Trailer Status Error Rate = 3.99%. 5% audit revealed 25 trailers
incorrectly logged in the Trailer Plan Log.
%Trailer
Utilization
Mean = 19.938%; StdDev = 3.543; Max = 28.964; Min = 11.905;
UCL = 22.26; LCL = 17.61. Distribution is not normal. Trend is
seasonal and follows Daily Shipments.
Daily
Shipments
Mean = 19,064; StdDev = 3,351; Max = 26,889; Min = 11,751;
UCL = 20,468; LCL = 17,660. Distribution is not normal. Trend isseasonal.
%Empty Mean = 47.41%; StdDev = 1.438; Max = 49.977; Min = 43.314;
UCL = 50.617; LCL = 47.094. Distribution is not normal. Trend
shows special cause in the last few weeks of the year.
AOS% Mean = 97.73%; StdDev = 1.851; Max = 100; Min = 93.202;
UCL = 102.088; LCL = 93.373. Distribution is not normal.
LOS% Mean = 97.833%; StdDev = 1.563; Max = 100; Min = 95.005;
UCL = 102.83; LCL = 92.83. Distribution is not normal.
Dispatch Mean Mean = 18.439; StdDev = 3.909; Max = 29.469; Min = 12.110;
UCL = 27.34; LCL = 9.54. Distribution is not normal.
Dispatch
Deviation Mean
Mean = –11.561; StdDev = 3.909; Max = –0.531; Min = –17.89;
UCL = –2.66; LCL = –20.46. Distribution is not normal.
Arrival
Deviation Mean
Mean = –28.993; StdDev = 12.502; Max = 7.047; Min = –45.484;
UCL = –11.20; LCL = –46.79. Distribution is not normal.
Departure
Deviation Mean
Mean = –34.638; StdDev = 11.441; Max = –6.497; Min = –55.329;
UCL = –11.03; LCL = –58.24. Distribution is not normal.% responded
by question
Topic: “Open
communication
of critical or
jeopardy events”
Transportation: Driver Coord.
Q1 “Within the last month, how often did drivers show up late at the
destination dock without calling to alert you before their arrival?”
75% 1–10 times, 5% 11–20 times, 2% more than 20, 18% Never
Q2 “Within the last month, how often did you notify a requestor of a
late delivery or pickup before the trailer made it to the dock?”
14% 1–10 times, 0% 11–20 times, 0% more than 20, 86% Never
Figure 5.20 Baseline data for the process.
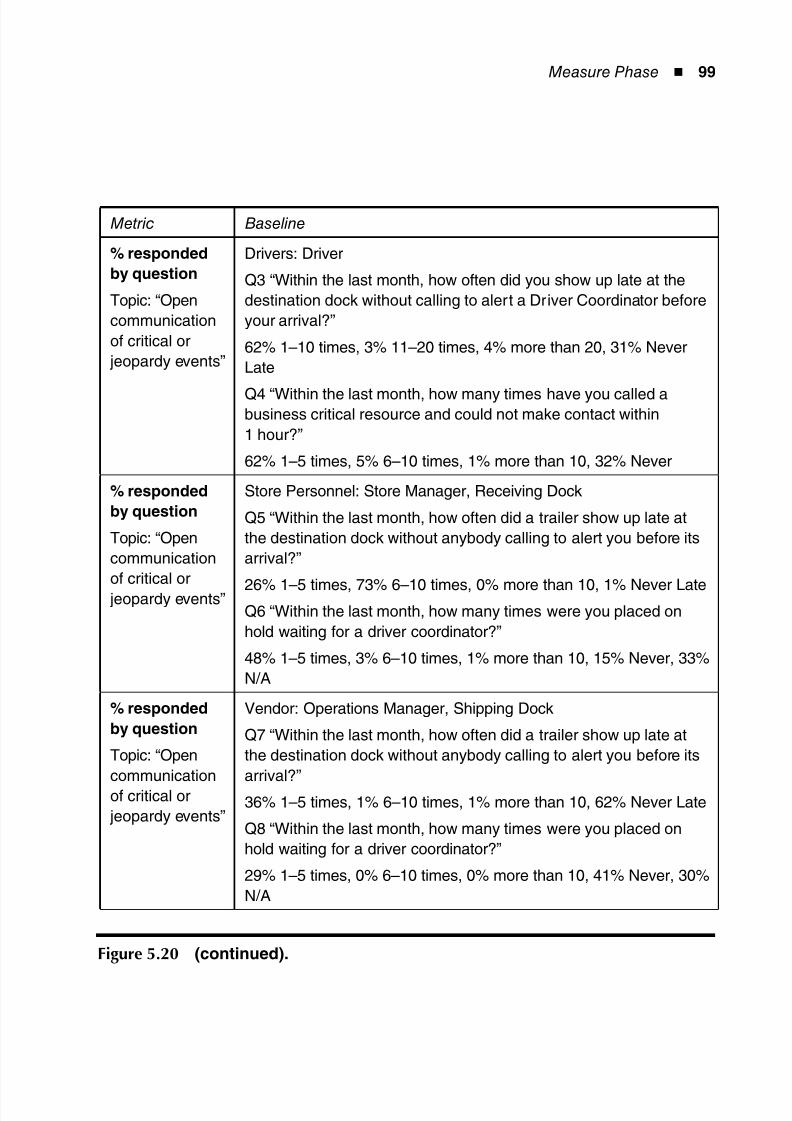
8/12/2019 Implementing Lean Six Sigma Throughout the Supply Chain
http://slidepdf.com/reader/full/implementing-lean-six-sigma-throughout-the-supply-chain 116/278
Measure Phase ◾ 99
Metric Baseline
% responded
by question
Topic: “Open
communication
of critical or
jeopardy events”
Drivers: Driver
Q3 “Within the last month, how often did you show up late at the
destination dock without calling to alert a Driver Coordinator before
your arrival?”
62% 1–10 times, 3% 11–20 times, 4% more than 20, 31% Never
Late
Q4 “Within the last month, how many times have you called abusiness critical resource and could not make contact within
1 hour?”
62% 1–5 times, 5% 6–10 times, 1% more than 10, 32% Never
% responded
by question
Topic: “Open
communication
of critical or
jeopardy events”
Store Personnel: Store Manager, Receiving Dock
Q5 “Within the last month, how often did a trailer show up late at
the destination dock without anybody calling to alert you before its
arrival?”
26% 1–5 times, 73% 6–10 times, 0% more than 10, 1% Never LateQ6 “Within the last month, how many times were you placed on
hold waiting for a driver coordinator?”
48% 1–5 times, 3% 6–10 times, 1% more than 10, 15% Never, 33%
N/A
% responded
by question
Topic: “Open
communication
of critical or
jeopardy events”
Vendor: Operations Manager, Shipping Dock
Q7 “Within the last month, how often did a trailer show up late at
the destination dock without anybody calling to alert you before its
arrival?”
36% 1–5 times, 1% 6–10 times, 1% more than 10, 62% Never Late
Q8 “Within the last month, how many times were you placed on
hold waiting for a driver coordinator?”
29% 1–5 times, 0% 6–10 times, 0% more than 10, 41% Never, 30%
N/A
Figure 5.20 (continued).
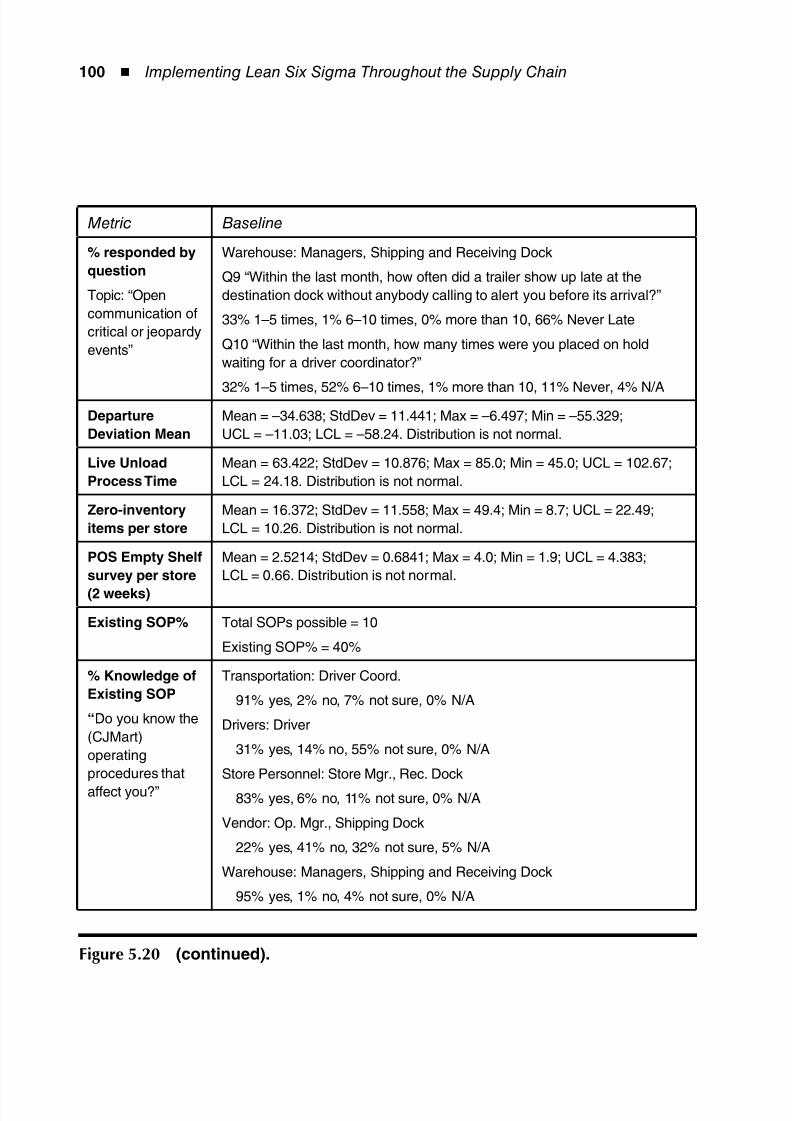
8/12/2019 Implementing Lean Six Sigma Throughout the Supply Chain
http://slidepdf.com/reader/full/implementing-lean-six-sigma-throughout-the-supply-chain 117/278
100 ◾ Implementing Lean Six Sigma Throughout the Supply Chain
Metric Baseline
% responded by
question
Topic: “Open
communication of
critical or jeopardy
events”
Warehouse: Managers, Shipping and Receiving Dock
Q9 “Within the last month, how often did a trailer show up late at the
destination dock without anybody calling to alert you before its arrival?”
33% 1–5 times, 1% 6–10 times, 0% more than 10, 66% Never Late
Q10 “Within the last month, how many times were you placed on hold
waiting for a driver coordinator?”
32% 1–5 times, 52% 6–10 times, 1% more than 10, 11% Never, 4% N/ADeparture
Deviation Mean
Mean = –34.638; StdDev = 11.441; Max = –6.497; Min = –55.329;
UCL = –11.03; LCL = –58.24. Distribution is not normal.
Live Unload
Process Time
Mean = 63.422; StdDev = 10.876; Max = 85.0; Min = 45.0; UCL = 102.67;
LCL = 24.18. Distribution is not normal.
Zero-inventory
items per store
Mean = 16.372; StdDev = 11.558; Max = 49.4; Min = 8.7; UCL = 22.49;
LCL = 10.26. Distribution is not normal.
POS Empty Shelf
survey per store
(2 weeks)
Mean = 2.5214; StdDev = 0.6841; Max = 4.0; Min = 1.9; UCL = 4.383;
LCL = 0.66. Distribution is not normal.
Existing SOP% Total SOPs possible = 10
Existing SOP% = 40%
% Knowledge of
Existing SOP
“Do you know the
(CJMart)
operating
procedures that
affect you?”
Transportation: Driver Coord.
91% yes, 2% no, 7% not sure, 0% N/A
Drivers: Driver
31% yes, 14% no, 55% not sure, 0% N/A
Store Personnel: Store Mgr., Rec. Dock
83% yes, 6% no, 11% not sure, 0% N/A
Vendor: Op. Mgr., Shipping Dock
22% yes, 41% no, 32% not sure, 5% N/A
Warehouse: Managers, Shipping and Receiving Dock
95% yes, 1% no, 4% not sure, 0% N/A
Figure 5.20 (continued).
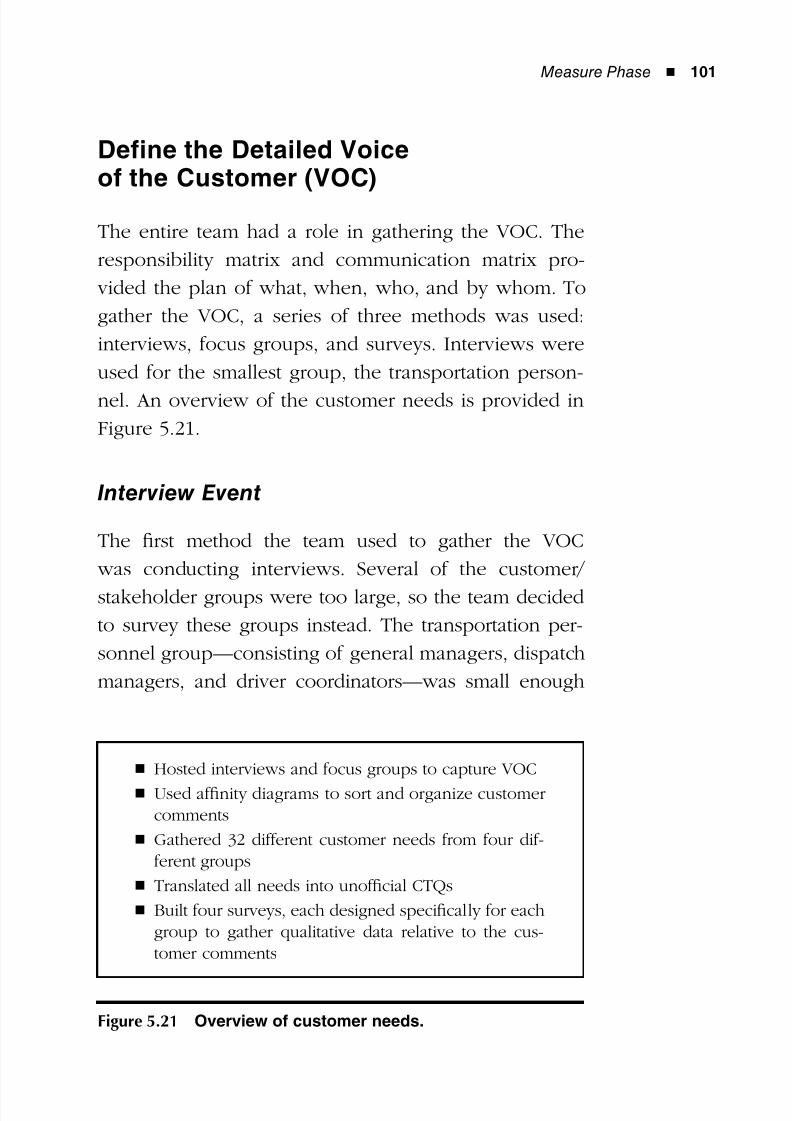
8/12/2019 Implementing Lean Six Sigma Throughout the Supply Chain
http://slidepdf.com/reader/full/implementing-lean-six-sigma-throughout-the-supply-chain 118/278
Measure Phase ◾ 101
Define the Detailed Voiceof the Customer (VOC)
The entire team had a role in gathering the VOC. The
responsibility matrix and communication matrix pro-
vided the plan of what, when, who, and by whom. To
gather the VOC, a series of three methods was used:
interviews, focus groups, and surveys. Interviews were
used for the smallest group, the transportation person-
nel. An overview of the customer needs is provided in
Figure 5.21.
Interview Event
The first method the team used to gather the VOC
was conducting interviews. Several of the customer/
stakeholder groups were too large, so the team decided
to survey these groups instead. The transportation per-
sonnel group—consisting of general managers, dispatch
managers, and driver coordinators—was small enough
Hosted interviews and focus groups to capture VOC◾
Used affinity diagrams to sort and organize customer◾
comments
Gathered 32 different customer needs from four dif-◾
ferent groups
Translated all needs into unofficial CTQs◾
Built four surveys, each designed specifically for each◾
group to gather qualitative data relative to the cus-tomer comments
Figure 5.21 Overview of customer needs.
8/12/2019 Implementing Lean Six Sigma Throughout the Supply Chain
http://slidepdf.com/reader/full/implementing-lean-six-sigma-throughout-the-supply-chain 119/278
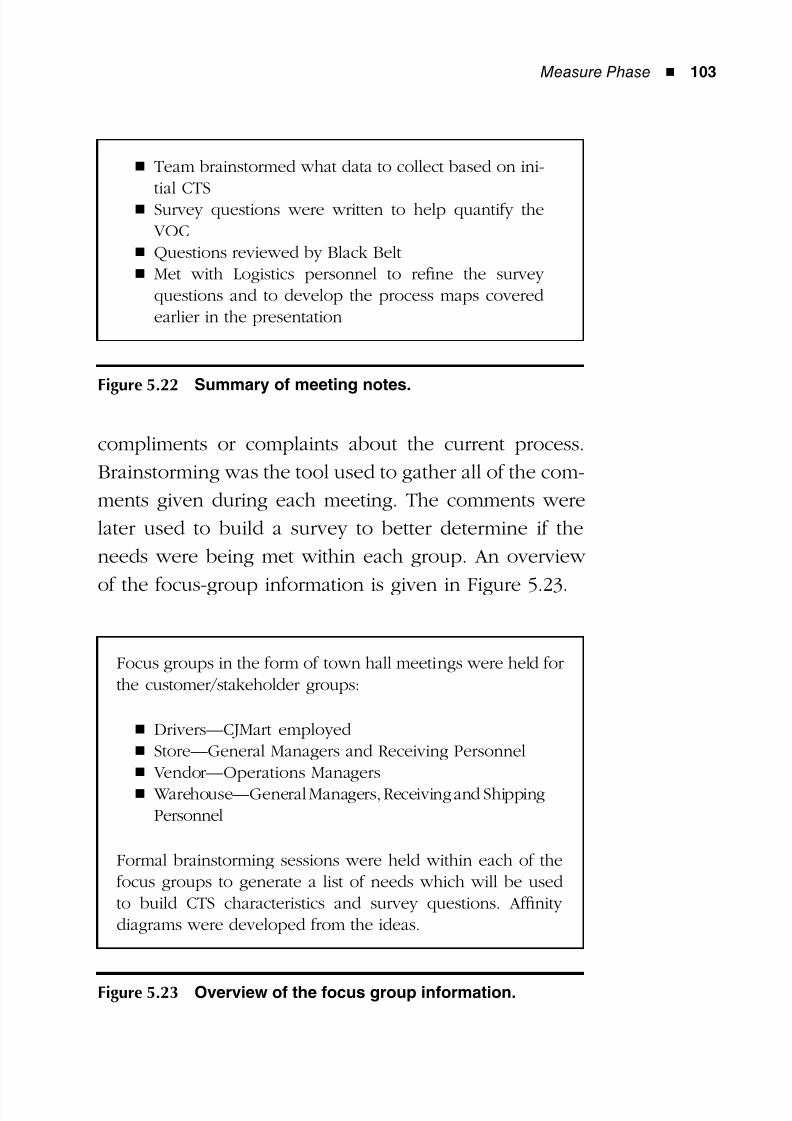
8/12/2019 Implementing Lean Six Sigma Throughout the Supply Chain
http://slidepdf.com/reader/full/implementing-lean-six-sigma-throughout-the-supply-chain 120/278
Measure Phase ◾ 103
compliments or complaints about the current process.
Brainstorming was the tool used to gather all of the com-
ments given during each meeting. The comments were
later used to build a survey to better determine if the
needs were being met within each group. An overview
of the focus-group information is given in Figure 5.23.
Focus groups in the form of town hall meetings were held for
the customer/stakeholder groups:
Drivers—CJMart employed◾
Store—General Managers and Receiving Personnel◾
Vendor—Operations Managers◾
Warehouse—General Managers, Receiving and Shipping◾
Personnel
Formal brainstorming sessions were held within each of thefocus groups to generate a list of needs which will be usedto build CTS characteristics and survey questions. Affinitydiagrams were developed from the ideas.
Figure 5.23 Overview of the focus group information.
Team brainstormed what data to collect based on ini-◾
tial CTSSurvey questions were written to help quantify the◾
VOCQuestions reviewed by Black Belt◾
Met with Logistics personnel to refine the survey◾
questions and to develop the process maps coveredearlier in the presentation
Figure 5.22 Summary of meeting notes.
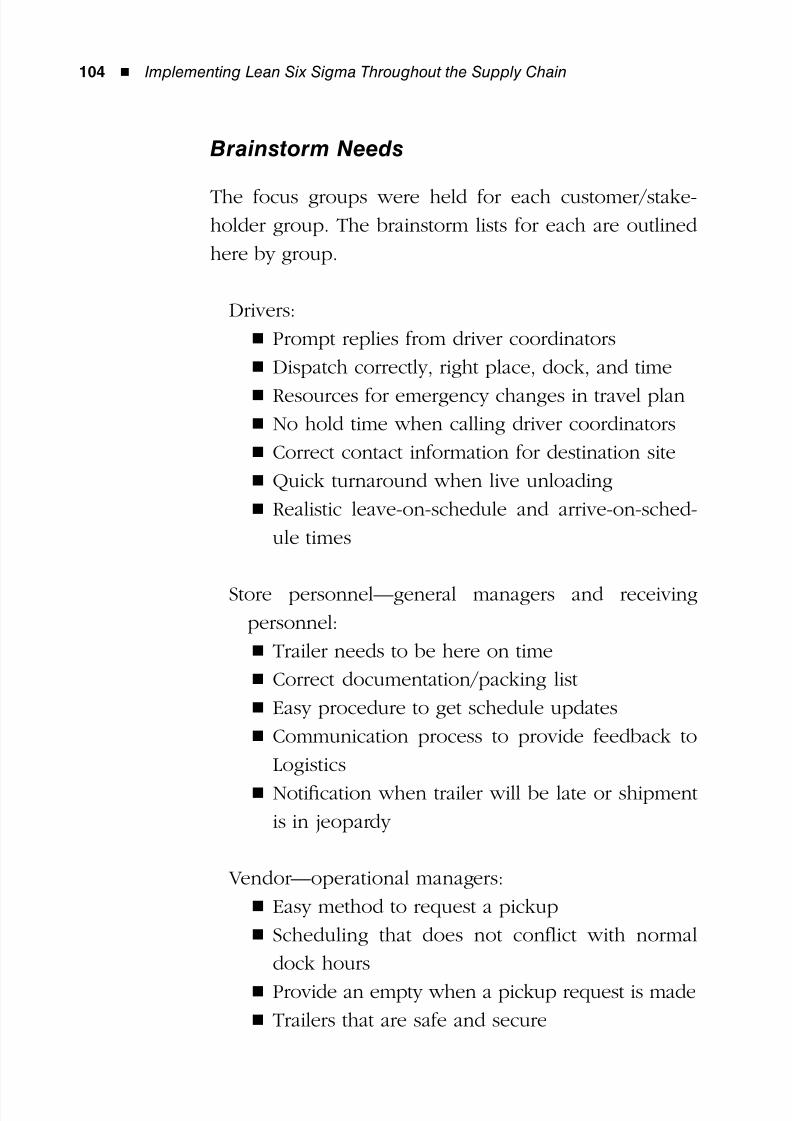
8/12/2019 Implementing Lean Six Sigma Throughout the Supply Chain
http://slidepdf.com/reader/full/implementing-lean-six-sigma-throughout-the-supply-chain 121/278
104 ◾ Implementing Lean Six Sigma Throughout the Supply Chain
Brainstorm Needs
The focus groups were held for each customer/stake-holder group. The brainstorm lists for each are outlined
here by group.
Drivers:
Prompt replies from driver coordinators◾
Dispatch correctly, right place, dock, and time◾
Resources for emergency changes in travel plan◾
No hold time when calling driver coordinators◾
Correct contact information for destination site◾
Quick turnaround when live unloading◾
Realistic leave-on-schedule and arrive-on-sched-◾
ule times
Store personnel—general managers and receivingpersonnel:
Trailer needs to be here on time◾
Correct documentation/packing list◾
Easy procedure to get schedule updates◾
Communication process to provide feedback to◾
Logistics
Notification when trailer will be late or shipment◾
is in jeopardy
Vendor—operational managers:
Easy method to request a pickup◾
Scheduling that does not conflict with normal◾
dock hours
Provide an empty when a pickup request is made◾
Trailers that are safe and secure◾
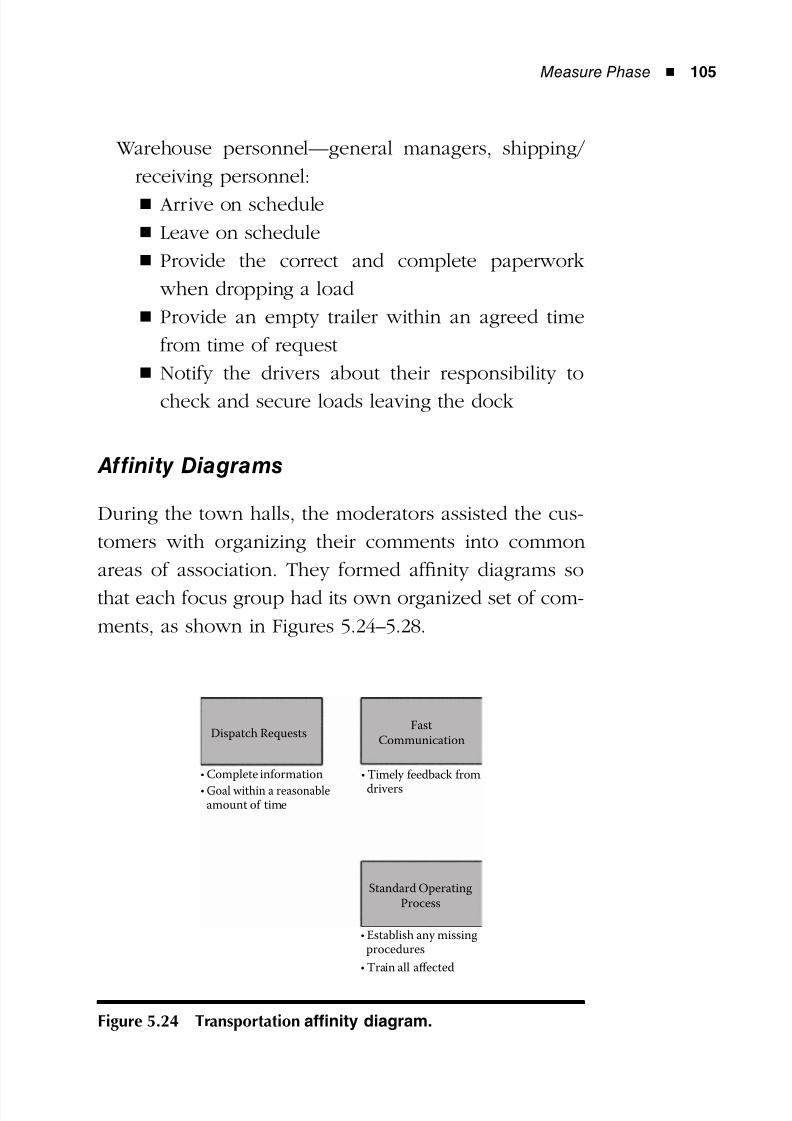
8/12/2019 Implementing Lean Six Sigma Throughout the Supply Chain
http://slidepdf.com/reader/full/implementing-lean-six-sigma-throughout-the-supply-chain 122/278
Measure Phase ◾ 105
Warehouse personnel—general managers, shipping/
receiving personnel:
Arrive on schedule◾
Leave on schedule◾
Provide the correct and complete paperwork◾
when dropping a load
Provide an empty trailer within an agreed time◾
from time of request
Notify the drivers about their responsibility to◾
check and secure loads leaving the dock
Affinity Diagrams
During the town halls, the moderators assisted the cus-
tomers with organizing their comments into common
areas of association. They formed affinity diagrams so
that each focus group had its own organized set of com-
ments, as shown in Figures 5.24–5.28.
Dispatch RequestsFast
Communication
Standard OperatingProcess
• Complete information
• Train all affected
• Goal within a reasonable
amount of time
• Timely feedback from
drivers
• Establish any missing procedures
Figure 5.24 Transportation affinity diagram.
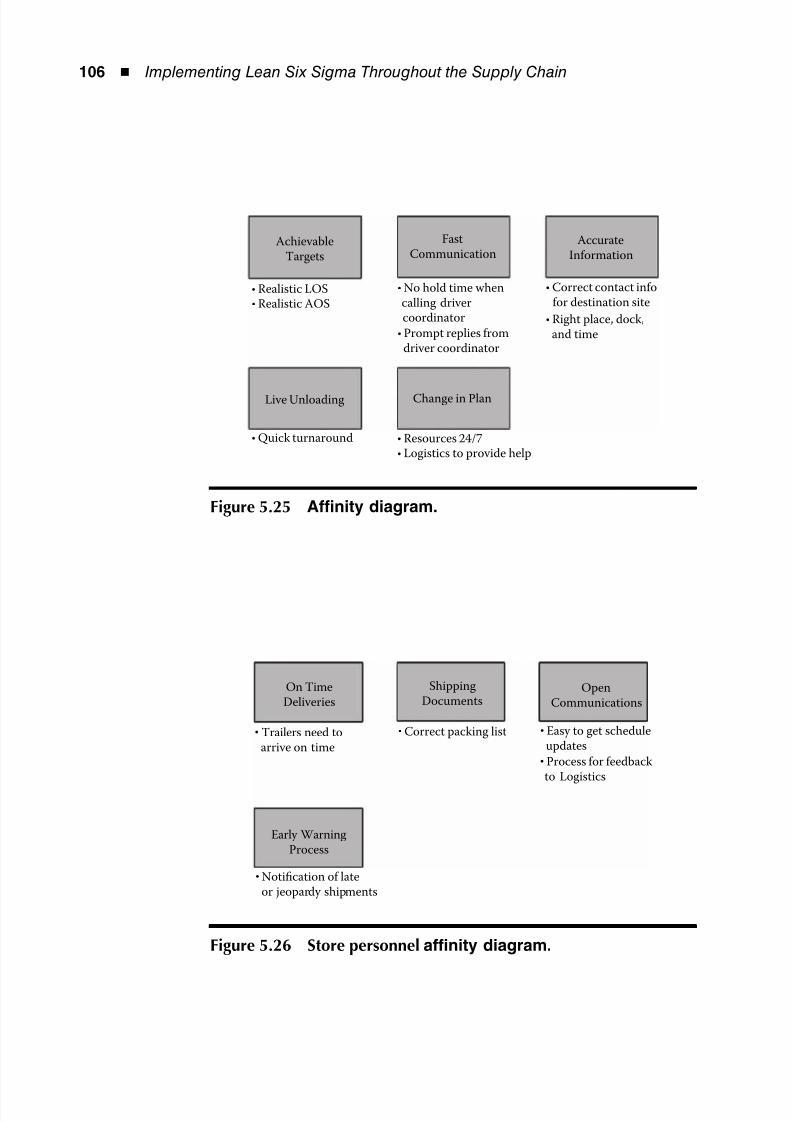
8/12/2019 Implementing Lean Six Sigma Throughout the Supply Chain
http://slidepdf.com/reader/full/implementing-lean-six-sigma-throughout-the-supply-chain 123/278
106 ◾ Implementing Lean Six Sigma Throughout the Supply Chain
AchievableTargets
FastCommunication
AccurateInformation
Change in PlanLive Unloading
• Realistic LOS• Realistic AOS
• Quick turnaround • Resources 24/7
• Logistics to provide help
• Correct contact info for destination site
• Right place, dock, and time
• No hold time when calling driver coordinator
• Prompt replies from driver coordinator
Figure 5.25 Affinity diagram.
On TimeDeliveries
Early WarningProcess
ShippingDocuments
OpenCommunications
• Easy to get schedule updates
• Correct packing list• Trailers need to arrive on time
• Notification of late or jeopardy shipments
• Process for feedback to Logistics
Figure 5.26 Store personnel affinity diagram.
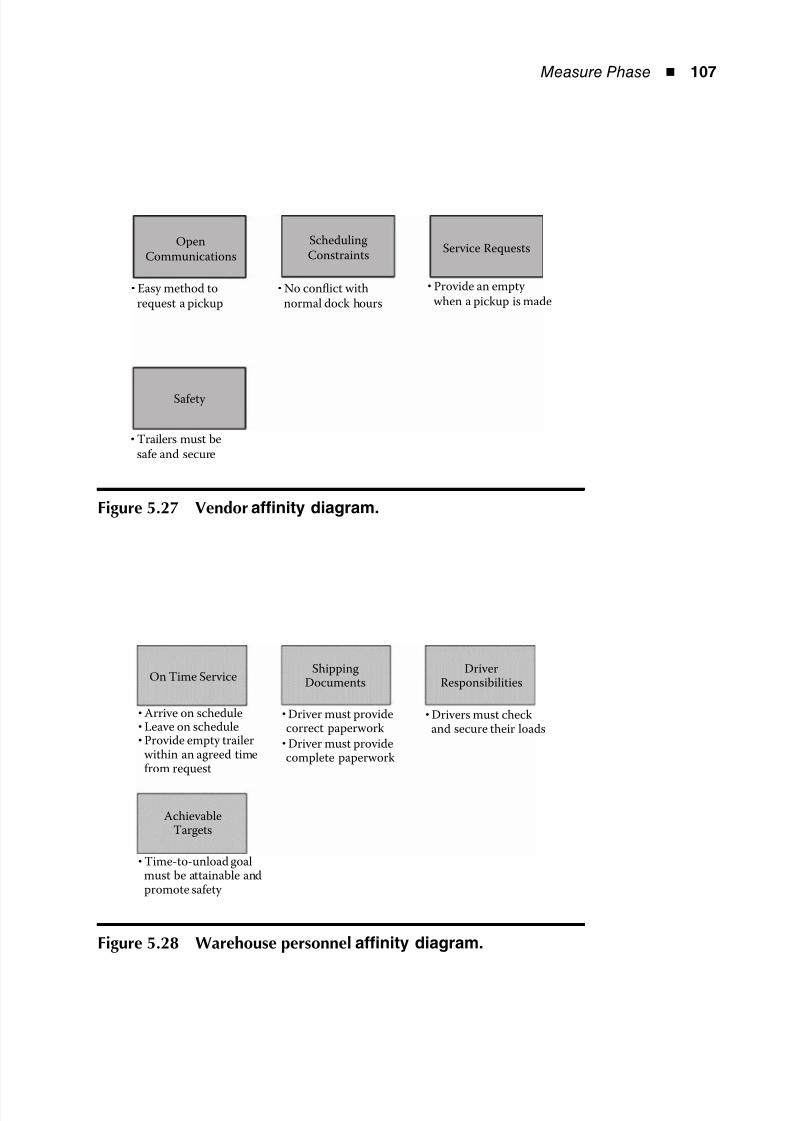
8/12/2019 Implementing Lean Six Sigma Throughout the Supply Chain
http://slidepdf.com/reader/full/implementing-lean-six-sigma-throughout-the-supply-chain 124/278
Measure Phase ◾ 107
OpenCommunications
SchedulingConstraints
Service Requests
• Provide an empty when a pickup is made
• No conflict with normal dock hours
• Easy method to request a pickup
• Trailers must be safe and secure
Safety
Figure 5.27 Vendor affinity diagram.
On Time ServiceShipping
DocumentsDriver
Responsibilities
AchievableTargets
• Arrive on schedule• Leave on schedule
• Driver must provide correct paperwork
• Driver must provide complete paperwork
• Drivers must check and secure their loads
• Time-to-unload goal must be attainable and promote safety
• Provide empty trailer within an agreed time from request
Figure 5.28 Warehouse personnel affinity diagram.
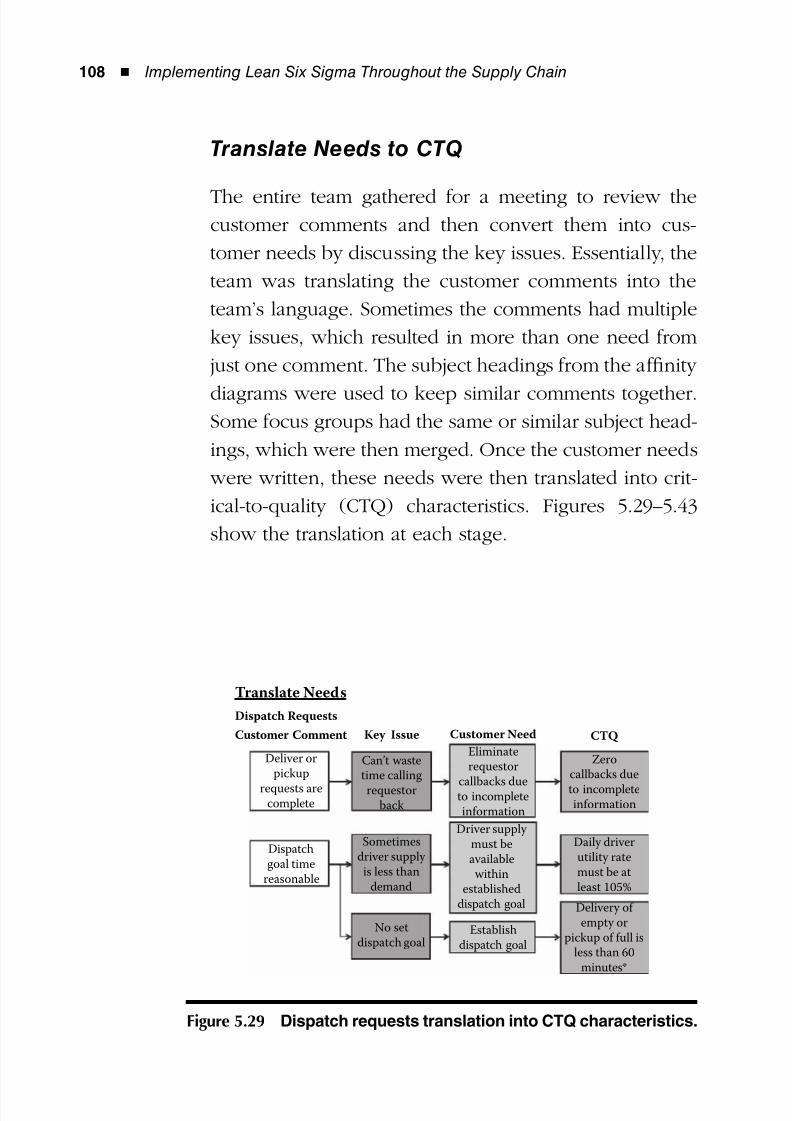
8/12/2019 Implementing Lean Six Sigma Throughout the Supply Chain
http://slidepdf.com/reader/full/implementing-lean-six-sigma-throughout-the-supply-chain 125/278
108 ◾ Implementing Lean Six Sigma Throughout the Supply Chain
Translate Needs to CTQ
The entire team gathered for a meeting to review thecustomer comments and then convert them into cus-
tomer needs by discussing the key issues. Essentially, the
team was translating the customer comments into the
team’s language. Sometimes the comments had multiple
key issues, which resulted in more than one need from
just one comment. The subject headings from the affinity
diagrams were used to keep similar comments together.Some focus groups had the same or similar subject head-
ings, which were then merged. Once the customer needs
were written, these needs were then translated into crit-
ical-to-quality (CTQ) characteristics. Figures 5.29–5.43
show the translation at each stage.
Translate Needs
Dispatch Requests
Customer Comment
Deliver orpickup
requests arecomplete
Can’t wastetime calling
requestorback
Eliminaterequestor
callbacks dueto incompleteinformation
Zerocallbacks due
to incompleteinformation
Daily driverutility ratemust be atleast 105%
Driver supply must beavailablewithin
establisheddispatch goal
Establishdispatch goal
No setdispatch goal
Sometimesdriver supply
is less thandemand
Dispatchgoal time
reasonable
Delivery of empty or
pickup of full isless than 60
minutes*
Key Issue Customer Need CTQ
Figure 5.29 Dispatch requests translation into CTQ characteristics.
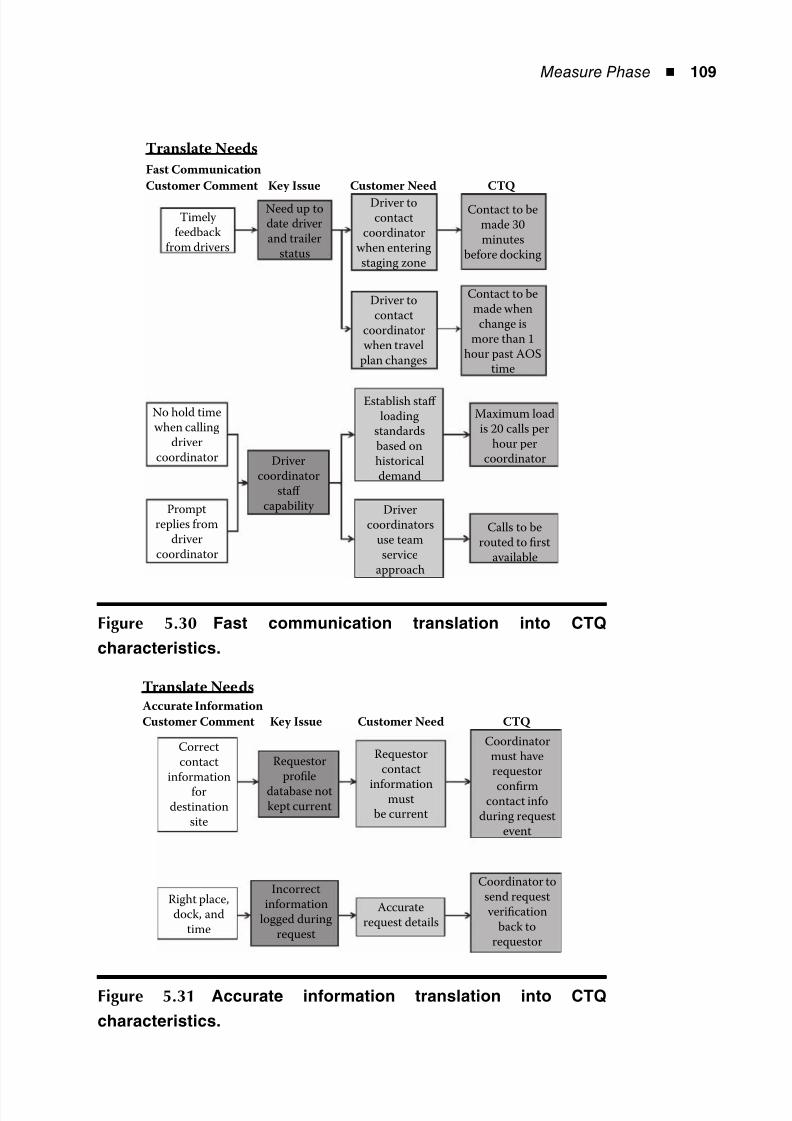
8/12/2019 Implementing Lean Six Sigma Throughout the Supply Chain
http://slidepdf.com/reader/full/implementing-lean-six-sigma-throughout-the-supply-chain 126/278
Measure Phase ◾ 109
Translate Needs
Fast Communication
Customer Comment Key Issue Customer Need CTQ
Timely feedback
from drivers
Need up todate driverand trailer
status
Driver tocontact
coordinatorwhen enteringstaging zone
Contact to bemade 30minutes
before docking
Contact to bemade when
change ismore than 1
hour past AOStime
Driver tocontact
coordinatorwhen travel
plan changes
Establish staff loading
standardsbased onhistoricaldemand
Maximum loadis 20 calls per
hour percoordinator
Calls to berouted to first
available
Drivercoordinators
use teamservice
approach
Drivercoordinator
staff capability Prompt
replies fromdriver
coordinator
No hold timewhen calling
drivercoordinator
Figure 5.30 Fast communication translation into CTQ
characteristics.
Translate Needs
Accurate Information
Key Issue Customer NeedCustomer Comment CTQ
Correctcontact
informationfor
destinationsite
Requestorprofile
database notkept current
Requestorcontact
informationmust
be current
Coordinatormust haverequestor
confirmcontact info
during requestevent
Right place,dock, and
time
Incorrectinformation
logged duringrequest
Accuraterequest details
Coordinator tosend request verification
back torequestor
Figure 5.31 Accurate information translation into CTQ
characteristics.
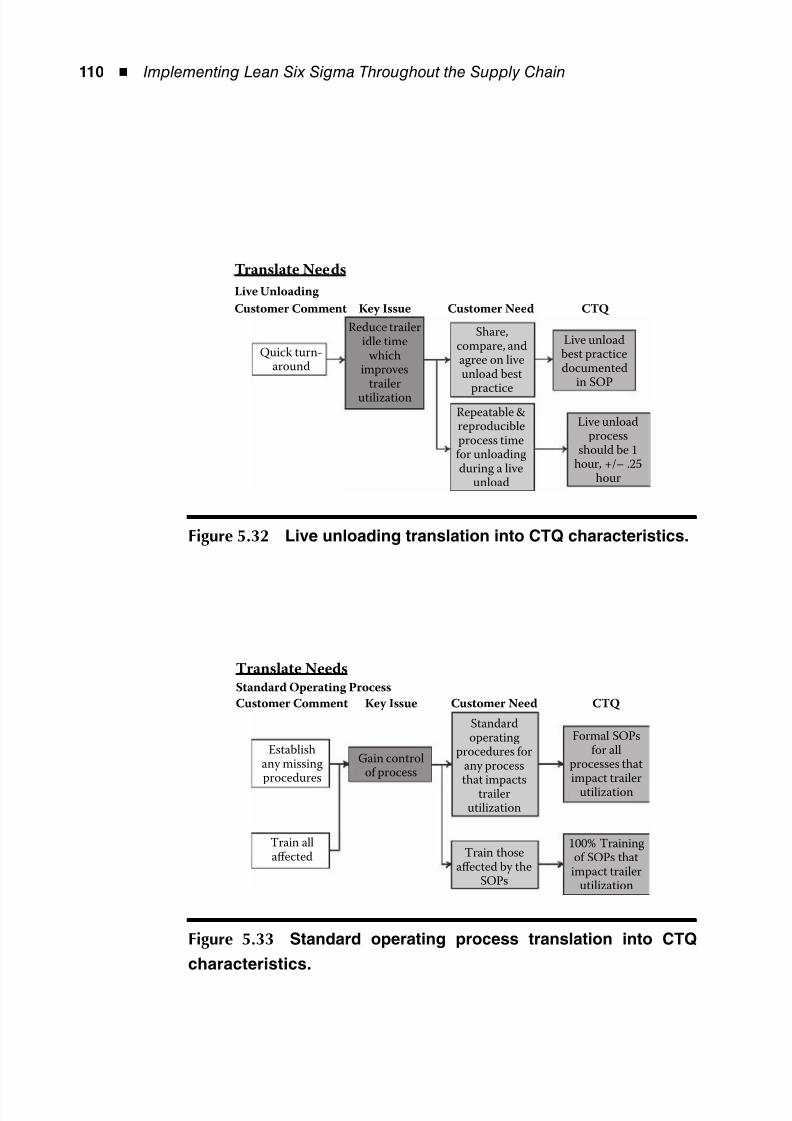
8/12/2019 Implementing Lean Six Sigma Throughout the Supply Chain
http://slidepdf.com/reader/full/implementing-lean-six-sigma-throughout-the-supply-chain 127/278
110 ◾ Implementing Lean Six Sigma Throughout the Supply Chain
Translate Needs
Live Unloading
Customer Comment CTQ Key Issue Customer Need
Quick turn-around
Reduce traileridle time
whichimproves
trailerutilization
Share,compare, andagree on liveunload best
practiceRepeatable &reproducibleprocess timefor unloadingduring a live
unload
Live unloadbest practicedocumented
in SOP
Live unloadprocess
should be 1hour, +/– .25
hour
Figure 5.32 Live unloading translation into CTQ characteristics.
Translate NeedsStandard Operating Process
Customer Comment CTQ Key Issue Customer Need
Establishany missingprocedures
Train allaffected
Gain controlof process
Standardoperating
procedures forany process
that impactstrailerutilization
Formal SOPsfor all
processes thatimpact trailer
utilization
100% Trainingof SOPs that
impact trailerutilization
Train thoseaffected by the
SOPs
Figure 5.33 Standard operating process translation into CTQ
characteristics.
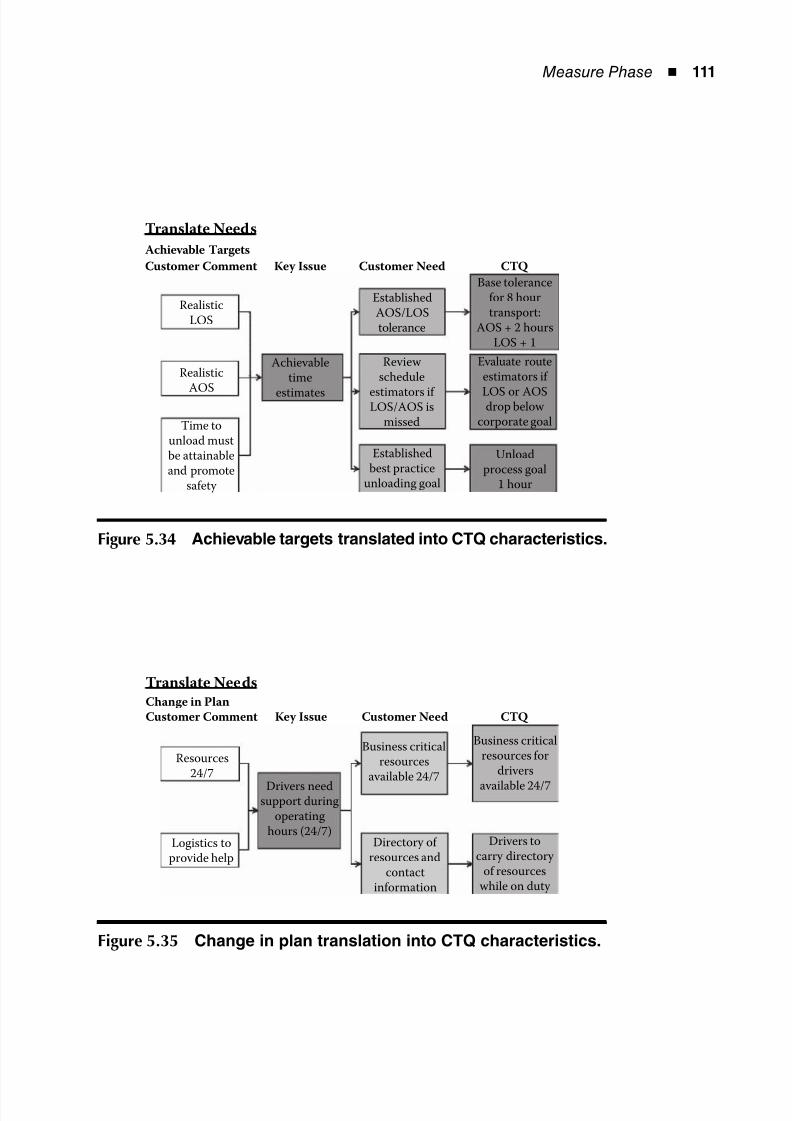
8/12/2019 Implementing Lean Six Sigma Throughout the Supply Chain
http://slidepdf.com/reader/full/implementing-lean-six-sigma-throughout-the-supply-chain 128/278
Measure Phase ◾ 111
Translate Needs
Achievable Targets
Customer Comment CTQ Key Issue Customer Need
RealisticLOS
Realistic
AOS
Time tounload mustbe attainableand promote
safety
Achievabletime
estimates
EstablishedAOS/LOStolerance
Review schedule
estimators if LOS/AOS is
missed
Base tolerancefor 8 hourtransport:
AOS + 2 hoursLOS + 1
Evaluate routeestimators if
LOS or AOSdrop below
corporate goal
Unloadprocess goal
1 hour
Establishedbest practice
unloading goal
Figure 5.34 Achievable targets translated into CTQ characteristics.
Translate Needs
Change in Plan
Customer Comment CTQ Key Issue Customer Need
Resources24/7
Logistics toprovide help
Drivers needsupport during
operatinghours (24/7)
Business criticalresources
available 24/7
Directory of resources and
contactinformation
Business criticalresources for
drivers
available 24/7
Drivers tocarry directory
of resourceswhile on duty
Figure 5.35 Change in plan translation into CTQ characteristics.
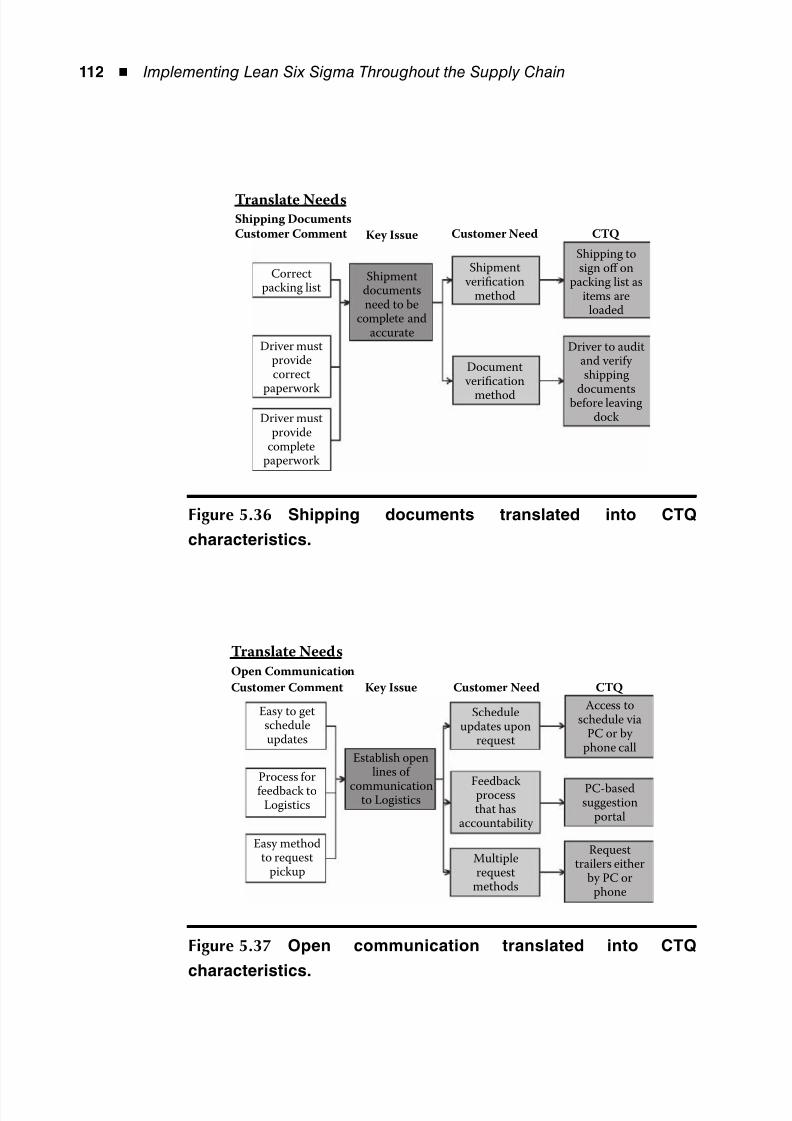
8/12/2019 Implementing Lean Six Sigma Throughout the Supply Chain
http://slidepdf.com/reader/full/implementing-lean-six-sigma-throughout-the-supply-chain 129/278
112 ◾ Implementing Lean Six Sigma Throughout the Supply Chain
Translate NeedsShipping Documents
Customer Comment CTQ Key Issue Customer Need
Correctpacking list
Driver mustprovidecorrect
paperwork
Driver mustprovide
completepaperwork
Shipmentdocumentsneed to be
complete andaccurate
Shipping tosign off on
packing list asitems are
loaded
Driver to auditand verify shipping
documentsbefore leavingdock
Shipment verification
method
Document verification
method
Figure 5.36 Shipping documents translated into CTQ
characteristics.
Translate Needs
Open Communication
Customer Comment CTQ Key Issue Customer Need
Easy to getscheduleupdates
Easy methodto request
pickup
Process forfeedback to
Logistics
Establish openlines of
communicationto Logistics
Scheduleupdates upon
request
Feedbackprocessthat has
accountability
Multiplerequest
methods
Requesttrailers either
by PC orphone
PC-basedsuggestion
portal
Access toschedule via
PC or by phone call
Figure 5.37 Open communication translated into CTQ
characteristics.
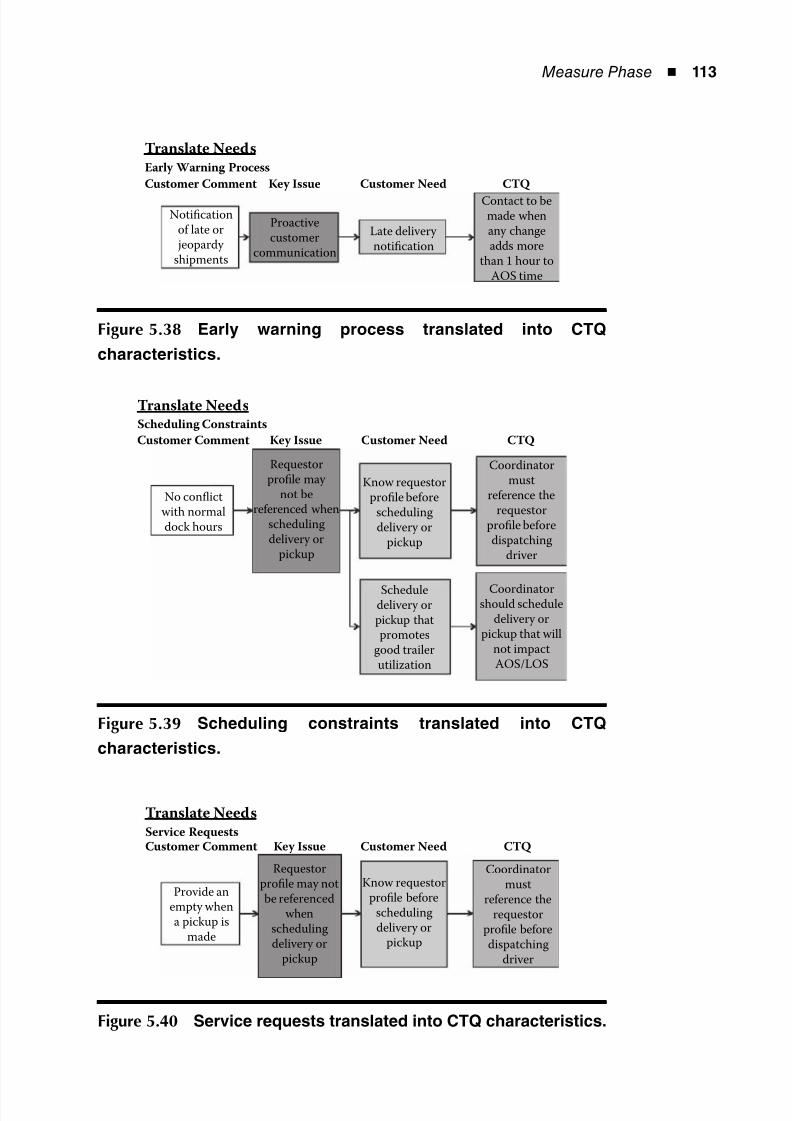
8/12/2019 Implementing Lean Six Sigma Throughout the Supply Chain
http://slidepdf.com/reader/full/implementing-lean-six-sigma-throughout-the-supply-chain 130/278
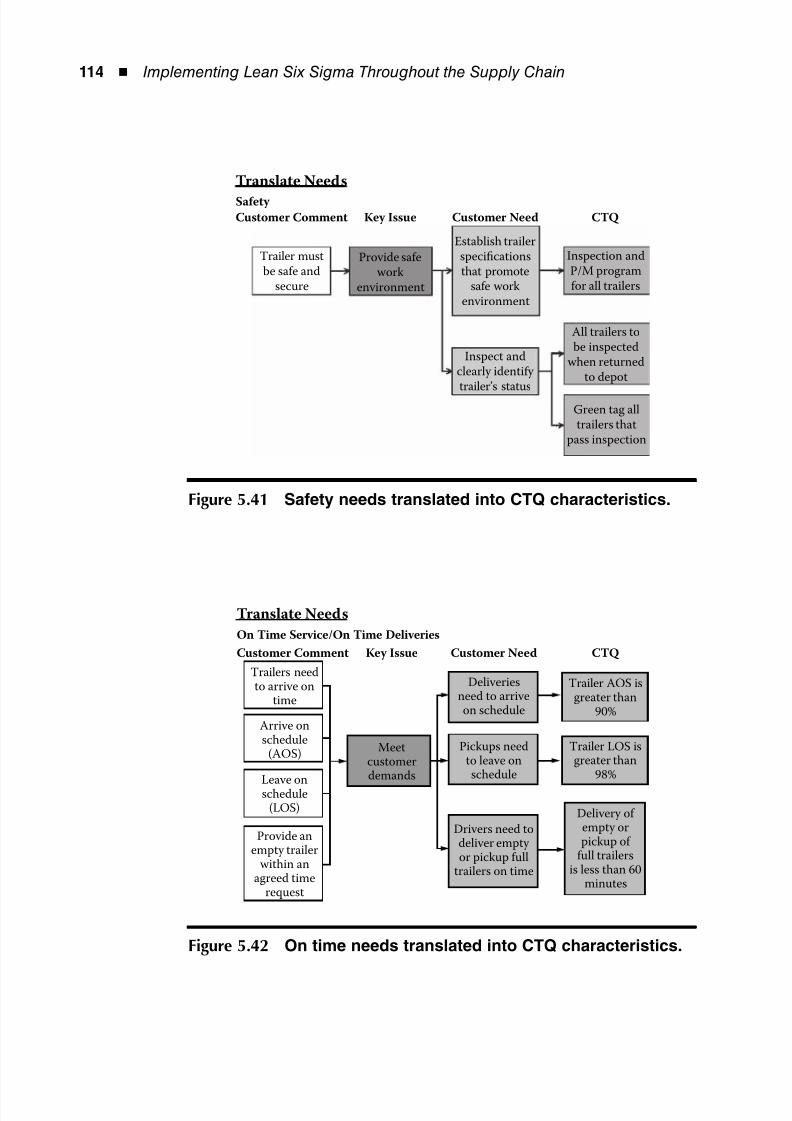
8/12/2019 Implementing Lean Six Sigma Throughout the Supply Chain
http://slidepdf.com/reader/full/implementing-lean-six-sigma-throughout-the-supply-chain 131/278
114 ◾ Implementing Lean Six Sigma Throughout the Supply Chain
Translate Needs
Safety
Customer Comment CTQ Key Issue Customer Need
Trailer mustbe safe and
secure
Provide safework
environment
Establish trailerspecificationsthat promote
safe workenvironment
Inspection andP/M programfor all trailers
All trailers tobe inspected
when returnedto depot
Green tag alltrailers that
pass inspection
Inspect andclearly identify
trailer’s status
Figure 5.41 Safety needs translated into CTQ characteristics.
Translate Needs
On Time Service/On Time Deliveries
Customer Comment CTQ Key Issue Customer Need
Trailers needto arrive on
time
Arrive onschedule
(AOS)
Leave onschedule(LOS)
Provide anempty trailer
within anagreed time
request
Meetcustomerdemands
Deliveriesneed to arriveon schedule
Pickups needto leave onschedule
Drivers need todeliver empty or pickup full
trailers on time
Delivery of empty orpickup of
full trailersis less than 60
minutes
Trailer LOS isgreater than
98%
Trailer AOS isgreater than
90%
Figure 5.42 On time needs translated into CTQ characteristics.
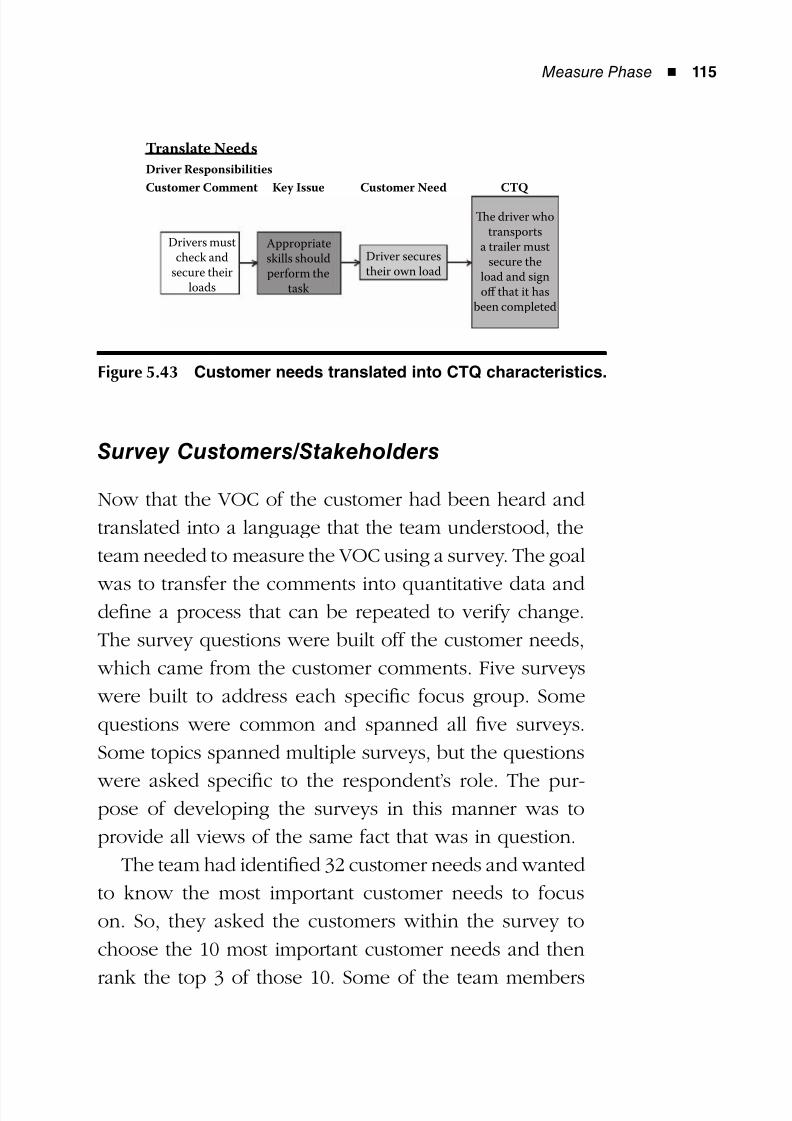
8/12/2019 Implementing Lean Six Sigma Throughout the Supply Chain
http://slidepdf.com/reader/full/implementing-lean-six-sigma-throughout-the-supply-chain 132/278
Measure Phase ◾ 115
Survey Customers/Stakeholders
Now that the VOC of the customer had been heard and
translated into a language that the team understood, the
team needed to measure the VOC using a survey. The goal
was to transfer the comments into quantitative data anddefine a process that can be repeated to verify change.
The survey questions were built off the customer needs,
which came from the customer comments. Five surveys
were built to address each specific focus group. Some
questions were common and spanned all five surveys.
Some topics spanned multiple surveys, but the questions
were asked specific to the respondent’s role. The pur-pose of developing the surveys in this manner was to
provide all views of the same fact that was in question.
The team had identified 32 customer needs and wanted
to know the most important customer needs to focus
on. So, they asked the customers within the survey to
choose the 10 most important customer needs and then
rank the top 3 of those 10. Some of the team members
Translate Needs
Driver Responsibilities
Customer Comment CTQ Key Issue Customer Need
Drivers mustcheck and
secure theirloads
Appropriateskills shouldperform the
task
Driver securestheir own load
Te driver whotransports
a trailer mustsecure the
load and signoff that it has
been completed
Figure 5.43 Customer needs translated into CTQ characteristics.
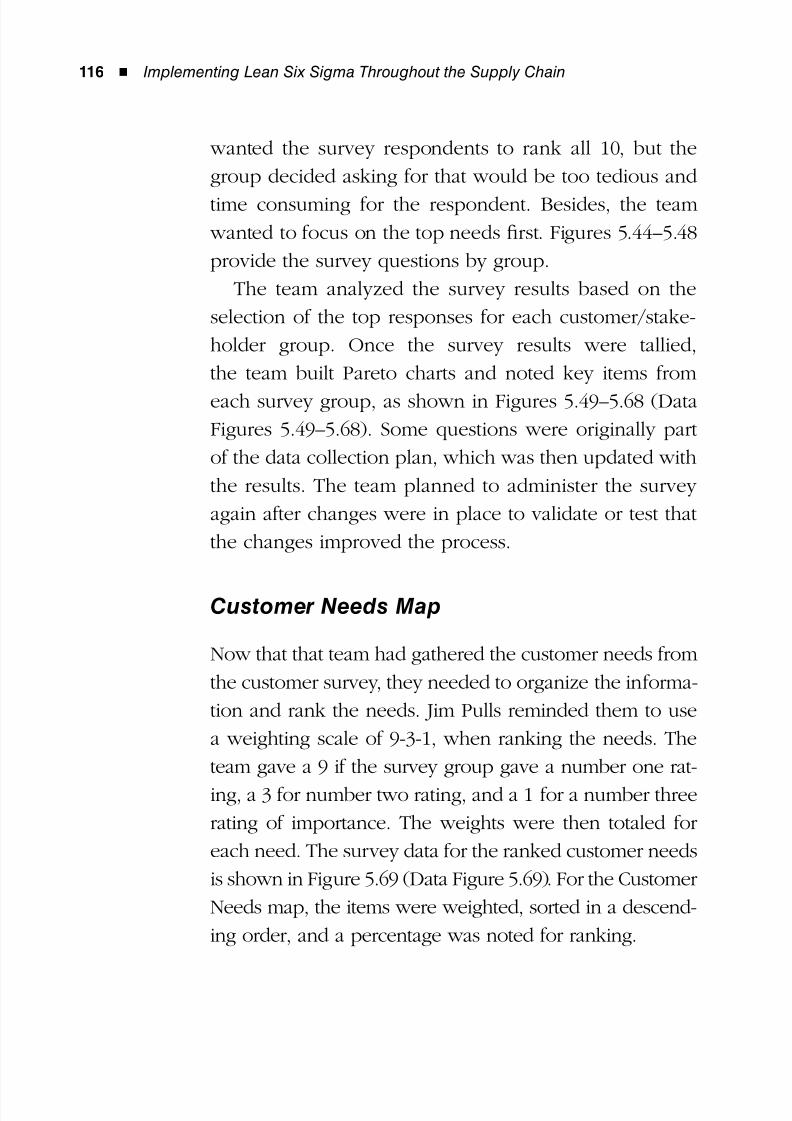
8/12/2019 Implementing Lean Six Sigma Throughout the Supply Chain
http://slidepdf.com/reader/full/implementing-lean-six-sigma-throughout-the-supply-chain 133/278
116 ◾ Implementing Lean Six Sigma Throughout the Supply Chain
wanted the survey respondents to rank all 10, but the
group decided asking for that would be too tedious and
time consuming for the respondent. Besides, the team
wanted to focus on the top needs first. Figures 5.44–5.48
provide the survey questions by group.
The team analyzed the survey results based on the
selection of the top responses for each customer/stake-
holder group. Once the survey results were tallied,
the team built Pareto charts and noted key items from
each survey group, as shown in Figures 5.49–5.68 (Data
Figures 5.49–5.68). Some questions were originally part
of the data collection plan, which was then updated with
the results. The team planned to administer the survey
again after changes were in place to validate or test that
the changes improved the process.
Customer Needs Map
Now that that team had gathered the customer needs from
the customer survey, they needed to organize the informa-
tion and rank the needs. Jim Pulls reminded them to use
a weighting scale of 9-3-1, when ranking the needs. The
team gave a 9 if the survey group gave a number one rat-
ing, a 3 for number two rating, and a 1 for a number three
rating of importance. The weights were then totaled for
each need. The survey data for the ranked customer needs
is shown in Figure 5.69 (Data Figure 5.69). For the Customer
Needs map, the items were weighted, sorted in a descend-
ing order, and a percentage was noted for ranking.
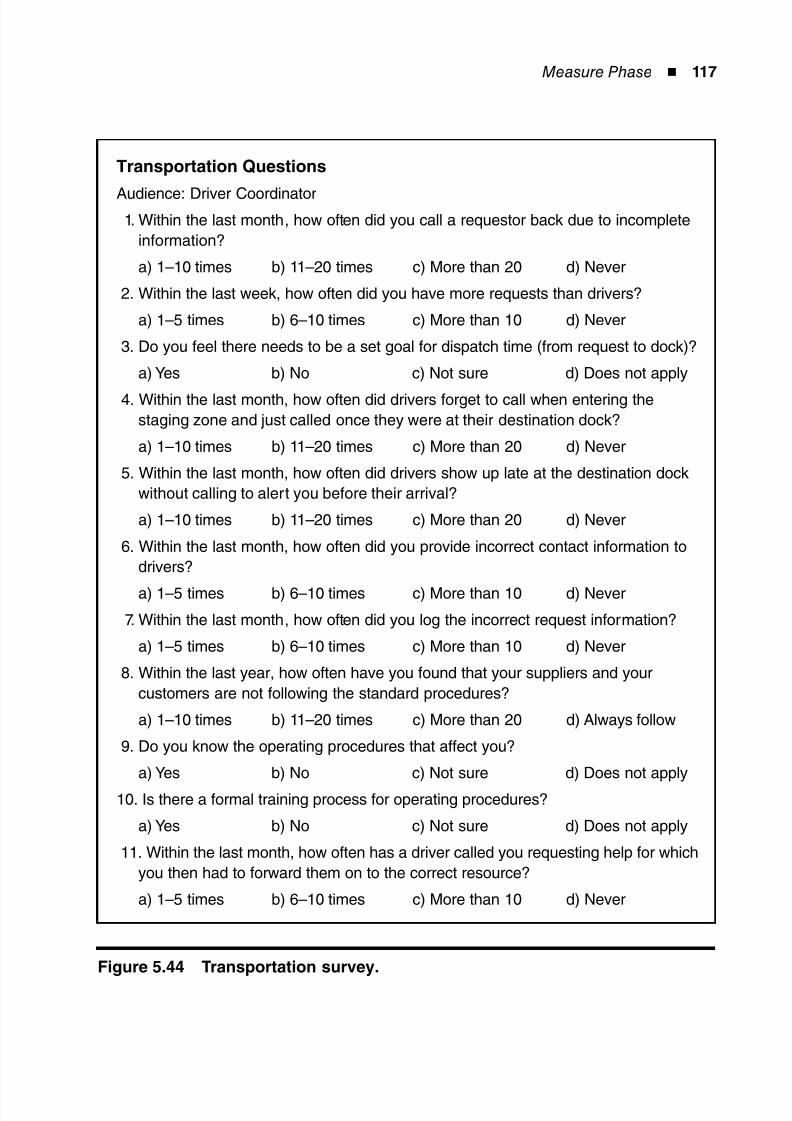
8/12/2019 Implementing Lean Six Sigma Throughout the Supply Chain
http://slidepdf.com/reader/full/implementing-lean-six-sigma-throughout-the-supply-chain 134/278
Measure Phase ◾ 117
Transportation Questions
Audience: Driver Coordinator 1. Within the last month, how often did you call a requestor back due to incomplete
information?
a) 1–10 times b) 11–20 times c) More than 20 d) Never
2. Within the last week, how often did you have more requests than drivers?
a) 1–5 times b) 6–10 times c) More than 10 d) Never
3. Do you feel there needs to be a set goal for dispatch time (from request to dock)?
a) Yes b) No c) Not sure d) Does not apply
4. Within the last month, how often did drivers forget to call when entering the
staging zone and just called once they were at their destination dock?
a) 1–10 times b) 11–20 times c) More than 20 d) Never
5. Within the last month, how often did drivers show up late at the destination dock
without calling to alert you before their arrival?
a) 1–10 times b) 11–20 times c) More than 20 d) Never
6. Within the last month, how often did you provide incorrect contact information to
drivers?
a) 1–5 times b) 6–10 times c) More than 10 d) Never
7. Within the last month, how often did you log the incorrect request information?
a) 1–5 times b) 6–10 times c) More than 10 d) Never
8. Within the last year, how often have you found that your suppliers and your
customers are not following the standard procedures?
a) 1–10 times b) 11–20 times c) More than 20 d) Always follow
9. Do you know the operating procedures that affect you?
a) Yes b) No c) Not sure d) Does not apply
10. Is there a formal training process for operating procedures?
a) Yes b) No c) Not sure d) Does not apply
11. Within the last month, how often has a driver called you requesting help for which
you then had to forward them on to the correct resource?
a) 1–5 times b) 6–10 times c) More than 10 d) Never
Figure 5.44 Transportation survey.
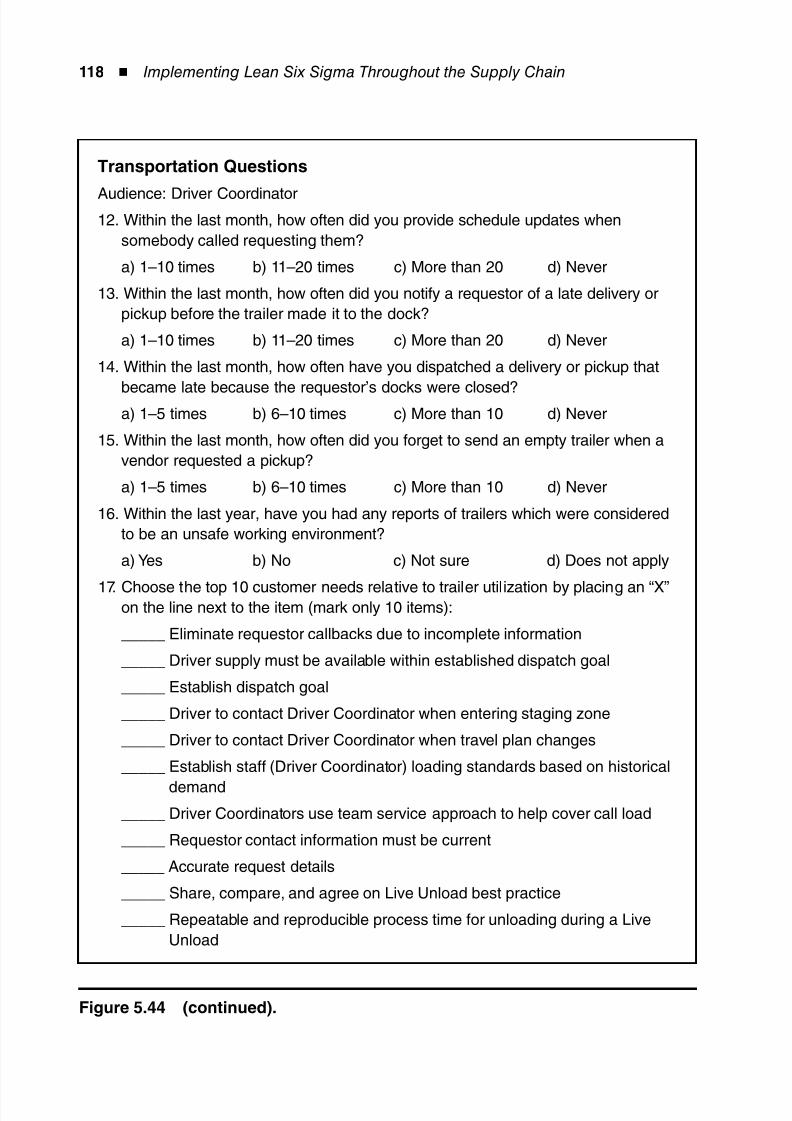
8/12/2019 Implementing Lean Six Sigma Throughout the Supply Chain
http://slidepdf.com/reader/full/implementing-lean-six-sigma-throughout-the-supply-chain 135/278
118 ◾ Implementing Lean Six Sigma Throughout the Supply Chain
Transportation Questions
Audience: Driver Coordinator 12. Within the last month, how often did you provide schedule updates when
somebody called requesting them?
a) 1–10 times b) 11–20 times c) More than 20 d) Never
13. Within the last month, how often did you notify a requestor of a late delivery or
pickup before the trailer made it to the dock?
a) 1–10 times b) 11–20 times c) More than 20 d) Never
14. Within the last month, how often have you dispatched a delivery or pickup that
became late because the requestor’s docks were closed? a) 1–5 times b) 6–10 times c) More than 10 d) Never
15. Within the last month, how often did you forget to send an empty trailer when a
vendor requested a pickup?
a) 1–5 times b) 6–10 times c) More than 10 d) Never
16. Within the last year, have you had any reports of trailers which were considered
to be an unsafe working environment?
a) Yes b) No c) Not sure d) Does not apply
17. Choose the top 10 customer needs relative to trailer utilization by placing an “X”on the line next to the item (mark only 10 items):
_____ Eliminate requestor callbacks due to incomplete information
_____ Driver supply must be available within established dispatch goal
_____ Establish dispatch goal
_____ Driver to contact Driver Coordinator when entering staging zone
_____ Driver to contact Driver Coordinator when travel plan changes
_____ Establish staff (Driver Coordinator) loading standards based on historical
demand
_____ Driver Coordinators use team service approach to help cover call load
_____ Requestor contact information must be current
_____ Accurate request details
_____ Share, compare, and agree on Live Unload best practice
_____ Repeatable and reproducible process time for unloading during a Live
Unload
Figure 5.44 (continued).
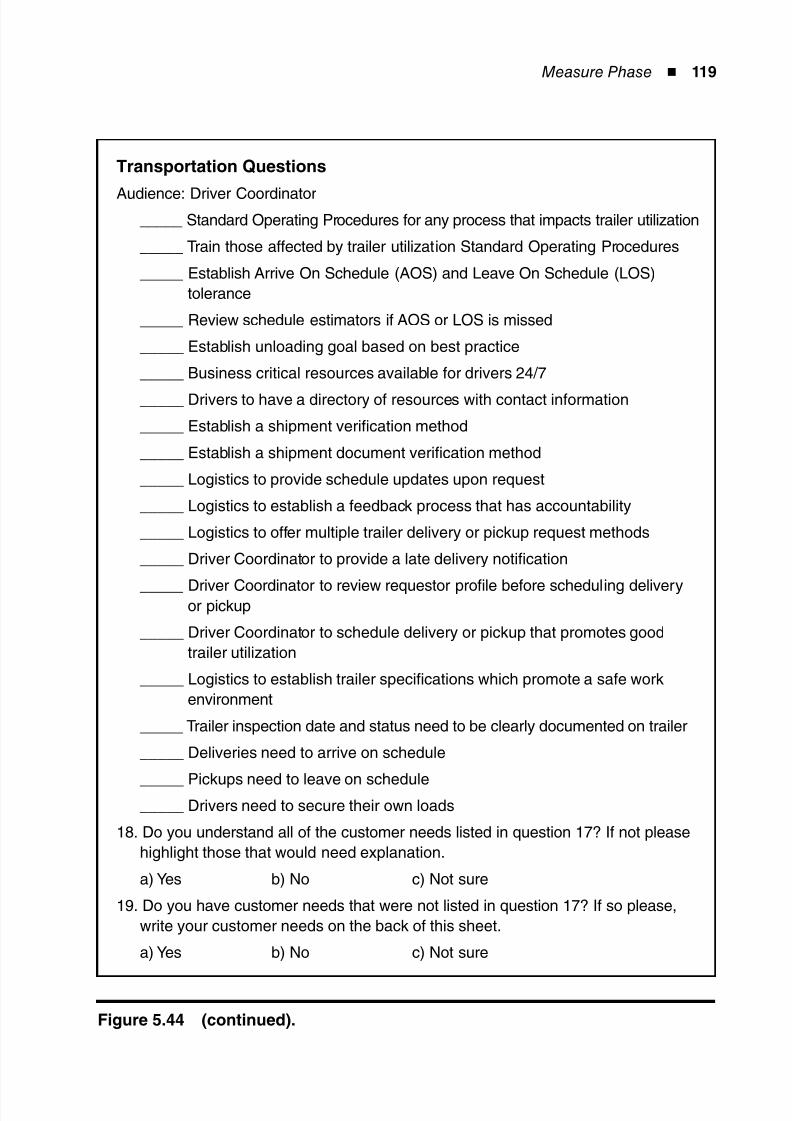
8/12/2019 Implementing Lean Six Sigma Throughout the Supply Chain
http://slidepdf.com/reader/full/implementing-lean-six-sigma-throughout-the-supply-chain 136/278
Measure Phase ◾ 119
Transportation Questions
Audience: Driver Coordinator _____ Standard Operating Procedures for any process that impacts trailer utilization
_____ Train those affected by trailer utilization Standard Operating Procedures
_____ Establish Arrive On Schedule (AOS) and Leave On Schedule (LOS)
tolerance
_____ Review schedule estimators if AOS or LOS is missed
_____ Establish unloading goal based on best practice
_____ Business critical resources available for drivers 24/7
_____ Drivers to have a directory of resources with contact information
_____ Establish a shipment verification method
_____ Establish a shipment document verification method
_____ Logistics to provide schedule updates upon request
_____ Logistics to establish a feedback process that has accountability
_____ Logistics to offer multiple trailer delivery or pickup request methods
_____ Driver Coordinator to provide a late delivery notification
_____ Driver Coordinator to review requestor profile before scheduling deliveryor pickup
_____ Driver Coordinator to schedule delivery or pickup that promotes good
trailer utilization
_____ Logistics to establish trailer specifications which promote a safe work
environment
_____ Trailer inspection date and status need to be clearly documented on trailer
_____ Deliveries need to arrive on schedule
_____ Pickups need to leave on schedule _____ Drivers need to secure their own loads
18. Do you understand all of the customer needs listed in question 17? If not please
highlight those that would need explanation.
a) Yes b) No c) Not sure
19. Do you have customer needs that were not listed in question 17? If so please,
write your customer needs on the back of this sheet.
a) Yes b) No c) Not sure
Figure 5.44 (continued).
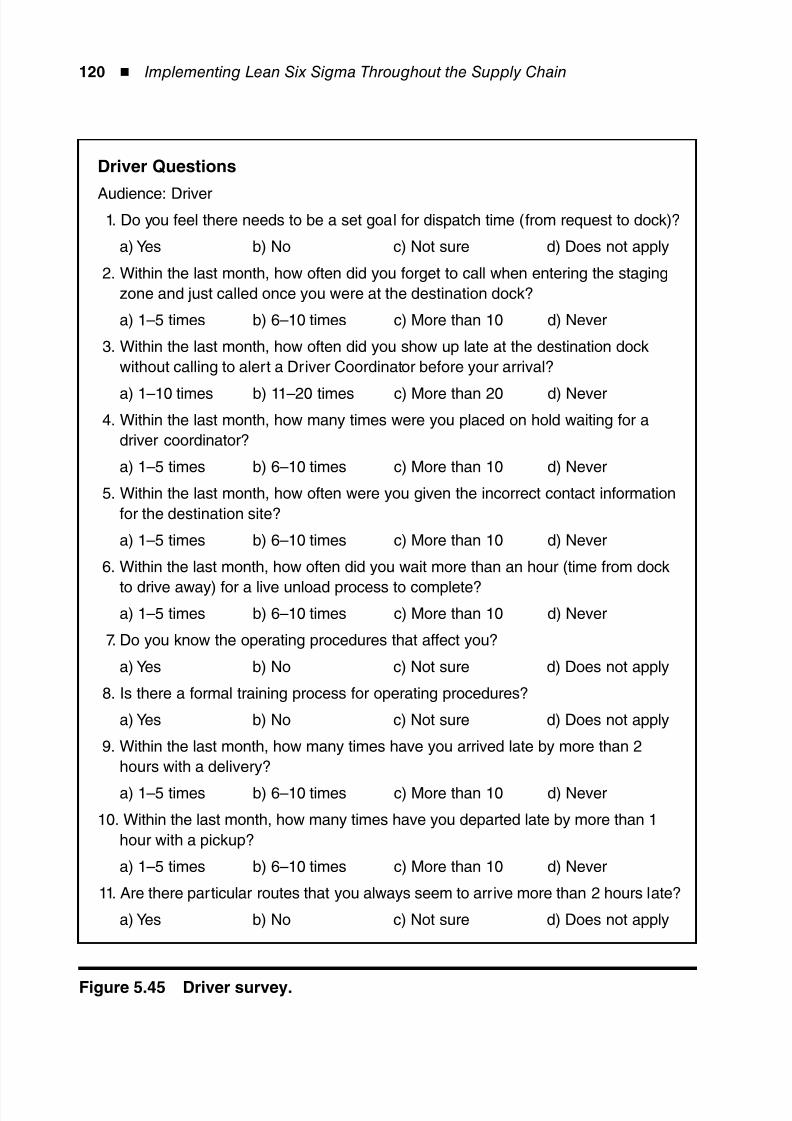
8/12/2019 Implementing Lean Six Sigma Throughout the Supply Chain
http://slidepdf.com/reader/full/implementing-lean-six-sigma-throughout-the-supply-chain 137/278
120 ◾ Implementing Lean Six Sigma Throughout the Supply Chain
Driver Questions
Audience: Driver 1. Do you feel there needs to be a set goal for dispatch time (from request to dock)?
a) Yes b) No c) Not sure d) Does not apply
2. Within the last month, how often did you forget to call when entering the staging
zone and just called once you were at the destination dock?
a) 1–5 times b) 6–10 times c) More than 10 d) Never
3. Within the last month, how often did you show up late at the destination dock
without calling to alert a Driver Coordinator before your arrival?
a) 1–10 times b) 11–20 times c) More than 20 d) Never
4. Within the last month, how many times were you placed on hold waiting for a
driver coordinator?
a) 1–5 times b) 6–10 times c) More than 10 d) Never
5. Within the last month, how often were you given the incorrect contact information
for the destination site?
a) 1–5 times b) 6–10 times c) More than 10 d) Never
6. Within the last month, how often did you wait more than an hour (time from dock
to drive away) for a live unload process to complete? a) 1–5 times b) 6–10 times c) More than 10 d) Never
7. Do you know the operating procedures that affect you?
a) Yes b) No c) Not sure d) Does not apply
8. Is there a formal training process for operating procedures?
a) Yes b) No c) Not sure d) Does not apply
9. Within the last month, how many times have you arrived late by more than 2
hours with a delivery?
a) 1–5 times b) 6–10 times c) More than 10 d) Never
10. Within the last month, how many times have you departed late by more than 1
hour with a pickup?
a) 1–5 times b) 6–10 times c) More than 10 d) Never
11. Are there particular routes that you always seem to arrive more than 2 hours late?
a) Yes b) No c) Not sure d) Does not apply
Figure 5.45 Driver survey.
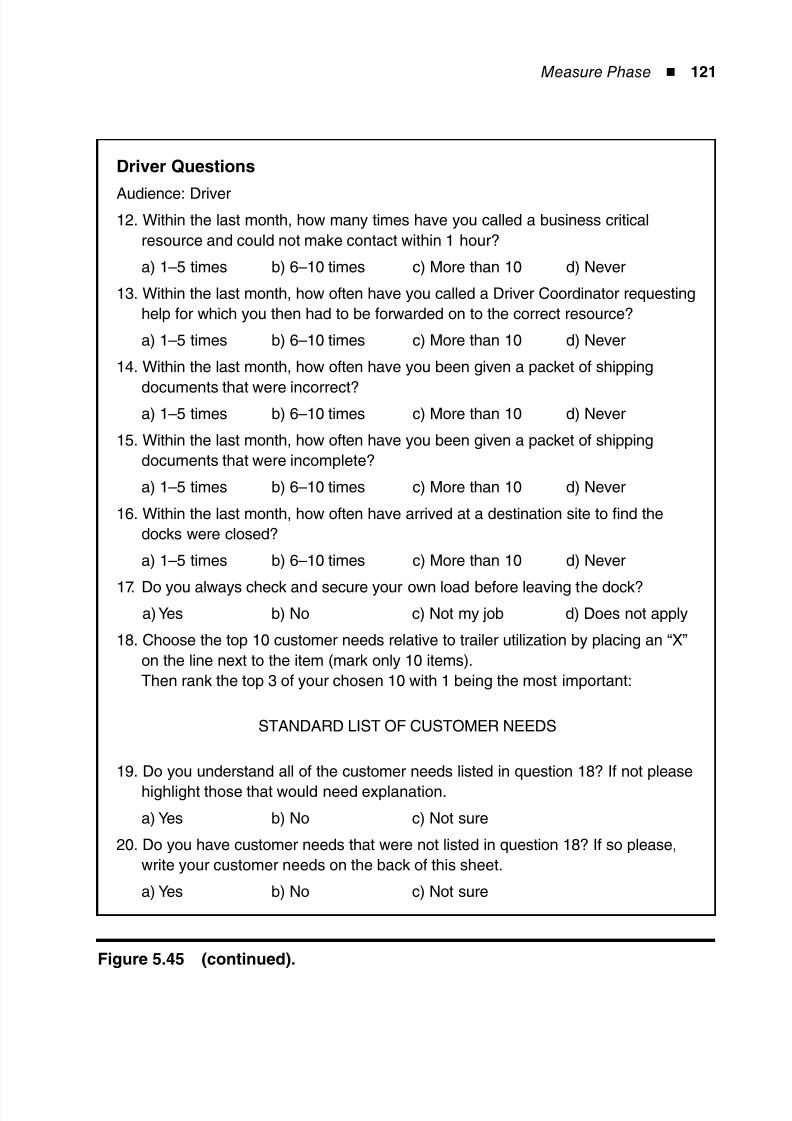
8/12/2019 Implementing Lean Six Sigma Throughout the Supply Chain
http://slidepdf.com/reader/full/implementing-lean-six-sigma-throughout-the-supply-chain 138/278
Measure Phase ◾ 121
Driver Questions
Audience: Driver 12. Within the last month, how many times have you called a business critical
resource and could not make contact within 1 hour?
a) 1–5 times b) 6–10 times c) More than 10 d) Never
13. Within the last month, how often have you called a Driver Coordinator requesting
help for which you then had to be forwarded on to the correct resource?
a) 1–5 times b) 6–10 times c) More than 10 d) Never
14. Within the last month, how often have you been given a packet of shipping
documents that were incorrect? a) 1–5 times b) 6–10 times c) More than 10 d) Never
15. Within the last month, how often have you been given a packet of shipping
documents that were incomplete?
a) 1–5 times b) 6–10 times c) More than 10 d) Never
16. Within the last month, how often have arrived at a destination site to find the
docks were closed?
a) 1–5 times b) 6–10 times c) More than 10 d) Never
17. Do you always check and secure your own load before leaving the dock? a) Yes b) No c) Not my job d) Does not apply
18. Choose the top 10 customer needs relative to trailer utilization by placing an “X”
on the line next to the item (mark only 10 items).
Then rank the top 3 of your chosen 10 with 1 being the most important:
STANDARD LIST OF CUSTOMER NEEDS
19. Do you understand all of the customer needs listed in question 18? If not please
highlight those that would need explanation.
a) Yes b) No c) Not sure
20. Do you have customer needs that were not listed in question 18? If so please,
write your customer needs on the back of this sheet.
a) Yes b) No c) Not sure
Figure 5.45 (continued).
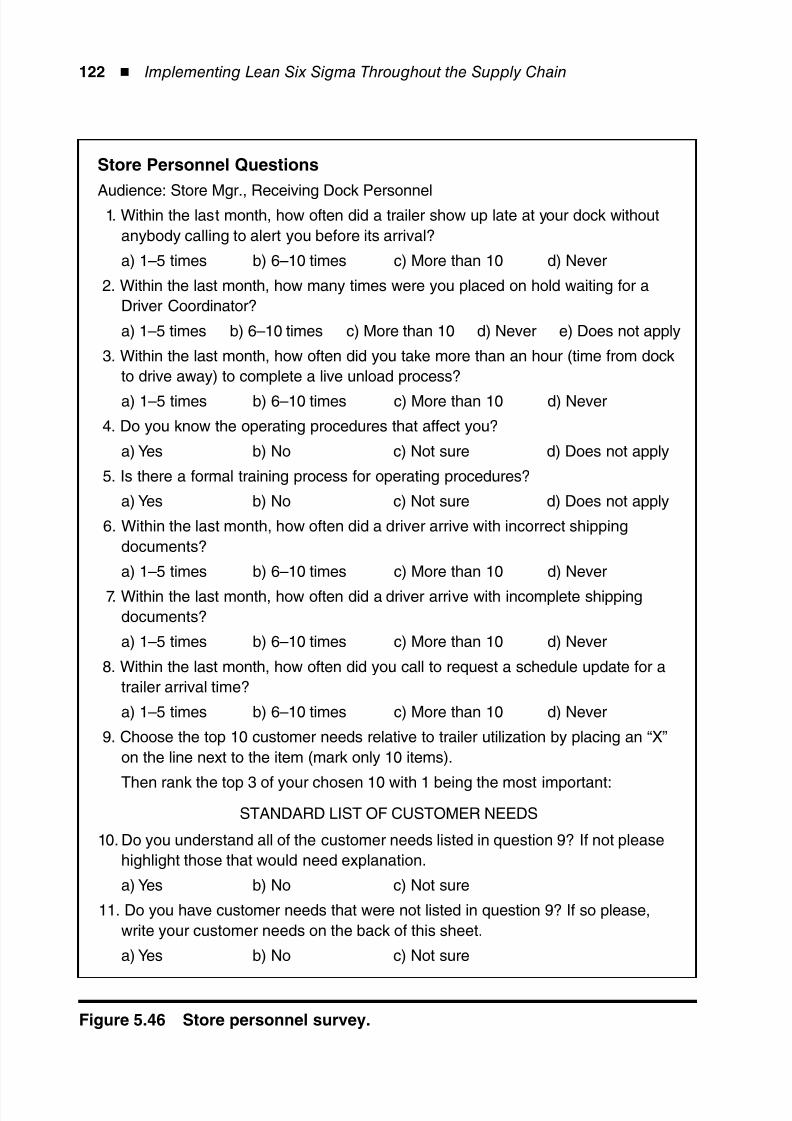
8/12/2019 Implementing Lean Six Sigma Throughout the Supply Chain
http://slidepdf.com/reader/full/implementing-lean-six-sigma-throughout-the-supply-chain 139/278
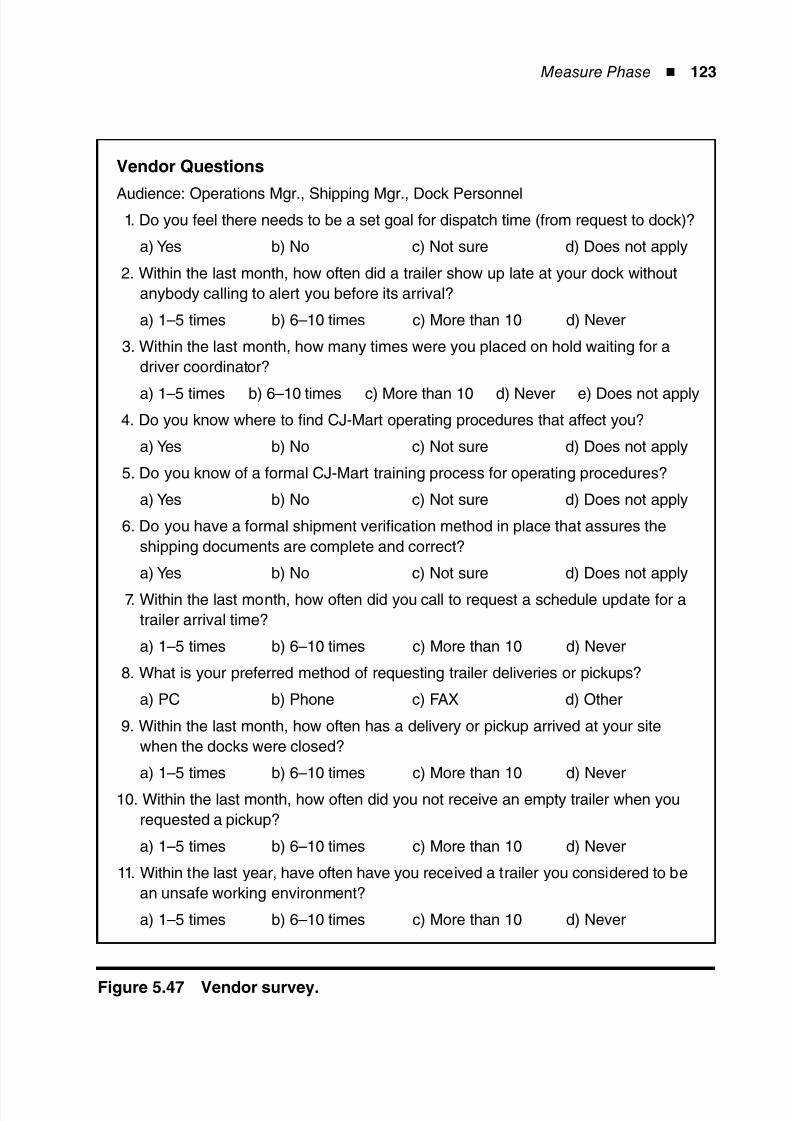
8/12/2019 Implementing Lean Six Sigma Throughout the Supply Chain
http://slidepdf.com/reader/full/implementing-lean-six-sigma-throughout-the-supply-chain 140/278
Measure Phase ◾ 123
Vendor Questions
Audience: Operations Mgr., Shipping Mgr., Dock Personnel 1. Do you feel there needs to be a set goal for dispatch time (from request to dock)?
a) Yes b) No c) Not sure d) Does not apply
2. Within the last month, how often did a trailer show up late at your dock without
anybody calling to alert you before its arrival?
a) 1–5 times b) 6–10 times c) More than 10 d) Never
3. Within the last month, how many times were you placed on hold waiting for a
driver coordinator?
a) 1–5 times b) 6–10 times c) More than 10 d) Never e) Does not apply
4. Do you know where to find CJ-Mart operating procedures that affect you?
a) Yes b) No c) Not sure d) Does not apply
5. Do you know of a formal CJ-Mart training process for operating procedures?
a) Yes b) No c) Not sure d) Does not apply
6. Do you have a formal shipment verification method in place that assures the
shipping documents are complete and correct?
a) Yes b) No c) Not sure d) Does not apply
7. Within the last month, how often did you call to request a schedule update for a
trailer arrival time?
a) 1–5 times b) 6–10 times c) More than 10 d) Never
8. What is your preferred method of requesting trailer deliveries or pickups?
a) PC b) Phone c) FAX d) Other
9. Within the last month, how often has a delivery or pickup arrived at your site
when the docks were closed?
a) 1–5 times b) 6–10 times c) More than 10 d) Never
10. Within the last month, how often did you not receive an empty trailer when you
requested a pickup?
a) 1–5 times b) 6–10 times c) More than 10 d) Never
11. Within the last year, have often have you received a trailer you considered to be
an unsafe working environment?
a) 1–5 times b) 6–10 times c) More than 10 d) Never
Figure 5.47 Vendor survey.
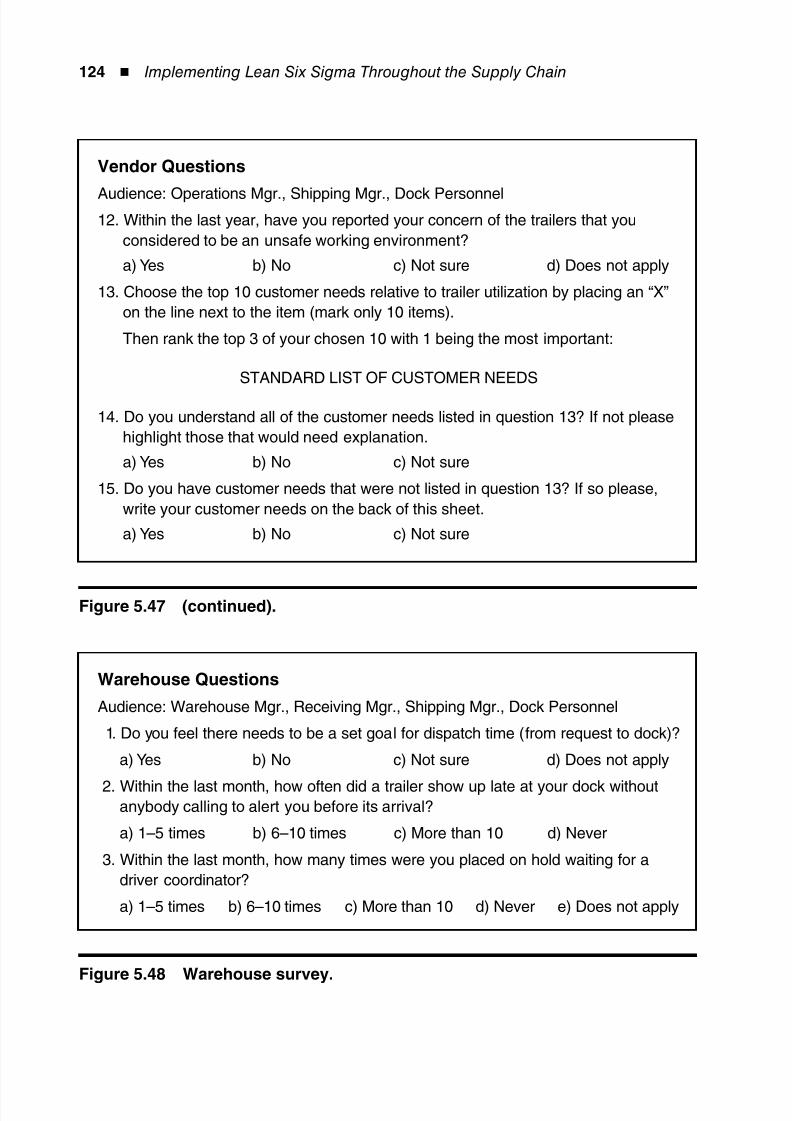
8/12/2019 Implementing Lean Six Sigma Throughout the Supply Chain
http://slidepdf.com/reader/full/implementing-lean-six-sigma-throughout-the-supply-chain 141/278
124 ◾ Implementing Lean Six Sigma Throughout the Supply Chain
Vendor Questions
Audience: Operations Mgr., Shipping Mgr., Dock Personnel 12. Within the last year, have you reported your concern of the trailers that you
considered to be an unsafe working environment?
a) Yes b) No c) Not sure d) Does not apply
13. Choose the top 10 customer needs relative to trailer utilization by placing an “X”
on the line next to the item (mark only 10 items).
Then rank the top 3 of your chosen 10 with 1 being the most important:
STANDARD LIST OF CUSTOMER NEEDS
14. Do you understand all of the customer needs listed in question 13? If not please
highlight those that would need explanation.
a) Yes b) No c) Not sure
15. Do you have customer needs that were not listed in question 13? If so please,
write your customer needs on the back of this sheet.
a) Yes b) No c) Not sure
Figure 5.47 (continued).
Warehouse Questions
Audience: Warehouse Mgr., Receiving Mgr., Shipping Mgr., Dock Personnel
1. Do you feel there needs to be a set goal for dispatch time (from request to dock)?
a) Yes b) No c) Not sure d) Does not apply
2. Within the last month, how often did a trailer show up late at your dock withoutanybody calling to alert you before its arrival?
a) 1–5 times b) 6–10 times c) More than 10 d) Never
3. Within the last month, how many times were you placed on hold waiting for a
driver coordinator?
a) 1–5 times b) 6–10 times c) More than 10 d) Never e) Does not apply
Figure 5.48 Warehouse survey.
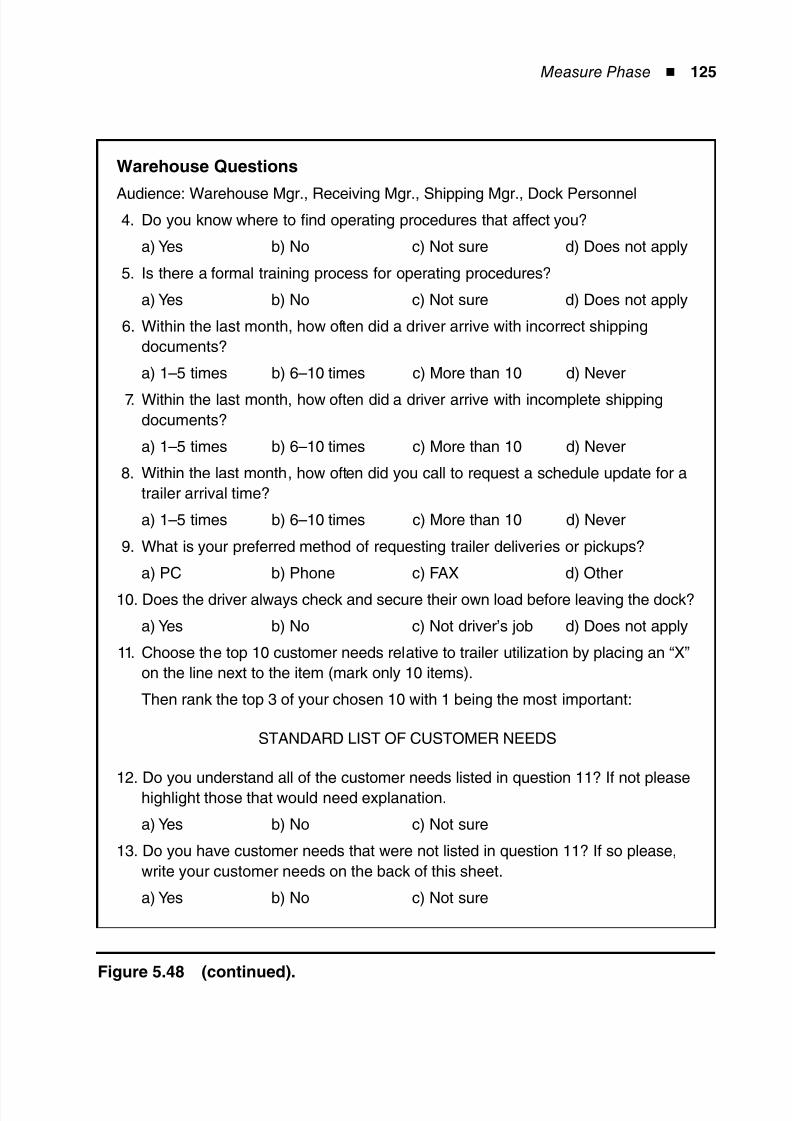
8/12/2019 Implementing Lean Six Sigma Throughout the Supply Chain
http://slidepdf.com/reader/full/implementing-lean-six-sigma-throughout-the-supply-chain 142/278
Measure Phase ◾ 125
Warehouse Questions
Audience: Warehouse Mgr., Receiving Mgr., Shipping Mgr., Dock Personnel 4. Do you know where to find operating procedures that affect you?
a) Yes b) No c) Not sure d) Does not apply
5. Is there a formal training process for operating procedures?
a) Yes b) No c) Not sure d) Does not apply
6. Within the last month, how often did a driver arrive with incorrect shipping
documents?
a) 1–5 times b) 6–10 times c) More than 10 d) Never
7. Within the last month, how often did a driver arrive with incomplete shipping
documents?
a) 1–5 times b) 6–10 times c) More than 10 d) Never
8. Within the last month, how often did you call to request a schedule update for a
trailer arrival time?
a) 1–5 times b) 6–10 times c) More than 10 d) Never
9. What is your preferred method of requesting trailer deliveries or pickups?
a) PC b) Phone c) FAX d) Other
10. Does the driver always check and secure their own load before leaving the dock?
a) Yes b) No c) Not driver’s job d) Does not apply
11. Choose the top 10 customer needs relative to trailer utilization by placing an “X”
on the line next to the item (mark only 10 items).
Then rank the top 3 of your chosen 10 with 1 being the most important:
STANDARD LIST OF CUSTOMER NEEDS
12. Do you understand all of the customer needs listed in question 11? If not pleasehighlight those that would need explanation.
a) Yes b) No c) Not sure
13. Do you have customer needs that were not listed in question 11? If so please,
write your customer needs on the back of this sheet.
a) Yes b) No c) Not sure
Figure 5.48 (continued).
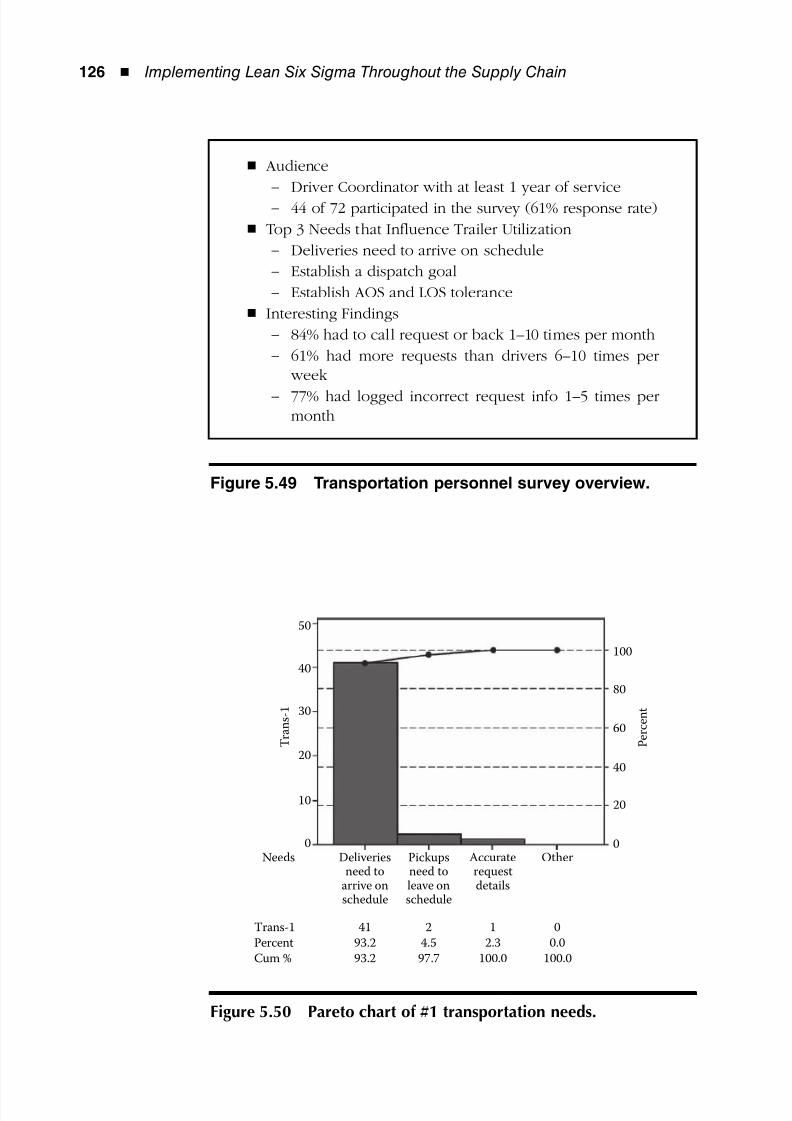
8/12/2019 Implementing Lean Six Sigma Throughout the Supply Chain
http://slidepdf.com/reader/full/implementing-lean-six-sigma-throughout-the-supply-chain 143/278
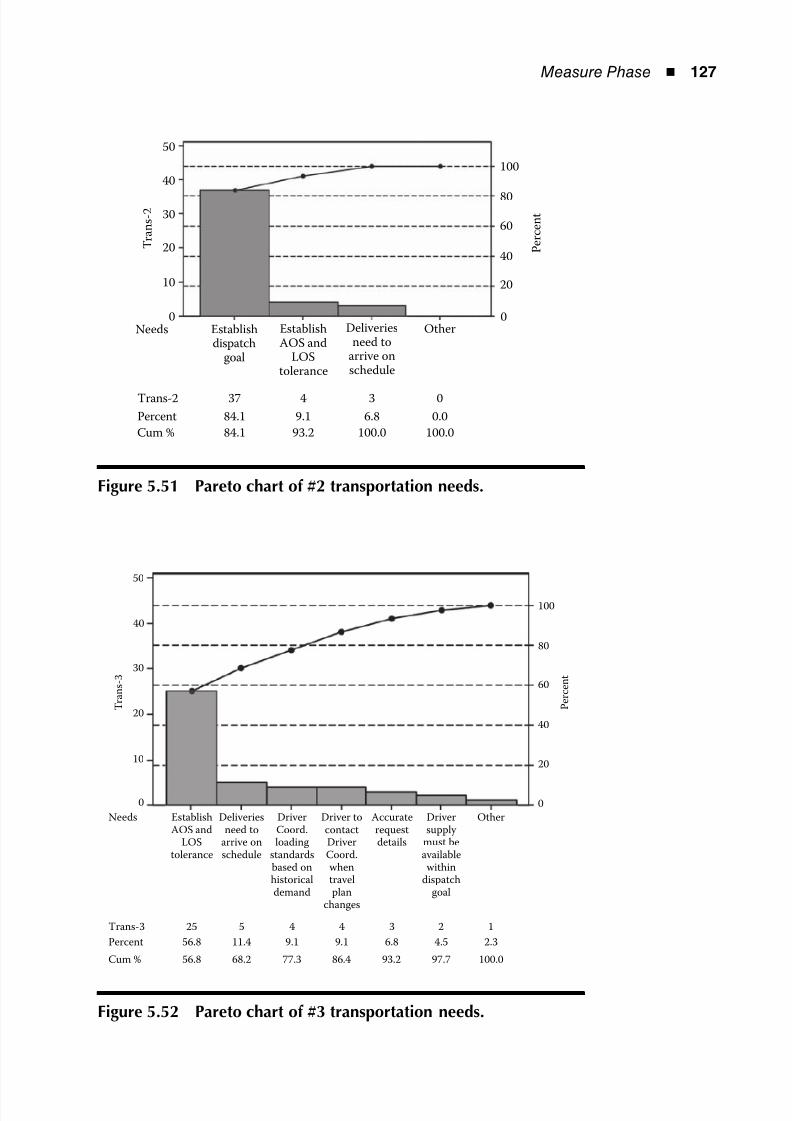
8/12/2019 Implementing Lean Six Sigma Throughout the Supply Chain
http://slidepdf.com/reader/full/implementing-lean-six-sigma-throughout-the-supply-chain 144/278
Measure Phase ◾ 127
50
40
30
20
10
0
40
60
80
100
P e r c e n t
T r a n s - 2
20
0Needs Establish
dispatchgoal
EstablishAOS and
LOStolerance
Deliveriesneed to
arrive onschedule
Other
Trans-2
Percent
Cum %
37
84.1
84.1
4
9.1
93.2
3
6.8
100.0
0
100.0
0.0
Figure 5.51 Pareto chart of #2 transportation needs.
50
40
30
20
10
Needs EstablishAOS and
LOStolerance
Deliveriesneed to
arrive onschedule
DriverCoord.loading
standardsbased onhistoricaldemand
Driver tocontactDriverCoord.whentravelplan
changes
Accuraterequestdetails
Driversupply
must beavailablewithin
dispatchgoal
Other
0 0
20
40
60
80
100
P e r c e n t
T r a n s - 3
Trans-3
Percent
Cum %
25
56.8
56.8
5
11.4
68.2
9.1
44 2
9.1 6.8
77.3 86.4 93.2
2.3
100.097.7
4.5
3 1
Figure 5.52 Pareto chart of #3 transportation needs.
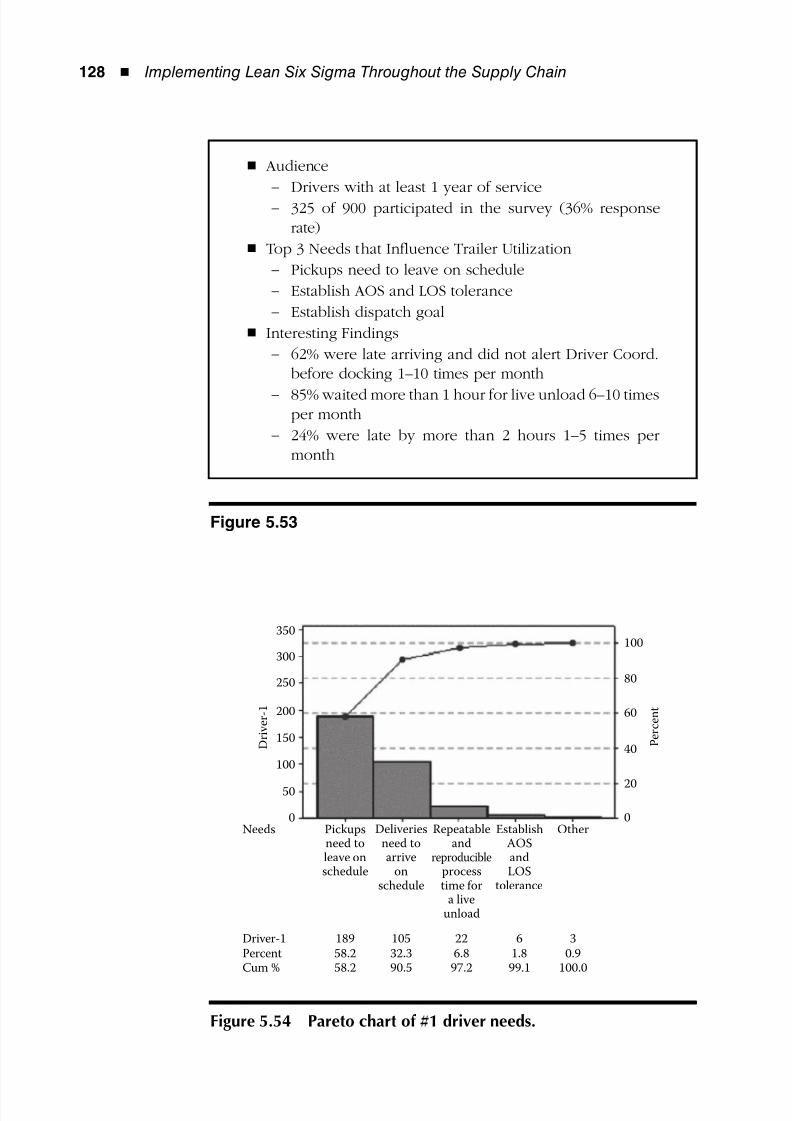
8/12/2019 Implementing Lean Six Sigma Throughout the Supply Chain
http://slidepdf.com/reader/full/implementing-lean-six-sigma-throughout-the-supply-chain 145/278
128 ◾ Implementing Lean Six Sigma Throughout the Supply Chain
350
300
250
200
150
100
50
0 0
20
40
60
80
100
P e r c e n t
D r i v e r - 1
Needs Pickupsneed toleave onschedule
Driver-1
PercentCum %
189
58.258.2
105
32.390.5
22
6.897.2
6
1.899.1
3
0.9100.0
Deliveriesneed toarrive
onschedule
Repeatableand
reproducibleprocesstime for
a liveunload
EstablishAOSandLOS
tolerance
Other
Figure 5.54 Pareto chart of #1 driver needs.
Audience◾
Drivers with at least 1 year of service−
325 of 900 participated in the survey (36% response−
rate)
Top 3 Needs that Influence Trailer Utilization◾
Pickups need to leave on schedule−
Establish AOS and LOS tolerance−
Establish dispatch goal−
Interesting Findings◾
62% were late arriving and did not alert Driver Coord.−
before docking 1–10 times per month
85% waited more than 1 hour for live unload 6–10 times−
per month
24% were late by more than 2 hours 1–5 times per−
month
Figure 5.53
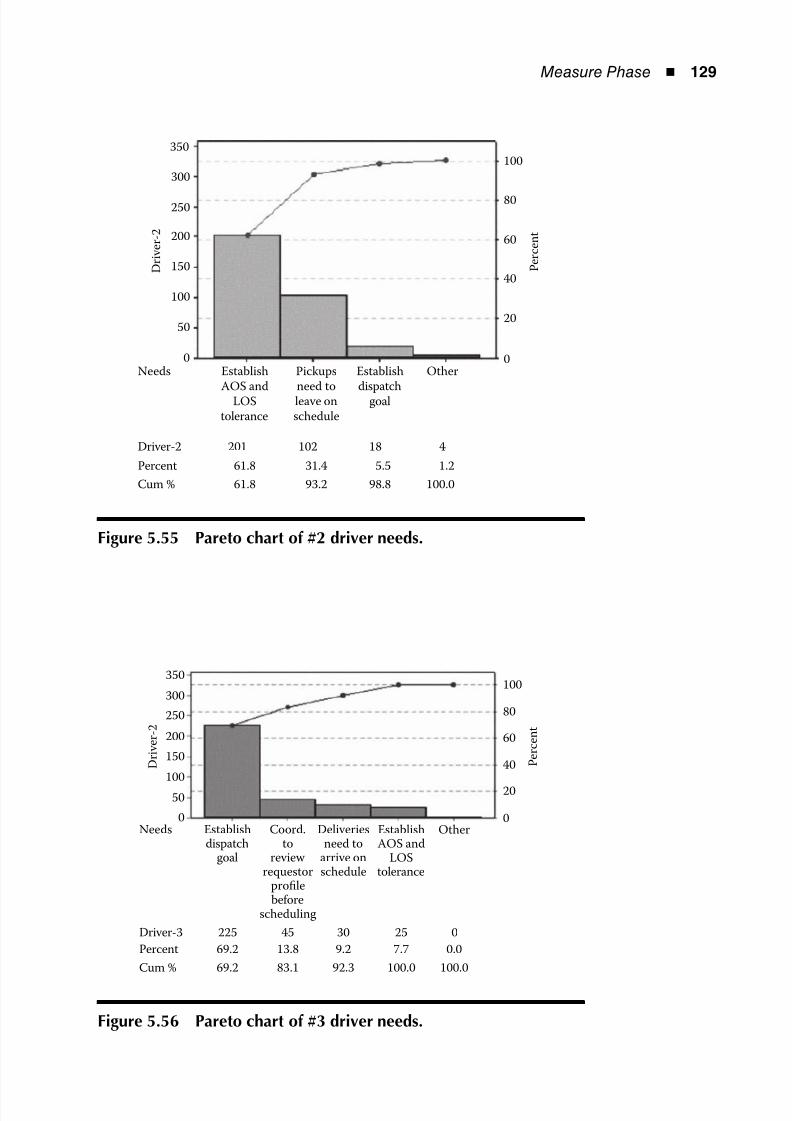
8/12/2019 Implementing Lean Six Sigma Throughout the Supply Chain
http://slidepdf.com/reader/full/implementing-lean-six-sigma-throughout-the-supply-chain 146/278
Measure Phase ◾ 129
350
300
250
200
150
100
50
0 0
20
40
60
80
100
P e r c e n t
D r i v e r - 2
Needs Pickups
need toleave onschedule
Establish
dispatchgoal
Driver-2
Percent
Cum %
201
61.8
61.8
102
31.4
93.2
18
5.5
98.8
4
1.2
100.0
Establish
AOS andLOStolerance
Other
Figure 5.55 Pareto chart of #2 driver needs.
350
300
250
200
150
100
50
0 0
20
40
60
80
100
P e r c e n t
D r i v e r - 2
Needs Coord.to
review requestor
profilebefore
scheduling
Deliveriesneed to
arrive onschedule
Establishdispatch
goal
Driver-3
Percent
Cum %
225
69.2
69.2
45
13.8
83.1
30
9.2
92.3
25
7.7
100.0
0
0.0
100.0
EstablishAOS and
LOStolerance
Other
Figure 5.56 Pareto chart of #3 driver needs.
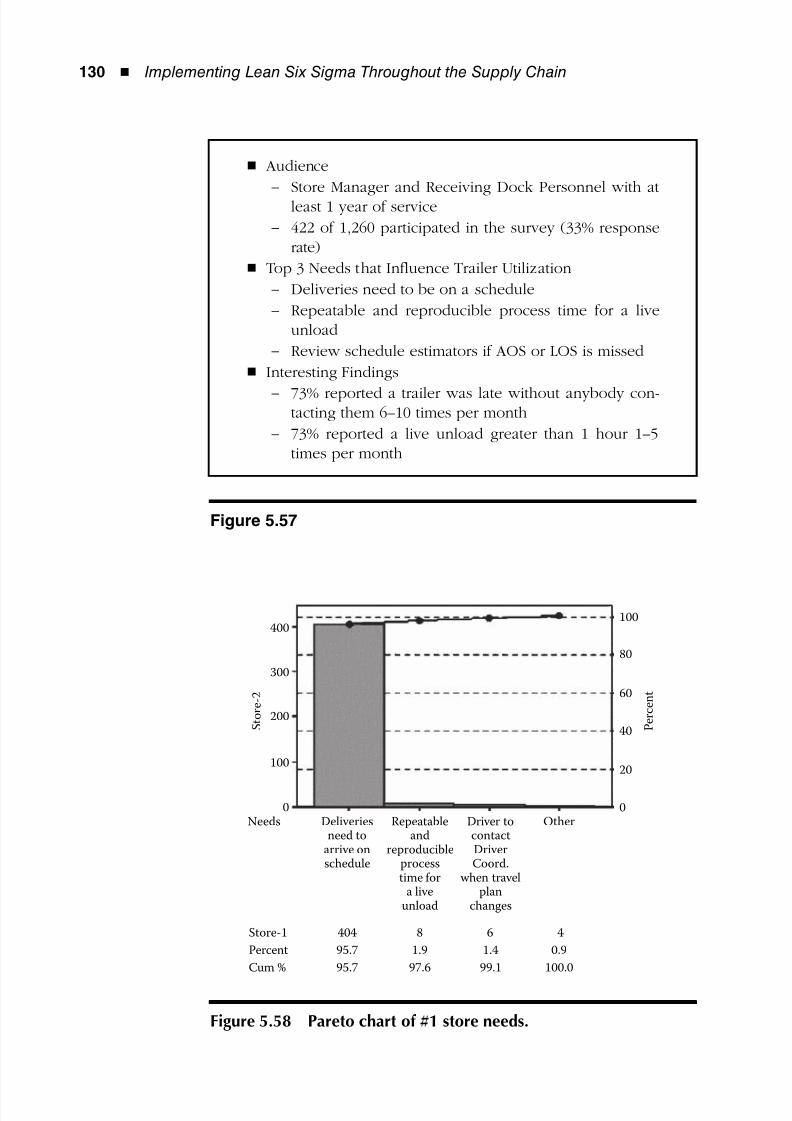
8/12/2019 Implementing Lean Six Sigma Throughout the Supply Chain
http://slidepdf.com/reader/full/implementing-lean-six-sigma-throughout-the-supply-chain 147/278
130 ◾ Implementing Lean Six Sigma Throughout the Supply Chain
300
400
200
100
0 0
20
40
60
80
100
P e r c e n t
S t o r e -
2
Needs Repeatableand
reproducibleprocesstime for
a liveunload
Driver tocontactDriverCoord.
when travelplan
changes
Store-1
Percent
Cum %
404
95.7
95.7
8
1.9
97.6
6
1.4
99.1
4
0.9
100.0
Deliveriesneed to
arrive onschedule
Other
Figure 5.58 Pareto chart of #1 store needs.
Audience◾
Store Manager and Receiving Dock Personnel with at−
least 1 year of service
422 of 1,260 participated in the survey (33% response−
rate)
Top 3 Needs that Influence Trailer Utilization◾
Deliveries need to be on a schedule−
Repeatable and reproducible process time for a live−
unload
Review schedule estimators if AOS or LOS is missed−
Interesting Findings◾
73% reported a trailer was late without anybody con-−
tacting them 6–10 times per month
73% reported a live unload greater than 1 hour 1–5−
times per month
Figure 5.57
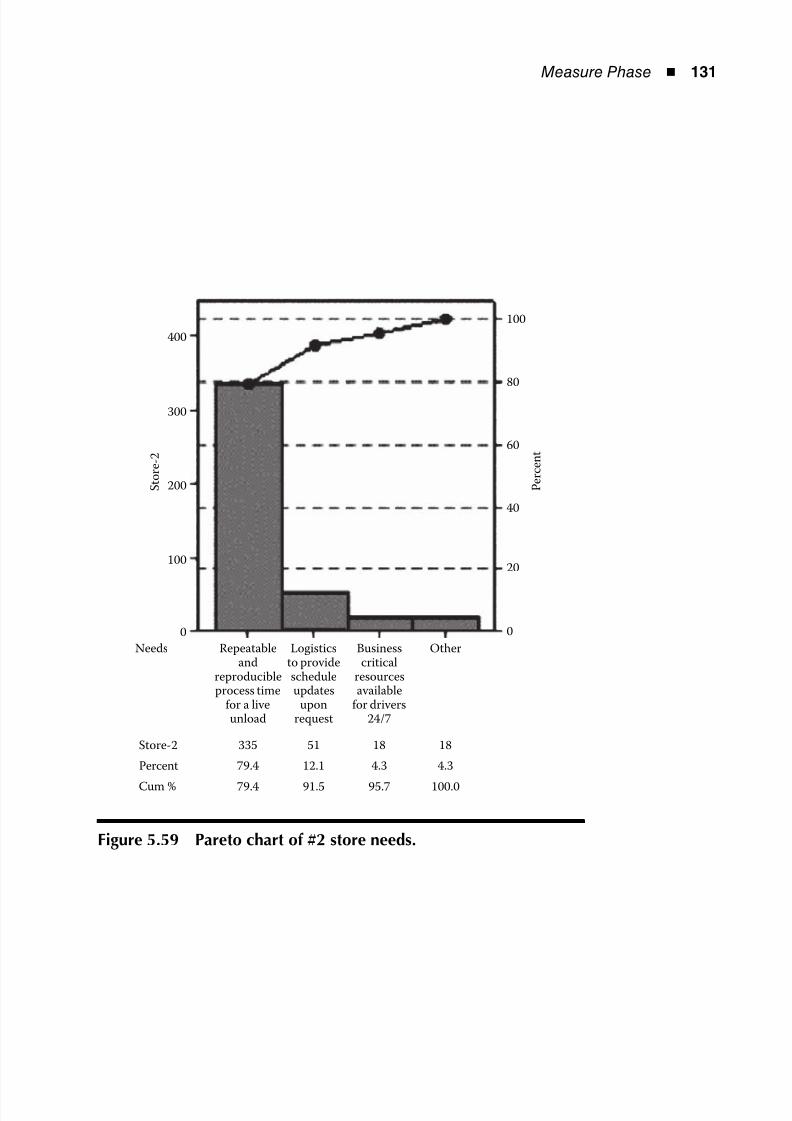
8/12/2019 Implementing Lean Six Sigma Throughout the Supply Chain
http://slidepdf.com/reader/full/implementing-lean-six-sigma-throughout-the-supply-chain 148/278
Measure Phase ◾ 131
400
300
200
100
0 0
20
40
60
80
100
P e r c e n t
S t o r e -
2
Needs
Store-2
Percent
Cum %
335
79.4
79.4
51
12.1
91.5
18
95.7
4.3
18
4.3
100.0
Repeatableand
reproducibleprocess time
for a liveunload
Logisticsto providescheduleupdates
uponrequest
Businesscritical
resourcesavailable
for drivers24/7
Other
Figure 5.59 Pareto chart of #2 store needs.
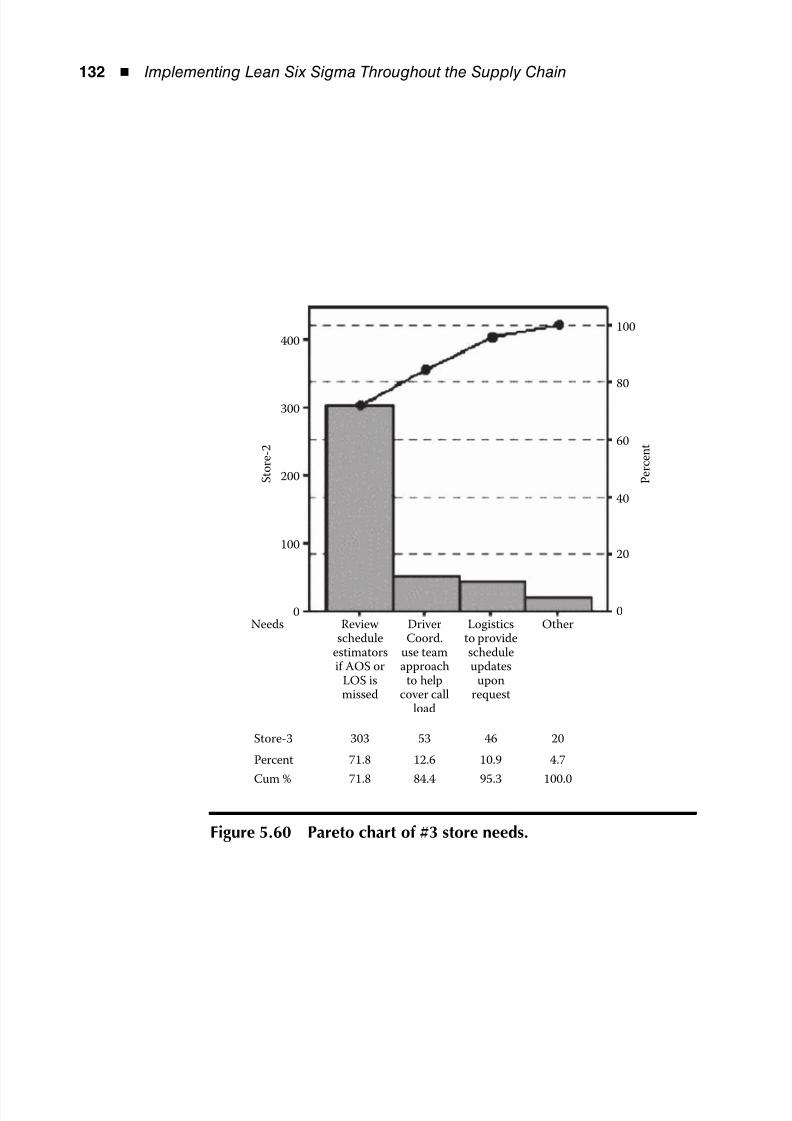
8/12/2019 Implementing Lean Six Sigma Throughout the Supply Chain
http://slidepdf.com/reader/full/implementing-lean-six-sigma-throughout-the-supply-chain 149/278
132 ◾ Implementing Lean Six Sigma Throughout the Supply Chain
400
300
200
100
0 0
20
40
60
80
100
P e r c e n t
S t o r e -
2
Needs
Store-3
Percent
Cum %
303
71.8
71.8
53
12.6
84.4
46
95.3
10.9
20
4.7
100.0
Review schedule
estimatorsif AOS or
LOS ismissed
Logisticsto providescheduleupdates
uponrequest
DriverCoord.
use teamapproach
to helpcover call
load
Other
Figure 5.60 Pareto chart of #3 store needs.
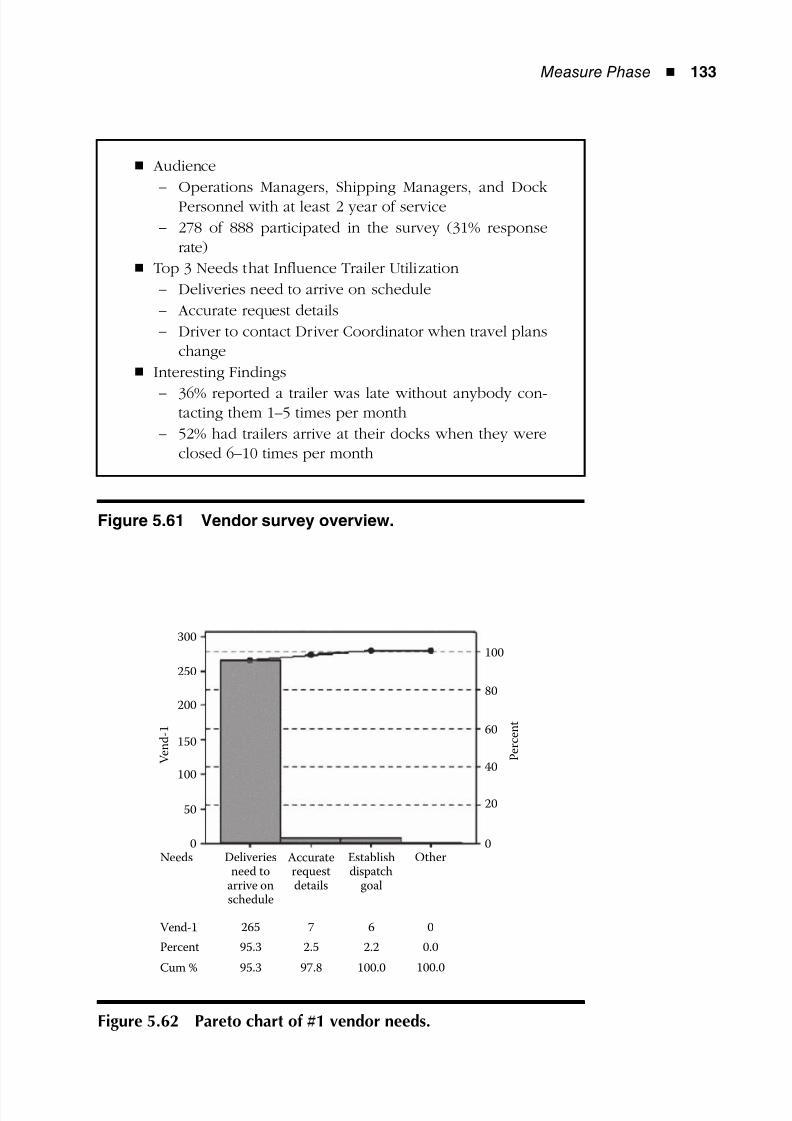
8/12/2019 Implementing Lean Six Sigma Throughout the Supply Chain
http://slidepdf.com/reader/full/implementing-lean-six-sigma-throughout-the-supply-chain 150/278
Measure Phase ◾ 133
Audience◾
Operations Managers, Shipping Managers, and Dock−
Personnel with at least 2 year of service
278 of 888 participated in the survey (31% response−
rate)
Top 3 Needs that Influence Trailer Utilization◾
Deliveries need to arrive on schedule−
Accurate request details−
Driver to contact Driver Coordinator when travel plans−
change
Interesting Findings◾
36% reported a trailer was late without anybody con-−
tacting them 1–5 times per month
52% had trailers arrive at their docks when they were−
closed 6–10 times per month
Figure 5.61 Vendor survey overview.
250
300
200
100
50
150
0 0
20
40
60
80
100
P e r c e n t
V e n d - 1
Vend-1
Needs Accuraterequestdetails
Establishdispatch
goal
Percent
Cum %
265
95.3
95.3
7
2.5
97.8
6
2.2
100.0
0
0.0
100.0
Deliveriesneed to
arrive onschedule
Other
Figure 5.62 Pareto chart of #1 vendor needs.
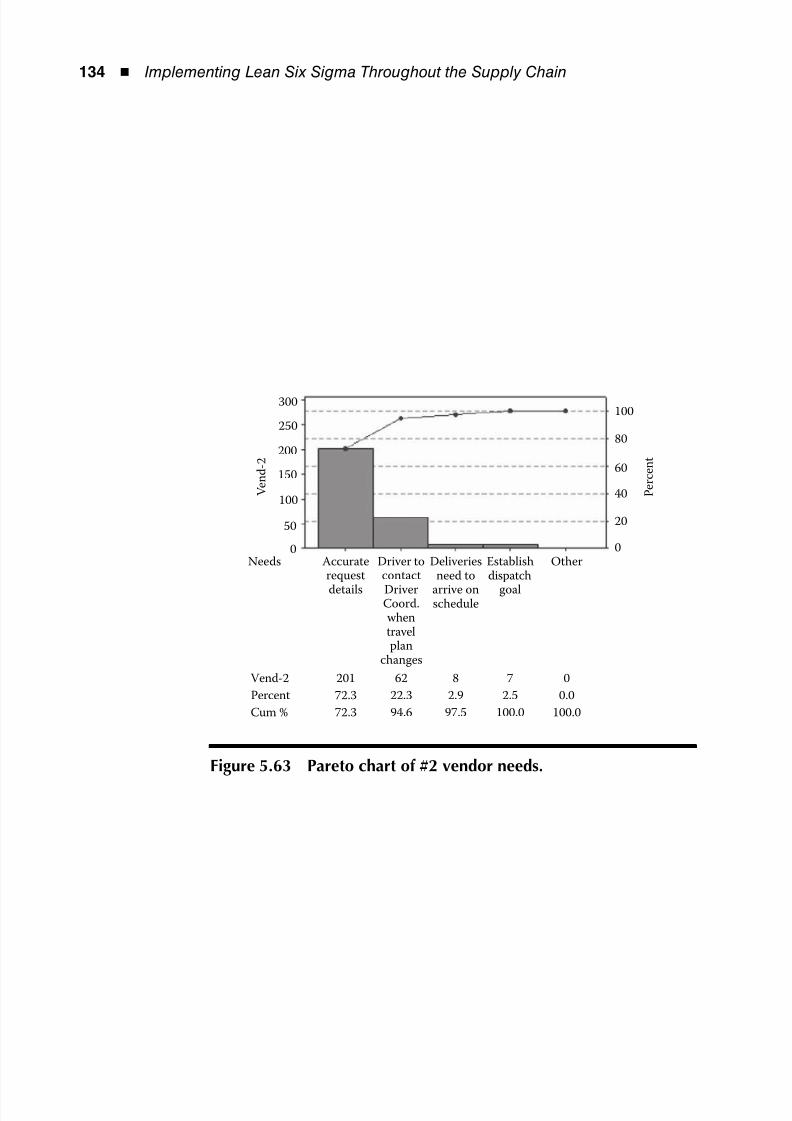
8/12/2019 Implementing Lean Six Sigma Throughout the Supply Chain
http://slidepdf.com/reader/full/implementing-lean-six-sigma-throughout-the-supply-chain 151/278
134 ◾ Implementing Lean Six Sigma Throughout the Supply Chain
250
300
200
150
100
0
50
0
20
40
60
80
100
P e r c e n t
V e n d - 2
Needs Accuraterequest
details
Driver tocontact
DriverCoord.whentravelplan
changes
Vend-2
Percent
Cum %
201
72.3
72.3
62
22.3
94.6
8
2.9
97.5
7 0
0.0
100.0
2.5
100.0
Deliveriesneed to
arrive onschedule
Establishdispatch
goal
Other
Figure 5.63 Pareto chart of #2 vendor needs.
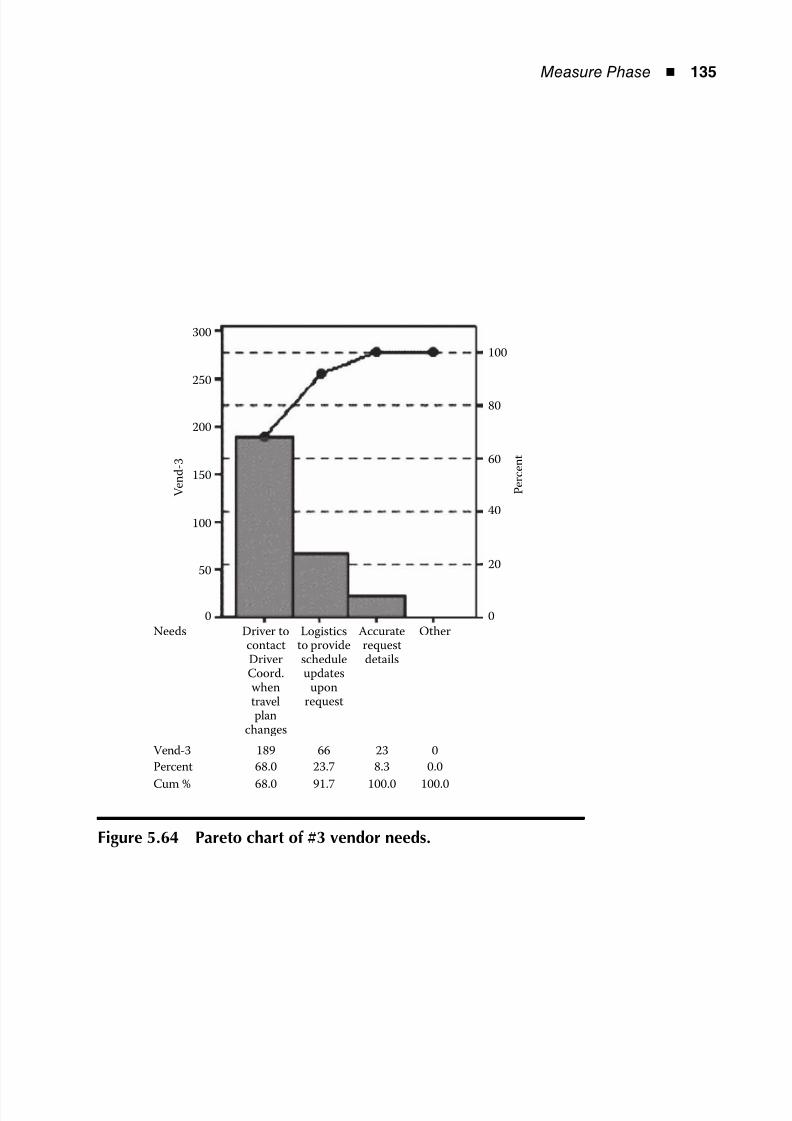
8/12/2019 Implementing Lean Six Sigma Throughout the Supply Chain
http://slidepdf.com/reader/full/implementing-lean-six-sigma-throughout-the-supply-chain 152/278
Measure Phase ◾ 135
250
300
200
150
100
0
50
0
20
40
60
80
100
P e r c e n t
V e n d - 3
Needs Driver tocontactDriverCoord.whentravelplan
changes
Vend-3
Percent
Cum %
189
68.0
68.0
66
23.7
91.7
23
8.3
100.0
0
0.0
100.0
Logisticsto providescheduleupdates
uponrequest
Accuraterequestdetails
Other
Figure 5.64 Pareto chart of #3 vendor needs.
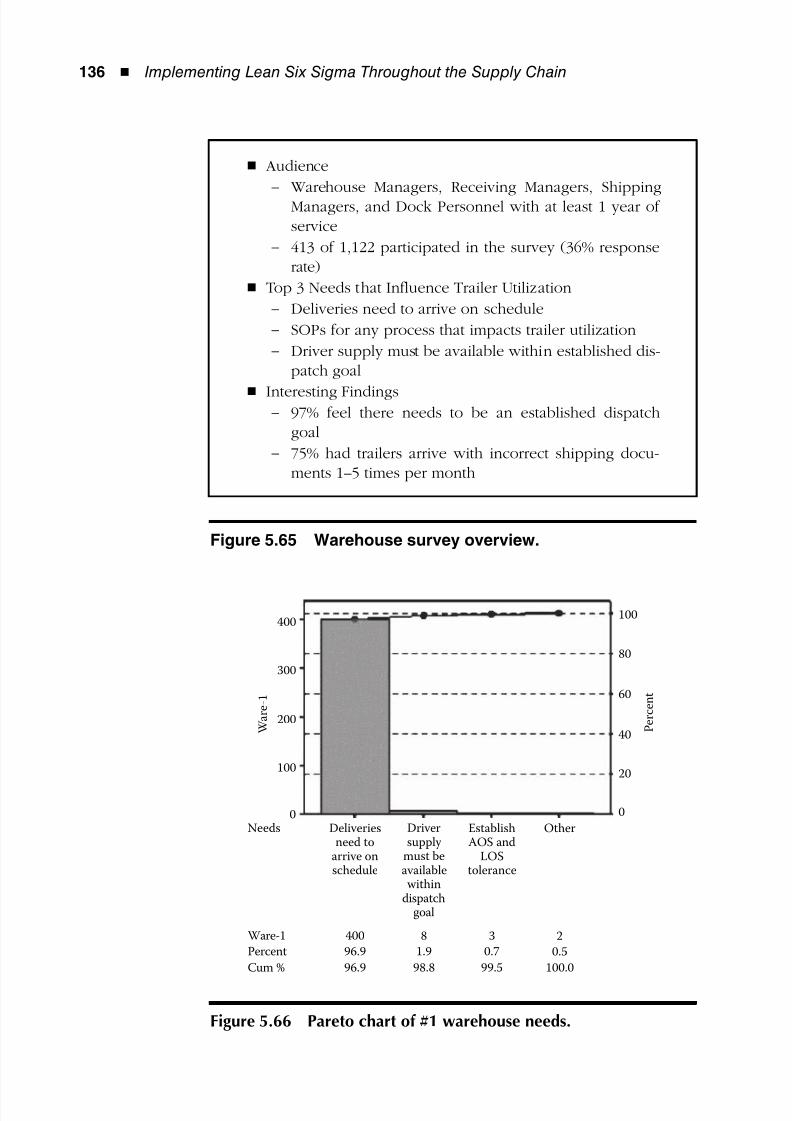
8/12/2019 Implementing Lean Six Sigma Throughout the Supply Chain
http://slidepdf.com/reader/full/implementing-lean-six-sigma-throughout-the-supply-chain 153/278
136 ◾ Implementing Lean Six Sigma Throughout the Supply Chain
300
400
200
100
0 0
20
40
60
80
100
P e r c e n t
W a r e - 1
Needs Driversupply
must beavailablewithin
dispatchgoal
Ware-1
Percent
Cum %
400
96.9
96.9
8
1.9
98.8
3
0.7
99.5
2
0.5
100.0
Deliveriesneed to
arrive onschedule
EstablishAOS and
LOStolerance
Other
Figure 5.66 Pareto chart of #1 warehouse needs.
Audience◾
Warehouse Managers, Receiving Managers, Shipping−
Managers, and Dock Personnel with at least 1 year ofservice
413 of 1,122 participated in the survey (36% response−
rate)
Top 3 Needs that Influence Trailer Utilization◾
Deliveries need to arrive on schedule−
SOPs for any process that impacts trailer utilization−
Driver supply must be available within established dis-−
patch goal
Interesting Findings◾
97% feel there needs to be an established dispatch−
goal
75% had trailers arrive with incorrect shipping docu-−
ments 1–5 times per month
Figure 5.65 Warehouse survey overview.
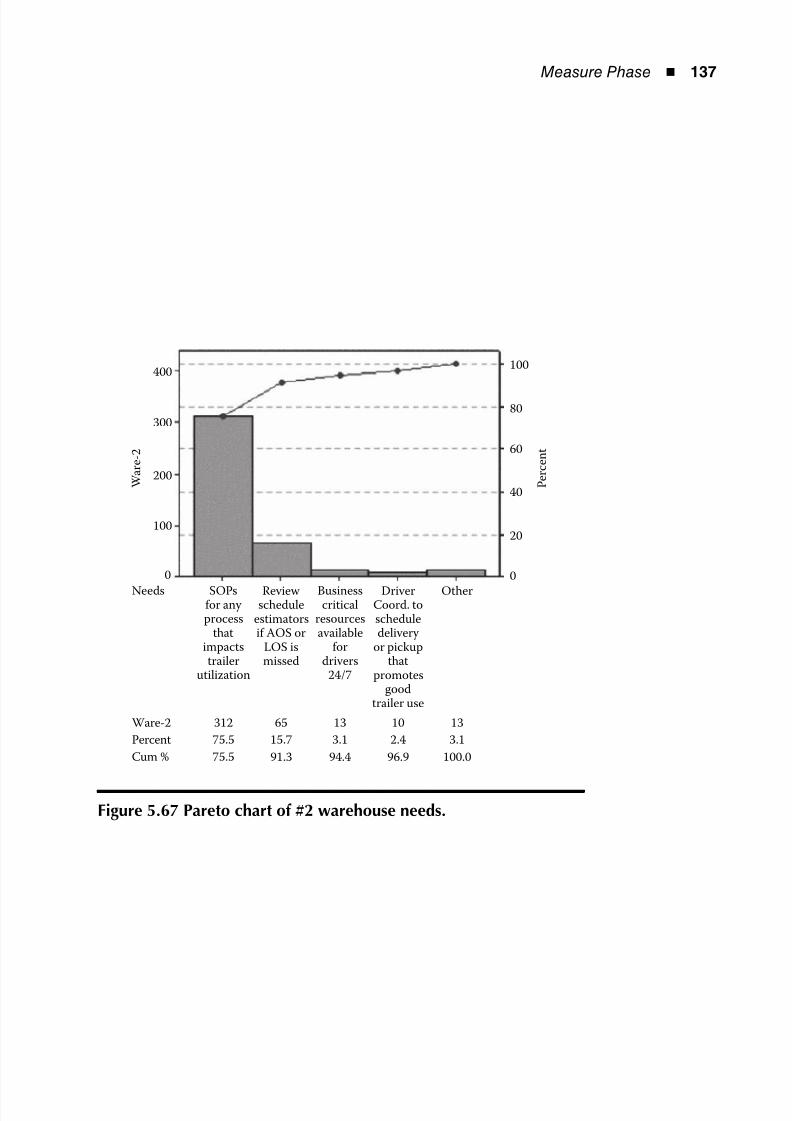
8/12/2019 Implementing Lean Six Sigma Throughout the Supply Chain
http://slidepdf.com/reader/full/implementing-lean-six-sigma-throughout-the-supply-chain 154/278
Measure Phase ◾ 137
300
400
200
100
00
20
40
60
80
100
P e r c e n t
W a r e - 2
Needs SOPsfor any process
thatimpactstrailer
utilization
Businesscritical
resourcesavailable
fordrivers
24/7
Ware-2
Percent
Cum %
312
75.5
75.5
65
15.7
91.3
13
3.1
94.4
10 13
3.1
100.0
2.4
96.9
Review schedule
estimatorsif AOS or
LOS ismissed
DriverCoord. toscheduledelivery
or pickupthat
promotesgood
trailer use
Other
Figure 5.67 Pareto chart of #2 warehouse needs.
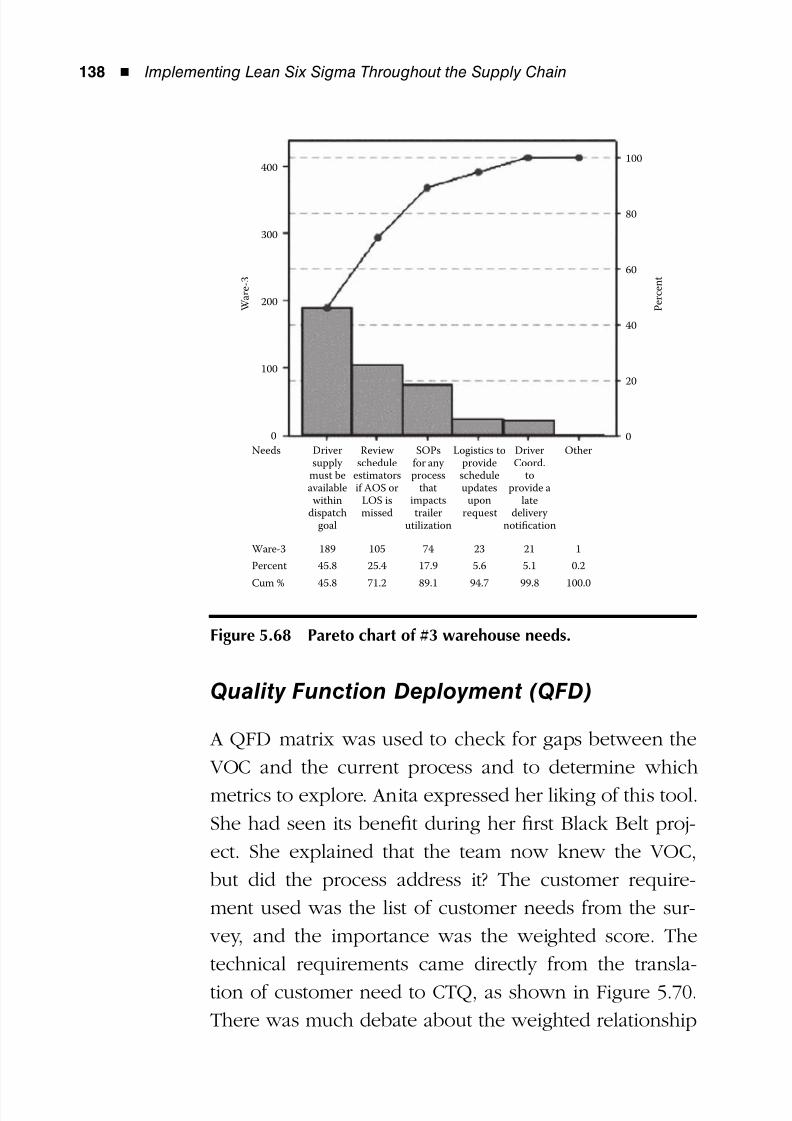
8/12/2019 Implementing Lean Six Sigma Throughout the Supply Chain
http://slidepdf.com/reader/full/implementing-lean-six-sigma-throughout-the-supply-chain 155/278
138 ◾ Implementing Lean Six Sigma Throughout the Supply Chain
Quality Function Deployment (QFD)
A QFD matrix was used to check for gaps between the
VOC and the current process and to determine which
metrics to explore. Anita expressed her liking of this tool.
She had seen its benefit during her first Black Belt proj-
ect. She explained that the team now knew the VOC,
but did the process address it? The customer require-
ment used was the list of customer needs from the sur-
vey, and the importance was the weighted score. The
technical requirements came directly from the transla-
tion of customer need to CTQ, as shown in Figure 5.70.
There was much debate about the weighted relationship
300
400
200
100
00
20
40
60
80
100
P e r c e n t
W a r e - 3
Needs Driversupply
must beavailablewithin
dispatchgoal
Ware-3
Percent
Cum %
189
45.8
45.8
105
25.4
71.2
74
17.9
89.1
23 21
5.1
99.8
1
0.2
100.0
5.6
94.7
OtherSOPsfor any process
thatimpactstrailer
utilization
Logistics toprovide
scheduleupdates
uponrequest
Review schedule
estimatorsif AOS or
LOS ismissed
DriverCoord.
toprovide a
latedelivery
notification
Figure 5.68 Pareto chart of #3 warehouse needs.
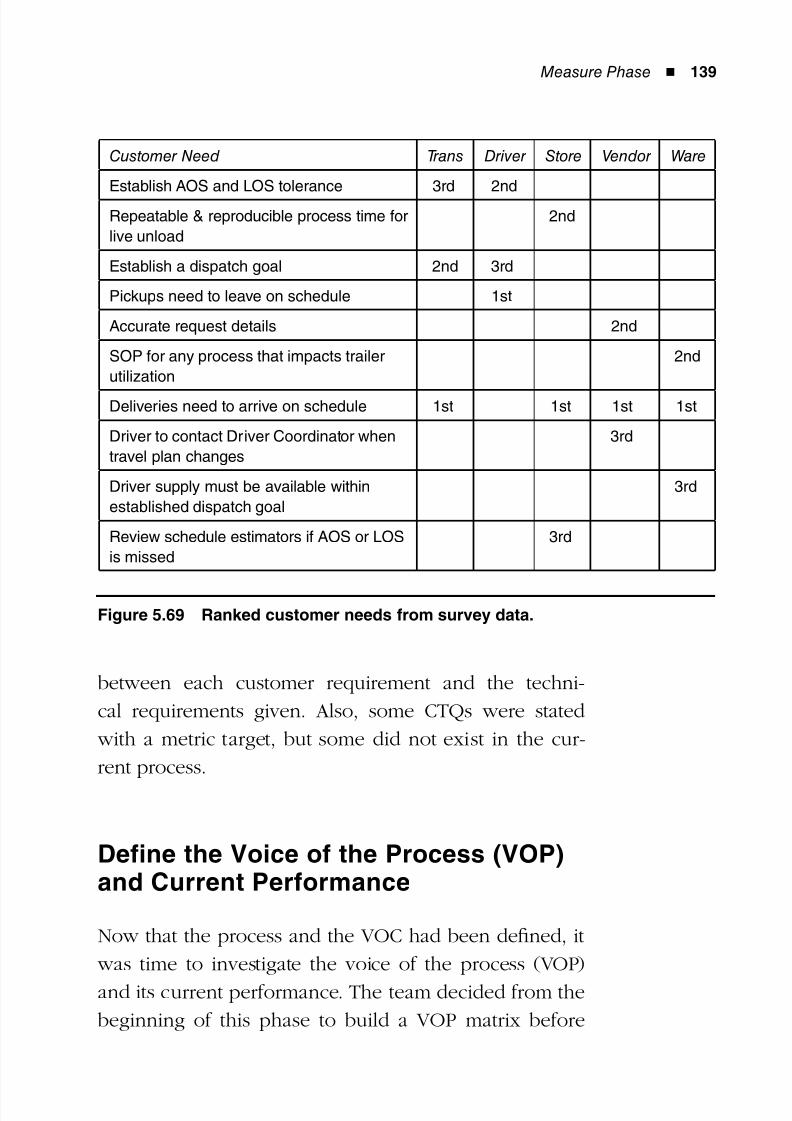
8/12/2019 Implementing Lean Six Sigma Throughout the Supply Chain
http://slidepdf.com/reader/full/implementing-lean-six-sigma-throughout-the-supply-chain 156/278
Measure Phase ◾ 139
between each customer requirement and the techni-
cal requirements given. Also, some CTQs were stated
with a metric target, but some did not exist in the cur-
rent process.
Define the Voice of the Process (VOP)and Current Performance
Now that the process and the VOC had been defined, it
was time to investigate the voice of the process (VOP)
and its current performance. The team decided from the
beginning of this phase to build a VOP matrix before
Customer Need Trans Driver Store Vendor Ware
Establish AOS and LOS tolerance 3rd 2nd
Repeatable & reproducible process time for
live unload
2nd
Establish a dispatch goal 2nd 3rd
Pickups need to leave on schedule 1st
Accurate request details 2nd
SOP for any process that impacts trailer
utilization
2nd
Deliveries need to arrive on schedule 1st 1st 1st 1st
Driver to contact Driver Coordinator when
travel plan changes
3rd
Driver supply must be available within
established dispatch goal
3rd
Review schedule estimators if AOS or LOS
is missed
3rd
Figure 5.69 Ranked customer needs from survey data.
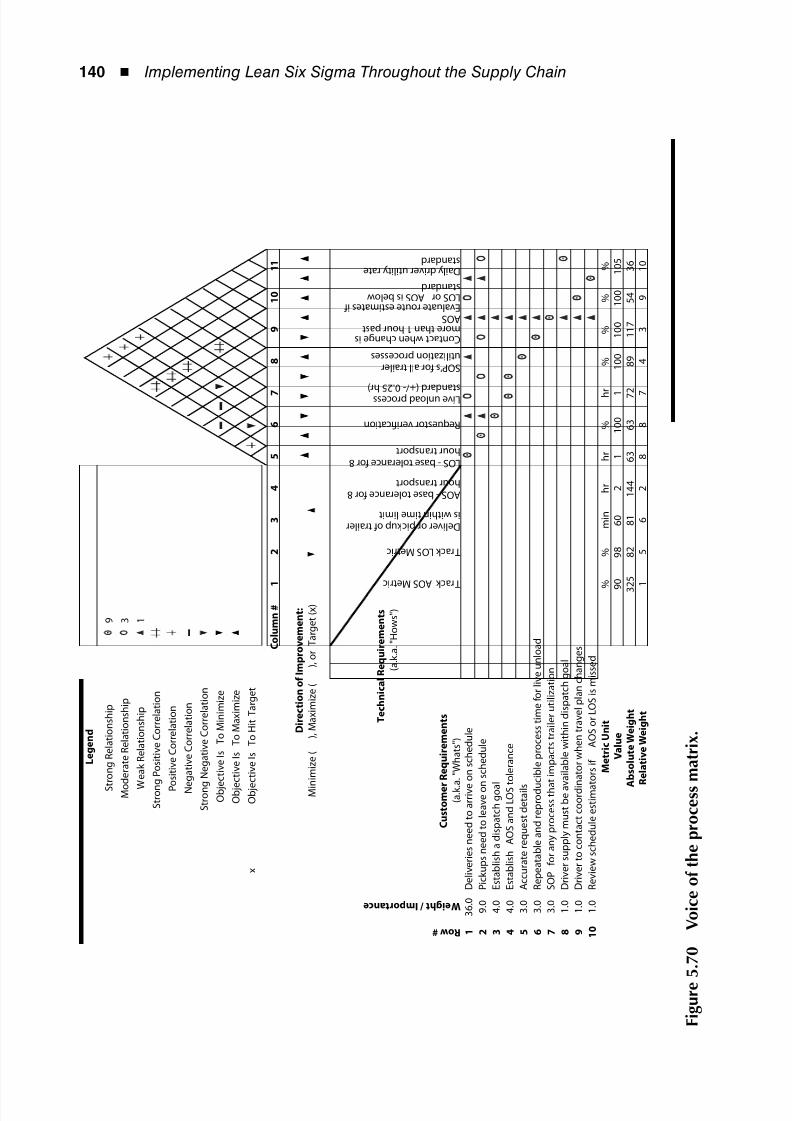
8/12/2019 Implementing Lean Six Sigma Throughout the Supply Chain
http://slidepdf.com/reader/full/implementing-lean-six-sigma-throughout-the-supply-chain 157/278
140 ◾ Implementing Lean Six Sigma Throughout the Supply Chain
1
3 6 . 0
2
9 . 0
3
4 . 0
4
4 . 0
5
3 . 0
6
3 . 0
7
3 . 0
8
1 . 0
9
1 . 0
1 0
1 . 0
x
O b j e
c t i v e I s T o H i t T a r g e t
N e
g a t i v e C o r r e l a t i o n
O b j e
c t i v e I s T o M a x i m i z e
S t r o n g
N e g a t i v e C o r r e l a t i o n
O b j e
c t i v e I s T o M i n i m i z e
W
e a k R e l a t i o n s h i p
1
S t r o n g P o s i t i v e C o r r e l a t i o n
L e g e n d
S t
r o n g R e l a t i o n s h i p
9
M o d e r a t e R e l a t i o n s h i p
3
T e c h n i c a l R e q u i r e m e n t s
( a . k . a . " H o w s " )
P o
s i t i v e C o r r e l a t i o n
4
3
9
1 0
8
8
7
2
R e l a t i v e W e i g h t
1
5
6
8 9
3 6
6 3
6 3
7 2
h r
%
%
A
b s o l u t e W e i g h t
3 2 5
8 2
8 1
1 4 4
1 1 7
5 4
M e t r i c U n i t
%
%
m i n
h r
h r
%
%
%
R e v i e w s c h e d u l e e s t i m a t o r s i f
A O S o r L O S i s m i s s e d
D r i v e r t o c o n t a c t c o o r d i n
a t o r w h e n t r a v e l p l a n c h a n g e s
D r i v e r s u p p l y m u s t b e a v
a i l a b l e w i t h i n d i s p a t c h g o a l
S O P f o r a n y p r o c e s s t h a
t i m p a c t s t r a i l e r u t i l i z a t i o n
R e p e a t a b l e a n d r e p r o d u
c i b l e p r o c e s s t i m e f o r l i v e u n l o a d
A c c u r a t e r e q u e s t d e t a i l s
E s t a b l i s h
A O S a n d L O S t o l e r a n c e
E s t a b l i s h a d i s p a t c h g o a l
C o n t a c t w h e n c h a n g e i s m o r e t h a n 1 h o u r p a s t A O S E v a l u a t e r o u t e e s t i m a t e s i f L O S o r A O S i s b e l o w s t a n d a r d
D a i l y d r i v e r u t i l i t y r a t e s t a n d a r d
P i c k u p s n e e d t o l e a v e o n
s c h e d u l e
D e l i v e r i e s n e e d t o a r r i v e
o n s c h e d u l e
L O S - b a s e t o l e r a n c e f o r 8 h o u r t r a n s p o r t
R e q u e s t o r v e r i fi c a t i o n
L i v e u n l o a d p r o c e s s s t a n d a r d ( + / - 0 . 2 5 h r )
D e l i v e r o r p i c k u p o f t r a i l e r i s w i t h i n t i m e l i m i t
A O S - b a s e t o l e r a n c e f o r 8 h o u r t r a n s p o r t
S O P ' s f o r a l l t r a i l e r u t i l i z a t i o n p r o c e s s e s
R o w #
W e i g h t / I m p o r t a n c e
T r a c k A O S M e t r i c
T r a c k L O S M e t r i c
C u s t o m e r
R e q u i r e m e n t s
( a . k . a . " W h a t s " )
D i r e c t i o n o f I m p r o v e m e n t :
M i n
i m i z e (
) , M a x i m i z e (
) , o r T a r g e t ( x )
1 0 5
8
9
1 0
1 1
C o l u m n #
1
2
3
4
5
6
7
1 0 0
1 0 0
1
1 0 0
1 0 0
9 8
6 0
2
1
V a l u e
9
0
F i g u r e
5 . 7
0
V o i c e o f t h e p r o c e s s
m a t r i x .
8/12/2019 Implementing Lean Six Sigma Throughout the Supply Chain
http://slidepdf.com/reader/full/implementing-lean-six-sigma-throughout-the-supply-chain 158/278
Measure Phase ◾ 141
continuing further with the VOP. They brought together
key information from different documents into one sheet
to make reference easier. The CTS and metric data were
brought in from the data-collection plan. This information
was matched with its respective operational definition
(which the team condensed). The team then charted the
factors that impacted the metric and documented the
current target. This sheet became handy, because each
team member had the definition, target, impacting fac-
tors, and CTS relationship for each metric in one place,
as shown in Figure 5.71.
Benchmarking
Simone Fillbert and Joe Thompson took on the role of
researching other industry leaders to find out more about
what made them leaders. This information was then
organized, summarized, and placed in a benchmarking
matrix, as shown in Figure 5.72. The goal was not just to
look at other leaders in retail supply chain management.
They picked leaders of quality processes and wanted to
better understand how each company or business did it
so well. In the end, they found that businesses in a com-
petitive market were consistent in their processes while
offering what the customer really wanted.
Check Sheets
The team needed to collect some data via audits of real
events, so they decided to use check sheets to gather the
data for the trailer status audit and the attribute gauge
repeatability and reproducibility (R&R) for Trailer Log
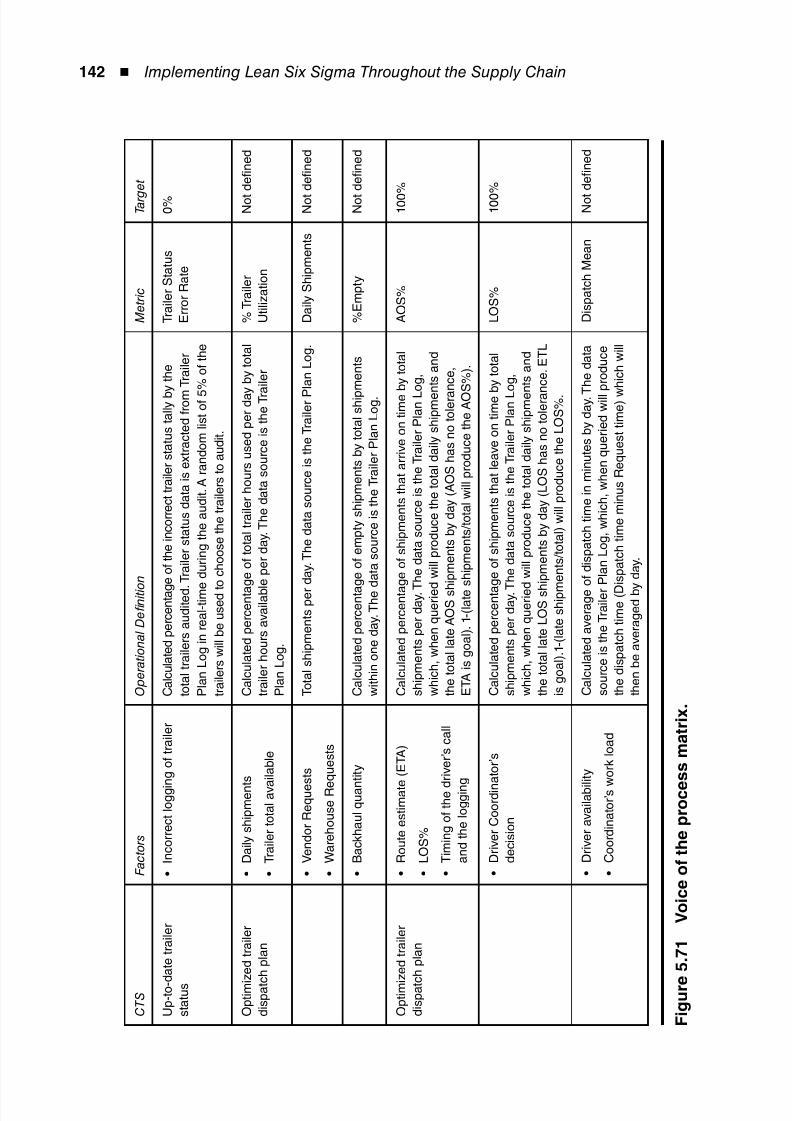
8/12/2019 Implementing Lean Six Sigma Throughout the Supply Chain
http://slidepdf.com/reader/full/implementing-lean-six-sigma-throughout-the-supply-chain 159/278
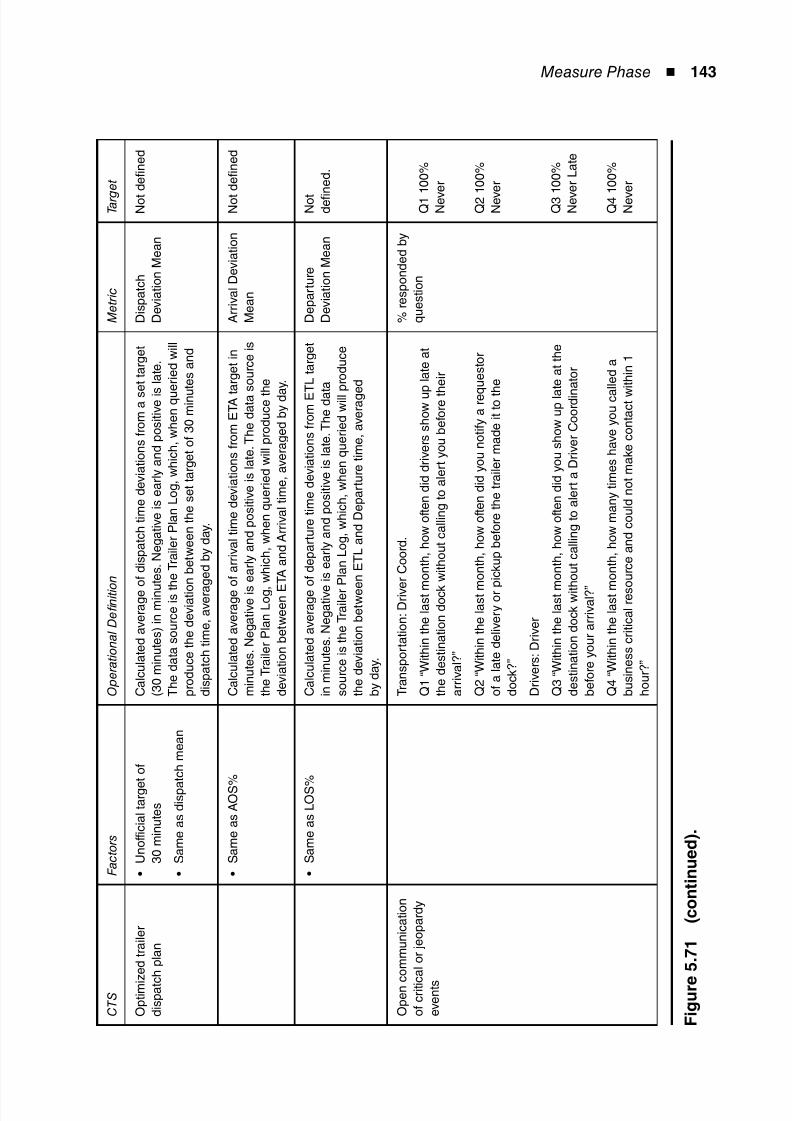
8/12/2019 Implementing Lean Six Sigma Throughout the Supply Chain
http://slidepdf.com/reader/full/implementing-lean-six-sigma-throughout-the-supply-chain 160/278
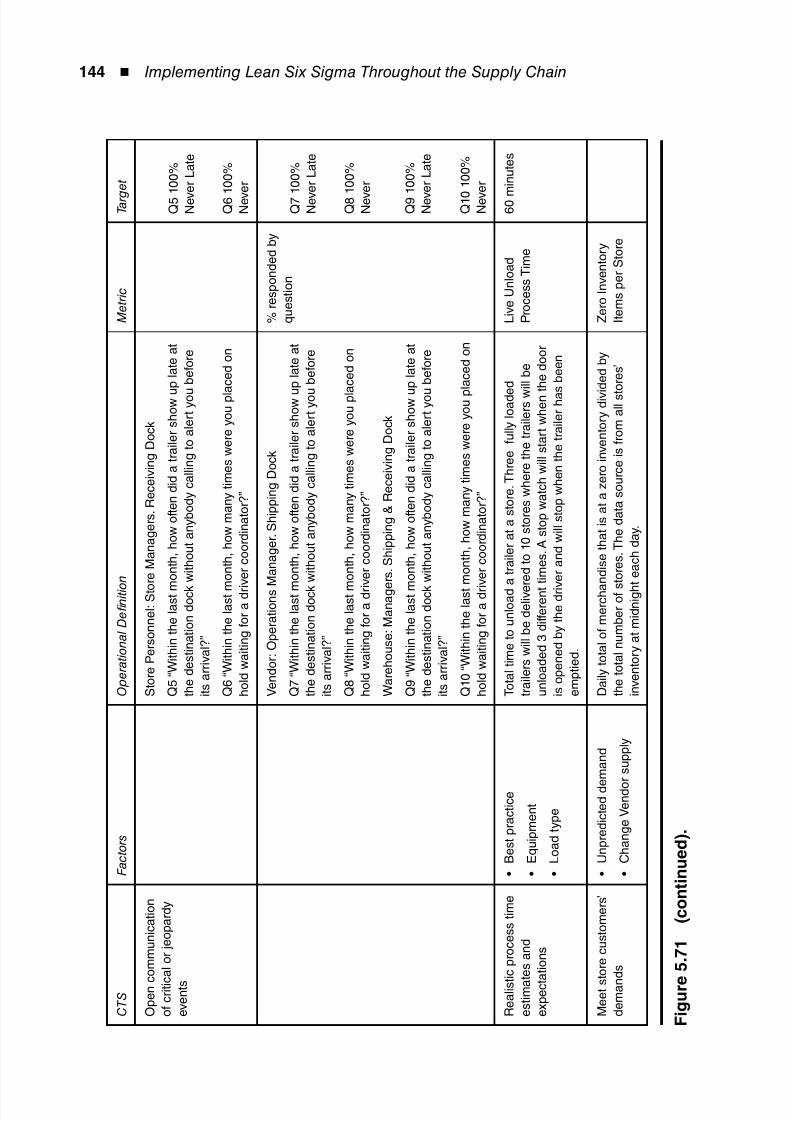
8/12/2019 Implementing Lean Six Sigma Throughout the Supply Chain
http://slidepdf.com/reader/full/implementing-lean-six-sigma-throughout-the-supply-chain 161/278
144 ◾ Implementing Lean Six Sigma Throughout the Supply Chain
C T S
F a c t o r s
O p e r a t i o n a l D e fi n i t i o
n
M e t r i c
T a r g
e t
O p e n c
o m m u n i c a t i o n
o f c r i t i c
a l o r j e o p a r d y
e v e n t s
S t o r e P e r s o n n e l : S t o
r e M a n a g e r s . R e c e i v i n g D o c k
Q 5 “ W i t h i n t h e l a s t m
o n t h , h o w o f t e n d i d a t r a i l e r s h o w u
p l a t e a t
t h e d e s t i n a t i o n d o c k
w i t h o u t a n y b o d y c a l l i n g t o a l e r t y o u
b e f o r e
i t s a r r i v a l ? ”
Q 6 “ W i t h i n t h e l a s t m
o n t h , h o w m a n y t i m e s w e r e y o u p l a
c e d o n
h o l d w a i t i n g f o r a d r i v e r c o o r d i n a t o r ? ”
Q 5 1 0 0 %
N e v
e r L a t e
Q 6 1 0 0 %
N e v
e r
V e n d o r : O p e r a t i o n s M a n a g e r . S h i p p i n g D o c k
Q 7 “ W i t h i n t h e l a s t m
o n t h , h o w o f t e n d i d a t r a i l e r s h o w u
p l a t e a t
t h e d e s t i n a t i o n d o c k
w i t h o u t a n y b o d y c a l l i n g t o a l e r t y o u
b e f o r e
i t s a r r i v a l ? ”
Q 8 “ W i t h i n t h e l a s t m
o n t h , h o w m a n y t i m e s w e r e y o u p l a
c e d o n
h o l d w a i t i n g f o r a d r i v e r c o o r d i n a t o r ? ”
W a r e h o u s e : M a n a g e r s . S h i p p i n g & R e c e i v i n g D o c k
Q 9 “ W i t h i n t h e l a s t m
o n t h , h o w o f t e n d i d a t r a i l e r s h o w u
p l a t e a t
t h e d e s t i n a t i o n d o c k
w i t h o u t a n y b o d y c a l l i n g t o a l e r t y o u
b e f o r e
i t s a r r i v a l ? ”
Q 1 0 “ W i t h i n t h e l a s t
m o n t h , h o w m a n y t i m e s w e r e y o u p
l a c e d o n
h o l d w a i t i n g f o r a d r i v e r c o o r d i n a t o r ? ”
% r e s p o n d e d b y
q u e s t i o n
Q 7 1 0 0 %
N e v
e r L a t e
Q 8 1 0 0 %
N e v
e r
Q 9 1 0 0 %
N e v
e r L a t e
Q 1 0
1 0 0 %
N e v
e r
R e a l i s t i c p r o c e s s t i m e
e s t i m a t e s a n d
e x p e c t a t i o n s
B e s t p r a c t i c e
•
E q u i p m e n t
•
L o a d t y p e
•
T o t a l t i m e t o u n l o a d
a t r a i l e r a t a s t o r e . T h r e e f u l l y l o a d e
d
t r a i l e r s w i l l b e d e l i v e
r e d t o 1 0 s t o r e s w h e r e t h e t r a i l e r s w
i l l b e
u n l o a d e d 3 d i f f e r e n t
t i m e s . A s t o p w a t c h w i l l s t a r t w h e n t h e d o o r
i s o p e n e d b y t h e d r i v e r a n d w i l l s t o p w h e n t h e t r a i l e r h a s b e e n
e m p t i e d .
L i v e U n l o a d
P r o c e s s T i m e
6 0 m
i n u t e s
M e e t s t o r e c u s t o m e r s ’
d e m a n
d s
U n p r e d i c t e d d e
m a n d
•
C h a n g e V e n d o
r s u p p l y
•
D a i l y t o t a l o f m e r c h a
n d i s e t h a t i s a t a z e r o i n v e n t o r y d i v i d e d b y
t h e t o t a l n u m b e r o f s t o r e s . T h e d a t a s o u r c e i s f r o m a l l s t o r e s ’
i n v e n t o r y a t m i d n i g h
t e a c h d a y .
Z e r o I n v e n t o r y
I t e m s p e r S t o r e
F i g u r e
5 . 7 1
( c o n t i n u e d ) .
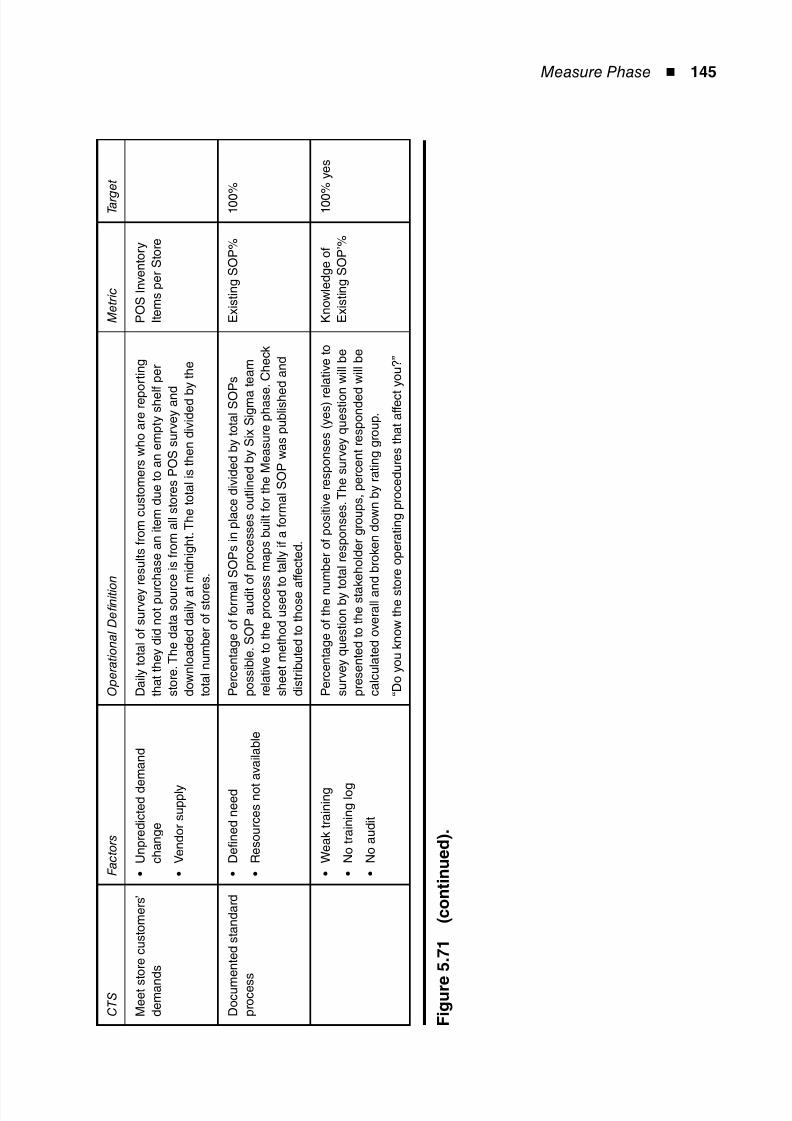
8/12/2019 Implementing Lean Six Sigma Throughout the Supply Chain
http://slidepdf.com/reader/full/implementing-lean-six-sigma-throughout-the-supply-chain 162/278
Measure Phase ◾ 145
C T S
F a c t o r s
O p e r a t i o n a l D e fi n i t i o
n
M e t r i c
T a r g
e t
M e e t s t o r e c u s t o m e r s ’
d e m a n
d s
U n p r e d i c t e d d e
m a n d
•
c h a n g e
V e n d o r s u p p l y
•
D a i l y t o t a l o f s u r v e y
r e s u l t s f r o m c u s t o m e r s w h o a r e r e p o r t i n g
t h a t t h e y d i d n o t p u r c h a s e a n i t e m d u e t o a n e m p t y s h e l f p e r
s t o r e . T h e d a t a s o u r c e i s f r o m a l l s t o r e s P O S s u r v e y a n d
d o w n l o a d e d d a i l y a t
m i d n i g h t . T h e t o t a l i s t h e n d i v i d e d b
y t h e
t o t a l n u m b e r o f s t o r e
s .
P O S I n v e n t o r y
I t e m s p e r S t o r e
D o c u m
e n t e d s t a n d a r d
p r o c e s s
D e fi n e d n e e d
•
R e s o u r c e s n o t
a v a i l a b l e
•
P e r c e n t a g e o f f o r m a
l S O P s i n p l a c e d i v i d e d b y t o t a l S O P s
p o s s i b l e . S O P a u d i t
o f p r o c e s s e s o u t l i n e d b y S i x S i g m a
t e a m
r e l a t i v e t o t h e p r o c e s s m a p s b u i l t f o r t h e M e a s u r e p h a s e
. C h e c k
s h e e t m e t h o d u s e d t o t a l l y i f a f o r m a l S O P w a s p u b l i s h e
d a n d
d i s t r i b u t e d t o t h o s e a f f e c t e d .
E x i s t i n g S O P %
1 0 0 %
W e a k t r a i n i n g
•
N o t r a i n i n g l o g
•
N o a u d i t
•
P e r c e n t a g e o f t h e n u m b e r o f p o s i t i v e r e s p o n s e s ( y e s ) r e
l a t i v e t o
s u r v e y q u e s t i o n b y t o t a l r e s p o n s e s . T h e s u r v e y q u e s t i o n
w i l l b e
p r e s e n t e d t o t h e s t a k e h o l d e r g r o u p s , p e r c e n t r e s p o n d e d
w i l l b e
c a l c u l a t e d o v e r a l l a n
d b r o k e n d o w n b y r a t i n g g r o u p .
“ D o y o u k n o w t h e s t o r e o p e r a t i n g p r o c e d u r e s t h a t a f f e c t
y o u ? ”
K n o w l e d g e o f
E x i s t i n g S O P ’ %
1 0 0 % y e s
F i g u r e
5 . 7 1
( c o n t i n u e d ) .
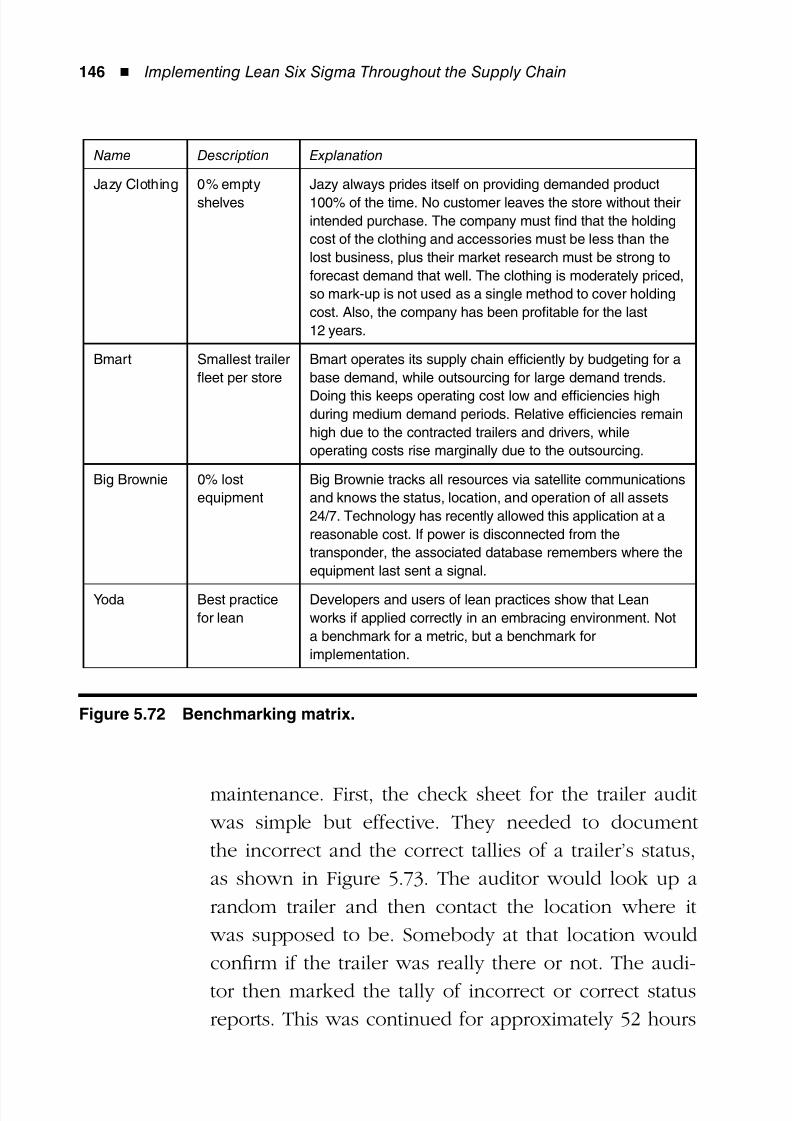
8/12/2019 Implementing Lean Six Sigma Throughout the Supply Chain
http://slidepdf.com/reader/full/implementing-lean-six-sigma-throughout-the-supply-chain 163/278
146 ◾ Implementing Lean Six Sigma Throughout the Supply Chain
maintenance. First, the check sheet for the trailer audit
was simple but effective. They needed to document
the incorrect and the correct tallies of a trailer’s status,
as shown in Figure 5.73. The auditor would look up a
random trailer and then contact the location where it
was supposed to be. Somebody at that location would
confirm if the trailer was really there or not. The audi-
tor then marked the tally of incorrect or correct status
reports. This was continued for approximately 52 hours
Name Description Explanation
Jazy Clothing 0% empty
shelves
Jazy always prides itself on providing demanded product
100% of the time. No customer leaves the store without their
intended purchase. The company must find that the holding
cost of the clothing and accessories must be less than the
lost business, plus their market research must be strong to
forecast demand that well. The clothing is moderately priced,
so mark-up is not used as a single method to cover holding
cost. Also, the company has been profitable for the last
12 years.
Bmart Smallest trailer
fleet per store
Bmart operates its supply chain efficiently by budgeting for a
base demand, while outsourcing for large demand trends.
Doing this keeps operating cost low and efficiencies highduring medium demand periods. Relative efficiencies remain
high due to the contracted trailers and drivers, while
operating costs rise marginally due to the outsourcing.
Big Brownie 0% lost
equipment
Big Brownie tracks all resources via satellite communications
and knows the status, location, and operation of all assets
24/7. Technology has recently allowed this application at a
reasonable cost. If power is disconnected from the
transponder, the associated database remembers where the
equipment last sent a signal.
Yoda Best practice
for lean
Developers and users of lean practices show that Lean
works if applied correctly in an embracing environment. Not
a benchmark for a metric, but a benchmark for
implementation.
Figure 5.72 Benchmarking matrix.
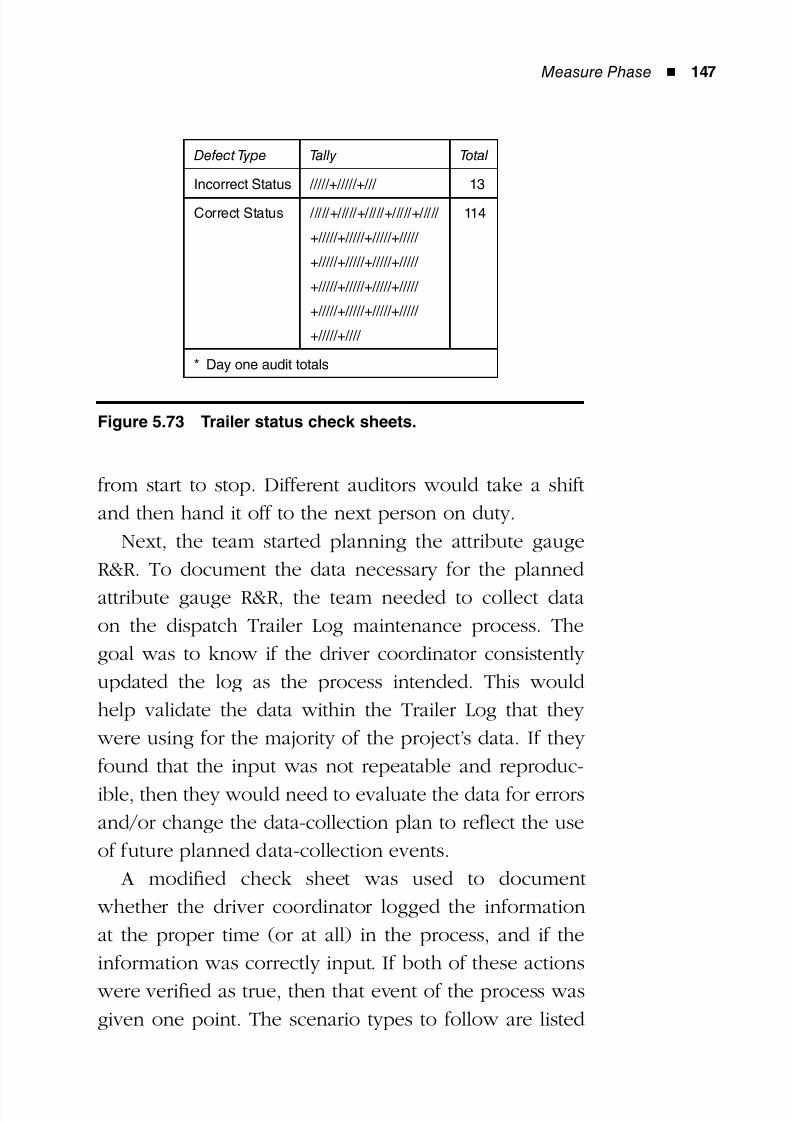
8/12/2019 Implementing Lean Six Sigma Throughout the Supply Chain
http://slidepdf.com/reader/full/implementing-lean-six-sigma-throughout-the-supply-chain 164/278
Measure Phase ◾ 147
from start to stop. Different auditors would take a shift
and then hand it off to the next person on duty.
Next, the team started planning the attribute gauge
R&R. To document the data necessary for the planned
attribute gauge R&R, the team needed to collect data
on the dispatch Trailer Log maintenance process. The
goal was to know if the driver coordinator consistently
updated the log as the process intended. This would
help validate the data within the Trailer Log that they
were using for the majority of the project’s data. If they
found that the input was not repeatable and reproduc-
ible, then they would need to evaluate the data for errors
and/or change the data-collection plan to reflect the use
of future planned data-collection events.
A modified check sheet was used to document
whether the driver coordinator logged the information
at the proper time (or at all) in the process, and if the
information was correctly input. If both of these actions
were verified as true, then that event of the process was
given one point. The scenario types to follow are listed
Defect Type Tally Total
Incorrect Status /////+/////+/// 13
Correct Status /////+/////+/////+/////+/////
+/////+/////+/////+/////
+/////+/////+/////+/////
+/////+/////+/////+/////
+/////+/////+/////+/////
+/////+////
114
* Day one audit totals
Figure 5.73 Trailer status check sheets.
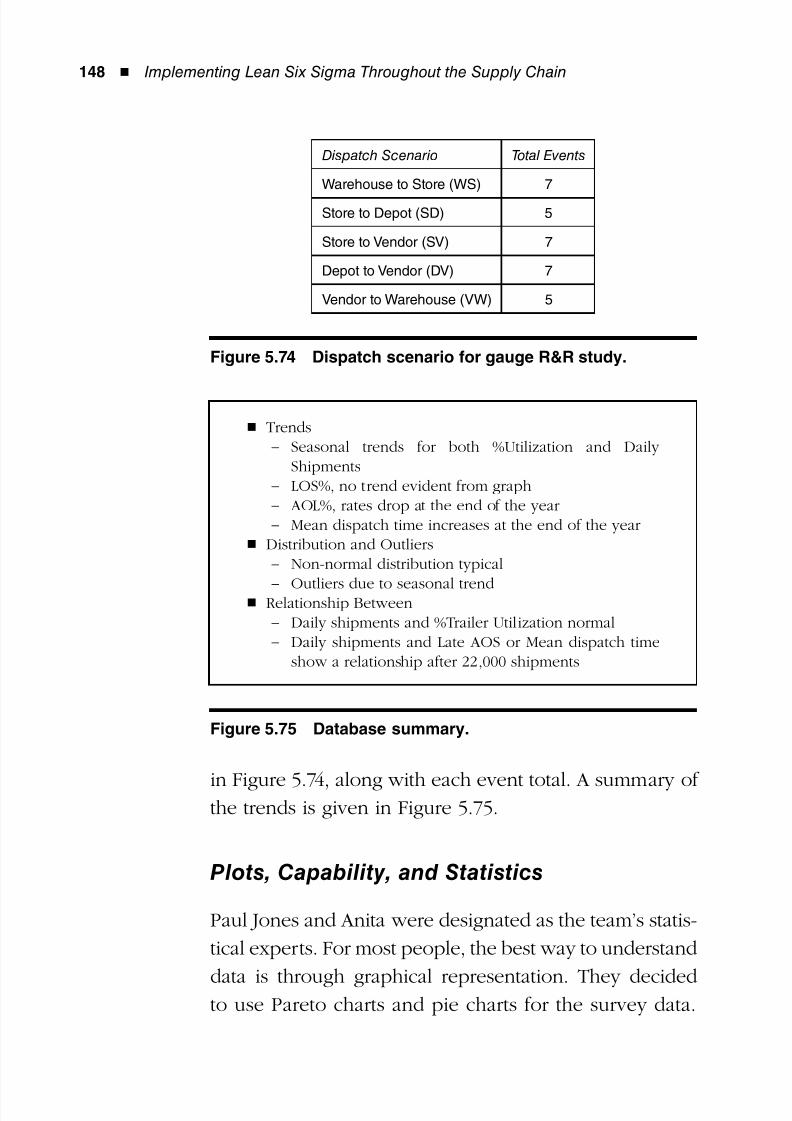
8/12/2019 Implementing Lean Six Sigma Throughout the Supply Chain
http://slidepdf.com/reader/full/implementing-lean-six-sigma-throughout-the-supply-chain 165/278
148 ◾ Implementing Lean Six Sigma Throughout the Supply Chain
in Figure 5.74, along with each event total. A summary ofthe trends is given in Figure 5.75.
Plots, Capability, and Statistics
Paul Jones and Anita were designated as the team’s statis-
tical experts. For most people, the best way to understand
data is through graphical representation. They decidedto use Pareto charts and pie charts for the survey data.
Dispatch Scenario Total Events
Warehouse to Store (WS) 7
Store to Depot (SD) 5
Store to Vendor (SV) 7
Depot to Vendor (DV) 7
Vendor to Warehouse (VW) 5
Figure 5.74 Dispatch scenario for gauge R&R study.
Trends◾
Seasonal trends for both %Utilization and Daily−
ShipmentsLOS%, no trend evident from graph−
AOL%, rates drop at the end of the year−
Mean dispatch time increases at the end of the year−
Distribution and Outliers◾
Non-normal distribution typical−
Outliers due to seasonal trend−
Relationship Between◾
Daily shipments and %Trailer Utilization normal−
Daily shipments and Late AOS or Mean dispatch time−
show a relationship after 22,000 shipments
Figure 5.75 Database summary.
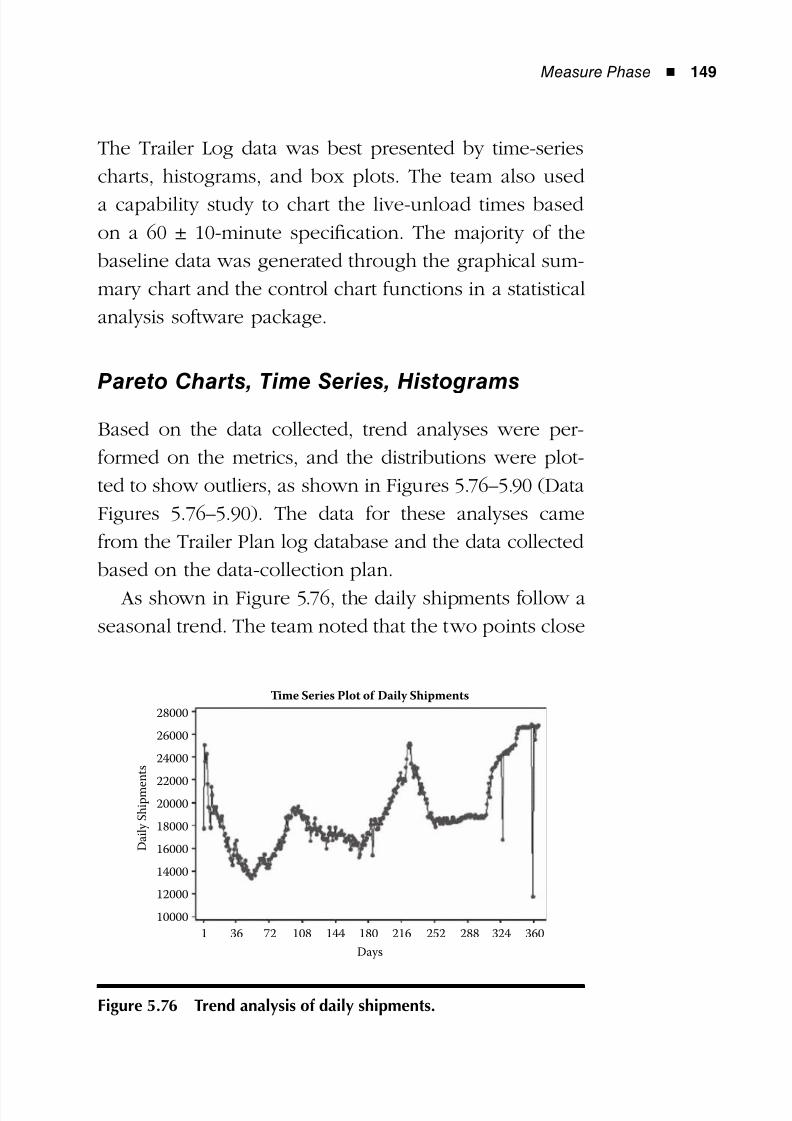
8/12/2019 Implementing Lean Six Sigma Throughout the Supply Chain
http://slidepdf.com/reader/full/implementing-lean-six-sigma-throughout-the-supply-chain 166/278
Measure Phase ◾ 149
The Trailer Log data was best presented by time-series
charts, histograms, and box plots. The team also used
a capability study to chart the live-unload times based
on a 60 ± 10-minute specification. The majority of the
baseline data was generated through the graphical sum-
mary chart and the control chart functions in a statistical
analysis software package.
Pareto Charts, Time Series, Histograms
Based on the data collected, trend analyses were per-
formed on the metrics, and the distributions were plot-
ted to show outliers, as shown in Figures 5.76–5.90 (Data
Figures 5.76–5.90). The data for these analyses came
from the Trailer Plan log database and the data collected
based on the data-collection plan.
As shown in Figure 5.76, the daily shipments follow a
seasonal trend. The team noted that the two points close
28000
26000
24000
2200020000
18000
16000
14000
12000
10000
1 36 72 108 144 180 216 252 288 324 360
Days
Time Series Plot of Daily Shipments
D a i l y S h i p m e
n t s
Figure 5.76 Trend analysis of daily shipments.
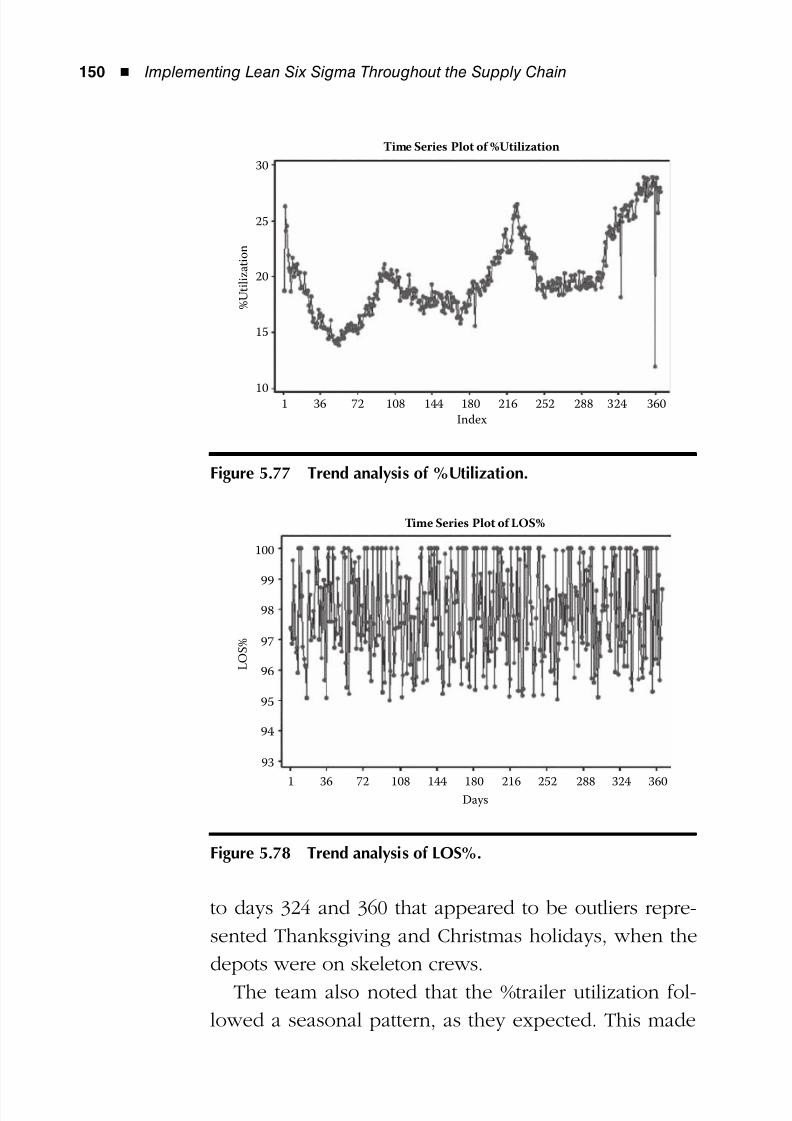
8/12/2019 Implementing Lean Six Sigma Throughout the Supply Chain
http://slidepdf.com/reader/full/implementing-lean-six-sigma-throughout-the-supply-chain 167/278
150 ◾ Implementing Lean Six Sigma Throughout the Supply Chain
to days 324 and 360 that appeared to be outliers repre-
sented Thanksgiving and Christmas holidays, when the
depots were on skeleton crews.
The team also noted that the %trailer utilization fol-
lowed a seasonal pattern, as they expected. This made
1 36 72 108 144 180 216 252 288 324 360
Index
Time Series Plot of %Utilization
% U t i l i z a t i o n
30
25
20
15
10
Figure 5.77 Trend analysis of %Utilization.
1 36 72 108 144 180 216 252 288 324 360Days
Time Series Plot of LOS%
L O S %
100
99
98
97
96
95
94
93
Figure 5.78 Trend analysis of LOS%.
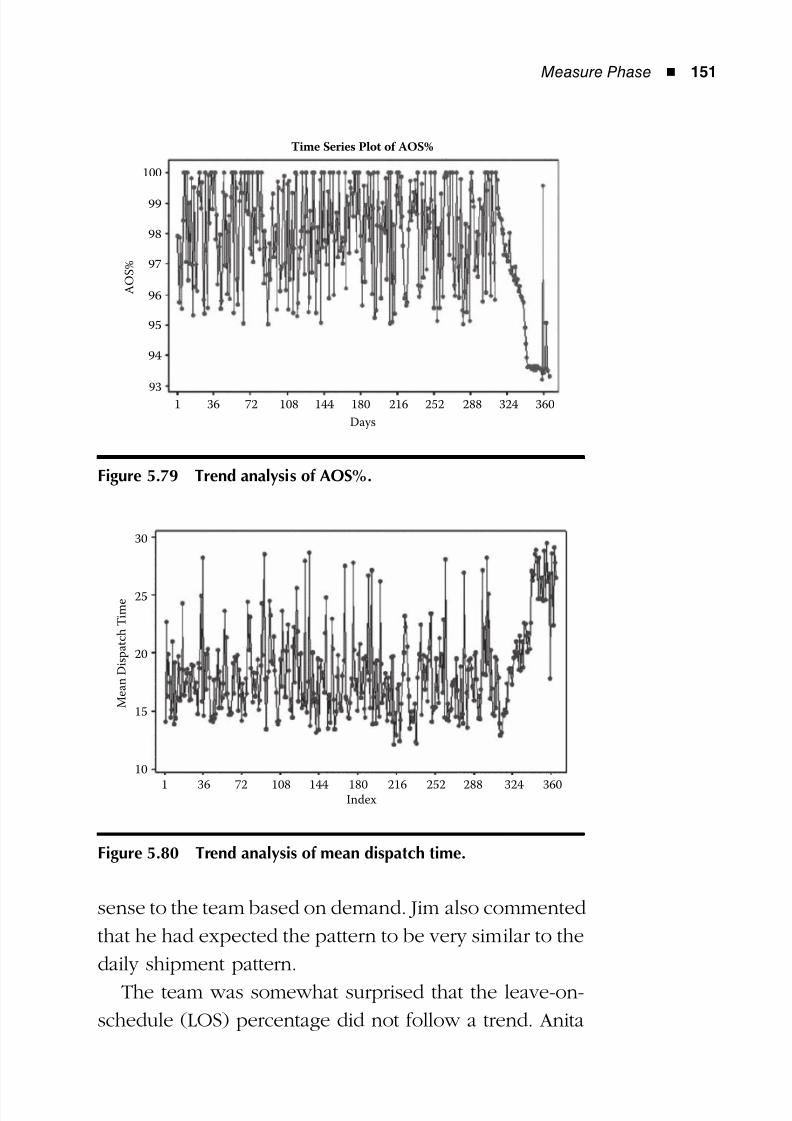
8/12/2019 Implementing Lean Six Sigma Throughout the Supply Chain
http://slidepdf.com/reader/full/implementing-lean-six-sigma-throughout-the-supply-chain 168/278
Measure Phase ◾ 151
sense to the team based on demand. Jim also commented
that he had expected the pattern to be very similar to the
daily shipment pattern.
The team was somewhat surprised that the leave-on-
schedule (LOS) percentage did not follow a trend. Anita
1 36 72 108 144 180 216 252 288 324 360
Days
Time Series Plot of AOS%
A O S %
100
99
98
97
96
95
94
93
Figure 5.79 Trend analysis of AOS%.
1 36 72 108 144 180 216 252 288 324 360Index
M e a n D i s p a t c h T i m e
30
25
20
15
10
Figure 5.80 Trend analysis of mean dispatch time.
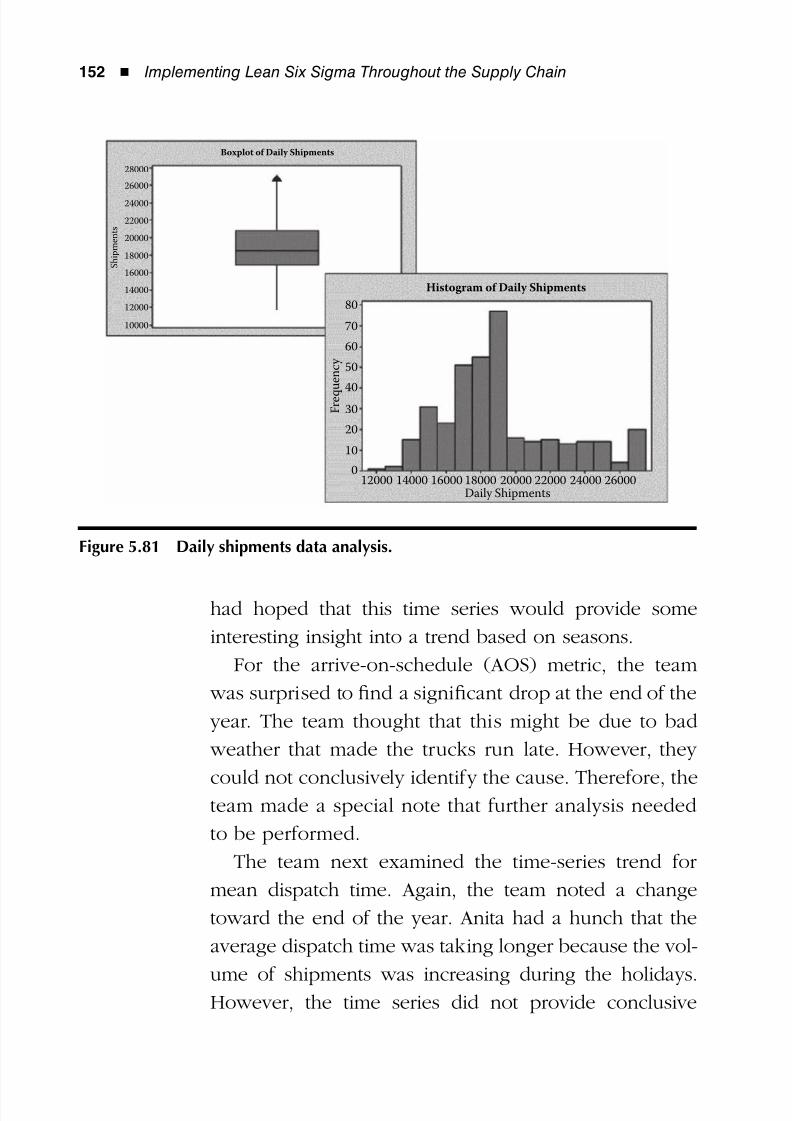
8/12/2019 Implementing Lean Six Sigma Throughout the Supply Chain
http://slidepdf.com/reader/full/implementing-lean-six-sigma-throughout-the-supply-chain 169/278
152 ◾ Implementing Lean Six Sigma Throughout the Supply Chain
had hoped that this time series would provide some
interesting insight into a trend based on seasons.
For the arrive-on-schedule (AOS) metric, the team
was surprised to find a significant drop at the end of the
year. The team thought that this might be due to bad
weather that made the trucks run late. However, they
could not conclusively identify the cause. Therefore, theteam made a special note that further analysis needed
to be performed.
The team next examined the time-series trend for
mean dispatch time. Again, the team noted a change
toward the end of the year. Anita had a hunch that the
average dispatch time was taking longer because the vol-
ume of shipments was increasing during the holidays.However, the time series did not provide conclusive
2600024000220002000018000160001400012000
80
70
60
50
4030
20
10
0
Histogram of Daily Shipments
F r e q
u e n c y
Daily Shipments
28000
26000
24000
22000
20000
18000
16000
14000
12000
10000
Boxplot of Daily Shipments
S h i p m e n t s
Figure 5.81 Daily shipments data analysis.
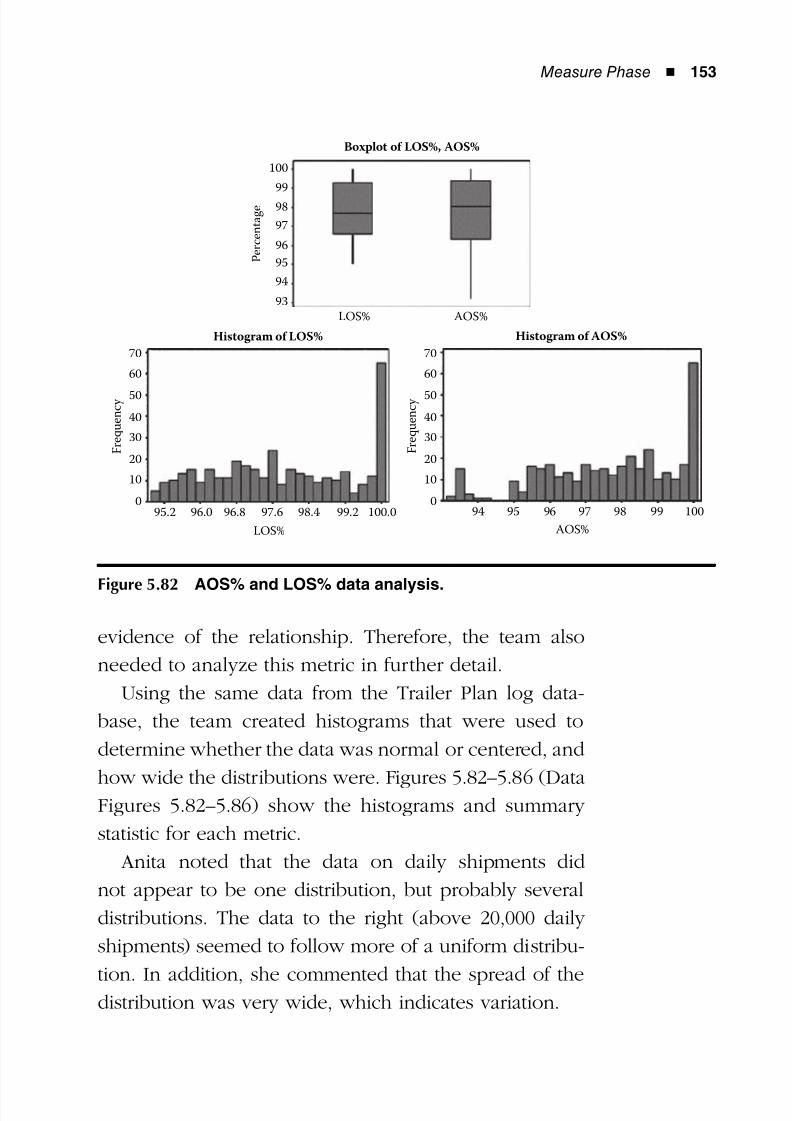
8/12/2019 Implementing Lean Six Sigma Throughout the Supply Chain
http://slidepdf.com/reader/full/implementing-lean-six-sigma-throughout-the-supply-chain 170/278
Measure Phase ◾ 153
evidence of the relationship. Therefore, the team also
needed to analyze this metric in further detail.
Using the same data from the Trailer Plan log data-
base, the team created histograms that were used to
determine whether the data was normal or centered, and
how wide the distributions were. Figures 5.82–5.86 (DataFigures 5.82–5.86) show the histograms and summary
statistic for each metric.
Anita noted that the data on daily shipments did
not appear to be one distribution, but probably several
distributions. The data to the right (above 20,000 daily
shipments) seemed to follow more of a uniform distribu-
tion. In addition, she commented that the spread of thedistribution was very wide, which indicates variation.
Boxplot of LOS%, AOS%
Histogram of AOS%Histogram of LOS%
100
99
98
97
96
95
94
93
70
60
50
40
30
20
10
0
70
60
50
40
30
20
10
09495.2 96.0 96.8 97.6 98.4 99.2 100.0 95 96 97 98 99 100
AOS%LOS%
F r e q u e n c y
F r e q u e n c y
LOS% AOS%
P e r c e n t a g e
Figure 5.82 AOS% and LOS% data analysis.
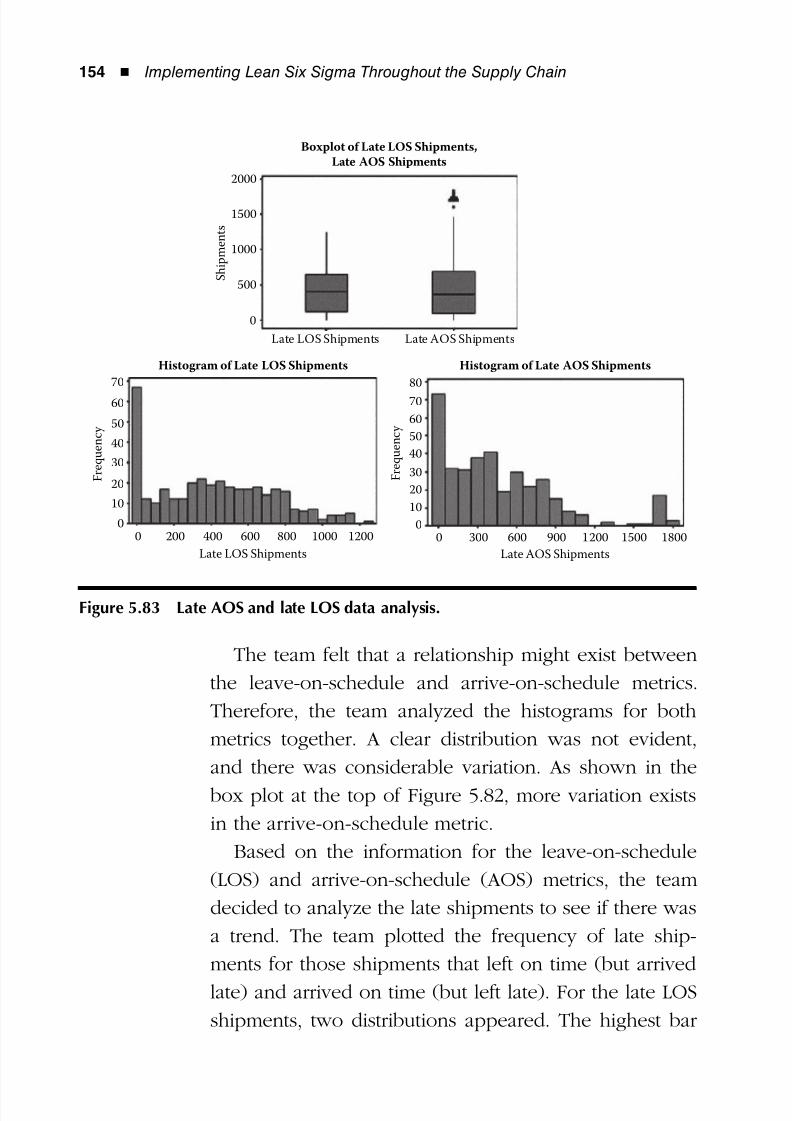
8/12/2019 Implementing Lean Six Sigma Throughout the Supply Chain
http://slidepdf.com/reader/full/implementing-lean-six-sigma-throughout-the-supply-chain 171/278
154 ◾ Implementing Lean Six Sigma Throughout the Supply Chain
The team felt that a relationship might exist between
the leave-on-schedule and arrive-on-schedule metrics.
Therefore, the team analyzed the histograms for both
metrics together. A clear distribution was not evident,
and there was considerable variation. As shown in the
box plot at the top of Figure 5.82, more variation exists
in the arrive-on-schedule metric.
Based on the information for the leave-on-schedule
(LOS) and arrive-on-schedule (AOS) metrics, the team
decided to analyze the late shipments to see if there was
a trend. The team plotted the frequency of late ship-
ments for those shipments that left on time (but arrived
late) and arrived on time (but left late). For the late LOS
shipments, two distributions appeared. The highest bar
Boxplot of Late LOS Shipments,
Late AOS Shipments
2000
1500
1000
500
0
70
60
50
40
30
20
10
0
70
80
60
50
40
30
20
10
00 200 400 600 800 1000 1200 0 300 600 900 1200 1500 1800
Late AOS ShipmentsLate LOS Shipments
Histogram of Late LOS Shipments
Late LOS Shipments Late AOS Shipments
S h i p m e n t s
Histogram of Late AOS Shipments
F r e q u e n c y
F r e q u e n c y
Figure 5.83 Late AOS and late LOS data analysis.
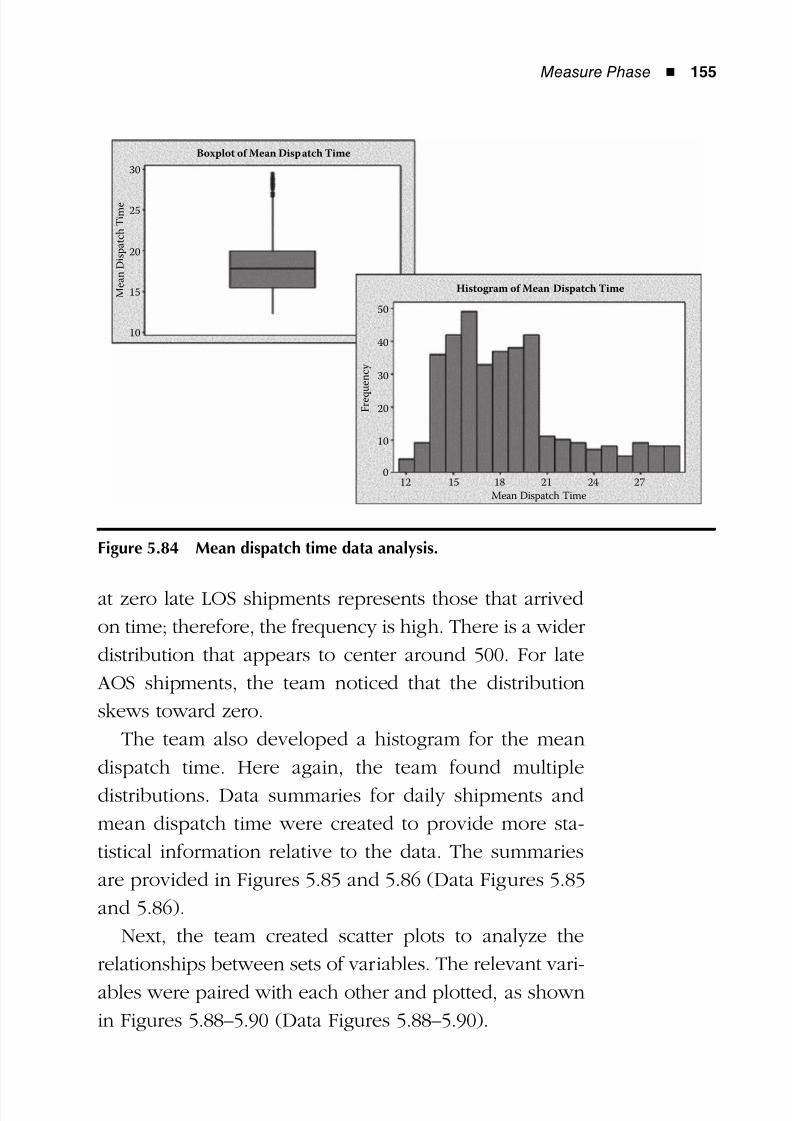
8/12/2019 Implementing Lean Six Sigma Throughout the Supply Chain
http://slidepdf.com/reader/full/implementing-lean-six-sigma-throughout-the-supply-chain 172/278
Measure Phase ◾ 155
at zero late LOS shipments represents those that arrived
on time; therefore, the frequency is high. There is a wider
distribution that appears to center around 500. For late
AOS shipments, the team noticed that the distribution
skews toward zero.
The team also developed a histogram for the mean
dispatch time. Here again, the team found multiple
distributions. Data summaries for daily shipments and
mean dispatch time were created to provide more sta-
tistical information relative to the data. The summaries
are provided in Figures 5.85 and 5.86 (Data Figures 5.85
and 5.86).
Next, the team created scatter plots to analyze the
relationships between sets of variables. The relevant vari-
ables were paired with each other and plotted, as shown
in Figures 5.88–5.90 (Data Figures 5.88–5.90).
30
40
50
20
10
012 15 18 21 24 27
Mean Dispatch Time
Histogram of Mean Dispatch Time
F r e q u e n c y
30
25
20
15
10
Boxplot of Mean Dispatch Time
M e a n D i s p a t c h T i m e
Figure 5.84 Mean dispatch time data analysis.
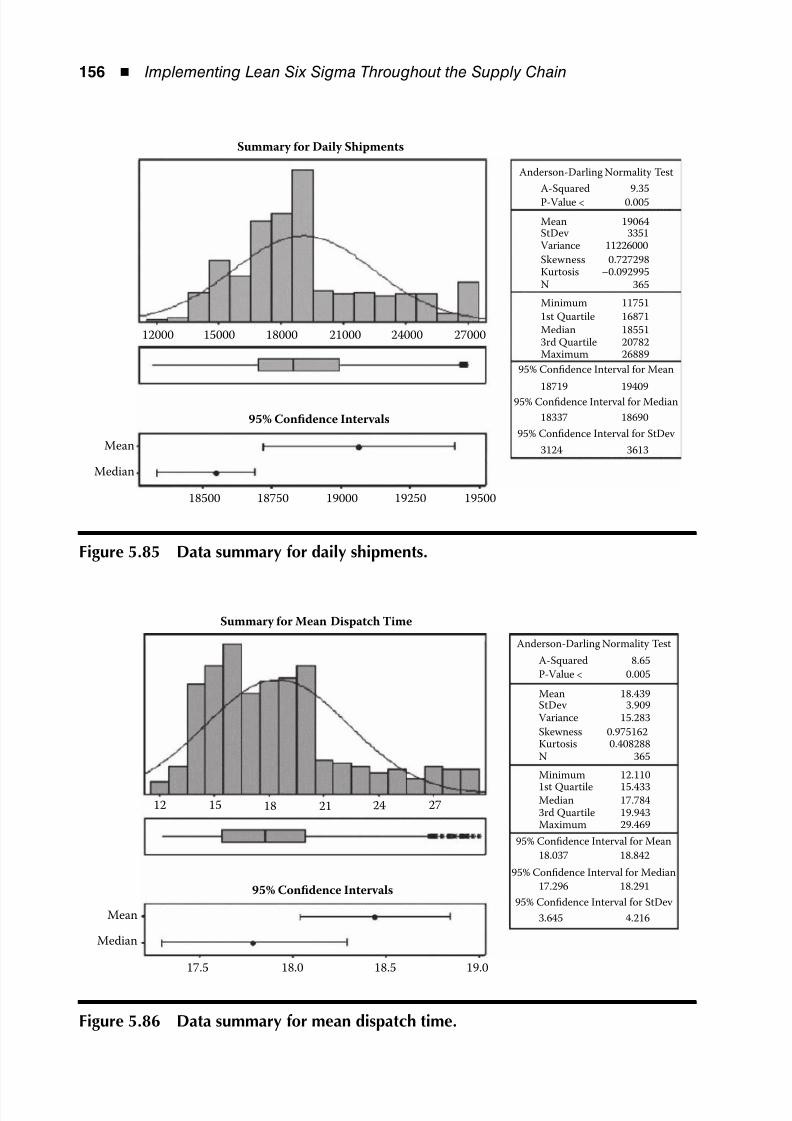
8/12/2019 Implementing Lean Six Sigma Throughout the Supply Chain
http://slidepdf.com/reader/full/implementing-lean-six-sigma-throughout-the-supply-chain 173/278
156 ◾ Implementing Lean Six Sigma Throughout the Supply Chain
12000 15000 18000 21000 24000 27000
1950019250190001875018500
Mean
Median
95% Confidence Intervals
Summary for Daily Shipments
Anderson-Darling Normality Test
A-Squared
P-Value <
9.35
0.005
MeanStDev Variance
SkewnessKurtosisN
190643351
11226000
0.727298–0.092995
365
11751
16871
185512078226889
Minimum
1st Quartile
Median3rd QuartileMaximum
95% Confidence Interval for Mean
95% Confidence Interval for Median
95% Confidence Interval for StDev
18719 19409
18337 18690
3124 3613
Figure 5.85 Data summary for daily shipments.
12 15 18 21 24 27
19.018.518.017.5
Mean
Median
95% Confidence Intervals
Summary for Mean Dispatch Time
Anderson-Darling Normality Test
A-Squared
P-Value <
8.65
0.005
MeanStDev Variance
SkewnessKurtosisN
18.4393.909
15.283
0.9751620.408288
365
12.110
15.43317.78419.94329.469
Minimum
1st QuartileMedian3rd QuartileMaximum
95% Confidence Interval for Mean
95% Confidence Interval for Median
95% Confidence Interval for StDev
18.037 18.842
17.296 18.291
3.645 4.216
Figure 5.86 Data summary for mean dispatch time.
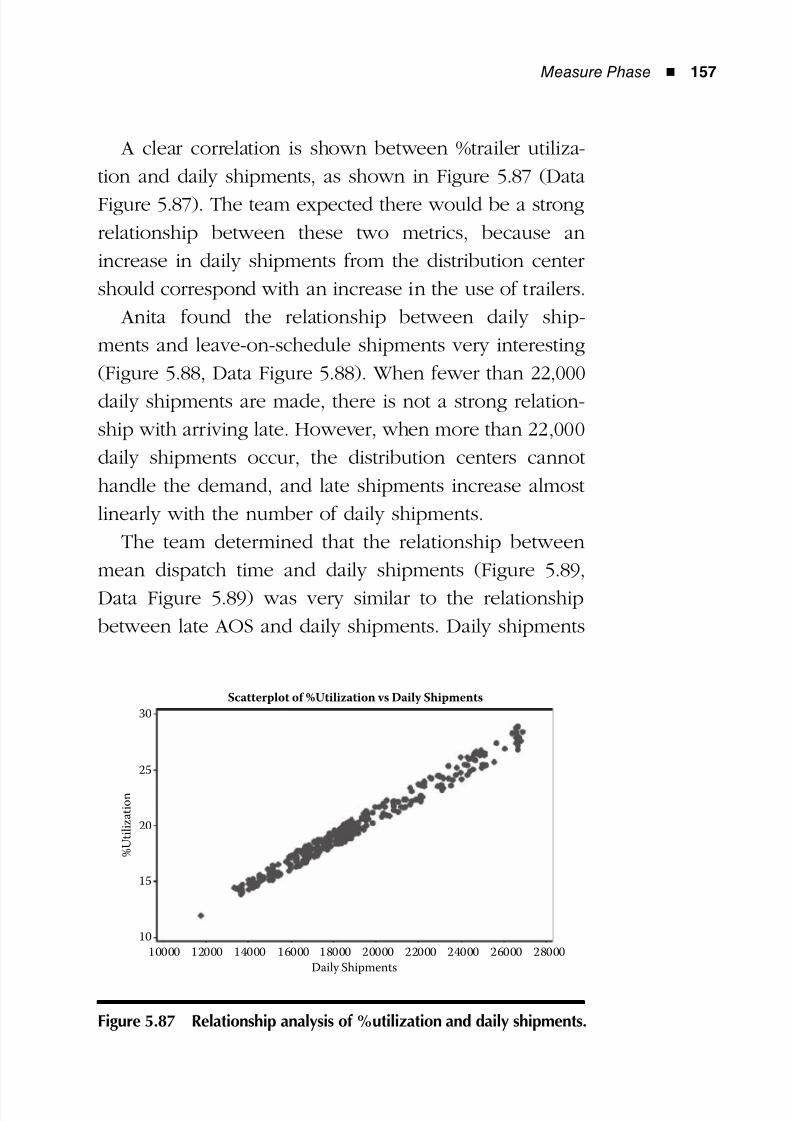
8/12/2019 Implementing Lean Six Sigma Throughout the Supply Chain
http://slidepdf.com/reader/full/implementing-lean-six-sigma-throughout-the-supply-chain 174/278
Measure Phase ◾ 157
A clear correlation is shown between %trailer utiliza-
tion and daily shipments, as shown in Figure 5.87 (Data
Figure 5.87). The team expected there would be a strong
relationship between these two metrics, because an
increase in daily shipments from the distribution center
should correspond with an increase in the use of trailers.
Anita found the relationship between daily ship-
ments and leave-on-schedule shipments very interesting
(Figure 5.88, Data Figure 5.88). When fewer than 22,000
daily shipments are made, there is not a strong relation-
ship with arriving late. However, when more than 22,000
daily shipments occur, the distribution centers cannot
handle the demand, and late shipments increase almost
linearly with the number of daily shipments.
The team determined that the relationship between
mean dispatch time and daily shipments (Figure 5.89,
Data Figure 5.89) was very similar to the relationship
between late AOS and daily shipments. Daily shipments
30
25
20
15
10
10000 12000 14000 16000 18000 20000 22000 24000 26000 28000
Daily Shipments
% U t i l i z a t i o n
Scatterplot of %Utilization vs Daily Shipments
Figure 5.87 Relationship analysis of %utilization and daily shipments.
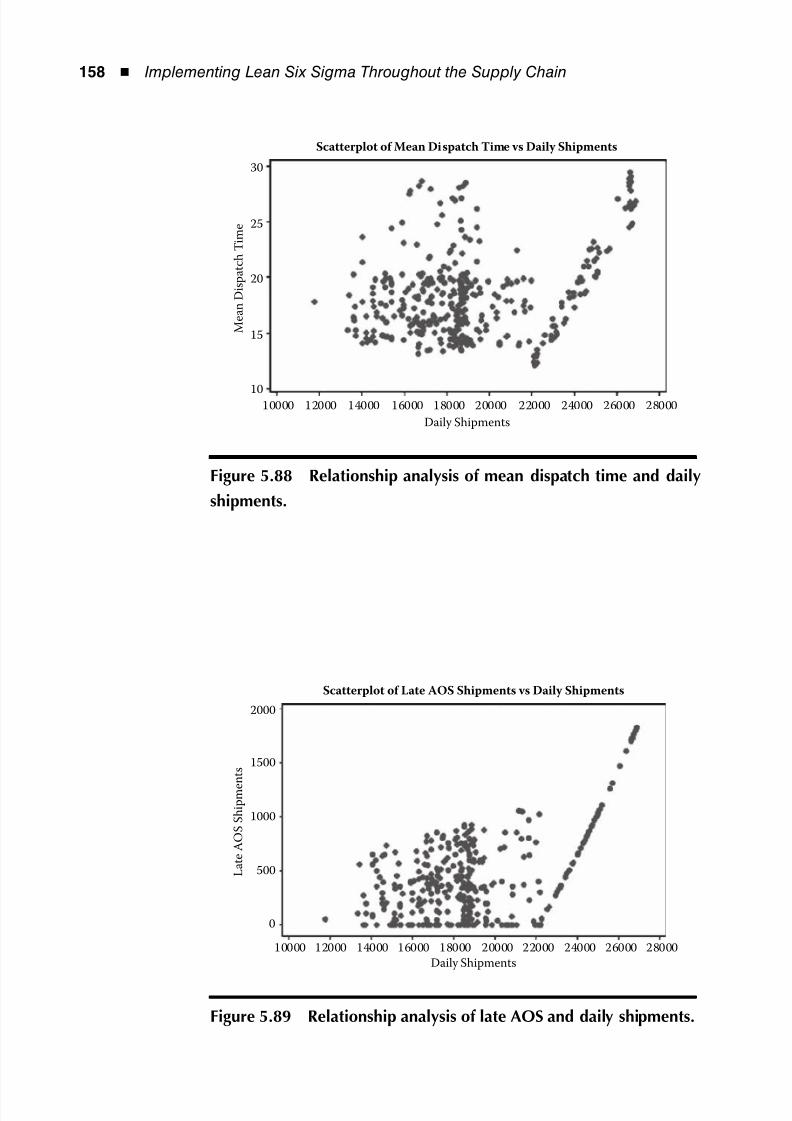
8/12/2019 Implementing Lean Six Sigma Throughout the Supply Chain
http://slidepdf.com/reader/full/implementing-lean-six-sigma-throughout-the-supply-chain 175/278
158 ◾ Implementing Lean Six Sigma Throughout the Supply Chain
2000
1500
1000
500
0
10000 12000 14000 16000 18000 20000 22000 24000 26000 28000
Daily Shipments
L a t e A O S S h i p m e n t s
Scatterplot of Late AOS Shipments vs Daily Shipments
Figure 5.89 Relationship analysis of late AOS and daily shipments.
30
25
20
15
1010000 12000 14000 16000 18000 20000 22000 24000 26000 28000
Daily Shipments
M e a n D i s p a t c h T i m e
Scatterplot of Mean Dispatch Time vs Daily Shipments
Figure 5.88 Relationship analysis of mean dispatch time and daily
shipments.
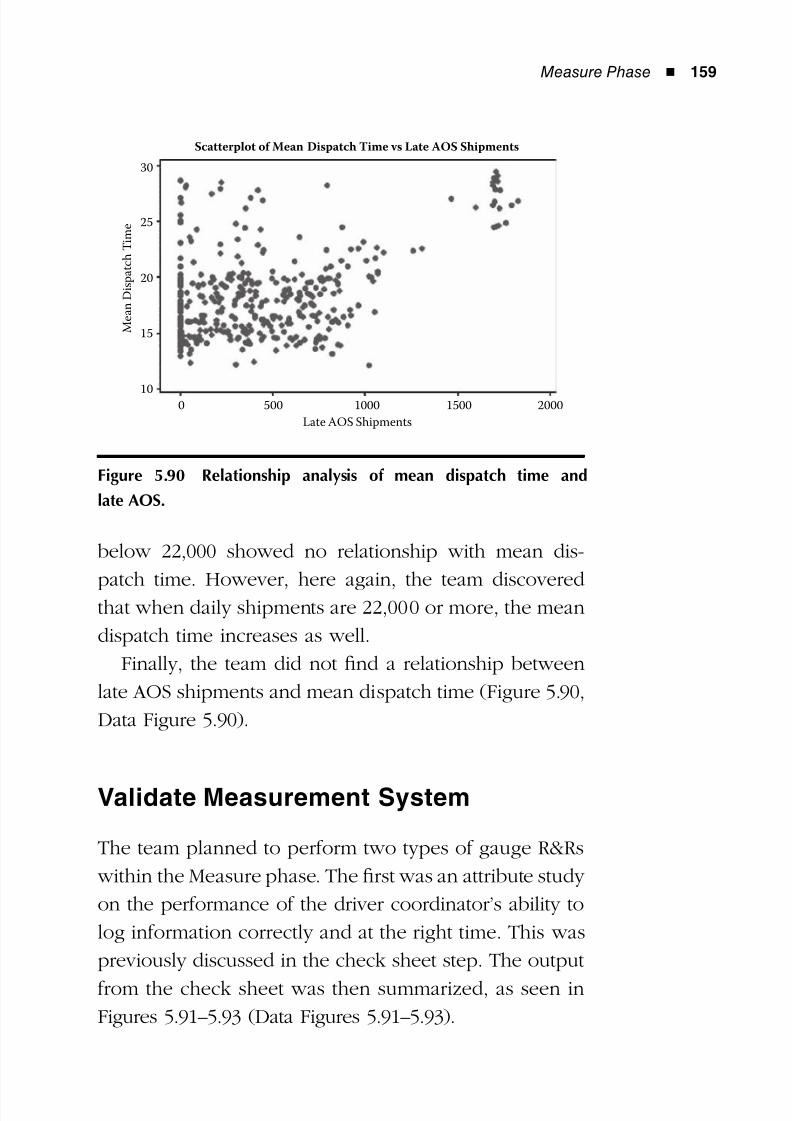
8/12/2019 Implementing Lean Six Sigma Throughout the Supply Chain
http://slidepdf.com/reader/full/implementing-lean-six-sigma-throughout-the-supply-chain 176/278
Measure Phase ◾ 159
below 22,000 showed no relationship with mean dis-
patch time. However, here again, the team discoveredthat when daily shipments are 22,000 or more, the mean
dispatch time increases as well.
Finally, the team did not find a relationship between
late AOS shipments and mean dispatch time (Figure 5.90,
Data Figure 5.90).
Validate Measurement System
The team planned to perform two types of gauge R&Rs
within the Measure phase. The first was an attribute study
on the performance of the driver coordinator’s ability to
log information correctly and at the right time. This was
previously discussed in the check sheet step. The output
from the check sheet was then summarized, as seen in
Figures 5.91–5.93 (Data Figures 5.91–5.93).
30
25
20
15
100 500 1000 1500 2000
Late AOS Shipments
M e a n D i s p a t c h T i m e
Scatterplot of Mean Dispatch Time vs Late AOS Shipments
Figure 5.90 Relationship analysis of mean dispatch time and
late AOS.
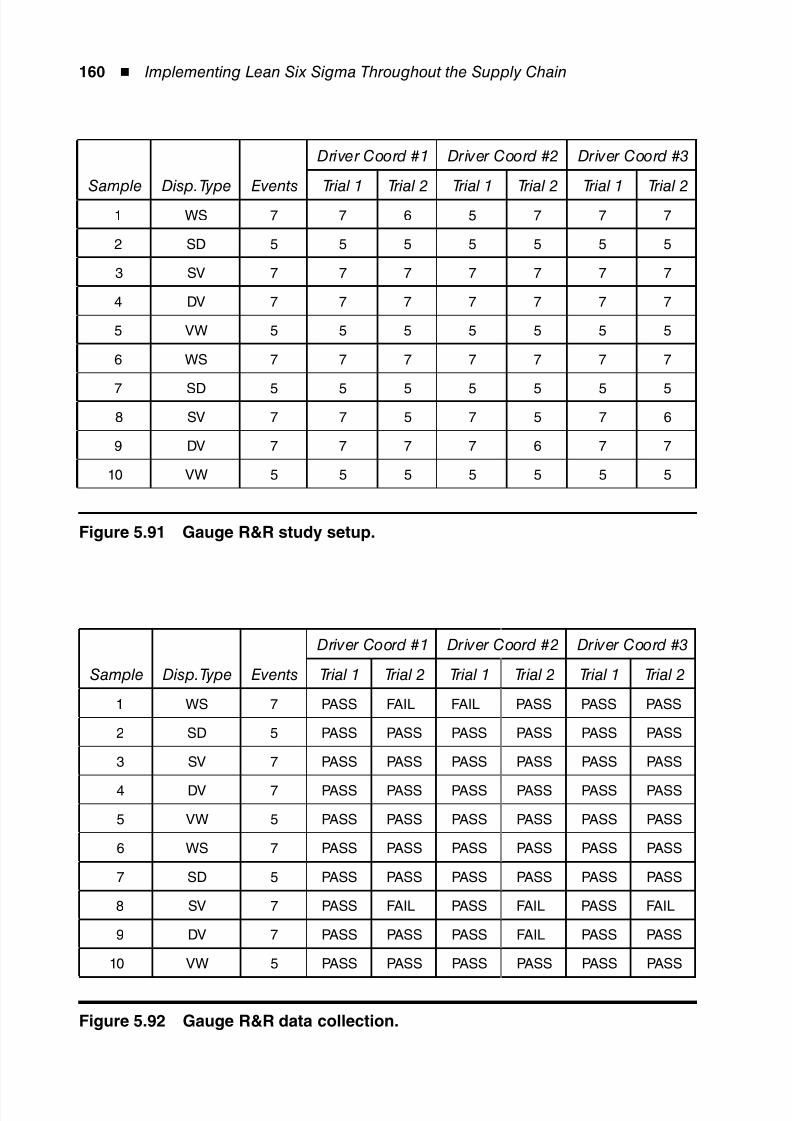
8/12/2019 Implementing Lean Six Sigma Throughout the Supply Chain
http://slidepdf.com/reader/full/implementing-lean-six-sigma-throughout-the-supply-chain 177/278
160 ◾ Implementing Lean Six Sigma Throughout the Supply Chain
Sample Disp. Type Events
Driver Coord #1 Driver Coord #2 Driver Coord #3
Trial 1 Trial 2 Trial 1 Trial 2 Trial 1 Trial 2
1 WS 7 7 6 5 7 7 7
2 SD 5 5 5 5 5 5 5
3 SV 7 7 7 7 7 7 7
4 DV 7 7 7 7 7 7 7
5 VW 5 5 5 5 5 5 5
6 WS 7 7 7 7 7 7 7
7 SD 5 5 5 5 5 5 5
8 SV 7 7 5 7 5 7 6
9 DV 7 7 7 7 6 7 7
10 VW 5 5 5 5 5 5 5
Figure 5.91 Gauge R&R study setup.
Sample Disp. Type Events
Driver Coord #1 Driver Coord #2 Driver Coord #3
Trial 1 Trial 2 Trial 1 Trial 2 Trial 1 Trial 2
1 WS 7 PASS FAIL FAIL PASS PASS PASS
2 SD 5 PASS PASS PASS PASS PASS PASS
3 SV 7 PASS PASS PASS PASS PASS PASS
4 DV 7 PASS PASS PASS PASS PASS PASS
5 VW 5 PASS PASS PASS PASS PASS PASS
6 WS 7 PASS PASS PASS PASS PASS PASS
7 SD 5 PASS PASS PASS PASS PASS PASS
8 SV 7 PASS FAIL PASS FAIL PASS FAIL
9 DV 7 PASS PASS PASS FAIL PASS PASS
10 VW 5 PASS PASS PASS PASS PASS PASS
Figure 5.92 Gauge R&R data collection.
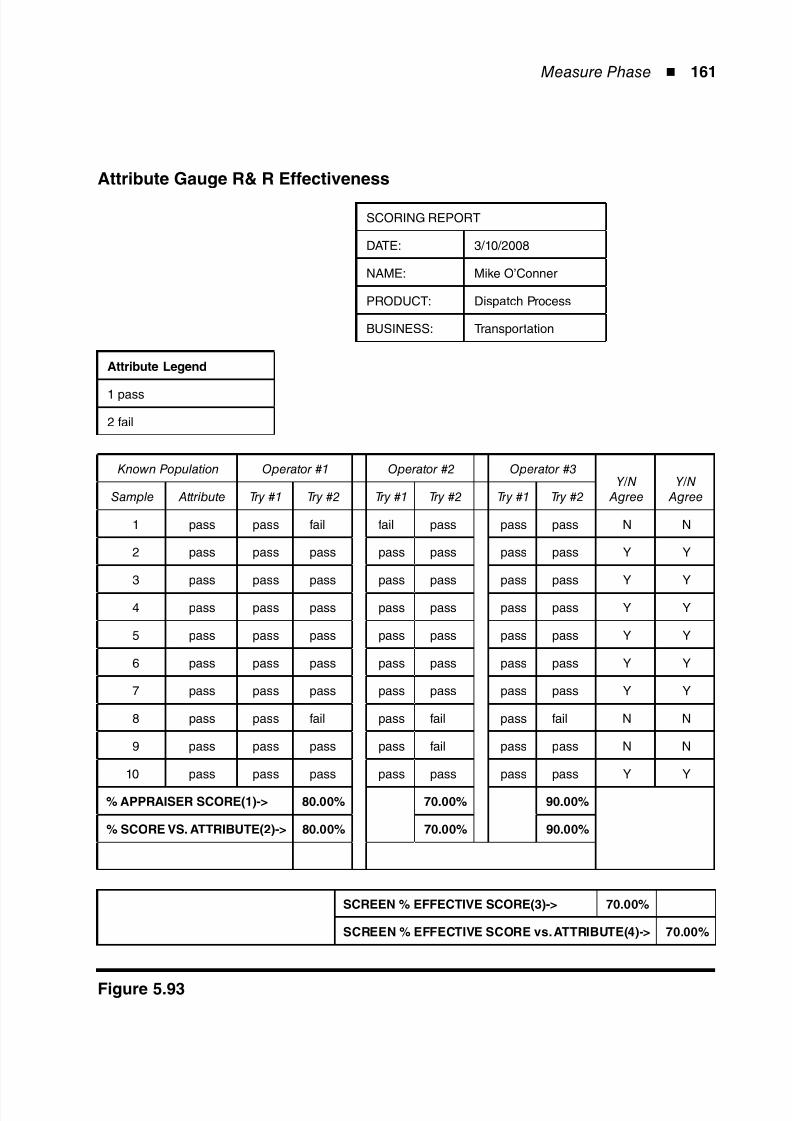
8/12/2019 Implementing Lean Six Sigma Throughout the Supply Chain
http://slidepdf.com/reader/full/implementing-lean-six-sigma-throughout-the-supply-chain 178/278
Measure Phase ◾ 161
Attribute Gauge R& R Effectiveness
SCORING REPORT
DATE: 3/10/2008
NAME: Mike O’Conner
PRODUCT: Dispatch Process
BUSINESS: Transportation
Attribute Legend
1 pass
2 fail
Known Population Operator #1 Operator #2 Operator #3Y/N
AgreeY/N
AgreeSample Attribute Try #1 Try #2 Try #1 Try #2 Try #1 Try #2
1 pass pass fail fail pass pass pass N N
2 pass pass pass pass pass pass pass Y Y
3 pass pass pass pass pass pass pass Y Y
4 pass pass pass pass pass pass pass Y Y
5 pass pass pass pass pass pass pass Y Y
6 pass pass pass pass pass pass pass Y Y
7 pass pass pass pass pass pass pass Y Y
8 pass pass fail pass fail pass fail N N
9 pass pass pass pass fail pass pass N N
10 pass pass pass pass pass pass pass Y Y
% APPRAISER SCORE(1)-> 80.00% 70.00% 90.00%
% SCORE VS. ATTRIBUTE(2)-> 80.00% 70.00% 90.00%
SCREEN % EFFECTIVE SCORE(3)-> 70.00%
SCREEN % EFFECTIVE SCORE vs. ATTRIBUTE(4)-> 70.00%
Figure 5.93
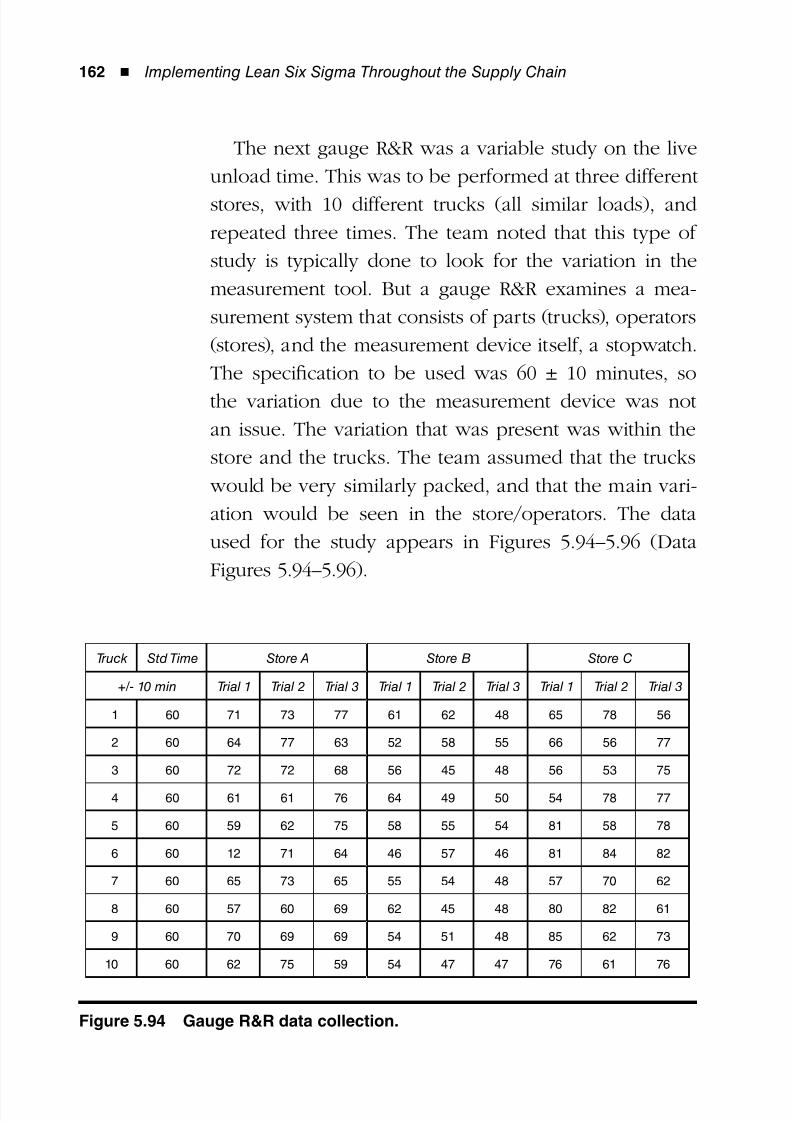
8/12/2019 Implementing Lean Six Sigma Throughout the Supply Chain
http://slidepdf.com/reader/full/implementing-lean-six-sigma-throughout-the-supply-chain 179/278
162 ◾ Implementing Lean Six Sigma Throughout the Supply Chain
The next gauge R&R was a variable study on the live
unload time. This was to be performed at three different
stores, with 10 different trucks (all similar loads), and
repeated three times. The team noted that this type of
study is typically done to look for the variation in the
measurement tool. But a gauge R&R examines a mea-
surement system that consists of parts (trucks), operators
(stores), and the measurement device itself, a stopwatch.
The specification to be used was 60 ± 10 minutes, so
the variation due to the measurement device was not
an issue. The variation that was present was within the
store and the trucks. The team assumed that the trucks
would be very similarly packed, and that the main vari-
ation would be seen in the store/operators. The data
used for the study appears in Figures 5.94–5.96 (Data
Figures 5.94–5.96).
Truck Std Time Store A Store B Store C
+/- 10 min Trial 1 Trial 2 Trial 3 Trial 1 Trial 2 Trial 3 Trial 1 Trial 2 Trial 3
1 60 71 73 77 61 62 48 65 78 56
2 60 64 77 63 52 58 55 66 56 77
3 60 72 72 68 56 45 48 56 53 75
4 60 61 61 76 64 49 50 54 78 77
5 60 59 62 75 58 55 54 81 58 78
6 60 12 71 64 46 57 46 81 84 82
7 60 65 73 65 55 54 48 57 70 62
8 60 57 60 69 62 45 48 80 82 61
9 60 70 69 69 54 51 48 85 62 73
10 60 62 75 59 54 47 47 76 61 76
Figure 5.94 Gauge R&R data collection.
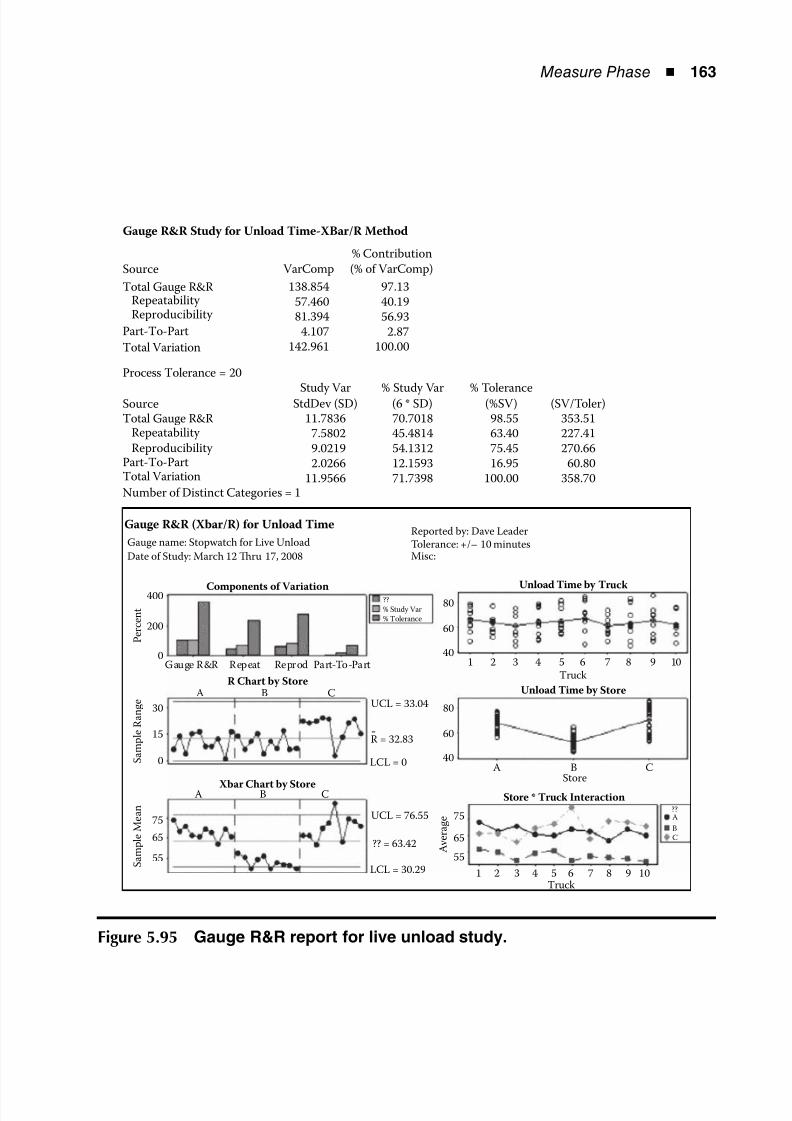
8/12/2019 Implementing Lean Six Sigma Throughout the Supply Chain
http://slidepdf.com/reader/full/implementing-lean-six-sigma-throughout-the-supply-chain 180/278
Measure Phase ◾ 163
Gauge R&R Study for Unload Time-XBar/R Method
Source
Total Gauge R&RRepeatability Reproducibility
Part-To-Part
Total Variation
SourceTotal Gauge R&R
Repeatability
Reproducibility Part-To-PartTotal Variation
% Contribution
% Study Var % ToleranceStudy VarStdDev (SD) (6 * SD)70.701845.481454.131212.159371.7398
98.5563.4075.4516.95
100.00
353.51227.41270.66
60.80358.70
(%SV) (SV/Toler)11.7836
7.58029.02192.0266
11.9566
VarComp
138.85457.46081.394
4.107142.961
(% of VarComp)
Process Tolerance = 20
Number of Distinct Categories = 1
Gauge name: Stopwatch for Live Unload
Date of Study: March 12 ru 17, 2008
400
200
0
30
80
60
40
80
60
40
15
0
75
65
55
75
65
55
A B C
A B C
Reported by: Dave LeaderTolerance: +/– 10 minutesMisc:
Components of Variation
R Chart b y Store
Xbar Chart by StoreStore * Truck Interaction
Unload Time by Store
Unload Time by Truck
Gauge R&R (Xbar/R) for Unload Time
P e r c e n t
S a m p l e R a n g e
S a m p l e M e a n
A v e r a g e
Truck
Truck
StoreA B C
1 2 3 4 5 6 7 8 9 10
1 2 3 4 5 6 7 8 9 10
??A
BC
??
% Study Var% Tolerance
Gauge R&R Repeat Reprod Part-To-Part
UCL = 33.04
UCL = 76.55
?? = 63.42
R = 32.83
LCL = 0
LCL = 30.29
97.1340.1956.93
2.87100.00
Figure 5.95 Gauge R&R report for live unload study.
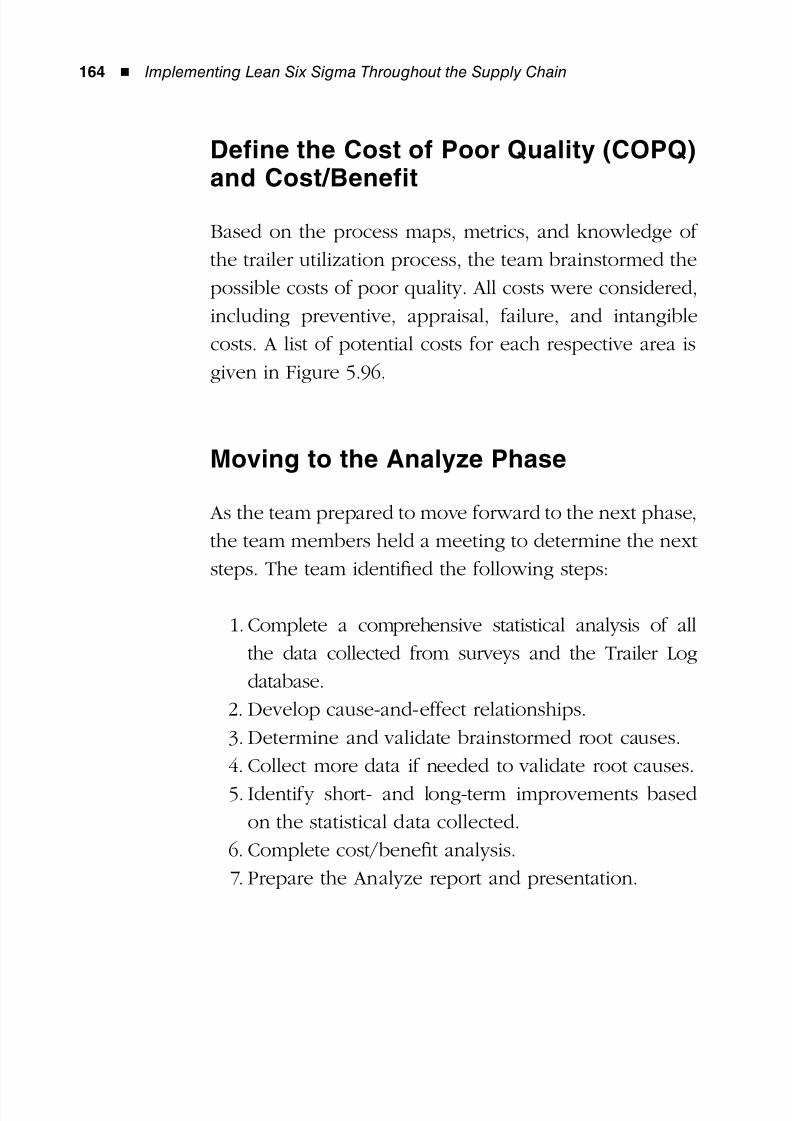
8/12/2019 Implementing Lean Six Sigma Throughout the Supply Chain
http://slidepdf.com/reader/full/implementing-lean-six-sigma-throughout-the-supply-chain 181/278
8/12/2019 Implementing Lean Six Sigma Throughout the Supply Chain
http://slidepdf.com/reader/full/implementing-lean-six-sigma-throughout-the-supply-chain 182/278
Measure Phase ◾ 165
P r e v e n t i o n C o s t s
A p p r a i s a l C o s t s
E x t e r n a l C o s
t s
I n t e r n a l C o s t s
I n t a n g i b l e C o s t s
1 . C r e a t i o n o f S O P s a n d
t r a
i n i n g o f t h e
m a t e r i a l
2 . W e e k l y t e a m
m e e t i n g s w i t h D r i v e r
C o
o r d i n a t o r s t o
r e v i e w c u r r e n t
p e
r f o r m a n c e
3 . T r a
i l e r q u a n t i t y h e l d t o
m e e t h i g h e s t l e v e l o f
d e
m a n d
4 . D r i v e r q u a n t i t y h e l d t o
m e e t h i g h e s t l e v e l o f
d e
m a n d
5 . T r a
i l e r m a i n t e n a n c e
1 . T r a i l e r L o g D a t a b a s e
q u e r y
f o r t h e A O S %
a n d L
O S %
2 . T i m e a n d m a t e r i a l s
a s s o c
i a t e d w i t h
d r i v e r
’ s
c o m m
u n i c a t i o n o f
l e a v e
t i m e a n d a r r i v a l
t i m e t o D r i v e r
C o o r d
i n a t o r
3 . T i m e a n d m a t e r i a l s
a s s o c
i a t e d w i t h
D r i v e r C o o r d i n a t o r ’ s
c r e a t i o n , l o g g i n g , a n d
c o m m
u n i c a t i o n o f
E T L a
n d E T A t o
d r i v e r
1 . M i s s e d s a l e d u e t o
z e r o s h e l f i n v e n t o r y
2 . L o s t c u s t o m e r d u e t o
l a c k o f f a
i t h t h a t w h a t
t h e y w a n
t w i l l b e o n
t h e s h e l f
1 . L a t e s h i p m e
n t s c a u s e
p o t e n t i a l d o w n t i m e
o r c r e a t e t h e
n e e d t o
r e d i r e c t p e r s
o n n e l
u n t i l t h e s h i p m e n t
a r r i v e s
2 . L a t e s h i p m e
n t s m a y
i n c r e a s e r i s k o f
p e r s o n n e l i n
j u r y d u e
t o a n e e d t o
c a t c h u p
w h i l e u n l o a d
i n g o r
s t o c k i n g t h e
l a t e
i t e m s
1 . D a m a g e d c o r p o r a t e
i m a g e , “ b e s t p r i c e , i f
i t i s o n t h e s h e l f ” ?
2 . I n t e r n a l c o r p o r a
t e
c o n fl i c t m a y b u i l d
r e s i s t a n c e t o f u t u r e
c o o p e r a t i o n
F i g u r e
5 . 9 6

8/12/2019 Implementing Lean Six Sigma Throughout the Supply Chain
http://slidepdf.com/reader/full/implementing-lean-six-sigma-throughout-the-supply-chain 183/278
8/12/2019 Implementing Lean Six Sigma Throughout the Supply Chain
http://slidepdf.com/reader/full/implementing-lean-six-sigma-throughout-the-supply-chain 184/278
167
6Chapter
Analyze Phase
Introduction
Now that the team had established a baseline of the
process and gained the voice of the customer, they
needed to do some problem solving. In the Analyze
phase, the team needs to focus on identifying potential
root causes of the problem: improve trailer utilization.
They also need to validate cause-and-effect relation-
ships between the key process input variables and the
key process output variables. By doing this, the team
should be able to identify the vital few root causes of
the problem. As expected, the team was given a set of
questions by their team leader, Anita, for the first meet-
ing of the Analyze phase.
What is the current state?◾
What are the root causes that impact the process?◾
Can we validate the root causes identified?◾
Is the current state as good as the process can do?◾
How does the root process perform? (variation◾
and target)
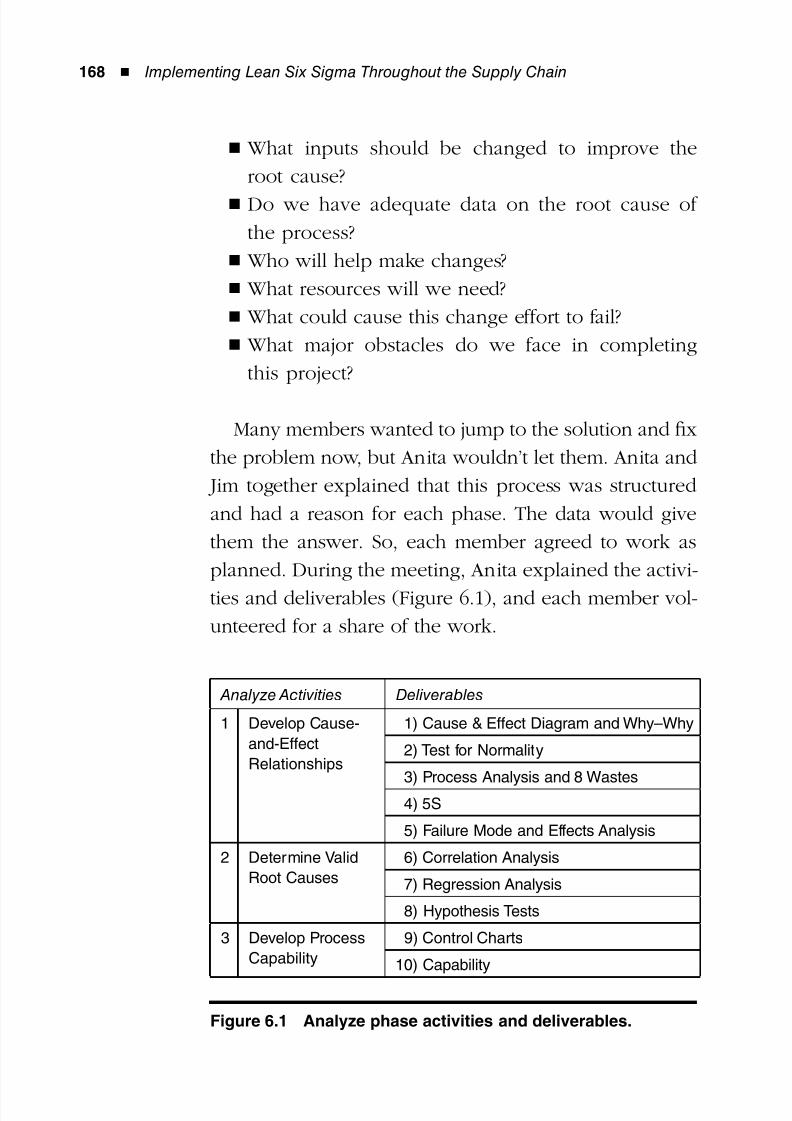
8/12/2019 Implementing Lean Six Sigma Throughout the Supply Chain
http://slidepdf.com/reader/full/implementing-lean-six-sigma-throughout-the-supply-chain 185/278
168 ◾ Implementing Lean Six Sigma Throughout the Supply Chain
What inputs should be changed to improve the◾
root cause?
Do we have adequate data on the root cause of◾
the process?
Who will help make changes?◾
What resources will we need?◾
What could cause this change effort to fail?◾
What major obstacles do we face in completing◾
this project?
Many members wanted to jump to the solution and fix
the problem now, but Anita wouldn’t let them. Anita and
Jim together explained that this process was structured
and had a reason for each phase. The data would give
them the answer. So, each member agreed to work as
planned. During the meeting, Anita explained the activi-
ties and deliverables (Figure 6.1), and each member vol-
unteered for a share of the work.
Analyze Activities Deliverables
1 Develop Cause-
and-Effect
Relationships
1) Cause & Effect Diagram and Why–Why
2) Test for Normality
3) Process Analysis and 8 Wastes
4) 5S
5) Failure Mode and Effects Analysis
2 Determine Valid
Root Causes
6) Correlation Analysis
7) Regression Analysis
8) Hypothesis Tests
3 Develop Process
Capability
9) Control Charts
10) Capability
Figure 6.1 Analyze phase activities and deliverables.
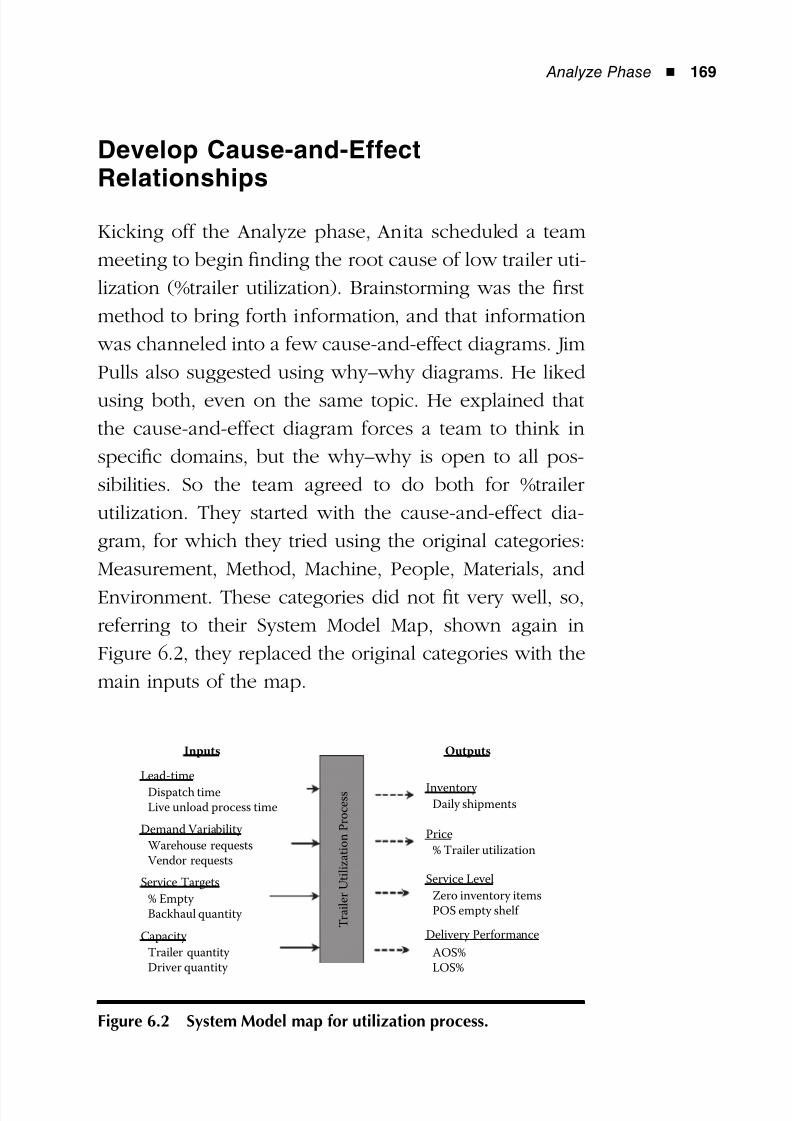
8/12/2019 Implementing Lean Six Sigma Throughout the Supply Chain
http://slidepdf.com/reader/full/implementing-lean-six-sigma-throughout-the-supply-chain 186/278
Analyze Phase ◾ 169
Develop Cause-and-EffectRelationships
Kicking off the Analyze phase, Anita scheduled a team
meeting to begin finding the root cause of low trailer uti-
lization (%trailer utilization). Brainstorming was the first
method to bring forth information, and that information
was channeled into a few cause-and-effect diagrams. Jim
Pulls also suggested using why–why diagrams. He liked
using both, even on the same topic. He explained that
the cause-and-effect diagram forces a team to think in
specific domains, but the why–why is open to all pos-
sibilities. So the team agreed to do both for %trailer
utilization. They started with the cause-and-effect dia-
gram, for which they tried using the original categories:
Measurement, Method, Machine, People, Materials, and
Environment. These categories did not fit very well, so,
referring to their System Model Map, shown again in
Figure 6.2, they replaced the original categories with the
main inputs of the map.
Inputs
Lead-time
Service Targets
Capacity
Inventory
Price
Service Level
Delivery Performance
Demand Variability
Outputs
Dispatch timeLive unload process time Daily shipments
% Trailer utilization
Zero inventory itemsPOS empty shelf
AOS%LOS%
Warehouse requestsVendor requests
% Empty Backhaul quantity
Trailer quantity Driver quantity
T r a i l e r U t i l i z a t i o n P r o c e s s
Figure 6.2 System Model map for utilization process.
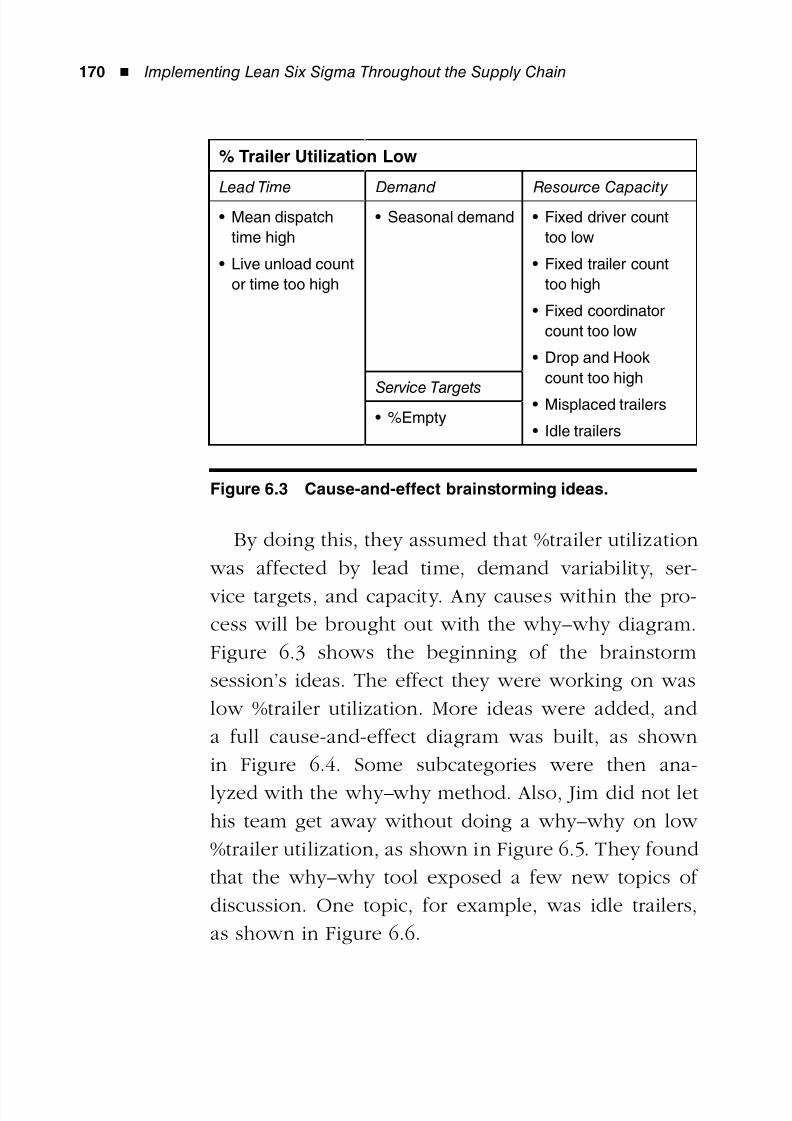
8/12/2019 Implementing Lean Six Sigma Throughout the Supply Chain
http://slidepdf.com/reader/full/implementing-lean-six-sigma-throughout-the-supply-chain 187/278
170 ◾ Implementing Lean Six Sigma Throughout the Supply Chain
By doing this, they assumed that %trailer utilization
was affected by lead time, demand variability, ser-
vice targets, and capacity. Any causes within the pro-
cess will be brought out with the why–why diagram.
Figure 6.3 shows the beginning of the brainstorm
session’s ideas. The effect they were working on was
low %trailer utilization. More ideas were added, and
a full cause-and-effect diagram was built, as shown
in Figure 6.4. Some subcategories were then ana-
lyzed with the why–why method. Also, Jim did not let
his team get away without doing a why–why on low
%trailer utilization, as shown in Figure 6.5. They found
that the why–why tool exposed a few new topics of
discussion. One topic, for example, was idle trailers,
as shown in Figure 6.6.
% Trailer Utilization Low
Lead Time Demand Resource Capacity
Mean dispatch•
time high
Live unload count•
or time too high
Seasonal demand• Fixed driver count•
too low
Fixed trailer count•
too high
Fixed coordinator•
count too low
Drop and Hook•
count too high
Misplaced trailers•
Idle trailers•
Service Targets%Empty•
Figure 6.3 Cause-and-effect brainstorming ideas.
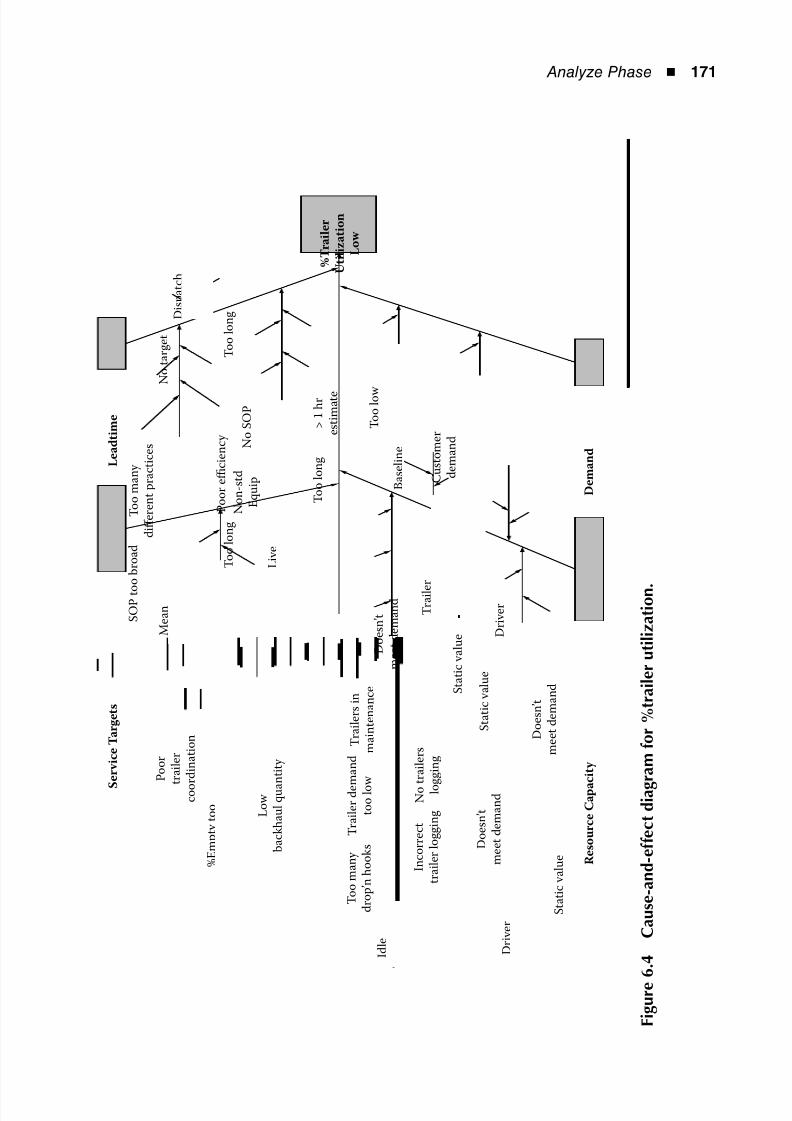
8/12/2019 Implementing Lean Six Sigma Throughout the Supply Chain
http://slidepdf.com/reader/full/implementing-lean-six-sigma-throughout-the-supply-chain 188/278
Analyze Phase ◾ 171
S
e r v i c e T a r g e t s
L e a d t i m e
% T r a i l e r
U t i l i z a t i o n
L o w
D e m a n d
R e s o u r c e C a p a
c i t y
P o o r
t r a i l e r
c o o r d i n a t i o n
S O P t o
o b r o a d
T o o m a n y
d i ff e r e n t p r a c t i c e s
L o w
b a c k h a u l q u a n t i t y
% E m p t y t o o
C l o s e t o 5 0 %
M e a n
D i s p a t c h
T i m e
D i s p a t c h
t o T o u c h
T i m e
L i v e
U n l o a d
B a s e l i n e
T r a i l e
r
C o u n
t
I d l e
T r a i l e r s
D r i v e r
C o u n t
S e a s o n a l
N o t a r g e t
T o o l o n g
T o o l o n g
T o o l o n g
T o o l o w
C u s t o m e r
d e m a n d
D o e s n ’ t
m e e t d e m a n d
D o e s n ’ t
m e e t d e m a n d
S t a t i c v a l u e
D o e s n ’ t
m e e t d e m a n d S
t a t i c v a l u e
S t a t i c v a l u e
> 1 h r
e s t i m a t e
N o S O P
N o n - s t d
E q u i p
P o o r e ffi c i e n c y
T o o m a n y
d r o p ’ n h o o k s
T r a i l e r d e m a n d
t o o l o w
T r a i l e r s i n
m a i n t e n a n c e
N o t r a i l e r s
l o g g i n g
I n c o r r e c t
t r a i l e r l o g g i n g
M i s p l a c e d
T r a i l e r s
D r i v e r
C o o r d i n a t o r
C o u n t
F i g u r e
6 . 4
C a u s e - a n d - e
f f e c t d i a g
r a m f o r % t r a i l e r u t i l i z a t i o n .
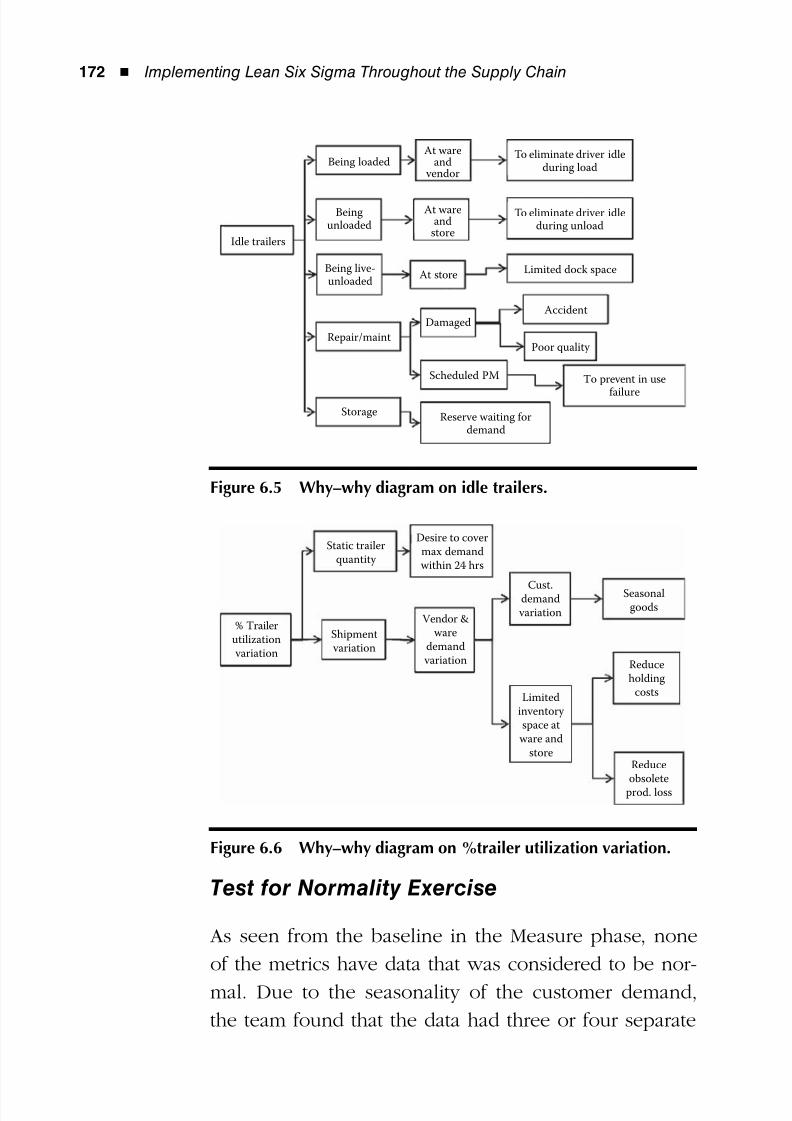
8/12/2019 Implementing Lean Six Sigma Throughout the Supply Chain
http://slidepdf.com/reader/full/implementing-lean-six-sigma-throughout-the-supply-chain 189/278
172 ◾ Implementing Lean Six Sigma Throughout the Supply Chain
Test for Normality Exercise
As seen from the baseline in the Measure phase, none
of the metrics have data that was considered to be nor-
mal. Due to the seasonality of the customer demand,
the team found that the data had three or four separate
Idle trailers
Being loaded
Beingunloaded
Being live-unloaded
Repair/maint
Storage
At store
Damaged
Scheduled PM
Reserve waiting fordemand
To prevent in use
failure
Poor quality
Accident
Limited dock space
To eliminate driver idleduring unload
To eliminate driver idleduring load
At wareand
vendor
At wareand
store
Figure 6.5 Why–why diagram on idle trailers.
Static trailer
quantity
Shipment
variation
Vendor &
ware
demand
variation
Limited
inventory
space at
ware and
storeReduce
obsolete
prod. loss
Reduce
holding
costs
Seasonalgoods
Cust.demand
variation
Desire to cover
max demand
within 24 hrs
% Trailer
utilization
variation
Figure 6.6 Why–why diagram on %trailer utilization variation.
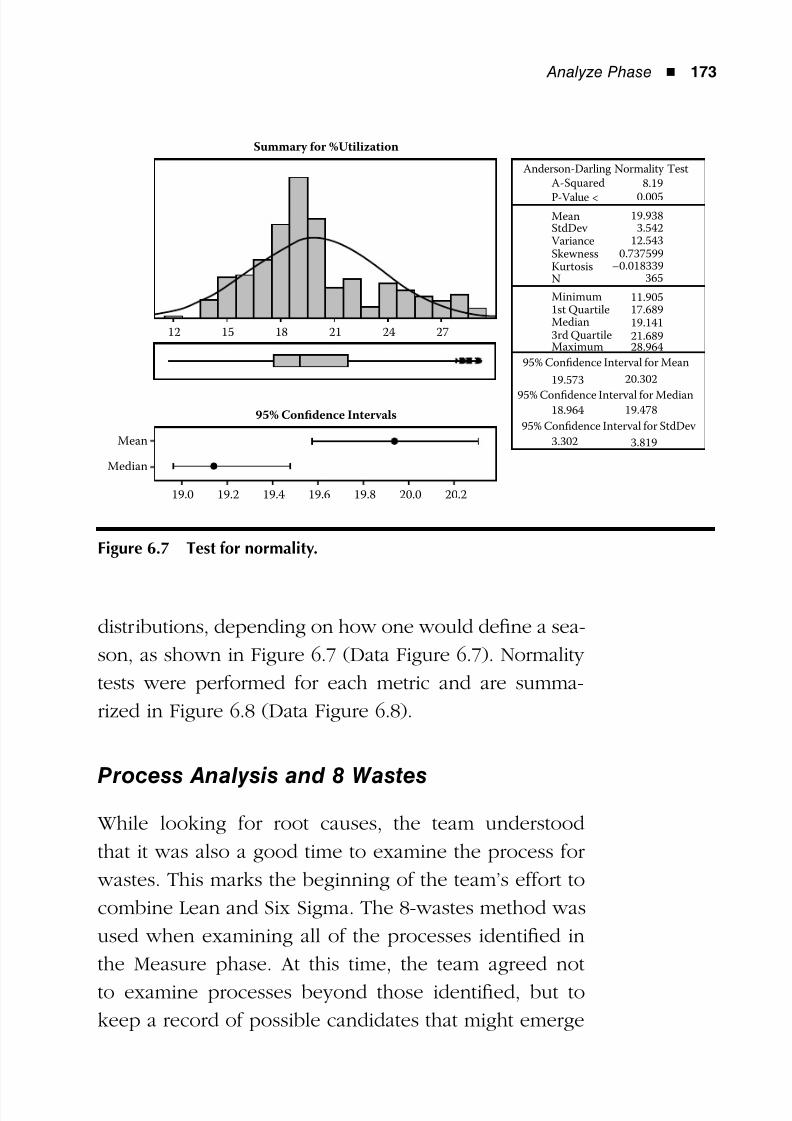
8/12/2019 Implementing Lean Six Sigma Throughout the Supply Chain
http://slidepdf.com/reader/full/implementing-lean-six-sigma-throughout-the-supply-chain 190/278
Analyze Phase ◾ 173
distributions, depending on how one would define a sea-
son, as shown in Figure 6.7 (Data Figure 6.7). Normality
tests were performed for each metric and are summa-
rized in Figure 6.8 (Data Figure 6.8).
Process Analysis and 8 Wastes
While looking for root causes, the team understood
that it was also a good time to examine the process for
wastes. This marks the beginning of the team’s effort to
combine Lean and Six Sigma. The 8-wastes method was
used when examining all of the processes identified in
the Measure phase. At this time, the team agreed not
to examine processes beyond those identified, but to
keep a record of possible candidates that might emerge
Anderson-Darling Normality Test
95% Confidence Interval for Mean
95% Confidence Interval for Median
95% Confidence Interval for StdDev
A-Squared 8.19
0.005
19.9383.542
12.5430.737599
–0.018339365
11.90517.68919.14121.68928.964
20.302
19.478
3.819
P-Value <
MeanStdDev VarianceSkewnessKurtosis
Minimum1st Quartile
3rd QuartileMedian
Maximum
19.573
18.964
3.302
N
Summary for %Utilization
95% Confidence Intervals
12 15 18 21 24 27
Mean
Median
19.0 19.2 19.4 19.6 19.8 20.0 20.2
Figure 6.7 Test for normality.
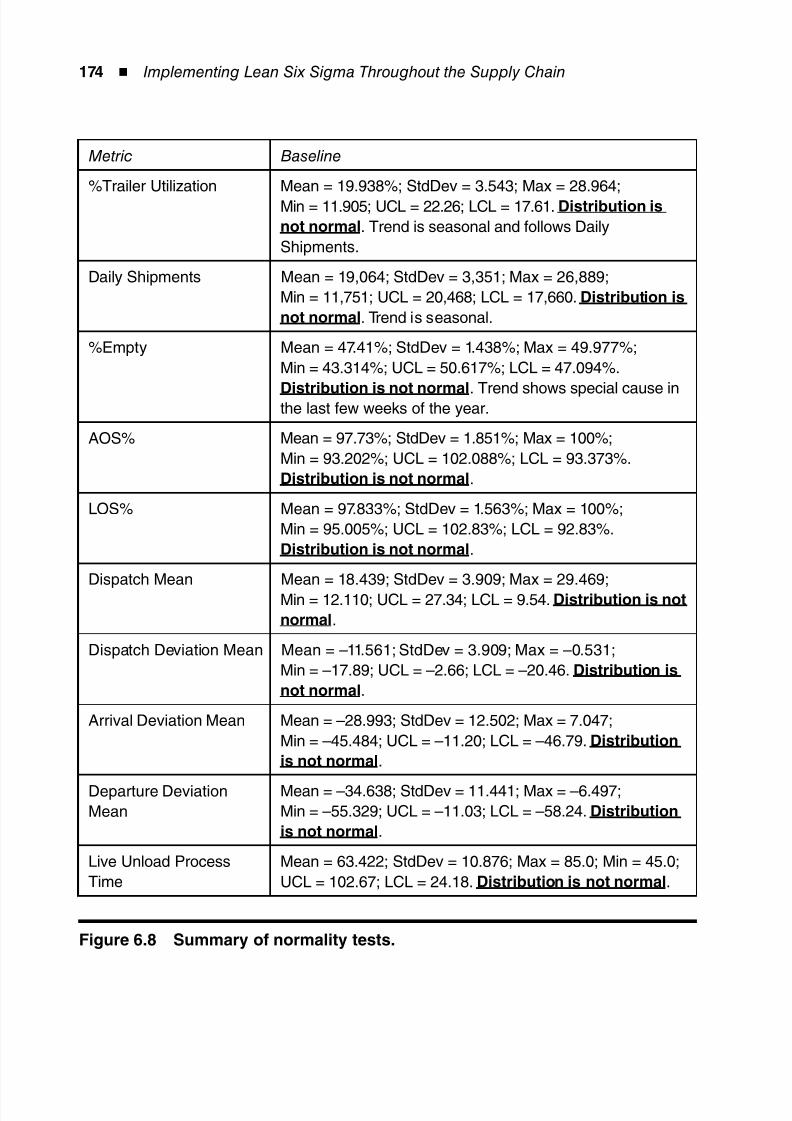
8/12/2019 Implementing Lean Six Sigma Throughout the Supply Chain
http://slidepdf.com/reader/full/implementing-lean-six-sigma-throughout-the-supply-chain 191/278
174 ◾ Implementing Lean Six Sigma Throughout the Supply Chain
Metric Baseline
%Trailer Utilization Mean = 19.938%; StdDev = 3.543; Max = 28.964;
Min = 11.905; UCL = 22.26; LCL = 17.61. Distribution is
not normal. Trend is seasonal and follows Daily
Shipments.
Daily Shipments Mean = 19,064; StdDev = 3,351; Max = 26,889;
Min = 11,751; UCL = 20,468; LCL = 17,660. Distribution is
not normal. Trend is seasonal.
%Empty Mean = 47.41%; StdDev = 1.438%; Max = 49.977%;
Min = 43.314%; UCL = 50.617%; LCL = 47.094%.
Distribution is not normal. Trend shows special cause inthe last few weeks of the year.
AOS% Mean = 97.73%; StdDev = 1.851%; Max = 100%;
Min = 93.202%; UCL = 102.088%; LCL = 93.373%.
Distribution is not normal.
LOS% Mean = 97.833%; StdDev = 1.563%; Max = 100%;
Min = 95.005%; UCL = 102.83%; LCL = 92.83%.
Distribution is not normal.
Dispatch Mean Mean = 18.439; StdDev = 3.909; Max = 29.469;
Min = 12.110; UCL = 27.34; LCL = 9.54. Distribution is not
normal.
Dispatch Deviation Mean Mean = –11.561; StdDev = 3.909; Max = –0.531;
Min = –17.89; UCL = –2.66; LCL = –20.46. Distribution is
not normal.
Arrival Deviation Mean Mean = –28.993; StdDev = 12.502; Max = 7.047;
Min = –45.484; UCL = –11.20; LCL = –46.79. Distribution
is not normal.
Departure DeviationMean
Mean = –34.638; StdDev = 11.441; Max = –6.497;Min = –55.329; UCL = –11.03; LCL = –58.24. Distribution
is not normal.
Live Unload Process
Time
Mean = 63.422; StdDev = 10.876; Max = 85.0; Min = 45.0;
UCL = 102.67; LCL = 24.18. Distribution is not normal.
Figure 6.8 Summary of normality tests.
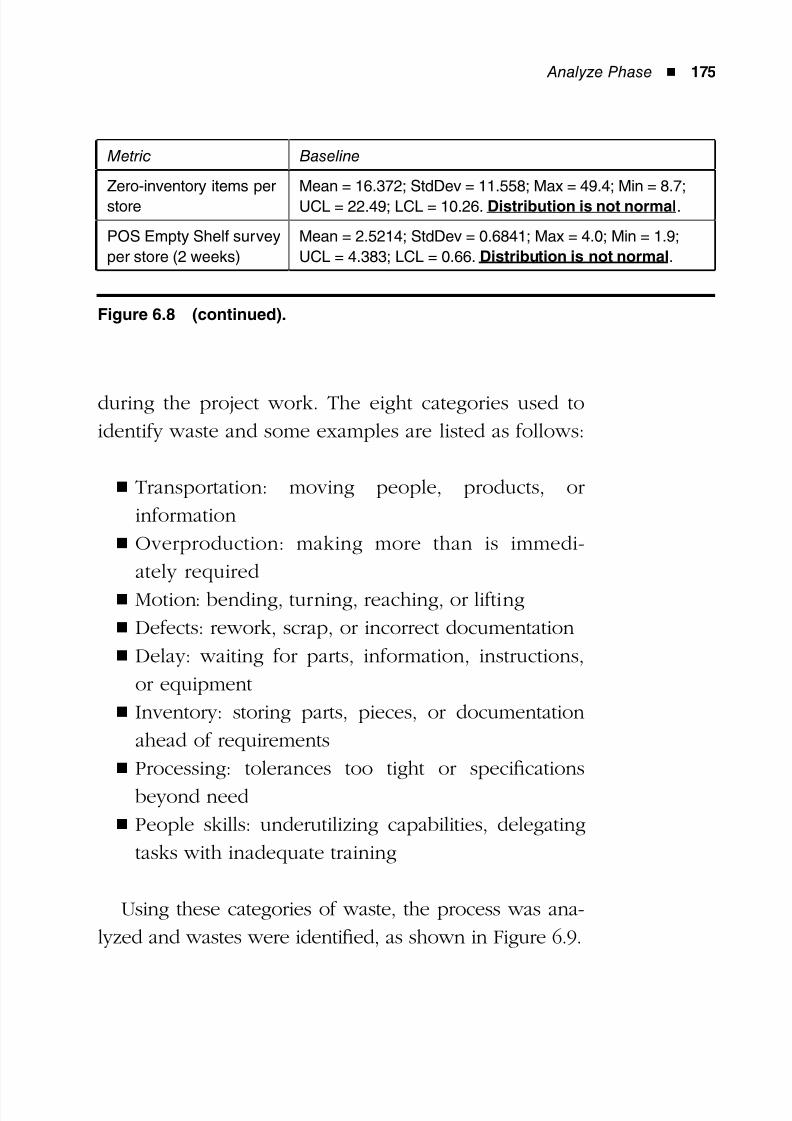
8/12/2019 Implementing Lean Six Sigma Throughout the Supply Chain
http://slidepdf.com/reader/full/implementing-lean-six-sigma-throughout-the-supply-chain 192/278
Analyze Phase ◾ 175
during the project work. The eight categories used to
identify waste and some examples are listed as follows:
Transportation: moving people, products, or◾
information
Overproduction: making more than is immedi-◾
ately required
Motion: bending, turning, reaching, or lifting◾
Defects: rework, scrap, or incorrect documentation◾
Delay: waiting for parts, information, instructions,◾
or equipment
Inventory: storing parts, pieces, or documentation◾
ahead of requirements
Processing: tolerances too tight or specifications◾
beyond need
People skills: underutilizing capabilities, delegating◾
tasks with inadequate training
Using these categories of waste, the process was ana-
lyzed and wastes were identified, as shown in Figure 6.9.
Metric Baseline
Zero-inventory items per
store
Mean = 16.372; StdDev = 11.558; Max = 49.4; Min = 8.7;
UCL = 22.49; LCL = 10.26. Distribution is not normal.
POS Empty Shelf survey
per store (2 weeks)
Mean = 2.5214; StdDev = 0.6841; Max = 4.0; Min = 1.9;
UCL = 4.383; LCL = 0.66. Distribution is not normal.
Figure 6.8 (continued).
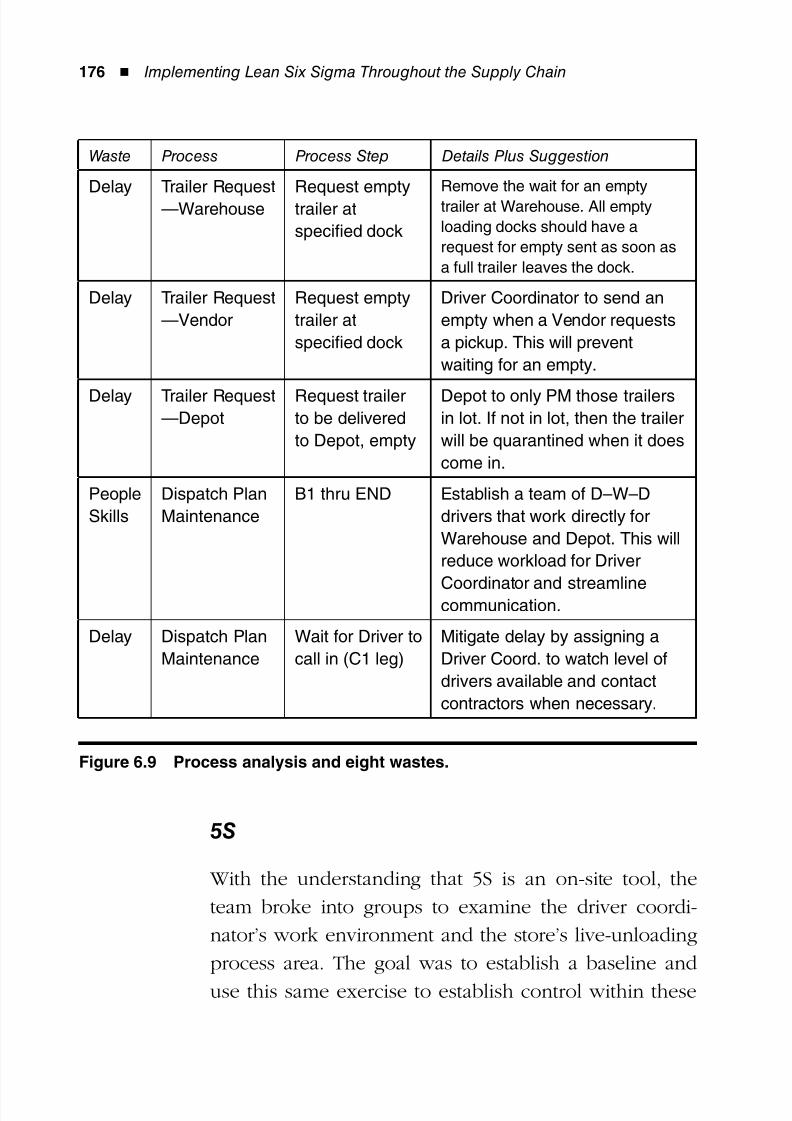
8/12/2019 Implementing Lean Six Sigma Throughout the Supply Chain
http://slidepdf.com/reader/full/implementing-lean-six-sigma-throughout-the-supply-chain 193/278
176 ◾ Implementing Lean Six Sigma Throughout the Supply Chain
5S
With the understanding that 5S is an on-site tool, the
team broke into groups to examine the driver coordi-
nator’s work environment and the store’s live-unloading
process area. The goal was to establish a baseline and
use this same exercise to establish control within these
Waste Process Process Step Details Plus Suggestion
Delay Trailer Request
—Warehouse
Request empty
trailer at
specified dock
Remove the wait for an empty
trailer at Warehouse. All empty
loading docks should have a
request for empty sent as soon as
a full trailer leaves the dock.
Delay Trailer Request
—Vendor
Request empty
trailer at
specified dock
Driver Coordinator to send an
empty when a Vendor requests
a pickup. This will prevent
waiting for an empty.
Delay Trailer Request—Depot
Request trailerto be delivered
to Depot, empty
Depot to only PM those trailersin lot. If not in lot, then the trailer
will be quarantined when it does
come in.
People
Skills
Dispatch Plan
Maintenance
B1 thru END Establish a team of D–W–D
drivers that work directly for
Warehouse and Depot. This will
reduce workload for Driver
Coordinator and streamlinecommunication.
Delay Dispatch Plan
Maintenance
Wait for Driver to
call in (C1 leg)
Mitigate delay by assigning a
Driver Coord. to watch level of
drivers available and contact
contractors when necessary.
Figure 6.9 Process analysis and eight wastes.
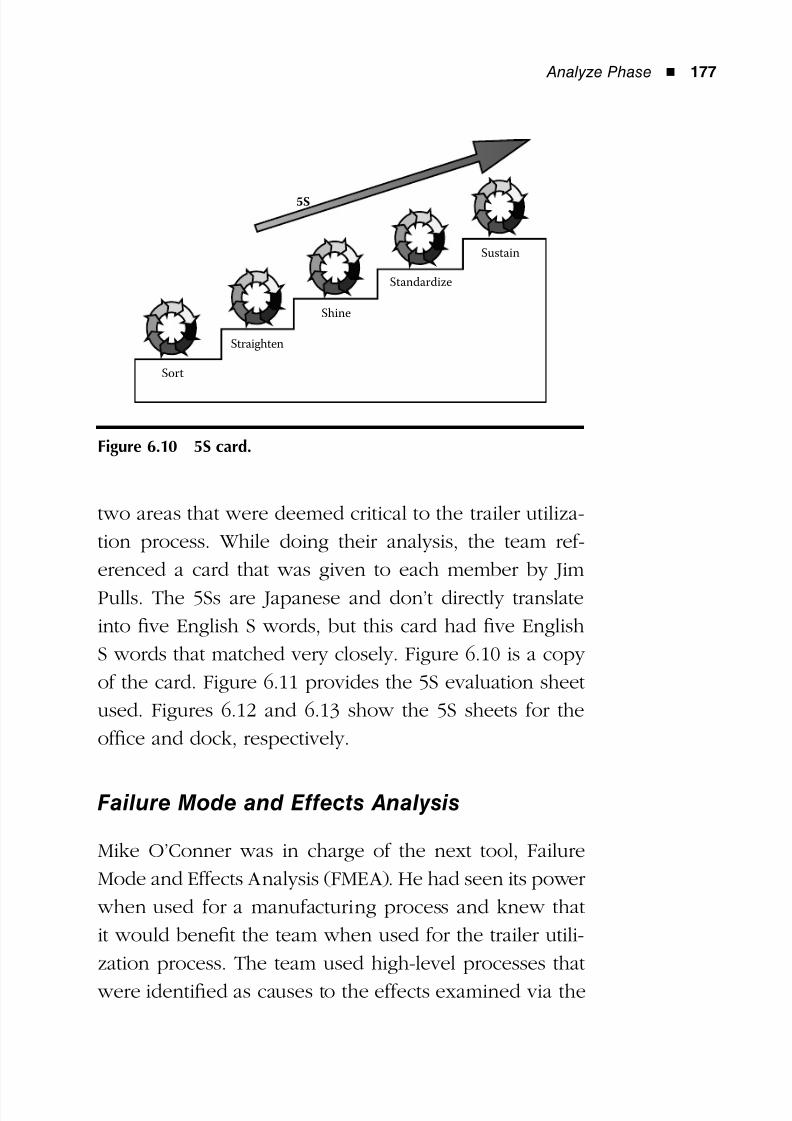
8/12/2019 Implementing Lean Six Sigma Throughout the Supply Chain
http://slidepdf.com/reader/full/implementing-lean-six-sigma-throughout-the-supply-chain 194/278
Analyze Phase ◾ 177
two areas that were deemed critical to the trailer utiliza-
tion process. While doing their analysis, the team ref-
erenced a card that was given to each member by Jim
Pulls. The 5Ss are Japanese and don’t directly translate
into five English S words, but this card had five English
S words that matched very closely. Figure 6.10 is a copy
of the card. Figure 6.11 provides the 5S evaluation sheet
used. Figures 6.12 and 6.13 show the 5S sheets for the
office and dock, respectively.
Failure Mode and Effects Analysis
Mike O’Conner was in charge of the next tool, Failure
Mode and Effects Analysis (FMEA). He had seen its power
when used for a manufacturing process and knew that
it would benefit the team when used for the trailer utili-
zation process. The team used high-level processes that
were identified as causes to the effects examined via the
5S
Sort
Straighten
Shine
Standardize
Sustain
Figure 6.10 5S card.
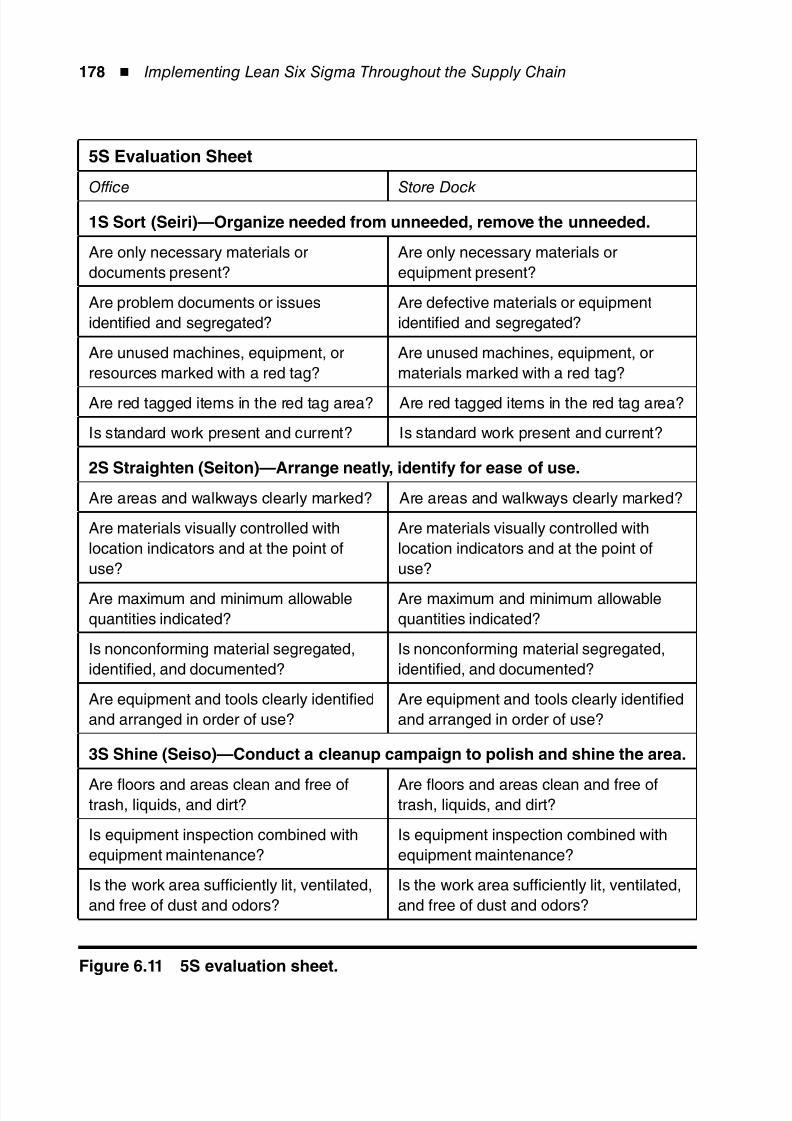
8/12/2019 Implementing Lean Six Sigma Throughout the Supply Chain
http://slidepdf.com/reader/full/implementing-lean-six-sigma-throughout-the-supply-chain 195/278
178 ◾ Implementing Lean Six Sigma Throughout the Supply Chain
5S Evaluation Sheet
Office Store Dock
1S Sort (Seiri)—Organize needed from unneeded, remove the unneeded.
Are only necessary materials or
documents present?
Are only necessary materials or
equipment present?
Are problem documents or issues
identified and segregated?
Are defective materials or equipment
identified and segregated?
Are unused machines, equipment, or
resources marked with a red tag?
Are unused machines, equipment, or
materials marked with a red tag?
Are red tagged items in the red tag area? Are red tagged items in the red tag area?
Is standard work present and current? Is standard work present and current?
2S Straighten (Seiton)—Arrange neatly, identify for ease of use.
Are areas and walkways clearly marked? Are areas and walkways clearly marked?
Are materials visually controlled with
location indicators and at the point of
use?
Are materials visually controlled with
location indicators and at the point of
use?
Are maximum and minimum allowable
quantities indicated?
Are maximum and minimum allowable
quantities indicated?
Is nonconforming material segregated,
identified, and documented?
Is nonconforming material segregated,
identified, and documented?
Are equipment and tools clearly identified
and arranged in order of use?
Are equipment and tools clearly identified
and arranged in order of use?
3S Shine (Seiso)—Conduct a cleanup campaign to polish and shine the area.
Are floors and areas clean and free oftrash, liquids, and dirt?
Are floors and areas clean and free oftrash, liquids, and dirt?
Is equipment inspection combined with
equipment maintenance?
Is equipment inspection combined with
equipment maintenance?
Is the work area sufficiently lit, ventilated,
and free of dust and odors?
Is the work area sufficiently lit, ventilated,
and free of dust and odors?
Figure 6.11 5S evaluation sheet.
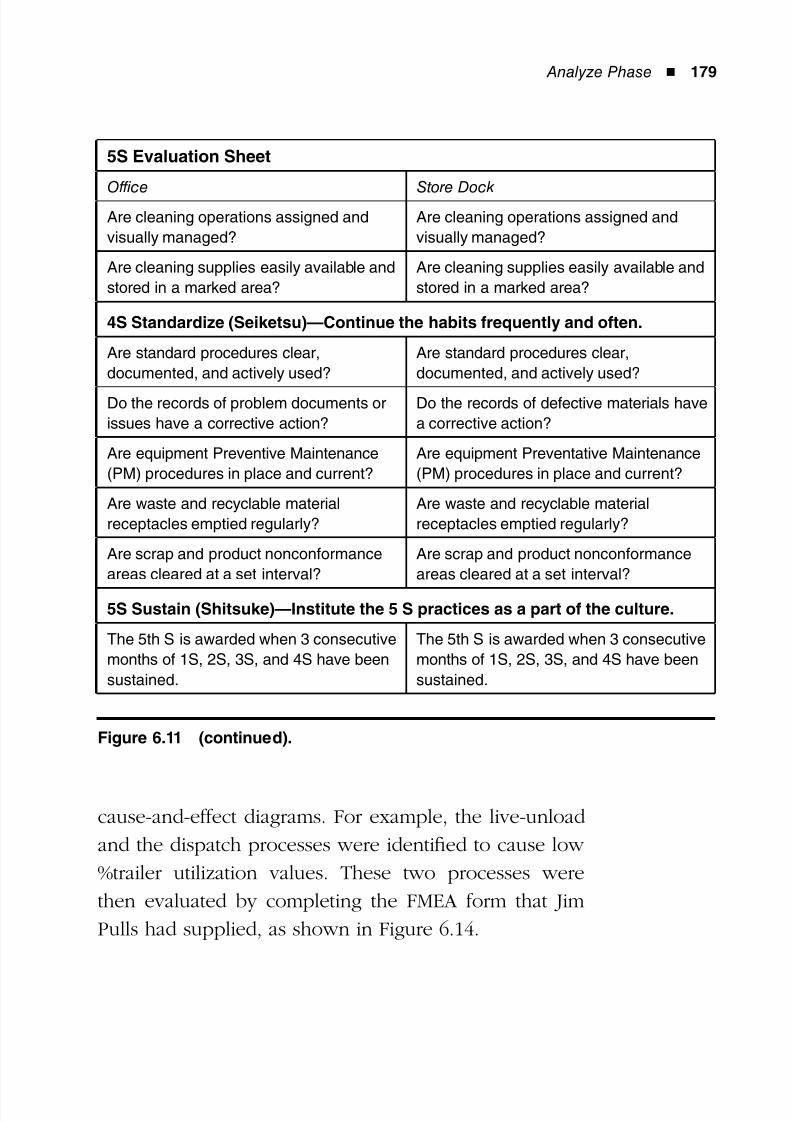
8/12/2019 Implementing Lean Six Sigma Throughout the Supply Chain
http://slidepdf.com/reader/full/implementing-lean-six-sigma-throughout-the-supply-chain 196/278
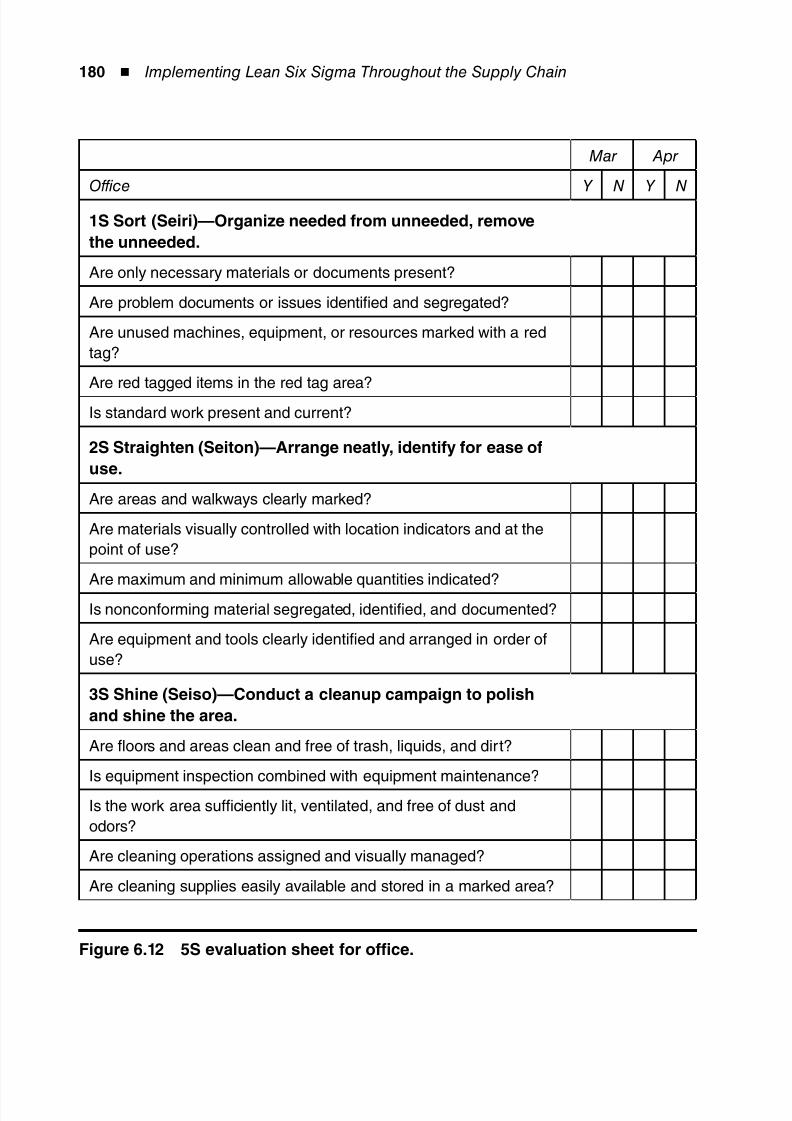
8/12/2019 Implementing Lean Six Sigma Throughout the Supply Chain
http://slidepdf.com/reader/full/implementing-lean-six-sigma-throughout-the-supply-chain 197/278
180 ◾ Implementing Lean Six Sigma Throughout the Supply Chain
Mar Apr
Office Y N Y N
1S Sort (Seiri)—Organize needed from unneeded, remove
the unneeded.
Are only necessary materials or documents present?
Are problem documents or issues identified and segregated?
Are unused machines, equipment, or resources marked with a red
tag?
Are red tagged items in the red tag area?
Is standard work present and current?
2S Straighten (Seiton)—Arrange neatly, identify for ease of
use.
Are areas and walkways clearly marked?
Are materials visually controlled with location indicators and at the
point of use?
Are maximum and minimum allowable quantities indicated?
Is nonconforming material segregated, identified, and documented?
Are equipment and tools clearly identified and arranged in order of
use?
3S Shine (Seiso)—Conduct a cleanup campaign to polish
and shine the area.
Are floors and areas clean and free of trash, liquids, and dirt?
Is equipment inspection combined with equipment maintenance?
Is the work area sufficiently lit, ventilated, and free of dust and
odors?
Are cleaning operations assigned and visually managed?
Are cleaning supplies easily available and stored in a marked area?
Figure 6.12 5S evaluation sheet for office.
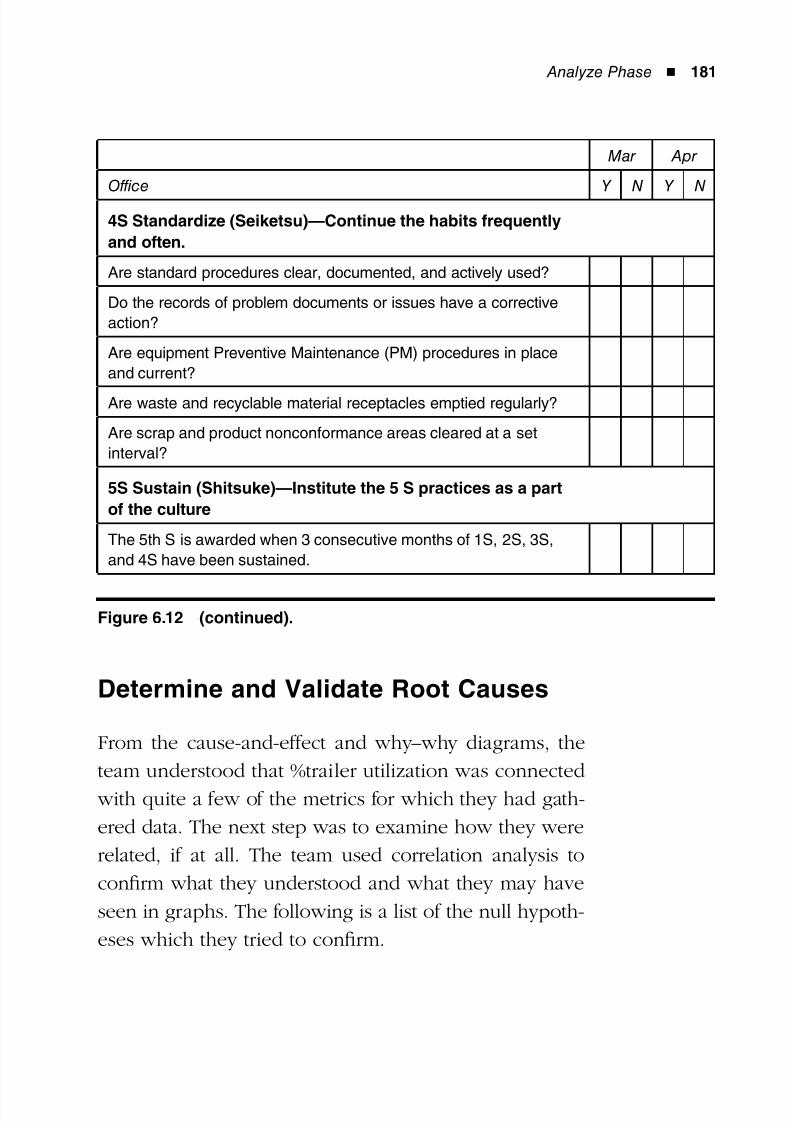
8/12/2019 Implementing Lean Six Sigma Throughout the Supply Chain
http://slidepdf.com/reader/full/implementing-lean-six-sigma-throughout-the-supply-chain 198/278
Analyze Phase ◾ 181
Determine and Validate Root Causes
From the cause-and-effect and why–why diagrams, the
team understood that %trailer utilization was connected
with quite a few of the metrics for which they had gath-
ered data. The next step was to examine how they were
related, if at all. The team used correlation analysis to
confirm what they understood and what they may have
seen in graphs. The following is a list of the null hypoth-
eses which they tried to confirm.
Mar Apr
Office Y N Y N
4S Standardize (Seiketsu)—Continue the habits frequently
and often.
Are standard procedures clear, documented, and actively used?
Do the records of problem documents or issues have a corrective
action?
Are equipment Preventive Maintenance (PM) procedures in place
and current?
Are waste and recyclable material receptacles emptied regularly?
Are scrap and product nonconformance areas cleared at a set
interval?
5S Sustain (Shitsuke)—Institute the 5 S practices as a part
of the culture
The 5th S is awarded when 3 consecutive months of 1S, 2S, 3S,
and 4S have been sustained.
Figure 6.12 (continued).
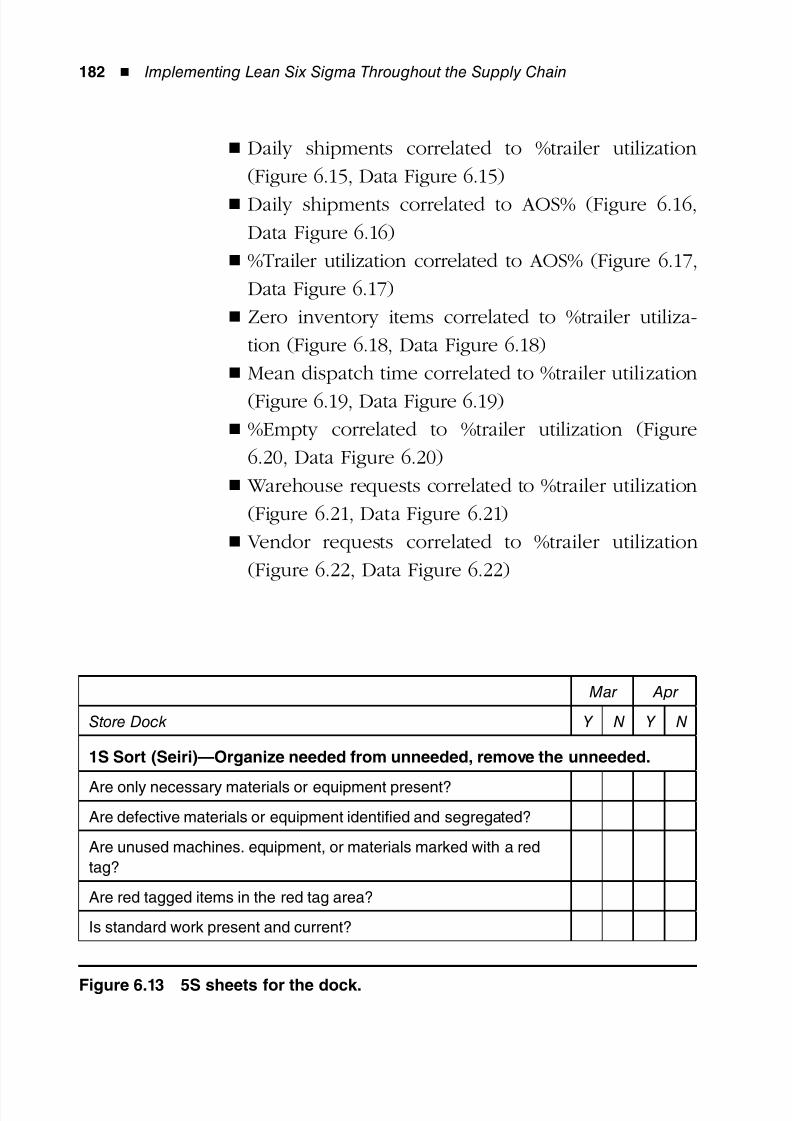
8/12/2019 Implementing Lean Six Sigma Throughout the Supply Chain
http://slidepdf.com/reader/full/implementing-lean-six-sigma-throughout-the-supply-chain 199/278
182 ◾ Implementing Lean Six Sigma Throughout the Supply Chain
Daily shipments correlated to %trailer utilization◾
(Figure 6.15, Data Figure 6.15)
Daily shipments correlated to AOS% (Figure 6.16,◾
Data Figure 6.16)
%Trailer utilization correlated to AOS% (Figure 6.17,◾
Data Figure 6.17)
Zero inventory items correlated to %trailer utiliza-◾
tion (Figure 6.18, Data Figure 6.18)
Mean dispatch time correlated to %trailer utilization◾
(Figure 6.19, Data Figure 6.19)
%Empty correlated to %trailer utilization (Figure◾
6.20, Data Figure 6.20)
Warehouse requests correlated to %trailer utilization◾
(Figure 6.21, Data Figure 6.21)
Vendor requests correlated to %trailer utilization◾
(Figure 6.22, Data Figure 6.22)
Mar Apr
Store Dock Y N Y N
1S Sort (Seiri)—Organize needed from unneeded, remove the unneeded.
Are only necessary materials or equipment present?
Are defective materials or equipment identified and segregated?
Are unused machines. equipment, or materials marked with a red
tag?
Are red tagged items in the red tag area?
Is standard work present and current?
Figure 6.13 5S sheets for the dock.
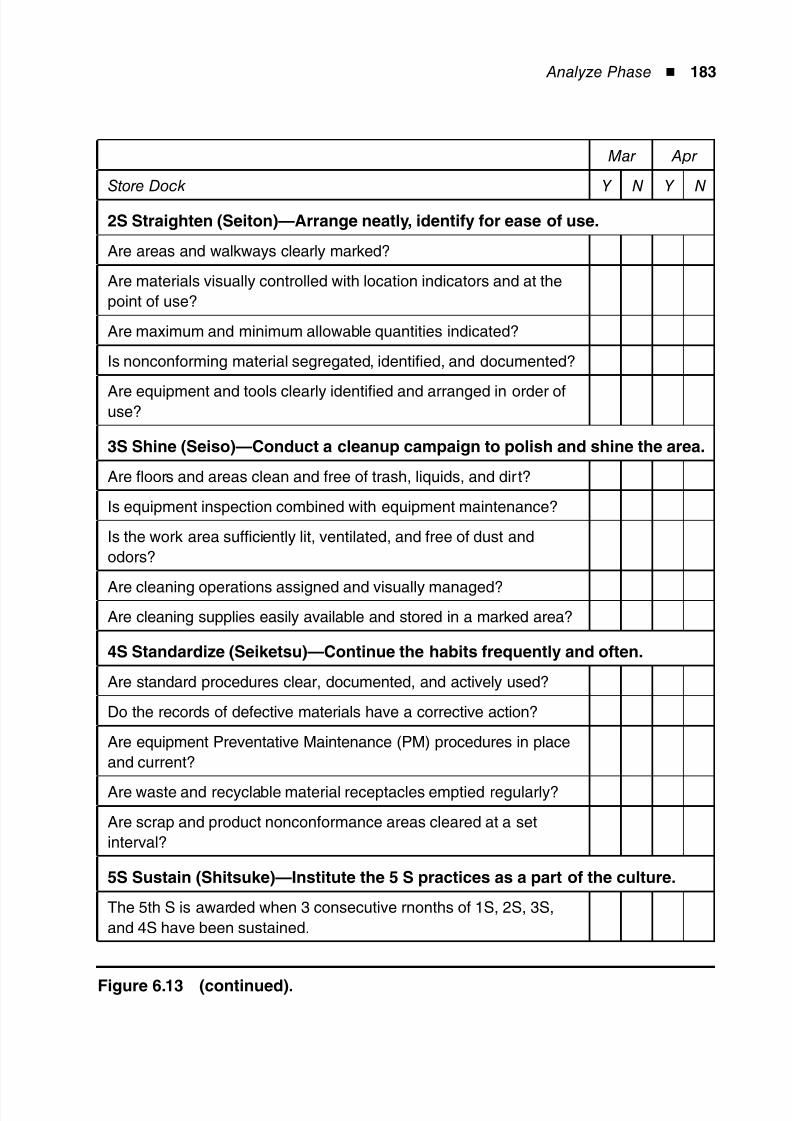
8/12/2019 Implementing Lean Six Sigma Throughout the Supply Chain
http://slidepdf.com/reader/full/implementing-lean-six-sigma-throughout-the-supply-chain 200/278
Analyze Phase ◾ 183
Mar Apr
Store Dock Y N Y N
2S Straighten (Seiton)—Arrange neatly, identify for ease of use.
Are areas and walkways clearly marked?
Are materials visually controlled with location indicators and at the
point of use?
Are maximum and minimum allowable quantities indicated?
Is nonconforming material segregated, identified, and documented?
Are equipment and tools clearly identified and arranged in order ofuse?
3S Shine (Seiso)—Conduct a cleanup campaign to polish and shine the area.
Are floors and areas clean and free of trash, liquids, and dirt?
Is equipment inspection combined with equipment maintenance?
Is the work area sufficiently lit, ventilated, and free of dust and
odors?
Are cleaning operations assigned and visually managed?
Are cleaning supplies easily available and stored in a marked area?
4S Standardize (Seiketsu)—Continue the habits frequently and often.
Are standard procedures clear, documented, and actively used?
Do the records of defective materials have a corrective action?
Are equipment Preventative Maintenance (PM) procedures in place
and current?
Are waste and recyclable material receptacles emptied regularly?
Are scrap and product nonconformance areas cleared at a set
interval?
5S Sustain (Shitsuke)—Institute the 5 S practices as a part of the culture.
The 5th S is awarded when 3 consecutive rnonths of 1S, 2S, 3S,
and 4S have been sustained.
Figure 6.13 (continued).
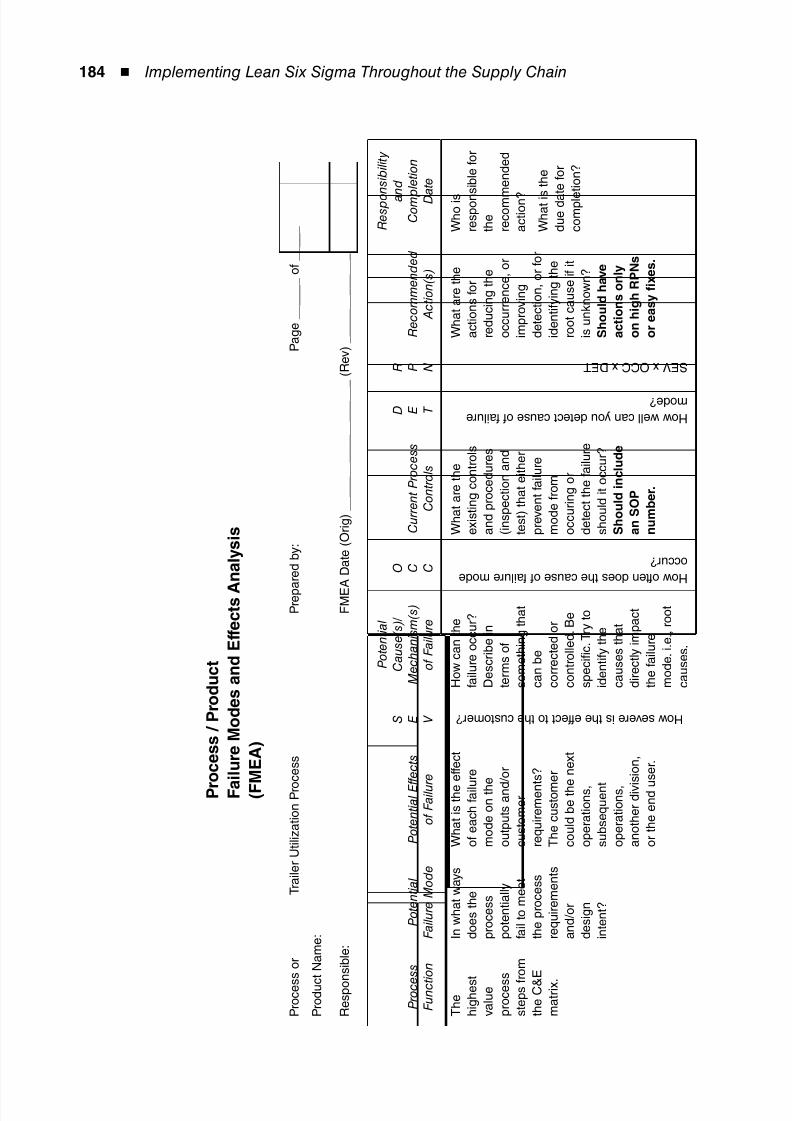
8/12/2019 Implementing Lean Six Sigma Throughout the Supply Chain
http://slidepdf.com/reader/full/implementing-lean-six-sigma-throughout-the-supply-chain 201/278
184 ◾ Implementing Lean Six Sigma Throughout the Supply Chain
P r o c e s s / P r o d u c t
F a
i l u r e M o d e s a n d E f f e c t s A
n a l y s i s
( F M E A )
P r o c e s
s o r
P r o d u c
t N a m e :
T r a i l e r U t i l i z a t i o n P r o
c e s s
P r e p a r e d b y :
P a g e______ o f_____
R e s p o n s i b l e :
F M E A D a t e ( O r i g )__________________
_ ( R e v )_____________
P r o c e
s s
F u n c t i o n
P o t e n t i a l
F a i l u r e M o d e
P o t e n t i a l E f f e c t s
o f F a i l u r
e
S E V
P o t e n t i a l
C a u s e ( s ) /
M e c h a n i s m ( s )
o f F a i l u r e
O C C
C u r r e n t P r o c e s s
C o n t r o l s
D E T
R P N
R e c o m m e n d e d
A c t i o n ( s )
R e s p o n s i b i l i t y
a n d
C o m p
l e t i o n
D a t e
T h e h i g h e s t
v a l u e
p r o c e s s
s t e p s f r o m
t h e C &
E
m a t r i x .
I n w h a t w a y s
d o e s t h e
p r o c e s s
p o t e n t i a l l y
f a i l t o m e e t
t h e p r o c e s s
r e q u i r e m e n t s
a n d / o r
d e s i g n
i n t e n t ?
W h a t i s t h e
e f f e c t
o f e a c h f a i l u
r e
m o d e o n t h e
o u t p u t s a n d
/ o r
c u s t o m e r
r e q u i r e m e n t s ?
T h e c u s t o m
e r
c o u l d b e t h e
n e x t
o p e r a t i o n s ,
s u b s e q u e n t
o p e r a t i o n s ,
a n o t h e r d i v i s i o n ,
o r t h e e n d u
s e r .
H o w s e v e r e i s t h e e f f e c t t o t h e c u s t o m e r ?
H o w c a n t h e
f a i l u r e o c c u r ?
D e s c r i b e i n
t e r m s o f
s o m e t h i n g t h a t
c a n b e
c o r r e c t e d o r
c o n t r o l l e d . B e
s p e c i fi c . T r y t o
i d e n t i f y t h e
c a u s e s t h a t
d i r e c t l y i m p a c t
t h e f a i l u r e
m o d e . i . e . , r o o t
c a u s e s .
H o w o f t e n d o e s t h e c a u s e o f f a i l u r e m o d e
o c c u r ?
W h a t a r e t h e
e x i s t i n g c o n t r o l s
a n d p r o c e d u r e s
( i n s p e c t i o n a n d
t e s t ) t h a t e i t h e r
p r e v e n t f a i l u r e
m o d e f r o m
o c c u r i n g o r
d e t e c t t h e f a i l u r e
s h o u l d i t o c c u r ?
S h o u l d i n c l u d e
a n S O P
n u m b e r .
H o w w e l l c a n y o u d e t e c t c a u s e o f f a i l u r e
m o d e ?
S E V x O C C x D E T
W h a t a r e t h e
a c t i o n s f o r
r e d u c i n g t h e
o c c u r r e n c e , o r
i m p r o v i n g
d e t e c t i o n , o r f o r
i d e n t i f y i n g t h e
r o o t c a u s e i f i t
i s u n k n o w n ?
S h o u l d h a v e
a c t i o n s o n l y
o n h i g h R P N s
o r e a s y fi x e s .
W h o i s
r e s p o n s i b l e f o r
t h e
r e c o m m
e n d e d
a c t i o n ?
W h a t i s
t h e
d u e d a t e f o r
c o m p l e
t i o n ?
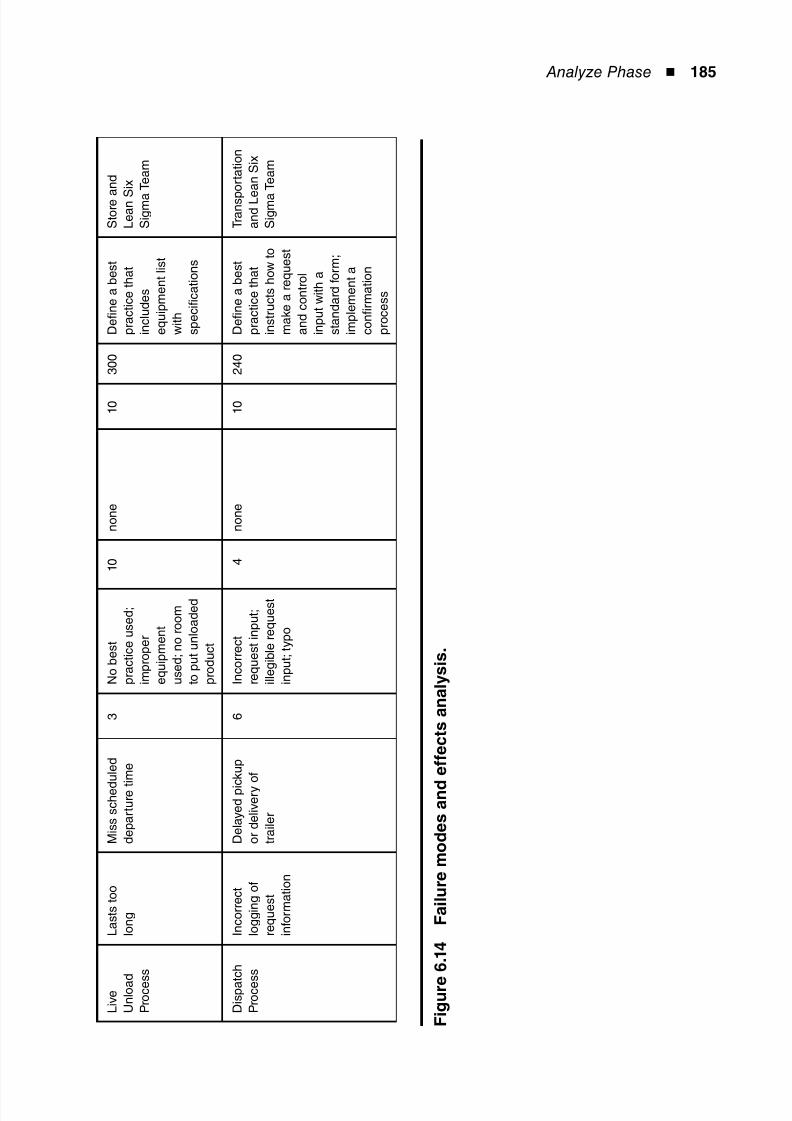
8/12/2019 Implementing Lean Six Sigma Throughout the Supply Chain
http://slidepdf.com/reader/full/implementing-lean-six-sigma-throughout-the-supply-chain 202/278
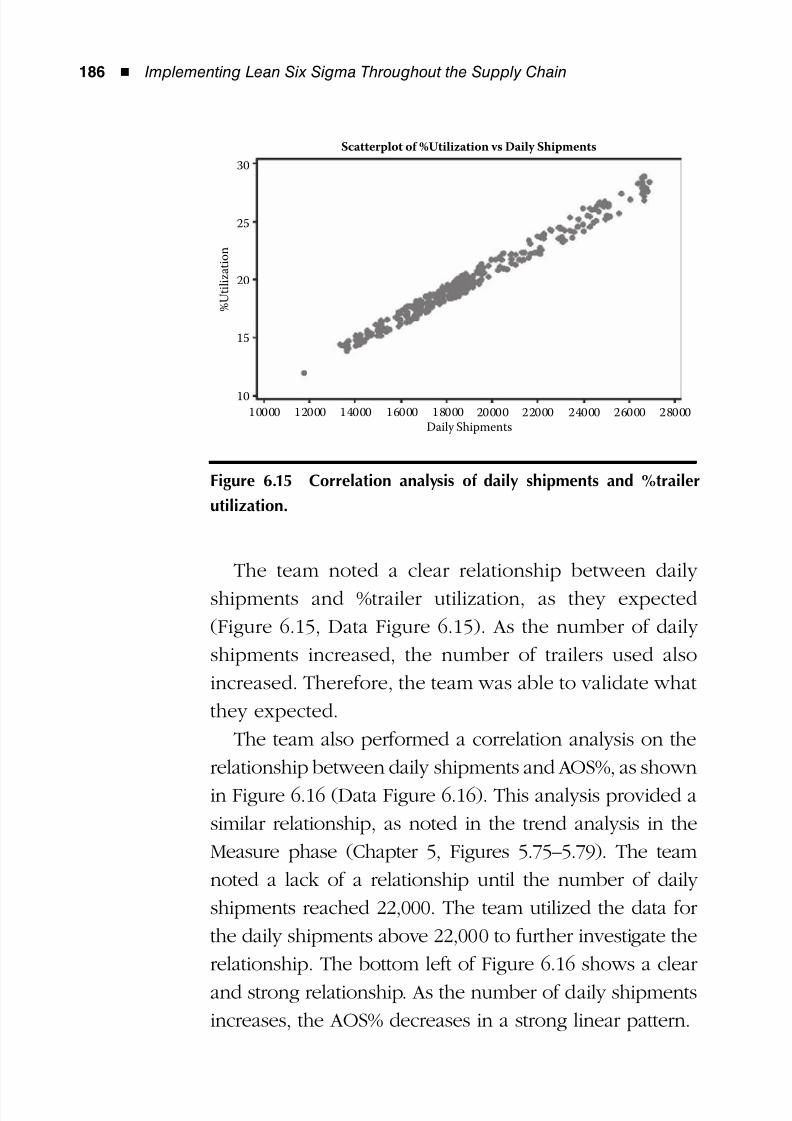
8/12/2019 Implementing Lean Six Sigma Throughout the Supply Chain
http://slidepdf.com/reader/full/implementing-lean-six-sigma-throughout-the-supply-chain 203/278
186 ◾ Implementing Lean Six Sigma Throughout the Supply Chain
The team noted a clear relationship between daily
shipments and %trailer utilization, as they expected
(Figure 6.15, Data Figure 6.15). As the number of daily
shipments increased, the number of trailers used also
increased. Therefore, the team was able to validate what
they expected.
The team also performed a correlation analysis on the
relationship between daily shipments and AOS%, as shown
in Figure 6.16 (Data Figure 6.16). This analysis provided a
similar relationship, as noted in the trend analysis in the
Measure phase (Chapter 5, Figures 5.75–5.79). The team
noted a lack of a relationship until the number of daily
shipments reached 22,000. The team utilized the data for
the daily shipments above 22,000 to further investigate the
relationship. The bottom left of Figure 6.16 shows a clear
and strong relationship. As the number of daily shipments
increases, the AOS% decreases in a strong linear pattern.
30
25
20
15
10
% U t i l i z a t i o n
10000 12000 14000 16000 18000 20000 22000 24000 26000 28000Daily Shipments
Scatterplot of %Utilization vs Daily Shipments
Figure 6.15 Correlation analysis of daily shipments and %trailer
utilization.
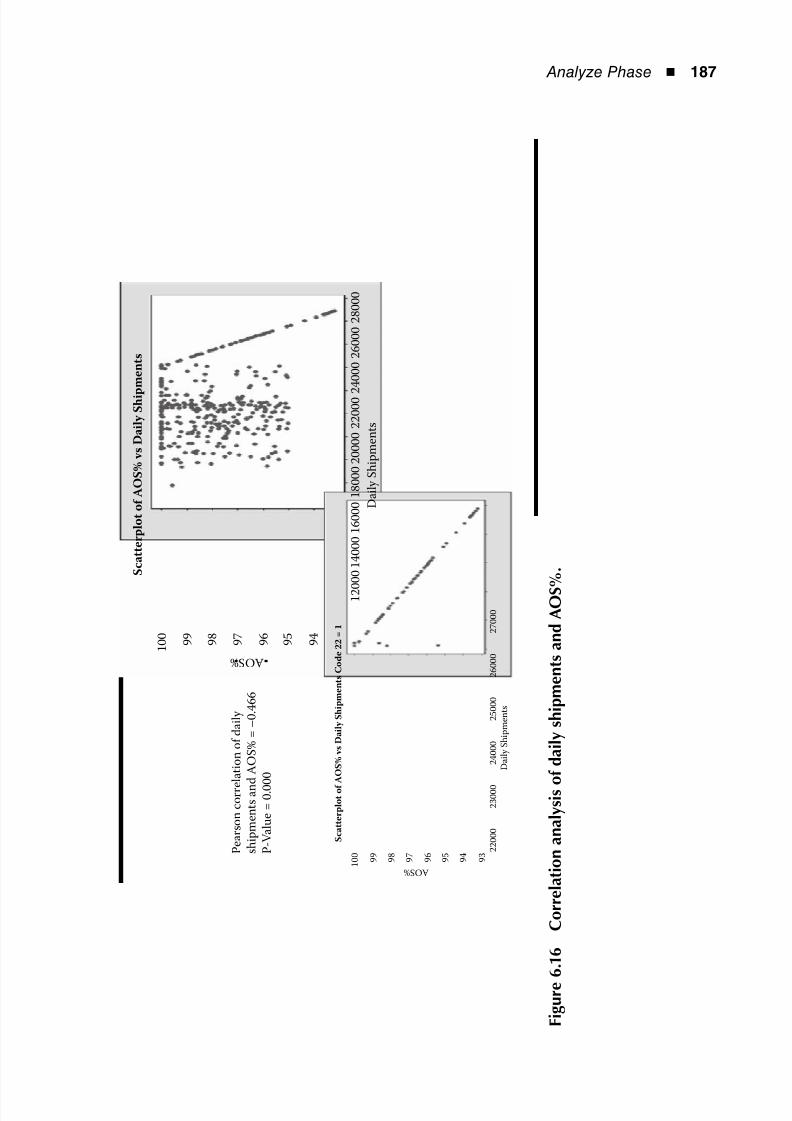
8/12/2019 Implementing Lean Six Sigma Throughout the Supply Chain
http://slidepdf.com/reader/full/implementing-lean-six-sigma-throughout-the-supply-chain 204/278
Analyze Phase ◾ 187
1 0 0
9 9
9 8
9 7
9 6
9 5
9 4
A O S %
A O S %
1 2 0 0 0 1 4 0 0 0
2 2 0 0 0
2 3 0 0 0
2 4 0 0 0
2 5 0 0 0
2 6 0 0 0
2 7 0 0 0
1 6 0 0 0 1 8 0 0 0 2 0 0 0 0 2 2 0 0 0 2
4 0 0 0 2 6 0 0 0 2 8 0 0 0
D a i l y S h i p m e n t s
D a i l y S h i p m e n t s
S c a t t e r p l o t o f
A O S % v s D a i l y S h i p m e n t s C o d e 2 2 = 1
S c a t t e r p l o t o f A O S % v s D a i l y S h i p
m e n t s
1 0 0
9 9
9 8
9 7
9 6
9 5
9 4
9 3 P
e a r s o n c o r r e
l a t i o n o f d a i l y
s h i p m e n t s a n d A O S % = – 0 . 4 6 6
P - V a l u e = 0 . 0 0 0
F i g u r e
6 . 1
6
C o r r e l a t i o n a n a l y s i s o f d a i l y s h i p m e n t s a n d A O S % .
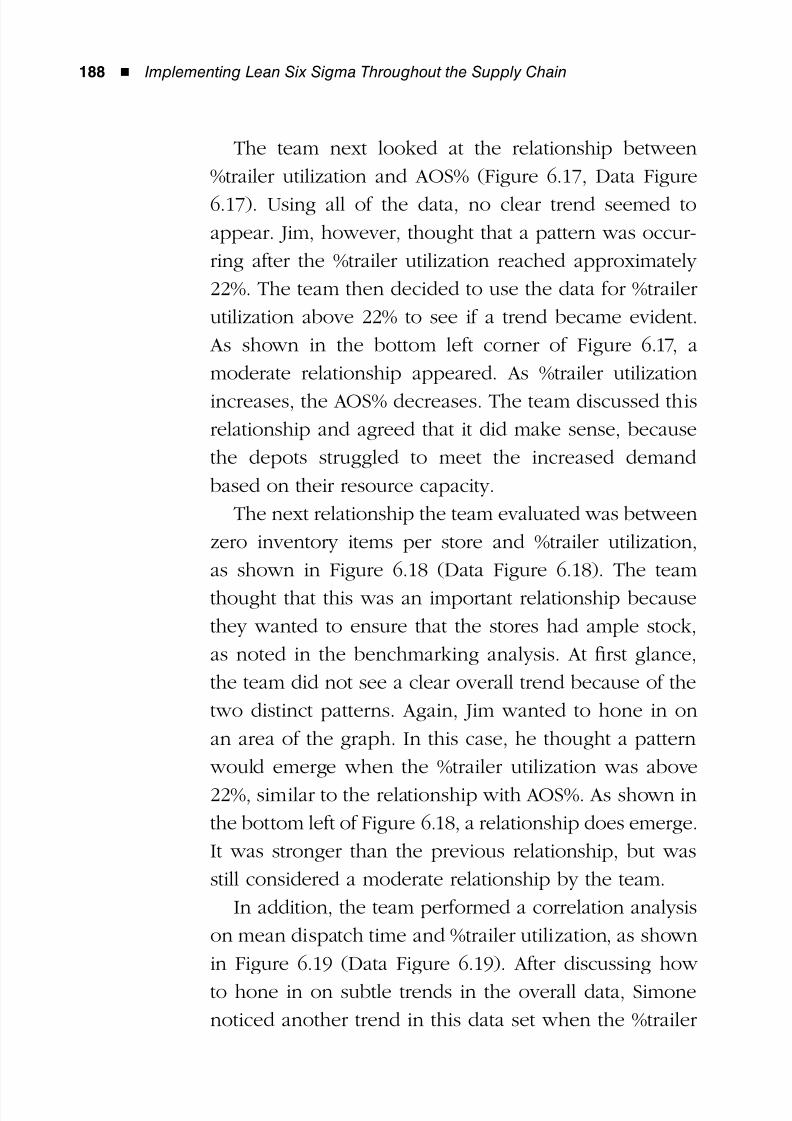
8/12/2019 Implementing Lean Six Sigma Throughout the Supply Chain
http://slidepdf.com/reader/full/implementing-lean-six-sigma-throughout-the-supply-chain 205/278
188 ◾ Implementing Lean Six Sigma Throughout the Supply Chain
The team next looked at the relationship between
%trailer utilization and AOS% (Figure 6.17, Data Figure
6.17). Using all of the data, no clear trend seemed to
appear. Jim, however, thought that a pattern was occur-
ring after the %trailer utilization reached approximately
22%. The team then decided to use the data for %trailer
utilization above 22% to see if a trend became evident.
As shown in the bottom left corner of Figure 6.17, a
moderate relationship appeared. As %trailer utilization
increases, the AOS% decreases. The team discussed this
relationship and agreed that it did make sense, because
the depots struggled to meet the increased demand
based on their resource capacity.
The next relationship the team evaluated was between
zero inventory items per store and %trailer utilization,
as shown in Figure 6.18 (Data Figure 6.18). The team
thought that this was an important relationship because
they wanted to ensure that the stores had ample stock,
as noted in the benchmarking analysis. At first glance,
the team did not see a clear overall trend because of the
two distinct patterns. Again, Jim wanted to hone in on
an area of the graph. In this case, he thought a pattern
would emerge when the %trailer utilization was above
22%, similar to the relationship with AOS%. As shown in
the bottom left of Figure 6.18, a relationship does emerge.
It was stronger than the previous relationship, but was
still considered a moderate relationship by the team.
In addition, the team performed a correlation analysis
on mean dispatch time and %trailer utilization, as shown
in Figure 6.19 (Data Figure 6.19). After discussing how
to hone in on subtle trends in the overall data, Simone
noticed another trend in this data set when the %trailer
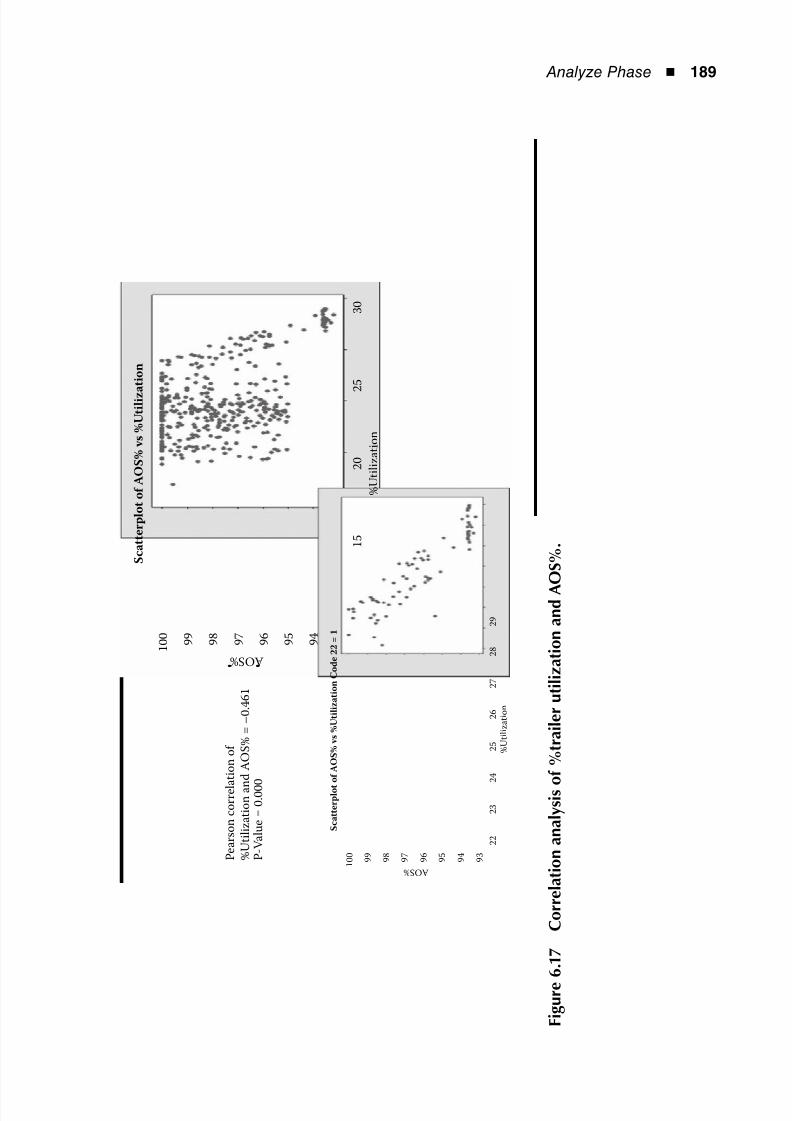
8/12/2019 Implementing Lean Six Sigma Throughout the Supply Chain
http://slidepdf.com/reader/full/implementing-lean-six-sigma-throughout-the-supply-chain 206/278
Analyze Phase ◾ 189
1 0 0
9 9
9 8
9 7
9 6
9 5
9 4
A O S %
A O S %
1 5
2 2
2 3
2 5
2 4
2 7
2 6
2 8
2 9
2 5
2 0
3 0
% U t i l i z a t i o n
% U t i l i z a t i o n
S c a t t e r p l o t o f A O S % v
s % U t i l i z a t i o n
S c a t t e r p l o t
o f A O S % v
s % U t i l i z a t i o n C o d e 2 2 = 1
1 0 0
9 9
9 8
9 7
9 6
9 5
9 4
9 3 P
e a r s o n c o r r e l a t i o n o
f
% U t i l i z a t i o n a n
d A O S %
= – 0 . 4
6 1
P - V a
l u e = 0 . 0 0
0
F i g u r e
6 . 1
7
C o r r e l a t i o n a n a l y s i s o f % t r a i l e r u t i l i z a t i o n a n d A
O S % .
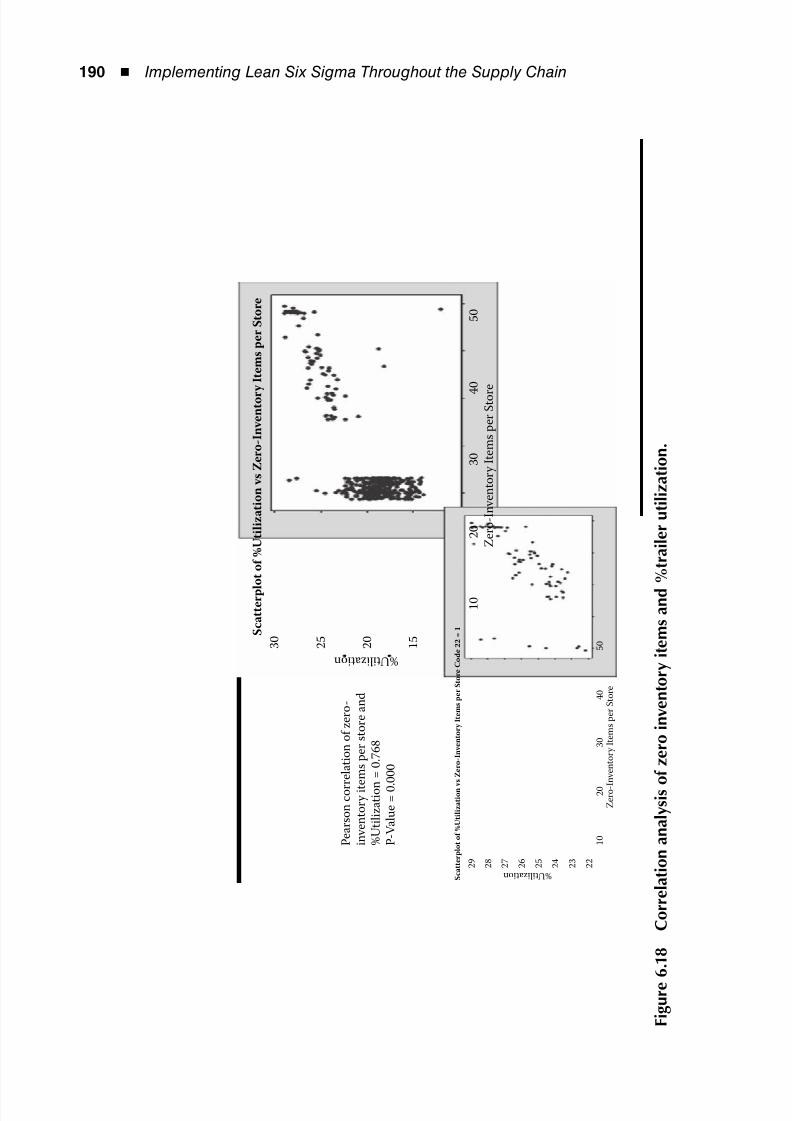
8/12/2019 Implementing Lean Six Sigma Throughout the Supply Chain
http://slidepdf.com/reader/full/implementing-lean-six-sigma-throughout-the-supply-chain 207/278
190 ◾ Implementing Lean Six Sigma Throughout the Supply Chain
3 0
2 5
2 0
1 5
1 0
2 0
4
0
3 0
5 0
Z e r o - I n v e n t o r y I t e m s p e r S t o r
e
% U t i l i z a t i o n
S c a t t e r p l o t o f % U t i l i z a t i o n v s Z e r o - I n v e n t o r y I t e m s p e r S t o r e
2 9
2 8
2 7
2 6
2 5
2 4
2 3
2 2
1 0
2 0
4 0
3 0
5 0
Z e r o - I
n v e n t o r y I t e m s p e r S t o r e
% U t i l i z a t i o n S c a t t e r p l o t o f % U t i l i z a t i o n v
s Z e r o - I n v e n t o r y I t e m s p e r S t o r e C o d e 2 2 = 1
P e a r s o n c o r r e l a t i o n o f z e r o -
i n v e n t o r y i t e m s p e r s t o r e a n d
% U t i l i z a t i o n
= 0 . 7 6 8
P - V a l u e = 0 . 0 0 0
F i g u r e
6 . 1
8
C o r r e l a t i o n a n a l y s i s o f z e r o i n v e n t o r y i t e m s a n d
% t r a i l e r u t i l i z a t i o n .
8/12/2019 Implementing Lean Six Sigma Throughout the Supply Chain
http://slidepdf.com/reader/full/implementing-lean-six-sigma-throughout-the-supply-chain 208/278
Analyze Phase ◾ 191
3 0
2 5
2 0
1 5
3 0
2 5
2 0
1 5
M e a n D i s p a t c h T i m e
% U t i l i z a t i o n
S c a t t e r p l o t o f % U t i l i z a t i o n v s M e a n
D i s p a t c h T i m e
2 9
2 8
2 7
2 6
2 5
2 4
2 3
2 2
3 0
2 5
2 0
1 5
1 0
M e a n D i s p a t c h T i m e
% U t i l i z a t i o n
S c a t t e r p l o t o f
% U t i l i z a t i o n v s M e a n D i s p a t c h T i m e C o d e 2 2 =
1
P e a r s o n c o r r e l a t i o n o f
m
e a n d i s p a t c h t i m e a n d
% U t i l i z a t i o n = 0 . 3 5 5
P - V a l u e = 0 . 0 0 0
F i g u r e
6 . 1
9
C o r r e l a t i o n a n a l y s i s o f m e a n d i s p a t c h t i m e a n d %
t r a i l e r u t i l i z a t i o n .
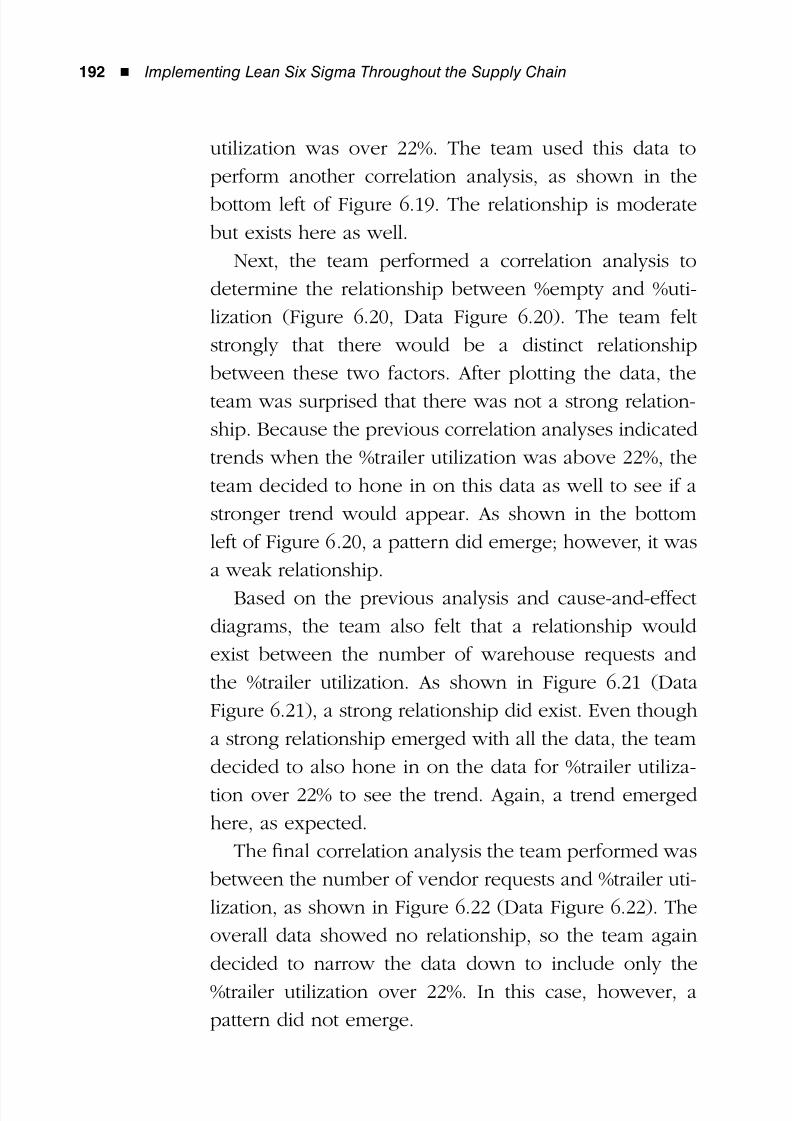
8/12/2019 Implementing Lean Six Sigma Throughout the Supply Chain
http://slidepdf.com/reader/full/implementing-lean-six-sigma-throughout-the-supply-chain 209/278
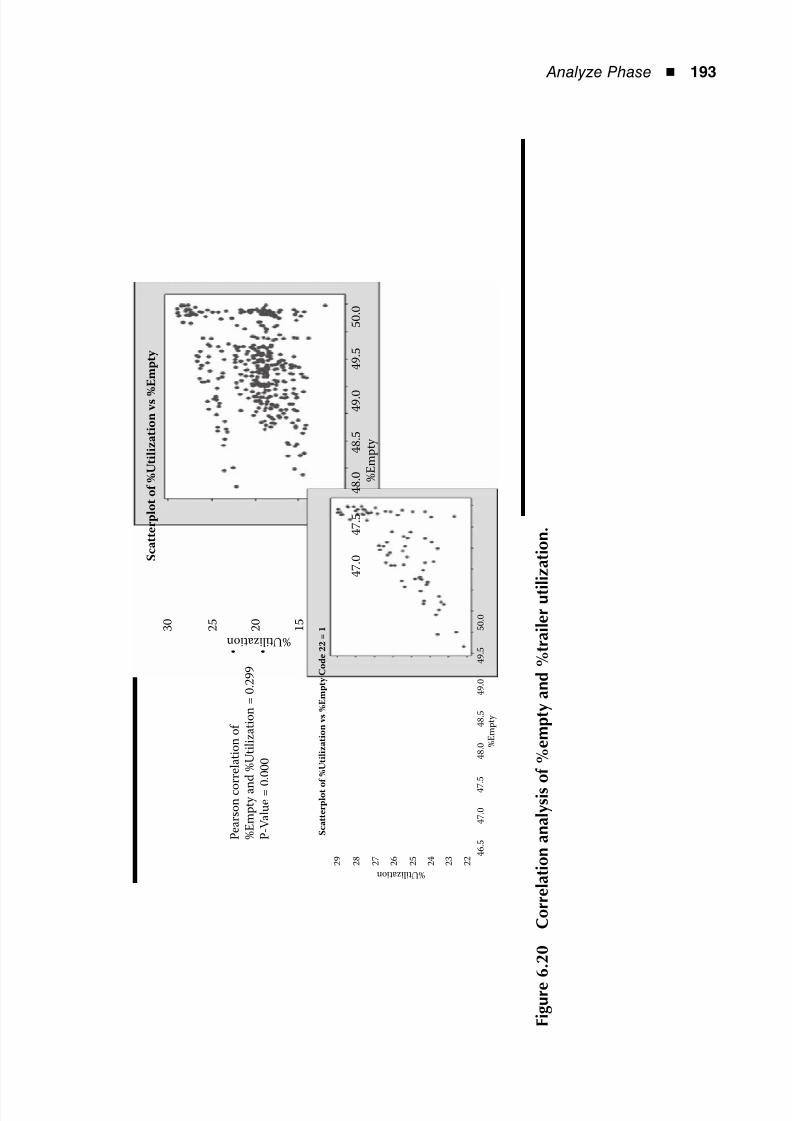
8/12/2019 Implementing Lean Six Sigma Throughout the Supply Chain
http://slidepdf.com/reader/full/implementing-lean-six-sigma-throughout-the-supply-chain 210/278
Analyze Phase ◾ 193
3 0
2 5
2 0
1 5
4 7 . 0
4 7 . 5
4 8 . 5
4 8 . 0
4 9 . 0
4 9 . 5
5 0 . 0
% E m p t y
4 7 . 0
4 6 . 5
4 8 . 0
4 8 . 5
4 9 . 0
4 9 . 5
5 0 . 0
4 7
. 5
% E m p t y
% U t i l i z a t i o n
S c a t t e r p l o t o f % U t i l i z a t i o n v s %
E m p t y
S c a t t e r p l o t o
f % U t i l i z a t i o n v s % E m p t y C o d e 2 2 = 1
2 9
2 8
2 7
2 6
2 5
2 4
2 3
2 2
% U t i l i z a t i o n
P e a r s o n c o r r e
l a t i o n o
f
% E m p t y a n
d % U t i l i z a t i o n = 0 . 2
9 9
P - V a
l u e = 0
. 0 0 0
F i g u r e
6 . 2
0
C o r r e l a t i o n a n a l y s i s o f % e m p t y a n d % t r a i l e r u t i l i z a t i o n .
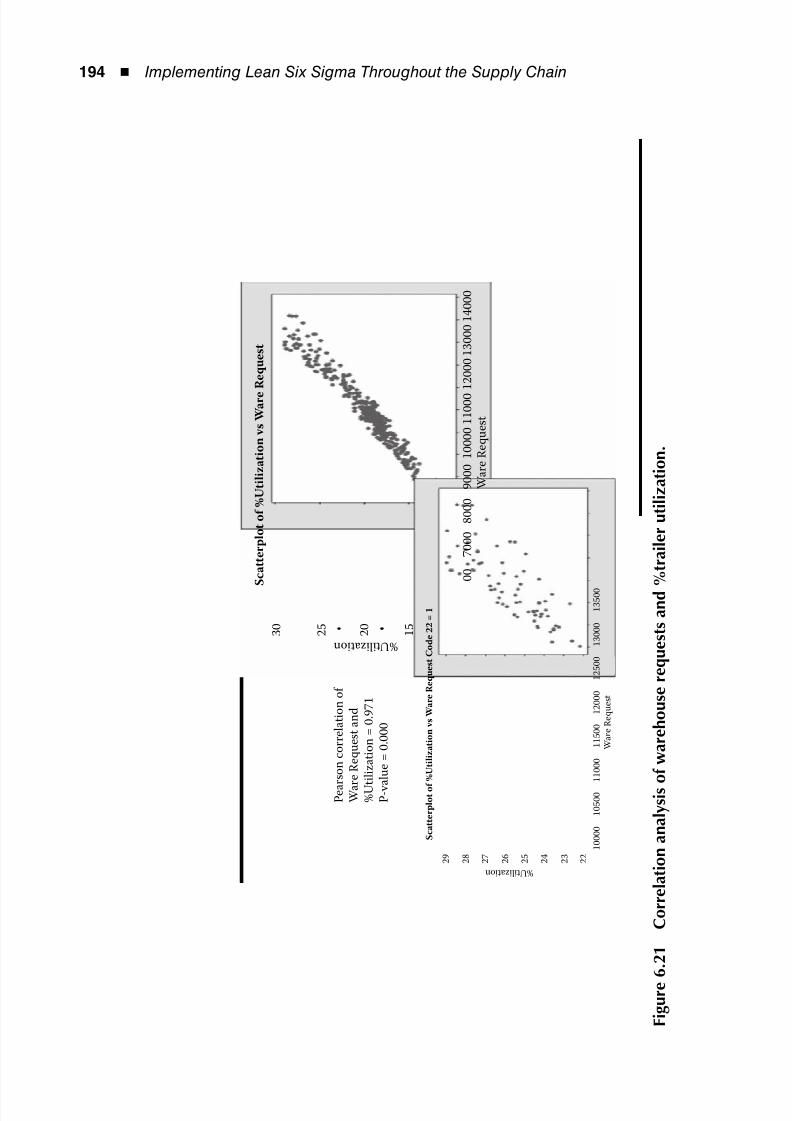
8/12/2019 Implementing Lean Six Sigma Throughout the Supply Chain
http://slidepdf.com/reader/full/implementing-lean-six-sigma-throughout-the-supply-chain 211/278
194 ◾ Implementing Lean Six Sigma Throughout the Supply Chain
3 0 2 5 2 0 1 5
0 0
7 0 0 0 8 0 0 0 9 0 0 0 1 0 0 0 0 1 1 0 0 0 1 2 0 0 0 1 3 0 0 0 1 4 0 0 0
W a r e R e q u e s t
1 0 0 0 0
1 0 5 0 0
1 1 0 0 0
1 1 5 0 0
1 2 0 0 0
1 2 5 0 0
1 3 0 0 0
1 3 5 0 0
W a r e R e q u e s t
% U t i l i z a t i o n
S c a t t e r p l o t o f % U t i l i z a t i o n v s W a r e
R e q u e s t
S c a t t e r p l o t o f
% U t i l i z a t i o n v s W a r e R e q u e s t C o d e 2 2 = 1
2 9 2 8 2 7 2 6 2 5 2 4 2 3 2 2 % U t i l i z a t i o n
P e a r s o n c o r r e l a t i o n o
f
W a r e R e q u e s t a n
d
% U t i l i z a t i o n = 0 . 9 7 1
P - v a l u e = 0 . 0 0 0
F i g u r e
6 . 2
1
C o r r e l a t i o n a n a l y s i s o f w a r e h o u s e r e q u e s t s a n d % t r a i l e r u t i l i z a t i o n .
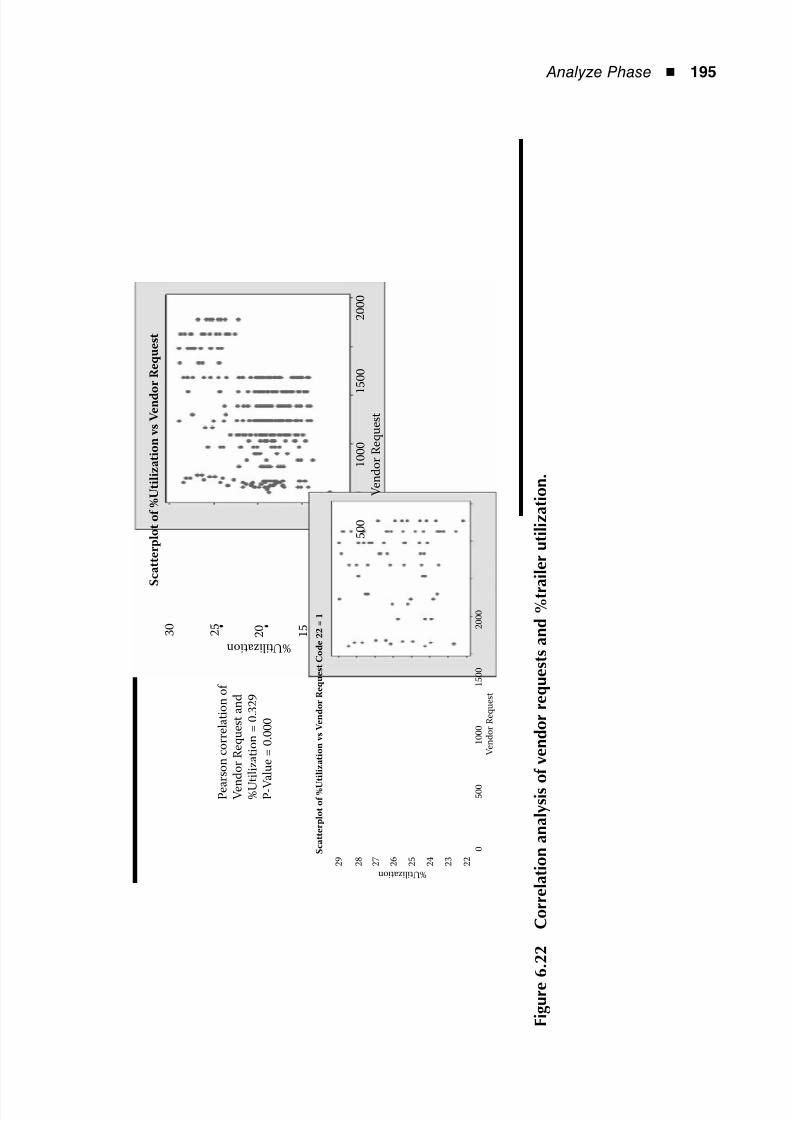
8/12/2019 Implementing Lean Six Sigma Throughout the Supply Chain
http://slidepdf.com/reader/full/implementing-lean-six-sigma-throughout-the-supply-chain 212/278
Analyze Phase ◾ 195
3 0
2 5
2 0
1 5
5 0 0
1 0 0 0
1
5 0 0
2 0 0 0
V e n
d o r R e q u e s t
2 0 0 0
1 5 0 0
1 0 0 0
5 0 0
0
V e n
d o r R e q u e s t
% U t i l i z a t i o n
S c a t t e r p l o t o f % U t i l i z a t i o n v s V e n d o
r R e q u e s t
S c a t t e r p l o t o f % U
t i l i z a t i o n v s V e n d o r R e q u e s t C o d e 2 2 = 1
2 9
2 8
2 7
2 6
2 5
2 4
2 3
2 2
% U t i l i z a t i o n
P e a
r s o n c o r r e
l a t i o n o
f
V e n
d o r R e q u e s t a n
d
% U
t i l i z a t i o n = 0 . 3
2 9
P - V
a l u e = 0 . 0
0 0
F i g u r e
6 . 2
2
C o r r e l a t i o n a n a l y s i s o f v e n d o r r e q u e s t s a n d % t r a i l e r u t i l i z a t i o n .
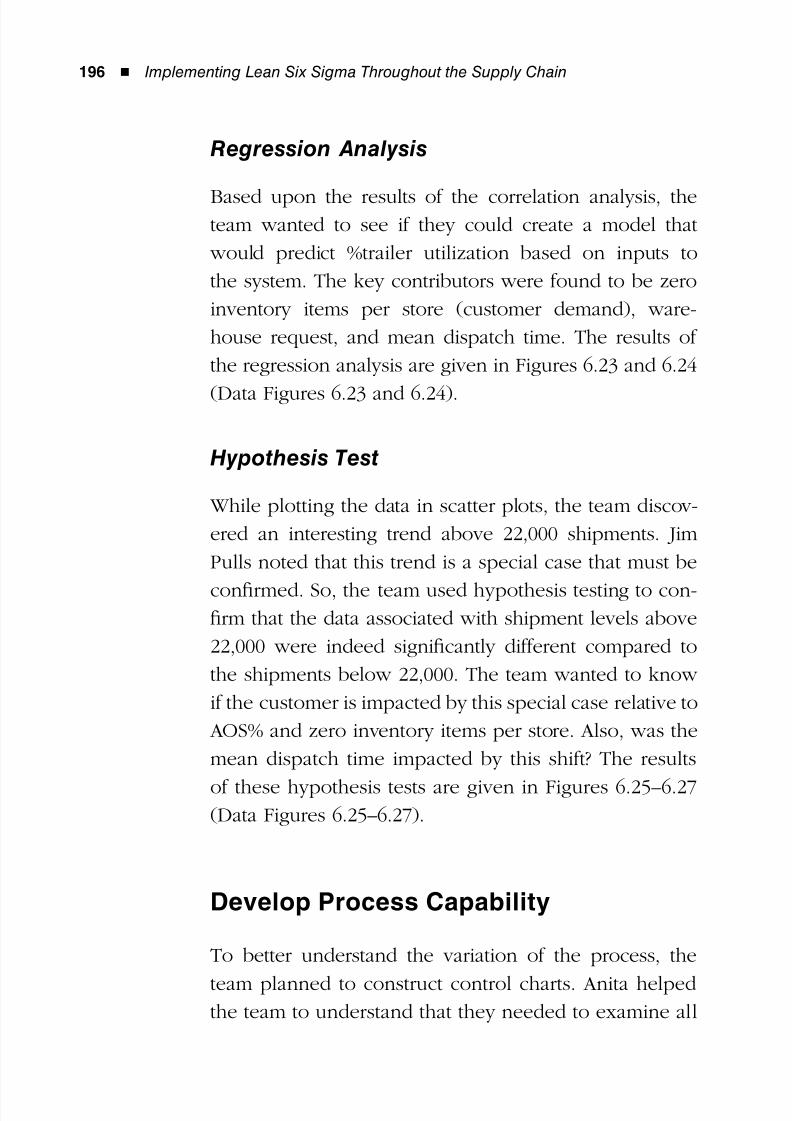
8/12/2019 Implementing Lean Six Sigma Throughout the Supply Chain
http://slidepdf.com/reader/full/implementing-lean-six-sigma-throughout-the-supply-chain 213/278
196 ◾ Implementing Lean Six Sigma Throughout the Supply Chain
Regression Analysis
Based upon the results of the correlation analysis, theteam wanted to see if they could create a model that
would predict %trailer utilization based on inputs to
the system. The key contributors were found to be zero
inventory items per store (customer demand), ware-
house request, and mean dispatch time. The results of
the regression analysis are given in Figures 6.23 and 6.24
(Data Figures 6.23 and 6.24).
Hypothesis Test
While plotting the data in scatter plots, the team discov-
ered an interesting trend above 22,000 shipments. Jim
Pulls noted that this trend is a special case that must be
confirmed. So, the team used hypothesis testing to con-firm that the data associated with shipment levels above
22,000 were indeed significantly different compared to
the shipments below 22,000. The team wanted to know
if the customer is impacted by this special case relative to
AOS% and zero inventory items per store. Also, was the
mean dispatch time impacted by this shift? The results
of these hypothesis tests are given in Figures 6.25–6.27(Data Figures 6.25–6.27).
Develop Process Capability
To better understand the variation of the process, the
team planned to construct control charts. Anita helpedthe team to understand that they needed to examine all
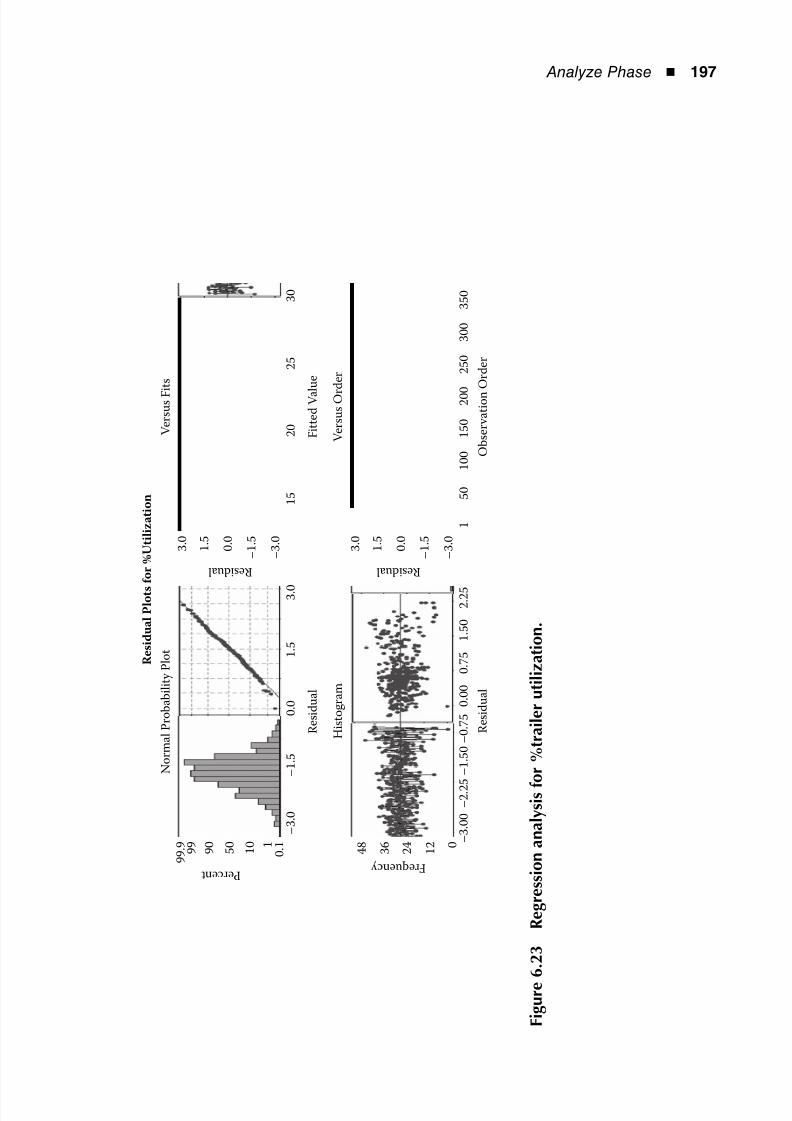
8/12/2019 Implementing Lean Six Sigma Throughout the Supply Chain
http://slidepdf.com/reader/full/implementing-lean-six-sigma-throughout-the-supply-chain 214/278
Analyze Phase ◾ 197
– 3
. 0 0 –
2 . 2 5 –
1 . 5
0 –
0 . 7
5
0 . 0
0
0 . 7
5
1 . 5
0
2 . 2 5
4 8
3 6
2 4
1 2 0
F r e q u e n c y
R e s i d u a l
R e s i d u a
l
H i s t o g r a m
R e s i d u a l P l o t s
f o r % U t i l i z a t i o n
1
5 0
1 0 0
1 5 0
2 0 0
2 5 0
3 0 0
3 5 0
O b
s e r v a
t i o n
O r d e r
V e r s u s
O r
d e r
3 . 0
1 . 5
0 . 0
– 1
. 5
– 3
. 0
R e s i d u a l
P e r c e n t
R e s i d u a
l
N o r m a
l P r o
b a
b i l i t y P
l o t
1 5
– 3
. 0
– 1
. 5
0 . 0
1 . 5
3 . 0
2 0
2 5
3 0
V e r s u s F
i t s
F i t t e
d V a
l u e
9 9
. 9 9 9
9 0
5 0
3 . 0
1 . 5
0 . 0
– 1
. 5
– 3
. 0
1 0 1
0 . 1
F i g u r e
6 . 2
3
R e g r e s s i o n a n a l y s i s f o r % t r a i l e r u t i l i z a t i o n .
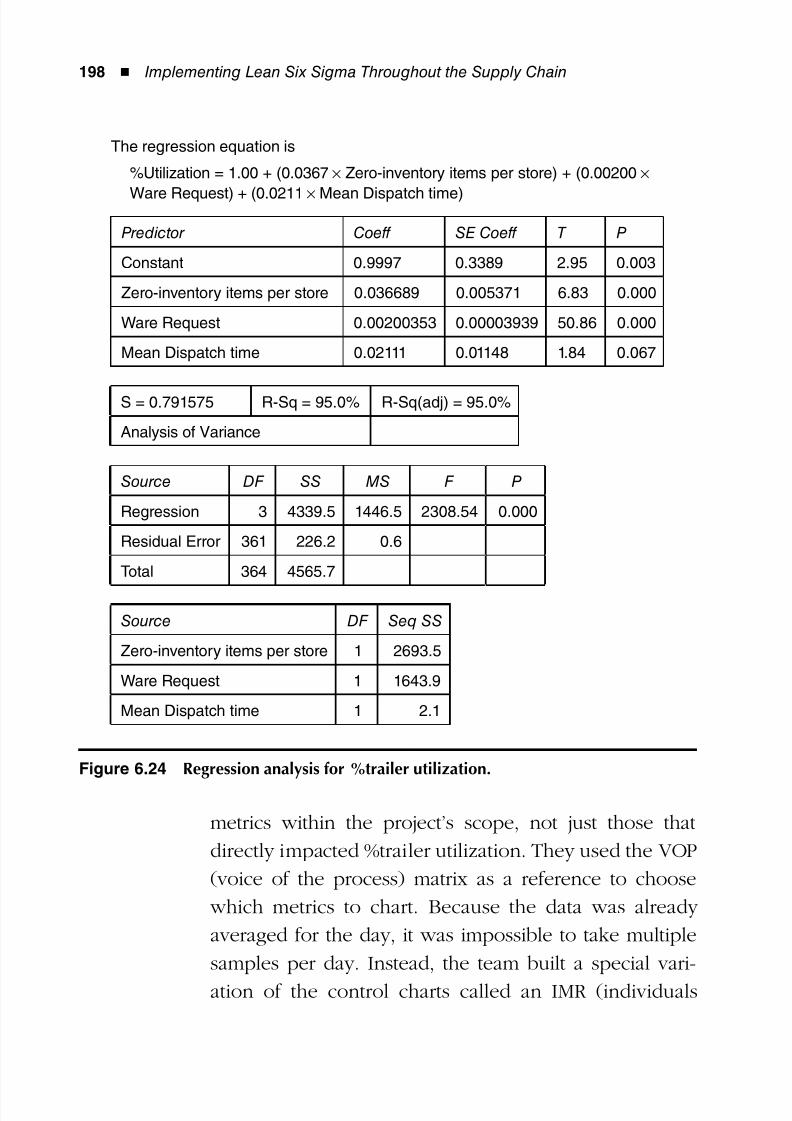
8/12/2019 Implementing Lean Six Sigma Throughout the Supply Chain
http://slidepdf.com/reader/full/implementing-lean-six-sigma-throughout-the-supply-chain 215/278
198 ◾ Implementing Lean Six Sigma Throughout the Supply Chain
metrics within the project’s scope, not just those that
directly impacted %trailer utilization. They used the VOP
(voice of the process) matrix as a reference to choose
which metrics to chart. Because the data was already
averaged for the day, it was impossible to take multiple
samples per day. Instead, the team built a special vari-
ation of the control charts called an IMR (individuals
The regression equation is
%Utilization = 1.00 + (0.0367 × Zero-inventory items per store) + (0.00200 ×
Ware Request) + (0.0211 × Mean Dispatch time)
Predictor Coeff SE Coeff T P
Constant 0.9997 0.3389 2.95 0.003
Zero-inventory items per store 0.036689 0.005371 6.83 0.000
Ware Request 0.00200353 0.00003939 50.86 0.000
Mean Dispatch time 0.02111 0.01148 1.84 0.067
S = 0.791575 R-Sq = 95.0% R-Sq(adj) = 95.0%
Analysis of Variance
Source DF SS MS F P
Regression 3 4339.5 1446.5 2308.54 0.000
Residual Error 361 226.2 0.6
Total 364 4565.7
Source DF Seq SS
Zero-inventory items per store 1 2693.5
Ware Request 1 1643.9
Mean Dispatch time 1 2.1
Figure 6.24 Regression analysis for %trailer utilization.
8/12/2019 Implementing Lean Six Sigma Throughout the Supply Chain
http://slidepdf.com/reader/full/implementing-lean-six-sigma-throughout-the-supply-chain 216/278
Analyze Phase ◾ 199
with moving range) chart, as shown in Figures 6.28–6.33
(Data Figures 6.28–6.33).
Process Capability
The majority of the data was not normal due to the
seasonal impact of the customer demand. So, the team
agreed to plot the capability of the live-unload data,
since they planned to suggest a target and tolerance as
part of their recommendations, as shown in Figure 6.34
(Data Figure 6.34). The live-unload data taken for the
gauge R&R (repeatability and reproducibility) was
charted for capability in reference to the agreed-upon
target of 60 minutes and tolerance of plus or minus
100
99
98
97
96
95
94
93
0 1
A O S %
Boxplot of AOS%
Two-Sample T-Test and CI: AOS%, Code 22
Two-sample Test for AOS%
Difference = mu (0) – mu (1)Estimate for difference: 1.82395% CI for difference: (1.294, 2.353)T-Test of difference = 0 (vs not =): T-Value = 6.84 P-Value = 0.000 DF = 92
Code 22
Code
0 292 98.10 1.58 0.0921 73 96.27 2.14 0.25
N22 Mean StdDev SE Mean
Figure 6.25 AOS% analysis
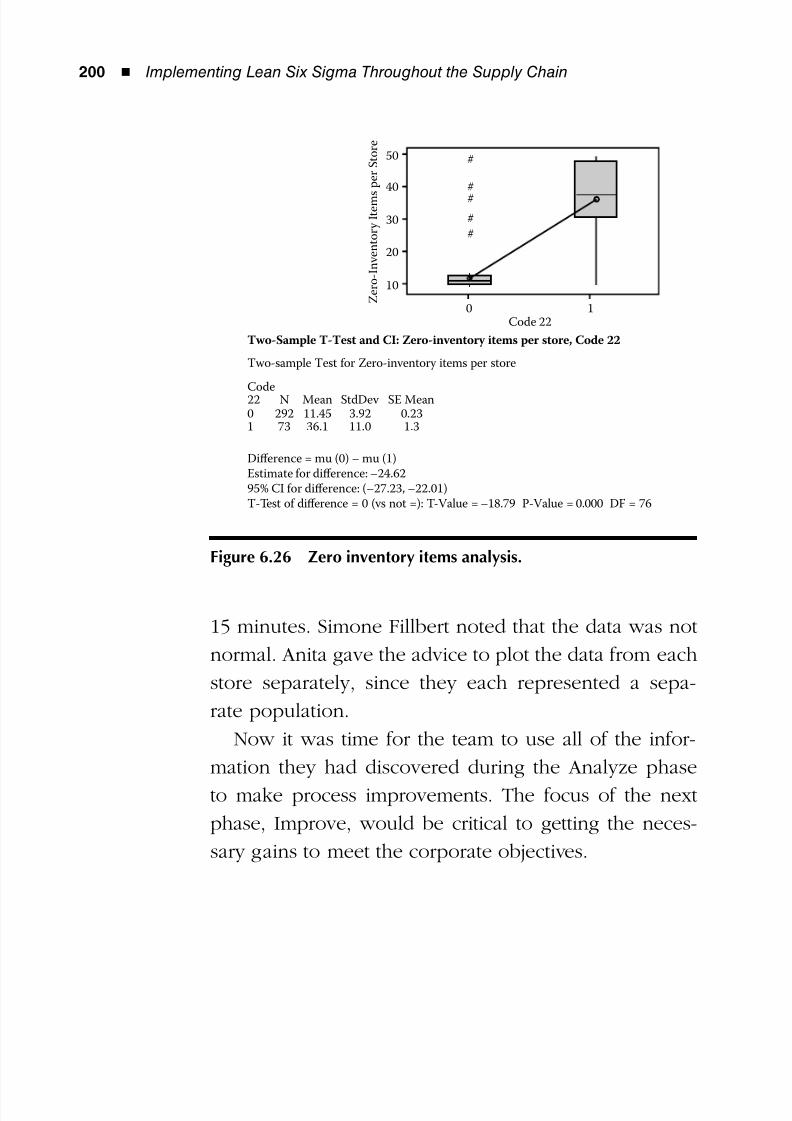
8/12/2019 Implementing Lean Six Sigma Throughout the Supply Chain
http://slidepdf.com/reader/full/implementing-lean-six-sigma-throughout-the-supply-chain 217/278
200 ◾ Implementing Lean Six Sigma Throughout the Supply Chain
15 minutes. Simone Fillbert noted that the data was not
normal. Anita gave the advice to plot the data from each
store separately, since they each represented a sepa-
rate population.
Now it was time for the team to use all of the infor-
mation they had discovered during the Analyze phase
to make process improvements. The focus of the next
phase, Improve, would be critical to getting the neces-
sary gains to meet the corporate objectives.
50
40
30
20
10
0 1 Z e r o - I n v e n t o r y I t e m s p e r S t o r e
Two-Sample T-Test and CI: Zero-inventory items per store, Code 22
Code
Two-sample Test for Zero-inventory items per store
0 292 11.45 3.92 0.231
Difference = mu (0) – mu (1)Estimate for difference: –24.6295% CI for difference: (–27.23, –22.01)T-Test of difference = 0 (vs not =): T-Value = –18.79 P-Value = 0.000 DF = 76
73 36.1 11.0 1.3
N22 Mean StdDev SE Mean
Code 22
#
#
##
#
Figure 6.26 Zero inventory items analysis.
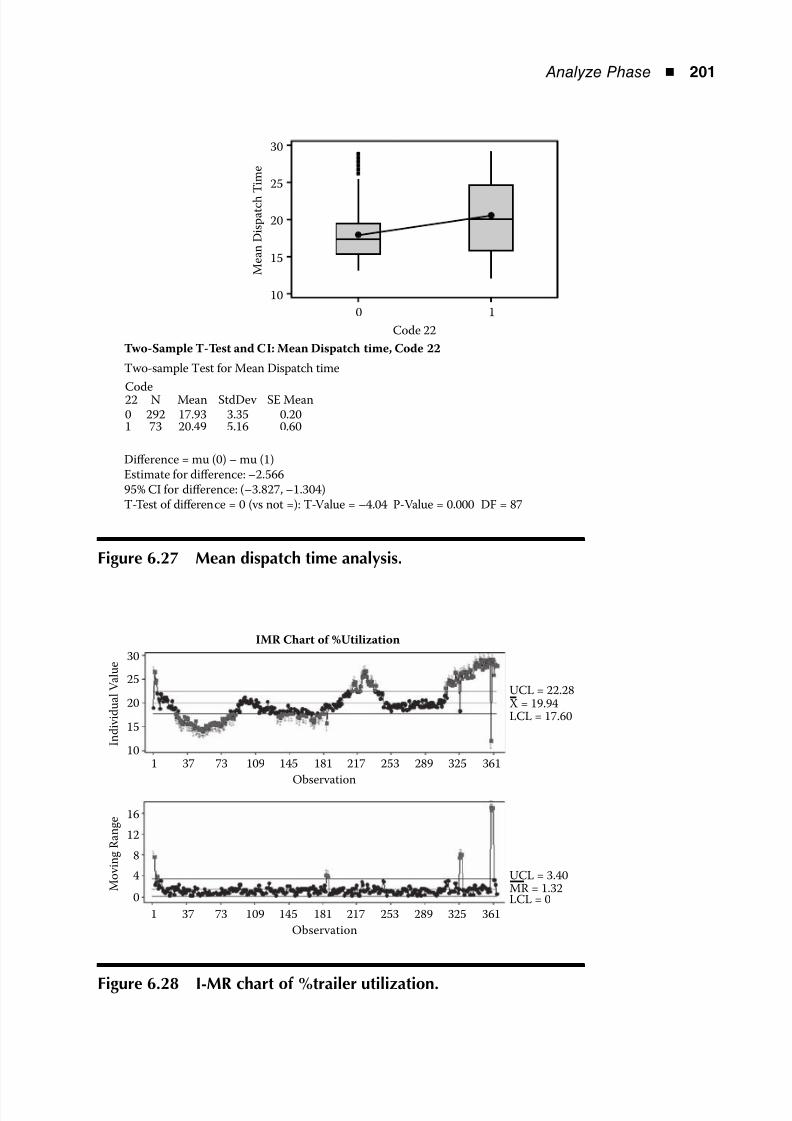
8/12/2019 Implementing Lean Six Sigma Throughout the Supply Chain
http://slidepdf.com/reader/full/implementing-lean-six-sigma-throughout-the-supply-chain 218/278
Analyze Phase ◾ 201
30
25
20
15
10
0 1
Two-Sample T-Test and CI: Mean Dispatch time, Code 22
Two-sample Test for Mean Dispatch time
Difference = mu (0) – mu (1)Estimate for difference: –2.56695% CI for difference: (–3.827, –1.304)T-Test of difference = 0 (vs not =): T-Value = –4.04 P-Value = 0.000 DF = 87
Code 22
M e a n D i s p a t c h
T i m e
Code
0 292 17.93 3.35 0.201 73 20.49 5.16 0.60
N22 Mean StdDev SE Mean
Figure 6.27 Mean dispatch time analysis.
15
25
30
20
10
0
16
12
8
4
1 37 73 109 145 181 217 253 289 325 361
Observation
1 37 73 109 145 181 217 253 289 325 361
Observation
IMR Chart of %Utilization
UCL = 22.28
X = 19.94
LCL = 17.60
UCL = 3.40
MR = 1.32LCL = 0
I n d i v i d u a l V a l u e
M o v i n g R a n g e
Figure 6.28 I-MR chart of %trailer utilization.
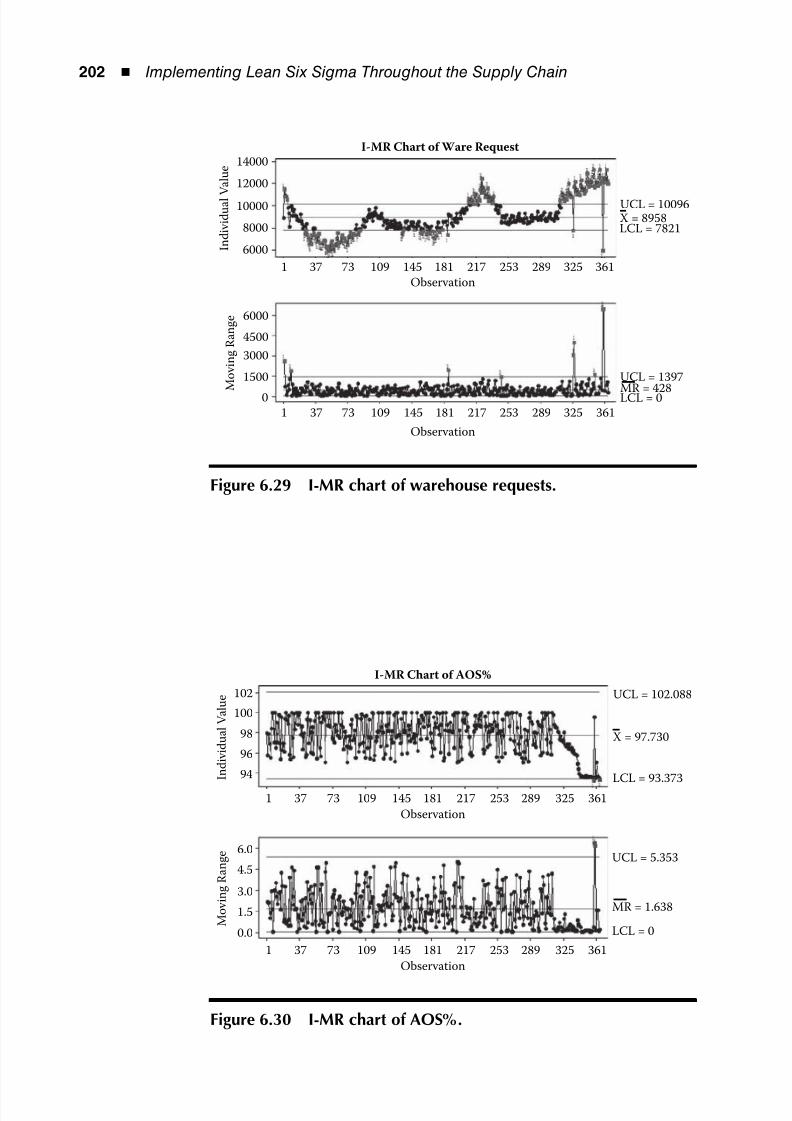
8/12/2019 Implementing Lean Six Sigma Throughout the Supply Chain
http://slidepdf.com/reader/full/implementing-lean-six-sigma-throughout-the-supply-chain 219/278
202 ◾ Implementing Lean Six Sigma Throughout the Supply Chain
8000
12000
14000
10000
6000
0
6000
4500
3000
1500
1 37 73 109 145 181 217 253 289 325 361
Observation
1 37 73 109 145 181 217 253 289 325 361
Observation
I-MR Chart of Ware Request
UCL = 10096
X = 8958LCL = 7821
UCL = 1397MR = 428LCL = 0
I n d i v i d u a l V a l u e
M o v i n g R a n g e
Figure 6.29 I-MR chart of warehouse requests.
96
100
102
98
94
0.0
6.0
4.5
3.0
1.5
1 37 73 109 145 181 217 253 289 325 361
Observation
1 37 73 109 145 181 217 253 289 325 361
Observation
I-MR Chart of AOS%
UCL = 102.088
X = 97.730
LCL = 93.373
UCL = 5.353
MR = 1.638
LCL = 0
I n d i v i d u a l V a l u e
M o v i n g R a n g e
Figure 6.30 I-MR chart of AOS%.
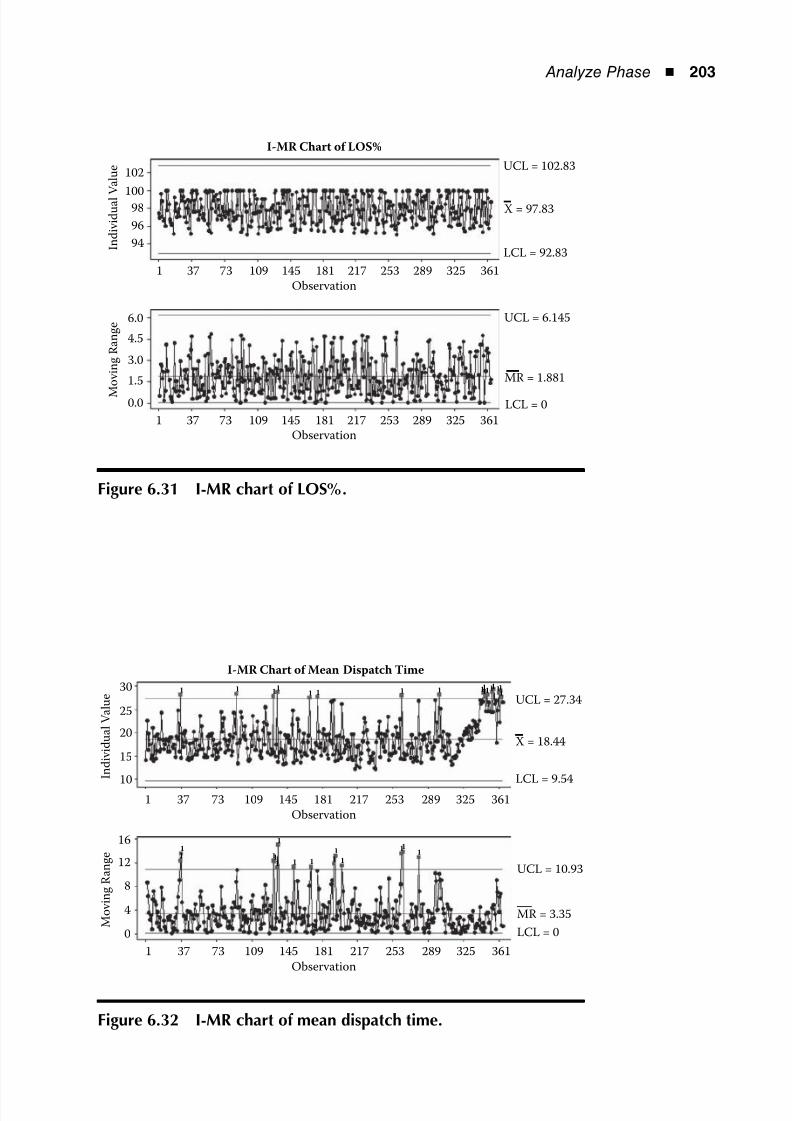
8/12/2019 Implementing Lean Six Sigma Throughout the Supply Chain
http://slidepdf.com/reader/full/implementing-lean-six-sigma-throughout-the-supply-chain 220/278
Analyze Phase ◾ 203
96
100
102
98
94
0.0
6.0
4.5
3.0
1.5
1 37 73 109 145 181 217 253 289 325 361
Observation
1 37 73 109 145 181 217 253 289 325 361
Observation
I-MR Chart of LOS%
UCL = 102.83
X = 97.83
LCL = 92.83
UCL = 6.145
MR = 1.881
LCL = 0
I n d i v i d u a l V a l u e
M
o v i n g R a n g e
Figure 6.31 I-MR chart of LOS%.
15
25
30
20
10
0
16
12
8
4
1 37 73 109 145 181 217 253 289 325 361
1 37 73 109 145 181 217 253 289 325 361
Observation
I-MR Chart of Mean Dispatch Time
Observation
UCL = 27.34
X = 18.44
LCL = 9.54
UCL = 10.93
MR = 3.35
LCL = 0
I n d i v i d u a l V a l u e
M o v i n g R a n g e 1
111
1
1 1 1 11
1
111
1111111111111
1111
Figure 6.32 I-MR chart of mean dispatch time.
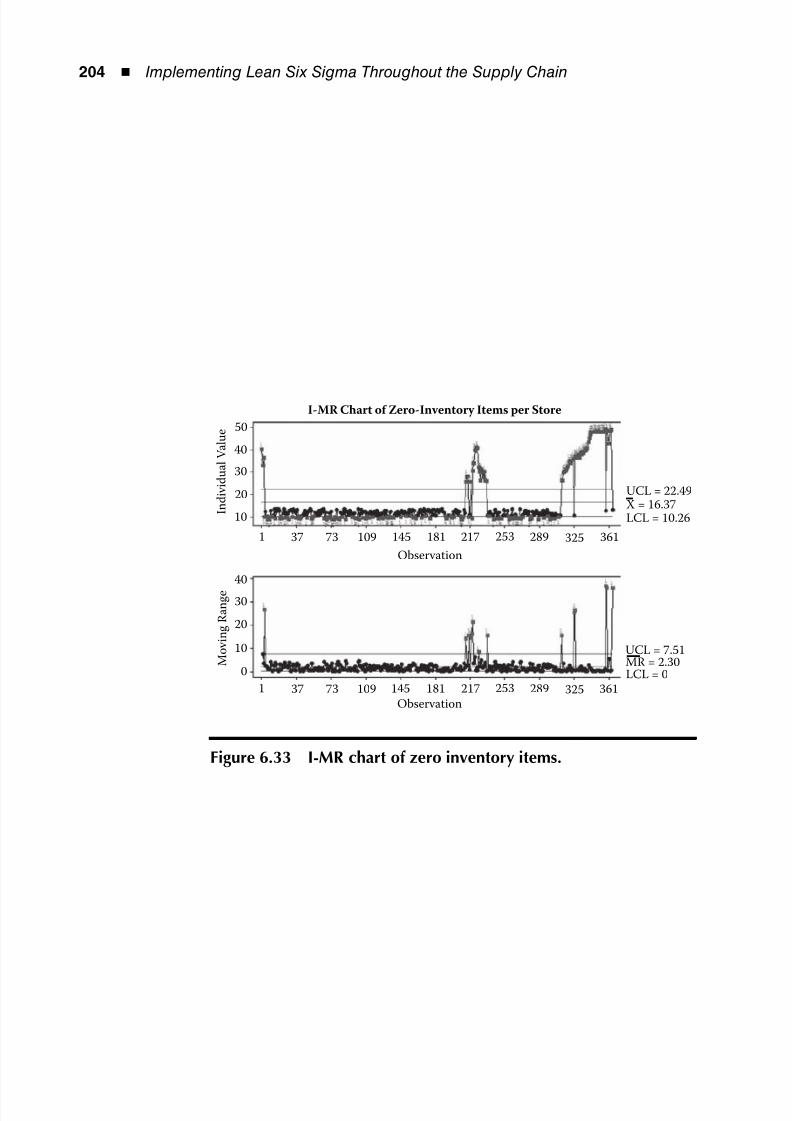
8/12/2019 Implementing Lean Six Sigma Throughout the Supply Chain
http://slidepdf.com/reader/full/implementing-lean-six-sigma-throughout-the-supply-chain 221/278
204 ◾ Implementing Lean Six Sigma Throughout the Supply Chain
50
40
30
20
10
0
40
30
20
10
1 37 73 109 145 181 217 253 289 325 361
Observation
I-MR Chart of Zero-Inventory Items per Store
1 37 73 109 145 181 217 253 289 325 361
Observation
UCL = 22.49
X = 16.37
LCL = 10.26
UCL = 7.51
MR = 2.30
LCL = 0
I n d i v i d u a l V a l u e
M o v i n g R a n g e
Figure 6.33 I-MR chart of zero inventory items.
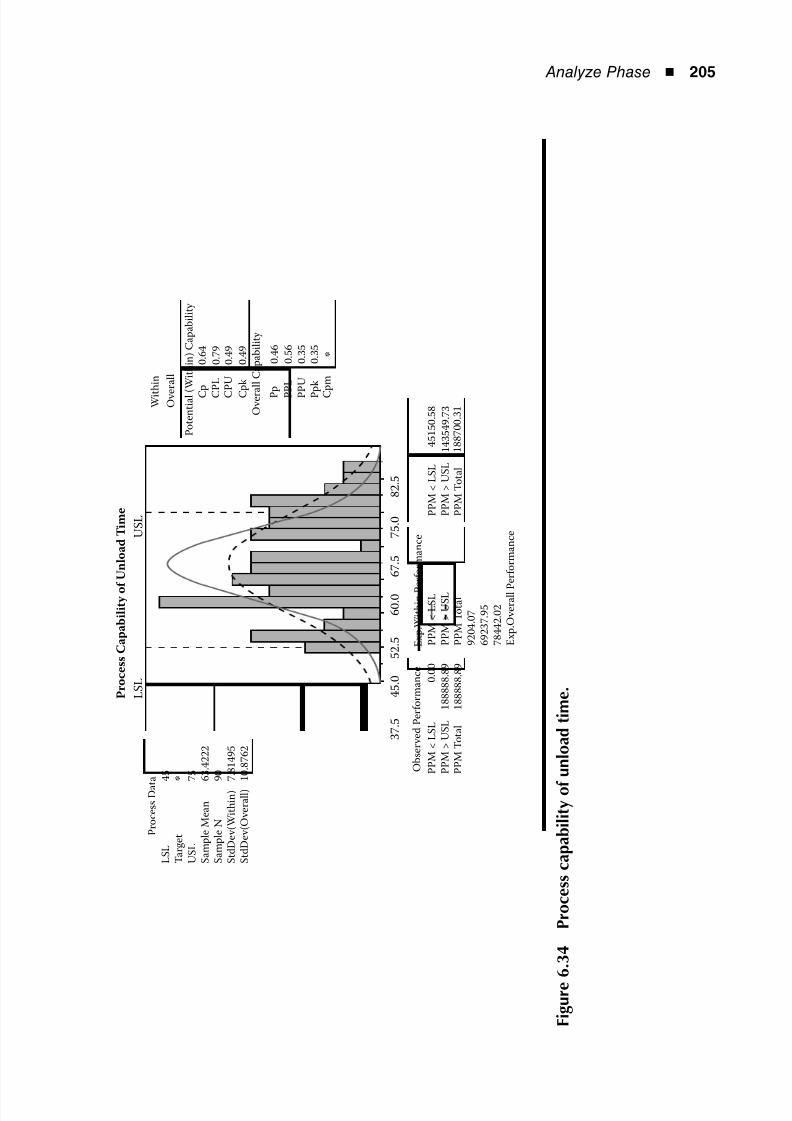
8/12/2019 Implementing Lean Six Sigma Throughout the Supply Chain
http://slidepdf.com/reader/full/implementing-lean-six-sigma-throughout-the-supply-chain 222/278
Analyze Phase ◾ 205
L S L
3 7 . 5
4 5 . 0
5 2 . 5
6 0 . 0
6 7 . 5
7 5 . 0
8 2 . 5
U S L
P r o c e s s C a p a b i l i t y o f U n l o a d T i m e
O v e r a l l C a p a b i l i t y
P o t e n t i a l ( W i t h i n ) C a p a b i l i t y
C p
C P L
C P U
C p
k
0 . 4 9
0 . 4 9
0 . 7 9
0 . 6 4
P p
P P L
P P U
P p
k
C p m
* 0 . 3 5
0 . 3 5
0 . 5 6
0 . 4 6
P r o c e s s D a t a
O b s e r v e d P e r
f o r m a n c e
P P M < L S L
P P M > U S L
P P M T o t a
l
0 . 0 0
1 8 8 8 8 8 . 8 9
1 8 8 8 8 8 . 8 9
E x p . W
i t h i n P e r
f o r m a n c e
P P M < L S L
P P M > U S L
P P M T o t a l
9 2 0 4 . 0 7
6 9 2 3 7 . 9 5
7 8 4 4 2 . 0 2
E x p . O v e r a
l l P
e r f o r m a n c e
P P M < L S L
P P M > U S L
P P M T o t a
l
1 8 8 7 0 0 . 3 1
1 4 3 5 4 9 . 7 3
4 5 1 5 0 . 5 8 W i t
h i n
O v e
r a l l
L S L
T a r g e t
U S L
S a m p
l e M e a n
S a m p
l e N
S t d D e v
( W i t h i n )
S t d D e v
( O v e r a
l l )
4 5 * 7 5 6 3 . 4 2 2 2
9 0 7 . 8 1 4 9 5
1 0 . 8 7 6 2
F i g u r e
6 . 3
4
P r o c e s s c a p a b i l i t y o f
u n l o a d t i m e .

8/12/2019 Implementing Lean Six Sigma Throughout the Supply Chain
http://slidepdf.com/reader/full/implementing-lean-six-sigma-throughout-the-supply-chain 223/278
8/12/2019 Implementing Lean Six Sigma Throughout the Supply Chain
http://slidepdf.com/reader/full/implementing-lean-six-sigma-throughout-the-supply-chain 224/278
207
7Chapter
Improve Phase
Introduction
The Define phase stated the problem; the Measure phase
established a baseline; and the Analyze phase bore a root
cause. Now the team needed to be creative with ways
to improve %trailer utilization without changing the cur-
rent customer satisfaction level. Knowing that the mainroot cause, warehouse demand, could not be altered,
the solutions would need to be very creative. Here in the
Improve phase, the solutions should be chosen to address
the root cause, and they should be tested to ensure that
they truly do solve the problem. Without missing a beat,
Anita supplied the team with questions for Improve at
their first meeting of the phase.
What is the work breakdown structure for this◾
project?
What specific activities are necessary to meet the◾
project’s goals?
How will we reintegrate the various subprojects?◾
Do the changes produce the desired effects?◾
Are there any unanticipated consequences?◾
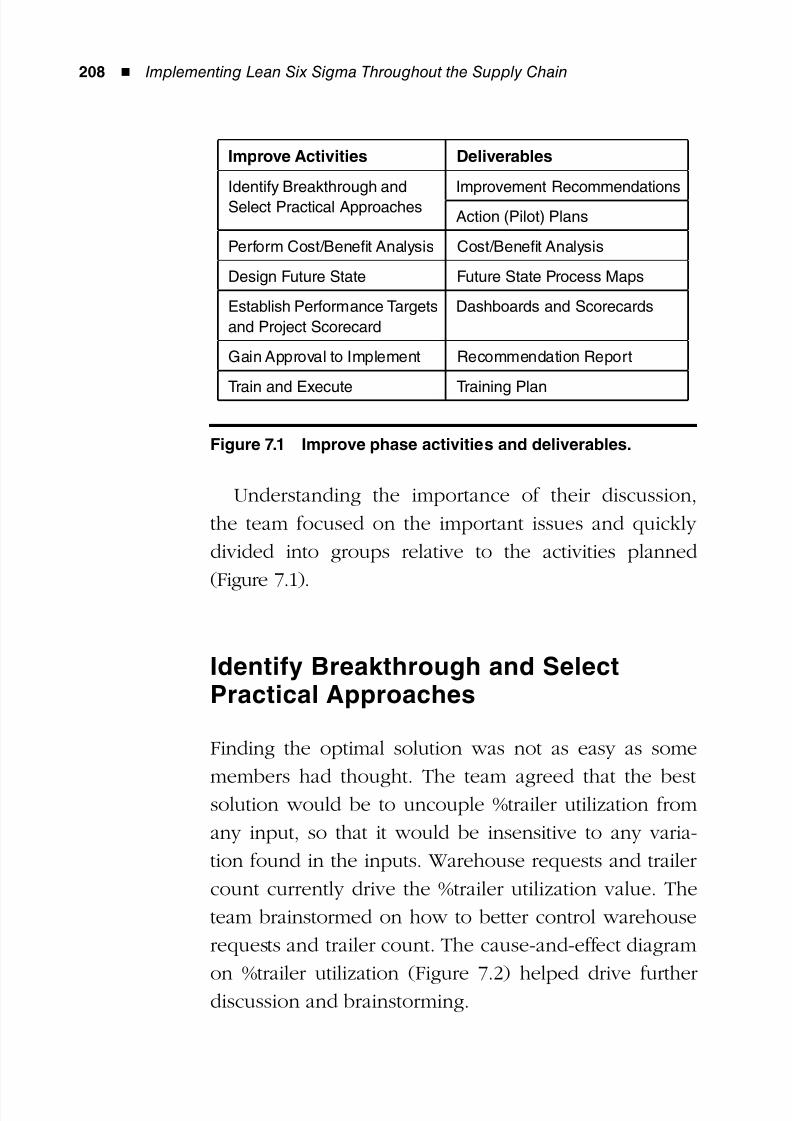
8/12/2019 Implementing Lean Six Sigma Throughout the Supply Chain
http://slidepdf.com/reader/full/implementing-lean-six-sigma-throughout-the-supply-chain 225/278
208 ◾ Implementing Lean Six Sigma Throughout the Supply Chain
Understanding the importance of their discussion,
the team focused on the important issues and quickly
divided into groups relative to the activities planned
(Figure 7.1).
Identify Breakthrough and SelectPractical Approaches
Finding the optimal solution was not as easy as some
members had thought. The team agreed that the bestsolution would be to uncouple %trailer utilization from
any input, so that it would be insensitive to any varia-
tion found in the inputs. Warehouse requests and trailer
count currently drive the %trailer utilization value. The
team brainstormed on how to better control warehouse
requests and trailer count. The cause-and-effect diagram
on %trailer utilization (Figure 7.2) helped drive furtherdiscussion and brainstorming.
Improve Activities Deliverables
Identify Breakthrough and
Select Practical Approaches
Improvement Recommendations
Action (Pilot) Plans
Perform Cost/Benefit Analysis Cost/Benefit Analysis
Design Future State Future State Process Maps
Establish Performance Targets
and Project Scorecard
Dashboards and Scorecards
Gain Approval to Implement Recommendation Report
Train and Execute Training Plan
Figure 7.1 Improve phase activities and deliverables.
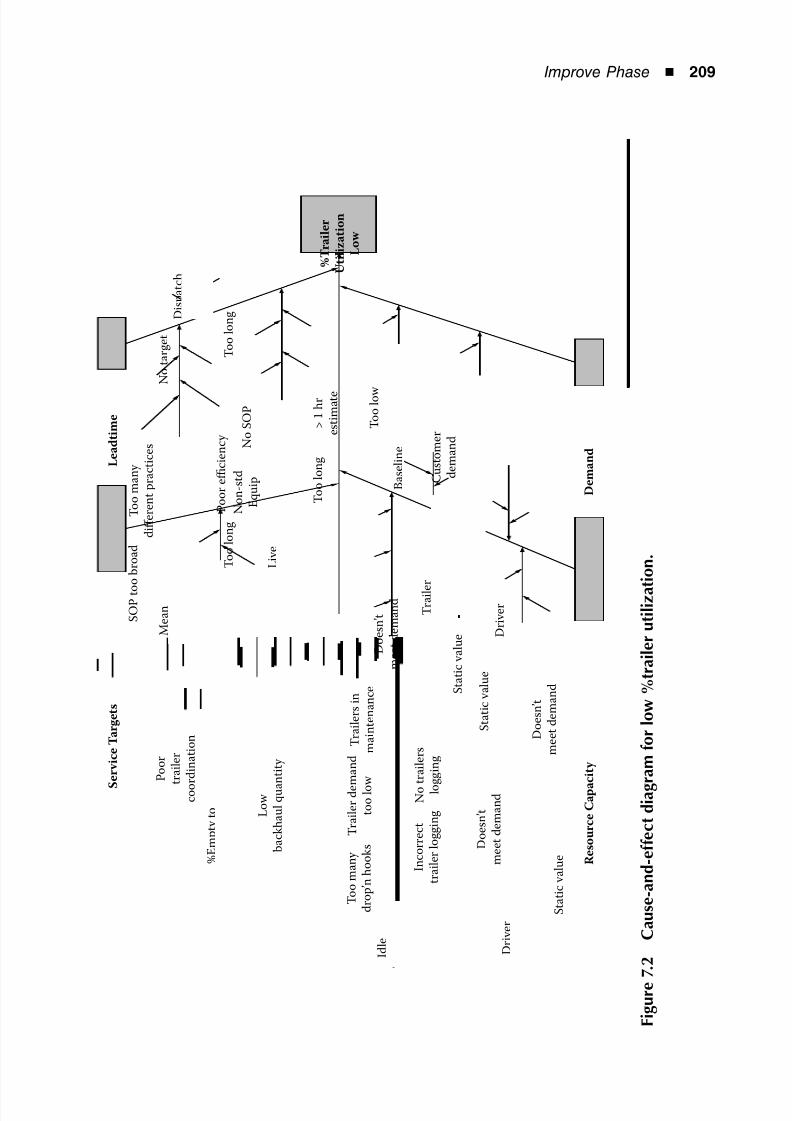
8/12/2019 Implementing Lean Six Sigma Throughout the Supply Chain
http://slidepdf.com/reader/full/implementing-lean-six-sigma-throughout-the-supply-chain 226/278
Improve Phase ◾ 209
S
e r v i c e T a r g e t s
L e a d t i m e
% T r a i l e r
U t i l i z a t i o n
L o w
D e m a n d
R e s o u r c e C a p a
c i t y
P o o r
t r a i l e r
c o o r d i n a t i o n
S O P t o
o b r o a d
T o o m a n y
d i ff e r e n t p r a c t i c e s
L o w
b a c k h a u l q u a n t i t y
% E m p t y t o
C l o s e t o 5 0 %
M e a n
D i s p a t c h
T i m e
D i s p a t c h
t o T o u c h
T i m e
L i v e
U n l o a d
B a s e l i n e
T r a i l e
r
C o u n
t
I d l e
T r a i l e r s
D r i v e r
C o u n t
S e a s o n a l
N o t a r g e t
T o o l o n g
T o o l o n g
T o o l o n g
T o o l o w
C u s t o m e r
d e m a n d
D o e s n ’ t
m e e t d e m a n d
D o e s n ’ t
m e e t d e m a n d
S t a t i c v a l u e
D o e s n ’ t
m e e t d e m a n d S
t a t i c v a l u e
S t a t i c v a l u e
> 1 h r
e s t i m a t e
N o S O P
N o n - s t d
E q u i p
P o o r e ffi c i e n c y
T o o m a n y
d r o p ’ n h o o k s
T r a i l e r d e m a n d
t o o l o w
T r a i l e r s i n
m a i n t e n a n c e
N o t r a i l e r s
l o g g i n g
I n c o r r e c t
t r a i l e r l o g g i n g
M i s p l a c e d
T r a i l e r s
D r i v e r
C o o r d i n a t o r
C o u n t
F i g u r e
7 . 2
C a u s e - a n d - e
f f e c t d i a g r a m f o r l o w % t r a i l e r u t i l i z a t i o n .
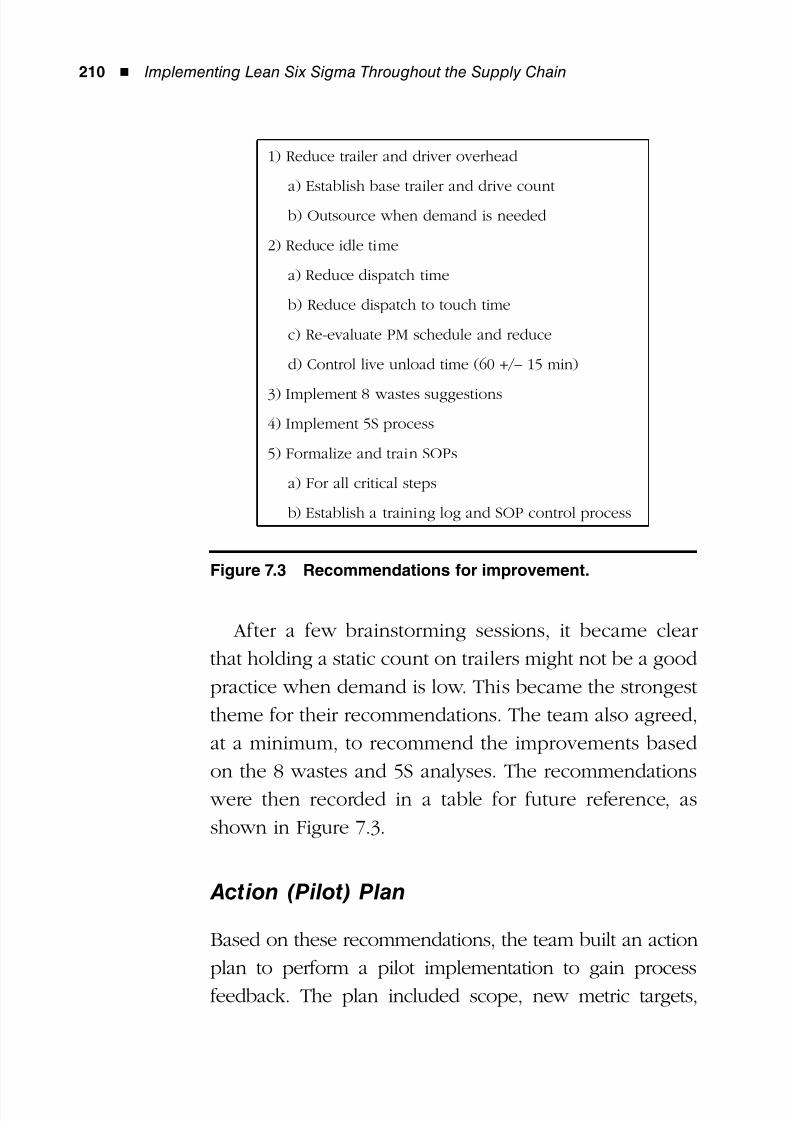
8/12/2019 Implementing Lean Six Sigma Throughout the Supply Chain
http://slidepdf.com/reader/full/implementing-lean-six-sigma-throughout-the-supply-chain 227/278
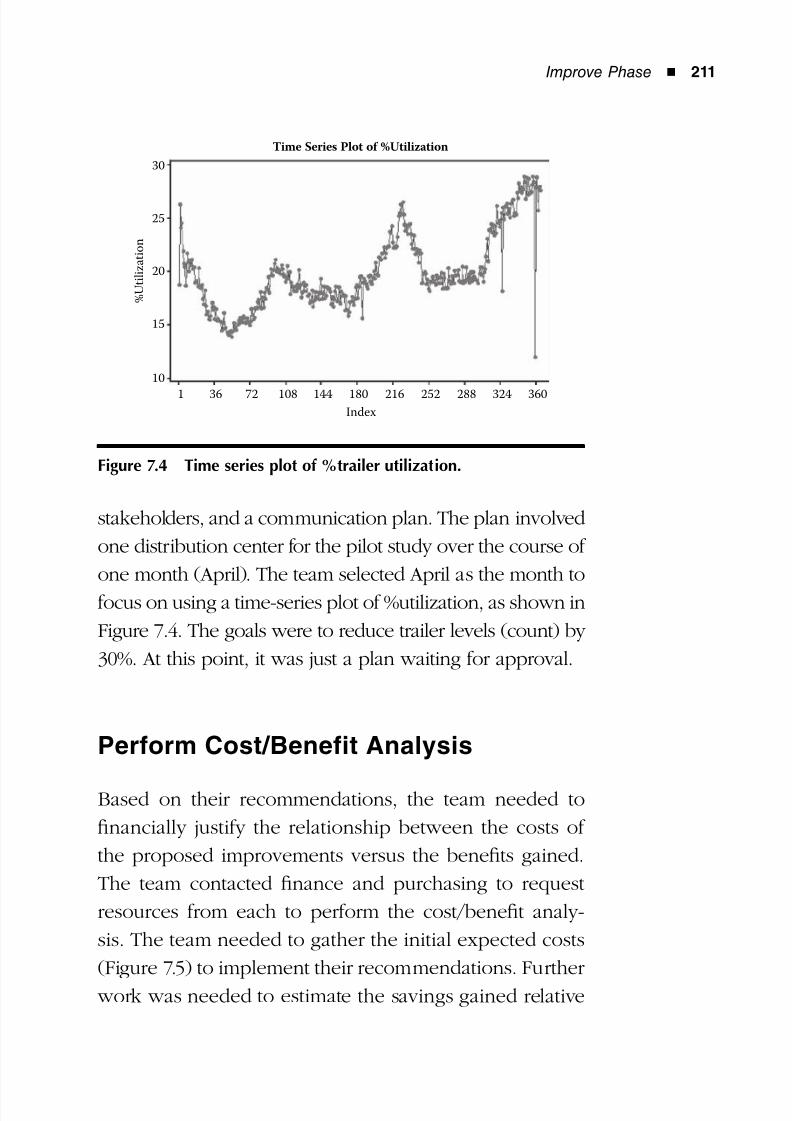
8/12/2019 Implementing Lean Six Sigma Throughout the Supply Chain
http://slidepdf.com/reader/full/implementing-lean-six-sigma-throughout-the-supply-chain 228/278
Improve Phase ◾ 211
stakeholders, and a communication plan. The plan involved
one distribution center for the pilot study over the course of
one month (April). The team selected April as the month to
focus on using a time-series plot of %utilization, as shown in
Figure 7.4. The goals were to reduce trailer levels (count) by
30%. At this point, it was just a plan waiting for approval.
Perform Cost/Benefit Analysis
Based on their recommendations, the team needed to
financially justify the relationship between the costs of
the proposed improvements versus the benefits gained.
The team contacted finance and purchasing to request
resources from each to perform the cost/benefit analy-
sis. The team needed to gather the initial expected costs
(Figure 7.5) to implement their recommendations. Further
work was needed to estimate the savings gained relative
1 36 72 108 144 180 216 252 288 324 360
Index
30
25
20
15
10
% U t i l i z a t i o n
Time Series Plot of %Utilization
Figure 7.4 Time series plot of %trailer utilization.
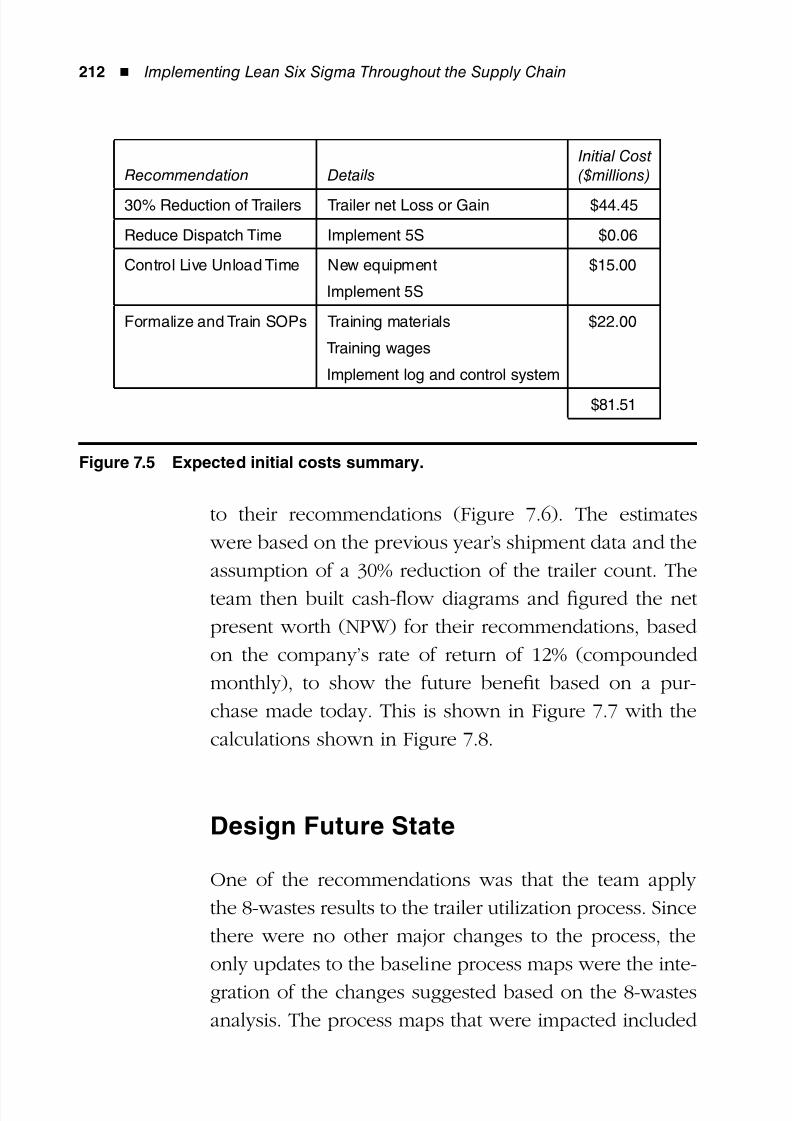
8/12/2019 Implementing Lean Six Sigma Throughout the Supply Chain
http://slidepdf.com/reader/full/implementing-lean-six-sigma-throughout-the-supply-chain 229/278
212 ◾ Implementing Lean Six Sigma Throughout the Supply Chain
to their recommendations (Figure 7.6). The estimates
were based on the previous year’s shipment data and the
assumption of a 30% reduction of the trailer count. The
team then built cash-flow diagrams and figured the net
present worth (NPW) for their recommendations, based
on the company’s rate of return of 12% (compounded
monthly), to show the future benefit based on a pur-
chase made today. This is shown in Figure 7.7 with the
calculations shown in Figure 7.8.
Design Future State
One of the recommendations was that the team apply
the 8-wastes results to the trailer utilization process. Since
there were no other major changes to the process, the
only updates to the baseline process maps were the inte-
gration of the changes suggested based on the 8-wastes
analysis. The process maps that were impacted included
Recommendation DetailsInitial Cost($millions)
30% Reduction of Trailers Trailer net Loss or Gain $44.45
Reduce Dispatch Time Implement 5S $0.06
Control Live Unload Time New equipment
Implement 5S
$15.00
Formalize and Train SOPs Training materials
Training wages
Implement log and control system
$22.00
$81.51
Figure 7.5 Expected initial costs summary.
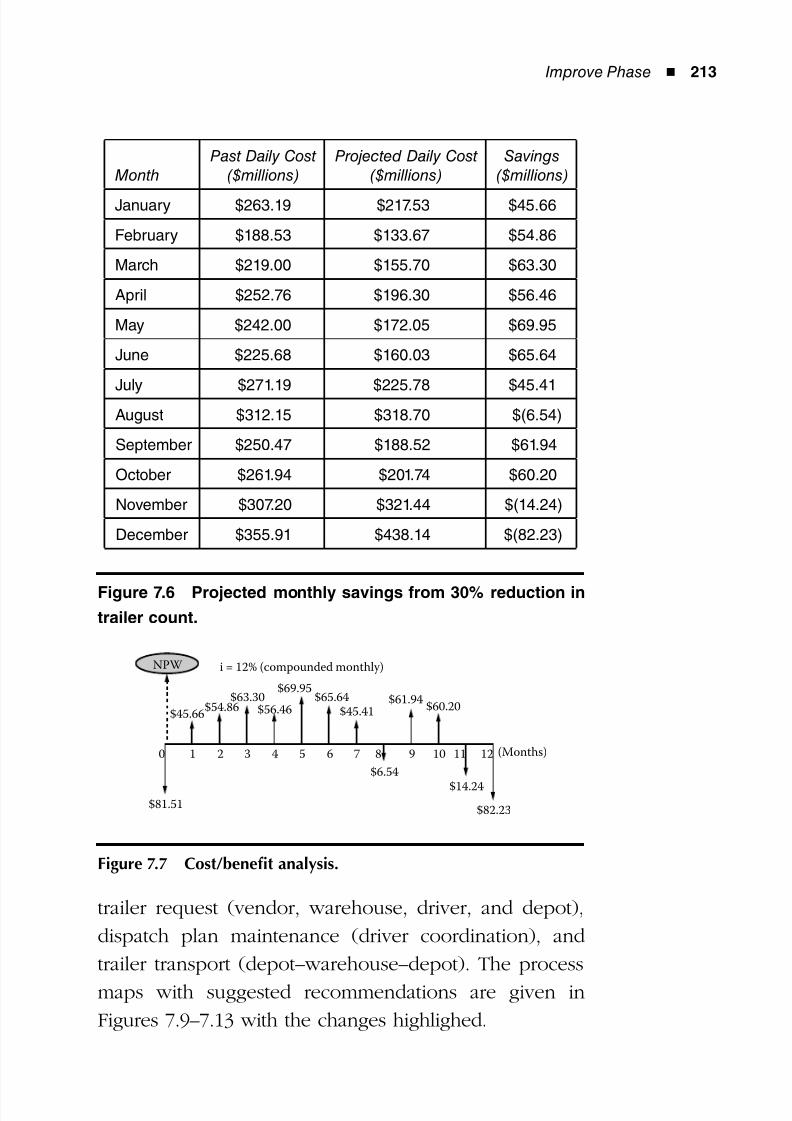
8/12/2019 Implementing Lean Six Sigma Throughout the Supply Chain
http://slidepdf.com/reader/full/implementing-lean-six-sigma-throughout-the-supply-chain 230/278
Improve Phase ◾ 213
trailer request (vendor, warehouse, driver, and depot),
dispatch plan maintenance (driver coordination), and
trailer transport (depot–warehouse–depot). The process
maps with suggested recommendations are given in
Figures 7.9–7.13 with the changes highlighed.
MonthPast Daily Cost
($millions)Projected Daily Cost
($millions)Savings
($millions)
January $263.19 $217.53 $45.66
February $188.53 $133.67 $54.86
March $219.00 $155.70 $63.30
April $252.76 $196.30 $56.46
May $242.00 $172.05 $69.95
June $225.68 $160.03 $65.64
July $271.19 $225.78 $45.41August $312.15 $318.70 $(6.54)
September $250.47 $188.52 $61.94
October $261.94 $201.74 $60.20
November $307.20 $321.44 $(14.24)
December $355.91 $438.14 $(82.23)
Figure 7.6 Projected monthly savings from 30% reduction in
trailer count.
$81.51
$6.54
$14.24
$60.20$61.94
$45.41$65.64
$69.95
$56.46$63.30
$54.86$45.66
$82.23
(Months)
NPW
10 2 3 4 5 6 7 8 9 10 11 12
i = 12% (compounded monthly)
Figure 7.7 Cost/benefit analysis.
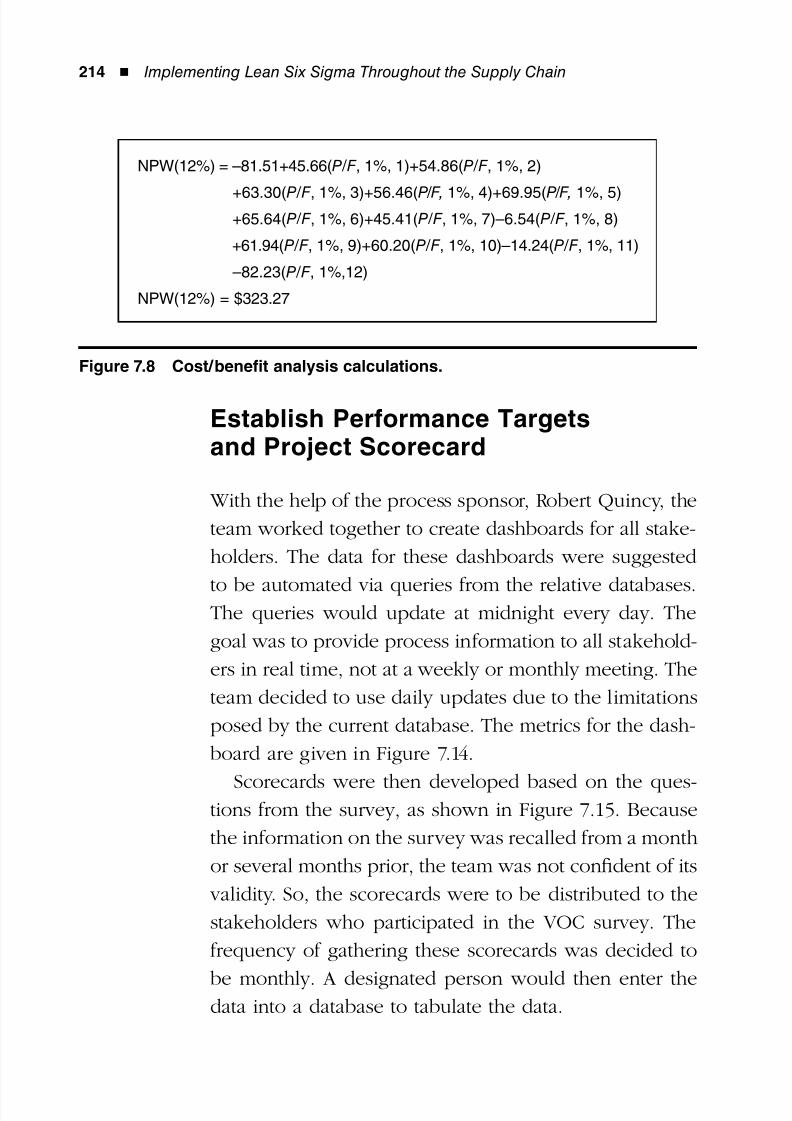
8/12/2019 Implementing Lean Six Sigma Throughout the Supply Chain
http://slidepdf.com/reader/full/implementing-lean-six-sigma-throughout-the-supply-chain 231/278
214 ◾ Implementing Lean Six Sigma Throughout the Supply Chain
Establish Performance Targetsand Project Scorecard
With the help of the process sponsor, Robert Quincy, the
team worked together to create dashboards for all stake-
holders. The data for these dashboards were suggested
to be automated via queries from the relative databases.The queries would update at midnight every day. The
goal was to provide process information to all stakehold-
ers in real time, not at a weekly or monthly meeting. The
team decided to use daily updates due to the limitations
posed by the current database. The metrics for the dash-
board are given in Figure 7.14.
Scorecards were then developed based on the ques-tions from the survey, as shown in Figure 7.15. Because
the information on the survey was recalled from a month
or several months prior, the team was not confident of its
validity. So, the scorecards were to be distributed to the
stakeholders who participated in the VOC survey. The
frequency of gathering these scorecards was decided to
be monthly. A designated person would then enter thedata into a database to tabulate the data.
NPW(12%) = –81.51+45.66(P/F , 1%, 1)+54.86(P/F , 1%, 2)
+63.30(P/F , 1%, 3)+56.46(P/F, 1%, 4)+69.95(P/F, 1%, 5) +65.64(P/F , 1%, 6)+45.41(P/F , 1%, 7)–6.54(P/F , 1%, 8)
+61.94(P/F , 1%, 9)+60.20(P/F , 1%, 10)–14.24(P/F , 1%, 11)
–82.23(P/F , 1%,12)
NPW(12%) = $323.27
Figure 7.8 Cost/benefit analysis calculations.
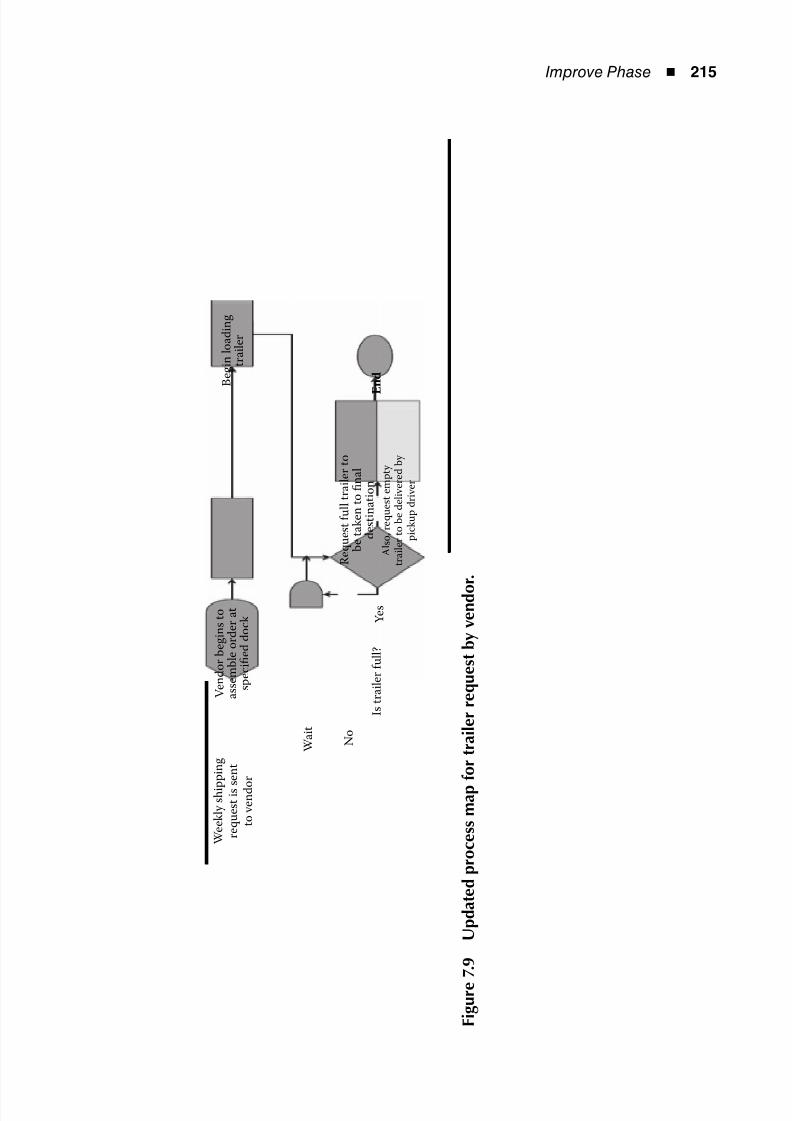
8/12/2019 Implementing Lean Six Sigma Throughout the Supply Chain
http://slidepdf.com/reader/full/implementing-lean-six-sigma-throughout-the-supply-chain 232/278
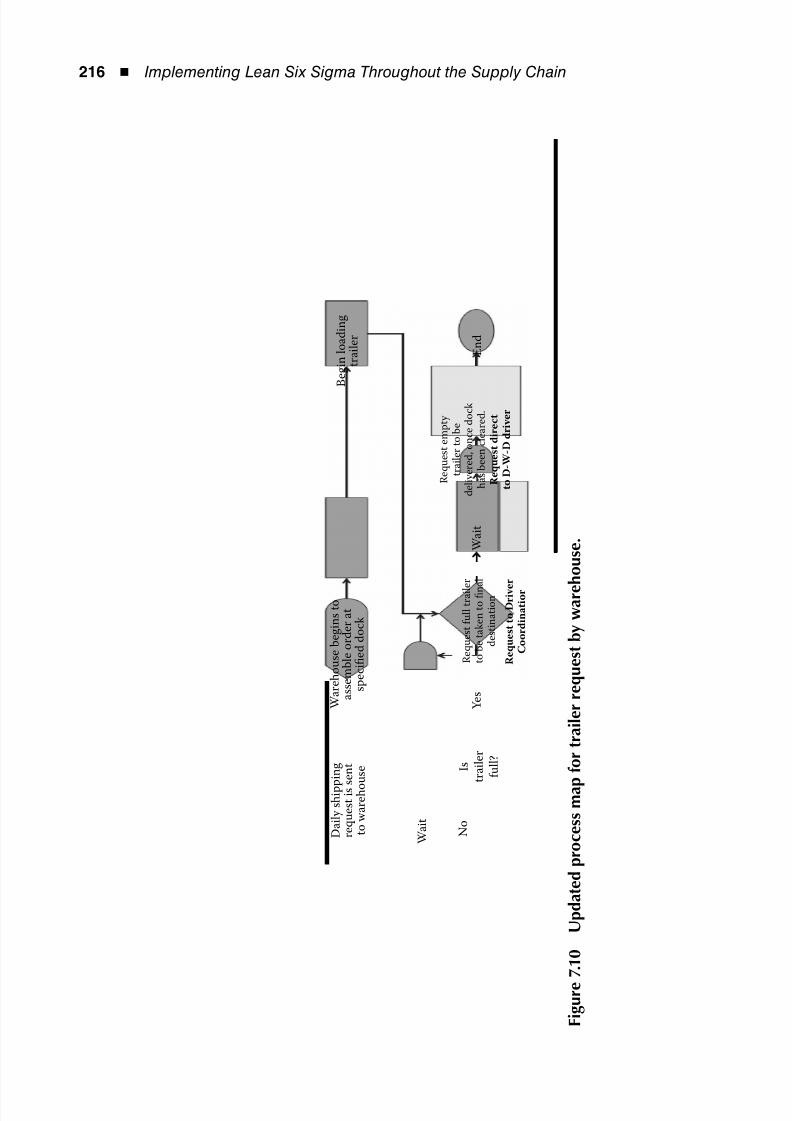
8/12/2019 Implementing Lean Six Sigma Throughout the Supply Chain
http://slidepdf.com/reader/full/implementing-lean-six-sigma-throughout-the-supply-chain 233/278
216 ◾ Implementing Lean Six Sigma Throughout the Supply Chain
D a i l y s h i p p
i n g
r e q u e s t i s s e n t
t o w a r e h o u s e
W a r e h o u s e
b e g i n s t o
a s s e m
b l e o r d e r a t
s p e c i fi e d
d o c k
B e g i n l o a d i n g
t r a i l e r
W a i t
W a i t
N o
E n
d
R e q u e s t e m p t y
t r a i l e r t o b e
d e l i v e r e d , o n c e
d o c k
h a s
b e e n c l e a r e d .
R e q u e s t d i r e c t
t o D - W - D d r i v e r
R e q u e s t f u l l t r a i l e r
t o b e t a k e n t o fi n a l
d e s t i n a t i o n
R e q u e s t t o D r i v e r
C o o r d i n a t i o r
I s t r a i l e r
f u l l ?
Y e s
F i g u r e
7 . 1 0
U p d a t e d p r o c e s s m a p
f o r t r a i l e r r e q u e s t b y w a r e
h o u s e .
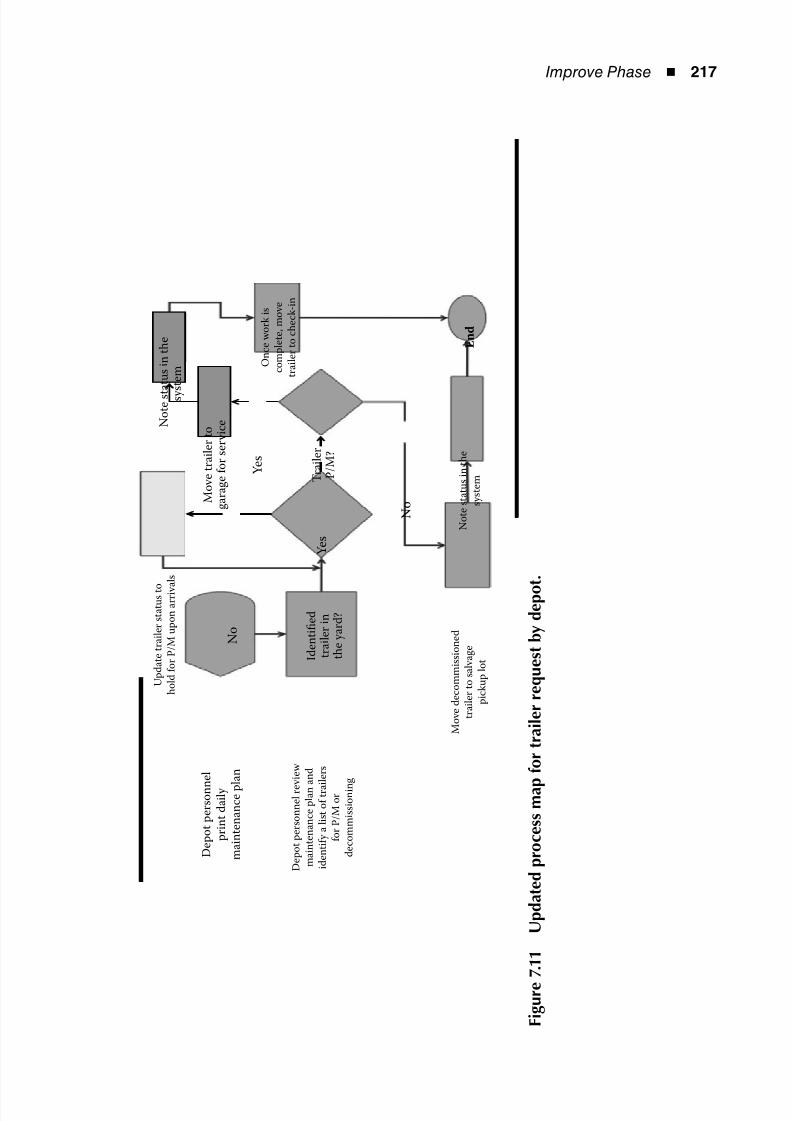
8/12/2019 Implementing Lean Six Sigma Throughout the Supply Chain
http://slidepdf.com/reader/full/implementing-lean-six-sigma-throughout-the-supply-chain 234/278
Improve Phase ◾ 217
D e p o t p e r s o n n
e l
p r i n t d a i l y
m a i n t e n a n c e p
l a n
D e p o t p e r s o n n e l r e v i e w
m a i n t e n a n c e p
l a n a n
d
i d e n t i f y a
l i s t o
f t r a i l e r s
f o r P / M
o r
d e c o m m i s s i o n i n g
O n c e w o r k i s
c o m p
l e t e , m o v e
t r a i l e r t o c h e c k - i n
N o
E n d
U p
d a t e t r a i l e r s t a t u s t o
h o
l d f o r P / M
u p o n a r r i v a l s
I d e n t i fi e d
t r a i l e r i n
t h e y a r
d ?
T r a i l e r
P / M ?
N o t e s t a t u s i n t h e
s y s t e m
M o v e
d e c o m m i s s i o n e
d
t r a i l e r t o s a
l v a g e
p i c k u p
l o t
Y e s
N o
M o v e t r a i l e r t o
g a r a g e
f o r s e r v i c e N
o t e s t a t u s i n t h e
s y s t e m
Y e s
F i g u r e
7 . 1 1
U p d a t e d p r o c e s s m a p
f o r t r a i l e r r e q u e s t b y d e p o
t .
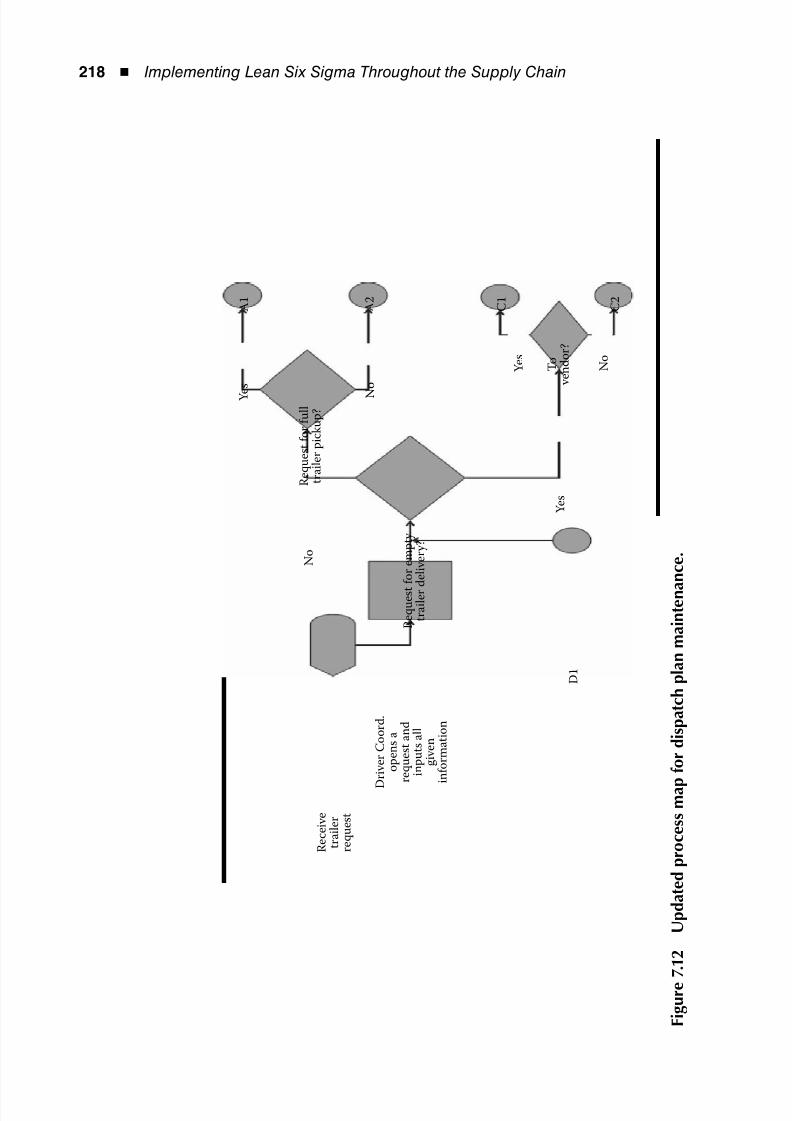
8/12/2019 Implementing Lean Six Sigma Throughout the Supply Chain
http://slidepdf.com/reader/full/implementing-lean-six-sigma-throughout-the-supply-chain 235/278
218 ◾ Implementing Lean Six Sigma Throughout the Supply Chain
R e c e i v e
t r a i l e r
r e q u e s t
D
r i v e r C o o r d .
o p e n s a
r e q u e s t a n
d
i n p u t s a
l l
g i v e n
i n f o r m a t i o n
D 1
N o
N
o
Y e s
N o
C 2
C 1
Y e s
Y e
s
A 1
A 2
R e q u e s t
f o r
f u l l
t r a i l e r p i c k u p ?
R e q u e s t
f o r e m p t y
t r a i l e r d e
l i v e r y ?
T o
v e n
d o r ?
F i g u r e
7 . 1 2
U p d a t e d p r o c e s s m a p
f o r d i s p a t c h p l a n m a i n t e n a
n c e .
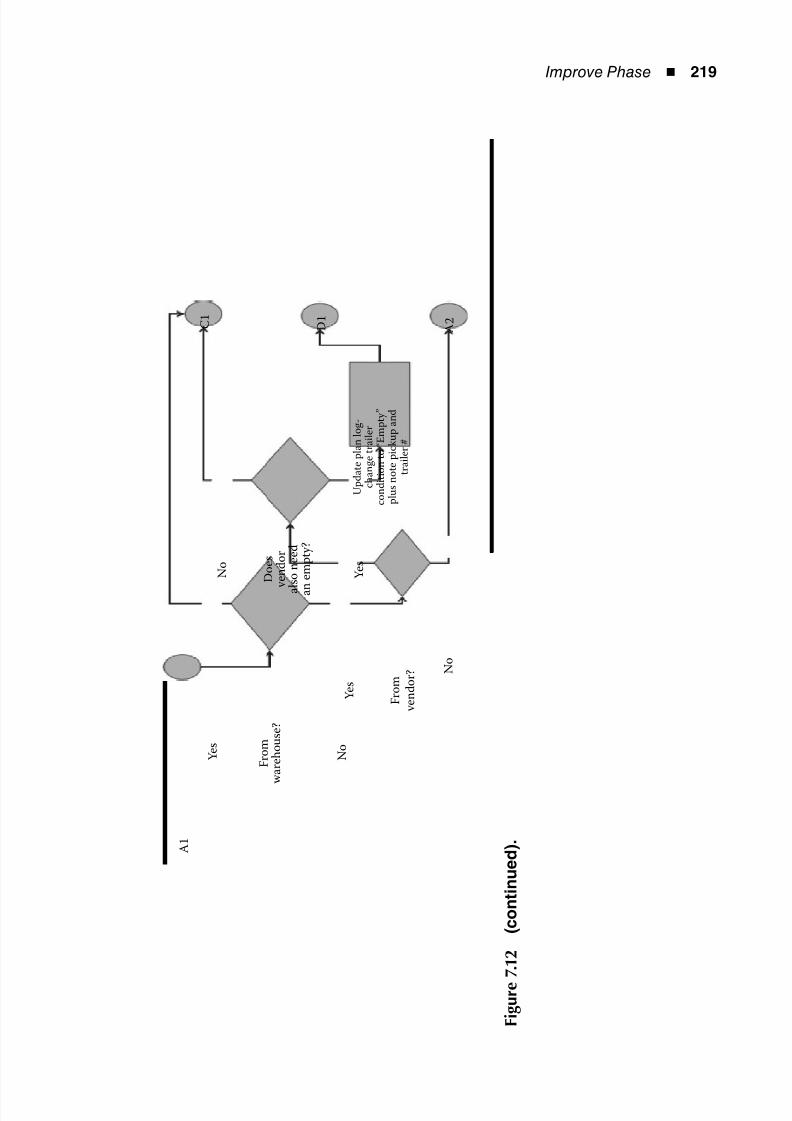
8/12/2019 Implementing Lean Six Sigma Throughout the Supply Chain
http://slidepdf.com/reader/full/implementing-lean-six-sigma-throughout-the-supply-chain 236/278
Improve Phase ◾ 219
N o
N o
N o
C 1
D 1
Y e s
Y e s
Y e s
A 1
A 2
F r o m
v e n
d o r ?
D o e s
v e n
d o r
a l s o n e e
d
a n
e m p t y ?
U p
d a t e p
l a n
l o g -
c h a n g e t r a i l e r
c o n
d i t i o n t o “ E m p t y ”
p l u s n o t e p i c k u p a n
d
t r a i l e r #
F r o m
w a r e
h o u s e ?
F i g u r e
7 . 1 2
( c o n t i n u e d ) .
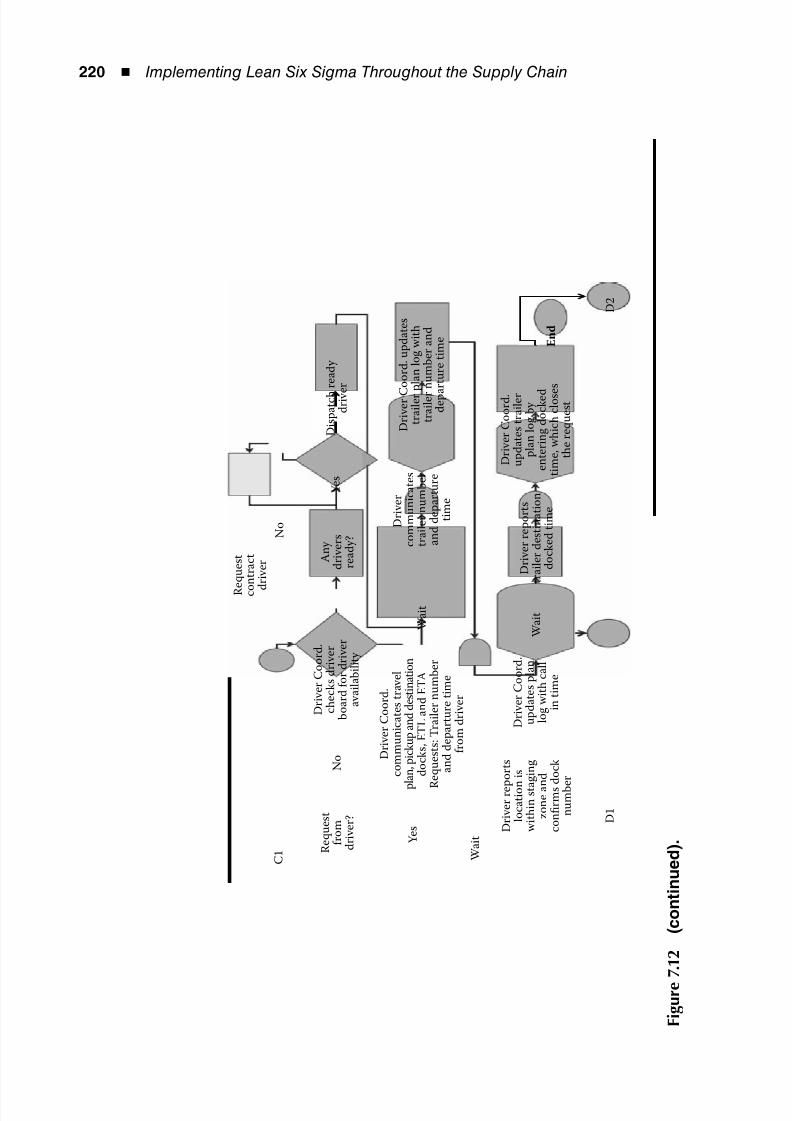
8/12/2019 Implementing Lean Six Sigma Throughout the Supply Chain
http://slidepdf.com/reader/full/implementing-lean-six-sigma-throughout-the-supply-chain 237/278
220 ◾ Implementing Lean Six Sigma Throughout the Supply Chain
R e q u e s t
c o
n t r a c t
d
r i v e r
C 1
D 1
R e q u e s t
f r o m
d r i v e r ?
Y e s
W a i t
D r i v e r r e p
o r t s
l o c a t i o n
i s
w i t h i n s t a
g i n g
z o n e a n
d
c o n fi r m s d o c k
n u m b e
r
D r i v e r C o o r d .
u p d a t e s p l a n
l o g w i t h c a l l
i n t i m e
W a i t
W a i t
E n d
D 2
D r i v e r C o o r d .
u p d a t e s t r a i l e r
p l a n l o g b y
e n t e r i n g d o c k e d
t i m e , w h i c h c l o s e
s
t h e r e q u e s t
D r i v e r C o o r d .
c h e c k s d r i v e r
b o a r d f o r d r i v e r
a v a i l a b i l i t y
D r i v e r r e p o r t s
t r a i l e r d e s t i n a t i o n
d o c k e d t i m e
D r i v e r C
o o r d . u p d a t e s
t r a i l e r p l a n l o g w i t h
t r a i l e r
n u m b e r a n d
d e p a
r t u r e t i m e
A n y
d r i v e r s
r e a d y ?
D i s p a t c h
r e a d y
d r i v e
r
N o
N o
D r i v e r
c o m m u n i c a t e s
t r a i l e r n u m b e r
a n d d e p a r t u r e
t i m e
Y e s
D r i v e r C o o r d .
c o m m u n i c a t e s t r a v e l
p
l a n , p i c k u p
a n
d
d e s t i n a t i o n
d o c k s , E T L a n d E T A
R
e q u e s t s : T r a i l e r n u m b e r
a n d d e p a r t u r e t i m e
f r o m d r i v e r
F i g u r e
7 . 1 2
( c o n t i n u e d ) .
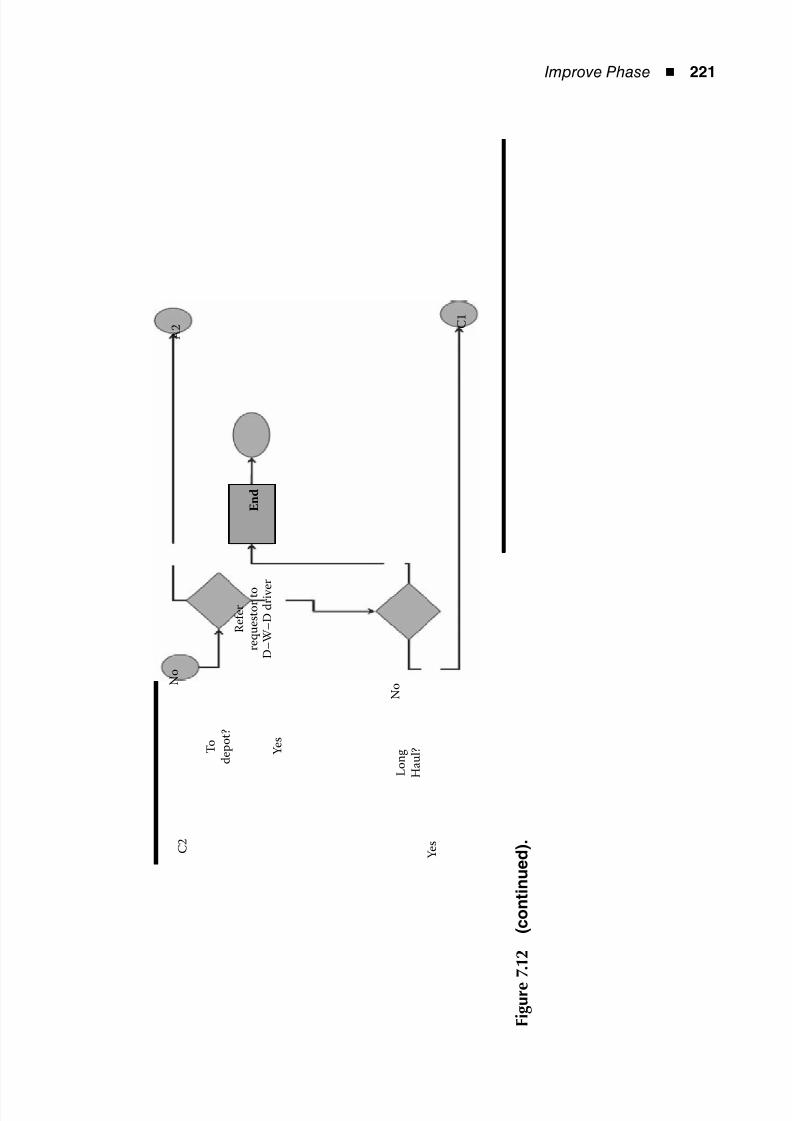
8/12/2019 Implementing Lean Six Sigma Throughout the Supply Chain
http://slidepdf.com/reader/full/implementing-lean-six-sigma-throughout-the-supply-chain 238/278
Improve Phase ◾ 221
C 2
T o
d e p o
t ?
L o n g
H a u
l ?
N o
Y e s
Y e s
E n d
N o
A 2 C
1
R e f e r
r e q u e s t o r t o
D –
W –
D d
r i v e
r
F i g u r e
7 . 1 2
( c o n t i n u e d ) .
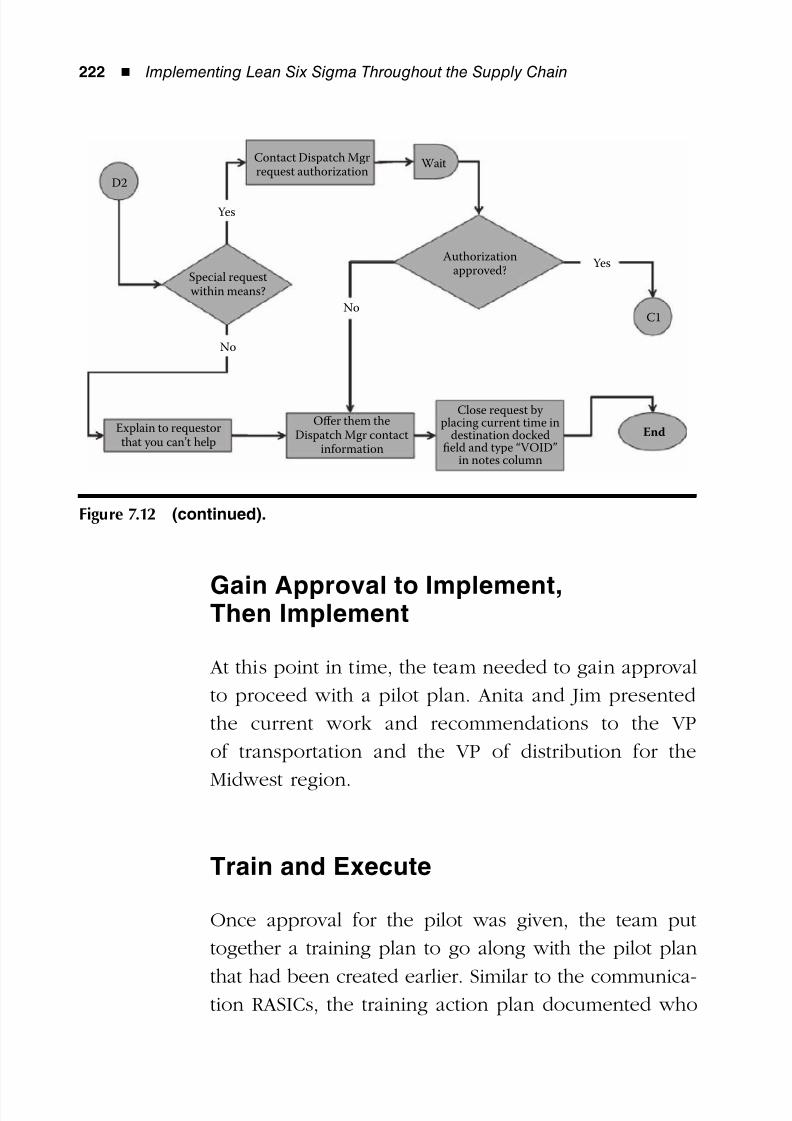
8/12/2019 Implementing Lean Six Sigma Throughout the Supply Chain
http://slidepdf.com/reader/full/implementing-lean-six-sigma-throughout-the-supply-chain 239/278
222 ◾ Implementing Lean Six Sigma Throughout the Supply Chain
Gain Approval to Implement,Then Implement
At this point in time, the team needed to gain approval
to proceed with a pilot plan. Anita and Jim presented
the current work and recommendations to the VP
of transportation and the VP of distribution for the
Midwest region.
Train and Execute
Once approval for the pilot was given, the team put
together a training plan to go along with the pilot plan
that had been created earlier. Similar to the communica-tion RASICs, the training action plan documented who
D2
Yes
No
Close request by placing current time in
destination dockedfield and type “VOID”
in notes column
End
C1
Yes
No
Authorizationapproved?
WaitContact Dispatch Mgrrequest authorization
Offer them theDispatch Mgr contact
information
Special requestwithin means?
Explain to requestorthat you can’t help
Figure 7.12 (continued).
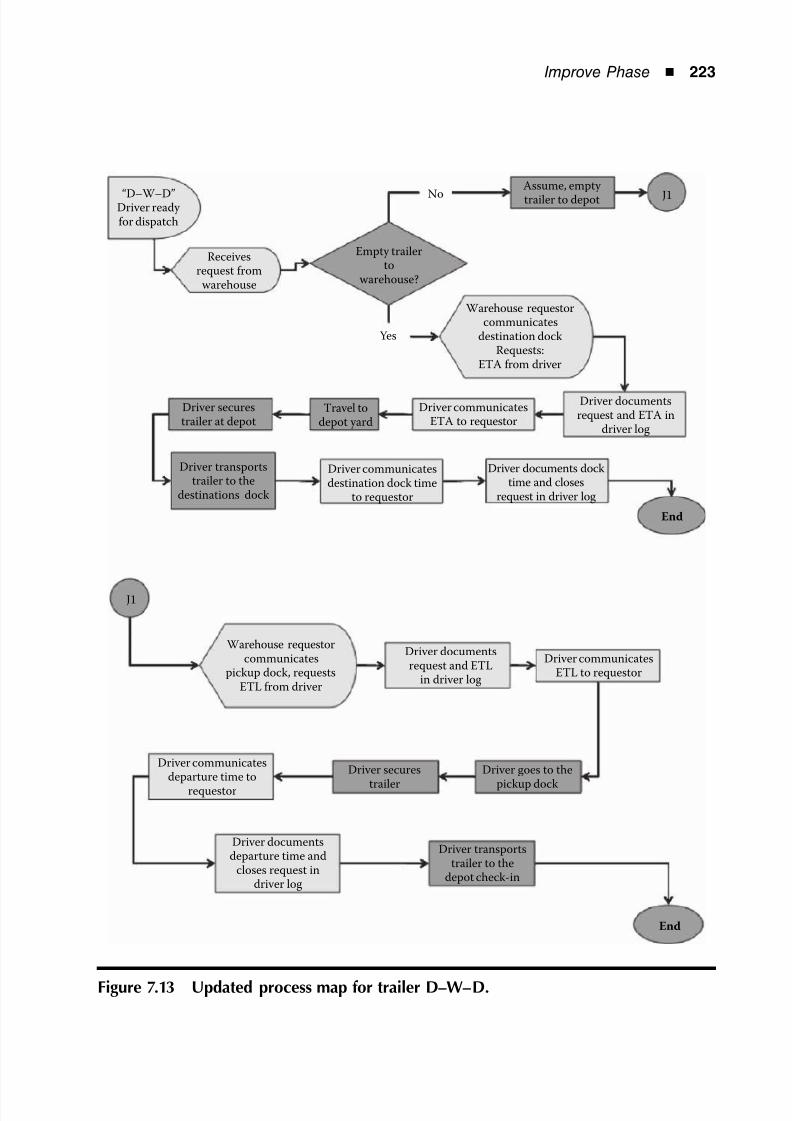
8/12/2019 Implementing Lean Six Sigma Throughout the Supply Chain
http://slidepdf.com/reader/full/implementing-lean-six-sigma-throughout-the-supply-chain 240/278
Improve Phase ◾ 223
Receivesrequest fromwarehouse
Empty trailerto
warehouse?
Yes
No J1
J1
Assume, empty
trailer to depot
Driver securestrailer at depot
Travel todepot yard
Driver communicatesETA to requestor
Driver documentsrequest and ETA in
driver log
End
End
Driver documents docktime and closes
request in driver log
Driver documentsdeparture time and
closes request indriver log
Driver communicatesdestination dock time
to requestor
Driver communicatesdeparture time to
requestor
Driver secures
trailer
Driver goes to the
pickup dock
Driver transportstrailer to the
depot check-in
Driver transportstrailer to the
destinations dock
Driver communicatesETL to requestor
Driver documentsrequest and ETL
in driver log
Warehouse requestorcommunicates
pickup dock, requestsETL from driver
“D–W–D”Driver ready for dispatch
Warehouse requestorcommunicates
destination dockRequests:
ETA from driver
Figure 7.13 Updated process map for trailer D–W–D.
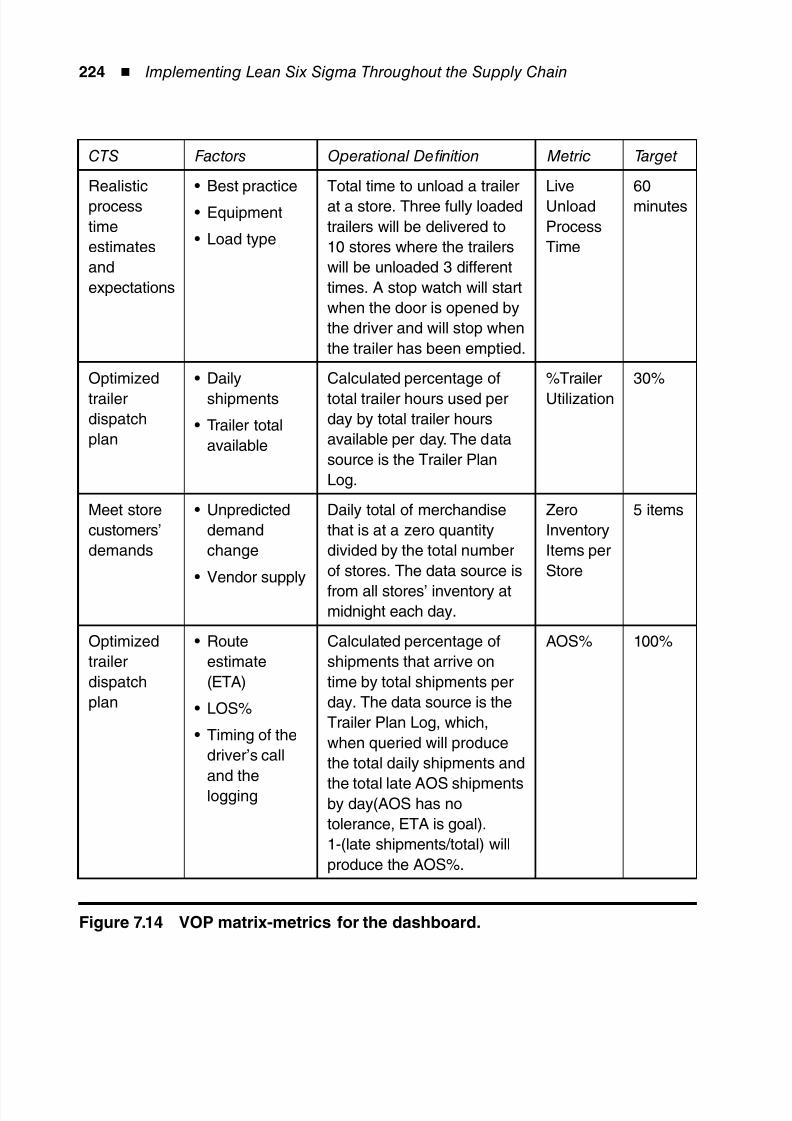
8/12/2019 Implementing Lean Six Sigma Throughout the Supply Chain
http://slidepdf.com/reader/full/implementing-lean-six-sigma-throughout-the-supply-chain 241/278
224 ◾ Implementing Lean Six Sigma Throughout the Supply Chain
CTS Factors Operational Definition Metric Target
Realistic
process
time
estimates
and
expectations
Best practice•
Equipment•
Load type•
Total time to unload a trailer
at a store. Three fully loaded
trailers will be delivered to
10 stores where the trailers
will be unloaded 3 different
times. A stop watch will start
when the door is opened by
the driver and will stop when
the trailer has been emptied.
Live
Unload
Process
Time
60
minutes
Optimized
trailerdispatch
plan
Daily•
shipments
Trailer total•
available
Calculated percentage of
total trailer hours used perday by total trailer hours
available per day. The data
source is the Trailer Plan
Log.
%Trailer
Utilization
30%
Meet store
customers’
demands
Unpredicted•
demand
change
Vendor supply•
Daily total of merchandise
that is at a zero quantity
divided by the total number
of stores. The data source is
from all stores’ inventory atmidnight each day.
Zero
Inventory
Items per
Store
5 items
Optimized
trailer
dispatch
plan
Route•
estimate
(ETA)
LOS%•
Timing of the•
driver’s call
and the
logging
Calculated percentage of
shipments that arrive on
time by total shipments per
day. The data source is the
Trailer Plan Log, which,
when queried will produce
the total daily shipments and
the total late AOS shipmentsby day(AOS has no
tolerance, ETA is goal).
1-(late shipments/total) will
produce the AOS%.
AOS% 100%
Figure 7.14 VOP matrix-metrics for the dashboard.
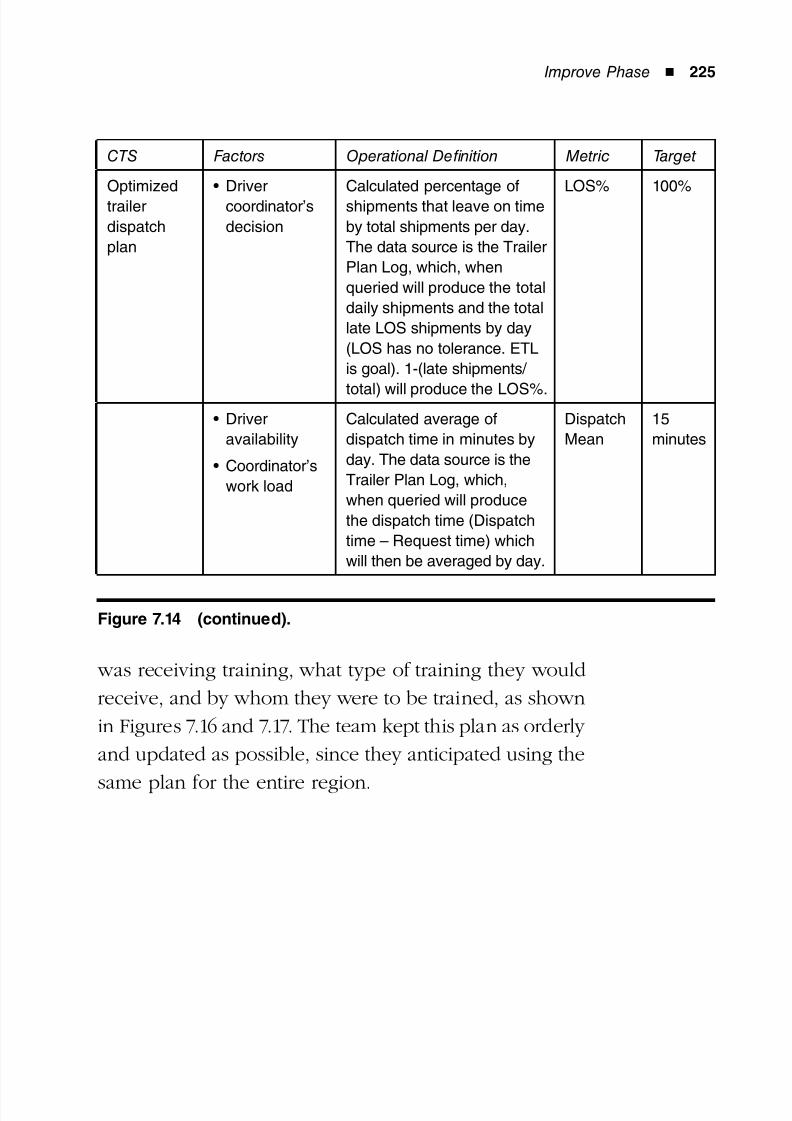
8/12/2019 Implementing Lean Six Sigma Throughout the Supply Chain
http://slidepdf.com/reader/full/implementing-lean-six-sigma-throughout-the-supply-chain 242/278
Improve Phase ◾ 225
was receiving training, what type of training they would
receive, and by whom they were to be trained, as shown
in Figures 7.16 and 7.17. The team kept this plan as orderly
and updated as possible, since they anticipated using the
same plan for the entire region.
CTS Factors Operational Definition Metric Target
Optimized
trailer
dispatch
plan
Driver•
coordinator’s
decision
Calculated percentage of
shipments that leave on time
by total shipments per day.
The data source is the Trailer
Plan Log, which, when
queried will produce the total
daily shipments and the total
late LOS shipments by day
(LOS has no tolerance. ETL
is goal). 1-(late shipments/
total) will produce the LOS%.
LOS% 100%
Driver•
availability
Coordinator’s•
work load
Calculated average of
dispatch time in minutes by
day. The data source is the
Trailer Plan Log, which,
when queried will produce
the dispatch time (Dispatch
time – Request time) which
will then be averaged by day.
Dispatch
Mean
15
minutes
Figure 7.14 (continued).
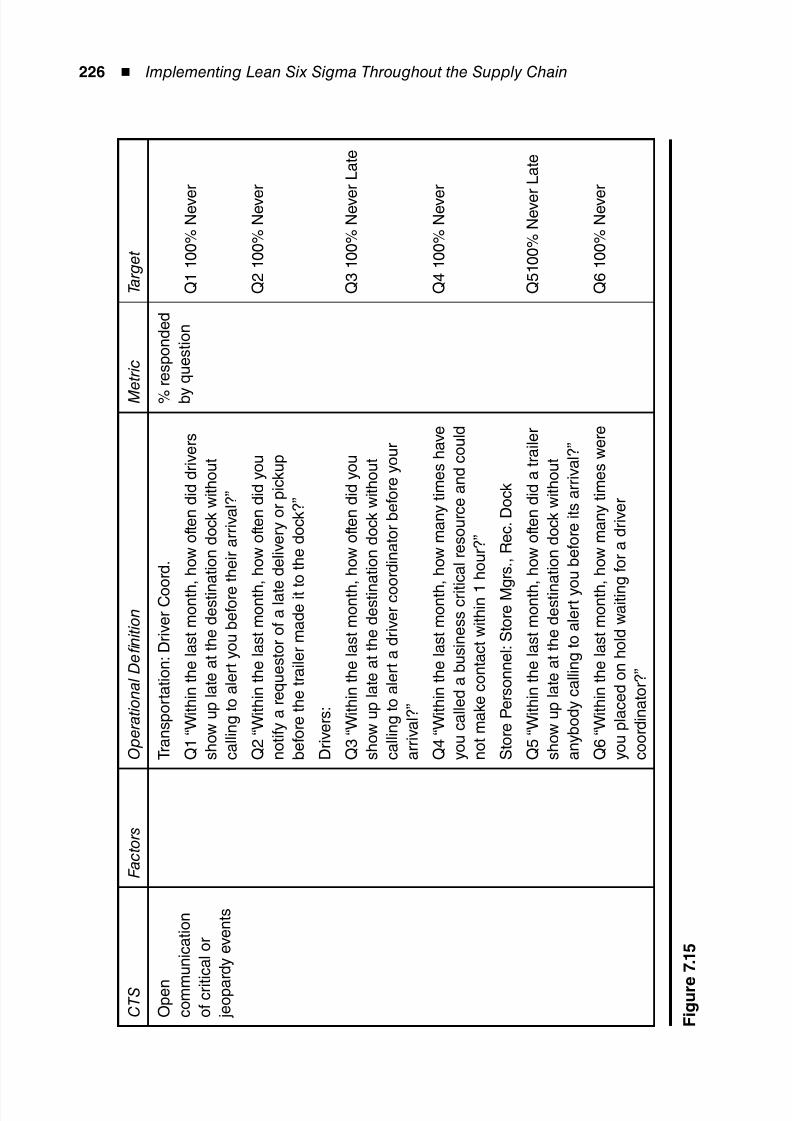
8/12/2019 Implementing Lean Six Sigma Throughout the Supply Chain
http://slidepdf.com/reader/full/implementing-lean-six-sigma-throughout-the-supply-chain 243/278
226 ◾ Implementing Lean Six Sigma Throughout the Supply Chain
C T S
F a c t o r s
O p e r a t i o n a l D e fi n i t i o n
M e t r i c
T a r g e t
O p e n
c o m m
u n i c a t i o n
o f c r i t i c a l o r
j e o p a r d y e v e n t s
T r a n s p o r t a t i o n : D r i v e r C o o r d .
Q 1 “ W i t h i n t h e l a s t m o n t h
, h o w o f t e n d i d d r i v e r s
s h o w u p l a t e a t t h e d e s t i n
a t i o n d o c k w i t h o u t
c a l l i n g t o a l e r t y o u b e f o r e
t h e i r a r r i v a l ? ”
Q 2 “ W i t h i n t h e l a s t m o n t h
, h o w o f t e n d i d y o u
n o t i f y a r e q u e s t o r o f a l a t e d e l i v e r y o r p i c k u p
b e f o r e t h e t r a i l e r m a d e i t t o t h e d o c k ? ”
D r i v e r s :
Q 3 “ W i t h i n t h e l a s t m o n t h
, h o w o f t e n d i d y o u
s h o w u p l a t e a t t h e d e s t i n
a t i o n d o c k w i t h o u t
c a l l i n g t o a l e r t a d r i v e r c o o r d i n a t o r b e f o r e y o u r
a r r i v a l ? ”
Q 4 “ W i t h i n t h e l a s t m o n t h
, h o w m a n y t i m e s h a v e
y o u c a l l e d a b u s i n e s s c r i t i c a l r e s o u r c e a n d c o u l d
n o t m a k e c o n t a c t w i t h i n 1
h o u r ? ”
S t o r e P e r s o n n e l : S t o r e M g r s . , R e c . D o c k
Q 5 “ W i t h i n t h e l a s t m o n t h
, h o w o f t e n d i d a t r a i l e r
s h o w u p l a t e a t t h e d e s t i n
a t i o n d o c k w i t h o u t
a n y b o d y c a l l i n g t o a l e r t y o u b e f o r e i t s a r r i v a l ? ”
Q 6 “ W i t h i n t h e l a s t m o n t h
, h o w m a n y t i m e s w e r e
y o u p l a c e d o n h o l d w a i t i n g f o r a d r i v e r
c o o r d i n a t o r ? ”
%
r e s p o n d e d
b y
q u e s t i o n
Q 1 1 0 0 % N e v e
r
Q 2 1 0 0 % N e v e
r
Q 3 1 0 0 % N e v e
r L a t e
Q 4 1 0 0 % N e v e
r
Q 5 1 0 0 % N e v e r L a t e
Q 6 1 0 0 % N e v e
r
F i g u r e
7 . 1 5
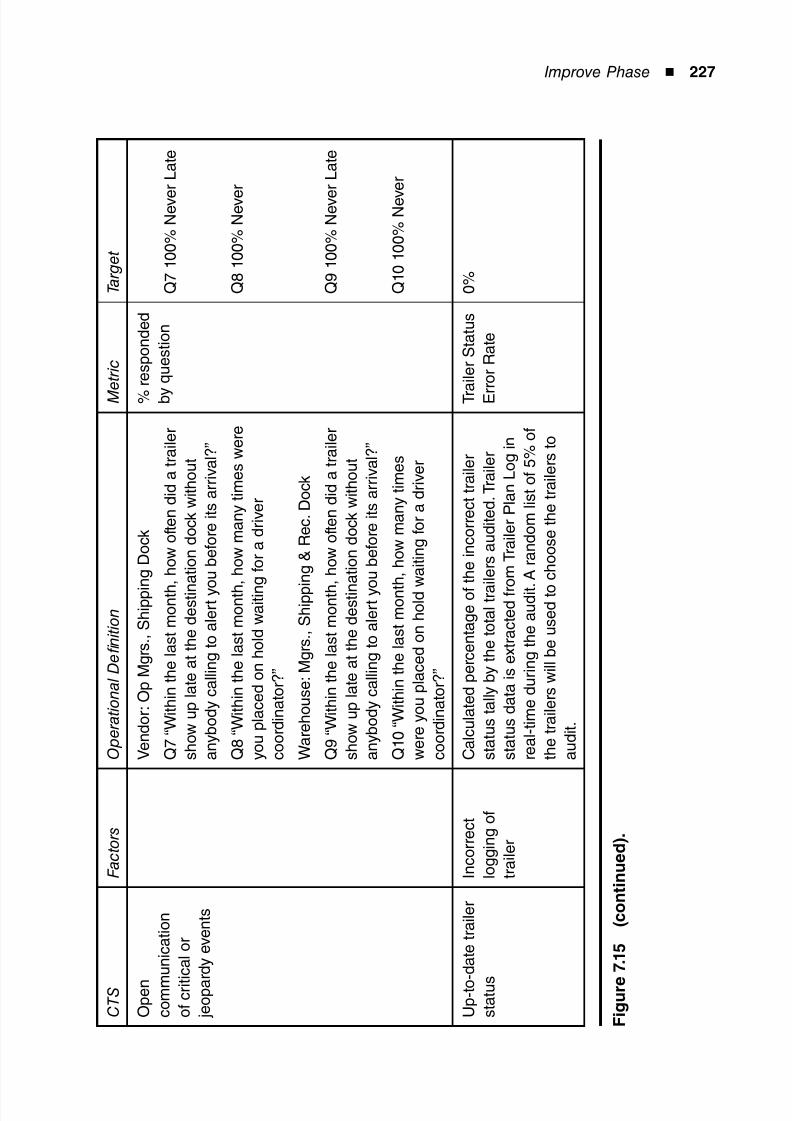
8/12/2019 Implementing Lean Six Sigma Throughout the Supply Chain
http://slidepdf.com/reader/full/implementing-lean-six-sigma-throughout-the-supply-chain 244/278
Improve Phase ◾ 227
C T S
F a c t o r s
O p e r a t i o n a l D e fi n i t i o n
M e t r i c
T a r g e t
O p e n
c o m m
u n i c a t i o n
o f c r i t i c a l o r
j e o p a r d y e v e n t s
V e n d o r : O p M g r s . , S h i p p i n g D o c k
Q 7 “ W i t h i n t h e l a s t m o n t h
, h o w o f t e n d i d a t r a i l e r
s h o w u p l a t e a t t h e d e s t i n
a t i o n d o c k w i t h o u t
a n y b o d y c a l l i n g t o a l e r t y o u b e f o r e i t s a r r i v a l ? ”
Q 8 “ W i t h i n t h e l a s t m o n t h
, h o w m a n y t i m e s w e r e
y o u p l a c e d o n h o l d w a i t i n g f o r a d r i v e r
c o o r d i n a t o r ? ”
W a r e h o u s e : M g r s . , S h i p p i n g & R e c . D o c k
Q 9 “ W i t h i n t h e l a s t m o n t h
, h o w o f t e n d i d a t r a i l e r
s h o w u p l a t e a t t h e d e s t i n
a t i o n d o c k w i t h o u t
a n y b o d y c a l l i n g t o a l e r t y o u b e f o r e i t s a r r i v a l ? ”
Q 1 0 “ W i t h i n t h e l a s t m o n t h , h o w m a n y t i m e s
w e r e y o u p l a c e d o n h o l d w a i t i n g f o r a d r i v e r
c o o r d i n a t o r ? ”
%
r e s p o n d e d
b y
q u e s t i o n
Q 7 1 0 0 % N e v e
r L a t e
Q 8 1 0 0 % N e v e
r
Q 9 1 0 0 % N e v e
r L a t e
Q 1 0 1 0 0 % N e v
e r
U p - t o - d a t e t r a i l e r
s t a t u s
I n c o r r e c t
l o g g i n g o f
t r a i l e r
C a l c u l a t e d p e r c e n t a g e o f
t h e i n c o r r e c t t r a i l e r
s t a t u s t a l l y b y t h e t o t a l t r a
i l e r s a u d i t e d . T r a i l e r
s t a t u s d a t a i s e x t r a c t e d f r o m T r a i l e r P l a n L o g i n
r e a l - t i m e d u r i n g t h e a u d i t . A r a n d o m l i s t o f 5 % o f
t h e t r a i l e r s w i l l b e u s e d t o
c h o o s e t h e t r a i l e r s t o
a u d i t .
T r a i l e r S t a t u s
E r
r o r R a t e
0 %
F i g u r e
7 . 1 5
( c o n t i n u e d ) .
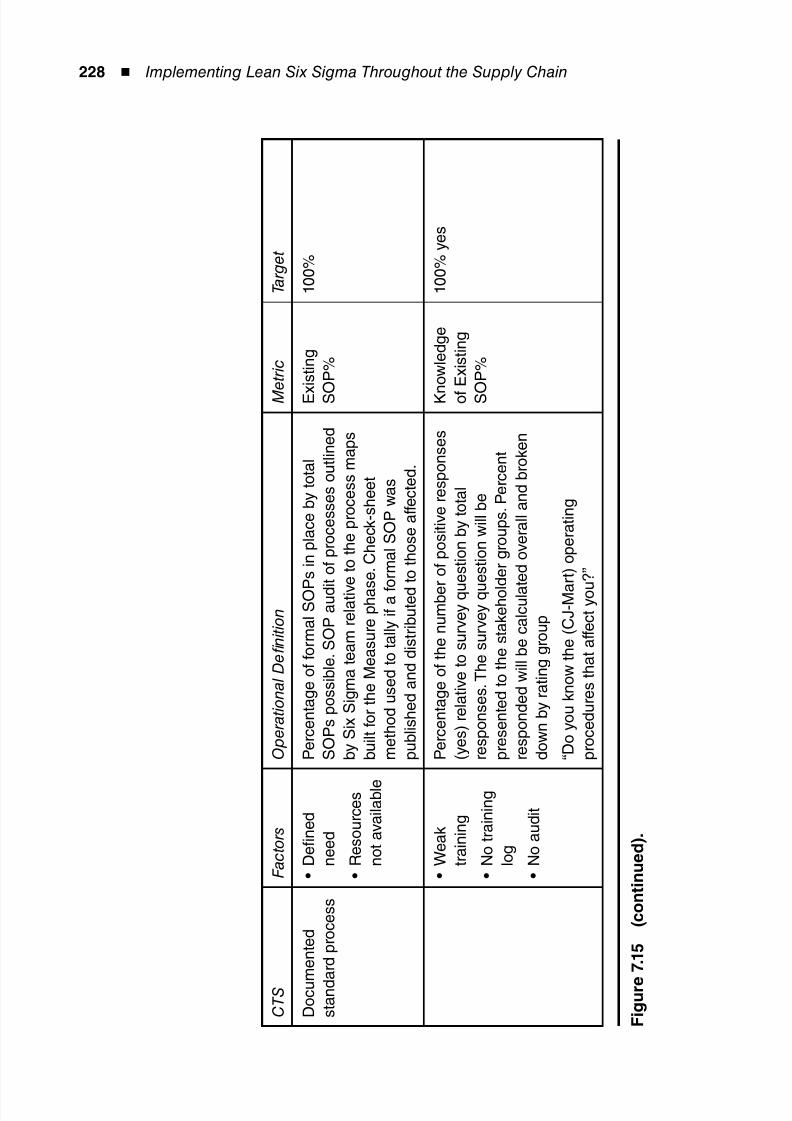
8/12/2019 Implementing Lean Six Sigma Throughout the Supply Chain
http://slidepdf.com/reader/full/implementing-lean-six-sigma-throughout-the-supply-chain 245/278
228 ◾ Implementing Lean Six Sigma Throughout the Supply Chain
C T S
F a c t o r s
O p e r a t i o n a l D e fi n i t i o n
M e t r i c
T a r g e t
D o c u m e n t e d
s t a n d a r d p r o c e s s
D e fi n e d
•
n e e d
R e s o u r c e s
•
n o t a v a i l a b l e
P e r c e n t a g e o f f o r m a l S O P
s i n p l a c e b y t o t a l
S O P s p o s s i b l e . S O P a u d i t o f p r o c e s s e s o u t l i n e d
b y S i x S i g m a t e a m r e l a t i v e t o t h e p r o c e s s m a p s
b u i l t f o r t h e M e a s u r e p h a s e . C h e c k - s h e e t
m e t h o d u s e d t o t a l l y i f a f o r m a l S O P w a s
p u b l i s h e d a n d d i s t r i b u t e d
t o t h o s e a f f e c t e d .
E x
i s t i n g
S O
P %
1 0 0 %
W e a k
•
t r a i n i n g
N o t r a i n i n g
•
l o g
N o a u d i t
•
P e r c e n t a g e o f t h e n u m b e r o f p o s i t i v e r e s p o n s e s
( y e s ) r e l a t i v e t o s u r v e y q u
e s t i o n b y t o t a l
r e s p o n s e s . T h e s u r v e y q u
e s t i o n w i l l b e
p r e s e n t e d t o t h e s t a k e h o l d e r g r o u p s . P e r c e n t
r e s p o n d e d w i l l b e c a l c u l a t e d o v e r a l l a n d b r o k e n
d o w n b y r a t i n g g r o u p
“ D o y o u k n o w t h e ( C J - M a
r t ) o p e r a t i n g
p r o c e d u r e s t h a t a f f e c t y o u
? ”
K n
o w l e d g e
o f
E x i s t i n g
S O
P %
1 0 0 % y e s
F i g u r e
7 . 1 5
( c o n t i n u e d ) .
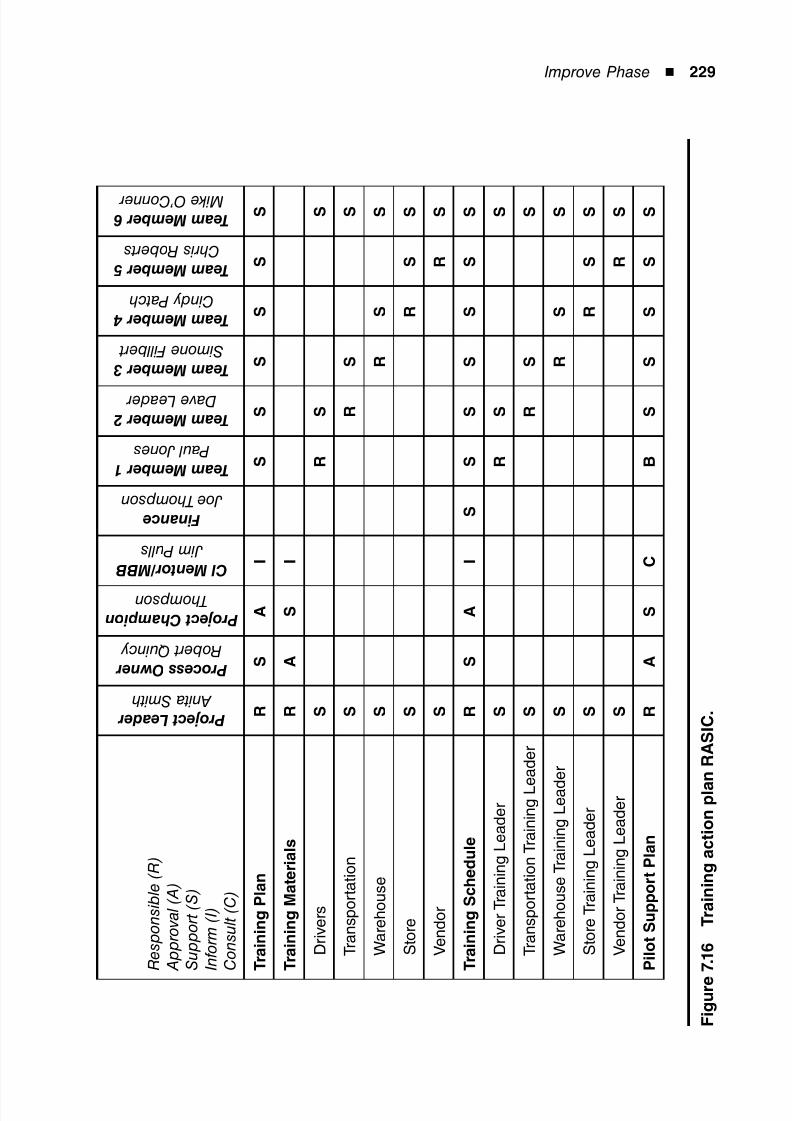
8/12/2019 Implementing Lean Six Sigma Throughout the Supply Chain
http://slidepdf.com/reader/full/implementing-lean-six-sigma-throughout-the-supply-chain 246/278
Improve Phase ◾ 229
R e s p o n s i b l e ( R )
A p p r o v a l ( A )
S u p p o r t ( S )
I n f o r m ( I )
C o n s u l t ( C )
P r o j e c t L e a d e r
A n i t a S m i t h
P r o c e s s O w n e r
R o b e r t Q u i n c y
P r o j e c t C h a m p i o n
T h o m p s o n
C l M e n t o r / M B B
J i m P u l l s
F i n a n c e
J o e T h o m p s o n
T e a m M e m b e r 1
P a u l J o n e s
T e a m M e m b e r 2
D a v e L e a d e r
T e a m M e m b e r 3
S i m o n e F i l l b e r t
T e a m M e m b e r 4
C i n d y P a t c h
T e a m M e m b e r 5
C h r i s R o b e r t s
T e a m M e m b e r 6 M i k e O ’ C o n n e r
T r a i n i n g P l a n
R
S
A
I
S
S
S
S
S
S
T r a i n i n g M a t e r i a l s
R
A
S
I
D r i v e r s
S
R
S
S
T r a n s p o r t a t i o n
S
R
S
S
W a r e h o u s e
S
R
S
S
S t o r e
S
R
S
S
V e n d o r
S
R
S
T r a i n i n g S c h e d u l e
R
S
A
I
S
S
S
S
S
S
S
D r i v e r T r a i n i n g L e a d e r
S
R
S
S
T r a n s p o r t a t i o n T r a i n i n g L e
a d e r
S
R
S
S
W a r e h o u s e T r a i n i n g L e a d
e r
S
R
S
S
S t o r e T r a i n i n g L e a d e r
S
R
S
S
V e n d o r T r a i n i n g L e a d e r
S
R
S
P i l o t S u p p o r t P l a n
R
A
S
C
B
S
S
S
S
S
F i g u r e
7 . 1 6
T r a i n i n g a c t i o n p l a n R A S I C .
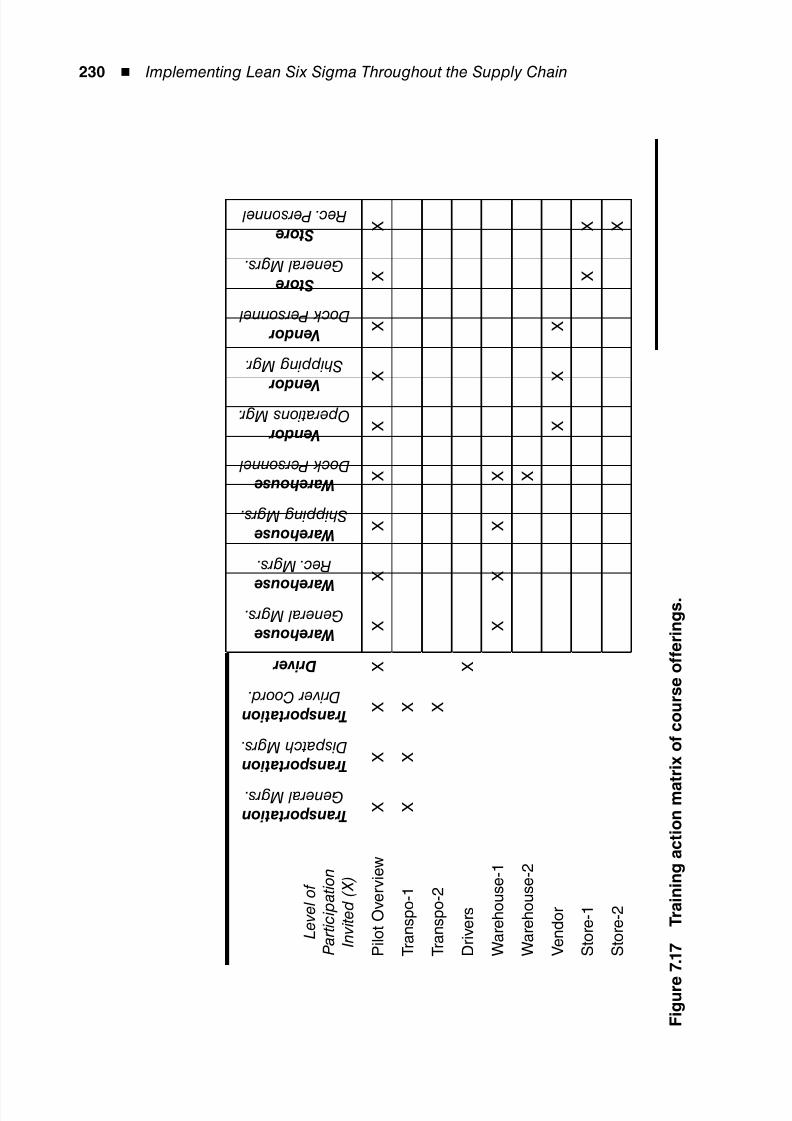
8/12/2019 Implementing Lean Six Sigma Throughout the Supply Chain
http://slidepdf.com/reader/full/implementing-lean-six-sigma-throughout-the-supply-chain 247/278
230 ◾ Implementing Lean Six Sigma Throughout the Supply Chain
L e v e l o f
P a r t i c i p a t i o n
I n v i t e d ( X )
T r a n s p o r t a t i o n
G e n e r a l M g r s .
T r a n s p o r t a t i o n
D i s p a t c h M g r s .
T r a n s p o r t a t i o n
D r i v e r C o o r d .
D r i v e r
W a r e h o u s e
G e n e r a l M g r s . W a r e h o u s e
R e c . M g r s .
W a r e h o u s e
S h i p p i n g M g r s .
W a r e h o u s e
D o c k P e r s o n n e l
V e n d o r
O p e r a t i o n s M g r .
V e n d o r
S h i p p i n g M g r .
V e n d o r
D o c k P e r s o n n e l
S t o r e
G e n e r a l M g r s .
S t o r e
R e c . P e r s o n n e l
P i l o t O v e r v i e w
X
X
X
X
X
X
X
X
X
X
X
X
X
T r a n s p o - 1
X
X
X
T r a n s p o - 2
X
D r i v e r s
X
W a r e h o u s e - 1
X
X
X
X
W a r e h o u s e - 2
X
V e n d o r
X
X
X
S t o r e - 1
X
X
S t o r e - 2
X
F i g u r e
7 . 1 7
T r a i n i n g a c t i o n m a t r i x o f c o u r s e o f f e r i n g s .
8/12/2019 Implementing Lean Six Sigma Throughout the Supply Chain
http://slidepdf.com/reader/full/implementing-lean-six-sigma-throughout-the-supply-chain 248/278
231
8Chapter
Control Phase
Introduction
Here in the Control phase, the team was to focus on how
to maintain the improvements that were seen in the data
from the execution of the pilot plan. Their goal was to
ensure that the key variables remain within the acceptable
ranges under the modified process. Jim Pulls suggestedthat the controls might be as simple as using checklists
or periodic status reviews to ensure that proper proce-
dures were followed, or they could be as detailed as
using process control charts to monitor the performance
of key measures. No matter, Anita started the phase as
she always did, with a list of questions for the team to
discuss at the first meeting of the phase.
During the project, how will we control risk, quality,◾
cost, schedule, scope, and changes to the plan?
What types of progress reports should we send to◾
sponsors?
How will we ensure that the business goals of the◾
project are accomplished?How will we maintain the gains made?◾
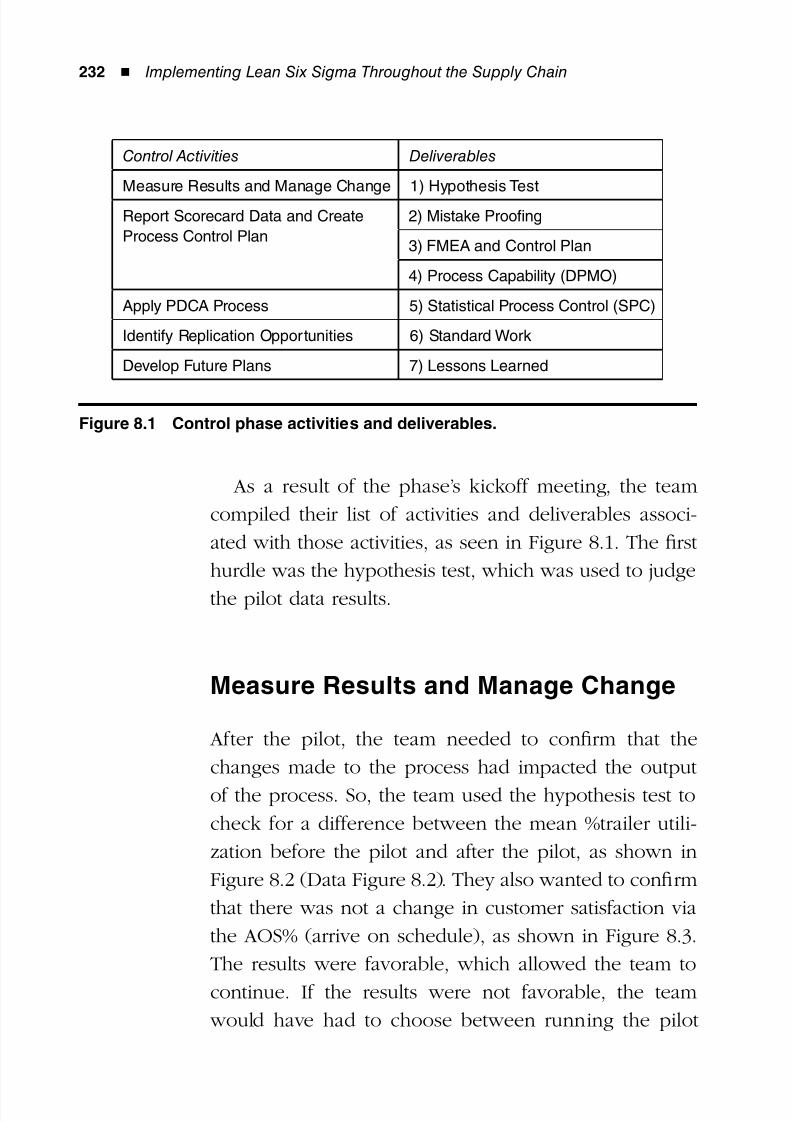
8/12/2019 Implementing Lean Six Sigma Throughout the Supply Chain
http://slidepdf.com/reader/full/implementing-lean-six-sigma-throughout-the-supply-chain 249/278
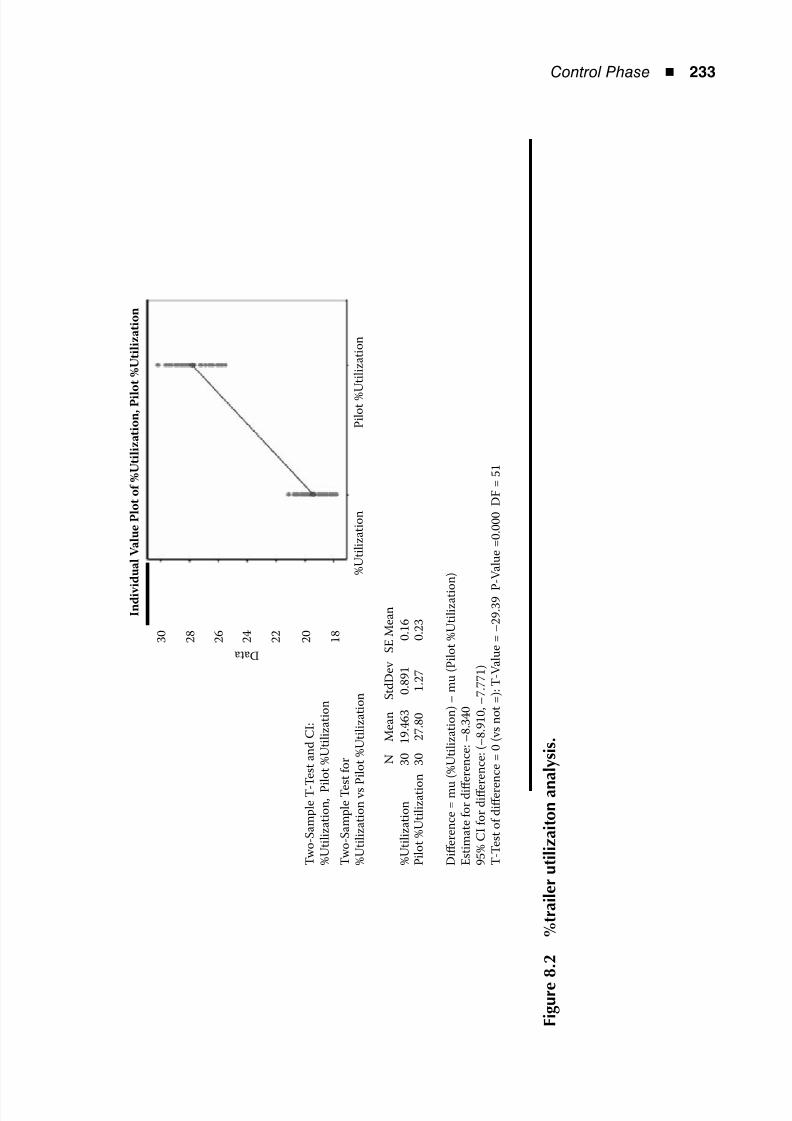
8/12/2019 Implementing Lean Six Sigma Throughout the Supply Chain
http://slidepdf.com/reader/full/implementing-lean-six-sigma-throughout-the-supply-chain 250/278
Control Phase ◾ 233
3 0
2 8
2 6
2 4
2 2
2 0
1 8
D a t a
% U t i l i z a t i o n
P i l o t % U t i l i z a t i o n
I n d i v i d u a l V a l u e P l o t o f % U t i l i z a t i o n , P i l o t % U t i l i z a t i o n
T w o - S a m p l e T - T e s t a n d C I :
% U t i l i z a t i o n , P i l o t % U t i l i z a t i o n
% U t i l i z a t i o n
3 0
1 9 . 4 6 3
0 . 8 9 1
0 . 1 6
P i l o t % U t i l i z a t i o
n
3 0
2 7 . 8 0
1 . 2 7
0 . 2 3
N
M e a n
S t d D e v
S E M e a n
T w o - S a m p l e T e s t f o r
% U t i l i z a t i o n v s P i l o t % U t i l i z a t i o n
D i ff e r e n c e = m u
( % U t i l i z a t i o n ) – m u ( P i l o t % U t i l i z a t i o
n )
E s t i m a t e f o r d i ff
e r e n c e : – 8 . 3 4 0
9 5 % C I f o r d i ff e r e n c e : ( – 8 . 9 1 0 , – 7 . 7 7 1 )
T - T e s t o f d i ff e r e
n c e = 0 ( v s n o t = ) : T - V a l u e = – 2 9 . 3 9 P
- V a l u e = 0 . 0 0 0 D F = 5 1
F i g u r e
8 . 2
% t r a i l e r u t i l i z a i t o n a n
a l y s i s .
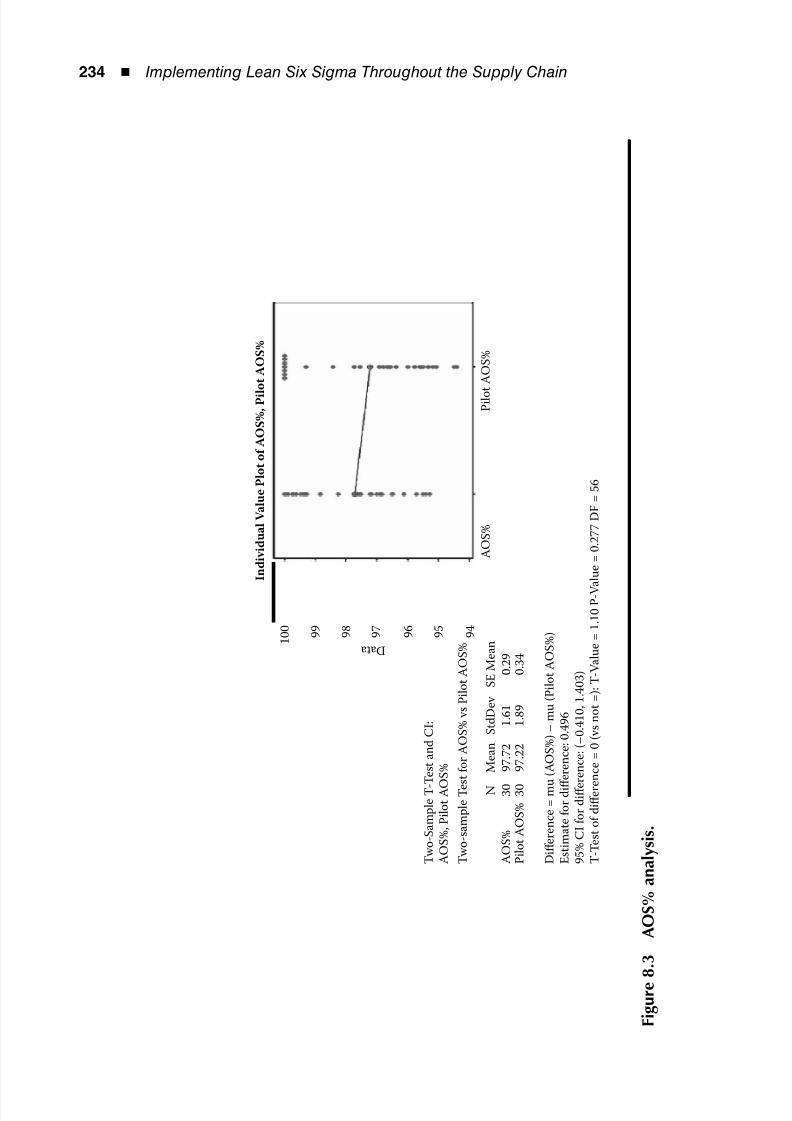
8/12/2019 Implementing Lean Six Sigma Throughout the Supply Chain
http://slidepdf.com/reader/full/implementing-lean-six-sigma-throughout-the-supply-chain 251/278
234 ◾ Implementing Lean Six Sigma Throughout the Supply Chain
1 0 0
9 9
9 8
9 7
9 6
9 5
9 4
D a t a
A O S %
P i l o t A O S %
I n d i v i d u a l V a l u e P l o t o f A O S % , P i l
o t A O S %
T w o - S a m p l e T - T e s t a n d C I :
A O S % , P i l o t A O
S %
T w o - s a m p l e T e s t f o r A O S % v s P i l o t A O S %
D i ff e r e n c e = m u
( A O S % ) – m u ( P i l o t A O S % )
E s t i m a t e f o r d i ff
e r e n c e : 0 . 4 9 6
9 5 % C I f o r d i ff e
r e n c e : ( – 0 . 4 1 0 , 1 . 4 0 3 )
T - T e s t o f d i ff e r e
n c e = 0 ( v s n o t = ) : T - V a l u e = 1 . 1 0 P - V a l u e = 0 . 2 7 7 D F = 5 6
A O S %
3 0
9 7 . 7 2
1 . 6 1
0 . 2 9
P i l o t A O S % 3 0
9 7 . 2 2
1 . 8 9
0 . 3 4
N
M e a n
S t d D e v
S E M e a n
F i g u r e
8 . 3
A O S %
a n a l y s i s .
8/12/2019 Implementing Lean Six Sigma Throughout the Supply Chain
http://slidepdf.com/reader/full/implementing-lean-six-sigma-throughout-the-supply-chain 252/278
Control Phase ◾ 235
longer to collect more data, or offering new recommen-
dations and running a new pilot.
Report Scorecard Data and CreateProcess Control Plan
Dave Leader stepped up as the mistake-proof expert for
the team. He had prior Lean training on this concept,
which allowed the team to excel here. They reviewed
each step of the process and referenced the cause-and-
effect diagrams and why–why diagrams, looking for fail-
ures for which they could plan to prevent or mitigate
the risk. Figure 8.4 is an example of a new diagram that
allowed the team to identify root causes in the trailer
plan log.
For example, instead of allowing the driver coordina-
tor a chance for error, they requested that the software
not allow blanks. The team found that they needed a
few more cause-and-effect diagrams to pull out some
more areas of improvement. Using the cause-and-effect
diagrams, action plans were created to highlight the pos-
sible areas for mistakes and identify methods of correc-
tion, as shown in Figure 8.5.
FMEA and Control Plan
The team revisited the Failure Mode and Effects Analysis
(FMEA) that was started in the Analyze phase, as shown
in Figure 8.6. The live-unload process and the dispatch
process had been changed due to the recommendations,
and many of the failure modes reduced. So the team
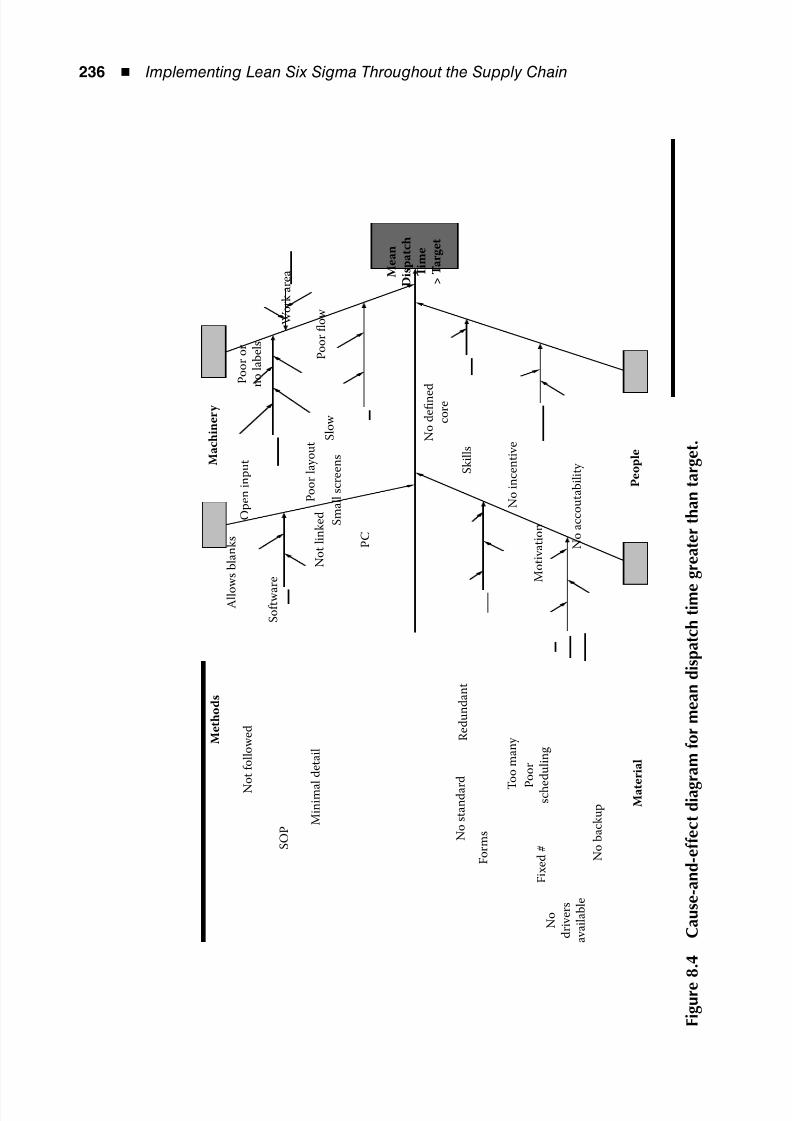
8/12/2019 Implementing Lean Six Sigma Throughout the Supply Chain
http://slidepdf.com/reader/full/implementing-lean-six-sigma-throughout-the-supply-chain 253/278
236 ◾ Implementing Lean Six Sigma Throughout the Supply Chain
M e t h o d s
M a c h i n e r y
M e a n
D i s p a t c h
T i m e
> T a r g e t
P e o p l e
M a t e r i a l
N o t f o l l o w e d
A l l o w s
b l a n
k s
O p e n i n p u t
M i n i m a l d e t a i l
S O P
S o
f t w a r e
W o r k a r e a
P C
S k i l l s
M o t i v a t i o n
P o o r o r
n o
l a b e l s
P o o r
fl o w
N o t l i n k e d
N o
d e fi n e
d
c o r e
N o i n c e n t i v e
N o a c c o u t a b i l i t y
S l o w
S m a l l s c r e e n s
P o o r
l a y o u t
F o r m s N
o s t a n
d a r d
P
o o r
s c h e
d u
l i n g
T o o m a n y
F i x e d #
N o
b a c
k u p
R e d u n
d a n t
N o
d r i v e r s
a v a i l a
b l e
F i g u r e
8 . 4
C a u s e - a n d - e
f f e c t d i a g
r a m f o r m e a n d i s p a t c h t i m e
g r e a t e r t h a n t a r g e t .
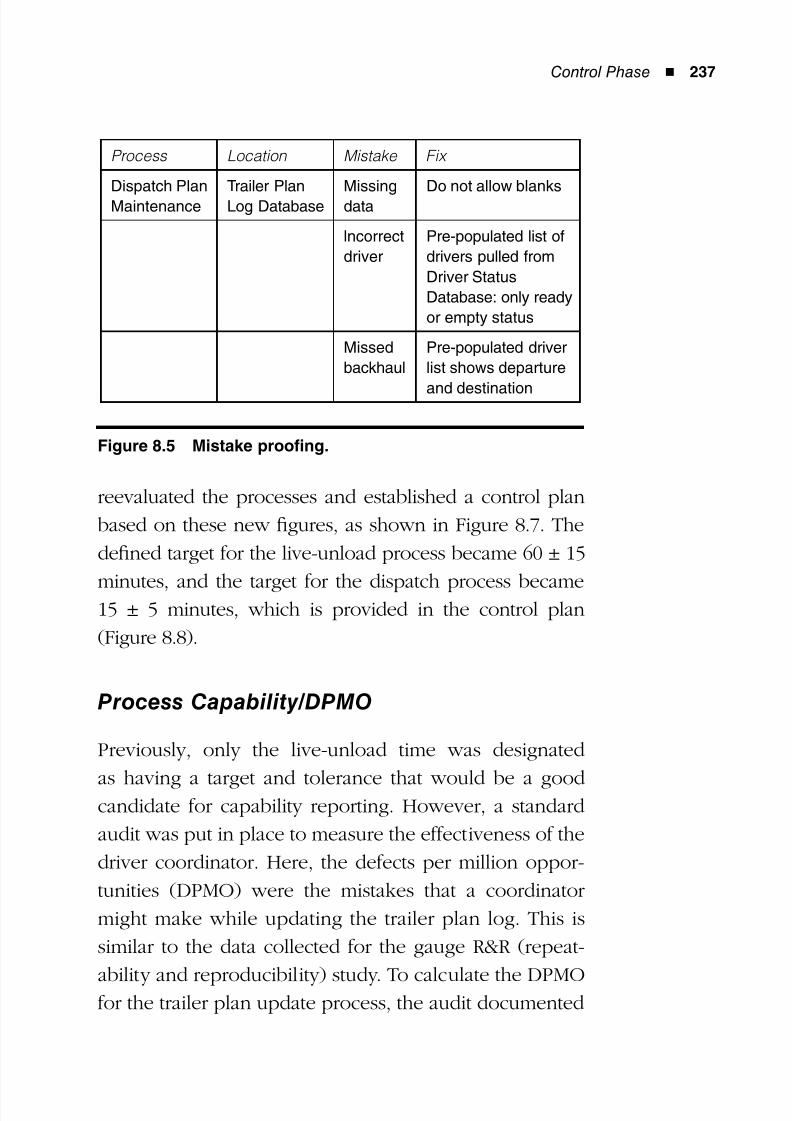
8/12/2019 Implementing Lean Six Sigma Throughout the Supply Chain
http://slidepdf.com/reader/full/implementing-lean-six-sigma-throughout-the-supply-chain 254/278
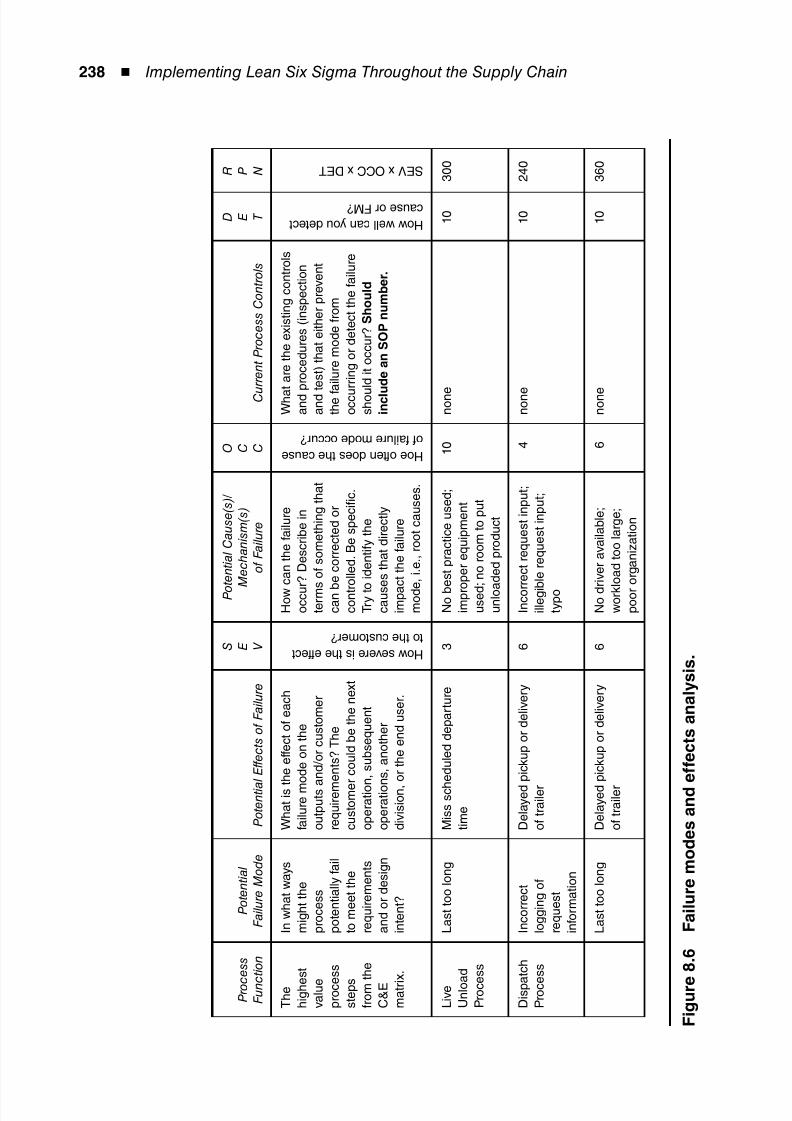
8/12/2019 Implementing Lean Six Sigma Throughout the Supply Chain
http://slidepdf.com/reader/full/implementing-lean-six-sigma-throughout-the-supply-chain 255/278
238 ◾ Implementing Lean Six Sigma Throughout the Supply Chain
P r o c
e s s
F u n c
t i o n
P o t e n t i a l
F a i l u r e M o d e
P o t e n t i a l E f f e c t s o f F a i l u r e
S E V
P o t e n t i a l C a u s e ( s ) /
M e c h a n i s m ( s )
o f F a i l u r e
O C C
C u
r r e n t P r o c e s s C o n t r o l s
D E T
R P N
T h e
h i g h e
s t
v a l u e
p r o c e
s s
s t e p s f r o m t h e
C & E
m a t r i x .
I n w h a t w a y s
m i g h t t h e
p r o c e s s
p o t e n t i a l l y f a i l
t o m e e t t h e
r e q u i r e m e n t s
a n d o r d e s i g n
i n t e n t ?
W h a t i s t h e e f f e c t o f e a c h
f a i l u r e m o d e o n t h e
o u t p u t s a
n d / o r c u s t o m e r
r e q u i r e m
e n t s ? T h e
c u s t o m e r c o u l d b e t h e n e x t
o p e r a t i o n , s u b s e q u e n t
o p e r a t i o n s , a n o t h e r
d i v i s i o n ,
o r t h e e n d u s e r .
H o w s e v e r e i s t h e e f f e c t
t o t h e c u s t o m e r ?
H o w
c a n t h e f a i l u r e
o c c u r ? D e s c r i b e i n
t e r m s o f s o m e t h i n g t h a t
c a n b
e c o r r e c t e d o r
c o n t r
o l l e d . B e s p e c i fi c .
T r y t o
i d e n t i f y t h e
c a u s e s t h a t d i r e c t l y
i m p a c t t h e f a i l u r e
m o d e , i . e . , r o o t c a u s e s .
H o e o f t e n d o e s t h e c a u s e
o f f a i l u r e m o d e o c c u r ?
W h a t a r e t h e e x i s t i n g c o n t r o l s
a n d p r o c e d u r e s ( i n s p e c t i o n
a n d t e s t ) t h a t e i t h e r p r e v e n t
t h e f a i l u r e m o d e f r o m
o c c u
r r i n g o r d e t e c t t h e f a i l u r e
s h o u
l d i t o c c u r ? S h o u l d
i n c l u
d e a n S O P n u m b e r .
H o w w e l l c a n y o u d e t e c t
c a u s e o r F M ?
S E V x O C C x D E T
L i v e U n l o a
d
P r o c e
s s
L a s t t o o l o n g
M i s s s c h
e d u l e d d e p a r t u r e
t i m e
3
N o b e s t p r a c t i c e u s e d ;
i m p r o p e r e q u i p m e n t
u s e d ; n o r o o m t o p u t
u n l o a
d e d p r o d u c t
1 0
n o n e
1 0
3 0 0
D i s p a
t c h
P r o c e
s s
I n c o r r e c t
l o g g i n g o f
r e q u e s t
i n f o r m a t i o n
D e l a y e d
p i c k u p o r d e l i v e r y
o f t r a i l e r
6
I n c o r
r e c t r e q u e s t i n p u t ;
i l l e g i b l e r e q u e s t i n p u t ;
t y p o
4
n o n e
1 0
2 4 0
L a s t t o o l o n g
D e l a y e d
p i c k u p o r d e l i v e r y
o f t r a i l e r
6
N o d r i v e r a v a i l a b l e ;
w o r k l o a d t o o l a r g e ;
p o o r
o r g a n i z a t i o n
6
n o n e
1 0
3 6 0
F i g u r e
8 . 6
F a i l u r e m o d e s a n d e f f e c t s a n a l y s i s .
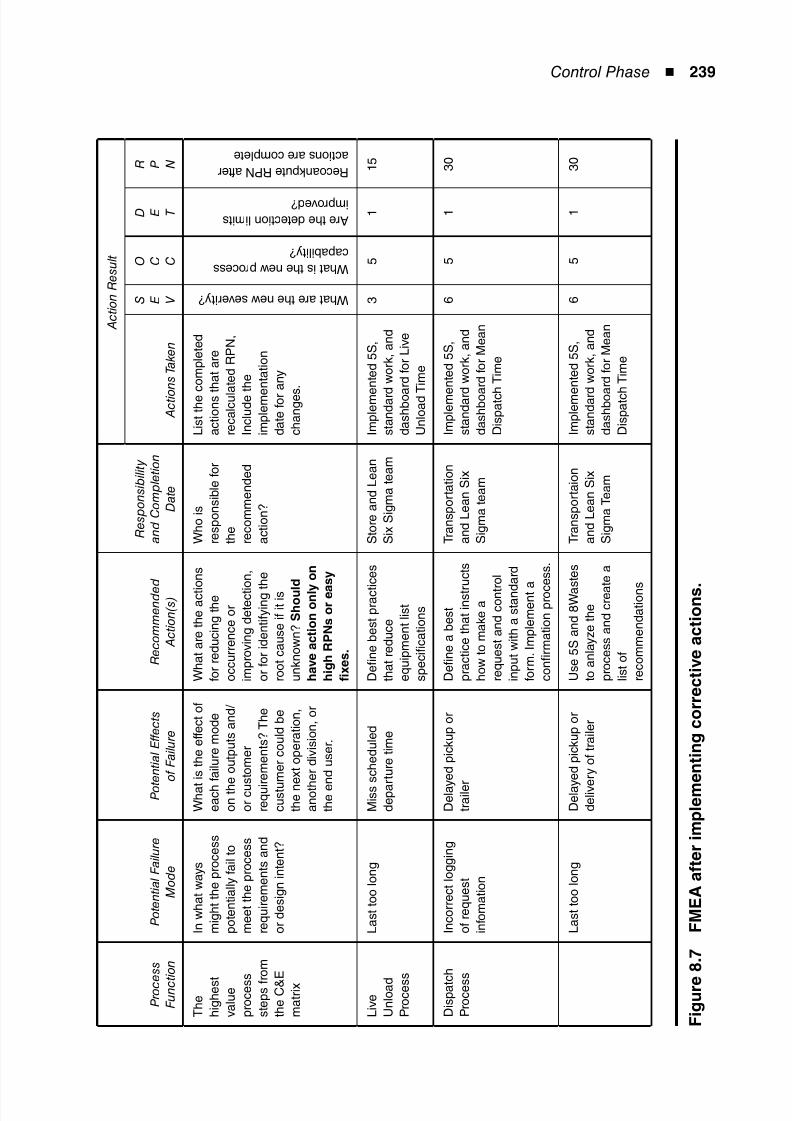
8/12/2019 Implementing Lean Six Sigma Throughout the Supply Chain
http://slidepdf.com/reader/full/implementing-lean-six-sigma-throughout-the-supply-chain 256/278
Control Phase ◾ 239
P r o c e
s s
F u n c t i o n
P o t e n t i a l F a i l u r e
M o d e
P o t e n t i a l E f f e c t s
o f F a i l u r e
R e c o m m e n d e d
A c t i o n ( s )
R e s p o n s i b i l i t y
a n d C o m p l e t i o n
D a t e
A c t i o n R e s u l t
A c t i o n s T a k e n
S E V
O C C
D E T
R P N
T h e h i g h e s t
v a l u e
p r o c e s s
s t e p s f r o m
t h e C & E
m a t r i x
I n w h a t w a y s
m i g h t t h e p r o c e s s
p o t e n t i a l l y f a i l t o
m e e t t h e p r o c e s s
r e q u i r e m e n t s a n d
o r d e s i g n i n t e n t ?
W h a t
i s t h e e f f e c t o f
e a c h
f a i l u r e m o d e
o n t h e o u t p u t s a n d /
o r c u s t o m e r
r e q u i r e m e n t s ? T h e
c u s t u
m e r c o u l d b e
t h e n e x t o p e r a t i o n ,
a n o t h
e r d i v i s i o n , o r
t h e e n d u s e r .
W h a t a r e t h e a c t i o n s
f o r r e d u c i n g t h e
o c c u r r e n c e o r
i m p r o v i n g d e t e c t i o n ,
o r f o r i d e n t i f y i n g t h e
r o o t c a u s e i f i t i s
u n k n o w n ? S h o u l d
h a v e a c t i o n o n l y
o n
h i g h R P N s o r e a
s y
fi x e s .
W h o i s
r e s p o n s i b l e f o r
t h e
r e c o m m e n d e d
a c t i o n ?
L i s t t h e c o m p l e t e d
a c t i o n s t h a t a r e
r e c a l c u l a t e d R P N ,
I n c l u d e t h e
i m p l e m e
n t a t i o n
d a t e f o r a n y
c h a n g e s
.
W h a t a r e t h e n e w s e v e r i t y ?
W h a t i s t h e n e w p r o c e s s
c a p a b i l i t y ?
A r e t h e d e t e c t i o n l i m i t s
i m p r o v e d ?
R e c o a n k p u t e R P N a f t e r
a c t i o n s a r e c o m p l e t e
L i v e U n l o a d
P r o c e s s
L a s t t o o l o n g
M i s s s c h e d u l e d
d e p a r t u r e t i m e
D e fi n e b e s t p r a c t i c e s
t h a t r e d u c e
e q u i p m e n t l i s t
s p e c i fi c a t i o n s
S t o r e a n d L e a n
S i x S i g m a t e a m
I m p l e m e
n t e d 5 S ,
s t a n d a r d
w o r k , a n d
d a s h b o a
r d f o r L i v e
U n l o a d T
i m e
3
5
1
1 5
D i s p a t c h
P r o c e s s
I n c o r r e c t l o g g i n g
o f r e q u e s t
i n f o m a t i o n
D e l a y
e d p i c k u p o r
t r a i l e r
D e fi n e a b e s t
p r a c t i c e t h a t i n s t r u c t s
h o w t o m a k e a
r e q u e s t a n d c o n t r o l
i n p u t w i t h a s t a n d
a r d
f o r m . I m p l e m e n t a
c o n fi r m a t i o n p r o c
e s s .
T r a n s p o r t a t i o n
a n d L e a n S i x
S i g m a t e a m
I m p l e m e
n t e d 5 S ,
s t a n d a r d
w o r k , a n d
d a s h b o a
r d f o r M e a n
D i s p a t c h
T i m e
6
5
1
3 0
L a s t t o o l o n g
D e l a y
e d p i c k u p o r
d e l i v e
r y o f t r a i l e r
U s e 5 S a n d 8 W a s t e s
t o a n l a y z e t h e
p r o c e s s a n d c r e a
t e a
l i s t o f
r e c o m m e n d a t i o n s
T r a n s p o r t a i o n
a n d L e a n S i x
S i g m a T e a m
I m p l e m e
n t e d 5 S ,
s t a n d a r d
w o r k , a n d
d a s h b o a
r d f o r M e a n
D i s p a t c h
T i m e
6
5
1
3 0
F i g u r e
8 . 7
F M E A a f t e r i m p l e m e n t i n g c o r r e c t i v e a c t i o n s .
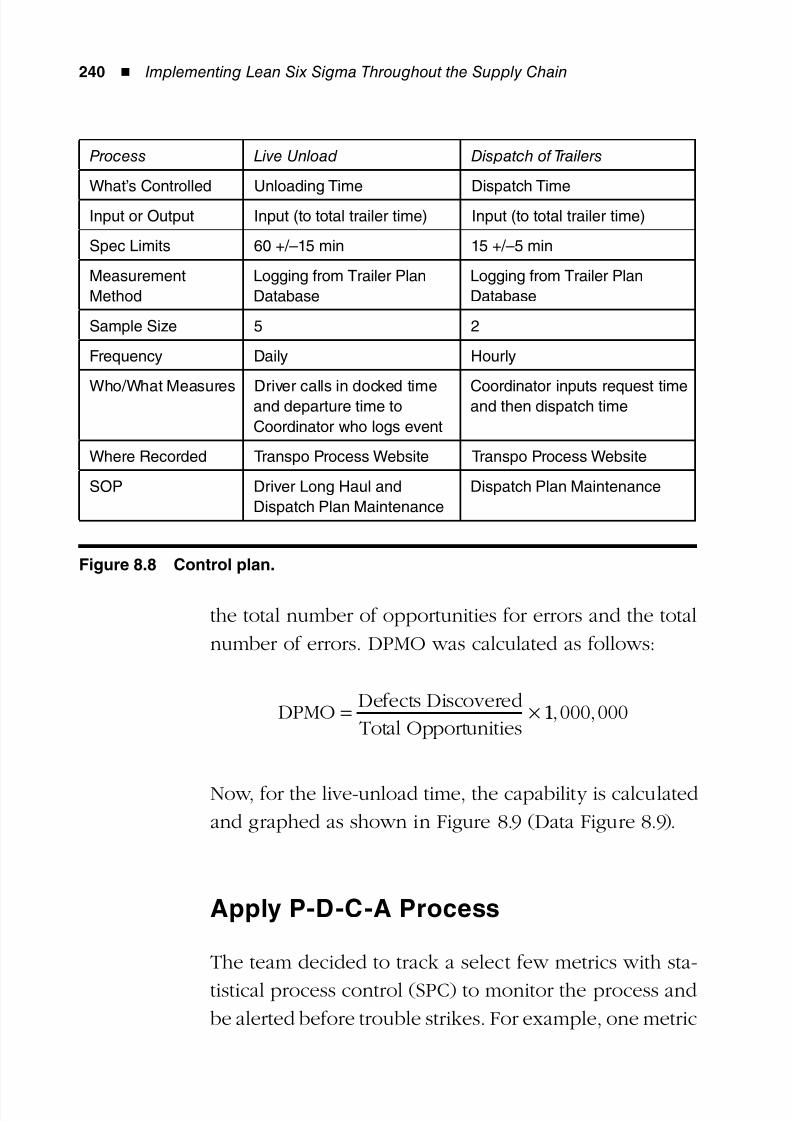
8/12/2019 Implementing Lean Six Sigma Throughout the Supply Chain
http://slidepdf.com/reader/full/implementing-lean-six-sigma-throughout-the-supply-chain 257/278
240 ◾ Implementing Lean Six Sigma Throughout the Supply Chain
the total number of opportunities for errors and the total
number of errors. DPMO was calculated as follows:
DPMODefects Discovered
Total Opportunities= × 11 000 000, ,
Now, for the live-unload time, the capability is calculated
and graphed as shown in Figure 8.9 (Data Figure 8.9).
Apply P-D-C-A Process
The team decided to track a select few metrics with sta-
tistical process control (SPC) to monitor the process and
be alerted before trouble strikes. For example, one metric
Process Live Unload Dispatch of Trailers
What’s Controlled Unloading Time Dispatch Time
Input or Output Input (to total trailer time) Input (to total trailer time)
Spec Limits 60 +/–15 min 15 +/–5 min
Measurement
Method
Logging from Trailer Plan
Database
Logging from Trailer Plan
Database
Sample Size 5 2
Frequency Daily Hourly
Who/What Measures Driver calls in docked timeand departure time to
Coordinator who logs event
Coordinator inputs request timeand then dispatch time
Where Recorded Transpo Process Website Transpo Process Website
SOP Driver Long Haul and
Dispatch Plan Maintenance
Dispatch Plan Maintenance
Figure 8.8 Control plan.
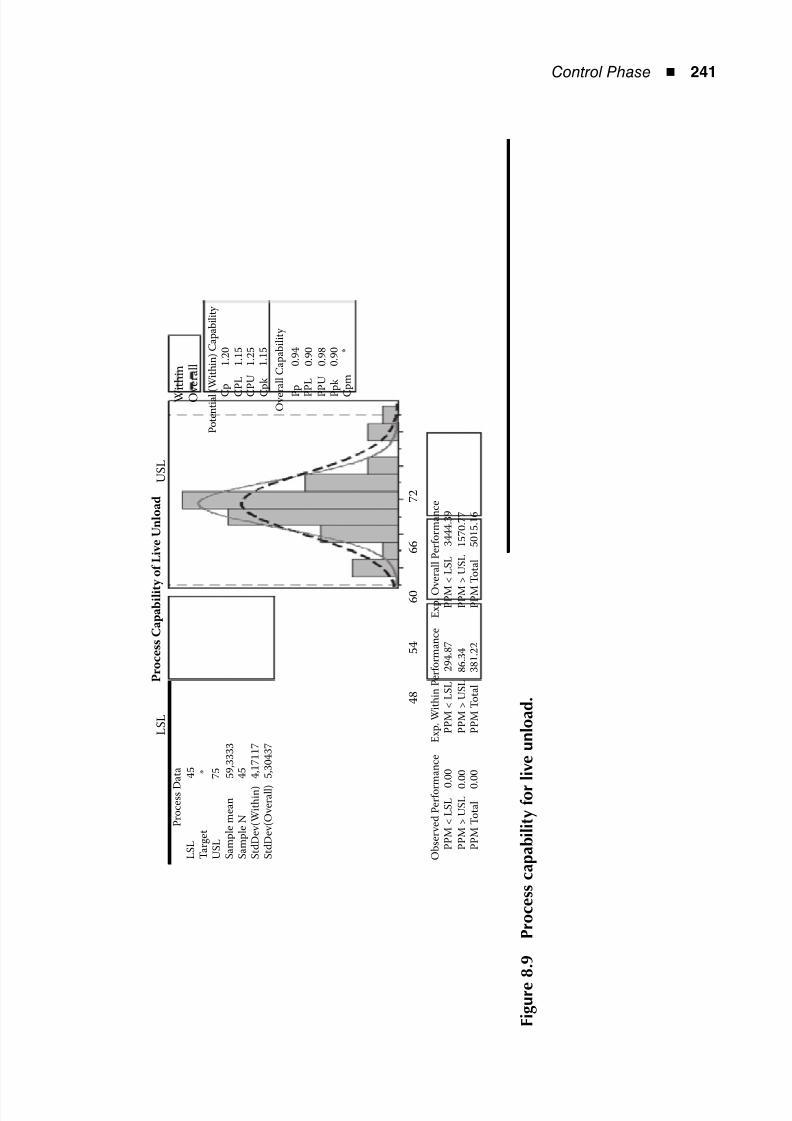
8/12/2019 Implementing Lean Six Sigma Throughout the Supply Chain
http://slidepdf.com/reader/full/implementing-lean-six-sigma-throughout-the-supply-chain 258/278
Control Phase ◾ 241
P r o c e s s D
a t a
L S L
4 5 7 5 5 9 , 3 3 3 3
4 5 4 , 1 7 1 1 7
5 , 3 0 4 3 7
*
T a r g e t
U S L
S a m p l e m e a n
S a m p l e N
S t d D e v ( W i t h i n )
S t d D e v ( O v e r a l l )
L S L
U S L
4 8
5 4
6 0
6 6
7 2
W i t h i n
O v e r a l l
P o t e n t i a l ( W i t h i n ) C a p a b i l i t y
O v e r a l l C a p a b i l i t y
E x p . O v e r a l l P e r f o r m a n c e
E x p . W i t h i n P e r f o r m a n c e
P P M
< L S L
3 4 4 4 . 3 9
P P M
> U S L 1 5 7 0 . 7 7
5 0 1 5 . 1 6
P P M
T o t a l
P P M < L S L
2 9 4 . 8 7
P P M > U S L 8 6 . 3 4
3 8 1 . 2 2
P P M T o t a l
O b s e r v e d P e r f o r m a n c e
P P M < L S L 0
. 0 0
P P M > U S L 0 . 0 0
0 . 0 0
P P M T o t a l
C
p
P p P P L
P P U
P p k
C
p m
C
P L
C
P U
C
p k
1 . 1 5
1 . 2 5
1 . 1 5
1 . 2 0
0 . 9 4
0 . 9 0
0 . 9 8
0 . 9 0 *
P r o c e s s C a p a b i l i t
y o f L i v e U n l o a d
F i g u r e
8 . 9
P r o c e s s c a p a b i l i t y f o r
l i v e u n l o a d .
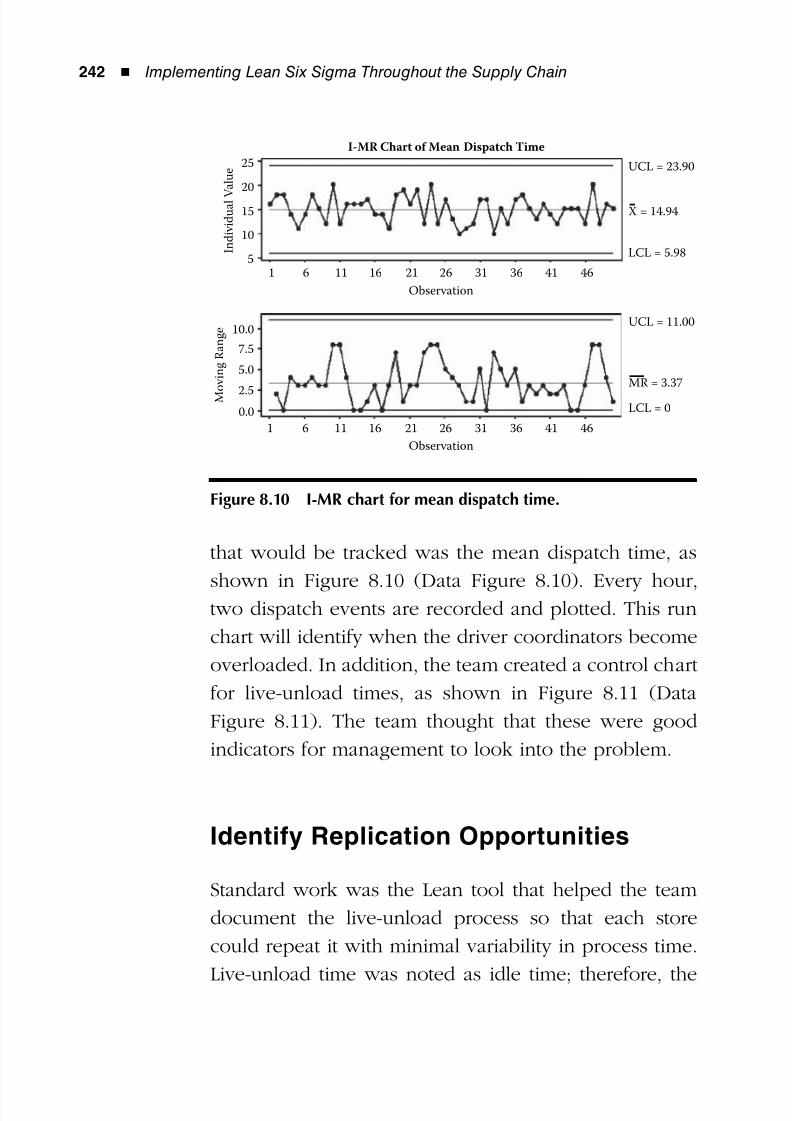
8/12/2019 Implementing Lean Six Sigma Throughout the Supply Chain
http://slidepdf.com/reader/full/implementing-lean-six-sigma-throughout-the-supply-chain 259/278
242 ◾ Implementing Lean Six Sigma Throughout the Supply Chain
that would be tracked was the mean dispatch time, as
shown in Figure 8.10 (Data Figure 8.10). Every hour,two dispatch events are recorded and plotted. This run
chart will identify when the driver coordinators become
overloaded. In addition, the team created a control chart
for live-unload times, as shown in Figure 8.11 (Data
Figure 8.11). The team thought that these were good
indicators for management to look into the problem.
Identify Replication Opportunities
Standard work was the Lean tool that helped the team
document the live-unload process so that each store
could repeat it with minimal variability in process time.
Live-unload time was noted as idle time; therefore, the
25
20
15
10
I n d i v i d u a l V
a l u e
5
1 6 11 16 21 26 31 36 41 46
Observation
UCL = 23.90
X = 14.94
LCL = 5.98
10.0
7.5
5.0
2.5 M o v i n g R a n g e
0.0
1 6 11 16 21 26 31 36 41 46
Observation
UCL = 11.00
MR = 3.37
LCL = 0
I-MR Chart of Mean Dispatch Time
Figure 8.10 I-MR chart for mean dispatch time.
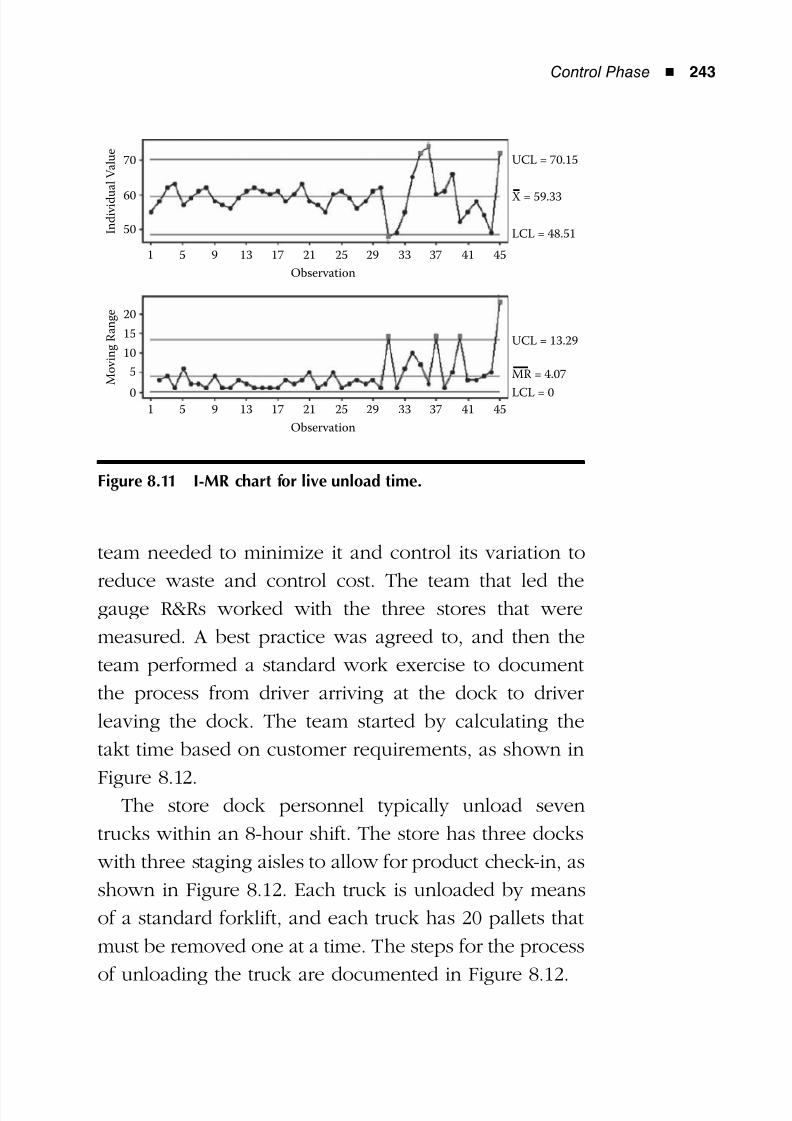
8/12/2019 Implementing Lean Six Sigma Throughout the Supply Chain
http://slidepdf.com/reader/full/implementing-lean-six-sigma-throughout-the-supply-chain 260/278
Control Phase ◾ 243
team needed to minimize it and control its variation to
reduce waste and control cost. The team that led thegauge R&Rs worked with the three stores that were
measured. A best practice was agreed to, and then the
team performed a standard work exercise to document
the process from driver arriving at the dock to driver
leaving the dock. The team started by calculating the
takt time based on customer requirements, as shown in
Figure 8.12.The store dock personnel typically unload seven
trucks within an 8-hour shift. The store has three docks
with three staging aisles to allow for product check-in, as
shown in Figure 8.12. Each truck is unloaded by means
of a standard forklift, and each truck has 20 pallets that
must be removed one at a time. The steps for the process
of unloading the truck are documented in Figure 8.12.
70
60
I n d i v i d u
a l V a l u e
50
UCL = 70.15
X = 59.33
LCL = 48.51
20
15
10
5 M o v i n g R a n g e
01 5 9 13 17 21 25 29 33 37 41 45
Observation
1 5 9 13 17 21 25 29 33 37 41 45
Observation
UCL = 13.29
MR = 4.07
LCL = 0
Figure 8.11 I-MR chart for live unload time.
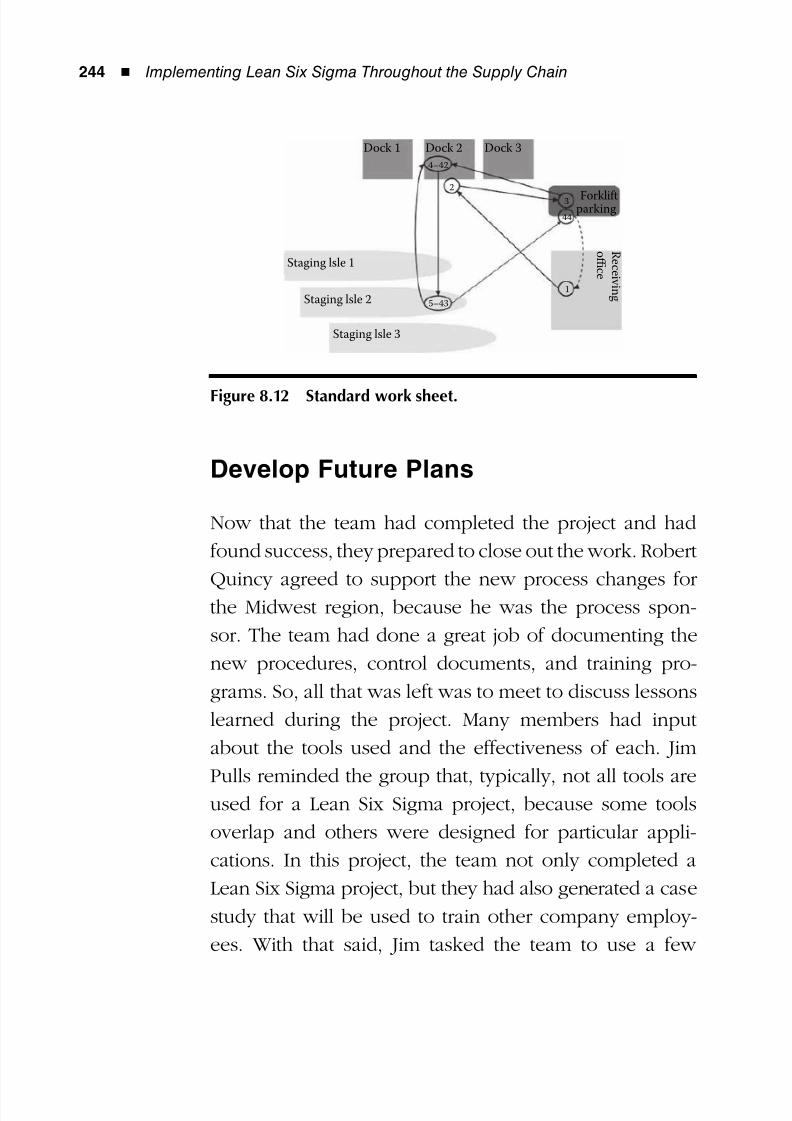
8/12/2019 Implementing Lean Six Sigma Throughout the Supply Chain
http://slidepdf.com/reader/full/implementing-lean-six-sigma-throughout-the-supply-chain 261/278
244 ◾ Implementing Lean Six Sigma Throughout the Supply Chain
Develop Future Plans
Now that the team had completed the project and had
found success, they prepared to close out the work. Robert
Quincy agreed to support the new process changes forthe Midwest region, because he was the process spon-
sor. The team had done a great job of documenting the
new procedures, control documents, and training pro-
grams. So, all that was left was to meet to discuss lessons
learned during the project. Many members had input
about the tools used and the effectiveness of each. Jim
Pulls reminded the group that, typically, not all tools areused for a Lean Six Sigma project, because some tools
overlap and others were designed for particular appli-
cations. In this project, the team not only completed a
Lean Six Sigma project, but they had also generated a case
study that will be used to train other company employ-
ees. With that said, Jim tasked the team to use a few
Staging lsle 1
Staging lsle 2
Staging lsle 3
5–43
2
3
44
1
4–42
Forkliftparking
R e c e i v i n g
o ffi c e
Dock 1 Dock 2 Dock 3
Figure 8.12 Standard work sheet.

8/12/2019 Implementing Lean Six Sigma Throughout the Supply Chain
http://slidepdf.com/reader/full/implementing-lean-six-sigma-throughout-the-supply-chain 262/278
Control Phase ◾ 245
extra tools with the idea that the results were to be used
for educational purposes. Jim Pulls congratulated the
team for completing two jobs at once! Then he stopped
and calmly asked Anita to continue with the lessons
learned.

8/12/2019 Implementing Lean Six Sigma Throughout the Supply Chain
http://slidepdf.com/reader/full/implementing-lean-six-sigma-throughout-the-supply-chain 263/278
8/12/2019 Implementing Lean Six Sigma Throughout the Supply Chain
http://slidepdf.com/reader/full/implementing-lean-six-sigma-throughout-the-supply-chain 264/278
247
9Chapter
Conclusions
Lean Six Sigma is a methodology whose use is growing
throughout all industries. Lean is a powerful methodol-
ogy utilized to reduce wastes in processes, thus reducing
lead time and costs. Six Sigma is a also a powerful meth-
odology strongly rooted in statistical techniques used to
reduce variation in processes. Organizations can reap
gains from each method. However, it is the integration of
the two methodologies as Lean Six Sigma that provides a
more dramatic impact to the organizational culture and
the bottom line.
When implementing Lean Six Sigma, significant train-
ing is needed to ensure that the team is fully knowl-
edgeable and has the necessary resources. However, due
to time restrictions and the need to manage Lean Six
Sigma projects, it is useful to develop fully supportive
case studies to facilitate the instruction. Case studies can
be used either throughout the training to further rein-
force concepts or as conceptual overviews. This book
provides a case study from start to finish to illustrate the
combined Lean Six Sigma methodology.

8/12/2019 Implementing Lean Six Sigma Throughout the Supply Chain
http://slidepdf.com/reader/full/implementing-lean-six-sigma-throughout-the-supply-chain 265/278
8/12/2019 Implementing Lean Six Sigma Throughout the Supply Chain
http://slidepdf.com/reader/full/implementing-lean-six-sigma-throughout-the-supply-chain 266/278
249
Lean Six Sigma Glossary
5S: A method of creating a self-sustaining culture that perpetuates an
organized, clean, and efficient work place. Also referred to as the
five pillars of the visual workplace.8 wastes: See waste .
affinity diagram: A tool to organize ideas and data which allows a
large number of ideas to be sorted into groups.
Analyze phase: Third step of the Six Sigma Define–Measure–Analyze–
Improve–Control phase. Data is analyzed in this step to verify
cause-and-effect relationships and determine the relationships.
appraisal cost: A cost of poor quality associated with, but not limitedto, test and inspection, supplier acceptance sampling, and audit-
ing processes.
attribute gauge R&R: Measurement systems analysis performed
on qualitative data in an effort to gauge repeatability and
reproducibility.
audit: A method of assessing the effectiveness of process improvement.
baseline: The starting point of a current process with respect to pro-cess metrics.
benchmarking: An activity to establish internal expectations for excel-
lence, based on direct comparison to “best.” In some cases, the
best is not a direct competitor in your industry.
Black Belt: A person trained to execute critical projects for break-
through improvements to enhance the bottom line.
8/12/2019 Implementing Lean Six Sigma Throughout the Supply Chain
http://slidepdf.com/reader/full/implementing-lean-six-sigma-throughout-the-supply-chain 267/278
250 ◾ Lean Six Sigma Glossary
boundary: The starting and stopping point of a process under consid-
eration for process improvements.
box plot: A method of graphically depicting groups of numerical data
through five-number summaries.
brainstorming: A technique to generate a large number of ideas in a
short period of time.
breakthrough thinking: A method of brainstorming for creative
problem solving that promotes unique, out-of-the-box thinking.
business case: A written document that provides the reasoning for
initiating a project or task.
capability: The ability of a process to meet customer specifications.
capacity: The ability to meet production requirements.
cause-and-effect diagram: A diagram that shows the causes of a spe-
cific event. The purpose is to identify potential factors that cause
an overall effect. Also known as the Ishikawa diagram or fish-
bone diagram.check sheets: A document used for collecting data in real time. This
document should be designed for efficient recording of data.
communication/influence strategy: A matrix developed based on
the customer/stakeholders matrix to ensure that the proper audi-
ence is provided the right information at the right time, as identi-
fied in the communications plan.
communications plan: A guide to communicating the right informa-tion at the right time to the right audience in an appropriate
format/medium.
control chart: A tool used to determine if a process is in a state of
statistical control. Also known as the Shewhart chart.
Control phase: Fifth step of the Six Sigma Define–Measure–Analyze–
Improve–Control phase. In this step, control mechanisms are
implemented and the process is monitored.
8/12/2019 Implementing Lean Six Sigma Throughout the Supply Chain
http://slidepdf.com/reader/full/implementing-lean-six-sigma-throughout-the-supply-chain 268/278
Lean Six Sigma Glossary ◾ 251
control plan: A method of controlling product characteristics and their
associated process variables to ensure capability of the process/
product over time.
core team: Typically a cross-functional team responsible for complet-
ing a project successfully.
correlation analysis: A statistical method that indicates the strength
and direction of a linear relationship between two random
variables.
cost/benefit analysis: A process to assess the business case for a
project. The total expected costs are weighted against the total
expected benefits to choose the most profitable option.
cost of poor quality (COPQ): Costs associated with not doing things
right the first time. Examples of COPQ include scrap, rework,
and waste.
critical to quality (CTQ): Key measurable product or service charac-
teristics defined by the customer.critical to satisfaction (CTS): Key measurable product or service
characteristics necessary to satisfy customer requirements. Often
referred to as critical to quality .
current state: The current steps, delays, and information flows neces-
sary to deliver a product or service.
customer: Anyone who uses or consumes a product or service. A cus-
tomer can be internal or external to the provider.customer-needs map (CNM): A matrix of customer needs that is
decomposed into more detailed and focused matrices to ensure
that all customer needs are adequately addressed.
customers/stakeholders matrix: A matrix that consists of different
stakeholders and their needs/requirements along one axis. Each
need/requirement is weighted according to relative importance
and then translated into technical requirements.
8/12/2019 Implementing Lean Six Sigma Throughout the Supply Chain
http://slidepdf.com/reader/full/implementing-lean-six-sigma-throughout-the-supply-chain 269/278
252 ◾ Lean Six Sigma Glossary
data collection plan: The process of preparing and collecting data
for process improvement.
defect: A nonconformance in a product or service.
defects per million opportunities (DPMO): A measure of process
performance in opportunities per million units.
Define phase: First step of the Six Sigma Define–Measure–Analyze–
Improve–Control phase. This step defines the high-level project
goals and the current process.
deliverable: A tangible or intangible object resulting from a project task.
deviation: The difference between an observed value and the mean
of all observed values.
DMAIC process: The Six Sigma Define–Measure–Analyze–Improve–
Control process.
failure cost: The cost of poor quality (COPQ) associated with inter-
nal and external failures. Internal failure costs are incurred from
rework and scrap. External failure costs are those costs related todefective parts that are shipped to the customer.
failure mode and effects analysis (FMEA): A structured approach
to assess the magnitude of potential failures and identify the
sources of each potential failure. Corrective actions are then
identified and implemented to prevent failure occurrence.
flexibility: The ability to respond to changes in demand, customer
requirements, etc.future state: The ideal process steps and information flows for deliv-
ering a product or service.
gauge repeatability and reproducibility (gauge R&R): A method
of collecting data to assess the variation in the measurement sys-
tem and compare it to the total process variation.
Green Belt: An individual trained to assist a Black Belt. This indi-
vidual may also undertake projects of a lesser scope than Black
Belt projects.
8/12/2019 Implementing Lean Six Sigma Throughout the Supply Chain
http://slidepdf.com/reader/full/implementing-lean-six-sigma-throughout-the-supply-chain 270/278
Lean Six Sigma Glossary ◾ 253
ground rules: Procedures and limits agreed to by a team for conduct-
ing a meeting or handling a project.
histogram: A graphical tool that shows frequencies of data as bars.
hypothesis: A proposed explanation put forward usually to test using
the scientific method.
hypothesis test: A method to make statistical decisions using experi-
mental data.
Improve phase: Fourth step of the Six Sigma Define–Measure–Analyze–
Improve–Control phase. In this step, the process is optimized
based on the data analyses from the Analyze phase.
input: A resource that is consumed, utilized, or added during a process.
intangible cost: Costs that are difficult to measure because they are
not monetary.
items for resolution (ITR): A list of action items to complete a proj-
ect or phase of a project.
lead time: The total time required to deliver an order to the customer.
Lean: A process-management philosophy that focuses on the reduc-
tion of non-value-added activities or wastes.
Lean Six Sigma: An integrated methodology that combines Six Sigma
and Lean using the DMAIC (Define–Measure–Analyze–Improve–
Control) process.
Master Black Belt: A Six Sigma expert who is responsible for the
strategic implementation within an organization. This involves
the training and mentoring of Black Belts and Green Belts.
mean: The sum of all data points divided by the number of data points.
Often referred to as the average.
measurement system analysis: A mathematical method of calculat-
ing how much variation within a measurement process contrib-
utes to overall process variability.
Measure phase: Second step of the Six Sigma Define–Measure–
Analyze–Improve–Control phase. In this step, relevant data is
collected on the current process.
8/12/2019 Implementing Lean Six Sigma Throughout the Supply Chain
http://slidepdf.com/reader/full/implementing-lean-six-sigma-throughout-the-supply-chain 271/278
254 ◾ Lean Six Sigma Glossary
metric: A performance measure that is linked to the goals and objec-
tives of an organization.
milestone timeline: A graph or chart depicting the key steps or tasks
required in a project over time.
mistake proofing: A mechanism that helps avoid mistakes by pre-
venting or correcting errors as they occur.
operating costs: Recurring expenses related to business operations
or the operation of equipment or the facility.
operational definition: A description of a product or process charac-
teristic and how to collect and measure the characteristic.
opportunity cost: A cost of poor quality (COPQ) associated with a
loss in market share or to the competition due to lower prod-
uct quality.
organization chart: A diagram that shows the structure and relation-
ships within an organization.
output: A product or service delivered by a process.
Pareto diagram: A vertical bar graph for attribute or categorical
data that shows the bars in descending order of significance,
ordered from left to right. Helps to focus on the vital few prob-
lems rather than the trivial many. An extension of the Pareto
Principle suggests that the significant items in a given group nor-
mally constitute a relatively small portion of the items in the total
group. Conversely, a majority of the items will be relatively minor
in significance (i.e., the 80/20 rule).
Plan–Do–Check–Act (PDCA): PDCA is a repeatable four-phase
implementation strategy for process improvement. PDCA is an
important item for control in policy deployment. Sometimes
referred to as the Deming or PDCA cycle.
prevention cost: A cost of poor quality (COPQ) associated with stop-
ping defects from occurring before they can happen. This is
where money should be spent to reduce defects.
8/12/2019 Implementing Lean Six Sigma Throughout the Supply Chain
http://slidepdf.com/reader/full/implementing-lean-six-sigma-throughout-the-supply-chain 272/278
Lean Six Sigma Glossary ◾ 255
preventive maintenance (PM): The maintenance of equipment and
facilities using systematic inspection, detection, and correction to
reduce failures from occurring.
problem solving: A process of identifying a problem, using the scien-
tific method to determine root causes, and implementing correc-
tive actions to prevent the problem from recurring.
process: An activity that blends inputs to produce a product, provide
a service, or perform a task.
process capability: A measurement of the capability of a process to
meet customer specifications. Usually expressed as a process
capability index such as Cp or Cpk.
process flow diagram: A pictorial representation of a process that
illustrates the inputs, main steps, branches, and outcomes of a
process. A problem-solving tool that illustrates a process. It can
show the “as is” process or “should be” process for comparison
and should make waste evident.
process input variables: A process is a blending of various inputs
with a goal of achieving a specific output. Inputs to a process gen-
erally include material, people, equipment, methods/procedures,
and environment.
process map: A visual representation of the sequential flow of a pro-
cess. Used as a tool in problem solving, this technique makes
opportunities for improvement apparent.
process output variables: A desired output of a process as specified
by the customer. Outputs typically include a stated service, prod-
uct, or task per customer requirements.
process sponsor/owner: The individual responsible for the design
and performance of a specific process.
project champion: A business leader or senior manager who is
responsible for ensuring that resources are available for the suc-
cessful completion of a project.
8/12/2019 Implementing Lean Six Sigma Throughout the Supply Chain
http://slidepdf.com/reader/full/implementing-lean-six-sigma-throughout-the-supply-chain 273/278
256 ◾ Lean Six Sigma Glossary
project charter: A statement of the scope, objectives, and team mem-
bers for a project. It includes the problem statement, objectives,
and goals.
project goal: The desired achievement from a process improvement
project.
project plan: The actions and procedures required to achieve the
project goal(s).
project scope: The processes and work required to successfully com-
plete a project.
project timeline: The chronological sequence of events necessary for
completing a project.
quality characteristic: An aspect of a product or service that is vital
to its ability to perform its intended function.
Quality Function Deployment (QFD): A methodology to transform
the voice of the customer into product or service characteristics.
regression analysis: A tool for modeling and analyzing numerical
data using a dependent or response variable and one or more
independent or explanatory variables.
responsibilities matrix: A matrix that identifies each team member
and their respective responsibilities to ensure successful comple-
tion of the project or of specific project phases.
Responsible Accountable Support Informed Consulted (RASIC)
matrix: A matrix that describes the participation responsibility
of roles for completing tasks or deliverables for a project.
risk management: The identification, assessment, prioritization, and
control/minimization of project and process risks.
root cause: The ultimate reason for an event or condition.
service flowdown diagram: A graphical representation of a process
depicting the various levels of the entire process as a means of
identifying the key areas of service to the stakeholders.
sigma (σ): Standard deviation of a statistical population.
8/12/2019 Implementing Lean Six Sigma Throughout the Supply Chain
http://slidepdf.com/reader/full/implementing-lean-six-sigma-throughout-the-supply-chain 274/278
Lean Six Sigma Glossary ◾ 257
sigma capability: A measure of process capability that represents the
number of standard deviations between the center of a process
and the closest specification limit. See also sigma level .
sigma level: A measure of process capability that represents the num-
ber of standard deviations between the center of a process and
the closest specification limit. See also sigma capability .
SIPOC (Suppliers, Inputs, Process, Outputs, Customers): A meth-
odology to identify the suppliers, inputs, process, output, and
customers of a process. It is a graphical representation to help
identify all key stakeholders.
Six Sigma: A quality-improvement and business strategy that emphasizes
impacting the bottom line by reducing defects, reducing cycle time,
and reducing costs. Six Sigma began in the 1980s at Motorola.
spaghetti chart: A map that illustrates the path of a product as it trav-
els through the value stream.
stakeholder: An individual who is affected by or who can influence
a project or process.
stakeholder analysis matrix: A matrix used to identify stakeholders
and gain support for developing a project action plan.
standard deviation: A measure of variability in a data set. It is the
square root of the variance.
standardization: The system of documenting and updating proce-
dures to make sure everyone knows clearly and simply what
is expected of them. Essential for the application of the PDCA
(Plan–Do–Check–Act) cycle.
standard operating procedure (SOP): A prescribed documented
method or process that is sustainable, repeatable, and predictable.
standard work: A tool that defines the interaction of people and their
environment when processing a product or service. It details
the motion of the operator and the sequence of action. It pro-
vides a routine for consistency of an operation and a basis for
8/12/2019 Implementing Lean Six Sigma Throughout the Supply Chain
http://slidepdf.com/reader/full/implementing-lean-six-sigma-throughout-the-supply-chain 275/278
258 ◾ Lean Six Sigma Glossary
improvement. Standard work has three central elements: takt
time, standard work sequence, and standard work in process.
statistical process control (SPC): A method of process monitoring
using control charts.
strategic goals: The overall goal of an organization, typically in terms
of gaining market position long term.
strategy: A plan of action to achieve a specific goal.
system model map: A diagram representing the process and its
respective inputs and outputs. Also known as an input–process–
output (IPO) diagram.
takt time: The frequency with which the customer wants a product.
How frequently a sold unit must be produced. The number is
derived by dividing the available production time in a shift by the
customer demand for the product. Takt time is usually expressed
in seconds.
target: An objective or goal.
team member: A person linked to a team for a common goal and
purpose.
technical, political, or cultural (TPC) analysis: A methodology to
identify, label, and understand sources of resistance from techni-
cal, political, or cultural sources.
test for normality: A statistical process to determine if a sample or
group of data fits a standard normal distribution.
time series: A sequence of data points measured at time intervals.
total productive maintenance (TPM): Productive maintenance car-
ried out by all employees. It is based on the principle that equip-
ment improvement must involve everyone in the organization,
from line operators to top management.
utility: The amount of satisfaction obtained from the entire consump-
tion of a product.
validation: The confirmation that customer needs are met.
value: A capability provided to a customer for an appropriate price.
8/12/2019 Implementing Lean Six Sigma Throughout the Supply Chain
http://slidepdf.com/reader/full/implementing-lean-six-sigma-throughout-the-supply-chain 276/278
Lean Six Sigma Glossary ◾ 259
value added: Any process or operation that shapes or transforms
the product or service into a final form that the customer will
purchase.
value stream: All activities required to design and produce a product
from conception to launch, order to delivery, and raw materials
to the customer.
value stream mapping: A process for identifying all activities required
to produce a product or product family. This is usually repre-
sented pictorially in a value stream map.
variance: A measure of variability in a data set or population. Variance
is equal to the squared value of standard deviation.
variation: A process is said to exhibit variation or variability if there
are changes or differences in the process.
visual control: Visual regulation of operations, tool placement, etc.,
that provides a method for understanding a process at a glance.
visual management: Systems that enable anyone to immediately
assess the current status of an operation or given process at a
glance, regardless of their knowledge of the process.
voice of the customer (VOC): Desires and requirements of the cus-
tomer at all levels, translated into real terms for consideration in
the development of new products, services, and daily business
conduct.
voice of the process (VOP): This is what the process is capable of
achieving. It is typically depicted by plotting data using a control
chart to determine if the process is under control and how much
variation exists.
waste: Also known as muda. Any process or operation that adds cost
or time and does not add value. Eight types of waste have been
identified:
1. Waste from overproduction
2. Waste from waiting or idle time
3. Waste from unnecessary transportation
8/12/2019 Implementing Lean Six Sigma Throughout the Supply Chain
http://slidepdf.com/reader/full/implementing-lean-six-sigma-throughout-the-supply-chain 277/278
260 ◾ Lean Six Sigma Glossary
4. Waste from inefficient processes
5. Waste from unnecessary stock on hand
6. Waste of motion and efforts
7. Waste from producing defective goods
8. Waste from unused creativity
why–why exercise: A simple problem-solving method of analyzing a
problem or issue by asking “Why” five times. The root cause should
become evident by continuing to ask why a situation exists.
8/12/2019 Implementing Lean Six Sigma Throughout the Supply Chain
http://slidepdf.com/reader/full/implementing-lean-six-sigma-throughout-the-supply-chain 278/278