Embed Size (px)
Citation preview
IMPLEMENTING A LANGUAGE MODELINGFRAMEWORK FOR INFORMATION RETRIEVAL
A DISSERTATIONSUBMITTED TO THE DEPARTMENT OF
COMPUTER SCIENCEAND THE COMMITTEE ON GRADUATE STUDIES OF
THE INDIAN STATISTICAL INSTITUTEIN PARTIAL FULFILLMENT OF THE REQUIREMENTS
FOR THE DEGREE OFMASTER OF TECHNOLOGY, COMPUTER SCIENCE
Debasis Ganguly
July 2008

c© Copyright by Debasis Ganguly 2008All Rights Reserved
ii

I certify that I have read this dissertation and that in my opinion it is fully adequate,in scope and in quality, as a dissertation for the degree of Master of Technology in Computer Science.
Mandar Mitra(Supervisor)
I certify that I have read this dissertation and that in my opinion it is fully adequate,in scope and in quality, as a dissertation for the degree of Master of Technology in Computer Science.
(External Examiner)
iii
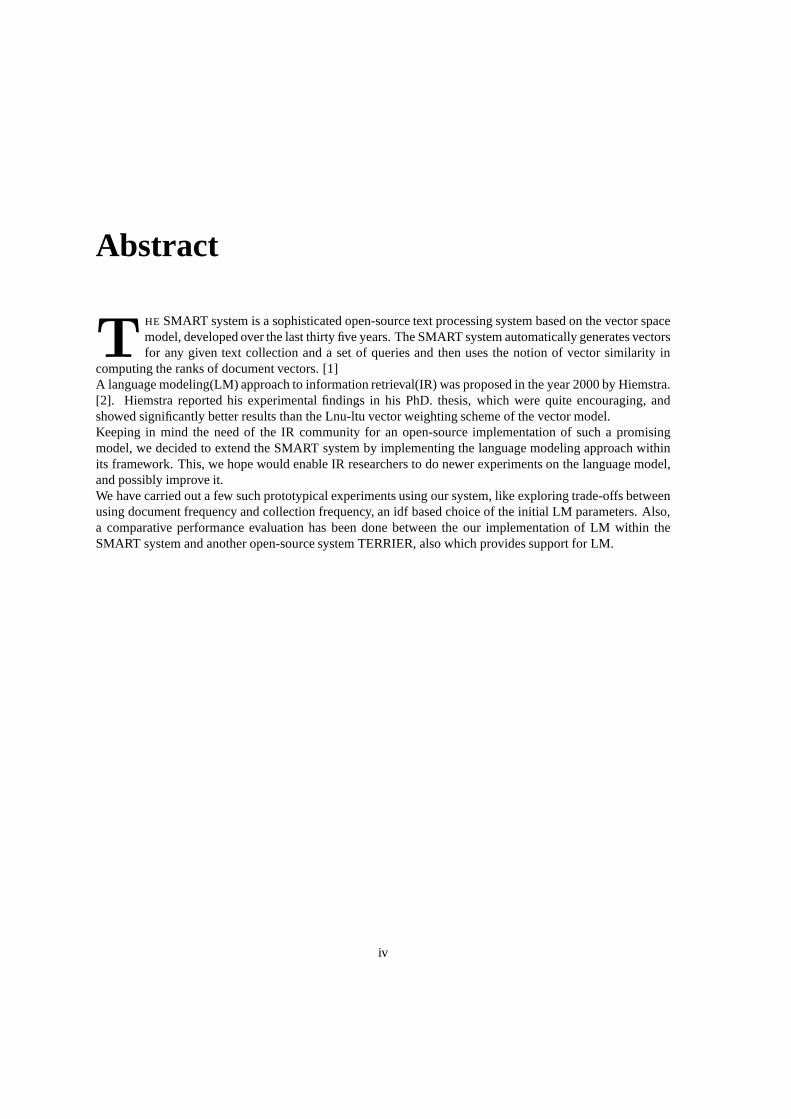
Abstract
THE SMART system is a sophisticated open-source text processing system based on the vector spacemodel, developed over the last thirty five years. The SMART system automatically generates vectorsfor any given text collection and a set of queries and then uses the notion of vector similarity in
computing the ranks of document vectors. [1]A language modeling(LM) approach to information retrieval(IR) was proposed in the year 2000 by Hiemstra.[2]. Hiemstra reported his experimental findings in his PhD.thesis, which were quite encouraging, andshowed significantly better results than the Lnu-ltu vectorweighting scheme of the vector model.Keeping in mind the need of the IR community for an open-source implementation of such a promisingmodel, we decided to extend the SMART system by implementingthe language modeling approach withinits framework. This, we hope would enable IR researchers to do newer experiments on the language model,and possibly improve it.We have carried out a few such prototypical experiments using our system, like exploring trade-offs betweenusing document frequency and collection frequency, an idf based choice of the initial LM parameters. Also,a comparative performance evaluation has been done betweenthe our implementation of LM within theSMART system and another open-source system TERRIER, also which provides support for LM.
iv
Acknowledgments
Words are not enough to express my gratitude to my supervisor Dr. Mandar Mitra. He has trulybeen an inspiration to me. My motivation to work under him canbe traced back a year, when Iused to remain spellbound during his lecture sessions on ‘Operating Systems’ and ‘Compilers’wondering how he was able to illustrate quite involved areasof computer science in apparently
simple terms. His enthusiasm and passion about ’Information Retrieval’ spurred me to do research in thisfield of study. Without his help in particular, it woudn’t have been possible to come to terms with the hugecodebase of the SMART IR engine, let aside extending it.I would also take the opportunity to thank Dr. Prasenjit Majumder for answering a lot of my amateurishquestions on IR and research fellow Sukomal Pal for helping me out with books, tutorials and researchpapers in my initial days of visits to the IR lab. It would be noless than a sin, of not thanking the projectlinked personnels Dipasree Pal, Ayan Bandopadhyay, Samaresh Maiti, Sukanya Mitra and Aparajita Sen forproviding such a nice and friendly atmosphere in the lab and lending their helping hands whenever needed.
v

Contents
Abstract . . . . . . . . . . . . . . . . . . . . . . . . . . . . . . . . . . . . . . . . . . .. . . . . . . ivAcknowledgments . . . . . . . . . . . . . . . . . . . . . . . . . . . . . . . . . . . .. . . . . . . . . vList of Tables . . . . . . . . . . . . . . . . . . . . . . . . . . . . . . . . . . . . . . .. . . . . . . . viiiList of Figures . . . . . . . . . . . . . . . . . . . . . . . . . . . . . . . . . . . . . .. . . . . . . . . ix
1 Introduction to IR 11.1 A Definition . . . . . . . . . . . . . . . . . . . . . . . . . . . . . . . . . . . . . .. . . . . 11.2 Basic processes of Information Retrieval . . . . . . . . . . . .. . . . . . . . . . . . . . . . 11.3 Overview of this thesis . . . . . . . . . . . . . . . . . . . . . . . . . . . .. . . . . . . . . 21.4 How an IR system works . . . . . . . . . . . . . . . . . . . . . . . . . . . . . .. . . . . . 3
1.4.1 Tokenization . . . . . . . . . . . . . . . . . . . . . . . . . . . . . . . . . .. . . . 31.4.2 Stop word removal . . . . . . . . . . . . . . . . . . . . . . . . . . . . . . .. . . . 31.4.3 Stemming . . . . . . . . . . . . . . . . . . . . . . . . . . . . . . . . . . . . . .. . 41.4.4 Phrase extraction . . . . . . . . . . . . . . . . . . . . . . . . . . . . . .. . . . . . 41.4.5 Index file structure . . . . . . . . . . . . . . . . . . . . . . . . . . . . .. . . . . . 5
1.5 Evaluation of IR systems . . . . . . . . . . . . . . . . . . . . . . . . . . .. . . . . . . . . 51.5.1 Evaluation of unranked retrieval sets . . . . . . . . . . . . .. . . . . . . . . . . . . 61.5.2 Evaluation of ranked retrieval sets . . . . . . . . . . . . . . .. . . . . . . . . . . . 6
1.6 Contributions of this thesis . . . . . . . . . . . . . . . . . . . . . . .. . . . . . . . . . . . 6
2 Vector Space Model 82.1 The model . . . . . . . . . . . . . . . . . . . . . . . . . . . . . . . . . . . . . . . .. . . . 8
2.1.1 Term weights . . . . . . . . . . . . . . . . . . . . . . . . . . . . . . . . . . .. . . 92.1.2 Inverse Document Frequency . . . . . . . . . . . . . . . . . . . . . .. . . . . . . 102.1.3 Document length normalization . . . . . . . . . . . . . . . . . . .. . . . . . . . . 10
2.2 The SMART system . . . . . . . . . . . . . . . . . . . . . . . . . . . . . . . . . .. . . . 112.2.1 Term weighting . . . . . . . . . . . . . . . . . . . . . . . . . . . . . . . . .. . . . 112.2.2 Code overview . . . . . . . . . . . . . . . . . . . . . . . . . . . . . . . . . .. . . 11
3 Language Model 133.1 Language Model - An information theoretic viewpoint . . .. . . . . . . . . . . . . . . . . 13
3.1.1 Important and unimportant terms . . . . . . . . . . . . . . . . . .. . . . . . . . . . 143.1.2 Ideal user . . . . . . . . . . . . . . . . . . . . . . . . . . . . . . . . . . . . .. . . 14
3.2 Formalization of the model . . . . . . . . . . . . . . . . . . . . . . . . .. . . . . . . . . . 143.2.1 Defining the probability space . . . . . . . . . . . . . . . . . . . .. . . . . . . . . 143.2.2 Conditional independence assumptions . . . . . . . . . . . .. . . . . . . . . . . . 153.2.3 Estimating the probabilities . . . . . . . . . . . . . . . . . . . .. . . . . . . . . . 153.2.4 Alternative definitions . . . . . . . . . . . . . . . . . . . . . . . . .. . . . . . . . 153.2.5 Simplified notations . . . . . . . . . . . . . . . . . . . . . . . . . . . .. . . . . . 16
vi
3.2.6 Unknown parameters . . . . . . . . . . . . . . . . . . . . . . . . . . . . .. . . . . 163.3 From language model to vector space model . . . . . . . . . . . . .. . . . . . . . . . . . . 17
4 Experimental results 194.1 Test collections . . . . . . . . . . . . . . . . . . . . . . . . . . . . . . . . .. . . . . . . . 19
4.1.1 Cranfield collection . . . . . . . . . . . . . . . . . . . . . . . . . . . .. . . . . . . 194.1.2 TREC 8 collection . . . . . . . . . . . . . . . . . . . . . . . . . . . . . . .. . . . 19
4.2 Results on Cranfield collection . . . . . . . . . . . . . . . . . . . . .. . . . . . . . . . . . 214.3 Results on TREC-8 test collection . . . . . . . . . . . . . . . . . . .. . . . . . . . . . . . 21
4.3.1 Comparative evaluation with TERRIER . . . . . . . . . . . . . .. . . . . . . . . . 224.4 Scope of future experiments . . . . . . . . . . . . . . . . . . . . . . . .. . . . . . . . . . 23
4.4.1 Feedback . . . . . . . . . . . . . . . . . . . . . . . . . . . . . . . . . . . . . .. . 244.4.2 Choice of initial parameters . . . . . . . . . . . . . . . . . . . . .. . . . . . . . . 25
5 Conclusions 26
Bibliography 27
vii
List of Tables
2.1 Term weights in the SMART . . . . . . . . . . . . . . . . . . . . . . . . . . .. . . . . . . 114.1 Document collection statistics for the adhoc task of TREC-8 . . . . . . . . . . . . . . . . . 204.2 Results of our LM implementation on Cranfield collection. . . . . . . . . . . . . . . . . . 224.3 Comaparative runs of LM(λ = 0.15) and VSM(Lnu.ltu) on TREC-8 collection . . . . . . . 244.4 Trying out differentλs on TREC-8 collection . . . . . . . . . . . . . . . . . . . . . . . . . 244.5 Comparative evaluation of SMART with TERRIER . . . . . . . . .. . . . . . . . . . . . . 24
viii
List of Figures
1.1 Information retrieval process . . . . . . . . . . . . . . . . . . . . .. . . . . . . . . . . . . 21.2 An example text - the opening lines of Agenda 21 . . . . . . . . .. . . . . . . . . . . . . . 31.3 The Agenda 21 text after tokenization . . . . . . . . . . . . . . . .. . . . . . . . . . . . . 41.4 The Agenda 21 text after stop word removal by Smart list . .. . . . . . . . . . . . . . . . . 41.5 The Agenda 21 text after stemming by Porter’s stemmer . . .. . . . . . . . . . . . . . . . 51.6 Merging two postings list . . . . . . . . . . . . . . . . . . . . . . . . . .. . . . . . . . . . 51.7 A recall-precision graph . . . . . . . . . . . . . . . . . . . . . . . . . .. . . . . . . . . . 72.1 A three dimensional vector space . . . . . . . . . . . . . . . . . . . .. . . . . . . . . . . . 93.1 Information theoretic viewpoint of language model . . . .. . . . . . . . . . . . . . . . . . 144.1 A document extract from the Financial Times . . . . . . . . . . .. . . . . . . . . . . . . . 204.2 A sample TREC-8 topic . . . . . . . . . . . . . . . . . . . . . . . . . . . . . .. . . . . . . 214.3 Average precision vs.λ values on Cranfield . . . . . . . . . . . . . . . . . . . . . . . . . . 234.4 Recall vs. MAP values on TREC-8 . . . . . . . . . . . . . . . . . . . . . .. . . . . . . . . 23
ix

x
Chapter 1
Introduction to IR
DOES Information Retrieval need an introduction today ? Surveysshow that about 85% of the usersof the internet use popular interactive search engines to formulate queries, retrieve references ofdocuments, inspect the documents (typically the top rankedones) and possibly reformulate the
queries, for buying goods, choosing vacations, finding research papers and for so many other reasons. Agood indication of the impact of search engines and information retrieval technology on ordinary people’slives can be found in common language. If a technology is important enough, many people will adopt thetechnical vocabulary and new words eventually end up in official dictionaries. Infact people often say ‘Googleout the information’ indicating the impact of Google on people’s life.Many modern information retrieval systems, like internet search engines, are specifically designed for userswho are not familiar with the collection, the representation of the documents, and the use of Boolean oper-ators. The main requirements for these systems are the following. Firstly, users should be able to enter anynatural language word(s), phrase(s) or sentence(s) to the system, without the need to enter operators. Thisusually implies a full text information retrieval system, which is a system that potentially indexes every wordin a document automatically. Secondly, the system should rank the retrieved documents by their estimateddegree or probability of usefulness for the user. Thirdly, though maybe not as important as the first two, thesystem should support the automatic reformulation of the search statement from user feedback.
1.1 A Definition
The discipline of information retrieval is almost as old as the computer itself. An old, if not the eldest,definition of information retrieval is the following by Mooers(1950)[3](from Savino and Sebastiani, 1998[4]).
Information retrieval is the name of the process or method whereby a prospective user of infor-mation is able to convert his need for information into an actual list of citations to documentsin storage containing information useful to him.
In modern day terminology, an information retrieval systemis a software program that stores and managesinformation contained in documents. The system assists users in finding the information they need.
1.2 Basic processes of Information Retrieval
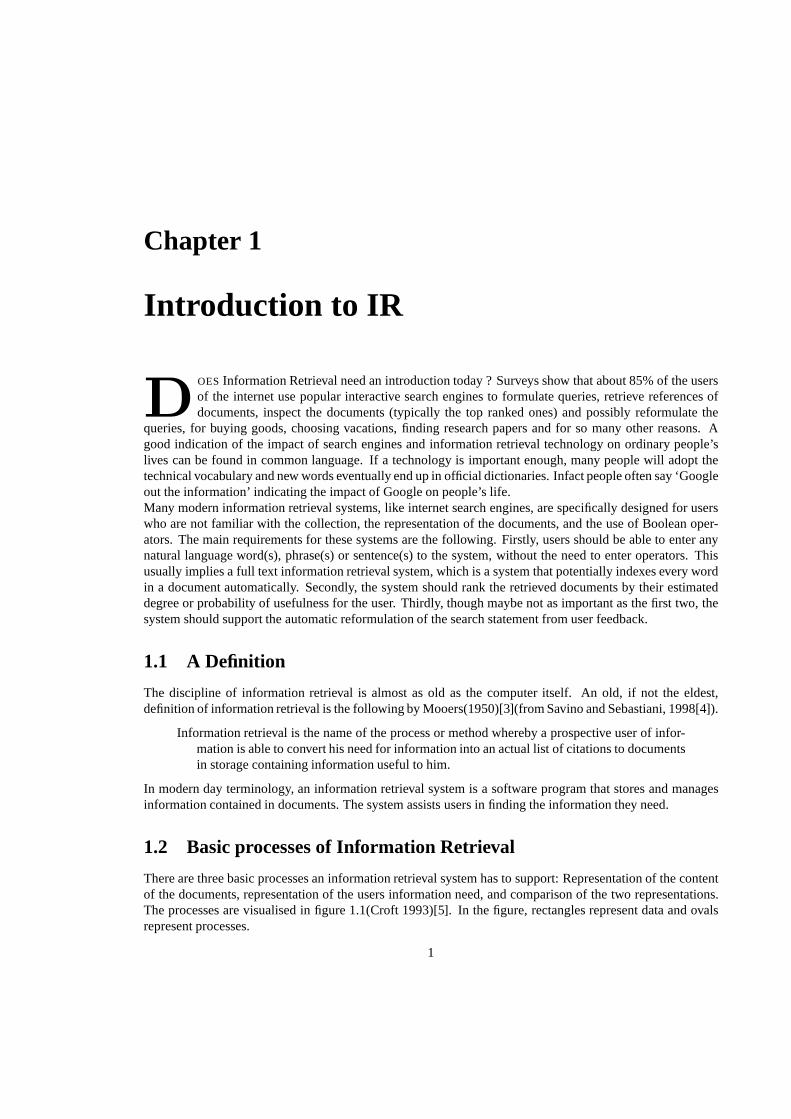
There are three basic processes an information retrieval system has to support: Representation of the contentof the documents, representation of the users information need, and comparison of the two representations.The processes are visualised in figure 1.1(Croft 1993)[5]. In the figure, rectangles represent data and ovalsrepresent processes.
1
2 Chapter 1 : Introduction to IR
Figure 1.1: Information retrieval process
Representing the documents is usually called the indexing process. The process takes place off-line, that is,the end user of the information retrieval system is not directly involved. The indexing process results in aformal representation of the document.The indexing process may include the actual storage of the documentin the system, but often documents are only stored partly, for instance only title and abstract, plus informationabout the actual location of the document.The process of representing the information need is often referred to as the query formulation process. Theresulting formal representation is the query. In a broad sense, query formulation might denote the completeinteractive dialogue between system and user, leading not only to a suitable query but possibly also to a betterunderstanding by the user of his information need. The retrieved set of documents can be further improved bya process known as relevance feedback, which iteratively tunes the parameters of the system, with referenceto a set of documents, being judged as relevant by the user. The aim of relevance feedback is to fetch moredocuments which are relevant to a particular query, within the retrieved set.
1.3 Overview of this thesis
In the section to follow, we speak briefly about the tasks as performed by a standard IR engine followedby a section on evaluation methodologies and standard metrics for IR evaluation. These sections are veryintroductory and a reader aware of the IR terminologies can skip these sections and move onto chapter 2 (ordirectly to chapter 3 if he is aware of the vector space model). We conclude this chapter with a section onwhat we feel are the contributions of this thesis in the IR discipline. The rest of the thesis is organized asfollows:
1.4 : How an IR system works 3
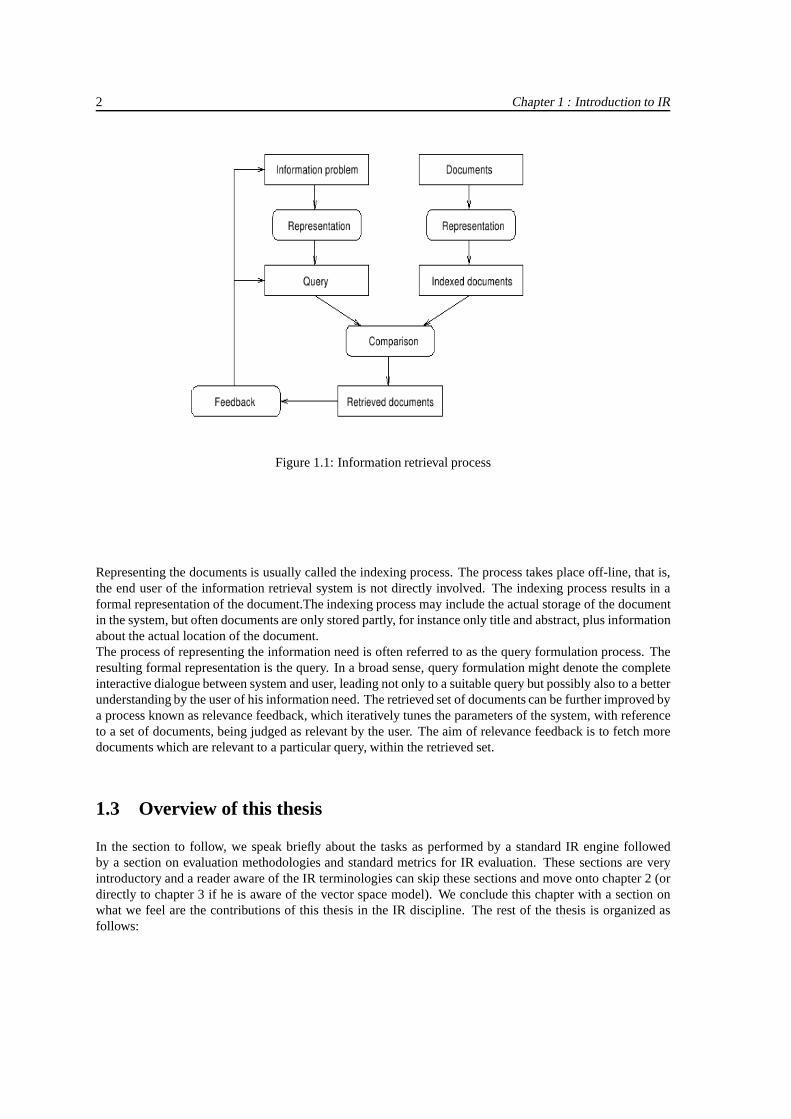
Figure 1.2: An example text - the opening lines of Agenda 21
Chapter 2 introduces the Vector Space Model (VSM)1 of IR, the underlying model used in the SMART[6]. Wealso give a brief description of the SMART system. In chapter3 we introduce the language model (LM)2 ofIR with a mathematical description of the theory underneaththis model and then follow it up with a discussionon how relevance feedback may be incorporated within this model by using the EM algorithm. Chapter 4reports the performance of our implementation of the LM approach through experimental results followedby a suggestion on future experiments. Chapter 5 closes thisthesis by summarizing our contributions andoutlining future experiments with extended SMART.
1.4 How an IR system works3 A typical approach to indexing and query formulation selects the query terms as follows. First a tokenisationprocess takes place, then stop words are removed, and finallythe remaining words are stemmed. Additionally,natural language processing modules might provide the identification of phrases or splitting of compounds.Figure 1.2 shows an example text that will be used to illustrate the typical approach to query term selection.
1.4.1 Tokenization
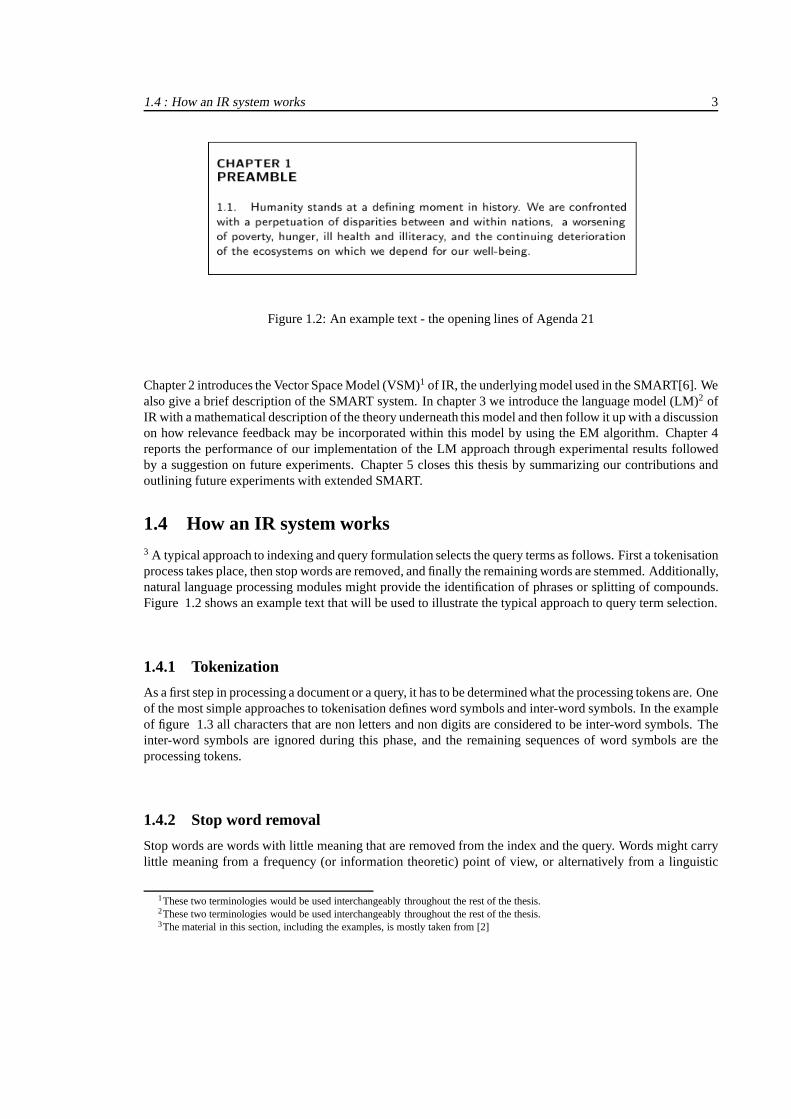
As a first step in processing a document or a query, it has to be determined what the processing tokens are. Oneof the most simple approaches to tokenisation defines word symbols and inter-word symbols. In the exampleof figure 1.3 all characters that are non letters and non digits are considered to be inter-word symbols. Theinter-word symbols are ignored during this phase, and the remaining sequences of word symbols are theprocessing tokens.
1.4.2 Stop word removal
Stop words are words with little meaning that are removed from the index and the query. Words might carrylittle meaning from a frequency (or information theoretic)point of view, or alternatively from a linguistic
1These two terminologies would be used interchangeably throughout the rest of the thesis.2These two terminologies would be used interchangeably throughout the rest of the thesis.3The material in this section, including the examples, is mostly taken from [2]
4 Chapter 1 : Introduction to IR
Figure 1.3: The Agenda 21 text after tokenization
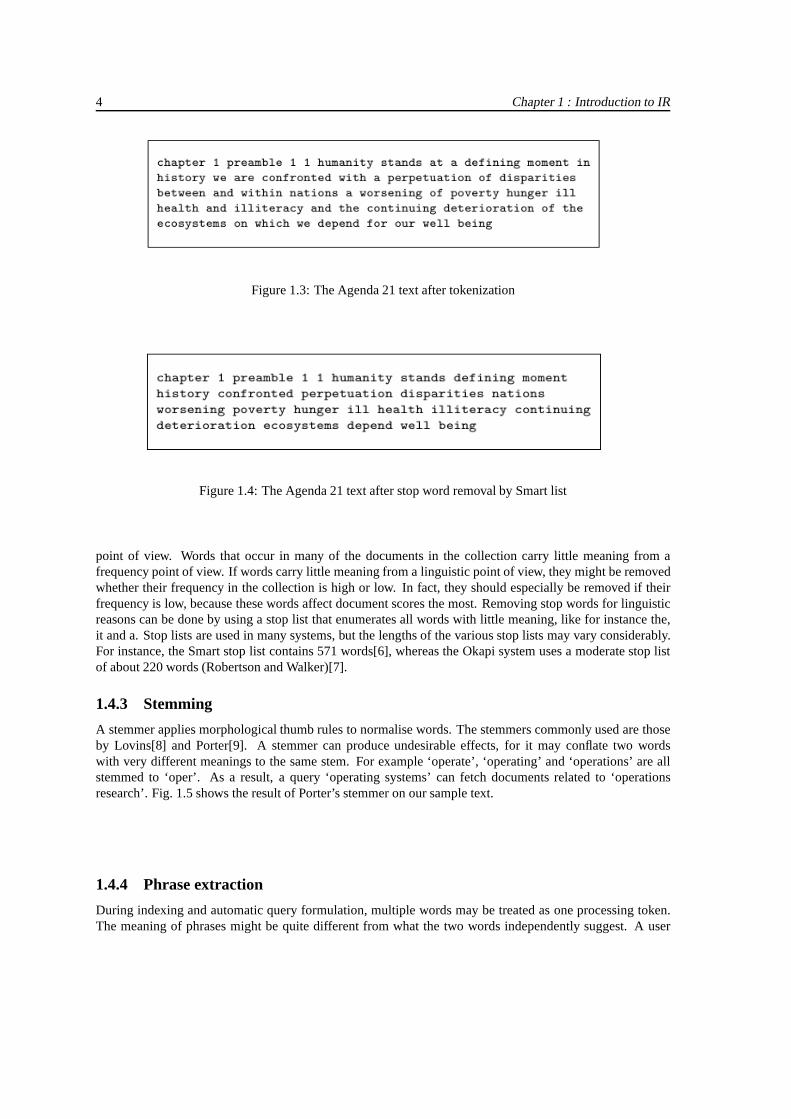
Figure 1.4: The Agenda 21 text after stop word removal by Smart list
point of view. Words that occur in many of the documents in thecollection carry little meaning from afrequency point of view. If words carry little meaning from alinguistic point of view, they might be removedwhether their frequency in the collection is high or low. In fact, they should especially be removed if theirfrequency is low, because these words affect document scores the most. Removing stop words for linguisticreasons can be done by using a stop list that enumerates all words with little meaning, like for instance the,it and a. Stop lists are used in many systems, but the lengths of the various stop lists may vary considerably.For instance, the Smart stop list contains 571 words[6], whereas the Okapi system uses a moderate stop listof about 220 words (Robertson and Walker)[7].
1.4.3 Stemming
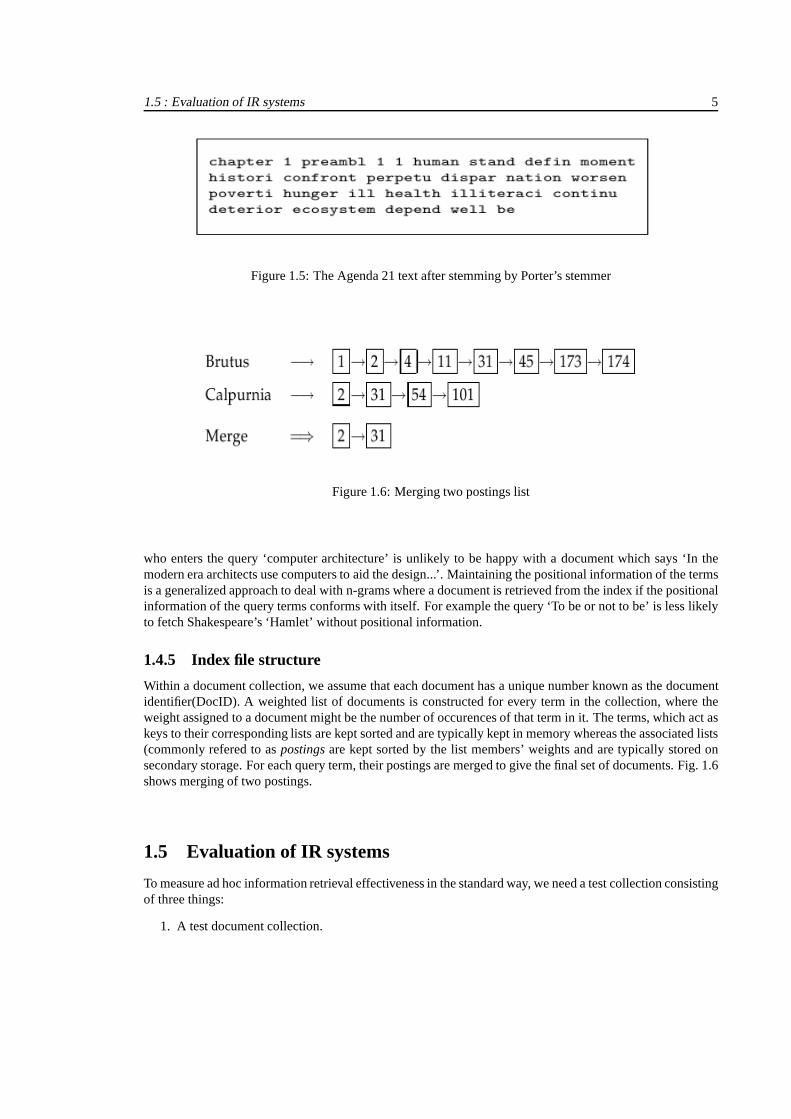
A stemmer applies morphological thumb rules to normalise words. The stemmers commonly used are thoseby Lovins[8] and Porter[9]. A stemmer can produce undesirable effects, for it may conflate two wordswith very different meanings to the same stem. For example ‘operate’, ‘operating’ and ‘operations’ are allstemmed to ‘oper’. As a result, a query ‘operating systems’ can fetch documents related to ‘operationsresearch’. Fig. 1.5 shows the result of Porter’s stemmer on our sample text.
1.4.4 Phrase extraction
During indexing and automatic query formulation, multiplewords may be treated as one processing token.The meaning of phrases might be quite different from what thetwo words independently suggest. A user
1.5 : Evaluation of IR systems 5
Figure 1.5: The Agenda 21 text after stemming by Porter’s stemmer
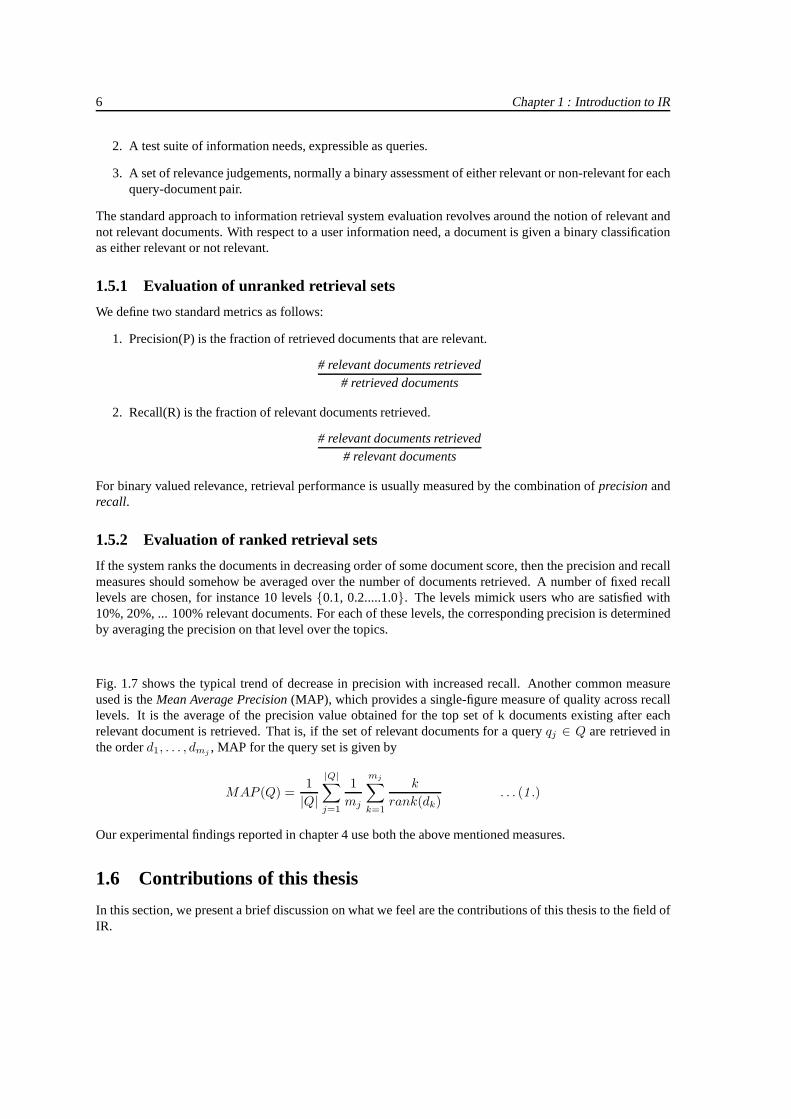
Figure 1.6: Merging two postings list
who enters the query ‘computer architecture’ is unlikely tobe happy with a document which says ‘In themodern era architects use computers to aid the design...’. Maintaining the positional information of the termsis a generalized approach to deal with n-grams where a document is retrieved from the index if the positionalinformation of the query terms conforms with itself. For example the query ‘To be or not to be’ is less likelyto fetch Shakespeare’s ‘Hamlet’ without positional information.
1.4.5 Index file structure
Within a document collection, we assume that each document has a unique number known as the documentidentifier(DocID). A weighted list of documents is constructed for every term in the collection, where theweight assigned to a document might be the number of occurences of that term in it. The terms, which act askeys to their corresponding lists are kept sorted and are typically kept in memory whereas the associated lists(commonly refered to aspostings are kept sorted by the list members’ weights and are typically stored onsecondary storage. For each query term, their postings are merged to give the final set of documents. Fig. 1.6shows merging of two postings.
1.5 Evaluation of IR systems
To measure ad hoc information retrieval effectiveness in the standard way, we need a test collection consistingof three things:
1. A test document collection.
6 Chapter 1 : Introduction to IR
2. A test suite of information needs, expressible as queries.
3. A set of relevance judgements, normally a binary assessment of either relevant or non-relevant for eachquery-document pair.
The standard approach to information retrieval system evaluation revolves around the notion of relevant andnot relevant documents. With respect to a user information need, a document is given a binary classificationas either relevant or not relevant.
1.5.1 Evaluation of unranked retrieval sets
We define two standard metrics as follows:
1. Precision(P) is the fraction of retrieved documents thatare relevant.
# relevant documents retrieved# retrieved documents
2. Recall(R) is the fraction of relevant documents retrieved.
# relevant documents retrieved# relevant documents
For binary valued relevance, retrieval performance is usually measured by the combination ofprecision andrecall.
1.5.2 Evaluation of ranked retrieval sets
If the system ranks the documents in decreasing order of somedocument score, then the precision and recallmeasures should somehow be averaged over the number of documents retrieved. A number of fixed recalllevels are chosen, for instance 10 levels{0.1, 0.2.....1.0}. The levels mimick users who are satisfied with10%, 20%, ... 100% relevant documents. For each of these levels, the corresponding precision is determinedby averaging the precision on that level over the topics.
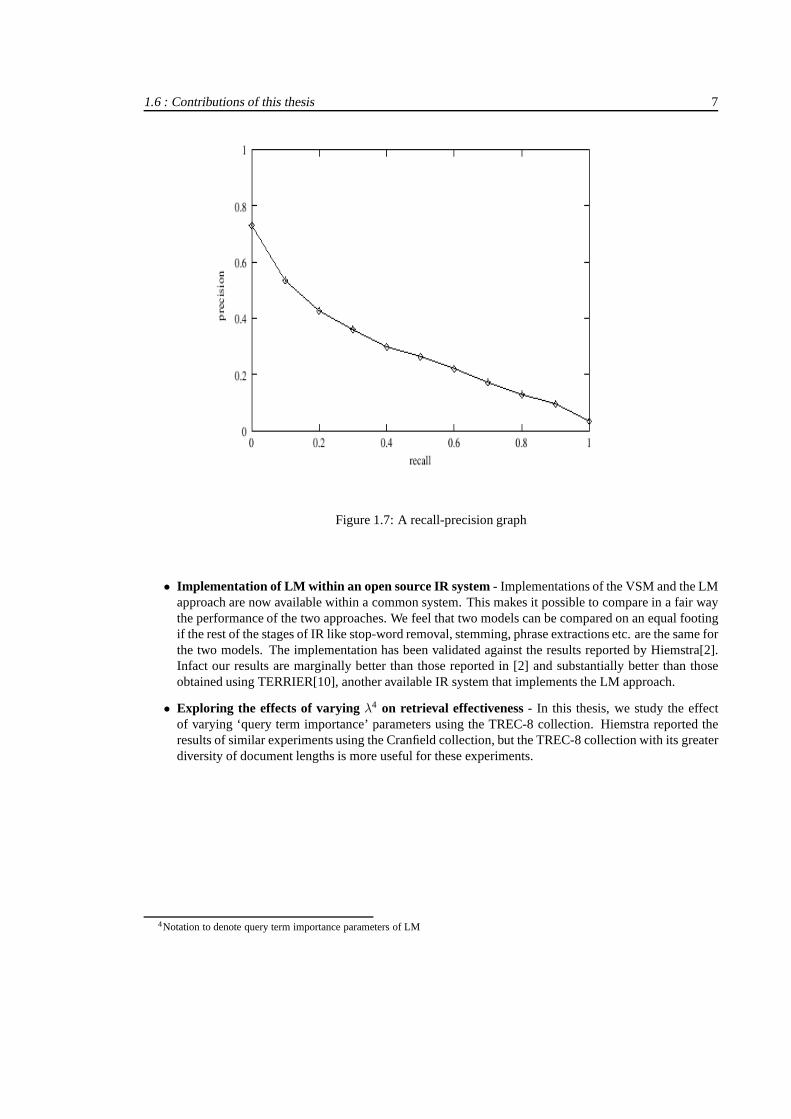
Fig. 1.7 shows the typical trend of decrease in precision with increased recall. Another common measureused is theMean Average Precision (MAP), which provides a single-figure measure of quality across recalllevels. It is the average of the precision value obtained forthe top set of k documents existing after eachrelevant document is retrieved. That is, if the set of relevant documents for a queryqj ∈ Q are retrieved inthe orderd1, . . . , dmj
, MAP for the query set is given by
MAP (Q) =1
|Q|
|Q|∑
j=1
1
mj
mj∑
k=1
k
rank(dk). . . (1 .)
Our experimental findings reported in chapter 4 use both the above mentioned measures.
1.6 Contributions of this thesis
In this section, we present a brief discussion on what we feelare the contributions of this thesis to the field ofIR.
1.6 : Contributions of this thesis 7
Figure 1.7: A recall-precision graph
• Implementation of LM within an open source IR system- Implementations of the VSM and the LMapproach are now available within a common system. This makes it possible to compare in a fair waythe performance of the two approaches. We feel that two models can be compared on an equal footingif the rest of the stages of IR like stop-word removal, stemming, phrase extractions etc. are the same forthe two models. The implementation has been validated against the results reported by Hiemstra[2].Infact our results are marginally better than those reported in [2] and substantially better than thoseobtained using TERRIER[10], another available IR system that implements the LM approach.
• Exploring the effects of varying λ4 on retrieval effectiveness- In this thesis, we study the effectof varying ‘query term importance’ parameters using the TREC-8 collection. Hiemstra reported theresults of similar experiments using the Cranfield collection, but the TREC-8 collection with its greaterdiversity of document lengths is more useful for these experiments.
4Notation to denote query term importance parameters of LM
Chapter 2
Vector Space Model
THE vector1 space model of information retrieval was developed by Salton and his students in the late1960’s and the early 1970’s[12]. This model transforms any given text such as an article, a query,a portion of an article etc. into a vector in a very high-dimensional vector space. The main power
of this model comes from its ability to measure the proximitybetween any two vectors, i.e., the ‘closeness’between any two texts. In terms of information retrieval, when two vectors are close, then the correspondingtexts are semantically related. The documents can then be ranked in decreasing order of their closeness to thequery, yielding a semantic relatedness ranking, as desiredin modern information retrieval systems.Salton and his students also implemented a system based on the vector space model, the Smart system[6].Smart has had an enormous impact on IR research over the last thirty years. Many theories and techniques inthe field of information retrieval, for example, automatic indexing and term weighting, evaluation of rankedsystems, soft boolean models, relevance feedback, document clustering, use of a thesaurus etc. were eitherdeveloped directly on the Smart system, or were first tested for their applicability to IR tasks on the Smartsystem. Research out of the Smart group at Cornell has contributed numerous important results, and hasstimulated lots of new work in the field of information retrieval. Through Smart, the vector space model hashad a tremendous influence on IR.
2.1 The model
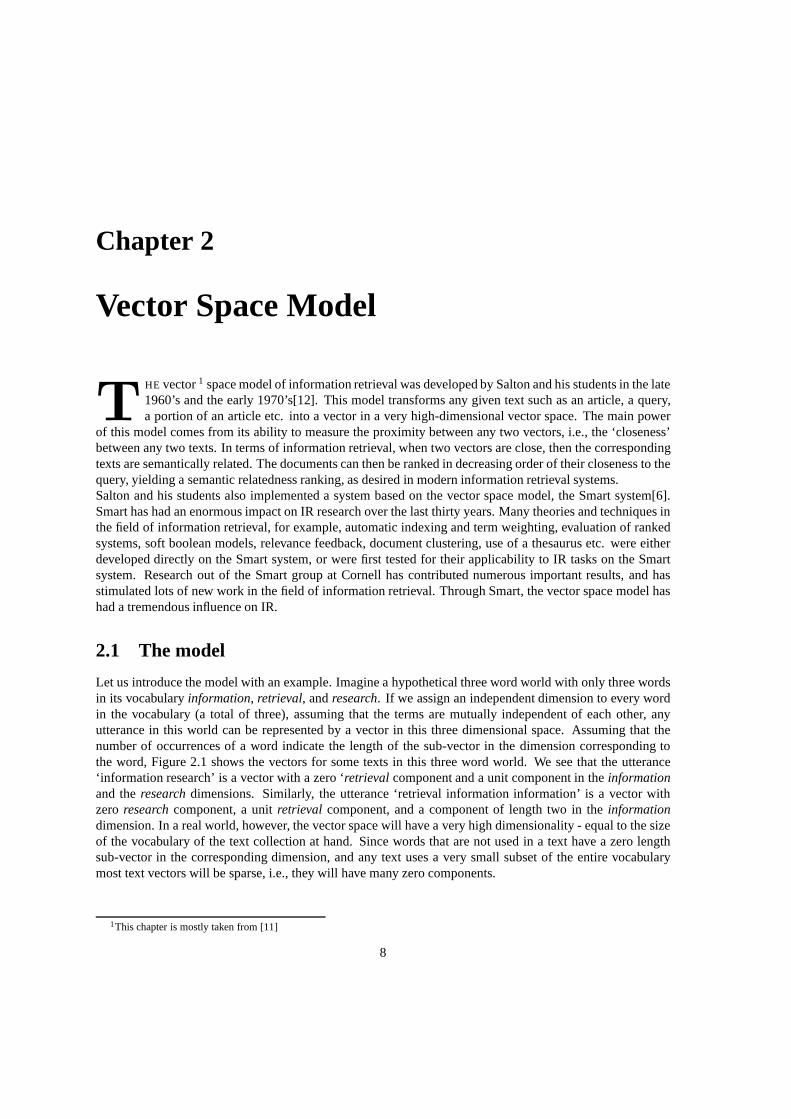
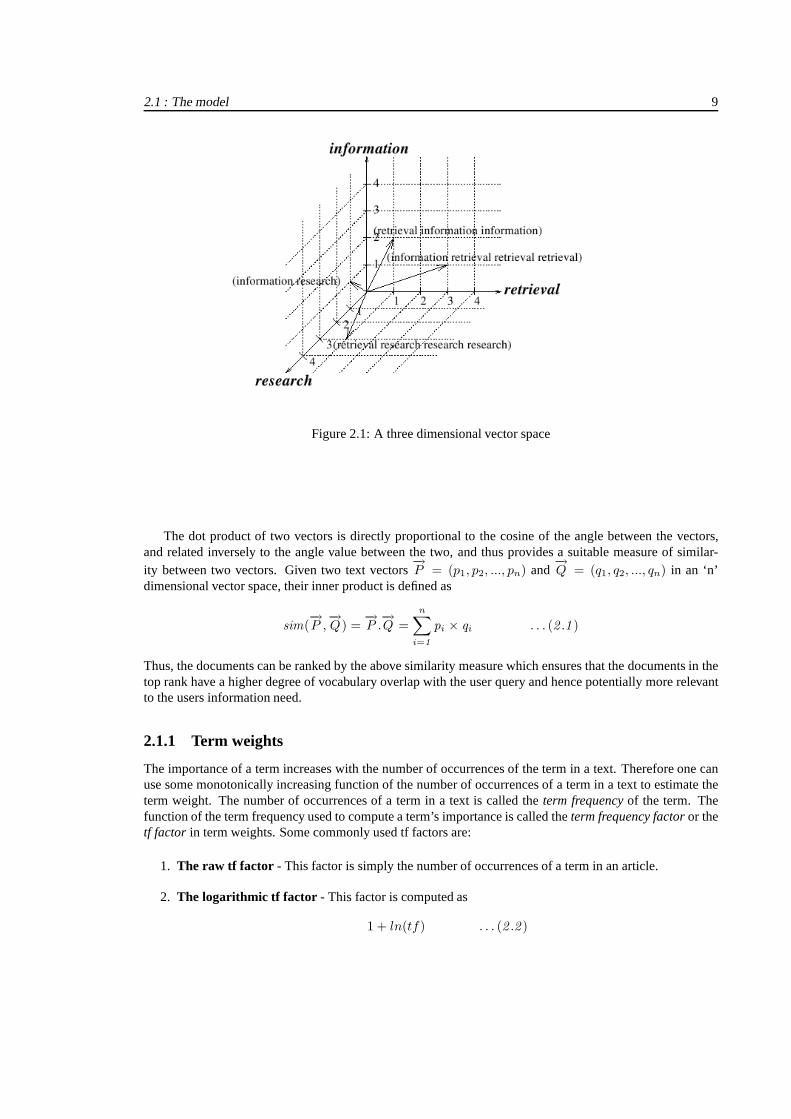
Let us introduce the model with an example. Imagine a hypothetical three word world with only three wordsin its vocabularyinformation, retrieval, andresearch. If we assign an independent dimension to every wordin the vocabulary (a total of three), assuming that the termsare mutually independent of each other, anyutterance in this world can be represented by a vector in thisthree dimensional space. Assuming that thenumber of occurrences of a word indicate the length of the sub-vector in the dimension corresponding tothe word, Figure 2.1 shows the vectors for some texts in this three word world. We see that the utterance‘information research’ is a vector with a zero ‘retrieval component and a unit component in theinformationand theresearch dimensions. Similarly, the utterance ‘retrieval information information’ is a vector withzero research component, a unitretrieval component, and a component of length two in theinformationdimension. In a real world, however, the vector space will have a very high dimensionality - equal to the sizeof the vocabulary of the text collection at hand. Since wordsthat are not used in a text have a zero lengthsub-vector in the corresponding dimension, and any text uses a very small subset of the entire vocabularymost text vectors will be sparse, i.e., they will have many zero components.
1This chapter is mostly taken from [11]
8
2.1 : The model 9
Figure 2.1: A three dimensional vector space
The dot product of two vectors is directly proportional to the cosine of the angle between the vectors,and related inversely to the angle value between the two, andthus provides a suitable measure of similar-ity between two vectors. Given two text vectors
−→P = (p1, p2, ..., pn) and
−→Q = (q1, q2, ..., qn) in an ‘n’
dimensional vector space, their inner product is defined as
sim(−→P ,
−→Q) =
−→P .
−→Q =
n∑
i=1
pi × qi . . . (2 .1 )
Thus, the documents can be ranked by the above similarity measure which ensures that the documents in thetop rank have a higher degree of vocabulary overlap with the user query and hence potentially more relevantto the users information need.
2.1.1 Term weights
The importance of a term increases with the number of occurrences of the term in a text. Therefore one canuse some monotonically increasing function of the number ofoccurrences of a term in a text to estimate theterm weight. The number of occurrences of a term in a text is called the term frequency of the term. Thefunction of the term frequency used to compute a term’s importance is called theterm frequency factor or thetf factor in term weights. Some commonly used tf factors are:
1. The raw tf factor - This factor is simply the number of occurrences of a term in an article.
2. The logarithmic tf factor - This factor is computed as
1 + ln(tf) . . . (2 .2 )
10 Chapter 2 : Vector Space Model
Consider as an example the query ‘recycling of tires’, and two documents -D1 with ten occurrencesof the word ‘recycling’, andD2 which uses both the words ‘recycling’ and ‘tires’ three times each.Everything else being equal, if raw tf s are used,D1 gets a higher similarity (proportional to 10) thanD2 (which gets a similarity proportional to 3 + 3 = 6). However itis more likely thatD2 addressesthe needs of the query much better than D1 because it addresses both recycling and tires, and not justrecycling (likeD1).
3. The augmented term factor- This factor reduces the range of the contributions from theterm fre-quency of a term. This is done by compressing the range of the possible tf factor values (say between0.5 and 1.0). The augmented tf factor is used with a belief that mere presence of a term in a text shouldhave some default weight (say 0.5); additional occurrencesof a term could increase the weight of theterm to some maximum value (usually 1.0). Typically this factor is:
0.5 + 0.5 ×tf
maxm. tf. . . (2 .3 )
2.1.2 Inverse Document Frequency
With reference to the discussion on stop words in section 1.4.2, we can say that such words occur with veryhigh term frequencies across numerous articles and hence are not very informative. A match between a queryand an article on words like ‘put’ does not mean much in terms of the semantic relationship between thequery and the article. For this reason we also need to differentiate between the goodness of matching terms.
Intuitively, a high idf term has a very specific usage and is therefore more useful for discriminatingbetween useful and non-relevant documents.
The number of articles a word appears in is often called thedocument frequency of the word. An inversefunction of the document frequency is used in term weights, and is called theinverse document frequencyfactor or theidf factor in term weights. The most commonly used inverse document frequency formulationis
ln(Ndf
) . . . (2 .4 )
where N is the total number of articles in a collection and df is the document frequency of the word.
2.1.3 Document length normalization
tf × idf weights don’t always suffice as good estimates of term importance in a text, because they ignore thedocument lengths often leading to prioritizing longer documents. Hence as a compensation, the weights of theterms in longer documents are depressed giving the shorter documents a chance to compete with the longerones. This technique is called ‘document length normalization’. Following is a review of some commonlyused length normalization schemes:
1. Cosine normalization- It is the most common and perhaps most intuitive normalization technique ofthe vector space model. The inner-product equation as defined in (2.1) can be modified to compute theactual cosine of the angle between the two vectors, which is independent of the length of the vectors.
cos(Q, D) =
−→Q.
−→D
‖ Q ‖‖ D ‖. . . (2 .5 )
2. Maximum tf Normalization - Another popular normalization technique is normalization of individualtf weights for a document by the maximum tf in the document. The Smart system’s augmented tf factor(see eqn. 2.3) is an example of such normalization.
2.2 : The SMART system 11
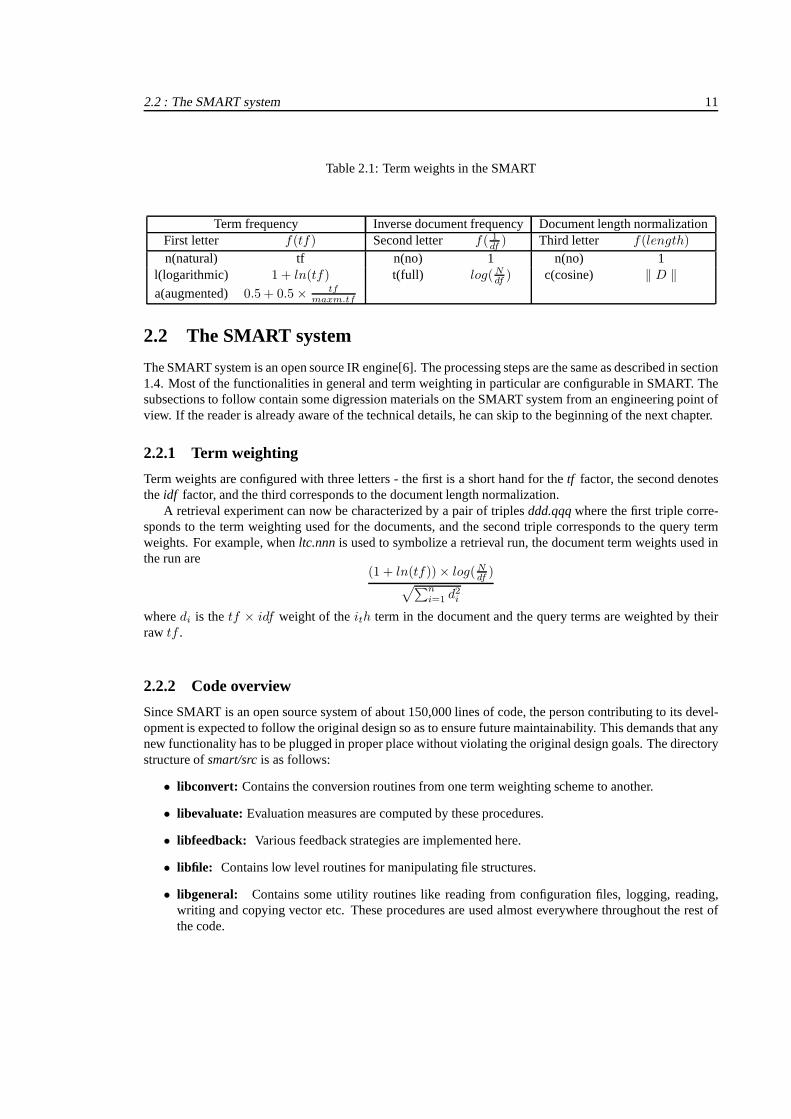
Table 2.1: Term weights in the SMART
Term frequency Inverse document frequencyDocument length normalizationFirst letter f(tf) Second letter f( 1
df) Third letter f(length)
n(natural) tf n(no) 1 n(no) 1l(logarithmic) 1 + ln(tf) t(full) log( N
df) c(cosine) ‖ D ‖
a(augmented) 0.5 + 0.5 × tf
maxm.tf
2.2 The SMART system
The SMART system is an open source IR engine[6]. The processing steps are the same as described in section1.4. Most of the functionalities in general and term weighting in particular are configurable in SMART. Thesubsections to follow contain some digression materials onthe SMART system from an engineering point ofview. If the reader is already aware of the technical details, he can skip to the beginning of the next chapter.
2.2.1 Term weighting
Term weights are configured with three letters - the first is a short hand for thetf factor, the second denotestheidf factor, and the third corresponds to the document length normalization.
A retrieval experiment can now be characterized by a pair of triplesddd.qqq where the first triple corre-sponds to the term weighting used for the documents, and the second triple corresponds to the query termweights. For example, whenltc.nnn is used to symbolize a retrieval run, the document term weights used inthe run are
(1 + ln(tf)) × log(Ndf
)√
∑n
i=1 d2i
wheredi is thetf × idf weight of theith term in the document and the query terms are weighted by theirraw tf .
2.2.2 Code overview
Since SMART is an open source system of about 150,000 lines ofcode, the person contributing to its devel-opment is expected to follow the original design so as to ensure future maintainability. This demands that anynew functionality has to be plugged in proper place without violating the original design goals. The directorystructure ofsmart/src is as follows:
• libconvert: Contains the conversion routines from one term weighting scheme to another.
• libevaluate: Evaluation measures are computed by these procedures.
• libfeedback: Various feedback strategies are implemented here.
• libfile: Contains low level routines for manipulating file structures.
• libgeneral: Contains some utility routines like reading from configuration files, logging, reading,writing and copying vector etc. These procedures are used almost everywhere throughout the rest ofthe code.
12 Chapter 2 : Vector Space Model
• libindexing: Contains indexing procedures for documents and queries. The procedures to be usedat various stages of the indexing process are specified through the configuration file. For examplethe default configuration filespec.default suggests that document vectors are to be stored as invertedlists and queries are to be stored in the vector format. The user can override this default behavior byconfiguring the parametersdoc.store andquery.store. Please refer to the ‘libproc’ section where wediscuss the function calling mechanism in SMART.
• libprint: Contains procedures to print the file structures as an aid fordebugging.
• libproc: Each file in this folder defines a procedure hieararchy providing a top level action to take,and a choice of configurable sub-actions to be chosen from theimplemented available options. If forexample the user wants to index documents, he simply invokesthe program as follows:
smart index.doc spec.default
The file spec.default is provided by the system and below we provide a small snippetof that file forquick reference relevant to our discussion.
store index.store.storevecdoc.store index.store.storeauxindex.doc index.top.doccoll
• libretrieve: The functions in this procedure compute the similarity measures of a given query with thedocuments in the collection and forms a list of retrieved documents ordered by decreasing similarityscores.
Chapter 3
Language Model
THE LANGUAGE MODEL of Information Retrieval is a new model developed independently by Ponteand Croft[13] and Hiemstra[2]. Our implementation is basedon Hiemstra’s work. In this chapter,we present the language model from an information theoreticpoint of view and then provide the
mathematical description of this model. In the sections to follow, we describe how this model can be cast interms of the vector space model and then conclude this chapter with an introduction to the notion of feedbackwithin the framework of this model.
3.1 Language Model - An information theoretic viewpoint
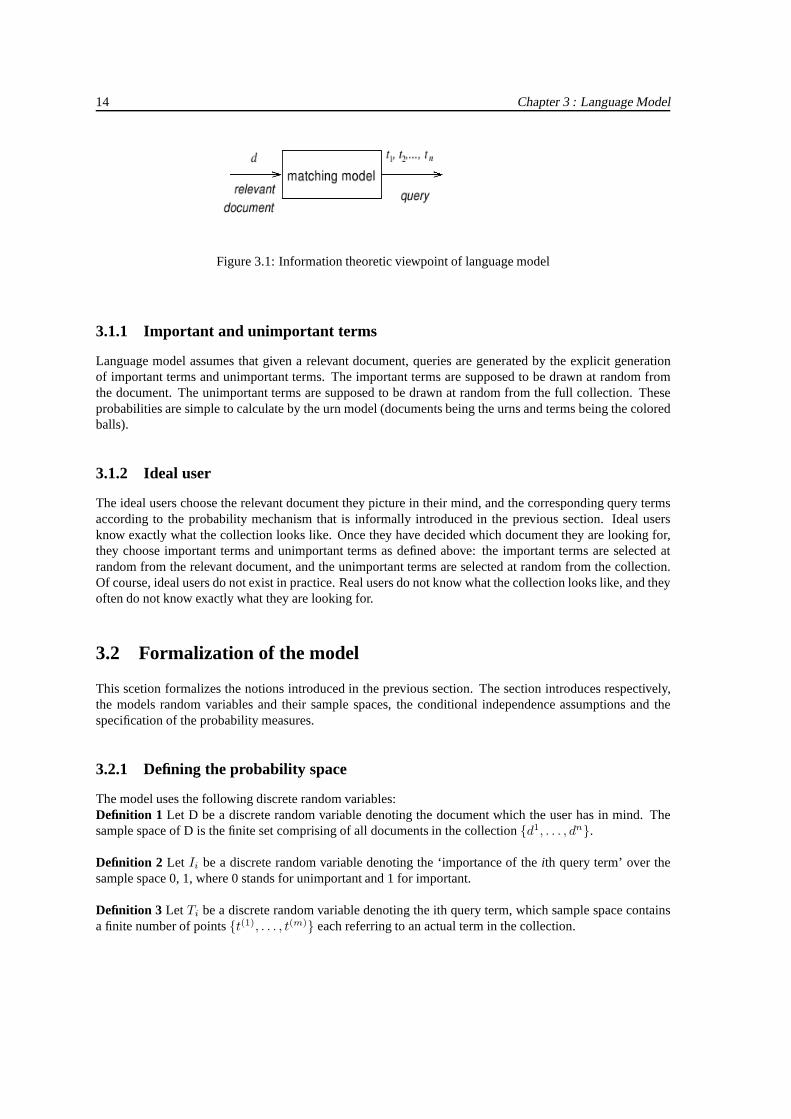
Information Theory was developed by Shannon (1948) to modelthe problem of decoding a message that issent over a noisy communication channel. From this viewpoint, a relevant documentd gets corrupted into aqueryt1, . . . , tn by transmission through a noisy channel as shown in the figure3.1. An IR system can bethought of as a decoding functionf : t1, . . . , tn → d that tries to reproduce the message that was actuallysent or to retrieve the actual document which the user had in mind. An optimal retrieval system would choosef : t1, . . . , tn → d such that:
f(t1, . . . , tn) = maxd
P (D = d|T1 = t1, . . . , Tn = tn) . . . (3 .1 )
By Bayes rule and sinceP (T1 = t1, . . . , Tn = tn) doesn’t depend ond, we get:
f(t1, . . . , tn) = maxd
∑
t1,...,tn
P (T1 = t1, . . . , Tn = tn|D = d).P (D = d) . . . (3 .2 )
whereP (D = d) is the prior probability of relevance of a documentd. andP (T1 = t1, . . . , Tn = tn|D =d) is the conditional probability of generating the query(t1, . . . , tn) from the documentd. The very essenceof the indexing process in language modeling is to derive estimates for the probabilities as defined on the rhsof the equation (3.2).
In the subsections to follow, we define notions ofquery term importance and that of anideal user whichwould guide us to a realistic estimation of the probabilities.
13
14 Chapter 3 : Language Model
Figure 3.1: Information theoretic viewpoint of language model
3.1.1 Important and unimportant terms
Language model assumes that given a relevant document, queries are generated by the explicit generationof important terms and unimportant terms. The important terms are supposed to be drawn at random fromthe document. The unimportant terms are supposed to be drawnat random from the full collection. Theseprobabilities are simple to calculate by the urn model (documents being the urns and terms being the coloredballs).
3.1.2 Ideal user
The ideal users choose the relevant document they picture intheir mind, and the corresponding query termsaccording to the probability mechanism that is informally introduced in the previous section. Ideal usersknow exactly what the collection looks like. Once they have decided which document they are looking for,they choose important terms and unimportant terms as definedabove: the important terms are selected atrandom from the relevant document, and the unimportant terms are selected at random from the collection.Of course, ideal users do not exist in practice. Real users donot know what the collection looks like, and theyoften do not know exactly what they are looking for.
3.2 Formalization of the model
This scetion formalizes the notions introduced in the previous section. The section introduces respectively,the models random variables and their sample spaces, the conditional independence assumptions and thespecification of the probability measures.
3.2.1 Defining the probability space
The model uses the following discrete random variables:Definition 1 Let D be a discrete random variable denoting the document which the user has in mind. Thesample space of D is the finite set comprising of all documentsin the collection{d1, . . . , dn}.
Definition 2 Let Ii be a discrete random variable denoting the ‘importance of the ith query term’ over thesample space 0, 1, where 0 stands for unimportant and 1 for important.
Definition 3 Let Ti be a discrete random variable denoting the ith query term, which sample space containsa finite number of points{t(1), . . . , t(m)} each referring to an actual term in the collection.
3.2 : Formalization of the model 15
3.2.2 Conditional independence assumptions
The joint probabilityP (D, I1, . . . , In, T1, . . . , Tn) completely defines the information retrieval problem fora query of length n. According to the informal description ofsection 3.1.2, a query is generated by firstselecting a documentd with probabilityP (D = d). Given thatd is the document the user has in mind, tossingfor importance and selecting the query terms is done independently for each query termi with probabilitiesrespectively asP (Ii) andP (Ti|Ii, D) as shown in equation (3.3).
P (D, I1, . . . In, T1, . . . , Tn) = P (D)
n∏
i=1
P (Ii)P (Ti|Ii, D) . . . (3 .3 )
Distributing sums over the products we get
P (D, T1, . . . , Tn) = P (D)
n∏
i=1
1∑
k=0
P (Ii = k)P (Ti|Ii = k, D) . . . (3 .4 )
Ranking the documents by equation (3.4) will in fact rank thedocuments in decreasing order of the probabilitythat the document is relevant given the query.
3.2.3 Estimating the probabilities
The probabilities are defined by using the number of documents in the collection and the term frequencies ofa term in a document. Lettf(t, d) denote the term frequency of termt in documentd.
From the urn model, it is quite straightforward to see that:
P (D = d) =1
# of documents. . . (3 .5 )
P (Ti = ti|Ii = 1, D = d) =tf(ti, d)
∑
t tf(t, d). . . (3 .6 )
P (Ti|Ii = 0) =
∑
k tf(ti, k)∑
t,k tf(t, k)=
cf(ti)
cf(t). . . (3 .7 )
wherecf(ti) is the collection frequency of the termti andcf(t) is the collection size.
3.2.4 Alternative definitions
Instead of assuming uniform prior probability values forP (D = d) ∀d we can estimate the prior probabilitiesof relevance according to the length of the documents assuming that longer documents have somewhat higherprobability of relevance. Thus equation (3.5) can be definedas:
P (D = d) =
∑
t tf(t, d)∑
t,k tf(t, k). . . (3 .8 )
We can also replace the collection frequencies by document frequencies since the vector space model, whichhas been a time-tested model over the years uses document frequencies. Equation (3.7) thus becomes:
P (Ti) =df(ti)
df(t). . . (3 .9 )
16 Chapter 3 : Language Model
3.2.5 Simplified notations
The notation to describe the importance of a query term is quite cumbersome and hence to to cut down thelength of our equations, letP (Ii = 1) be denoted byλi and henceP (Ii = 0) would become(1 − λi). LetP (Ti|Ii = 1, D) be denoted byP (Ti|D) andP (Ti|Ii = 0) be replaced withP (Ti) As a result the equation(3.4) becomes
P (D, T1, . . . , Tn) = P (D)
n∏
i=1
((1 − λi)P (Ti) + λiP (Ti|D)) . . . (3 .10 )
3.2.6 Unknown parameters
Since we do not have any prior knowledge about the importanceof query terms, one way of estimation isto start with arbitrary small initial values and then iteratively improve these parameters over retrieval stagesusing the relevance information. This is in essence, thefeedback as applied to language modeled IR. The it-erative method by which the parametersλis are improved is the well known Expectation Maximization (EM)algorithm [14]. The general idea of the EM-algorithm is thatif only the expected values of the unobserveddata were known, then these values could be used to estimate the probabilities we want to know. Unfortu-nately, in order to compute the expected values the probabilities are needed. To break the vicious circle, theEM-algorithm takes any set of probabilities to compute the expected values; these are used to re-estimate theprobabilities. The new probabilities are used to compute new expected values, etc. The two steps, called ex-pectation step and maximisation step are repeated until theprobabilities do not change significantly anymore.The algorithm is guaranteed to converge to a local maximum.We introducer separate random variablesDj, (1 6 j 6 r) one for each relevant document.Definition 4 Let Dj be a discrete random variable denoting ‘thejth relevant document whose sample spaceconsists of{d1, . . . , dn}.Definition 5 Let Iij be a discrete random variable denoting the ‘importance of the ith query term in thejthrelevant document over the sample space{0, 1}, where 0 stands for unimportant and 1 for important.Dempster et al. (1977) describe the algorithm by defining theobserved data as the incomplete data andthe combination of the observed data and the unobserved dataas the complete data. The incomplete dataconsist in this case of a sequence ofn query termsTi , (1 6 i 6 n), and a set ofr relevant documentsDj , (1 6 j 6 r). The complete data completely define how the model generatedthe observed data. Itconsists of the query terms, the relevant documents andr sequences ofn binary random variablesIij ,(1 6 i 6 n; 1 6 j 6 r) indicating the importance of each term on positioni in the relevant documentj. Thevaluesλ1, . . . , λn that the algorithm tries to find are related to the complete data by the following likelihoodfunction, assuming independence between the observed relevant documents:
r∏
j=1
P (Dj = dj , T1 = t1, . . . , Tn = tn, I1j = x1j , . . . , Inj = xnj)
=
r∏
j=1
P (Dj = dj) ×
n∏
i=1
(((1 − λi)P (Ti = ti))(1−xij)(λiP (Ti = ti|Dj = dj))
xij )
= (r
∏
j=1
P (Dj = dj)) × (n
∏
i=1
r∏
j=1
P (Ti = ti|Dj = dj)P (Ti = ti))(n
∏
i=1
λ
P
rj=1
xij
i )n
∏
i=1
(1 − λi)(r−
P
rj=1
xij)
The complete-data sufficient statistics aren countsMi for which Mi =∑r
j=1 Iij(1 6 i 6 n), and theunknown parametersλis can be estimated from the realization of the complete-datasufficient statistics by:λi = mi
r. This will be the maximisation step. The expectation step will estimate the complete-data sufficient
3.3 : From language model to vector space model 17
statistics, by the following expectation. Since the expectation of a sum is the sum of an expectation, theexpectation of the importance of terms in each separate relevant document might be summed instead.
E(M1, . . . , Mn|T1, . . . , Tn, D1, . . . , Dr, λ1, . . . , λn)
=
r∑
j=1
E(I1j , . . . , Inj |T1, . . . , Tn, D1, . . . , Dr, λ1, . . . , λn)
Because of independence between terms, it is not necessary to enumerate all2n combinations of importantand unimportant terms. Instead the expected values can be computed for each term independently. Theresulting algorithm is displayed below:
E step : mi =
r∑
j=1
λ(p)i P (Ti = ti|Dj = dj)
(1 − λ(p)i )P (Ti = ti) + λ
(p)i P (Ti = ti|Dj = dj)
M step : λ(p+1)i =
mi
r
The algorithm iteratively maximises the probability of thequeryt1, t2, . . . , tn given r relevant documentsd1, d2, . . . , dr. Before the iteration process starts, the importance weights are initialised to their default valuesλ
(0)i , wherei is the position in the query. Each iterationp estimates a new relevance weightλ
(p+1)i by first
doing the E-step and then the M-step until the value of the relevance weights do not change significantlyanymore.
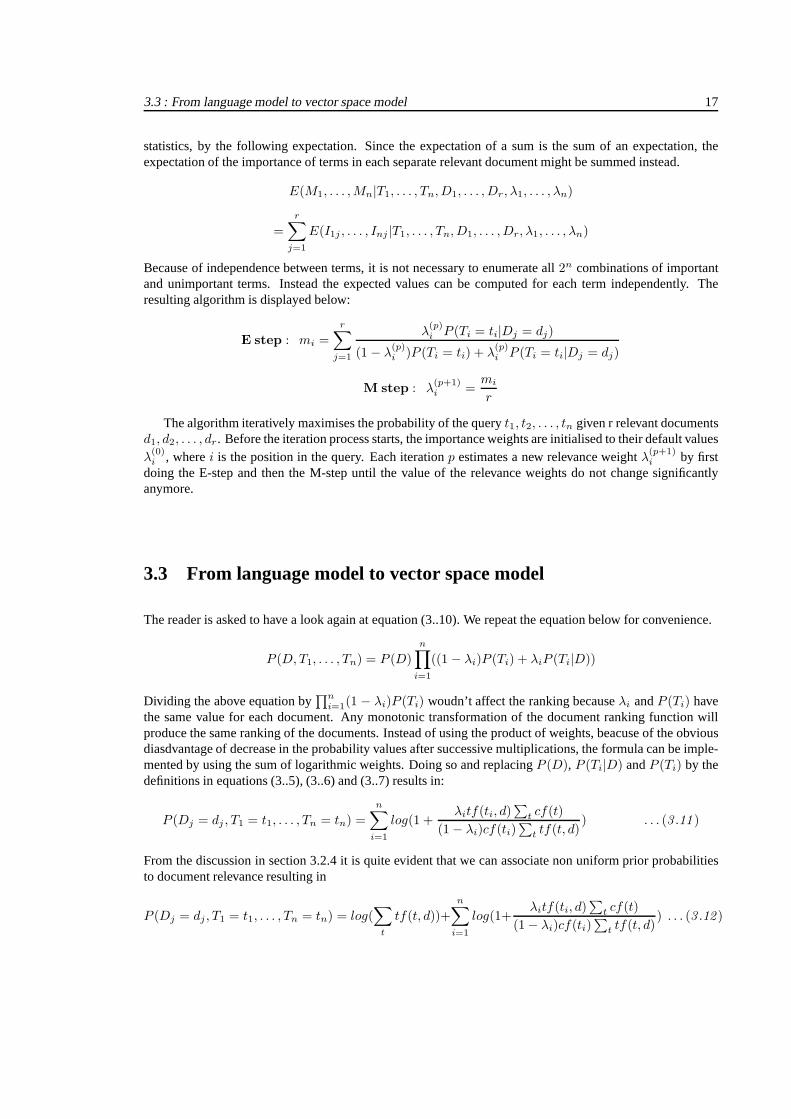
3.3 From language model to vector space model
The reader is asked to have a look again at equation (3..10). We repeat the equation below for convenience.
P (D, T1, . . . , Tn) = P (D)
n∏
i=1
((1 − λi)P (Ti) + λiP (Ti|D))
Dividing the above equation by∏n
i=1(1 − λi)P (Ti) woudn’t affect the ranking becauseλi andP (Ti) havethe same value for each document. Any monotonic transformation of the document ranking function willproduce the same ranking of the documents. Instead of using the product of weights, beacuse of the obviousdiasdvantage of decrease in the probability values after successive multiplications, the formula can be imple-mented by using the sum of logarithmic weights. Doing so and replacingP (D), P (Ti|D) andP (Ti) by thedefinitions in equations (3..5), (3..6) and (3..7) results in:
P (Dj = dj , T1 = t1, . . . , Tn = tn) =
n∑
i=1
log(1 +λitf(ti, d)
∑
t cf(t)
(1 − λi)cf(ti)∑
t tf(t, d)) . . . (3 .11 )
From the discussion in section 3.2.4 it is quite evident thatwe can associate non uniform prior probabilitiesto document relevance resulting in
P (Dj = dj , T1 = t1, . . . , Tn = tn) = log(∑
t
tf(t, d))+
n∑
i=1
log(1+λitf(ti, d)
∑
t cf(t)
(1 − λi)cf(ti)∑
t tf(t, d)) . . . (3 .12 )
18 Chapter 3 : Language Model
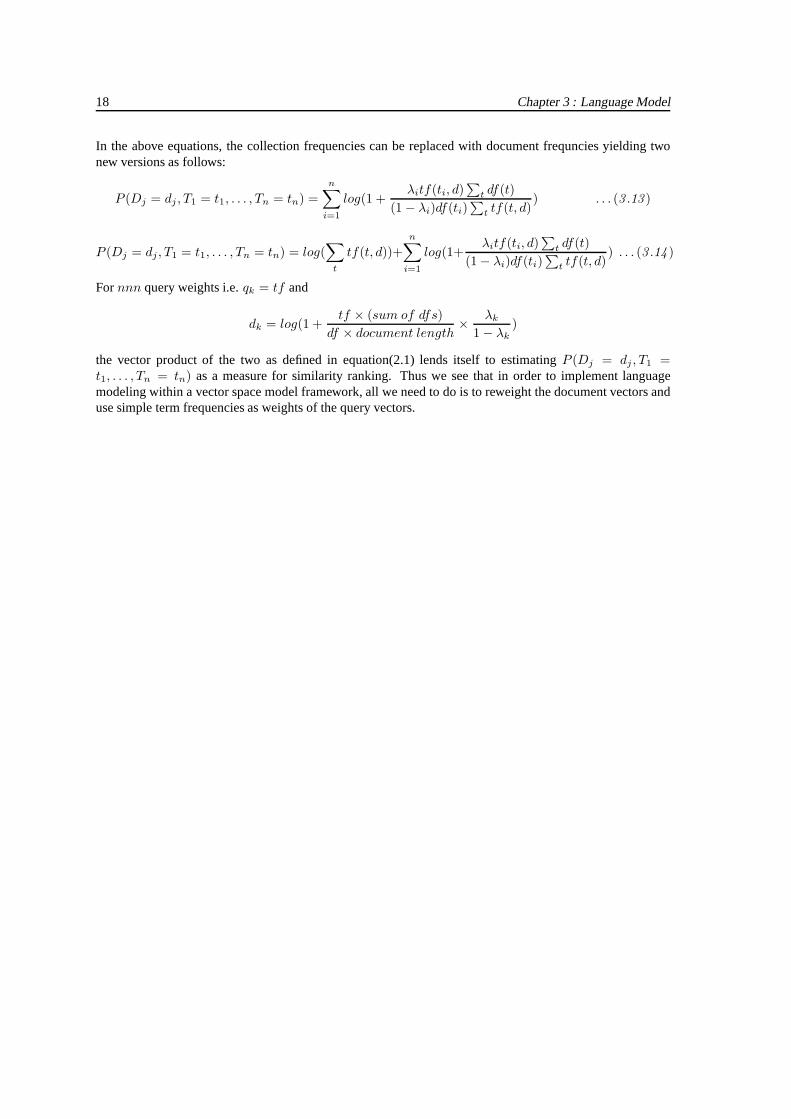
In the above equations, the collection frequencies can be replaced with document frequncies yielding twonew versions as follows:
P (Dj = dj , T1 = t1, . . . , Tn = tn) =
n∑
i=1
log(1 +λitf(ti, d)
∑
t df(t)
(1 − λi)df(ti)∑
t tf(t, d)) . . . (3 .13 )
P (Dj = dj , T1 = t1, . . . , Tn = tn) = log(∑
t
tf(t, d))+
n∑
i=1
log(1+λitf(ti, d)
∑
t df(t)
(1 − λi)df(ti)∑
t tf(t, d)) . . . (3 .14 )
Fornnn query weights i.e.qk = tf and
dk = log(1 +tf × (sum of dfs)
df × document length×
λk
1 − λk
)
the vector product of the two as defined in equation(2.1) lends itself to estimatingP (Dj = dj , T1 =t1, . . . , Tn = tn) as a measure for similarity ranking. Thus we see that in orderto implement languagemodeling within a vector space model framework, all we need to do is to reweight the document vectors anduse simple term frequencies as weights of the query vectors.
Chapter 4
Experimental results
USING the evaluaton described towards the end of chapter 1, this chapter reports on the evaluation ofa language model based retrieval system implemented withinSMART. After a brief introduction tothe test collections in section 4.1, we describe adhoc runs on Cranfield and TREC-8 collections in
the following sections. We then report the results of adhoc runs on the TREC-8 collection with a methodicalchoice of the initial importance of the query terms.
4.1 Test collections
Various available test collections are considered as benchmarks for adhoc retrieval. These test collectionscome packaged with semi-structured documents, queries andrelevance judgement files. We have used twosuch benchmark collections for our experiments:
4.1.1 Cranfield collection
The Cranfield collection is a small collection of 1398 abstracts on aerodynamics with 225 requests. By mod-ern retrieval standards, the number of documents is really small. The collections advantage is the relativelylarge number of requests, and the fact that all documents have been judged for each request.
4.1.2 TREC 8 collection
Like most traditional retrieval collections, there are three distinct parts to the collections used in TREC:the documents, topics and relevance judgements. This section describes each of these pieces for the adhoccollection.
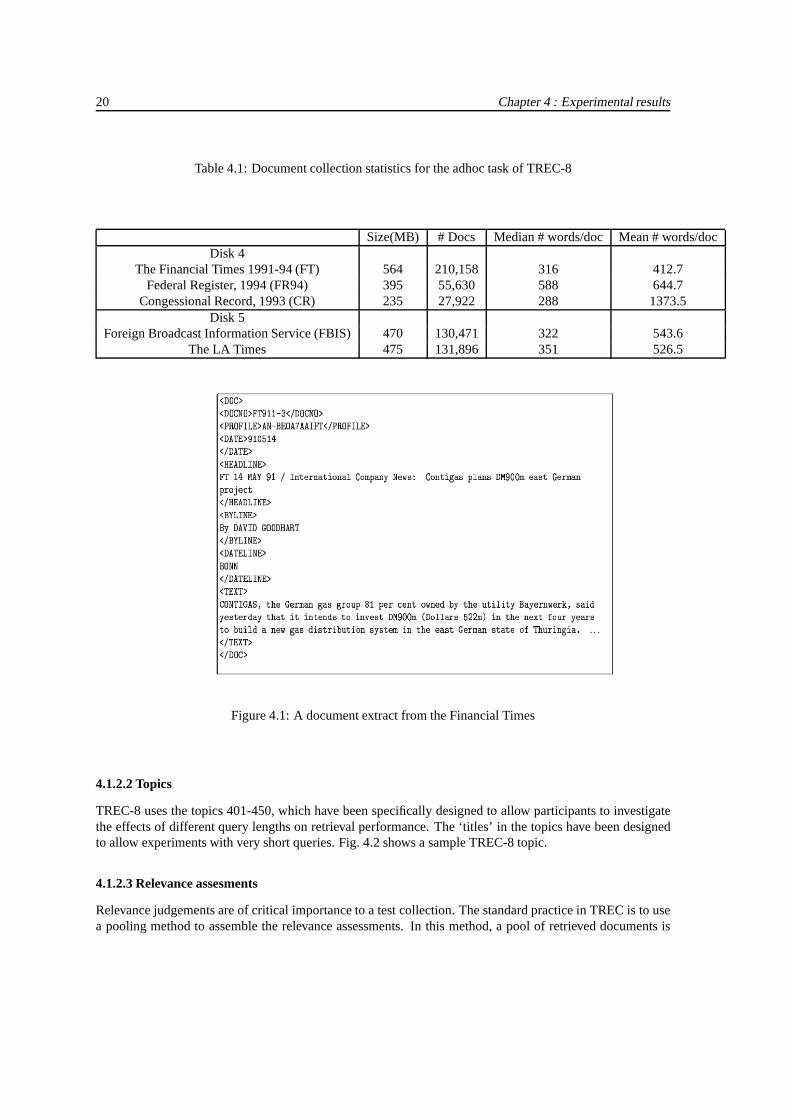
4.1.2.1 Documents
TREC 8 documents are distributed on CD-ROMS with approximately 1 GB of text in each, compressed tofit. Disks 4-5 were used for the adhoc task. TheCongressional Record subcollection on Disk 4 was excludedfrom the test document set.
Documents are tagged using SGML to allow easy parsing (see Fig. 4.1). The philosophy in the formattingat NIST is to leave the data as close as possible to the original.
19
20 Chapter 4 : Experimental results
Table 4.1: Document collection statistics for the adhoc task of TREC-8
Size(MB) # Docs Median # words/doc Mean # words/docDisk 4
The Financial Times 1991-94 (FT) 564 210,158 316 412.7Federal Register, 1994 (FR94) 395 55,630 588 644.7
Congessional Record, 1993 (CR) 235 27,922 288 1373.5Disk 5
Foreign Broadcast Information Service (FBIS) 470 130,471 322 543.6The LA Times 475 131,896 351 526.5
Figure 4.1: A document extract from the Financial Times
4.1.2.2 Topics
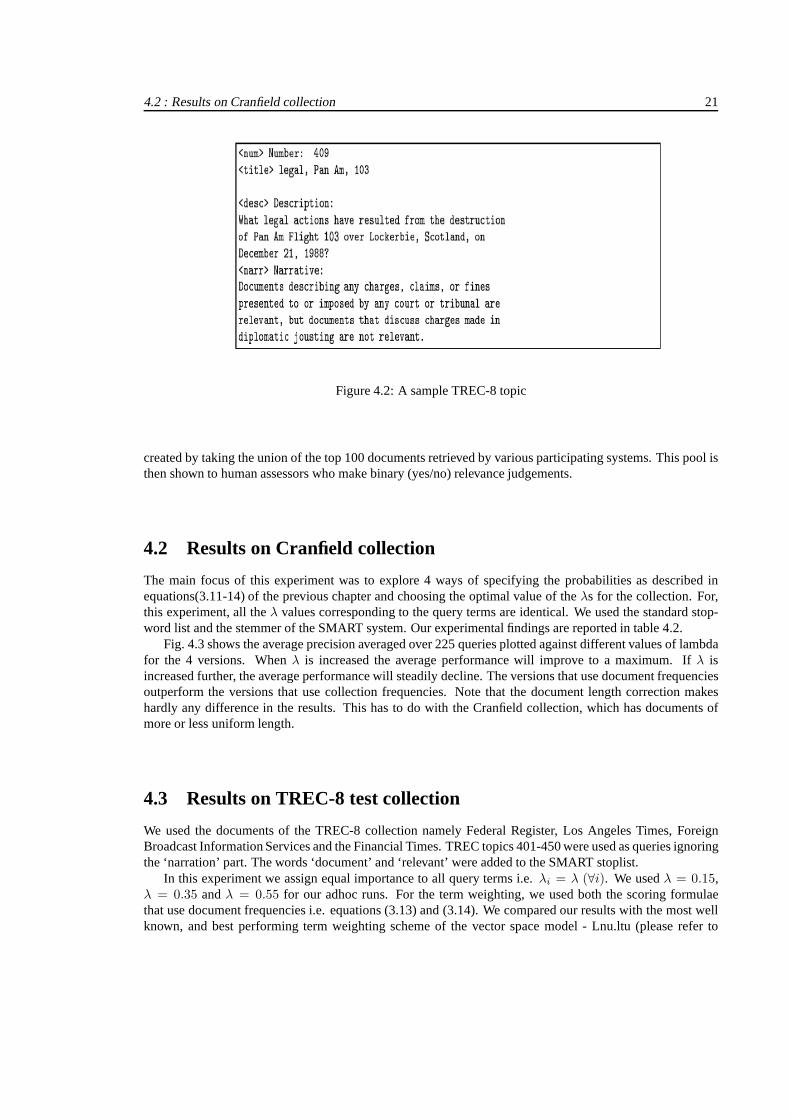
TREC-8 uses the topics 401-450, which have been specificallydesigned to allow participants to investigatethe effects of different query lengths on retrieval performance. The ‘titles’ in the topics have been designedto allow experiments with very short queries. Fig. 4.2 showsa sample TREC-8 topic.
4.1.2.3 Relevance assesments
Relevance judgements are of critical importance to a test collection. The standard practice in TREC is to usea pooling method to assemble the relevance assessments. In this method, a pool of retrieved documents is
4.2 : Results on Cranfield collection 21
Figure 4.2: A sample TREC-8 topic
created by taking the union of the top 100 documents retrieved by various participating systems. This pool isthen shown to human assessors who make binary (yes/no) relevance judgements.
4.2 Results on Cranfield collection
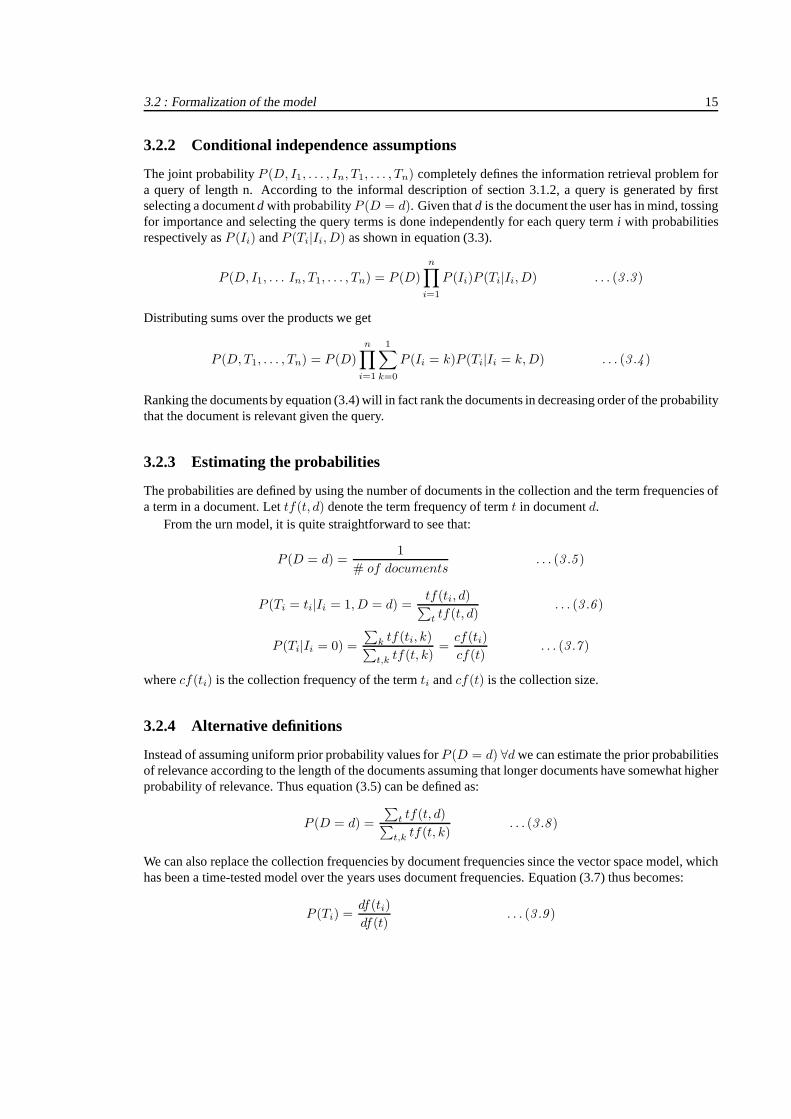
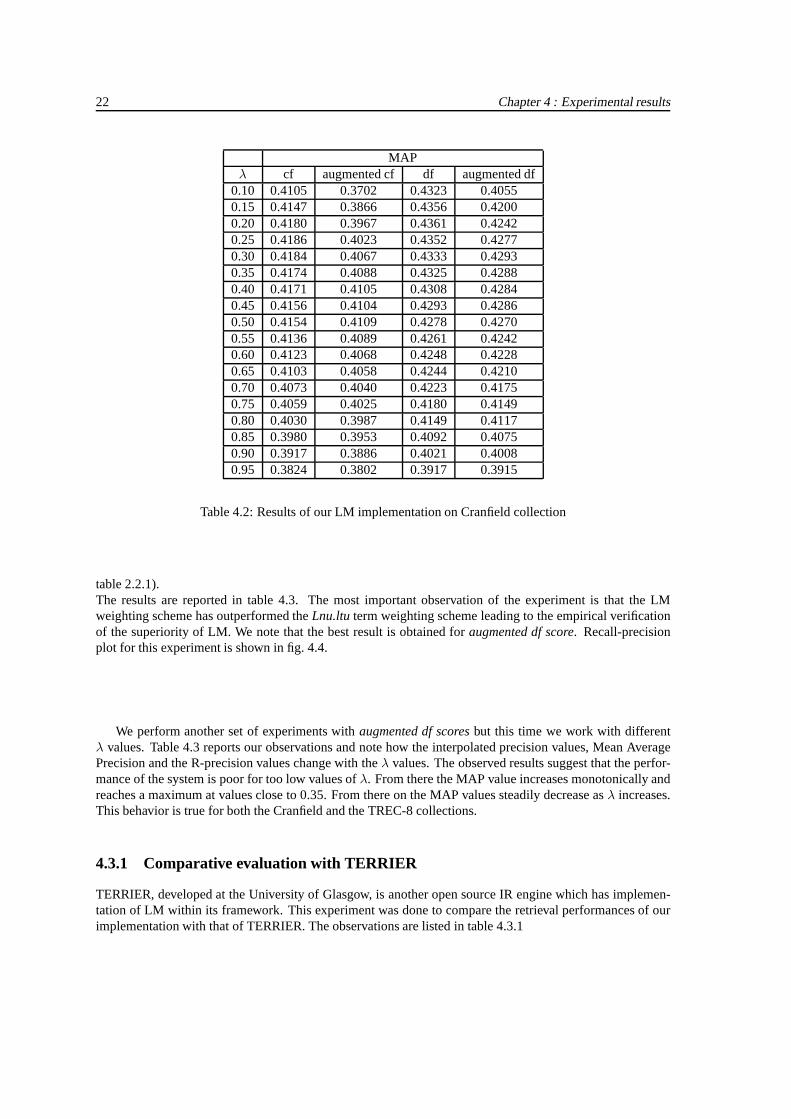
The main focus of this experiment was to explore 4 ways of specifying the probabilities as described inequations(3.11-14) of the previous chapter and choosing the optimal value of theλs for the collection. For,this experiment, all theλ values corresponding to the query terms are identical. We used the standard stop-word list and the stemmer of the SMART system. Our experimental findings are reported in table 4.2.
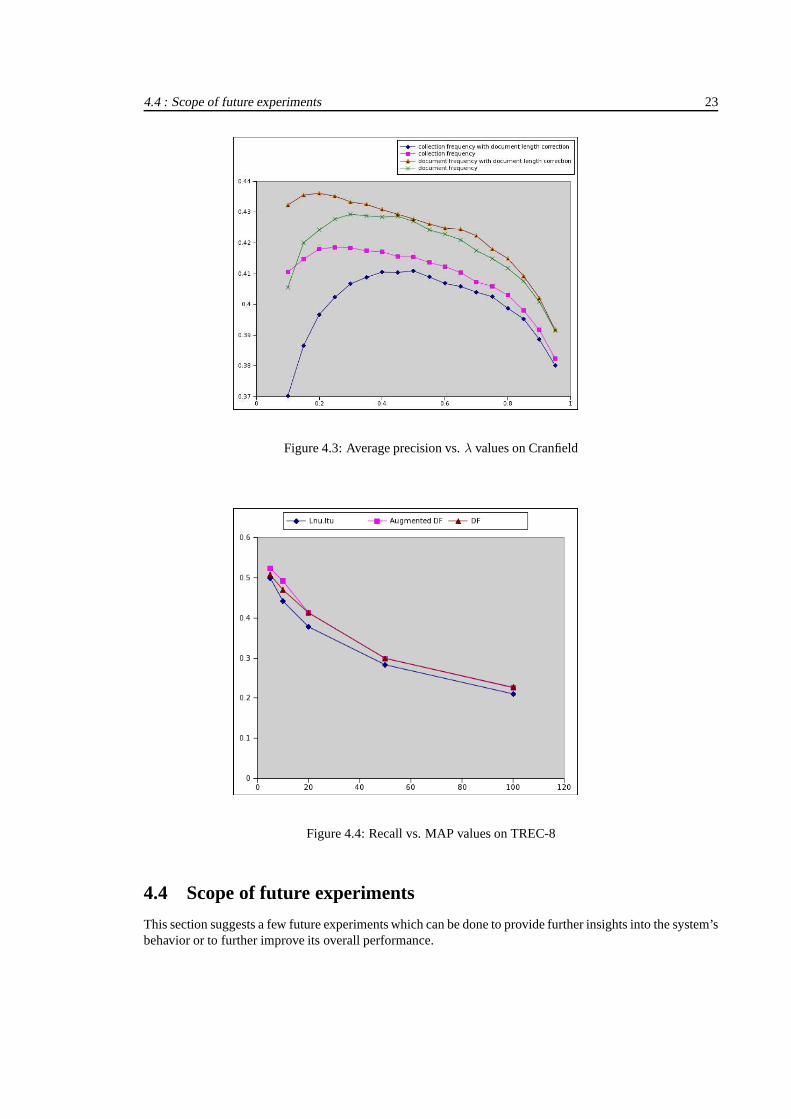
Fig. 4.3 shows the average precision averaged over 225 queries plotted against different values of lambdafor the 4 versions. Whenλ is increased the average performance will improve to a maximum. If λ isincreased further, the average performance will steadily decline. The versions that use document frequenciesoutperform the versions that use collection frequencies. Note that the document length correction makeshardly any difference in the results. This has to do with the Cranfield collection, which has documents ofmore or less uniform length.
4.3 Results on TREC-8 test collection
We used the documents of the TREC-8 collection namely Federal Register, Los Angeles Times, ForeignBroadcast Information Services and the Financial Times. TREC topics 401-450 were used as queries ignoringthe ‘narration’ part. The words ‘document’ and ‘relevant’ were added to the SMART stoplist.
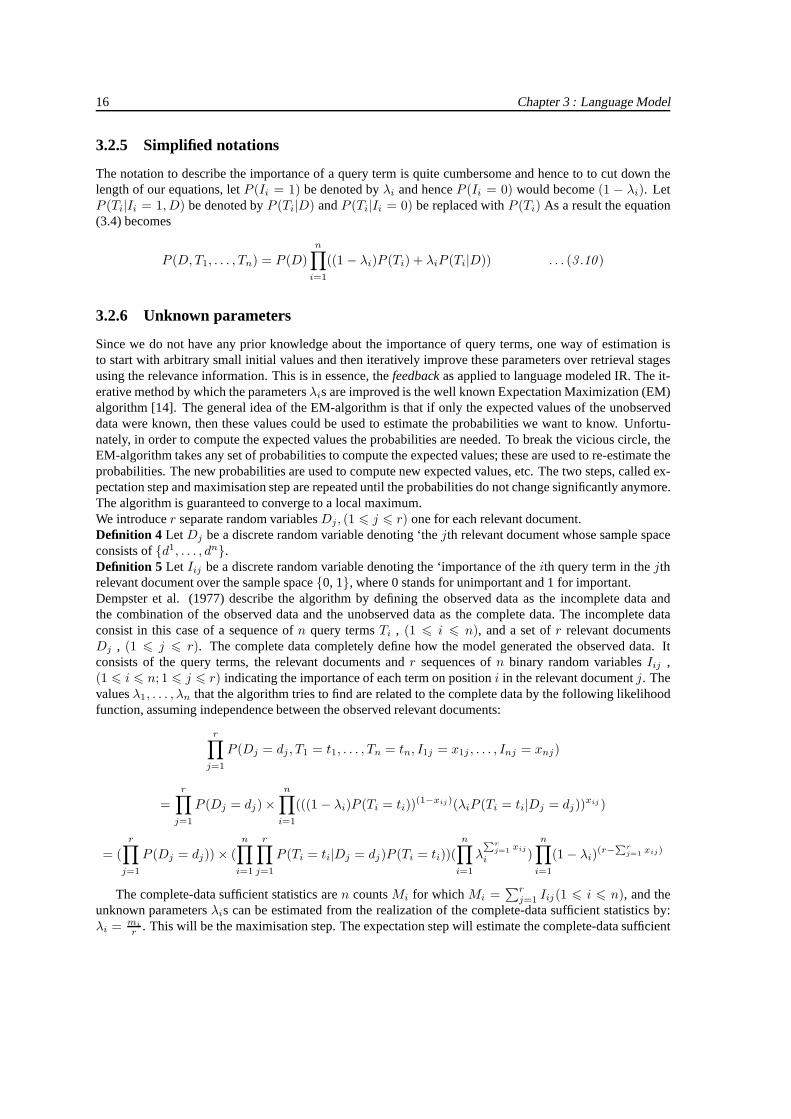
In this experiment we assign equal importance to all query terms i.e. λi = λ (∀i). We usedλ = 0.15,λ = 0.35 andλ = 0.55 for our adhoc runs. For the term weighting, we used both the scoring formulaethat use document frequencies i.e. equations (3.13) and (3.14). We compared our results with the most wellknown, and best performing term weighting scheme of the vector space model - Lnu.ltu (please refer to
22 Chapter 4 : Experimental results
MAPλ cf augmented cf df augmented df
0.10 0.4105 0.3702 0.4323 0.40550.15 0.4147 0.3866 0.4356 0.42000.20 0.4180 0.3967 0.4361 0.42420.25 0.4186 0.4023 0.4352 0.42770.30 0.4184 0.4067 0.4333 0.42930.35 0.4174 0.4088 0.4325 0.42880.40 0.4171 0.4105 0.4308 0.42840.45 0.4156 0.4104 0.4293 0.42860.50 0.4154 0.4109 0.4278 0.42700.55 0.4136 0.4089 0.4261 0.42420.60 0.4123 0.4068 0.4248 0.42280.65 0.4103 0.4058 0.4244 0.42100.70 0.4073 0.4040 0.4223 0.41750.75 0.4059 0.4025 0.4180 0.41490.80 0.4030 0.3987 0.4149 0.41170.85 0.3980 0.3953 0.4092 0.40750.90 0.3917 0.3886 0.4021 0.40080.95 0.3824 0.3802 0.3917 0.3915
Table 4.2: Results of our LM implementation on Cranfield collection
table 2.2.1).The results are reported in table 4.3. The most important observation of the experiment is that the LMweighting scheme has outperformed theLnu.ltu term weighting scheme leading to the empirical verificationof the superiority of LM. We note that the best result is obtained foraugmented df score. Recall-precisionplot for this experiment is shown in fig. 4.4.
We perform another set of experiments withaugmented df scores but this time we work with differentλ values. Table 4.3 reports our observations and note how the interpolated precision values, Mean AveragePrecision and the R-precision values change with theλ values. The observed results suggest that the perfor-mance of the system is poor for too low values ofλ. From there the MAP value increases monotonically andreaches a maximum at values close to 0.35. From there on the MAP values steadily decrease asλ increases.This behavior is true for both the Cranfield and the TREC-8 collections.
4.3.1 Comparative evaluation with TERRIER
TERRIER, developed at the University of Glasgow, is anotheropen source IR engine which has implemen-tation of LM within its framework. This experiment was done to compare the retrieval performances of ourimplementation with that of TERRIER. The observations are listed in table 4.3.1
4.4 : Scope of future experiments 23
Figure 4.3: Average precision vs.λ values on Cranfield
Figure 4.4: Recall vs. MAP values on TREC-8
4.4 Scope of future experiments
This section suggests a few future experiments which can be done to provide further insights into the system’sbehavior or to further improve its overall performance.
24 Chapter 4 : Experimental results
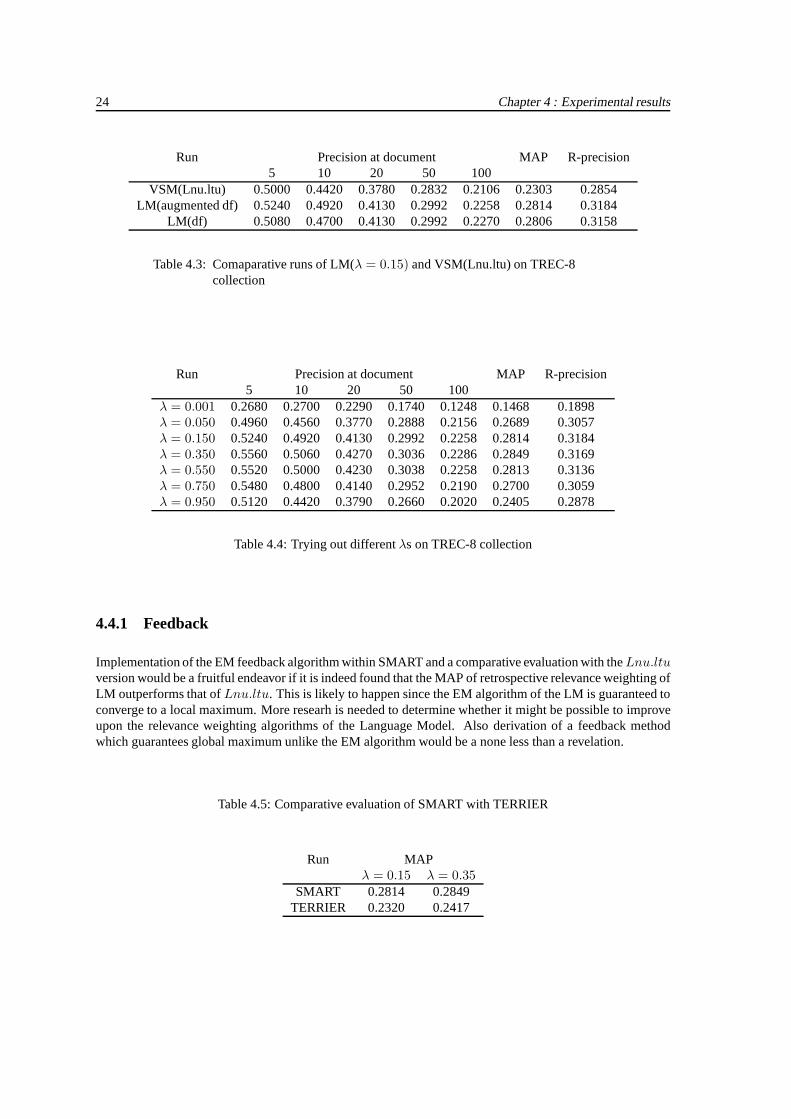
Run Precision at document MAP R-precision5 10 20 50 100
VSM(Lnu.ltu) 0.5000 0.4420 0.3780 0.2832 0.2106 0.2303 0.2854LM(augmented df) 0.5240 0.4920 0.4130 0.2992 0.2258 0.28140.3184
LM(df) 0.5080 0.4700 0.4130 0.2992 0.2270 0.2806 0.3158
Table 4.3: Comaparative runs of LM(λ = 0.15) and VSM(Lnu.ltu) on TREC-8collection
Run Precision at document MAP R-precision5 10 20 50 100
λ = 0.001 0.2680 0.2700 0.2290 0.1740 0.1248 0.1468 0.1898λ = 0.050 0.4960 0.4560 0.3770 0.2888 0.2156 0.2689 0.3057λ = 0.150 0.5240 0.4920 0.4130 0.2992 0.2258 0.2814 0.3184λ = 0.350 0.5560 0.5060 0.4270 0.3036 0.2286 0.2849 0.3169λ = 0.550 0.5520 0.5000 0.4230 0.3038 0.2258 0.2813 0.3136λ = 0.750 0.5480 0.4800 0.4140 0.2952 0.2190 0.2700 0.3059λ = 0.950 0.5120 0.4420 0.3790 0.2660 0.2020 0.2405 0.2878
Table 4.4: Trying out differentλs on TREC-8 collection
4.4.1 Feedback
Implementation of the EM feedback algorithm within SMART and a comparative evaluation with theLnu.ltu
version would be a fruitful endeavor if it is indeed found that the MAP of retrospective relevance weighting ofLM outperforms that ofLnu.ltu. This is likely to happen since the EM algorithm of the LM is guaranteed toconverge to a local maximum. More researh is needed to determine whether it might be possible to improveupon the relevance weighting algorithms of the Language Model. Also derivation of a feedback methodwhich guarantees global maximum unlike the EM algorithm would be a none less than a revelation.
Table 4.5: Comparative evaluation of SMART with TERRIER
Run MAPλ = 0.15 λ = 0.35
SMART 0.2814 0.2849TERRIER 0.2320 0.2417
4.4 : Scope of future experiments 25
4.4.2 Choice of initial parameters
Instead of arbitrarily initializing all theλs to a constant value, some insight in choosing them may be quitehelpful. Sinceλi semantically represents the ‘query term importance’, utilizing the idf factors of the queryterms to choose the lambdas would be an intuitive approach. We propose to chooseλi = λ× idf(ti). We areyet to verify empirically whether our proposed approach improves the MAP value for the adhoc run.
Chapter 5
Conclusions
THIS DISSERTATION has provided a short survey of the vector space and the language models forInformation Retrieval. A short introduction to the open source system SMART has been given.Through a series of experiments the superiority of the language model over the vector space model
has been empirically established. The results as reported in table 4.3 are quite encouraging because the MAPvalues have improved further as compared to those reported by Hiemstra[2]. Our implementation has alsoout-performed the TERRIER implementation of language modeling. We have plans of testing the baselineadhoc language model retrieval on a few other collections like ‘Wikipedia’ and a Bengali1 language testcollection that has been developed for the ‘Forum for Information Retrieval Evaluation’ (FIRE) workshop.Further experiments like incorporating feedback within LM, providing a judicious choice of the initial queryterm importance with the extended SMART system may be explored in future.To summarize the contributions, we can say that this thesis has opened up a new avenue for a comparativeevaluation of the new LM and the classical VSM approaches of IR on equal footings on benchmark testcollections. This thesis has also investigated the effectsof variations of the query term importance parametersand reported that the optimal term importance for the TREC-8collections is within a small range around 0.35.
1The author’s native language
26
Bibliography
[1] Gerard Salton editor,The SMART retrieval system - Experiments in Automatic Document Retrieval,Prentice-Hall, Englewood Cliffs, NJ, 1971.
[2] Djoerd Hiemstra,Using Language Models for Information Retrieval, Ph.D. thesis, Center of Telematicsand Information Technology, AE Enschede The Netherlands, 2000.
[3] C. N. Mooers, “Information Retrieval viewed as temporalsignalling,” 1950, Proceedings of the Inter-national Congress of Mathematicians.
[4] P. Savino and F. Sebastiani, “Essential bibliography onmultimedia information retrieval, categorizationand filtering,” 1998, In slides of the 2nd Europen Digital Libraries Conference Tutorial on MultimediaInformation Retrieval.
[5] W.B. Croft, “Knowledge based and statistical approaches to text retrieval,” IEEE Expert 8(2), 8-12,1993.
[6] Smart, “ftp://ftp.cs.cornell.edu/pub/smart,” .
[7] S. E. Robertson and S. Walker, “Okapi, Keenbow at TREC-8,” 2000, Eigth Text Retrieval Conference(TREC-8).
[8] J. B. Lovins, “Development of a stemming algorithm,”Mechanical translations and ComputationalLinguistics, vol. 11, pp. 22–31, 1993.
[9] M. F. Porter, “An algorithm for suffix stripping,”Program 14, pp. 130–137, 1980.
[10] (TERabyte RetRIEveR) TERRIER, “http://ir.dcs.gla.ac.uk/terrier/,” .
[11] Amit Singhal,Term weighting revisited, Ph.D. thesis, Cornell University, USA, 1997.
[12] C.S. Yang Gerard Salton, A. Wong, “A vector space model for Information Retrieval,”Journal of theAmerican Society of Information Science, pp. 613–620, 1975.
[13] J. M. Ponte and W. B. Croft, “A language modeling approach to information retrieval,” 1998, 21st ACMConference on Research and Development in Information Retrieval (SIGIR98).
[14] N. M. Laird A. P. Dempster and D. B. Rubin, “Maximum likelihood from incomplete data via theEM-algorithm plus discussions on the paper,”Journal of the Royal Statistical Society 39 (B), pp. 1–38,1977.
27