Embed Size (px)
Citation preview
Approved May 25, 2016
Implementation Plan for Two Total Maximum Daily Loads for Indicator Bacteria in the Tidal Segments of the Mission and Aransas Rivers Segments 2001 and 2003 Assessment Units 2001_01 and 2003_01
Produced by the Mission and Aransas Rivers TMDL Stakeholders
In cooperat ion with the Texas Water Resources Inst itute and the TMDL Team, Water Quality Planning Division, Texas Commission on Environmental Quality
Implementation Plan for Two TMDLs for Indicator Bacteria in the Mission and Aransas Rivers
Mission and Aransas Rivers TMDL Stakeholders ii Approved May 25, 2016
Distributed by the
Total Maximum Daily Load Team Texas Commission on Environmental Quality
MC-203 P.O. Box 13087
Austin, Texas 78711-3087 E-mail: [email protected]
TMDL implementation plans are also available on the TCEQ website at:
<www.tceq.texas.gov/waterquality/tmdl/>
The preparation of this report was financed in part through grants from the U.S. Environmental Protection Agency.
This plan is based in part on technical reports prepared for the TCEQ by the
Texas Institute for Applied Environmental Research (TIAER), on the recommendations of the three stakeholder groups organized by the
Texas Water Resources Institute (TWRI).
Agencies that participated in the development of this document include:
Texas A&M AgriLife Extension Service Texas A&M AgriLife Research
Texas Commission on Environmental Quality Texas Parks and Wildlife Department
USDA Natural Resources Conservation Service Texas State Soil and Water Conservation Board Bee Soil and Water Conservation District #344
Goliad Soil and Water Conservation District # 352 San Patricio Soil and Water Conservation District # 324 Copano Bay Soil and Water Conservation District #329
Coastal Bend Bays and Estuaries Program Nueces River Authority
In compliance with the Americans with Disabilities Act, this document may be requested in alternate formats by contacting the TCEQ at
512/239-0028, Fax 239-4488, or 1-800-RELAY-TX (TDD), or by writing P.O. Box 13087, Austin, TX 78711-3087.
Implementation Plan for Two TMDLs for Indicator Bacteria in the Mission and Aransas Rivers
Mission and Aransas Rivers TMDL Stakeholders iii Approved May 25, 2016
Contents Executive Summary ................................................................................................................................ 1 Introduction ........................................................................................................................................... 2 Watershed Overview .............................................................................................................................. 3 Summary of TMDLs ............................................................................................................................ 10
Pollutant Sources and Loads .......................................................................................................... 11 Waste Load Allocation ....................................................................................................... 11 Load Allocation (LA) .......................................................................................................... 15 Allowance for Future Growth (FG) .................................................................................. 16
Total Maximum Daily Load ........................................................................................................... 18 Implementation Strategy .................................................................................................................... 18
Adaptive Implementation .............................................................................................................. 19 Activities and Milestones ............................................................................................................... 20
Management Measures and Control Actions ..................................................................................... 20 Management Measures .................................................................................................................. 20 Control Actions ............................................................................................................................... 20 Management Measure 1 ..................................................................................................................21
Description .........................................................................................................................21 Education Component .......................................................................................................21 Priority Areas .................................................................................................................... 22 Responsible Parties and Funding .................................................................................... 22 Measurable Milestones ......................................................................................................31 Implementation Schedule .................................................................................................31 Estimated Loading Reductions ........................................................................................ 32
Management Measure 2................................................................................................................. 34 Description ........................................................................................................................ 34 Education Component ...................................................................................................... 35 Priority Areas .................................................................................................................... 35 Responsible Parties and Funding .................................................................................... 35 Measurable Milestones ..................................................................................................... 36 Implementation Schedule ................................................................................................ 37 Estimated Loading Reductions ........................................................................................ 38
Management Measure 3 ................................................................................................................. 40 Description ........................................................................................................................ 40 Education Component ...................................................................................................... 41 Priority Areas .................................................................................................................... 41 Responsible Parties and Funding .................................................................................... 41 Measureable Milestones ................................................................................................... 43 Implementation Schedule ................................................................................................ 44 Estimated Loading Reductions ........................................................................................ 45
Management Measure 4................................................................................................................. 47 Description ........................................................................................................................ 47 Education Component ...................................................................................................... 48 Priority Areas .................................................................................................................... 48 Responsible Parties and Funding .................................................................................... 48 Measureable Milestones ................................................................................................... 50 Implementation Schedule ................................................................................................ 50 Estimated Loading Reductions ......................................................................................... 51
Implementation Plan for Two TMDLs for Indicator Bacteria in the Mission and Aransas Rivers
Mission and Aransas Rivers TMDL Stakeholders iv Approved May 25, 2016
Management Measure 5 ................................................................................................................. 53 Description ........................................................................................................................ 53 Educational Component ................................................................................................... 54 Priority Areas .................................................................................................................... 54 Responsible Parties and Funding .................................................................................... 54 Measurable Milestones ..................................................................................................... 57 Implementation Schedule ................................................................................................ 57 Estimated Loading Reductions ........................................................................................ 58
Management Measure 6................................................................................................................. 60 Description ........................................................................................................................ 60 Educational Component ................................................................................................... 60 Priority Areas .................................................................................................................... 61 Responsible Parties and Funding .................................................................................... 61 Measurable Milestones ..................................................................................................... 63 Implementation Schedule ................................................................................................ 63 Estimated Loading Reductions ........................................................................................ 64
Management Measure 7 ................................................................................................................. 66 Description ........................................................................................................................ 66 Education Component ...................................................................................................... 66 Priority Areas .................................................................................................................... 67 Responsible Parties and Funding .................................................................................... 67 Measureable Milestones ................................................................................................... 68 Implementation Schedule ................................................................................................ 68 Estimated Loading Reductions ........................................................................................ 69
Management Measure 8 ................................................................................................................. 71 Description ......................................................................................................................... 71 Education Component ....................................................................................................... 71 Priority Areas ..................................................................................................................... 71 Responsible Parties and Funding .................................................................................... 72 Measureable Milestones ................................................................................................... 73 Implementation Schedule ................................................................................................ 73 Estimated Loading Reductions ........................................................................................ 73
Management Measure 9................................................................................................................. 76 Description ........................................................................................................................ 76 Education Component ...................................................................................................... 77 Priority Areas .................................................................................................................... 77 Responsible Parties and Funding .................................................................................... 78 Measureable Milestones ................................................................................................... 79 Implementation Schedule ................................................................................................ 79 Estimated Loading Reductions ........................................................................................ 80
Control Action 1 .............................................................................................................................. 82 Description ........................................................................................................................ 82 Education Component ...................................................................................................... 83 Priority Areas .................................................................................................................... 83 Responsible Parties ........................................................................................................... 83 Measurable Milestones ..................................................................................................... 85 Implementation Schedule ................................................................................................ 86 Estimated Loading Reductions ........................................................................................ 86
Implementation Plan for Two TMDLs for Indicator Bacteria in the Mission and Aransas Rivers
Mission and Aransas Rivers TMDL Stakeholders v Approved May 25, 2016
Control Action 2 ............................................................................................................................. 88
Description ........................................................................................................................ 88 Education Component ...................................................................................................... 88 Priority Areas .................................................................................................................... 88 Responsible Parties and Funding .................................................................................... 89 Measureable Milestones ................................................................................................... 90 Implementation Schedule ................................................................................................ 91 Estimated Loading Reductions ........................................................................................ 91
Sustainability ....................................................................................................................................... 93 Water Quality Indicators ..................................................................................................................... 93 Implementation Milestones ................................................................................................................ 94 Communication Strategy ..................................................................................................................... 94 References ............................................................................................................................................ 95 Appendix A. I-Plan Matrix and Schedule .......................................................................................... 96 Appendix B. Load Reduction Estimates .......................................................................................... 107
Implementation Plan for Two TMDLs for Indicator Bacteria in the Mission and Aransas Rivers
Mission and Aransas Rivers TMDL Stakeholders vi Approved May 25, 2016
Figures Figure 1. Boundaries for the Mission and Aransas River Watersheds ....................................... 5 Figure 2. 2006 land use/land cover within the watersheds of the Mission and Aransas
Rivers. ............................................................................................................................. 7 Figure 3. Map of the Mission River and Aransas River watersheds showing the location of
WWTFs, TCEQ surface water quality monitoring stations, and USGS stream gage stations. .......................................................................................................................... 8
Figure 4. Numbered subwatersheds for the Mission River and Aransas River Watersheds... 19
Tables Table 1. NLCD Land Use Classification and Acreage for the Mission River and Aransas River
Watersheds ..................................................................................................................... 6 Table 2. Municipal Wastewater Dischargers into the Mission River and Aransas River
Watersheds ..................................................................................................................... 9 Table 3. Water Quality Monitoring Results Used for the 2012 Integrated Report ................ 10 Table 4. Summary of TMDLs and Load Allocations for the Mission River and Aransas River
Watersheds .................................................................................................................... 11 Table 5. Waste Load Allocations for TPDES-Regulated Facilities (WLAWWTF) in the
Mission and Aransas River Watersheds ......................................................................13 Table 6. Stormwater General Permit Areas and Calculation of the FDASWP Term for the
Mission and Aransas Rivers. ....................................................................................... 14 Table 7. WLASW Calculations for the Mission and Aransas Rivers. ......................................... 15 Table 8. WLA Calculations for the Mission and Aransas Rivers. ............................................. 15 Table 9. LA Calculations for the Mission and Aransas Rivers. ................................................ 16 Table 10. FG Calculations for the Mission and Aransas Rivers. ................................................. 17 Table 11. TMDL Allocation Summary for the Mission and Aransas River Watersheds. ......... 18 Table 12. Estimated Costs.............................................................................................................31 Table 13. Management Measure 1.0: Develop and Implement Conservation Plans in Priority
Areas of the Watershed ............................................................................................... 33 Table 14. Estimated Costs............................................................................................................ 36 Table 15. Management Measure 2.0: Explore Feasibility of Altering Tax Exemption
Requirements for Small Acreage Landowners ........................................................... 39 Table 16. Estimated Costs............................................................................................................ 43 Table 17. Management Measure 3.0: Promote the Management of and Control Feral Hog
Populations .................................................................................................................. 46 Table 18. Estimated Costs............................................................................................................ 49 Table 19. Management Measure 4.0: Promote the Reduction of Illicit Dumping and Proper
Disposal of Animal Carcasses...................................................................................... 52 Table 20. Estimated Costs............................................................................................................ 56 Table 21. Management Measure 5.0: Identify OSSFs, Prioritize Problem Areas, and
Systematically Work to Bring Failing Systems into Compliance .............................. 59 Table 22. Estimated Costs............................................................................................................ 62 Table 23. Management Measure 6.0: Promote the Improved Quality and Management of
Urban Stormwater ....................................................................................................... 65 Table 24. Estimated Costs............................................................................................................ 68 Table 25. Management Measure 7.0: Coordinate Efforts to Reduce Unauthorized
Discharges .................................................................................................................... 70 Table 26. Management Measure 8.0: Reduce WWTF Contributions by Meeting Half of the
Permitted Bacteria Limit ............................................................................................. 75 Table 27. Estimated Costs............................................................................................................ 79
Implementation Plan for Two TMDLs for Indicator Bacteria in the Mission and Aransas Rivers
Mission and Aransas Rivers TMDL Stakeholders vii Approved May 25, 2016
Table 28. Management Measure 9.0: Coordinate and Expand Existing Water Quality Monitoring in the Watershed ...................................................................................... 81
Table 29. Permitted WWTFs in the Mission and Aransas River Watersheds .......................... 83 Table 30. Estimated Costs............................................................................................................ 85 Table 31. Summary of Control Action 1.0: Monitoring of WWTF Effluent to Ensure Permit
Compliance ................................................................................................................... 87 Table 32. Needed Improvements and Estimated Costs for WWTFs ......................................... 90 Table 33. Summary of Control Action 2.0: Improve and Upgrade WWTFs ............................. 92 Table A-1. Management Measure 1: Implementation Schedule and Tasks Develop and
Implement Conservation Plans in Priority Areas of the Watershed ....................... 97 Table A-2. Management Measure 2: Implementation Schedule and Tasks Explore Feasibility
of Altering Tax Exemption Requirements for Small Acreage Landowners ........... 98 Table A-3. Management Measure 3: Implementation Schedule and Tasks Promote the
Management of and Control Feral Hog Populations ............................................... 99 Table A-4. Management Measure 4: Implementation Schedule and Tasks Promote the
Reduction of Illicit Dumping and Proper Disposal of Animal Carcasses ............. 100 Table A-5. Management Measure 5: Implementation Schedule and Tasks Identify OSSFs,
Prioritize Problem Areas, and Systematically Work to Bring Systems into Compliance ................................................................................................................. 101
Table A-6. Management Measure 6: Implementation Schedule and Tasks Promote the Improved Quality and Management of Urban Stormwater ................................. 102
Table A-7. Management Measure 7: Implementation Schedule and Tasks Coordinate Efforts to Reduce Unauthorized Discharges ........................................................................ 103
Table A-8. Management Measure 8: Implementation Schedule and Tasks Reduce WWTF Contributions by Meeting Half of the Permitted Bacteria Limit ........................... 104
Table A-9. Management Measure 9: Implementation Schedule and Tasks Coordinate and Expand Existing Water Quality Monitoring in the Watershed ............................. 105
Table A-10. Control Acton 1: Implementation Schedule and Tasks Monitoring WWTF Effluent to Ensure Permit Compliance ................................................................................... 106
Table A-11. Control Action 2: Implementation Schedule and Tasks Improve and Upgrade WWTFs ....................................................................................................................... 106
Table B-1. Current permitted and proposed future voluntarily achieved wastewater treatment levels and resulting estimated loadings of Enterococcus in the Aransas and Mission watersheds................................................................................................................... 117
Table B-2 Summary of Implementation and Reductions Calculated for the Five-Year Plan . 120
Implementation Plan for Two TMDLs for Indicator Bacteria in the Mission and Aransas Rivers
Mission and Aransas Rivers TMDL Stakeholders viii Approved May 25, 2016
Abbreviations ACEP Agricultural Conservation Easement Program AU assessment unit BMP best management practice CCN certificates of convenience and necessity cfu colony-forming units CHAMP County Hog Abatement Matching Program CIAP Coastal Impact Assistance Program CIG Conservation Innovation Grants CMP Coastal Management Program CRP Clean Rivers Program CSP Conservation Stewardship Program CWA Clean Water Act CWSRF Clean Water State Revolving Fund CZM Coastal Zone Management Program CZMA Coastal Zone Management Administration E. coli Escherichia coli ECHO Enforcement and Compliance History Online EDAP Economically Distressed Areas Program EQIP Environmental Quality Incentives Program EE Environmental Education EPA Environmental Protection Agency (U.S.) FBMB Farm Business Management and Benchmarking FDA fractional proportion of drainage area FG future growth FOTG Field Office Technical Guide GIS geographic information system I-Plan implementation plan LA load allocation LID Low Impact Development LIP Landowner Incentive Program mL milliliter MGD million gallons per day MOS margin of safety MPN most probable number MS4 municipal separate storm sewer system MUD municipal utility district NIFA National Institute of Food and Agriculture NGO nongovernmental organization NIWQP National Integrated Water Quality Program NLCD National Land Cover Database NOAA National Oceanographic and Atmospheric Administration NPS nonpoint source NRA Nueces River Authority NRCS Natural Resources Conservation Service
Implementation Plan for Two TMDLs for Indicator Bacteria in the Mission and Aransas Rivers
Mission and Aransas Rivers TMDL Stakeholders ix Approved May 25, 2016
OSSF on-site sewage facility PSA public service announcement QAPP Quality Assurance Project Plan RCPP Regional Conservation Partnership Program RUS Rural Utilities Service SARE Sustainable Agriculture Research & Education SSO sanitary sewer overflow SWCD Soil and Water Conservation District TCEQ Texas Commission on Environmental Quality TDA Texas Department of Agriculture TEEX Texas A&M Engineering Extension TMDL total maximum daily load TGLO Texas General Land Office TPDES Texas Pollutant Discharge Elimination System TPWD Texas Parks and Wildlife Department TRWA Texas Rural Water Association TSSWCB Texas State Soil and Water Conservation Board TWDB Texas Water Development Board TWRI Texas Water Resources Institute TWS Texas Wildlife Services USFWS United States Fish and Wildlife Service USDA-CRP U.S. Department of Agriculture Conservation Reserve Program USGS United States Geological Survey WLA Waste Load Allocation WQMP Water Quality Management Plan WWD Water and Waste Disposal WWTF wastewater treatment facility
Mission and Aransas Rivers TMDL Stakeholders 1 For Adoption, May 2016
Implementation Plan for Two Total Maximum Daily Loads
for Indicator Bacteria in the Tidal Segments of the Mission and Aransas Rivers
Executive Summary In 2016, the Texas Commission on Environmental Quality (TCEQ) will consider adoption of Two Total Maximum Daily Loads (TMDLs) for Indicator Bacteria in the Tidal Segments of the Mission and Aransas Rivers (Segments 2001 and 2003).
This implementation plan, or I-Plan:
describes the steps that watershed stakeholders and the TCEQ will take to-ward achieving the pollutant reductions identified in the TMDL report, and
outlines the schedule for implementation activities. The tidally-influenced portions of the Mission and Aransas Rivers, classified by the State of Texas as segments 2001 and 2003, respectively, are included in the state’s list of impaired water bodies (Texas Integrated Report - Texas 303(d) List) for fail-ure to meet their primary contact recreation uses. The ultimate goal of this I-Plan is to restore the primary contact recreation uses in Segments 2001 and 2003 by reducing concentrations of indicator bacteria to levels established in the TMDLs.
The TMDLs for the Mission River Tidal and Aransas River Tidal identified regu-lated sources and unregulated sources of indicator bacteria in the watersheds that could contribute to the water quality impairment. Regulated sources identified in-clude wastewater treatment facilities (three in the Mission River watershed and nine in the Aransas River watershed). Sanitary sewer overflows, dry weather dis-charges, and illicit discharges are a subset of these regulated sources. There are no stormwater Phase I or II municipal separate storm sewer system permits (MS4 permits) in these watersheds.
Unregulated sources that could contribute to the indicator bacteria load entering the Mission and Aransas tidal segments include domestic animals (e.g., dogs, cats, etc.), livestock (e.g., cattle, horses, goats, sheep, etc.) neglected and failing on-site sewage facilities (OSSFs), wildlife and other unmanaged animals (e.g., deer, feral hogs, waterfowl, and other birds). In addition, illicit dumping and unregulated ur-ban stormwater have also been identified as potential contributors.
This I-Plan includes nine management measures and two control actions that will be implemented to reduce indicator bacteria in the watersheds of the Mission and Aransas Rivers. Management measures are related to managing nonpoint sources (unregulated), such as identifying failing OSSFs in the watershed. Control actions
Implementation Plan for Two TMDLs for Indicator Bacteria in the Mission and Aransas Rivers
Mission and Aransas Rivers TMDL Stakeholders 2 Approved May 25, 2016
are related to point sources (regulated discharges), such as monitoring compliance with permit requirements and improving and upgrading domestic wastewater treatment facilities.
Management Measures 1. Develop and Implement Conservation Plans in Priority Areas of the Watershed 2. Explore Feasibility of Altering Tax Exemption Requirements for Small Acreage
Landowners 3. Promote the Management of Feral Hogs and Control Their Populations 4. Promote the Reduction of Illicit Dumping and Proper Disposal of Animal Car-
casses 5. Identify OSSFs, Prioritize OSSF Problem Areas, and Systematically Work to Bring
Failing OSSF Systems into Compliance 6. Promote the Improved Quality and Management of Urban Stormwater 7. Coordinate Efforts to Reduce Unauthorized Discharges 8. Reduce WWTF Contributions by Meeting Half of the Permitted Bacteria Limit 9. Coordinate and Expand Existing Water Quality Monitoring in the Watershed
Control Actions 1. Improve Monitoring of WWTF Effluent to Ensure Permit Compliance 2. Improve and Upgrade WWTFs
For each of the measures and actions, this plan identifies the responsible parties, technical and financial needs, monitoring and outreach efforts, and a schedule of activities. Implementation of the management measures will largely be dependent upon the availability of funding.
The stakeholders and TCEQ will review progress under the TCEQ’s adaptive man-agement process. The plan may be adjusted periodically as a result of progress reviews.
Introduction To keep Texas’ commitment to restore and maintain water quality in impaired riv-ers, lakes, and bays, the TCEQ worked with stakeholders to develop an I-Plan for each adopted TMDL. A TMDL is a technical analysis that:
determines the amount of a particular pollutant that a water body can receive and still meet applicable water quality standards, and
sets limits on categories of sources that will result in achieving standards. This I-Plan is designed to guide activities that will achieve the water quality goals for the watersheds of the Mission and Aransas Rivers as defined in the TMDLs. This I-Plan is a flexible tool that governmental and nongovernmental organiza-tions involved in implementation use to guide their activities to improve water
Implementation Plan for Two TMDLs for Indicator Bacteria in the Mission and Aransas Rivers
Mission and Aransas Rivers TMDL Stakeholders 3 Approved May 25, 2016
quality. The participating partners may accomplish the activities described in the plan through rule, order, guidance, or other appropriate formal or informal action.
This I-Plan contains the following components:
1) A description of control actions and management measures1 that will be im-plemented to achieve the water quality target.
2) A schedule for implementing activities (Appendix A).
3) The legal authority under which the participating agencies may require imple-mentation of the control actions.
4) A follow-up tracking and monitoring plan to determine the effectiveness of the control actions and management measures undertaken.
5) Identification of measurable outcomes and other considerations the TCEQ and stakeholders will use to determine whether the I-Plan has been properly executed, water quality standards are being achieved, or the plan needs to be modified.
6) Identification of the communication strategies the TCEQ will use to dissemi-nate information to stakeholders.
7) A review strategy that stakeholders will use to periodically review and revise the plan to ensure there is continued progress in improving water quality.
This plan also includes possible causes and sources of the impairment, manage-ment measure descriptions, estimated potential load reductions, technical and financial assistance needed, educational components for each measure, schedule of implementation, measurable milestones, indicators to measure progress, mon-itoring components, and responsible entities, as outlined in the Nonpoint Source Program Grants Guidelines for States and Territories (EPA, 2003). Conse-quently, projects developed to implement nonpoint source (unregulated) elements of this plan that also meet the grant program conditions may be eligible for funding under the EPA’s Clean Water Act (CWA) Section 319(h) incremental grant pro-gram.
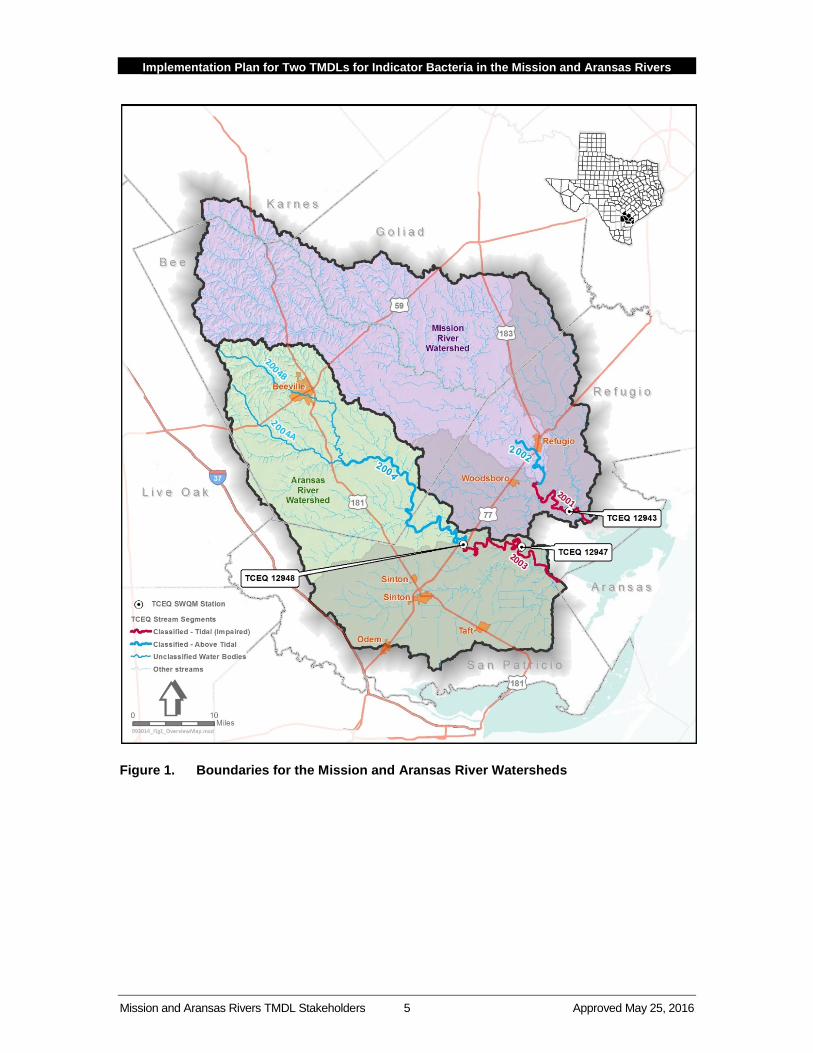
Watershed Overview Figure 1 shows the location of the Mission and Aransas Rivers as well their water-sheds and the portions of the rivers considered to be tidally influenced.
1 Control actions refer to regulated sources reduction strategies, generally TPDES permits. Man-agement measures refer to strategies for reducing unregulated pollutants, generally through voluntary best management practices (BMPs).
Implementation Plan for Two TMDLs for Indicator Bacteria in the Mission and Aransas Rivers
Mission and Aransas Rivers TMDL Stakeholders 4 Approved May 25, 2016
The tidal segments of both the Mission and Aransas Rivers lie within the Copano Bay watershed, which encompasses nearly all of the San Antonio – Nueces Coastal Basin, and are classified by the State of Texas as segments 2001 and 2003, respec-tively. These water bodies are the primary sources of freshwater for Copano Bay, provide habitat for a wide variety of aquatic, terrestrial, and avian species (includ-ing the endangered Whooping Crane), and are a prime area for many types of contact recreation. Regulated dischargers consist of three wastewater treatment facilities (WWTFs) in the Mission River watershed and nine WWTFs in the Aransas River watershed.
The Mission River watershed begins in southern Karnes County and northeastern Bee County and it includes major portions of Bee, Goliad, and Refugio Counties. On the southern and western region of the watershed, the topographic boundary extends from north of Beeville, northeast of Skidmore, and south of Woodsboro. The primary urban areas of this watershed are Woodsboro and Refugio. Major trib-utaries include Medio Creek, Blanco Creek, and Melon Creek. Figure 1 displays the boundaries of the Mission River Watershed.
The Aransas River originates southeast of the City of Beeville, flows due east and then south to southern Bee County and continues southeast forming the boundary between San Patricio and Refugio Counties until it reaches Copano Bay near the city of Bayside. Urban areas in the Aransas River watershed include Beeville, Tynan, Skidmore, St. Paul, Sinton, Taft, and a small portion of Odem. Major trib-utaries for the Aransas River are Aransas Creek, Poesta Creek, Papalote Creek, and Chiltipin Creek. Figure 1 displays the boundaries of the Aransas River watershed.
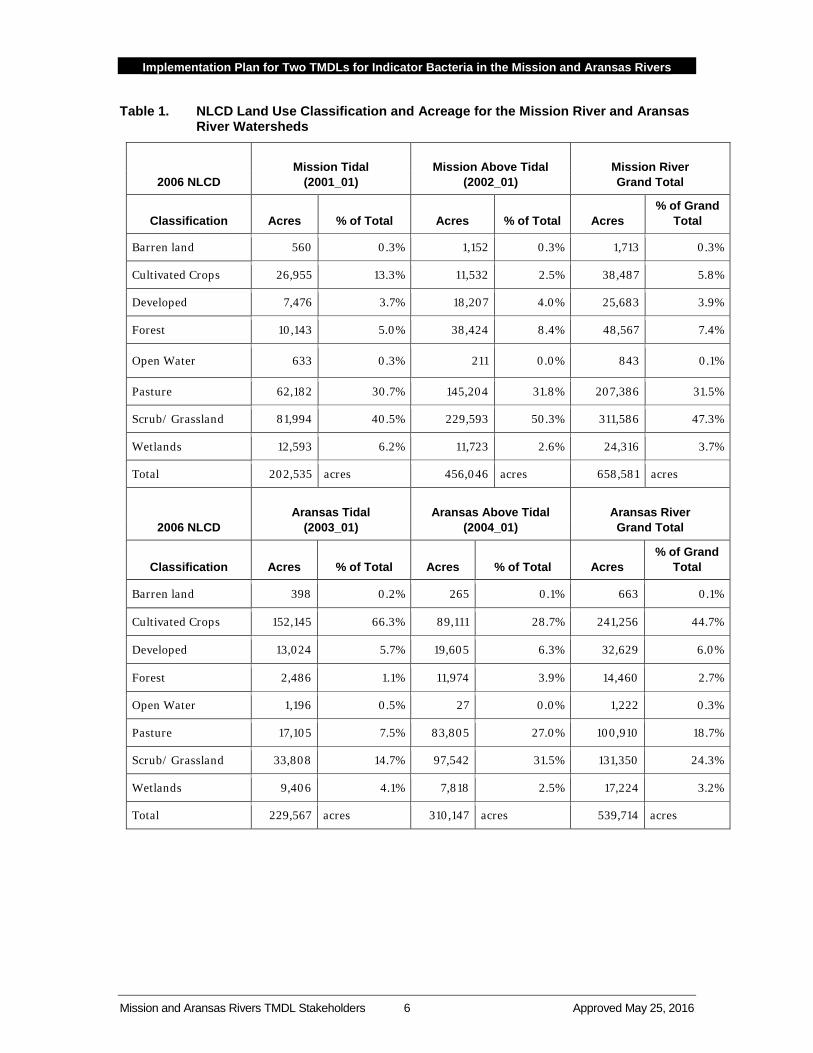
Land uses in the two TMDL watersheds are shown in Table 1. A description of each National Land Cover Database (NLCD) land use classification can be found at the following U.S. Department of the Interior website: <www.mrlc.gov/nlcd06_leg.php>.
Implementation Plan for Two TMDLs for Indicator Bacteria in the Mission and Aransas Rivers
Mission and Aransas Rivers TMDL Stakeholders 5 Approved May 25, 2016
Figure 1. Boundaries for the Mission and Aransas River Watersheds
Implementation Plan for Two TMDLs for Indicator Bacteria in the Mission and Aransas Rivers
Mission and Aransas Rivers TMDL Stakeholders 6 Approved May 25, 2016
Table 1. NLCD Land Use Classification and Acreage for the Mission River and Aransas River Watersheds
2006 NLCD Mission Tidal
(2001_01) Mission Above Tidal
(2002_01) Mission River Grand Total
Classification Acres % of Total Acres % of Total Acres % of Grand
Total
Barren land 560 0.3% 1,152 0.3% 1,713 0.3%
Cultivated Crops 26,955 13.3% 11,532 2.5% 38,487 5.8%
Developed 7,476 3.7% 18,207 4.0% 25,683 3.9%
Forest 10,143 5.0% 38,424 8.4% 48,567 7.4%
Open Water 633 0.3% 211 0.0% 843 0.1%
Pasture 62,182 30.7% 145,204 31.8% 207,386 31.5%
Scrub/ Grassland 81,994 40.5% 229,593 50.3% 311,586 47.3%
Wetlands 12,593 6.2% 11,723 2.6% 24,316 3.7%
Total 202,535 acres 456,046 acres 658,581 acres
2006 NLCD Aransas Tidal
(2003_01) Aransas Above Tidal
(2004_01) Aransas River Grand Total
Classification Acres % of Total Acres % of Total Acres % of Grand
Total
Barren land 398 0.2% 265 0.1% 663 0.1%
Cultivated Crops 152,145 66.3% 89,111 28.7% 241,256 44.7%
Developed 13,024 5.7% 19,605 6.3% 32,629 6.0%
Forest 2,486 1.1% 11,974 3.9% 14,460 2.7%
Open Water 1,196 0.5% 27 0.0% 1,222 0.3%
Pasture 17,105 7.5% 83,805 27.0% 100,910 18.7%
Scrub/ Grassland 33,808 14.7% 97,542 31.5% 131,350 24.3%
Wetlands 9,406 4.1% 7,818 2.5% 17,224 3.2%
Total 229,567 acres 310,147 acres 539,714 acres
Implementation Plan for Two TMDLs for Indicator Bacteria in the Mission and Aransas Rivers
Mission and Aransas Rivers TMDL Stakeholders 7 Approved May 25, 2016
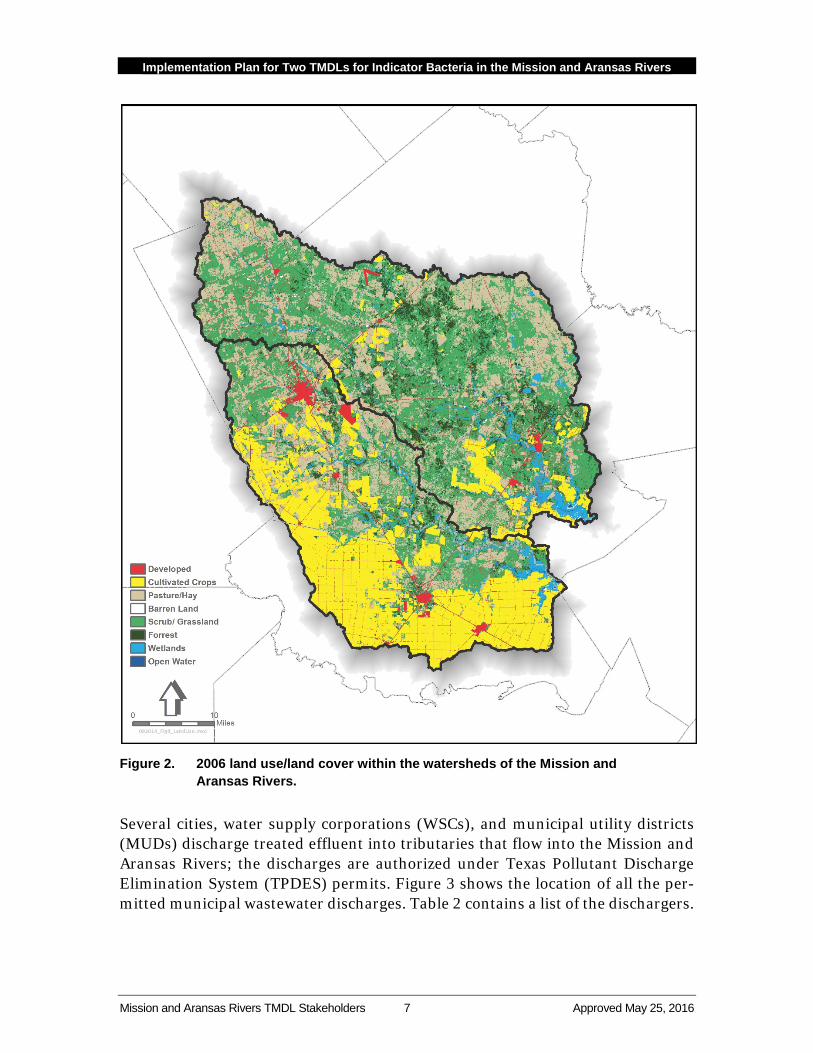
Figure 2. 2006 land use/land cover within the watersheds of the Mission and
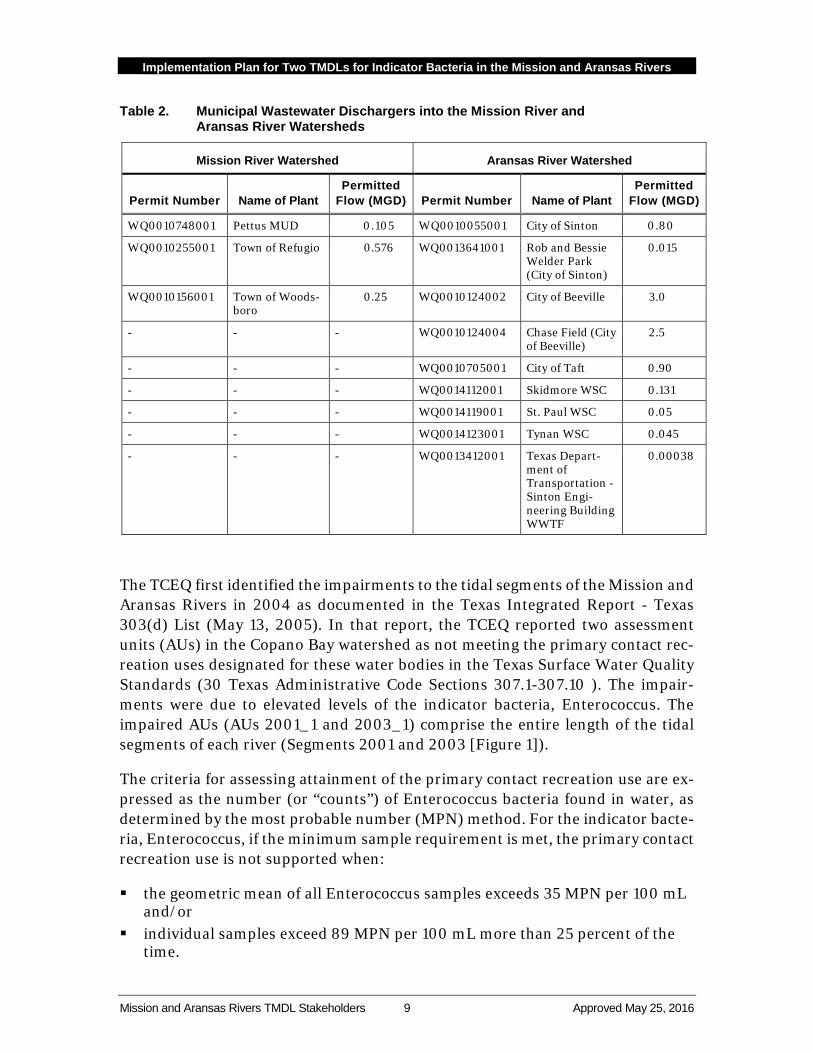
Aransas Rivers. Several cities, water supply corporations (WSCs), and municipal utility districts (MUDs) discharge treated effluent into tributaries that flow into the Mission and Aransas Rivers; the discharges are authorized under Texas Pollutant Discharge Elimination System (TPDES) permits. Figure 3 shows the location of all the per-mitted municipal wastewater discharges. Table 2 contains a list of the dischargers.
Implementation Plan for Two TMDLs for Indicator Bacteria in the Mission and Aransas Rivers
Mission and Aransas Rivers TMDL Stakeholders 8 Approved May 25, 2016
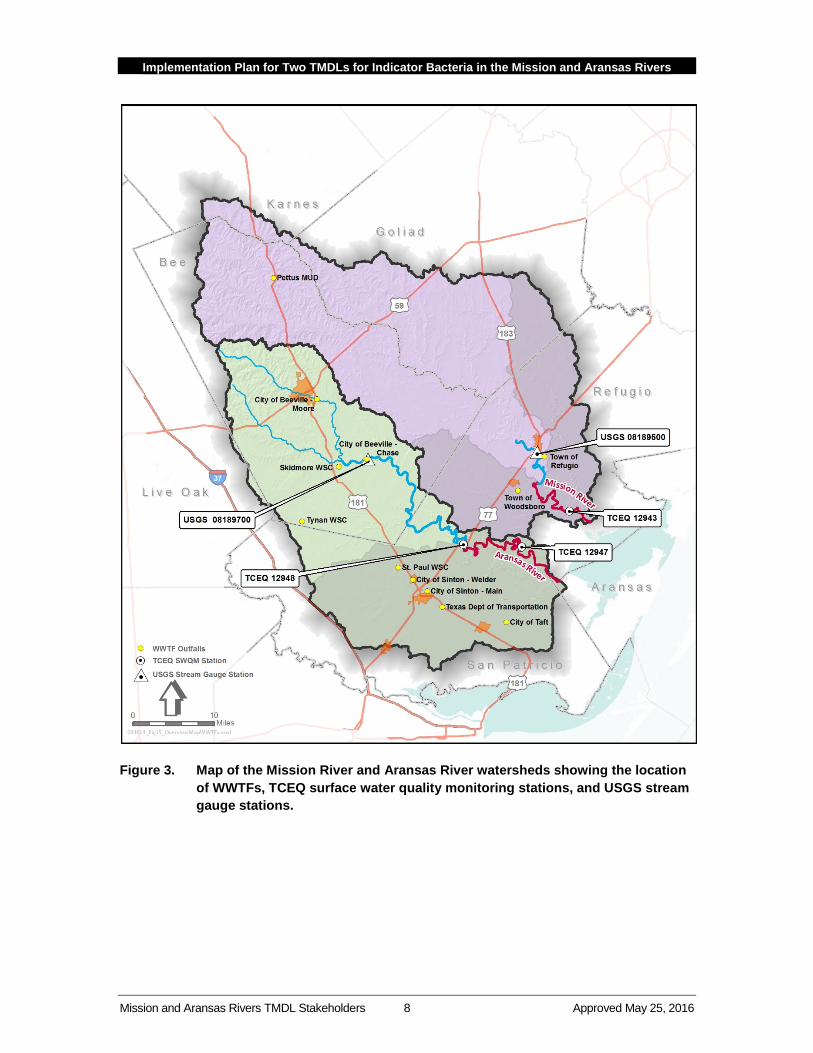
Figure 3. Map of the Mission River and Aransas River watersheds showing the location of WWTFs, TCEQ surface water quality monitoring stations, and USGS stream gauge stations.
Implementation Plan for Two TMDLs for Indicator Bacteria in the Mission and Aransas Rivers
Mission and Aransas Rivers TMDL Stakeholders 9 Approved May 25, 2016
Table 2. Municipal Wastewater Dischargers into the Mission River and Aransas River Watersheds
Mission River Watershed Aransas River Watershed
Permit Number Name of Plant Permitted
Flow (MGD) Permit Number Name of Plant Permitted
Flow (MGD)
WQ0010748001 Pettus MUD 0.105 WQ0010055001 City of Sinton 0.80
WQ0010255001 Town of Refugio 0.576 WQ0013641001 Rob and Bessie Welder Park (City of Sinton)
0.015
WQ0010156001 Town of Woods-boro
0.25 WQ0010124002 City of Beeville 3.0
- - - WQ0010124004 Chase Field (City of Beeville)
2.5
- - - WQ0010705001 City of Taft 0.90
- - - WQ0014112001 Skidmore WSC 0.131
- - - WQ0014119001 St. Paul WSC 0.05
- - - WQ0014123001 Tynan WSC 0.045
- - - WQ0013412001 Texas Depart-ment of Transportation - Sinton Engi-neering Building WWTF
0.00038
The TCEQ first identified the impairments to the tidal segments of the Mission and Aransas Rivers in 2004 as documented in the Texas Integrated Report - Texas 303(d) List (May 13, 2005). In that report, the TCEQ reported two assessment units (AUs) in the Copano Bay watershed as not meeting the primary contact rec-reation uses designated for these water bodies in the Texas Surface Water Quality Standards (30 Texas Administrative Code Sections 307.1-307.10 ). The impair-ments were due to elevated levels of the indicator bacteria, Enterococcus. The impaired AUs (AUs 2001_1 and 2003_1) comprise the entire length of the tidal segments of each river (Segments 2001 and 2003 [Figure 1]).
The criteria for assessing attainment of the primary contact recreation use are ex-pressed as the number (or “counts”) of Enterococcus bacteria found in water, as determined by the most probable number (MPN) method. For the indicator bacte-ria, Enterococcus, if the minimum sample requirement is met, the primary contact recreation use is not supported when:
the geometric mean of all Enterococcus samples exceeds 35 MPN per 100 mL and/or
individual samples exceed 89 MPN per 100 mL more than 25 percent of the time.
Implementation Plan for Two TMDLs for Indicator Bacteria in the Mission and Aransas Rivers
Mission and Aransas Rivers TMDL Stakeholders 10 Approved May 25, 2016
Ambient water sampling for the Mission and Aransas River TMDLs consisted of routine, quarterly water-quality monitoring conducted between 2003 and 2010 by the Nueces River Authority (NRA) through the TCEQ’s Clean Rivers Program (CRP). Also, the NRA conducted a special study from October 2007 through Jan-uary 2011 that collected additional data. The geometric mean concentration of Enterococcus exceeded the criterion of 35 MPN/100 mL during the time period used for the 2010 Texas Integrated Report and 303(d) List assessment. No addi-tional monitoring was conducted as part of the TMDL development process beyond this monitoring.
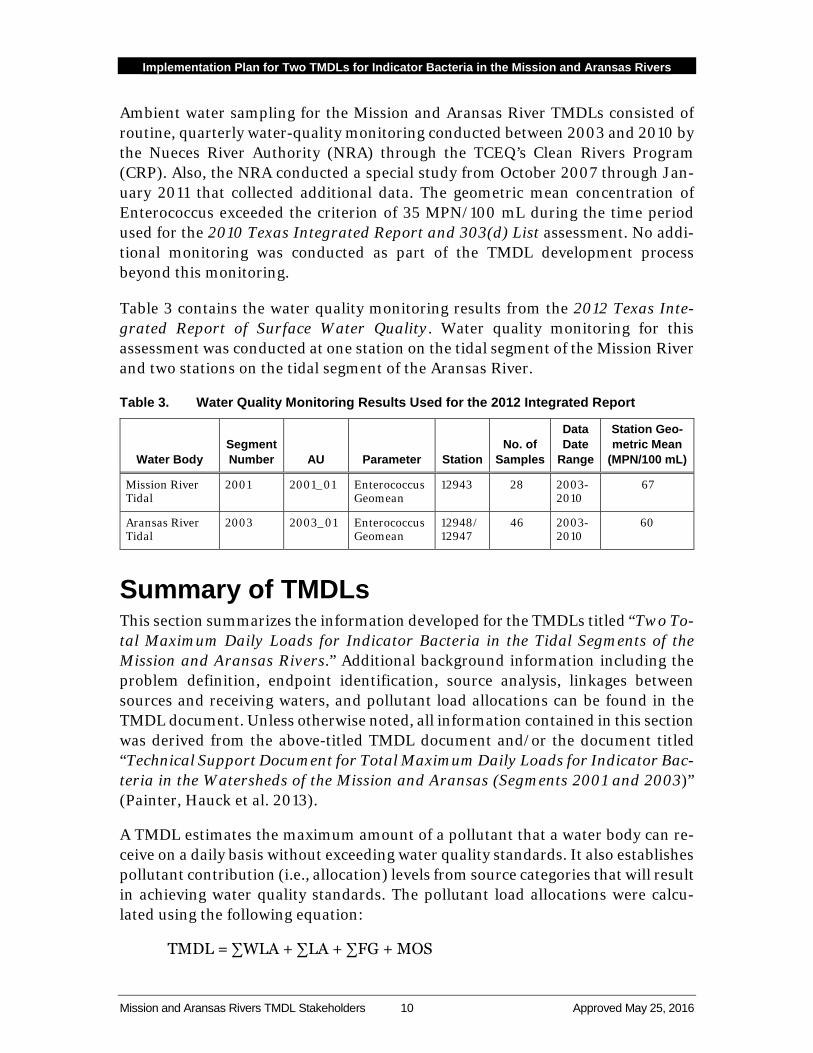
Table 3 contains the water quality monitoring results from the 2012 Texas Inte-grated Report of Surface Water Quality. Water quality monitoring for this assessment was conducted at one station on the tidal segment of the Mission River and two stations on the tidal segment of the Aransas River.
Table 3. Water Quality Monitoring Results Used for the 2012 Integrated Report
Water Body Segment Number AU Parameter Station
No. of Samples
Data Date
Range
Station Geo-metric Mean
(MPN/100 mL)
Mission River Tidal
2001 2001_01 Enterococcus Geomean
12943 28 2003-2010
67
Aransas River Tidal
2003 2003_01 Enterococcus Geomean
12948/ 12947
46 2003-2010
60
Summary of TMDLs This section summarizes the information developed for the TMDLs titled “Two To-tal Maximum Daily Loads for Indicator Bacteria in the Tidal Segments of the Mission and Aransas Rivers.” Additional background information including the problem definition, endpoint identification, source analysis, linkages between sources and receiving waters, and pollutant load allocations can be found in the TMDL document. Unless otherwise noted, all information contained in this section was derived from the above-titled TMDL document and/or the document titled “Technical Support Document for Total Maximum Daily Loads for Indicator Bac-teria in the Watersheds of the Mission and Aransas (Segments 2001 and 2003)” (Painter, Hauck et al. 2013).
A TMDL estimates the maximum amount of a pollutant that a water body can re-ceive on a daily basis without exceeding water quality standards. It also establishes pollutant contribution (i.e., allocation) levels from source categories that will result in achieving water quality standards. The pollutant load allocations were calcu-lated using the following equation:
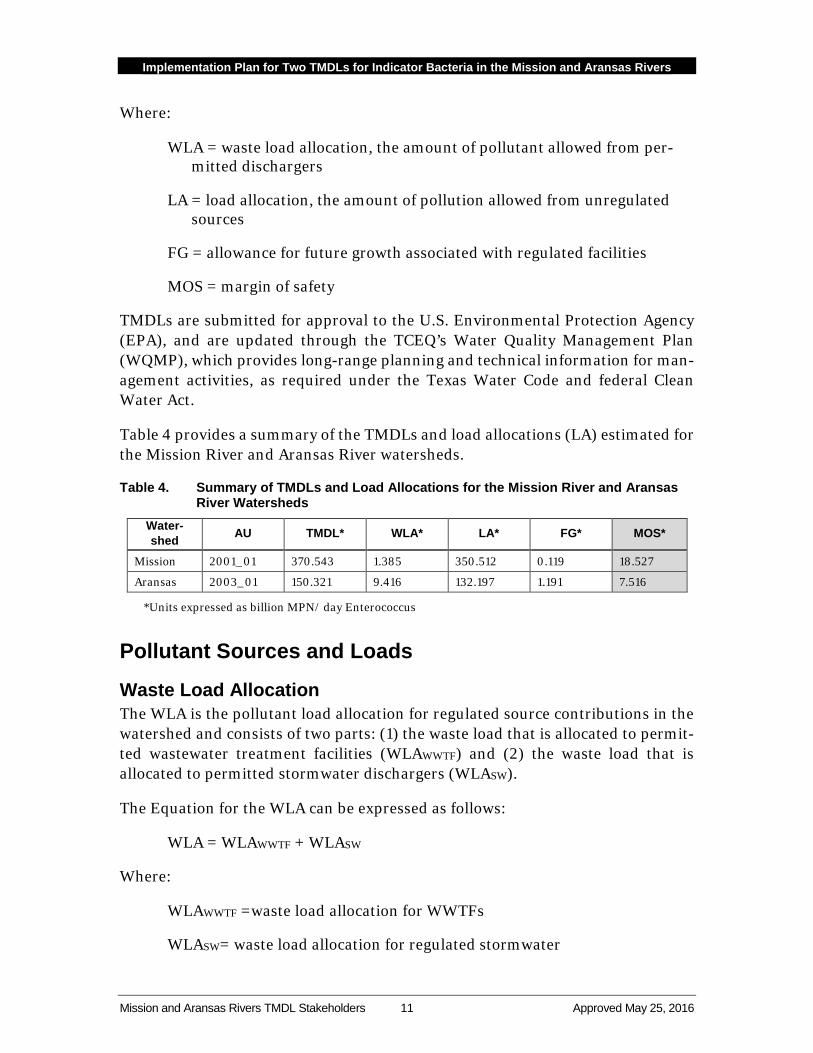
TMDL = ∑WLA + ∑LA + ∑FG + MOS
Implementation Plan for Two TMDLs for Indicator Bacteria in the Mission and Aransas Rivers
Mission and Aransas Rivers TMDL Stakeholders 11 Approved May 25, 2016
Where:
WLA = waste load allocation, the amount of pollutant allowed from per-mitted dischargers
LA = load allocation, the amount of pollution allowed from unregulated sources
FG = allowance for future growth associated with regulated facilities
MOS = margin of safety
TMDLs are submitted for approval to the U.S. Environmental Protection Agency (EPA), and are updated through the TCEQ’s Water Quality Management Plan (WQMP), which provides long-range planning and technical information for man-agement activities, as required under the Texas Water Code and federal Clean Water Act.
Table 4 provides a summary of the TMDLs and load allocations (LA) estimated for the Mission River and Aransas River watersheds.
Table 4. Summary of TMDLs and Load Allocations for the Mission River and Aransas River Watersheds
Water-shed AU TMDL* WLA* LA* FG* MOS*
Mission 2001_01 370.543 1.385 350.512 0.119 18.527
Aransas 2003_01 150.321 9.416 132.197 1.191 7.516
*Units expressed as billion MPN/ day Enterococcus
Pollutant Sources and Loads
Waste Load Allocation The WLA is the pollutant load allocation for regulated source contributions in the watershed and consists of two parts: (1) the waste load that is allocated to permit-ted wastewater treatment facilities (WLAWWTF) and (2) the waste load that is allocated to permitted stormwater dischargers (WLASW).
The Equation for the WLA can be expressed as follows:
WLA = WLAWWTF + WLASW
Where:
WLAWWTF =waste load allocation for WWTFs
WLASW= waste load allocation for regulated stormwater
Implementation Plan for Two TMDLs for Indicator Bacteria in the Mission and Aransas Rivers
Mission and Aransas Rivers TMDL Stakeholders 12 Approved May 25, 2016
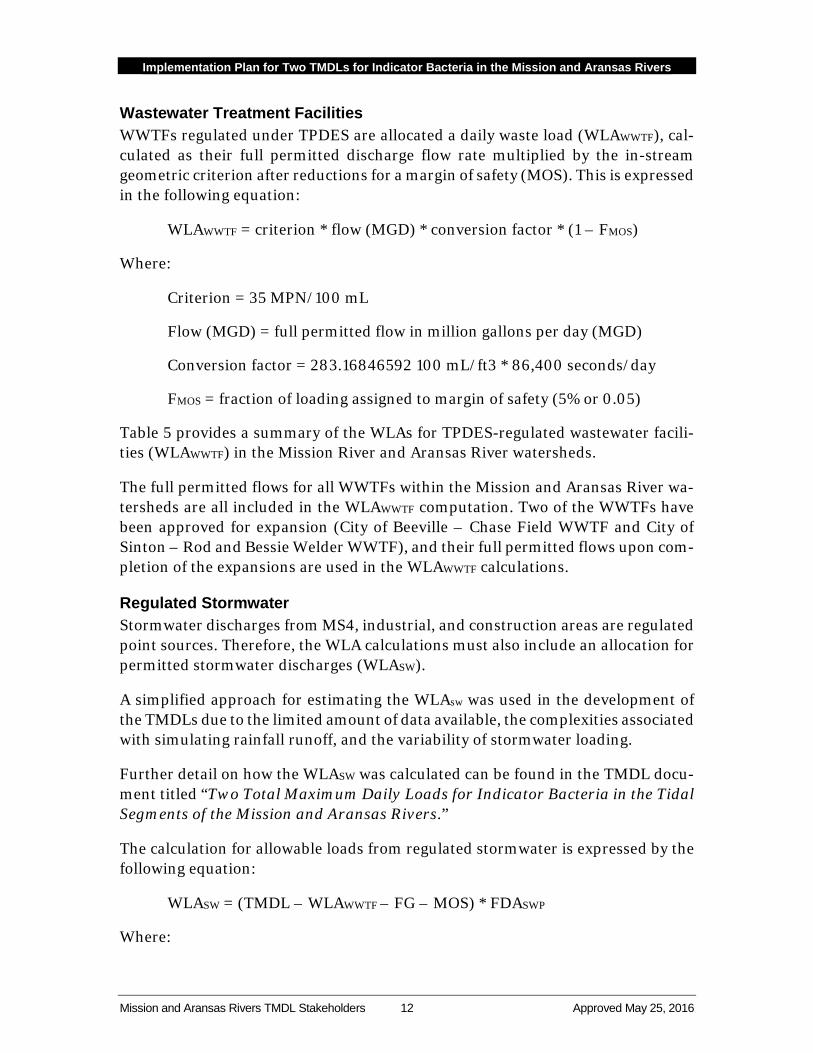
Wastewater Treatment Facilities WWTFs regulated under TPDES are allocated a daily waste load (WLAWWTF), cal-culated as their full permitted discharge flow rate multiplied by the in-stream geometric criterion after reductions for a margin of safety (MOS). This is expressed in the following equation:
WLAWWTF = criterion * flow (MGD) * conversion factor * (1 – FMOS)
Where:
Criterion = 35 MPN/100 mL
Flow (MGD) = full permitted flow in million gallons per day (MGD)
Conversion factor = 283.16846592 100 mL/ft3 * 86,400 seconds/day
FMOS = fraction of loading assigned to margin of safety (5% or 0.05)
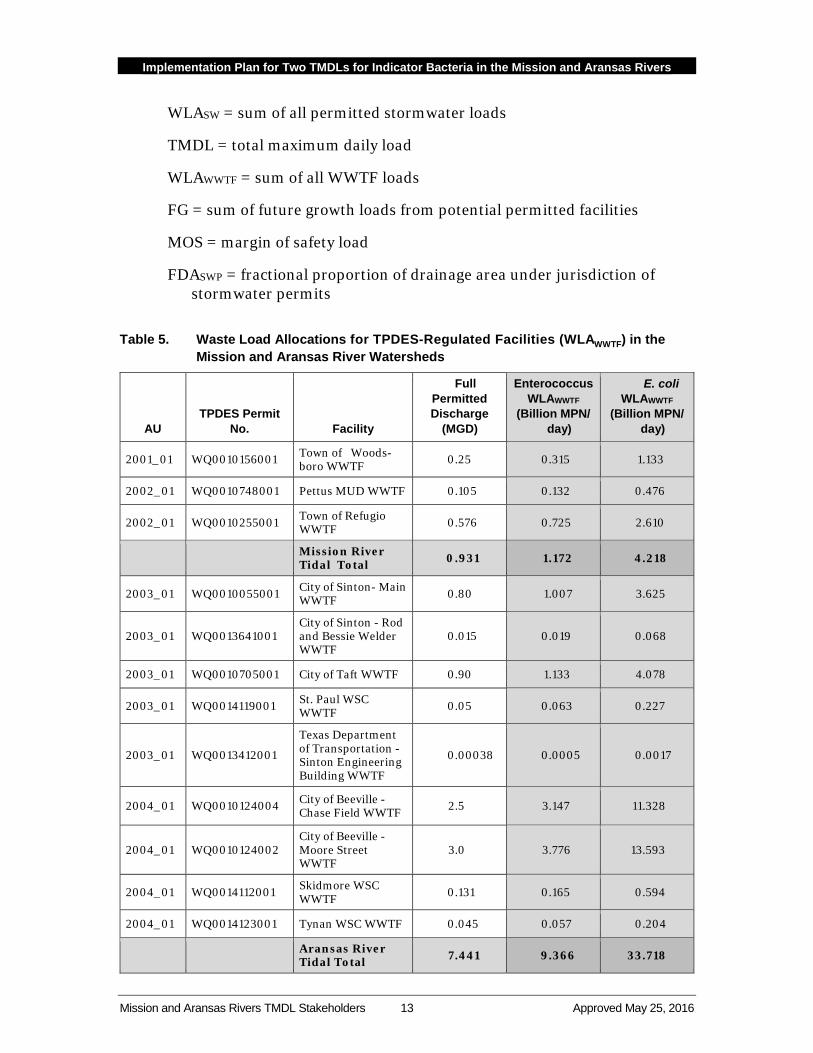
Table 5 provides a summary of the WLAs for TPDES-regulated wastewater facili-ties (WLAWWTF) in the Mission River and Aransas River watersheds.
The full permitted flows for all WWTFs within the Mission and Aransas River wa-tersheds are all included in the WLAWWTF computation. Two of the WWTFs have been approved for expansion (City of Beeville – Chase Field WWTF and City of Sinton – Rod and Bessie Welder WWTF), and their full permitted flows upon com-pletion of the expansions are used in the WLAWWTF calculations.
Regulated Stormwater Stormwater discharges from MS4, industrial, and construction areas are regulated point sources. Therefore, the WLA calculations must also include an allocation for permitted stormwater discharges (WLASW).
A simplified approach for estimating the WLAsw was used in the development of the TMDLs due to the limited amount of data available, the complexities associated with simulating rainfall runoff, and the variability of stormwater loading.
Further detail on how the WLASW was calculated can be found in the TMDL docu-ment titled “Two Total Maximum Daily Loads for Indicator Bacteria in the Tidal Segments of the Mission and Aransas Rivers.”
The calculation for allowable loads from regulated stormwater is expressed by the following equation:
WLASW = (TMDL – WLAWWTF – FG – MOS) * FDASWP
Where:
Implementation Plan for Two TMDLs for Indicator Bacteria in the Mission and Aransas Rivers
Mission and Aransas Rivers TMDL Stakeholders 13 Approved May 25, 2016
WLASW = sum of all permitted stormwater loads
TMDL = total maximum daily load
WLAWWTF = sum of all WWTF loads
FG = sum of future growth loads from potential permitted facilities
MOS = margin of safety load
FDASWP = fractional proportion of drainage area under jurisdiction of stormwater permits
Table 5. Waste Load Allocations for TPDES-Regulated Facilities (WLAWWTF) in the
Mission and Aransas River Watersheds
AU TPDES Permit
No. Facility
Full Permitted Discharge
(MGD)
Enterococcus WLAWWTF
(Billion MPN/ day)
E. coli WLAWWTF
(Billion MPN/ day)
2001_01 WQ0010156001 Town of Woods-boro WWTF 0.25 0.315 1.133
2002_01 WQ0010748001 Pettus MUD WWTF 0.105 0.132 0.476
2002_01 WQ0010255001 Town of Refugio WWTF 0.576 0.725 2.610
Mission River Tidal Total 0.931 1.172 4.218
2003_01 WQ0010055001 City of Sinton- Main WWTF 0.80 1.007 3.625
2003_01 WQ0013641001 City of Sinton - Rod and Bessie Welder WWTF
0.015 0.019 0.068
2003_01 WQ0010705001 City of Taft WWTF 0.90 1.133 4.078
2003_01 WQ0014119001 St. Paul WSC WWTF 0.05 0.063 0.227
2003_01 WQ0013412001
Texas Department of Transportation - Sinton Engineering Building WWTF
0.00038 0.0005 0.0017
2004_01 WQ0010124004 City of Beeville - Chase Field WWTF 2.5 3.147 11.328
2004_01 WQ0010124002 City of Beeville - Moore Street WWTF
3.0 3.776 13.593
2004_01 WQ0014112001 Skidmore WSC WWTF 0.131 0.165 0.594
2004_01 WQ0014123001 Tynan WSC WWTF 0.045 0.057 0.204
Aransas River Tidal Total 7.441 9.366 33.718
Implementation Plan for Two TMDLs for Indicator Bacteria in the Mission and Aransas Rivers
Mission and Aransas Rivers TMDL Stakeholders 14 Approved May 25, 2016
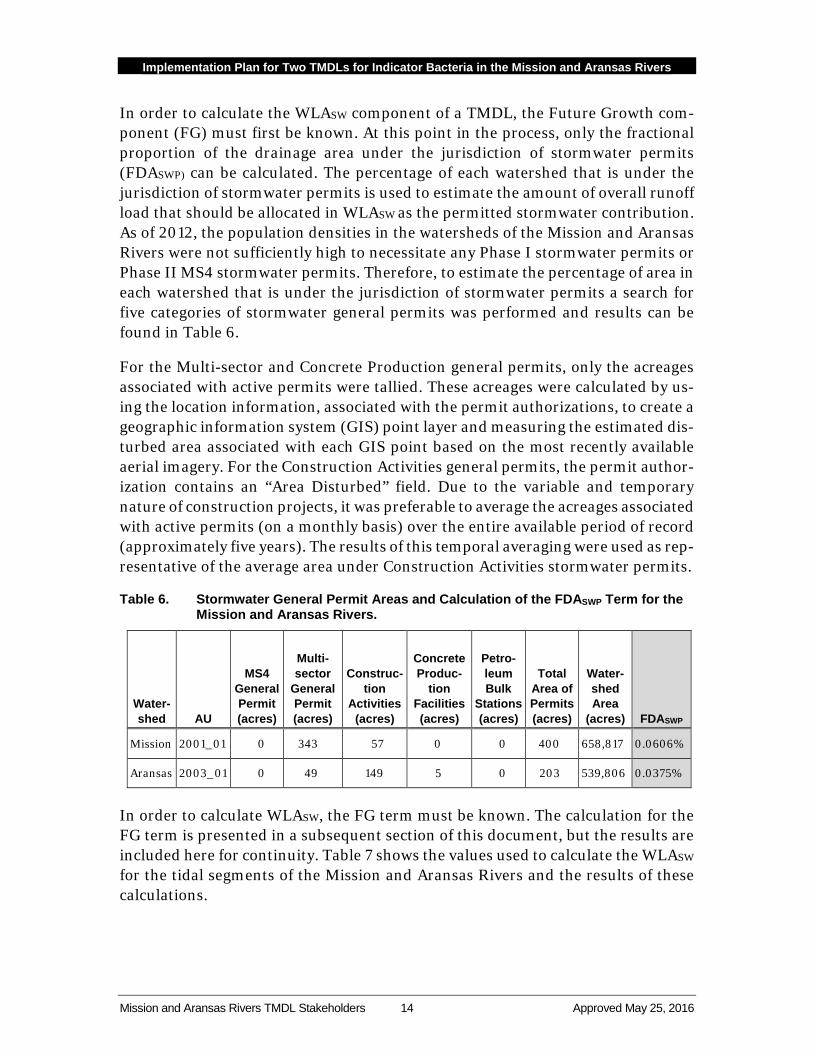
In order to calculate the WLASW component of a TMDL, the Future Growth com-ponent (FG) must first be known. At this point in the process, only the fractional proportion of the drainage area under the jurisdiction of stormwater permits (FDASWP) can be calculated. The percentage of each watershed that is under the jurisdiction of stormwater permits is used to estimate the amount of overall runoff load that should be allocated in WLASW as the permitted stormwater contribution. As of 2012, the population densities in the watersheds of the Mission and Aransas Rivers were not sufficiently high to necessitate any Phase I stormwater permits or Phase II MS4 stormwater permits. Therefore, to estimate the percentage of area in each watershed that is under the jurisdiction of stormwater permits a search for five categories of stormwater general permits was performed and results can be found in Table 6.
For the Multi-sector and Concrete Production general permits, only the acreages associated with active permits were tallied. These acreages were calculated by us-ing the location information, associated with the permit authorizations, to create a geographic information system (GIS) point layer and measuring the estimated dis-turbed area associated with each GIS point based on the most recently available aerial imagery. For the Construction Activities general permits, the permit author-ization contains an “Area Disturbed” field. Due to the variable and temporary nature of construction projects, it was preferable to average the acreages associated with active permits (on a monthly basis) over the entire available period of record (approximately five years). The results of this temporal averaging were used as rep-resentative of the average area under Construction Activities stormwater permits.
Table 6. Stormwater General Permit Areas and Calculation of the FDASWP Term for the Mission and Aransas Rivers.
Water-shed AU
MS4 General Permit (acres)
Multi-sector
General Permit (acres)
Construc-tion
Activities (acres)
Concrete Produc-
tion Facilities (acres)
Petro-leum Bulk
Stations (acres)
Total Area of Permits (acres)
Water-shed Area
(acres) FDASWP
Mission 2001_01 0 343 57 0 0 400 658,817 0.0606%
Aransas 2003_01 0 49 149 5 0 203 539,806 0.0375%
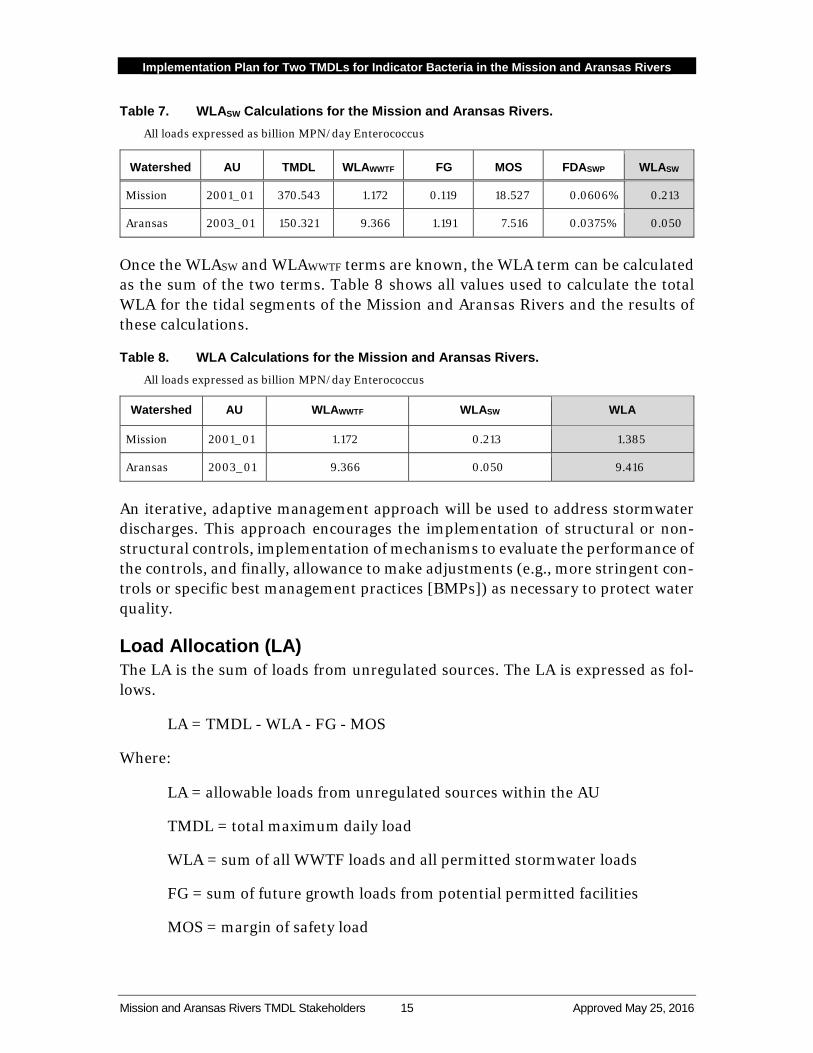
In order to calculate WLASW, the FG term must be known. The calculation for the FG term is presented in a subsequent section of this document, but the results are included here for continuity. Table 7 shows the values used to calculate the WLASW for the tidal segments of the Mission and Aransas Rivers and the results of these calculations.
Implementation Plan for Two TMDLs for Indicator Bacteria in the Mission and Aransas Rivers
Mission and Aransas Rivers TMDL Stakeholders 15 Approved May 25, 2016
Table 7. WLASW Calculations for the Mission and Aransas Rivers. All loads expressed as billion MPN/day Enterococcus
Watershed AU TMDL WLAWWTF FG MOS FDASWP WLASW
Mission 2001_01 370.543 1.172 0.119 18.527 0.0606% 0.213
Aransas 2003_01 150.321 9.366 1.191 7.516 0.0375% 0.050
Once the WLASW and WLAWWTF terms are known, the WLA term can be calculated as the sum of the two terms. Table 8 shows all values used to calculate the total WLA for the tidal segments of the Mission and Aransas Rivers and the results of these calculations.
Table 8. WLA Calculations for the Mission and Aransas Rivers. All loads expressed as billion MPN/day Enterococcus
Watershed AU WLAWWTF WLASW WLA
Mission 2001_01 1.172 0.213 1.385
Aransas 2003_01 9.366 0.050 9.416
An iterative, adaptive management approach will be used to address stormwater discharges. This approach encourages the implementation of structural or non-structural controls, implementation of mechanisms to evaluate the performance of the controls, and finally, allowance to make adjustments (e.g., more stringent con-trols or specific best management practices [BMPs]) as necessary to protect water quality.
Load Allocation (LA) The LA is the sum of loads from unregulated sources. The LA is expressed as fol-lows.
LA = TMDL - WLA - FG - MOS
Where:
LA = allowable loads from unregulated sources within the AU
TMDL = total maximum daily load
WLA = sum of all WWTF loads and all permitted stormwater loads
FG = sum of future growth loads from potential permitted facilities
MOS = margin of safety load
Implementation Plan for Two TMDLs for Indicator Bacteria in the Mission and Aransas Rivers
Mission and Aransas Rivers TMDL Stakeholders 16 Approved May 25, 2016
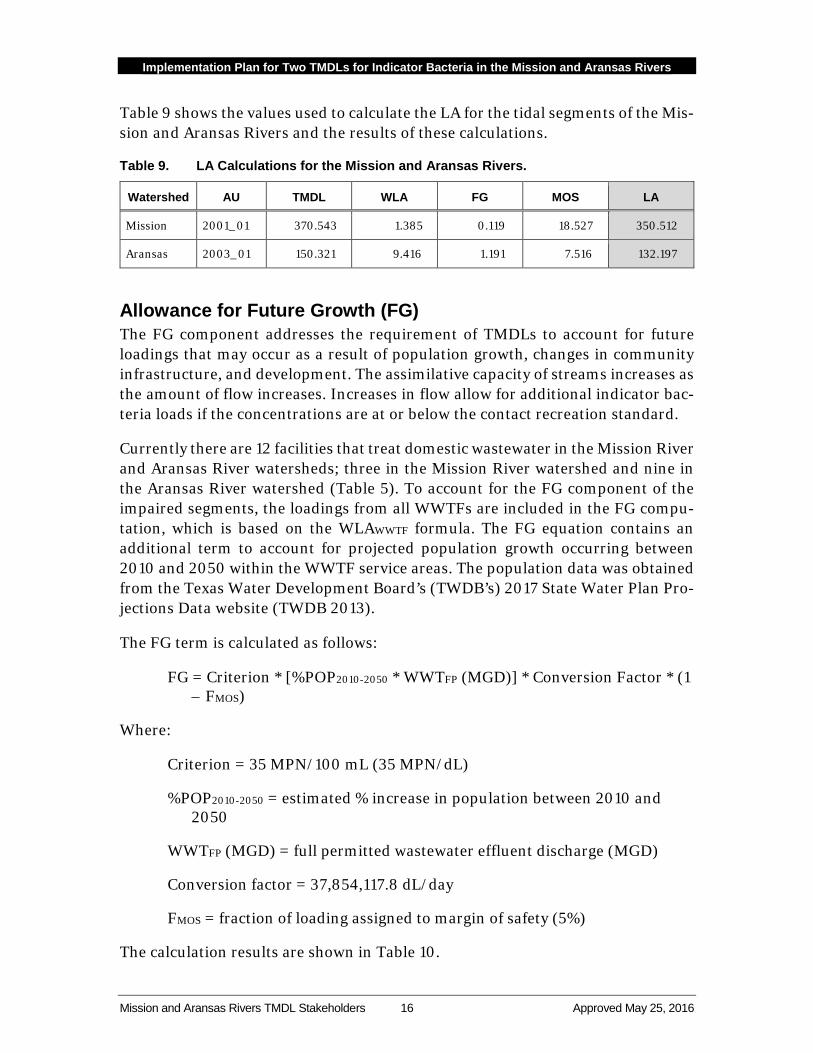
Table 9 shows the values used to calculate the LA for the tidal segments of the Mis-sion and Aransas Rivers and the results of these calculations.
Table 9. LA Calculations for the Mission and Aransas Rivers.
Watershed AU TMDL WLA FG MOS LA
Mission 2001_01 370.543 1.385 0.119 18.527 350.512
Aransas 2003_01 150.321 9.416 1.191 7.516 132.197
Allowance for Future Growth (FG) The FG component addresses the requirement of TMDLs to account for future loadings that may occur as a result of population growth, changes in community infrastructure, and development. The assimilative capacity of streams increases as the amount of flow increases. Increases in flow allow for additional indicator bac-teria loads if the concentrations are at or below the contact recreation standard.
Currently there are 12 facilities that treat domestic wastewater in the Mission River and Aransas River watersheds; three in the Mission River watershed and nine in the Aransas River watershed (Table 5). To account for the FG component of the impaired segments, the loadings from all WWTFs are included in the FG compu-tation, which is based on the WLAWWTF formula. The FG equation contains an additional term to account for projected population growth occurring between 2010 and 2050 within the WWTF service areas. The population data was obtained from the Texas Water Development Board’s (TWDB’s) 2017 State Water Plan Pro-jections Data website (TWDB 2013).
The FG term is calculated as follows:
FG = Criterion * [%POP2010-2050 * WWTFP (MGD)] * Conversion Factor * (1 – FMOS)
Where:
Criterion = 35 MPN/100 mL (35 MPN/dL)
%POP2010-2050 = estimated % increase in population between 2010 and 2050
WWTFP (MGD) = full permitted wastewater effluent discharge (MGD)
Conversion factor = 37,854,117.8 dL/day
FMOS = fraction of loading assigned to margin of safety (5%)
The calculation results are shown in Table 10.
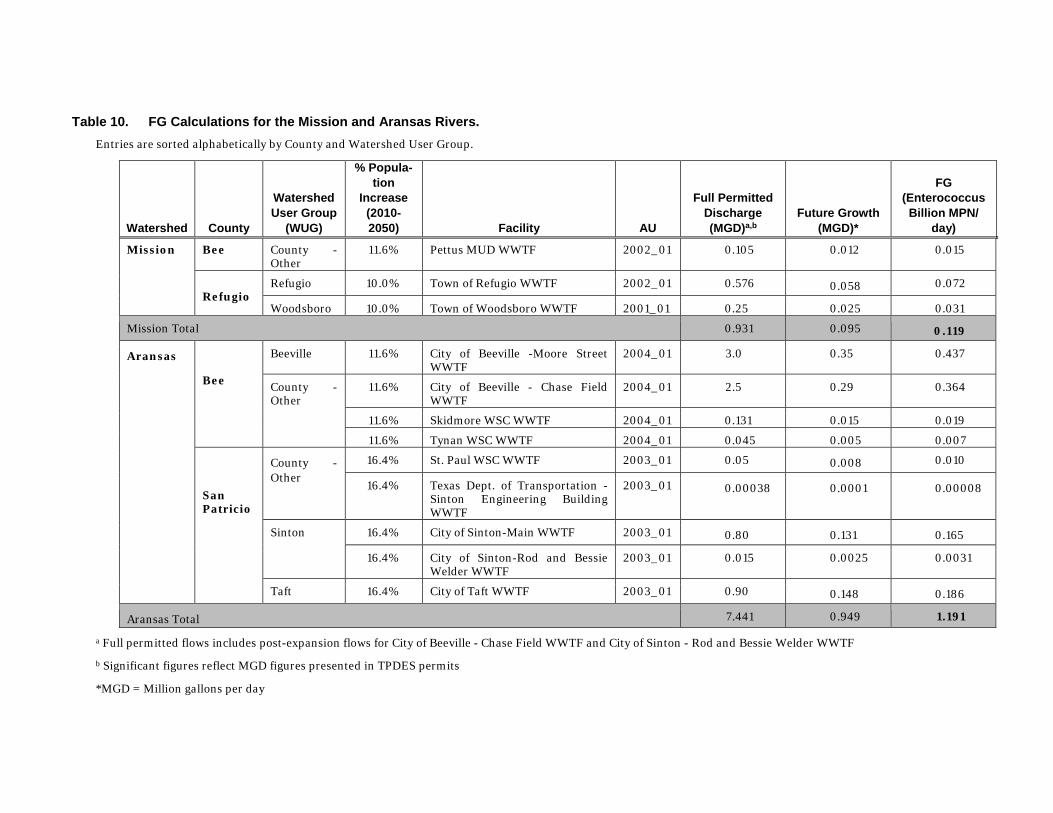
Table 10. FG Calculations for the Mission and Aransas Rivers. Entries are sorted alphabetically by County and Watershed User Group.
Watershed County
Watershed User Group
(WUG)
% Popula-tion
Increase (2010-2050) Facility AU
Full Permitted Discharge (MGD)a,b
Future Growth (MGD)*
FG (Enterococcus
Billion MPN/ day)
Mission
Bee County - Other
11.6% Pettus MUD WWTF 2002_01 0.105 0.012 0.015
Refugio
Refugio 10.0% Town of Refugio WWTF 2002_01 0.576 0.058 0.072
Woodsboro 10.0% Town of Woodsboro WWTF 2001_01 0.25 0.025 0.031
Mission Total 0.931 0.095 0.119
Aransas Bee
Beeville 11.6% City of Beeville -Moore Street WWTF
2004_01 3.0 0.35 0.437
County - Other
11.6% City of Beeville - Chase Field WWTF
2004_01 2.5 0.29 0.364
11.6% Skidmore WSC WWTF 2004_01 0.131 0.015 0.019
11.6% Tynan WSC WWTF 2004_01 0.045 0.005 0.007
San Patricio
County - Other
16.4% St. Paul WSC WWTF 2003_01 0.05 0.008 0.010
16.4% Texas Dept. of Transportation - Sinton Engineering Building WWTF
2003_01 0.00038 0.0001 0.00008
Sinton 16.4% City of Sinton-Main WWTF 2003_01 0.80 0.131 0.165
16.4% City of Sinton-Rod and Bessie Welder WWTF
2003_01 0.015 0.0025 0.0031
Taft 16.4% City of Taft WWTF 2003_01 0.90 0.148 0.186
Aransas Total 7.441 0.949 1.191
a Full permitted flows includes post-expansion flows for City of Beeville - Chase Field WWTF and City of Sinton - Rod and Bessie Welder WWTF
b Significant figures reflect MGD figures presented in TPDES permits
*MGD = Million gallons per day
Implementation Plan for Two TMDLs for Indicator Bacteria in the Mission and Aransas Rivers
Mission and Aransas Rivers TMDL Stakeholders 18 Approved May 25, 2016
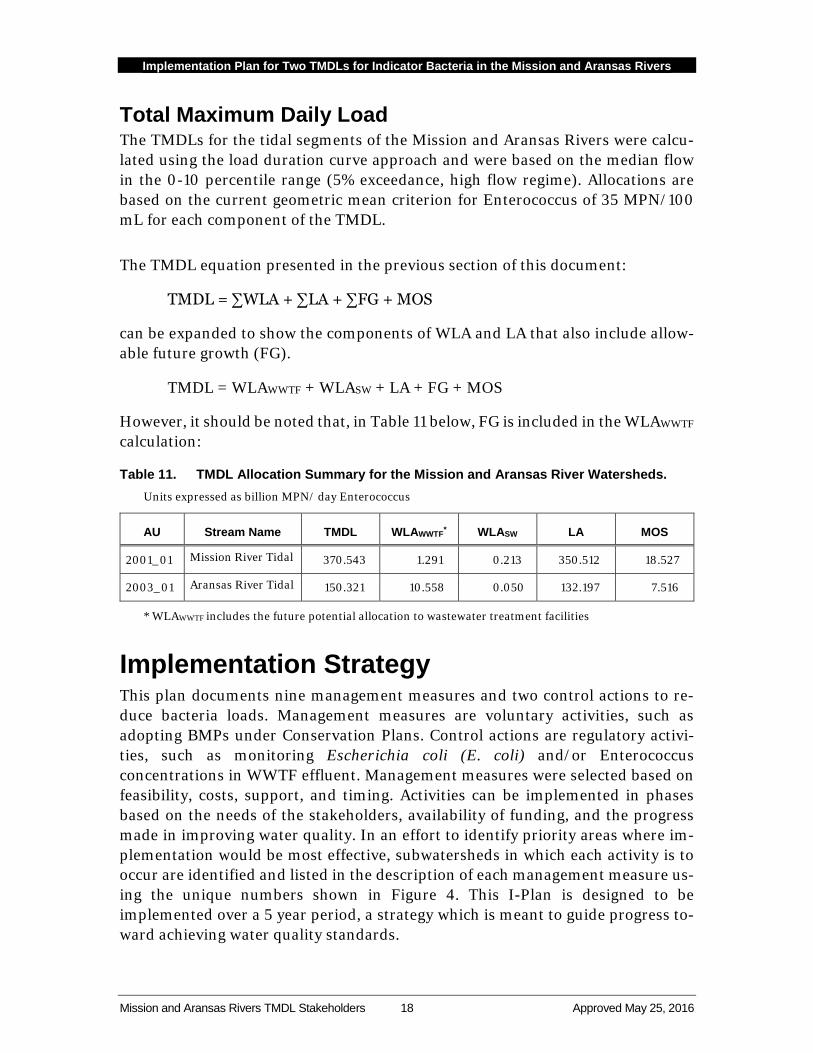
Total Maximum Daily Load The TMDLs for the tidal segments of the Mission and Aransas Rivers were calcu-lated using the load duration curve approach and were based on the median flow in the 0-10 percentile range (5% exceedance, high flow regime). Allocations are based on the current geometric mean criterion for Enterococcus of 35 MPN/100 mL for each component of the TMDL. The TMDL equation presented in the previous section of this document:
TMDL = ∑WLA + ∑LA + ∑FG + MOS
can be expanded to show the components of WLA and LA that also include allow-able future growth (FG).
TMDL = WLAWWTF + WLASW + LA + FG + MOS
However, it should be noted that, in Table 11 below, FG is included in the WLAWWTF calculation:
Table 11. TMDL Allocation Summary for the Mission and Aransas River Watersheds. Units expressed as billion MPN/ day Enterococcus
AU Stream Name TMDL WLAWWTF* WLASW LA MOS
2001_01 Mission River Tidal 370.543 1.291 0.213 350.512 18.527
2003_01 Aransas River Tidal 150.321 10.558 0.050 132.197 7.516
* WLAWWTF includes the future potential allocation to wastewater treatment facilities
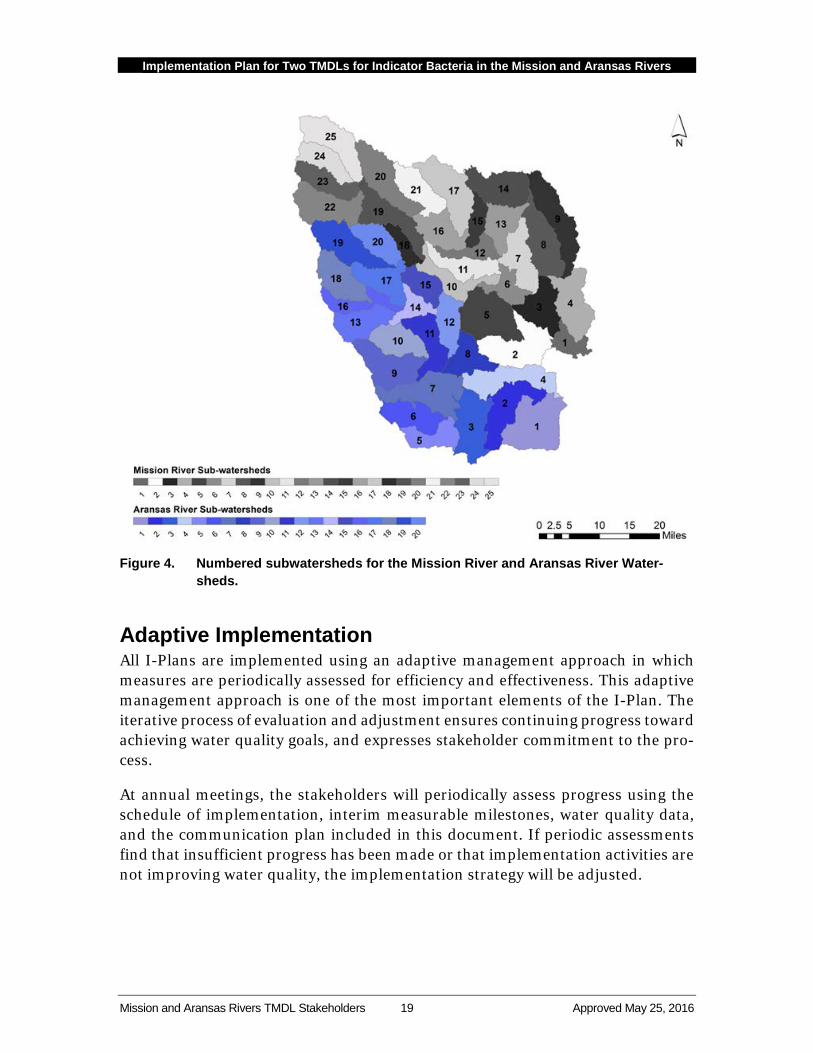
Implementation Strategy This plan documents nine management measures and two control actions to re-duce bacteria loads. Management measures are voluntary activities, such as adopting BMPs under Conservation Plans. Control actions are regulatory activi-ties, such as monitoring Escherichia coli (E. coli) and/or Enterococcus concentrations in WWTF effluent. Management measures were selected based on feasibility, costs, support, and timing. Activities can be implemented in phases based on the needs of the stakeholders, availability of funding, and the progress made in improving water quality. In an effort to identify priority areas where im-plementation would be most effective, subwatersheds in which each activity is to occur are identified and listed in the description of each management measure us-ing the unique numbers shown in Figure 4. This I-Plan is designed to be implemented over a 5 year period, a strategy which is meant to guide progress to-ward achieving water quality standards.
Implementation Plan for Two TMDLs for Indicator Bacteria in the Mission and Aransas Rivers
Mission and Aransas Rivers TMDL Stakeholders 19 Approved May 25, 2016
Figure 4. Numbered subwatersheds for the Mission River and Aransas River Water-
sheds.
Adaptive Implementation All I-Plans are implemented using an adaptive management approach in which measures are periodically assessed for efficiency and effectiveness. This adaptive management approach is one of the most important elements of the I-Plan. The iterative process of evaluation and adjustment ensures continuing progress toward achieving water quality goals, and expresses stakeholder commitment to the pro-cess.
At annual meetings, the stakeholders will periodically assess progress using the schedule of implementation, interim measurable milestones, water quality data, and the communication plan included in this document. If periodic assessments find that insufficient progress has been made or that implementation activities are not improving water quality, the implementation strategy will be adjusted.
Implementation Plan for Two TMDLs for Indicator Bacteria in the Mission and Aransas Rivers
Mission and Aransas Rivers TMDL Stakeholders 20 Approved May 25, 2016
Activities and Milestones To facilitate the development of the Mission and Aransas Rivers TMDL I-Plan, the Texas Water Resources Institute, under contract with the TCEQ, held a series of public meetings in the watershed from January 2012 through August 2013. As a result, participants in the meetings formed a coordination committee that consists of participating watershed stakeholders. This committee is considered the local de-cision-making body for the development of the I-Plan. The coordinating committee decided it was important to form workgroups to help determine the ap-propriate management measures and control actions pertinent to specific sectors and activities of interest in the watershed. The workgroups that were formed in-cluded the following sectors and activities: (1) Agricultural and Wildlife, and (2) Wastewater.
Each workgroup developed detailed, consensus-based action plans that later be-came sections of this I-Plan. The management measures and control actions contained in this I-Plan are the combined products of the two workgroups and the coordination committee.
The Mission and Aransas Rivers I-Plan includes nine stakeholder-developed man-agement measures and two control actions, which are described in the following sections.
Management Measures and Control Actions The I-Plan for Two Total Maximum Daily Loads for Bacteria in the Tidal Seg-ments of the Mission and Aransas Rivers (Segments 2001 and 2003) includes the following nine management measures and two control actions.
Management Measures 1. Develop and Implement Conservation Plans in Priority Areas of the Watershed 2. Explore Feasibility of Altering Tax Exemption Requirements for Small Acreage
Landowners 3. Promote the Management of Feral Hogs and Control Their Populations 4. Promote the Reduction of Illicit Dumping and Proper Disposal of Animal Car-
casses 5. Identify OSSFs, Prioritize OSSF Problem Areas, and Systematically Work to Bring
Failing OSSF Systems into Compliance 6. Promote the Improved Quality and Management of Urban Stormwater 7. Coordinate Efforts to Reduce Unauthorized Discharges 8. Reduce WWTF Contributions by Meeting Half of the Permitted Bacteria Limit 9. Coordinate and Expand Existing Water Quality Monitoring in the Watershed
Control Actions 1. Improve Monitoring of WWTF Effluent to Ensure Permit Compliance 2. Improve and Upgrade WWTFs

Implementation Plan for Two TMDLs for Indicator Bacteria in the Mission and Aransas Rivers
Mission and Aransas Rivers TMDL Stakeholders 21 Approved May 25, 2016
Management Measure 1 Develop and Implement Conservation Plans in Priority Areas of the Watershed
Description Although land uses in a watershed change with time, the Mission River and Aransas River watersheds continue to be dominated by forest lands, grasslands, pasture, and cultivated crops. The majority of the agricultural interests within the watershed are cattle grazing operations; however, there are farming operations that consume a sizable portion of the watersheds as well. The implementation of proven BMPs within priority subwatersheds can lead to instream water quality im-provements by minimizing the deposition of fecal matter directly into ditches, creeks, and rivers and in their riparian areas. Currently, 310 conservation plans have been developed and implemented across the two TMDL watersheds. Estab-lishing additional acreage under management practices (identified in Appendix B, but not limited to only these practices) and additional conservation plans in these watersheds is the primary goal of this management measure.
To accomplish this goal, participating stakeholders will partner with state and fed-eral agencies to garner the necessary technical and financial assistance, as resources are available, to implement these management practices under the ap-propriate programs requested by the landowner. Direct contact with landowners in priority areas will be made to discuss what a conservation plan is, its benefits, and other information necessary to inform landowners of the need for adoption of BMPs. Assistance at the local level may be needed to establish the necessary con-tacts.
Education Component Education is one of the most important components of this management measure. An intensive education and outreach program is needed to broadly promote the adoption of management practices through the appropriate program(s). Aware-ness of the programs, management practices, and their benefits is often one of the largest factors affecting adoption of BMPs and should also be assessed so that ad-justments can be made to encourage adoption. Educational programs specific to some of the landowner interests currently exist and should also be utilized as a part of the education and outreach campaign. Existing programs, such as the Lone Star Healthy Steams Program, the Statewide Riparian and Stream Ecosystem Educa-tion Program and the NRA’s South Texas Land and Water Initiative and Remarkable Riparian education resources, should be delivered in the watersheds to further promote the adoption of BMPs.
Implementation Plan for Two TMDLs for Indicator Bacteria in the Mission and Aransas Rivers
Mission and Aransas Rivers TMDL Stakeholders 22 Approved May 25, 2016
Priority Areas Priority areas for the adoption of management practices in these two watersheds will be focused on land uses that have the highest potential capacity for stocking livestock. Specific subwatersheds include:
Aransas River Watershed – 4, 8, 10, 11, 12, 13, 15, 17, 18, 19, and 20 Mission River Watershed – 2, 5, 7, 8, 9, 14, 17, 19, 21, 22, 24, and 25
Responsible Parties and Funding
Responsible Parties
Local Stakeholders: Local stakeholders will evaluate the option of adopting a conservation plan through a specific program of their choice, including but not limited to, the list below. If found feasible, the individual stakeholders will approach the appropriate agency and work with that agency to develop conservation plans to mitigate im-pacts to water quality. Stakeholders who adopt conservation plans should adhere to the requirements written into their specific conservation plan. The agency’s listed below are responsible for helping stakeholders adopt and implement the conservation plans.
Texas A&M AgriLife Extension Service: The Texas A&M AgriLife Extension Service (Texas AgriLife) provides quality, rel-evant, outreach and continuing education programs and services to Texans. Texas AgriLife serves every county in Texas; information is provided by scientists and researchers at Texas A&M and other universities, and is made practical and rele-vant by Texas AgriLife educators or agents who work in each county. Texas AgriLife continually assesses and responds to educational needs identified by community residents, advisory committee members, volunteers, stakeholder groups, and rep-resentatives of organizations and agencies. Texas AgriLife education encompasses the broad areas of agriculture and natural resources, community economic devel-opment, family and consumer sciences, and youth development programs such as 4-H.
Among other goals and priority objectives pursued by Texas AgriLife, the following relate to agriculture and natural resources:
Consumers, homeowners, agricultural producers, communities, and irrigation districts understand and adopt BMPs to protect water quality and enhance con-servation so water supplies meet future water needs in Texas. Clean and abundant water supplies are essential for expanding agricultural growth, jobs, and the economy in both rural and urban areas.
Implementation Plan for Two TMDLs for Indicator Bacteria in the Mission and Aransas Rivers
Mission and Aransas Rivers TMDL Stakeholders 23 Approved May 25, 2016
Landowners, professional ecosystem managers, community planners, and other interest groups become more knowledgeable, make more informed deci-sions, and adopt BMPs that ensure the proper management of rural and urban natural ecosystem resources through stewardship and education.
Advance the planning and management of natural resource-based recreation opportunities in Texas.
Funded with Texas State Soil and Water Conservation Board (TSSWCB) CWA Sec-tion 319(h) nonpoint source grants, Texas AgriLife and the Texas Water Resources Institute have developed the Lone Star Healthy Streams – Grazing Cattle curricu-lum. This educational program is delivered statewide and serves as the foundation for landowners’ understanding of the effects of grazing cattle on bacteria loading to streams and the BMPs designed to reduce bacteria from grazing cattle. The cur-riculum promotes the adoption of BMPs and participation in federal and state cost-share programs and should be delivered to stakeholders in the TMDL watersheds.
Funded with TSSWCB CWA Section 319(h) nonpoint source grants, Texas AgriLife and the Texas Water Resources Institute have developed the Lone Star Healthy Streams – Horse curriculum. This educational program is being delivered statewide and serves as the foundation for landowners’ understanding of the ef-fects on bacteria loading to streams and the BMPs designed to reduce bacteria from horses. The project manual is available at <http://lshs.tamu.edu/media/340453/horse_manual.pdf>. Upon request, TSSWCB and Texas AgriLife will deliver the program to horse owners in the Mis-sion River and Aransas River watersheds.
In concert with curriculum development, Texas AgriLife is evaluating the effective-ness of selected BMPs in reducing bacteria loading from grazing cattle to streams. BMPs evaluated include grazing management, shade, fencing, alternative water source development, riparian buffers, and combinations of these BMPs. The re-sults, to date, show significant impacts to animal behavior and subsequent fecal bacteria loading, thus substantiating the use of these practices to mitigate TMDL pollutant loading.
The Lone Star Healthy Streams project workplan and approved Quality Assurance Project Plan (QAPP) are available at the following TSSWCB website: <www.tsswcb.state.tx.us/ managementprogram/lonestar>. The TSSWCB is also working with Texas AgriLife to develop scopes of work to continue funding BMP effectiveness studies. Once the full curriculum is developed, TSSWCB and Texas AgriLife will deliver the program to cattlemen in the Mission River and Aransas River watersheds. More information on this project is available at <http://grazing-lands-wq.tamu.edu/>.
Implementation Plan for Two TMDLs for Indicator Bacteria in the Mission and Aransas Rivers
Mission and Aransas Rivers TMDL Stakeholders 24 Approved May 25, 2016
Texas State Soil and Water Conservation Board: The TSSWCB is the lead agency in Texas responsible for planning, implementing, and managing programs and practices for preventing and abating agricultural and silvicultural (forestry-related) nonpoint source pollution (Texas Agriculture Code 2007) . In accordance with this responsibility, the TSSWCB administers a certified WQMP Program that provides, through soil and water conservation districts (SWCDs), cost-share assistance for management practices on agricultural and sil-vicultural lands; however, not all WQMPs receive financial assistance.
Each WQMP is developed, maintained, and implemented under rules and criteria adopted by the TSSWCB. A WQMP achieves a level of pollution prevention or abatement consistent with the state’s water quality standards and is a site-specific plan designed to assist landowners in managing nonpoint source pollution from agricultural and silvicultural activities. WQMPs are traditional conservation plans based on the criteria outlined in the U.S. Department of Agriculture (USDA) Nat-ural Resource Conservation Service (NRCS) Field Office Technical Guide (FOTG). The FOTG is the best available technology and is tailored to meet local needs.
A WQMP includes appropriate land treatment practices, production practices, management measures, technologies, or combinations thereof. WQMPs are devel-oped in cooperation with the landowner, with assistance from the NRCS, are approved by the local SWCD, and are certified by the TSSWCB. This way of pre-venting and abating nonpoint source pollution uses a voluntary approach while affording the landowner a mechanism for compliance with the state’s water quality standards.
The TSSWCB regularly performs status reviews on WQMPs to ensure that the pro-ducers are implementing the measures described in the WQMP. The TSSWCB administers technical and financial assistance programs to assist producers in im-plementing their WQMPs. The TSSWCB utilizes both state funds and federal grants to implement the WQMP program. Several essential practices from the NRCS FOTG included in a WQMP have specific applicability to the bacteria reduc-tion goals of these TMDLs and I-Plan.
A grazing management system is a vital component of a WQMP for livestock oper-ations. The TSSWCB, in collaboration with NRCS and the Bee SWCD #344, Goliad SWCD #352, San Patricio SWCD #324, and Copano SWCD #329, will continue to provide technical assistance to landowners in developing and implementing WQMPs that include grazing management systems. TSSWCB will develop WQMPs on 100% of the livestock operations in the Mission River and Aransas River water-sheds who request planning assistance through the SWCD. TSSWCB will annually perform status reviews on at least 5% of all WQMPs in the Mission River and Aransas River watersheds.
Implementation Plan for Two TMDLs for Indicator Bacteria in the Mission and Aransas Rivers
Mission and Aransas Rivers TMDL Stakeholders 25 Approved May 25, 2016
Soil and Water Conservation Districts: An SWCD, like a county or school district, is a subdivision of state government. SWCDs are administered by a board of five directors who are elected by their fellow landowners. There are 216 individual SWCDs organized in Texas. It is through this conservation partnership that local SWCDs are able to furnish technical assistance to farmers and ranchers in the preparation of a complete soil and water conserva-tion plan to meet each land unit’s specific capabilities and needs. The Mission River and Aransas River watersheds lie inside the Bee SWCD #344, Goliad SWCD #352, San Patricio SWCD #324, and Copano SWCD #329.
U.S. Department of Agriculture Natural Resources Conservation Service (NRCS): The NRCS is a federal agency that works hand-in-hand with Texans to improve and protect their soil, water, and other natural resources. For decades, private landowners have voluntarily worked with NRCS specialists to prevent erosion, im-prove water quality, and promote sustainable agriculture. The NRCS provides conservation planning and technical assistance to landowners, groups, and units of government to develop and implement conservation plans that protect, con-serve, and enhance their natural resources. When providing assistance, NRCS focuses on the sound use and management of soil, water, air, plant, and animal resources. NRCS ensures sustainability, allows for productivity, and respects the customers’ needs. Conservation planning can make improvements to livestock op-erations, crop production, soil quality, water quality, and pastureland, forestland, and wildlife habitats. The NRCS also integrates ecological and economic consider-ations in order to address private and public concerns.
The NRCS administers numerous Farm Bill Programs authorized by the U.S. Con-gress that provide financial assistance for many conservation activities:
Conservation Innovation Grants (CIG) Conservation Stewardship Program (CSP) Environmental Quality Incentives Program (EQIP) Regional Conservation Partnership Program (RCPP) Agricultural Conservation Easement Program (ACEP) U.S. Department of Agriculture Conservation Reserve Program (USDA-CRP)
administered by USDA Farm Service Agency EQIP and other programs were reauthorized in the federal Agricultural Act of 2014 (Farm Bill) to provide a voluntary conservation program for farmers and ranchers that promotes agricultural production and environmental quality as compatible national goals. People who are engaged in livestock or agricultural production on eligible land may participate in EQIP. EQIP offers financial and technical assis-tance to eligible participants for installation or implementation of structural and management practices on eligible agricultural land.
Implementation Plan for Two TMDLs for Indicator Bacteria in the Mission and Aransas Rivers
Mission and Aransas Rivers TMDL Stakeholders 26 Approved May 25, 2016
EQIP also provides incentive and cost-share payments to implement conservation practices. EQIP activities are carried out according to a plan of operations devel-oped in conjunction with the producer that identifies the appropriate conservation practice(s) to address resource concerns. All practices are subject to NRCS tech-nical standards described in the FOTG and adapted for local conditions. The local SWCD approves the plan.
Local Work Groups provide recommendations to NRCS on allocating EQIP county base funds and on resource concerns for other USDA Farm Bill programs. The Mis-sion River and Aransas River watershed stakeholders are encouraged to participate in the Local Work Group in order to promote the goals of this I- Plan, as compatible with the resource concerns and conservation priorities for EQIP.
Texas Parks and Wildlife Department’s Private Lands Services: The Texas Parks and Wildlife Department’s (TPWD’s) Private Lands Services is a program for private landowners to provide practical information on ways to man-age wildlife resources, consistent with other land use goals, to ensure plant and animal diversity, to provide aesthetic and economic benefits, and to conserve soil, water, and related natural resources. To participate, landowners may request as-sistance by contacting the TPWD district serving their county. TPWD biologists serving specific geographical areas can be found at the following TPWD website: <www.tpwd.state.tx.us/landwater/land/technical_guidance/biologists/>.
TPWD’s only cost share program is the Landowner Incentive Program (LIP). To learn more about TPWD’s LIP or request financial assistance from a TPWD biolo-gist in the LIP program, visit the website at: <www.tpwd.state.tx.us/ landwater/land/private/lip/>. The website explains the types of projects funded by LIP. Once a property’s potential has been determined, a biologist will provide recommendations and, if requested, help the landowner develop a written wildlife management plan. Other funding opportunities may also be available through var-ious TPWD programs.
Prevention and management of wildlife conflicts is an essential and responsible part of wildlife management. The complex environmental balance between wildlife management and resource damage management includes a combination of biolog-ical, legal, socio-political, financial, and technical considerations. Texas Wildlife Services (TWS) accomplishes this balance by fostering cooperation between fed-eral, state, and private entities, servicing both rural and urban areas, utilizing technical assistance and providing direct control services in the specialized field of wildlife management.
NRA’s Riparian Habitat Education Initiatives: NRA’s South Texas Land and Water Initiative is aimed at bringing about improved water quality on a landscape scale through voluntary stewardship of private land,
Implementation Plan for Two TMDLs for Indicator Bacteria in the Mission and Aransas Rivers
Mission and Aransas Rivers TMDL Stakeholders 27 Approved May 25, 2016
especially private riparian lands. Riparian lands represent a small piece of the wa-tershed with large potential to influence water quality. Through the South Texas Land and Water Initiative, NRA can offer landowner workshops and seminars, as well as one-on-one riparian site evaluations in the San Antonio-Nueces Coastal Basin, which includes the Mission River and Aransas River watersheds. The goal of these activities is to bring about a better understanding of how riparian areas work and what hinders their function. The overarching goal is to enhance the ri-parian function and those area’s capacity to improve and protect water quality. Digital riparian lessons and other education resources are also available at NRA’s website <www.remarkableriparian.org>. The newly released Remarkable Ripar-ian Field Guide and Owner’s Manual can also help cultivate riparian understanding within the Mission River and Aransas River watersheds.
Technical Assistance The entities mentioned in this section provide resources of technical and financial assistance for Management Measure 1, but funding sources for this management measure need not be limited to these entities.
The intent of the previously mentioned programs is for the agencies listed under Management Measure 1 to work with landowners to voluntarily implement man-agement and conservation plans. Technical assistance to agricultural producers for developing management and conservation plans is provided through the TSSWCB’s WQMP Program, which is funded through state general revenue. It is anticipated that other sources of funding will be required to implement the activi-ties associated with Management Measure 1; it should also be noted that TSSWCB’s WQMP Program is dependent on continued appropriations from the Texas Legislature.
TSSWCB, NRCS, and TPWD will continue to provide appropriate levels of cost-share assistance to agricultural producers that will facilitate the implementation of BMPs and conservation programs in the Mission and Aransas River watersheds, as described in Management Measure 1. Historically, according to TSSWCB data, conservation plan development and implementation in this watershed has been moderately low; as such, it is anticipated that additional levels of funding will be needed to meet implementation needs.
Financial Assistance USDA Conservation Innovation Grants – The CIG is a voluntary program intended to stimulate the development and adoption of innovative conservation approaches and technologies while leveraging Federal investment in environmental enhance-ment and protection, in conjunction with agricultural production. Under CIG, EQIP funds are used to award competitive grants to non-Federal governmental or nongovernmental organizations, Tribes, or individuals.
Implementation Plan for Two TMDLs for Indicator Bacteria in the Mission and Aransas Rivers
Mission and Aransas Rivers TMDL Stakeholders 28 Approved May 25, 2016
Conservation Stewardship Program - The CSP helps agricultural producers main-tain and improve their existing conservation systems and adopt additional conservation activities to address priority resources concerns. Participants earn CSP payments for conservation performance—the higher the performance, the higher the payment.
USDA-NRCS Environmental Quality Incentives Program - The EQIP is a voluntary program that provides financial and technical assistance to agricultural producers through contracts up to a maximum term of ten years in length. These contracts provide financial assistance to help plan and implement conservation practices that address natural resource concerns and for opportunities to improve soil, wa-ter, plant, animal, air, and related resources on agricultural land and non-industrial private forestland. An additional purpose of EQIP is to help producers meet Federal, State, Tribal and local environmental regulations.
Regional Conservation Partnership Program - The RCPP is a new, comprehensive, and flexible program that uses partnerships to stretch and multiply conservation investments and reach conservation goals on a regional or watershed scale. Through RCPP, NRCS and state, local, and regional partners coordinate resources to help producers install and maintain conservation activities in selected project areas. Partners leverage RCPP funding in project areas and report on the benefits achieved.
Agricultural Conservation Easement Program - The ACEP provides financial and technical assistance to help conserve agricultural lands and wetlands and their re-lated benefits. Under the Agricultural Land Easements component, NRCS helps Indian tribes, state and local governments, and non-governmental organizations protect working agricultural lands and limit non-agricultural uses of the land. Un-der the Wetlands Reserve Easements component, NRCS helps to restore, protect, and enhance enrolled wetlands
US Fish and Wildlife Service National Coastal Wetlands Conservation Grants - The Coastal Wetlands Conservation Grants Program is an effective approach that as-sists states to acquire, restore, manage, and enhance their coastal wetland resources. The program’s emphasis on encouraging partnerships, supporting wa-tershed planning, and leveraging existing funds produces maximum benefits.
EPA/TCEQ/TSSWCB 319(h) - The EPA provides grant funding to Texas to imple-ment the state’s approved Nonpoint Source (NPS) Management Program. The EPA-approved state NPS program provides the framework for determining which activities are eligible for funding under CWA Section 319(h). In general, these ac-tivities include non-regulatory programs and are related to controlling NPS pollution; EPA-approved NPS programs cover costs associated with technical as-sistance, financial assistance, education, training, technology transfer,
Implementation Plan for Two TMDLs for Indicator Bacteria in the Mission and Aransas Rivers
Mission and Aransas Rivers TMDL Stakeholders 29 Approved May 25, 2016
demonstration projects, and monitoring to assess the success of specific NPS pro-jects.
USDA Sustainable Agriculture Research & Education (SARE) - The SARE program funds efforts that enhance the capabilities of Texas agricultural professionals in the area of sustainable agriculture. Grants and education are available to advance innovations in sustainable agriculture. The grants are aimed at advancing sustain-able innovations and have contributed to an impressive portfolio of sustainable agriculture efforts across the nation.
USDA National Institute of Food and Agriculture Farm Business Management and Benchmarking (FBMB) Competitive Grants Program - The FBMB Competitive Grants Program provides funds to (1) improve the farm management knowledge and skills of agricultural producers; and (2) establish and maintain a national, pub-licly available, farm financial management database to support improved farm management.
National Oceanographic and Atmospheric Administration (NOAA) Coastal Zone Management Administration (CZMA) Awards - This program assists states in im-plementing and enhancing CZMA programs that have been approved by the U.S. Commerce Department. Funds are available for projects in areas such as coastal wetlands management and protection, natural hazards management, public access improvements, reduction of marine debris, assessment of impacts of coastal growth and development, special area management planning, regional manage-ment issues, and demonstration projects with potential to improve coastal zone management.
USDA National Integrated Water Quality Program (NIWQP) - The NIWQP pro-vides funding for research, education, and extension projects aimed at improving water quality in agricultural and rural watersheds. The NIWQP has identified eight themes that are being promoted in research, education, and extension. The eight themes are (1) animal manure and waste management, (2) drinking water and hu-man health, (3) environmental restoration, (4) nutrient and pesticide management (5) pollution assessment and prevention (6) watershed management, (7) water conservation and agricultural water management and (8) water policy and eco-nomics. Awards are made in four program areas — National Projects, Regional Coordination Projects, Extension Education Projects, and Integrated Research, Education, and Extension Projects. It is important to note that funding from this program is only available to universities.
EPA Environmental Education (EE) Grants - Under the EE Grant Program, EPA seeks grant proposals from eligible applicants to support environmental education projects that promote environmental stewardship and help develop knowledgeable and responsible students, teachers, and citizens. This grant program provides fi-nancial support for projects that design, demonstrate, and/or disseminate
Implementation Plan for Two TMDLs for Indicator Bacteria in the Mission and Aransas Rivers
Mission and Aransas Rivers TMDL Stakeholders 30 Approved May 25, 2016
environmental education practices, methods, or techniques as described in Re-quests for Proposals.
EPA Targeted Watershed Grants Program - The Targeted Watersheds Grant Pro-gram is designed to encourage successful community-based approaches and management techniques to protect and restore the nation's watersheds. The Tar-geted Watersheds Grant program is a competitive grant program based on the fundamental principles of environmental improvement: collaboration, new tech-nologies, market incentives, and results-oriented strategies. The Targeted Watersheds Grant Program focuses on multi-faceted plans for protecting and re-storing water resources that are developed using partnership efforts of diverse stakeholders.
USDA-National Institute of Food and Agriculture (NIFA) Integrated Programs - NIFA Integrated Programs provide support for integrated research, education, and extension activities. Integrated, multi-functional projects are particularly effective in addressing important agricultural issues through the conduct of problem-fo-cused research that is combined with education and extension of knowledge to those in need of solutions. These activities address critical national, regional, and multi-state agricultural issues, priorities, or problems. Integrated Programs hold the greatest potential to produce and disseminate knowledge and technology di-rectly to end users while providing for educational opportunities to assure agricultural expertise in future generations.
USDA-NIFA Agricultural Food Research Initiative Competitive Fellowship Grants Program - The goal of the NIFA Agricultural Food Research Initiative Competitive Fellowship Grants Programs is to provide funding for fundamental and applied research, extension, and education to address food and agricultural sciences. Six topic areas are eligible for funding: A) Plant health and production and plant prod-ucts; B) Animal health and production and animal products C); Food safety, nutrition, and health D); Renewable energy, natural resources, and environment E); Agriculture systems and technology and; F) Agriculture economics and rural communities.
This I-Plan targets the adoption and implementation of a total of 203 conservation plans and 6 education programs over a five year period. Adoption and implemen-tation of the conservation plans is estimated to cost an average of $15,000 per plan (Table 12). Funding for implementation the plans, either in the form of grants or through cost sharing incentives, is available through the agencies/entities listed under the descriptions provided previously in this section. The funding needed for education programs was estimated using an average cost of $50,000 per program.
Implementation Plan for Two TMDLs for Indicator Bacteria in the Mission and Aransas Rivers
Mission and Aransas Rivers TMDL Stakeholders 31 Approved May 25, 2016
Table 12. Estimated Costs
Entity Activities Needed Estimated Costs
Entities Administering Incentive Programs for Stakeholders
Implementation of 203 Conserva-tion Plans at $15,000 each
$3,045,000
Entities Administering Educa-tion/Outreach Programs
Education and Outreach Programs $300,000
Measurable Milestones Measurable milestones for this management measure will consist of:
The number of landowners contacted The number of conservation plans developed The number of education/outreach programs delivered and materials devel-
oped
Progress Indicators Progress indicators for this management measure will consist of the following:
Year 1 – develop 24 conservation plans in the Aransas River watershed and 16 in the Mission River Watershed; seek funding for an education campaign; de-velop education campaign
Year 2 – develop 24 additional conservation plans in the Aransas River water-shed and an additional 16 in the Mission River Watershed; secure funding for an education campaign; initiate education campaign
Year 3 – develop 24 additional conservation plans in the Aransas River water-shed and 16 in the Mission River watershed; deliver 2 educational programs
Year 4 – develop 25 additional conservation plans in the Aransas River water-shed and 16 in the Mission River watershed; deliver 2 educational programs
Year 5 – develop 25 additional conservation plans in the Aransas River water-shed and 17 in the Mission River watershed; deliver 2 educational programs
Monitoring Component Monitoring of this management measure will consist of utilizing the TCEQ’s CRP to monitor surface water quality and to measure bacteria loadings, especially in critical areas. Additional monitoring may be needed and should be developed un-der Management Measure 9 of this document.
Implementation Schedule
Year 1: As funding allows, the TSSWCB, Texas AgriLife, and NRCS will:
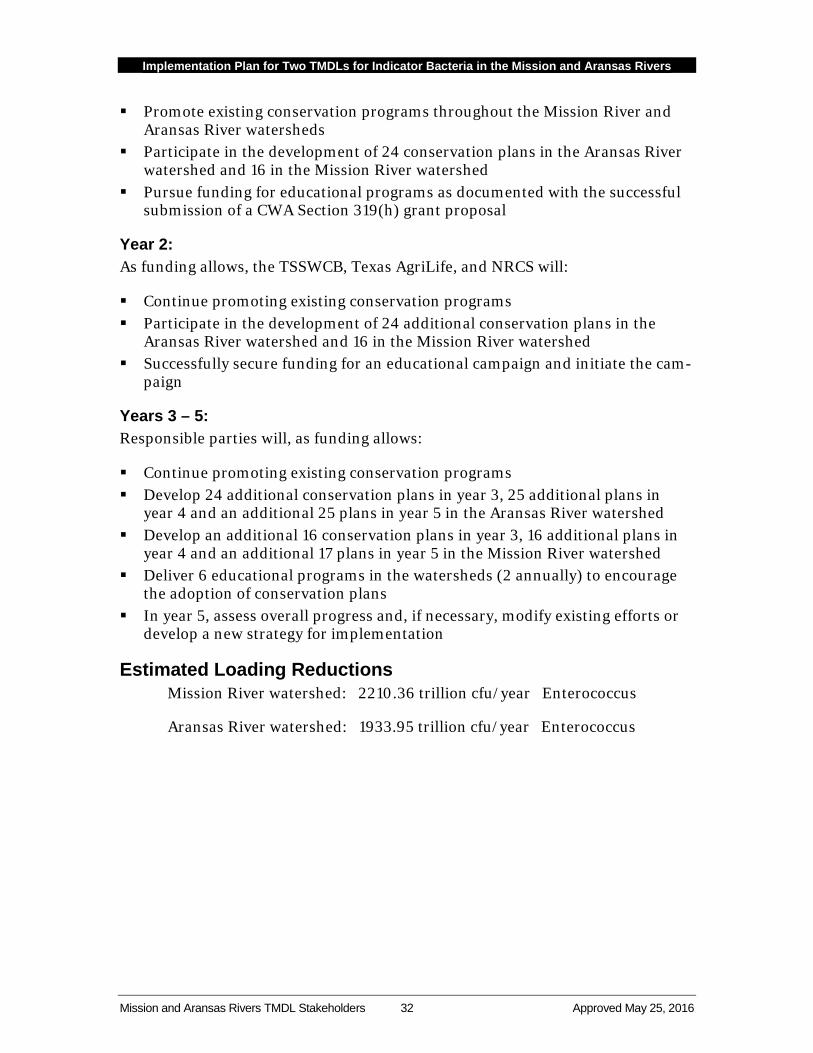
Implementation Plan for Two TMDLs for Indicator Bacteria in the Mission and Aransas Rivers
Mission and Aransas Rivers TMDL Stakeholders 32 Approved May 25, 2016
Promote existing conservation programs throughout the Mission River and Aransas River watersheds
Participate in the development of 24 conservation plans in the Aransas River watershed and 16 in the Mission River watershed
Pursue funding for educational programs as documented with the successful submission of a CWA Section 319(h) grant proposal
Year 2: As funding allows, the TSSWCB, Texas AgriLife, and NRCS will:
Continue promoting existing conservation programs Participate in the development of 24 additional conservation plans in the
Aransas River watershed and 16 in the Mission River watershed Successfully secure funding for an educational campaign and initiate the cam-
paign
Years 3 – 5: Responsible parties will, as funding allows:
Continue promoting existing conservation programs Develop 24 additional conservation plans in year 3, 25 additional plans in
year 4 and an additional 25 plans in year 5 in the Aransas River watershed Develop an additional 16 conservation plans in year 3, 16 additional plans in
year 4 and an additional 17 plans in year 5 in the Mission River watershed Deliver 6 educational programs in the watersheds (2 annually) to encourage
the adoption of conservation plans In year 5, assess overall progress and, if necessary, modify existing efforts or
develop a new strategy for implementation
Estimated Loading Reductions Mission River watershed: 2210.36 trillion cfu/year Enterococcus
Aransas River watershed: 1933.95 trillion cfu/year Enterococcus
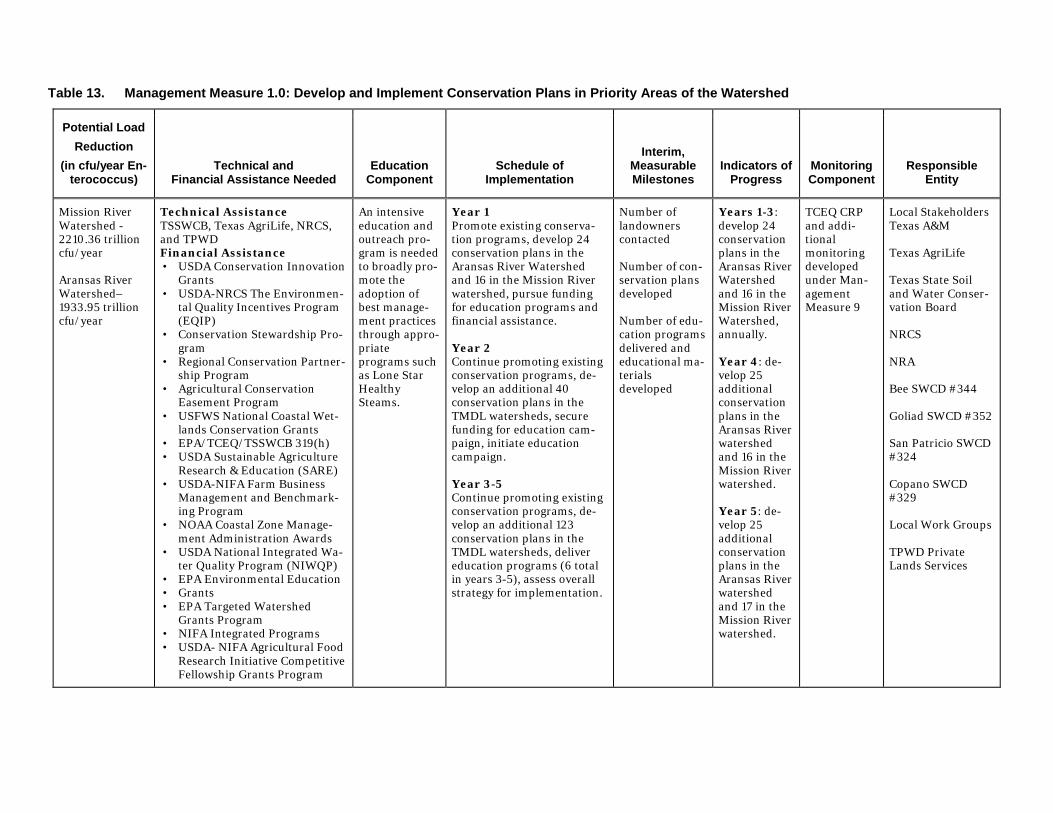
Table 13. Management Measure 1.0: Develop and Implement Conservation Plans in Priority Areas of the Watershed
Potential Load Reduction
(in cfu/year En-terococcus)
Technical and Financial Assistance Needed
Education Component
Schedule of Implementation
Interim, Measurable Milestones
Indicators of Progress
Monitoring Component
Responsible Entity
Mission River Watershed - 2210.36 trillion cfu/year Aransas River Watershed– 1933.95 trillion cfu/year
Technical Assistance TSSWCB, Texas AgriLife, NRCS, and TPWD Financial Assistance • USDA Conservation Innovation
Grants • USDA-NRCS The Environmen-
tal Quality Incentives Program (EQIP)
• Conservation Stewardship Pro-gram
• Regional Conservation Partner-ship Program
• Agricultural Conservation Easement Program
• USFWS National Coastal Wet-lands Conservation Grants
• EPA/TCEQ/TSSWCB 319(h) • USDA Sustainable Agriculture
Research & Education (SARE) • USDA-NIFA Farm Business
Management and Benchmark-ing Program
• NOAA Coastal Zone Manage-ment Administration Awards
• USDA National Integrated Wa-ter Quality Program (NIWQP)
• EPA Environmental Education • Grants • EPA Targeted Watershed
Grants Program • NIFA Integrated Programs • USDA- NIFA Agricultural Food
Research Initiative Competitive Fellowship Grants Program
An intensive education and outreach pro-gram is needed to broadly pro-mote the adoption of best manage-ment practices through appro-priate programs such as Lone Star Healthy Steams.
Year 1 Promote existing conserva-tion programs, develop 24 conservation plans in the Aransas River Watershed and 16 in the Mission River watershed, pursue funding for education programs and financial assistance. Year 2 Continue promoting existing conservation programs, de-velop an additional 40 conservation plans in the TMDL watersheds, secure funding for education cam-paign, initiate education campaign. Year 3-5 Continue promoting existing conservation programs, de-velop an additional 123 conservation plans in the TMDL watersheds, deliver education programs (6 total in years 3-5), assess overall strategy for implementation.
Number of landowners contacted Number of con-servation plans developed Number of edu-cation programs delivered and educational ma-terials developed
Years 1-3: develop 24 conservation plans in the Aransas River Watershed and 16 in the Mission River Watershed, annually. Year 4: de-velop 25 additional conservation plans in the Aransas River watershed and 16 in the Mission River watershed. Year 5: de-velop 25 additional conservation plans in the Aransas River watershed and 17 in the Mission River watershed.
TCEQ CRP and addi-tional monitoring developed under Man-agement Measure 9
Local Stakeholders Texas A&M Texas AgriLife Texas State Soil and Water Conser-vation Board NRCS NRA Bee SWCD #344 Goliad SWCD #352 San Patricio SWCD #324 Copano SWCD #329 Local Work Groups TPWD Private Lands Services
Implementation Plan for Two TMDLs for Indicator Bacteria in the Mission and Aransas Rivers
Mission and Aransas Rivers TMDL Stakeholders 34 Approved May 25, 2016
Management Measure 2 Explore Feasibility of Altering Tax Exemption Requirements for Small Acreage Landowners
Management Measure 2 is a stakeholder-initiated effort to reduce overstocking of livestock on small acreage land parcels. It should be noted that, except for its au-thority to determine tax-exempt pollution control property, the TCEQ does not have authority related to the property tax exemption requirements of any taxing units in the state. Local county tax appraisal districts or other organizations hold this authority. This management measure does not establish a TCEQ policy or an opinion regarding property tax exemption requirements.
Description The primary focus of this management measure is to reduce over stocking on small acreage by altering the property tax exemption requirements. Currently, small acreage landowners apply for agricultural property tax exemptions and must stock their land to meet the tax requirement. Often, this stocking rate is beyond the car-rying capacity of the land.
The purpose of this management measure is to outline a path for moving discus-sions forward across the watershed to explore alternatives for property tax exemptions that would encourage the adoption of practices that mitigate the ef-fects of overstocking on small acreage properties receiving agricultural property tax exemptions. Before a dialogue is initiated with landowners, taxing authorities, and lawmakers, an effective framework must be developed to describe proposed management requirements at various levels.
To initiate this process, representatives from state and local governmental entities and watershed stakeholders will convene and discuss the feasibility of using exist-ing tax exemptions and/or developing a new (or altering existing) tax exemption framework that can be used for county standards that promote improved water quality on small acreage lands. If feasible, discussions will be continued to collec-tively develop this framework. Realizing that each entity has its own specific needs and circumstances to address, the framework will remain flexible so that language for entity-specific standards can be adapted from this general framework to meet these individual needs. It should be noted that standard development and adop-tion are two distinctly separate items. Language for a proposed standard should be developed and presented to the appropriate entities for consideration and possible adoption. As a result, adoption will depend directly on the parties involved and is not universally guaranteed.
The motive behind this management measure is the desire by landowners in the watershed to have the entities tasked with providing agricultural exemptions across the watershed work with small acreage land owners to collectively develop
Implementation Plan for Two TMDLs for Indicator Bacteria in the Mission and Aransas Rivers
Mission and Aransas Rivers TMDL Stakeholders 35 Approved May 25, 2016
local solutions to address the water quality needs of all stakeholders in the water-shed. Within this overarching management goal, more specific needs can be addressed as they are identified. These may include needs such as evaluating the benefits of not overstocking small acreage lands for a future agricultural tax ex-emption status.
Education Component Education is also viewed as a critical need to effectively implement this manage-ment measure. Elected officials ultimately decide the fate of tax exemption statuses and if changes will be adopted. Ensuring that all responsible parties understand the need for improved water quality, and the specific intention of the proposed changes, is critical for their adoption. An education effort is planned to target these elected officials. The efforts will be designed to deliver materials and messages about small acreage impacts on water quality to these officials. In addition, an ed-ucation program is needed that focuses on small acreage landowners to provide education on the impacts of overstocking, in addition to the importance of adopt-ing a conservation plan, such as those outlined in Management Measure 1 of this I-Plan document.
Priority Areas There are no geographic priorities for this management measure other than focus-ing on small acreage properties with agricultural tax exemptions within the counties of the watershed.
Responsible Parties and Funding
Responsible Parties The members of the Coordinating Committee for the Mission and Aransas River Tidal bacteria TMDL and I-Plan will be responsible for assembling local and state experts that will assist in developing the framework for proposing alternatives for agricultural property tax exemptions for small acreage properties.
Representatives of local, regional, state, and federal governments will be responsi-ble for evaluating the proposed alternatives to agricultural property tax exemptions for small acreage properties and communicating the results of these evaluations to local stakeholders and tax authorities.
The following entities will be responsible for evaluating alternatives for property tax exemptions favorable to water quality improvement.
Bee County Appraisal District Goliad County Appraisal District San Patricio County Appraisal District Refugio County Appraisal District
Implementation Plan for Two TMDLs for Indicator Bacteria in the Mission and Aransas Rivers
Mission and Aransas Rivers TMDL Stakeholders 36 Approved May 25, 2016
Aransas County Appraisal District Coastal Bend Council of Governments Golden Crescent Regional Planning Commission Landowners and other stakeholders will provide input regarding their concerns and comments about the alternatives for property tax exemptions.
Technical Assistance Technical assistance may be needed from the Texas Comptroller of Public Ac-counts office to ensure that all requirements of the tax code have been met. Also, other technical assistance may be needed and will be pursued as necessary.
The V.G. Young Institute of County Government is a part of Texas AgriLife and the Texas A&M University System. Located in College Station, the Institute works to meet the educational needs of county officials and the public by anticipating, iden-tifying, and addressing the challenges and opportunities faced by Texas county governments. The Institute fulfills this charge by offering various educational pro-grams, published reference materials, and counsel to county officials, community organizations, and citizens across the state. The Institute is dedicated to the Exten-sion mission: “improving lives of people, businesses, and communities across Texas and beyond through high-quality, relevant education” according to Texas AgriLife (2013).
Financial Assistance Funds will be pursued through TSSWCB or TCEQ CWA Section 319(h) grants.
Table 14. Estimated Costs
Entity Activities Needed Estimated Costs
Educational Entities Education for elected officials and other responsible parties
$115,000
Measurable Milestones Measurable milestones for this management measure will consist of:
The number of times that responsible parties convene to discuss the available alternatives for property tax exemptions
Development of a framework for altering these tax exemptions Development of a proposal for changes submitted to various tax authorities or
elected officials Changes implemented
Progress Indicators Progress indicators for this management measure will consist of the following:
Implementation Plan for Two TMDLs for Indicator Bacteria in the Mission and Aransas Rivers
Mission and Aransas Rivers TMDL Stakeholders 37 Approved May 25, 2016
Year 1 – responsible parties convene to discuss alternatives; a submitted pro-posal for funding of educational activities
Year 2 – number of meetings to discuss alternatives, secured funding for edu-cational activities and an initiated educational campaign
Years 3 - 4 – development of a framework for altering property tax exemptions; number of individuals (both elected officials and landowners) educated
Year 5 – proposed changes submitted for consideration to appropriate entity (taxing authorities and/or elected officials); proposed changes adopted; num-ber of individuals educated; number of educational events held
Monitoring Component Monitoring for this management measure will consist of continuing TCEQ CRP surface water quality monitoring at existing sites and an expanded monitoring pro-gram, if needed, developed under Management Measure 9 of this I-Plan.
Implementation Schedule
Years 1 – 2: Responsible parties will, as funding allows:
Convene to discuss alternatives/changes for property tax exemptions Record the number of meetings Submit an education proposal to fulfill the requirements of the education
component in this management measure
Years 3 – 4: Responsible parties will, as funding allows:
Develop a framework for altering the property tax exemptions (measured by the number of meetings held, but primary milestone will be the progress of the framework document)
Successfully secure funding for educational activities Begin educational activities, where the number of individuals educated (both
elected officials and landowners) will be measured
Year 5: Responsible parties will, as funding allows:
Successfully submit the proposed changes for tax exemptions to the appropri-ate entities
Measure the adoption rate of those proposed changes that can be measured. It should be noted that the number of tax exemptions changed to the alternative
Implementation Plan for Two TMDLs for Indicator Bacteria in the Mission and Aransas Rivers
Mission and Aransas Rivers TMDL Stakeholders 38 Approved May 25, 2016
structure should be measured if the structure of the framework is adopted and adopted in time to be implemented under this plan.
Measure the number of individuals educated and programs delivered
Estimated Loading Reductions Potential pollutant load reductions from establishing new tax exemption require-ments cannot be quantified at this time.
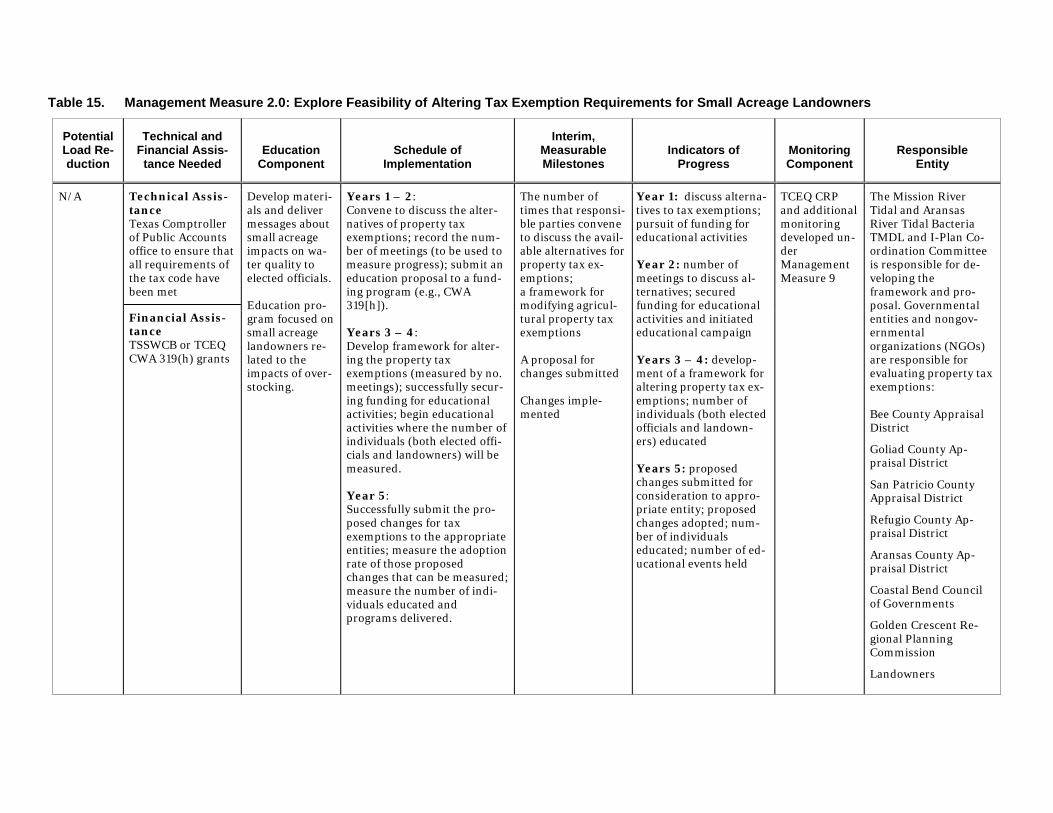
Table 15. Management Measure 2.0: Explore Feasibility of Altering Tax Exemption Requirements for Small Acreage Landowners
Potential Load Re-duction
Technical and Financial Assis-
tance Needed Education
Component Schedule of
Implementation
Interim, Measurable Milestones
Indicators of Progress
Monitoring Component
Responsible Entity
N/A Technical Assis-tance Texas Comptroller of Public Accounts office to ensure that all requirements of the tax code have been met
Develop materi-als and deliver messages about small acreage impacts on wa-ter quality to elected officials. Education pro-gram focused on small acreage landowners re-lated to the impacts of over-stocking.
Years 1 – 2: Convene to discuss the alter-natives of property tax exemptions; record the num-ber of meetings (to be used to measure progress); submit an education proposal to a fund-ing program (e.g., CWA 319[h]). Years 3 – 4: Develop framework for alter-ing the property tax exemptions (measured by no. meetings); successfully secur-ing funding for educational activities; begin educational activities where the number of individuals (both elected offi-cials and landowners) will be measured. Year 5: Successfully submit the pro-posed changes for tax exemptions to the appropriate entities; measure the adoption rate of those proposed changes that can be measured; measure the number of indi-viduals educated and programs delivered.
The number of times that responsi-ble parties convene to discuss the avail-able alternatives for property tax ex-emptions; a framework for modifying agricul-tural property tax exemptions A proposal for changes submitted Changes imple-mented
Year 1: discuss alterna-tives to tax exemptions; pursuit of funding for educational activities Year 2: number of meetings to discuss al-ternatives; secured funding for educational activities and initiated educational campaign Years 3 – 4: develop-ment of a framework for altering property tax ex-emptions; number of individuals (both elected officials and landown-ers) educated Years 5: proposed changes submitted for consideration to appro-priate entity; proposed changes adopted; num-ber of individuals educated; number of ed-ucational events held
TCEQ CRP and additional monitoring developed un-der Management Measure 9
The Mission River Tidal and Aransas River Tidal Bacteria TMDL and I-Plan Co-ordination Committee is responsible for de-veloping the framework and pro-posal. Governmental entities and nongov-ernmental organizations (NGOs) are responsible for evaluating property tax exemptions: Bee County Appraisal District
Goliad County Ap-praisal District
San Patricio County Appraisal District
Refugio County Ap-praisal District
Aransas County Ap-praisal District
Coastal Bend Council of Governments
Golden Crescent Re-gional Planning Commission
Landowners
Financial Assis-tance TSSWCB or TCEQ CWA 319(h) grants
Implementation Plan for Two TMDLs for Indicator Bacteria in the Mission and Aransas Rivers
Mission and Aransas Rivers TMDL Stakeholders 40 Approved May 25, 2016
Management Measure 3 Promote the Management of Feral Hogs and Control Their Populations
Description Feral hogs have been identified as significant contributors of pollutants to surface water bodies. As feral hogs congregate around water resources to drink and wal-low, the concentration of high numbers of feral hogs in riparian areas poses a threat to water quality. Fecal matter deposited directly in streams by feral hogs contributes bacteria and nutrients, polluting the state’s water bodies. In addition, extensive rooting activities of groups of feral hogs can cause extreme erosion and soil loss. The destructive habits of feral hogs cause an estimated $52 million worth of agricultural crop and property damage each year in Texas. Also, it has been es-timated that 60 to 70 percent of feral hogs would need to be removed annually to hold the population stable with no increase (Burns, 2011). Stakeholders in water-sheds across the state, including the Mission River and Aransas River watersheds, have recommended that efforts to control feral hogs be undertaken to reduce the population, limit the spread of these animals, and minimize their effects on water quality and the surrounding environment.
The purpose of this management measure is to manage the feral hog population in the TMDL watersheds such that the current population does not increase. Without a significant removal of feral hogs from the watershed on an annual basis and sus-tained efforts to keep the population at a manageable level, water quality improvements may not be realized. Various control efforts are currently employed such as live trapping, shooting, hunting with dogs, aerial hunting, exclusion, and habitat management. The continuation and increased intensity of these practices, especially in priority areas, along with technical and financial assistance is needed to reach the overall goal of this I-Plan. Activities will be targeted towards priority areas where landowners should be contacted to discuss the economic savings of removing feral hogs, specific methods for doing so, and available programs that assist in feral hog removal.
In an effort to track progress of this management measure, the Texas AgriLife Feral Hog Reporting tool will be utilized in addition to other tracking techniques. Also, sightings of feral hogs are a notable indicator of the feral hog population. The re-porting tool is an important instrument for identifying and controlling feral hog populations. The reporting tool can be found at <http://feralhogreports.tamu.edu/>.
Implementation for much of this management measure is dependent on available funding. Funding assistance will be needed for personnel, materials, supplies for feral hog management activities, and education.
Implementation Plan for Two TMDLs for Indicator Bacteria in the Mission and Aransas Rivers
Mission and Aransas Rivers TMDL Stakeholders 41 Approved May 25, 2016
Education Component Education and outreach for this management measure is needed to ensure that stakeholders understand the importance of feral hog removal and the economic savings that result from such removal. Some educational programs exist through Texas AgriLife and are discussed in the following description of this management measure, but services offered by Texas AgriLife are statewide programs and fund-ing for personnel is limited. Stakeholders would benefit greatly by receiving educational materials; therefore, a targeted campaign should be implemented con-sisting of multiple educational opportunities for stakeholders, including the development and tailoring of educational materials, and the dissemination of these materials. Additionally, an evaluation should be performed to gain an overall un-derstanding of the economic losses faced by landowners and the needs that exist for feral hog control services.
Priority Areas Priority areas for this management measure are found where feral hogs have the highest potential for congregating based on land cover. Specific subwatersheds are:
Aransas River Watershed – 1, 2 ,3, 4, 6, 7, 9, and 11 Mission River Watershed – 2, 4, 5, 8, 9, and 14
Responsible Parties and Funding
Responsible Parties
Stakeholders: The Mission River and Aransas River watershed stakeholders will take advantage of services provided by the TWS and Texas AgriLife by requesting feral hog man-agement workshops for landowners, local governments, and other interested individuals as appropriate. Workshops will be heavily promoted in the Texas AgriLife newsletter, as well as in local newspapers and on radio stations. Manage-ment activities, such as population control and exclusion measures, can also be implemented by local governments as appropriate. If interest in workshops re-mains strong after the term of this I-Plan, Texas AgriLife will continue to arrange workshops throughout the TMDL watersheds.
Texas A&M AgriLife Extension Service: Funded with TSSWCB CWA Section 319(h) nonpoint source grants, Texas AgriLife and the Texas Water Resources Institute developed the Lone Star Healthy Streams – Feral Hog curriculum. This education program is delivered statewide and serves as the foundation for educating landowners about the effects of feral hogs on bac-teria loading into streams and also about control techniques designed to abate feral hogs and reduce their bacteria contributions.
Implementation Plan for Two TMDLs for Indicator Bacteria in the Mission and Aransas Rivers
Mission and Aransas Rivers TMDL Stakeholders 42 Approved May 25, 2016
Concurrent with curriculum development, and with TSSWCB funding, Texas AgriLife has developed:
A series of publications addressing management strategies and techniques for feral hog control, and
An on-line feral hog activity reporting system to support identification of tar-get areas for implementation of feral hog control activities, as mentioned above.
While both the publication series and the on-line reporting tool are being piloted in the Plum Creek watershed, they have statewide applicability to watersheds im-pacted by feral hogs, including the Mission River and Aransas River watersheds. The project workplan and more information can be found at the following web-sites: <www.tsswcb.texas.gov/managementprogram/lonestar2> and <http:// plumcreek.tamu.edu/FeralHogs>.
TWS, Feral Hog Abatement Program: With continuous efforts, feral hogs can be managed. TWS, through cooperative agreements between Texas AgriLife and the USDA’s Animal and Plant Health In-spection Service, provide statewide leadership in the science, education, and practice of wildlife and invasive species management (including feral hogs) to pro-tect the state’s agricultural, industrial, and natural resources, as well as the public’s health, safety, and property (Texas Health and Safety Code Chapter 825).
Technical Assistance TWS, in addition to the assistance described above, anticipates that additional co-operative funding will be necessary to continue the focused feral hog control activities in the state.
Financial Assistance TWS is available to provide assistance in addressing feral hog issues and will re-main available to all citizens of the state. While direct control will be limited to availability of personnel in cooperative association areas (i.e., areas designated by groups of landowners to improve wildlife habitats and other associated wildlife programs [TPWD, 2004]), technical assistance can be provided to individuals on how to best resolve feral hog problems. Since 2008, the Texas Department of Ag-riculture (TDA) has awarded grants to TWS for a feral hog abatement program. The grants are used to carry out a number of specifically identified direct control projects where control efforts can be measured. Certain areas of the state have been targeted due to the contributions from feral hogs to impaired water quality and bacteria loading.
The TDA administers a County Hog Abatement Matching Program (CHAMP). CHAMP is designed to encourage counties across the State of Texas to create part-nerships with other counties, local governments, businesses, landowners, and
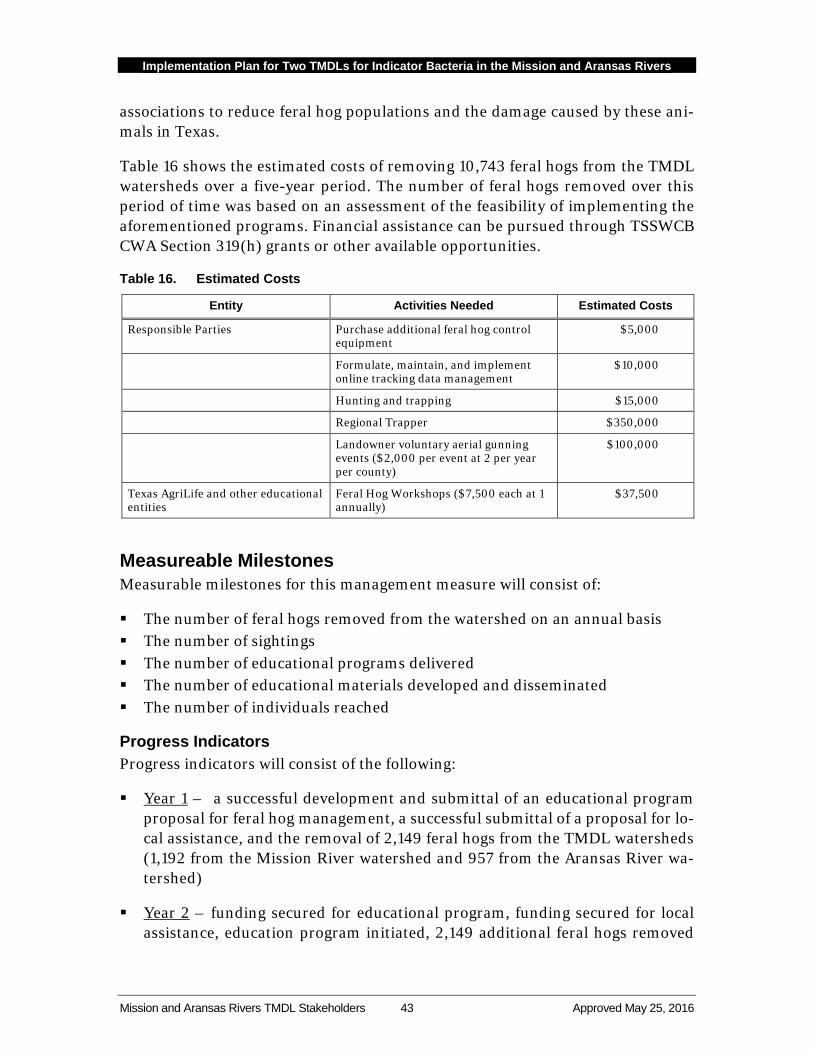
Implementation Plan for Two TMDLs for Indicator Bacteria in the Mission and Aransas Rivers
Mission and Aransas Rivers TMDL Stakeholders 43 Approved May 25, 2016
associations to reduce feral hog populations and the damage caused by these ani-mals in Texas.
Table 16 shows the estimated costs of removing 10,743 feral hogs from the TMDL watersheds over a five-year period. The number of feral hogs removed over this period of time was based on an assessment of the feasibility of implementing the aforementioned programs. Financial assistance can be pursued through TSSWCB CWA Section 319(h) grants or other available opportunities.
Table 16. Estimated Costs
Entity Activities Needed Estimated Costs
Responsible Parties Purchase additional feral hog control equipment
$5,000
Formulate, maintain, and implement online tracking data management
$10,000
Hunting and trapping $15,000
Regional Trapper $350,000
Landowner voluntary aerial gunning events ($2,000 per event at 2 per year per county)
$100,000
Texas AgriLife and other educational entities
Feral Hog Workshops ($7,500 each at 1 annually)
$37,500
Measureable Milestones Measurable milestones for this management measure will consist of:
The number of feral hogs removed from the watershed on an annual basis The number of sightings The number of educational programs delivered The number of educational materials developed and disseminated The number of individuals reached
Progress Indicators Progress indicators will consist of the following:
Year 1 – a successful development and submittal of an educational program proposal for feral hog management, a successful submittal of a proposal for lo-cal assistance, and the removal of 2,149 feral hogs from the TMDL watersheds (1,192 from the Mission River watershed and 957 from the Aransas River wa-tershed)
Year 2 – funding secured for educational program, funding secured for local assistance, education program initiated, 2,149 additional feral hogs removed
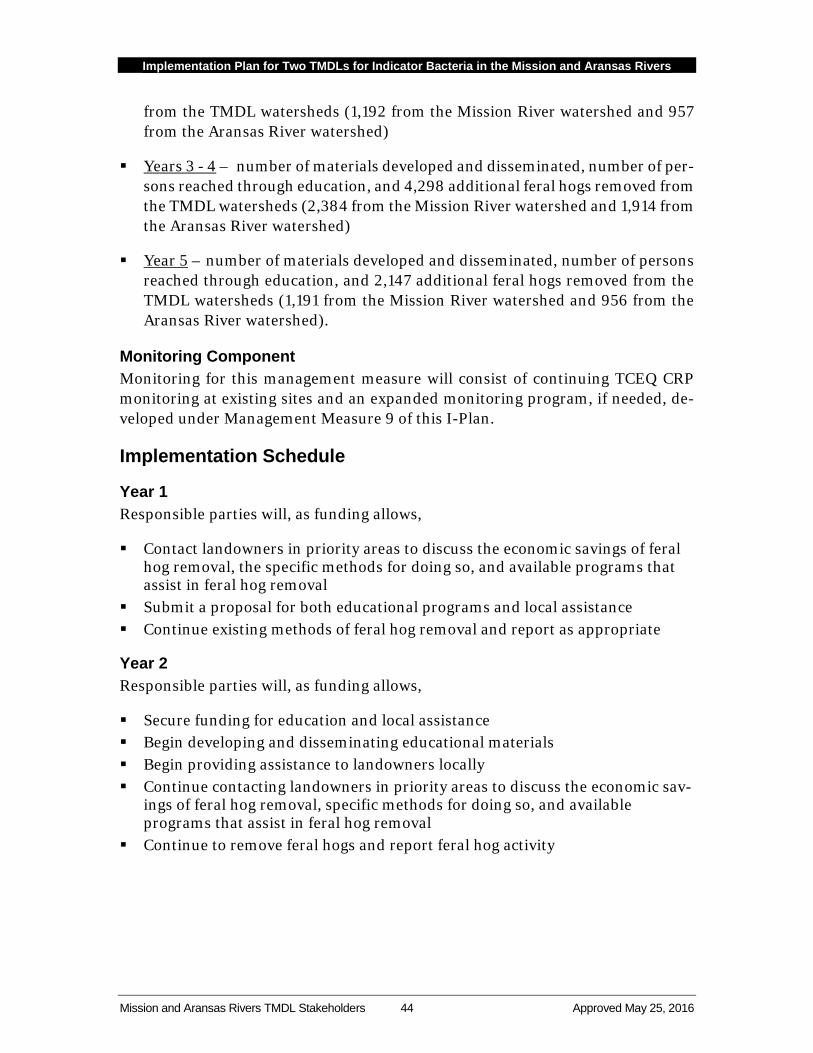
Implementation Plan for Two TMDLs for Indicator Bacteria in the Mission and Aransas Rivers
Mission and Aransas Rivers TMDL Stakeholders 44 Approved May 25, 2016
from the TMDL watersheds (1,192 from the Mission River watershed and 957 from the Aransas River watershed)
Years 3 - 4 – number of materials developed and disseminated, number of per-sons reached through education, and 4,298 additional feral hogs removed from the TMDL watersheds (2,384 from the Mission River watershed and 1,914 from the Aransas River watershed)
Year 5 – number of materials developed and disseminated, number of persons reached through education, and 2,147 additional feral hogs removed from the TMDL watersheds (1,191 from the Mission River watershed and 956 from the Aransas River watershed).
Monitoring Component Monitoring for this management measure will consist of continuing TCEQ CRP monitoring at existing sites and an expanded monitoring program, if needed, de-veloped under Management Measure 9 of this I-Plan.
Implementation Schedule
Year 1 Responsible parties will, as funding allows,
Contact landowners in priority areas to discuss the economic savings of feral hog removal, the specific methods for doing so, and available programs that assist in feral hog removal
Submit a proposal for both educational programs and local assistance Continue existing methods of feral hog removal and report as appropriate
Year 2 Responsible parties will, as funding allows,
Secure funding for education and local assistance Begin developing and disseminating educational materials Begin providing assistance to landowners locally Continue contacting landowners in priority areas to discuss the economic sav-
ings of feral hog removal, specific methods for doing so, and available programs that assist in feral hog removal
Continue to remove feral hogs and report feral hog activity
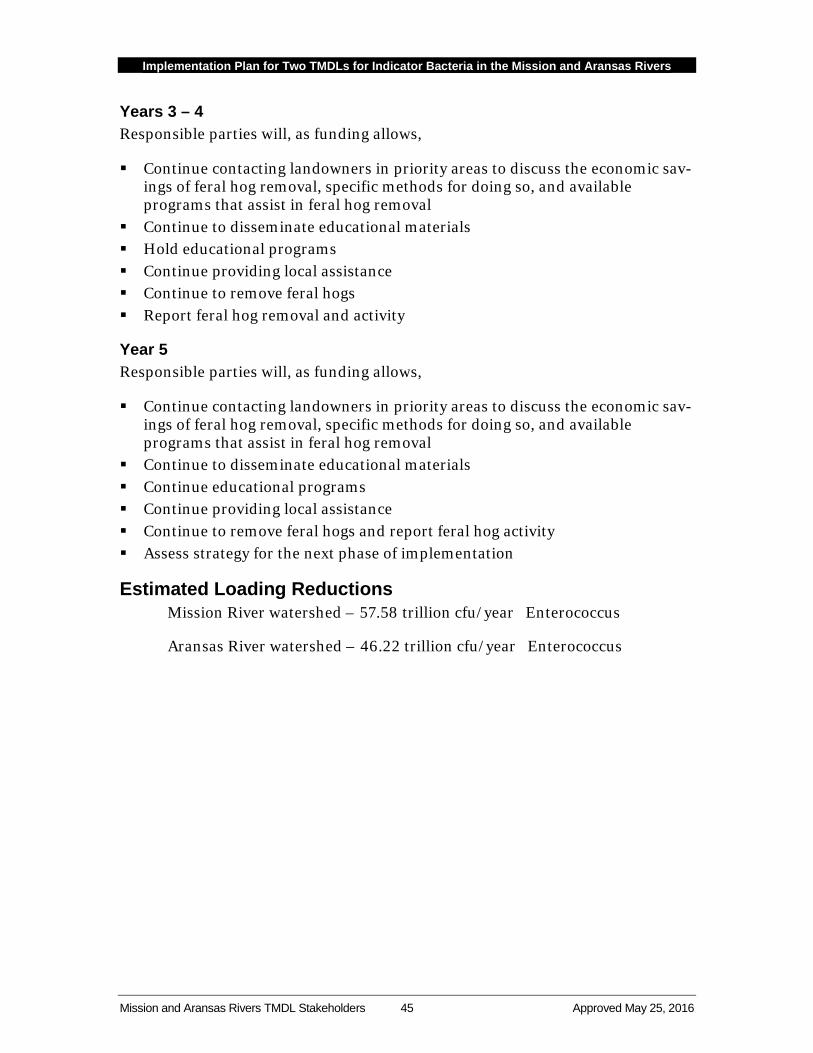
Implementation Plan for Two TMDLs for Indicator Bacteria in the Mission and Aransas Rivers
Mission and Aransas Rivers TMDL Stakeholders 45 Approved May 25, 2016
Years 3 – 4 Responsible parties will, as funding allows,
Continue contacting landowners in priority areas to discuss the economic sav-ings of feral hog removal, specific methods for doing so, and available programs that assist in feral hog removal
Continue to disseminate educational materials Hold educational programs Continue providing local assistance Continue to remove feral hogs Report feral hog removal and activity
Year 5 Responsible parties will, as funding allows,
Continue contacting landowners in priority areas to discuss the economic sav-ings of feral hog removal, specific methods for doing so, and available programs that assist in feral hog removal
Continue to disseminate educational materials Continue educational programs Continue providing local assistance Continue to remove feral hogs and report feral hog activity Assess strategy for the next phase of implementation
Estimated Loading Reductions Mission River watershed – 57.58 trillion cfu/year Enterococcus
Aransas River watershed – 46.22 trillion cfu/year Enterococcus
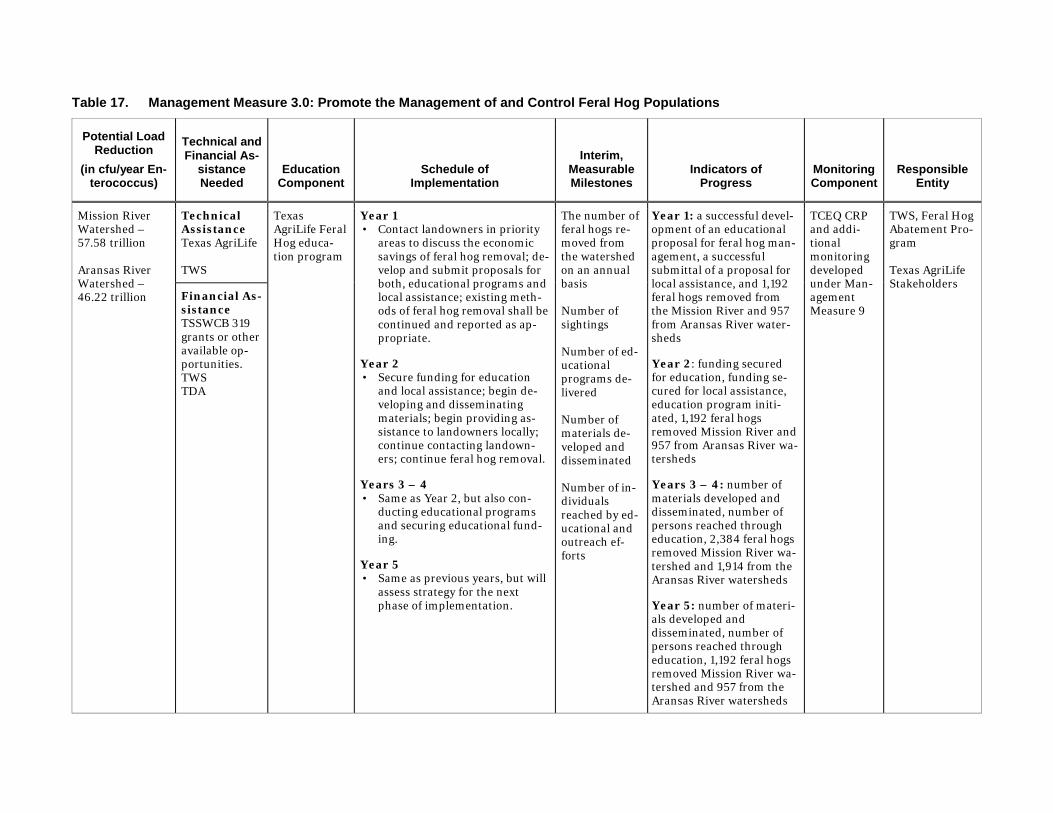
Table 17. Management Measure 3.0: Promote the Management of and Control Feral Hog Populations
Potential Load Reduction
(in cfu/year En-terococcus)
Technical and Financial As-
sistance Needed
Education Component
Schedule of Implementation
Interim, Measurable Milestones
Indicators of Progress
Monitoring Component
Responsible Entity
Mission River Watershed – 57.58 trillion Aransas River Watershed – 46.22 trillion
Technical Assistance Texas AgriLife TWS
Texas AgriLife Feral Hog educa-tion program
Year 1 • Contact landowners in priority
areas to discuss the economic savings of feral hog removal; de-velop and submit proposals for both, educational programs and local assistance; existing meth-ods of feral hog removal shall be continued and reported as ap-propriate.
Year 2 • Secure funding for education
and local assistance; begin de-veloping and disseminating materials; begin providing as-sistance to landowners locally; continue contacting landown-ers; continue feral hog removal.
Years 3 – 4 • Same as Year 2, but also con-
ducting educational programs and securing educational fund-ing.
Year 5 • Same as previous years, but will
assess strategy for the next phase of implementation.
The number of feral hogs re-moved from the watershed on an annual basis Number of sightings Number of ed-ucational programs de-livered Number of materials de-veloped and disseminated Number of in-dividuals reached by ed-ucational and outreach ef-forts
Year 1: a successful devel-opment of an educational proposal for feral hog man-agement, a successful submittal of a proposal for local assistance, and 1,192 feral hogs removed from the Mission River and 957 from Aransas River water-sheds Year 2: funding secured for education, funding se-cured for local assistance, education program initi-ated, 1,192 feral hogs removed Mission River and 957 from Aransas River wa-tersheds Years 3 – 4: number of materials developed and disseminated, number of persons reached through education, 2,384 feral hogs removed Mission River wa-tershed and 1,914 from the Aransas River watersheds Year 5: number of materi-als developed and disseminated, number of persons reached through education, 1,192 feral hogs removed Mission River wa-tershed and 957 from the Aransas River watersheds
TCEQ CRP and addi-tional monitoring developed under Man-agement Measure 9
TWS, Feral Hog Abatement Pro-gram Texas AgriLife Stakeholders
Financial As-sistance TSSWCB 319 grants or other available op-portunities. TWS TDA
Implementation Plan for Two TMDLs for Indicator Bacteria in the Mission and Aransas Rivers
Mission and Aransas Rivers TMDL Stakeholders 47 Approved May 25, 2016
Management Measure 4 Promote the Reduction of Illicit Dumping and Proper Disposal of Animal Car-casses
Description Due to the recent increase in oil and gas drilling activity associated with the Eagle Ford Shale play, the population in the area of the TMDL watersheds has increased substantially in recent years. A portion of the newly arrived population lives in portable buildings and recreational vehicles. These portable homes contain porta-ble bathrooms and as with any portable bathroom, there is a need to periodically dispose of the waste. Scattered throughout the area are disposal sites; however, there is often a fee for using these disposal facilities and as a result, the owners of the recreational vehicles sometimes dispose of their waste in or near local water bodies.
Illicit dumping has also been identified as a concern by the stakeholders. Trash, household items, waste, and animal carcasses have been known to be dumped into some local creeks; during rain events, these items wash downstream onto neigh-boring lands. This has been a concern for stakeholders throughout the TMDL watersheds.
Additionally, the Mission River and Aransas River watersheds are a destination for many outdoor sportsmen. The prime natural habitat, large tracts of well managed land, and abundance of game animals make the area very attractive for hunters. A common practice for some that harvest game species in the watersheds is to dis-pose of the carcasses in low lying areas, away from well-traveled roads and prime recreational areas. Often, these areas are near local water bodies. Education on the proper disposal of animal carcasses is needed to reduce their disposal near local water bodies.
Challenges in enforcing illicit dumping include the lack of available personnel for education and enforcement, lack of equipment necessary to reduce dumping, lack of equipment available to monitor sites for enforcement, and other challenges unique to each specific area. The purpose of this management measure is to reduce the amount of illicit dumping occurring in and near local water bodies. Through various efforts, including education (for both local officials and residents), signage at water bodies, enforcement, and other efforts, illicit dumping in water bodies can be reduced. Responsible parties will develop a strategy to reduce illicit dumping and will implement the strategy in the TMDL watersheds.
Implementation Plan for Two TMDLs for Indicator Bacteria in the Mission and Aransas Rivers
Mission and Aransas Rivers TMDL Stakeholders 48 Approved May 25, 2016
Education Component Education for both residents and local officials is important. Local officials need to understand the implications of illicit dumping and the strategies to reduce this lo-cal source of water pollution. A source of potential educational opportunities for local officials is the Texas Illegal Dumping Resource Center <http://www.tidrc.com/index.html>, which also provides Continuing Education Units to individuals who are interested in receiving educational credits. Residents must also be educated, so that the public understands the harmful effects of illicit dumping on local water bodies. Some possible methods of education could include, but are not limited to, signage at bridge crossings, educational inserts in water bills, and other methods designed to reach the population of interest.
Additionally, there is a need for an educational campaign that consists of educating recreational hunters and local landowners on the proper disposal of animal car-casses. Other targeted educational efforts should be conducted on the proper disposal of recreational vehicle waste. Through this program, educational materi-als can be developed and disseminated through a variety of avenues including, but not limited to, feed stores, direct mailing, newspaper articles, magazine articles, and billboards.
Priority Areas Specific priority areas for this management measure consist of bridge crossings within the respective jurisdictions of the responsible parties. Bridges tend to be a common site of illicit dumping. Furthermore, education about proper disposal of animals and the dumping of waste from recreational vehicles should focus on areas where there is a high demand for hunting, and high density of recreational vehicles.
Responsible Parties and Funding
Responsible Parties The following counties, as well as the holders of Certificates of Convenience and Necessity (CCNs) in the portions of these counties that fall within the TMDL wa-tersheds, will be responsible for enforcing illicit dumping activities within their respective jurisdictions and for delivering educational programs:
Goliad County
Refugio County
Bee County
San Patricio County
Aransas County
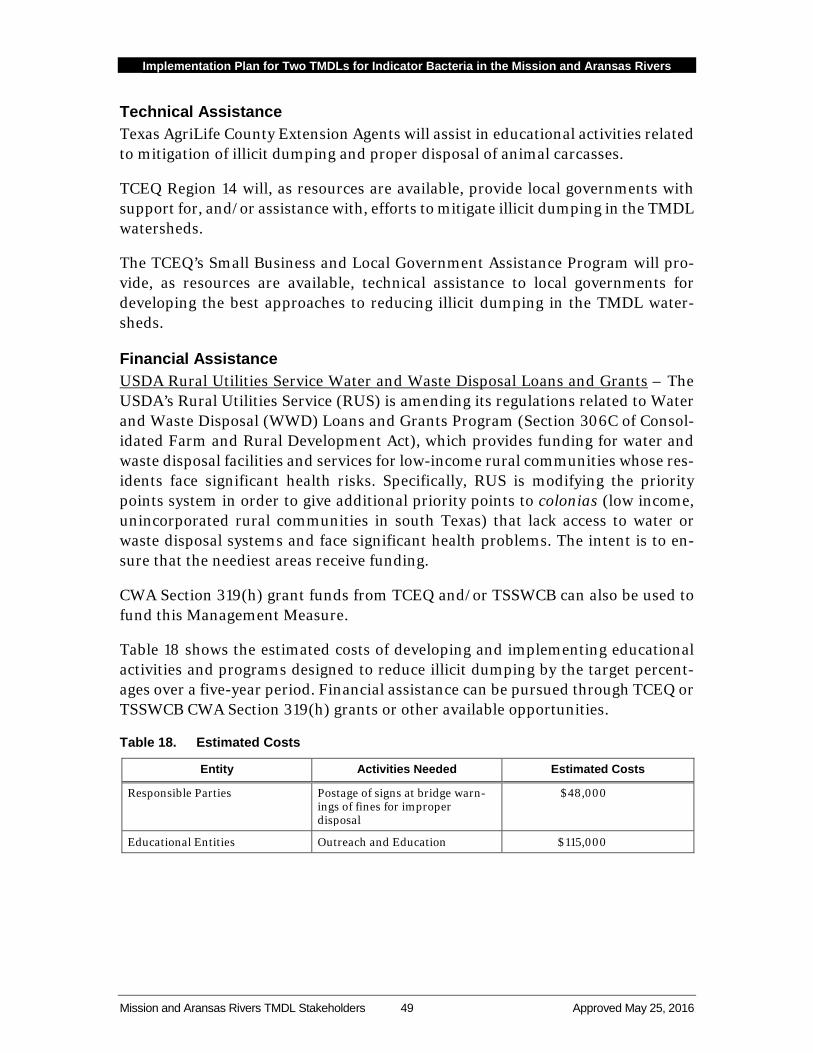
Implementation Plan for Two TMDLs for Indicator Bacteria in the Mission and Aransas Rivers
Mission and Aransas Rivers TMDL Stakeholders 49 Approved May 25, 2016
Technical Assistance Texas AgriLife County Extension Agents will assist in educational activities related to mitigation of illicit dumping and proper disposal of animal carcasses.
TCEQ Region 14 will, as resources are available, provide local governments with support for, and/or assistance with, efforts to mitigate illicit dumping in the TMDL watersheds.
The TCEQ’s Small Business and Local Government Assistance Program will pro-vide, as resources are available, technical assistance to local governments for developing the best approaches to reducing illicit dumping in the TMDL water-sheds.
Financial Assistance USDA Rural Utilities Service Water and Waste Disposal Loans and Grants – The USDA’s Rural Utilities Service (RUS) is amending its regulations related to Water and Waste Disposal (WWD) Loans and Grants Program (Section 306C of Consol-idated Farm and Rural Development Act), which provides funding for water and waste disposal facilities and services for low-income rural communities whose res-idents face significant health risks. Specifically, RUS is modifying the priority points system in order to give additional priority points to colonias (low income, unincorporated rural communities in south Texas) that lack access to water or waste disposal systems and face significant health problems. The intent is to en-sure that the neediest areas receive funding.
CWA Section 319(h) grant funds from TCEQ and/or TSSWCB can also be used to fund this Management Measure.
Table 18 shows the estimated costs of developing and implementing educational activities and programs designed to reduce illicit dumping by the target percent-ages over a five-year period. Financial assistance can be pursued through TCEQ or TSSWCB CWA Section 319(h) grants or other available opportunities.
Table 18. Estimated Costs
Entity Activities Needed Estimated Costs
Responsible Parties Postage of signs at bridge warn-ings of fines for improper disposal
$48,000
Educational Entities Outreach and Education $115,000
Implementation Plan for Two TMDLs for Indicator Bacteria in the Mission and Aransas Rivers
Mission and Aransas Rivers TMDL Stakeholders 50 Approved May 25, 2016
Measureable Milestones Measurable milestones for this management measure will consist of:
The number of illicit dumping citations issued The number of complaints made to responsible parties The amount of illicitly dumped material removed from bridge crossings and
illicit dump sites The number of educational materials developed The number of educational materials disseminated
Progress Indicators Progress indicators for this management measure consist of the following:
Year 1 – development and submittal of a grant proposal for additional person-nel and educational programs, a 5% increase in the number of fines written for illicit dumping and a 5% reduction in the number of reports/complaints to re-sponsible parties
Year 2 – receipt of a grant award for additional personnel and an educational program; an additional 5% reduction in the number of illicit dumping re-ports/complaints to responsible parties from the previous year
Years 3 - 4 – number of educational materials developed and disseminated; number of education programs delivered; an additional 5% annual reduction in the number of illicit dumping reports/complaints to responsible parties from the previous year
Year 5 – number of educational materials developed and disseminated; num-ber of education programs delivered; a 5% reduction in the number of illicit dumping reports/complaints to responsible parties from the previous year
Monitoring Component Monitoring for this management measure will consist of continuing TCEQ CRP monitoring at existing sites and an expanded monitoring program, if needed, de-veloped under Management Measure 9 of this I-Plan.
Implementation Schedule
Year 1: Responsible parties will, as funding allows,
Develop and submit a grant proposal in pursuit of funding for educational programs and additional personnel for illicit dumping mitigation activities
Develop a strategy for how to best reduce illicit dumping in the TMDL water-sheds
Implementation Plan for Two TMDLs for Indicator Bacteria in the Mission and Aransas Rivers
Mission and Aransas Rivers TMDL Stakeholders 51 Approved May 25, 2016
Implement activities as resources allow Increase the number of fines written by 5% in the first year of implementation
and reduced the number of reports of illicit dumping by 5% during each year of implementation
Years 2 – 5: Responsible parties will, as funding allows,
Secure funding for additional personnel, education programs, and or other il-licit dumping implementation activities
Initiate and implement educational programs Reduce the number of reports of illicit dumping to responsible parties by 5%
annually
Estimated Loading Reductions Potential load reductions from reducing illicit dumping and properly disposing of animal carcasses cannot be quantified at this time, as it is uncertain how much pollution will be removed and what effect the proposed activities will have on bac-teria loading to water bodies in the watershed.
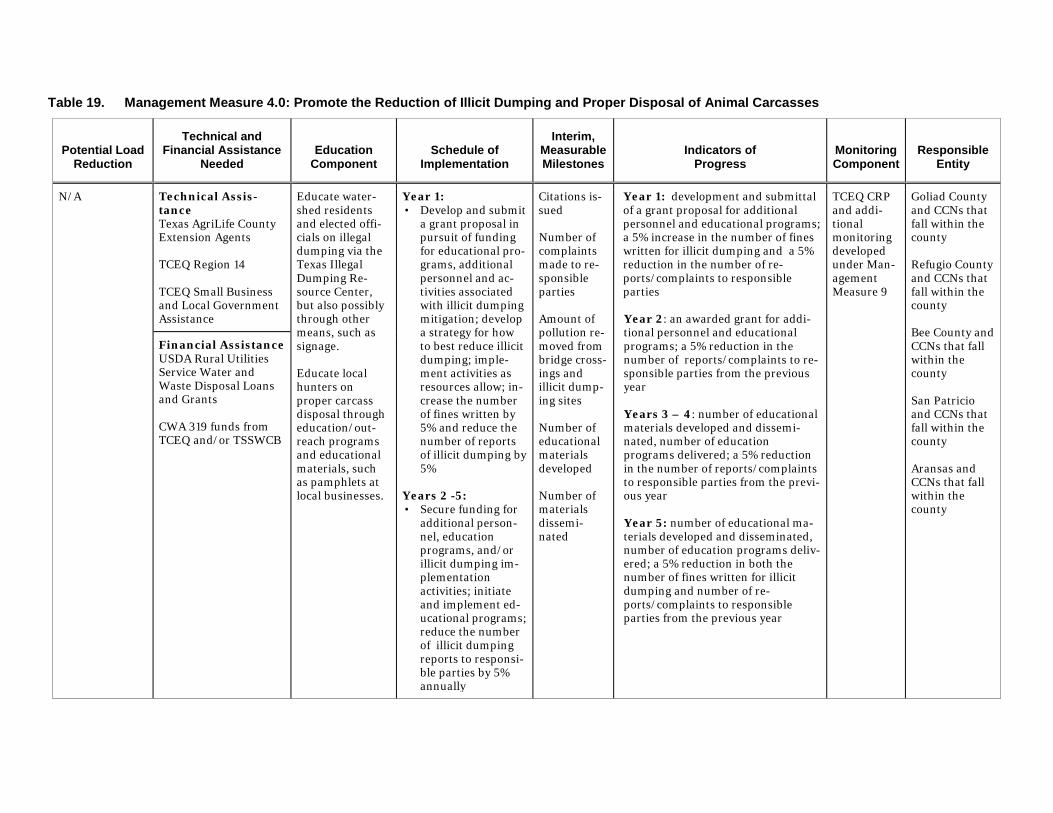
Table 19. Management Measure 4.0: Promote the Reduction of Illicit Dumping and Proper Disposal of Animal Carcasses
Potential Load Reduction
Technical and Financial Assistance
Needed Education
Component Schedule of
Implementation
Interim, Measurable Milestones
Indicators of Progress
Monitoring Component
Responsible Entity
N/A Technical Assis-tance Texas AgriLife County Extension Agents TCEQ Region 14 TCEQ Small Business and Local Government Assistance
Educate water-shed residents and elected offi-cials on illegal dumping via the Texas Illegal Dumping Re-source Center, but also possibly through other means, such as signage. Educate local hunters on proper carcass disposal through education/out-reach programs and educational materials, such as pamphlets at local businesses.
Year 1: • Develop and submit
a grant proposal in pursuit of funding for educational pro-grams, additional personnel and ac-tivities associated with illicit dumping mitigation; develop a strategy for how to best reduce illicit dumping; imple-ment activities as resources allow; in-crease the number of fines written by 5% and reduce the number of reports of illicit dumping by 5%
Years 2 -5: • Secure funding for
additional person-nel, education programs, and/or illicit dumping im-plementation activities; initiate and implement ed-ucational programs; reduce the number of illicit dumping reports to responsi-ble parties by 5% annually
Citations is-sued Number of complaints made to re-sponsible parties Amount of pollution re-moved from bridge cross-ings and illicit dump-ing sites Number of educational materials developed Number of materials dissemi-nated
Year 1: development and submittal of a grant proposal for additional personnel and educational programs; a 5% increase in the number of fines written for illicit dumping and a 5% reduction in the number of re-ports/complaints to responsible parties Year 2: an awarded grant for addi-tional personnel and educational programs; a 5% reduction in the number of reports/complaints to re-sponsible parties from the previous year Years 3 – 4: number of educational materials developed and dissemi-nated, number of education programs delivered; a 5% reduction in the number of reports/complaints to responsible parties from the previ-ous year Year 5: number of educational ma-terials developed and disseminated, number of education programs deliv-ered; a 5% reduction in both the number of fines written for illicit dumping and number of re-ports/complaints to responsible parties from the previous year
TCEQ CRP and addi-tional monitoring developed under Man-agement Measure 9
Goliad County and CCNs that fall within the county Refugio County and CCNs that fall within the county Bee County and CCNs that fall within the county San Patricio and CCNs that fall within the county Aransas and CCNs that fall within the county
Financial Assistance USDA Rural Utilities Service Water and Waste Disposal Loans and Grants CWA 319 funds from TCEQ and/or TSSWCB

Implementation Plan for Two TMDLs for Indicator Bacteria in the Mission and Aransas Rivers
Mission and Aransas Rivers TMDL Stakeholders 53 Approved May 25, 2016
Management Measure 5 Identify OSSFs, Prioritize OSSF Problem Areas, and Systematically Work to Bring Failing OSSF Systems into Compliance
Description Failing OSSFs have been known to contribute to bacteria impairments in surface water bodies all over the state of Texas and the Mission River and Aransas River watersheds are no exception, with roughly 10,000 septic systems scattered throughout the watersheds. In addition to the TCEQ, stakeholders in these water-sheds have also identified OSSFs as a contributing factor; therefore, it is the purpose of this management measure to improve the identification, inspection, pre-installation planning, education, operation, maintenance, and tracking of all OSSFs in the watershed and to minimize potential negative water quality impacts from malfunctioning onsite systems.
Identifying OSSFs in the Mission River and Aransas River watersheds is the first step in this process. Knowing the location of all onsite systems will aid in the im-plementation efforts and will help achieve the goal of reducing E. coli and Enterococcus loading to the Mission and Aransas Rivers. The initial step will be for responsible parties to collect GIS information of known OSSFs in the watershed as well as known wastewater infrastructure information. This effort can be initiated using 911 address point files, CCN layers, and 2010 Census block data. Following this exercise, dwellings and other facilities not served by existing wastewater ser-vice providers can be identified and further investigated. As OSSFs are identified, they will be tracked using GIS to document pertinent information related to the installation, operation, maintenance, and performance history of the systems. This tracking system will establish the basis for identifying potential problem areas and aiding in prioritizing these areas for action.
Once identified and prioritized, OSSFs will be inspected as time and funding allow. Physical inspections are necessary to properly identify problematic OSSFs or clus-ters of failing OSSFs. The staff of Authorized Agents in the TMDL watersheds available for inspections, typically county employees, also typically have many other obligations; therefore, these individuals have little, if any time, to perform systematic OSSF inspections. Additional funding is necessary to enable additional personnel to conduct these inspections. The inspections will provide critical input to the process of identifying priority areas of the watershed where repairs and re-placements will be conducted first.
OSSF owners should be contacted to request permission to conduct inspections and also to provide the owners information regarding maintenance and replace-ments. These contacts will begin first in priority areas that have been identified (see Priority Areas section) and then will continue throughout the rest of the TMDL
Implementation Plan for Two TMDLs for Indicator Bacteria in the Mission and Aransas Rivers
Mission and Aransas Rivers TMDL Stakeholders 54 Approved May 25, 2016
watersheds. Upon receiving permission to conduct an inspection, responsible par-ties, as funding allows, will conduct onsite inspections and consult with the owner on methods for maintenance, repairs, and replacements, if the system is found to be failing. This process should continue throughout implementation of this I-Plan. It is estimated that funds will be needed to support additional personnel and to assist/incentivize septic system owners.
Educational Component The level of general knowledge and understanding of operation and maintenance requirements for OSSFs is thought to be low throughout the TMDL watersheds. This deficiency in knowledge appears to apply not only to homeowners, but also to local authorities as well. Education and outreach for OSSFs is important in these TMDL watersheds and will be targeted to homeowners as well as local officials, as these officials have the ability to establish mechanisms that will mitigate pollution problems from OSSFs at community, county, watershed, and regional scales. Ef-forts must also be made to deliver educational materials on proper OSSF operation and maintenance to homeowners.
The Texas AgriLife currently hosts education programs for homeowners about proper operation and maintenance requirements as well as providing an overview of general OSSF requirements, collection and storage, pretreatment (and advanced pretreatment) components, disinfection, final treatment and dispersal, selection, and permitting. Information about this program can be found at <http://ossf.tamu.edu/>. As funding allows, this program will be delivered in the TMDL watersheds to assist in meeting the educational requirements of imple-menting this plan.
Priority Areas Priority areas for this management measure consist of the following subwater-sheds:
Aransas River watershed – 1, 2, 3, 5, 6, 7, 10, and 11 Mission River watershed – 2 and 3
Responsible Parties and Funding
Responsible Parties OSSF owners will be responsible for making sure needed repairs or replacements are made on malfunctioning OSSFs as funding allows.
The following Counties are Authorized Agents of the state and regulate OSSFs in their respective counties. Each county will be responsible for activities associated with this management measure within their respective jurisdictions.
Goliad County
Implementation Plan for Two TMDLs for Indicator Bacteria in the Mission and Aransas Rivers
Mission and Aransas Rivers TMDL Stakeholders 55 Approved May 25, 2016
Refugio County
Bee County
San Patricio County
Aransas County
TCEQ Region 14, as resources are available, will work to identify specific educa-tional needs and will help identify the technical and financial assistance needed to deliver these education programs locally.
Technical Assistance TCEQ Region 14 will, as resources are available, provide local governments with support and/or assistance in implementing activities covered in this management measure.
The TCEQ’s Small Business and Local Government Assistance Program will pro-vide, as resources are available, technical support to local governments to identify the best approach for addressing OSSF issues.
Financial Assistance Funding should be pursued through TCEQ CWA Section 319(h) grants for both replacements and education.
USFWS/Texas General Land Office Coastal Impact Assistance Program - The Coastal Impact Assistance Program provides federal grant funds, derived from fed-eral offshore lease revenues in oil producing states, for conservation, protection, and/or restoration of coastal areas including wetlands; the program also provides funding for mitigation of damage to fish, wildlife, or natural resources; for plan-ning assistance and for the administrative costs of complying with planning objectives; for implementation of a federally-approved marine, coastal, or compre-hensive conservation management plan; and for mitigation of the impact of outer Continental Shelf activities through funding of onshore infrastructure projects and public services.
NOAA/TGLO National Coastal Zone Management Program (CZM) and Coastal Management Program (CMP) - The National CZM Program is a voluntary partner-ship between the federal government and U.S. coastal and Great Lake states and territories (states) and is authorized by the Coastal Zone Management Act (CZMA) of 1972 to address national coastal issues. The Act provides funding for protecting, restoring, and responsibly developing our nation’s diverse coastal communities and resources. To meet the goals of the CZMA, the National CZM Program takes a comprehensive approach to coastal resource management—balancing the often
Implementation Plan for Two TMDLs for Indicator Bacteria in the Mission and Aransas Rivers
Mission and Aransas Rivers TMDL Stakeholders 56 Approved May 25, 2016
competing, and occasionally conflicting, demands of coastal resource use, eco-nomic development, and resource conservation. Some of the key elements of the National CZM Program include:
Protecting natural resources; Managing development in high hazard areas; Giving development priority to coastal-dependent uses; Providing public access for recreation; and Coordinating state and federal actions. The CZM Program provides pass-through funding to the Texas General Land Of-fice (TGLO), which, in turn, uses the funding to finance coastal restoration, conservation, and protection projects under TGLO’s Coastal Management Pro-gram.
TCEQ OSSF Training Reconnaissance and Replacement Program – Funded by the TCEQ’s CWA Section 319(h) Nonpoint Source Program, the purpose of this pro-gram is to fund reconnaissance efforts in coastal counties to identify areas of chronic OSSF failure and to offer funding for OSSF maintenance and/or replacement costs and for training on OSSF maintenance and inspection. This project is designed to address measures necessary to achieve a federally approved coastal management program as required under the Coastal Zone Act Reauthorization Amendments (CZARA) of the CZMA.
Table 20 shows the estimated costs of repairing and replacing malfunctioning OSSFs in the TMDL watersheds. The estimates are based on the replacement of 562 failing OSSFs, at an average cost of $8,000 per system. Additional funding is also needed, over a 5 year period, for developing and implementing educational activities and programs designed to reduce and/or prevent OSSF failures in the TMDL watersheds. Financial assistance can be pursued through TCEQ CWA Sec-tion 319(h) grants or through the federal and state programs described previously in this section.
Table 20. Estimated Costs
Entity Activities Needed Estimated Costs
Responsible Parties OSSF repair and replacement ($8,000 per sys-tem)
$4,496,000
Educational Entities Education and outreach events to 1) homeowners and 2) to installers/maintenance providers
$75,000
OSSF tailoring of online training modules $10,000
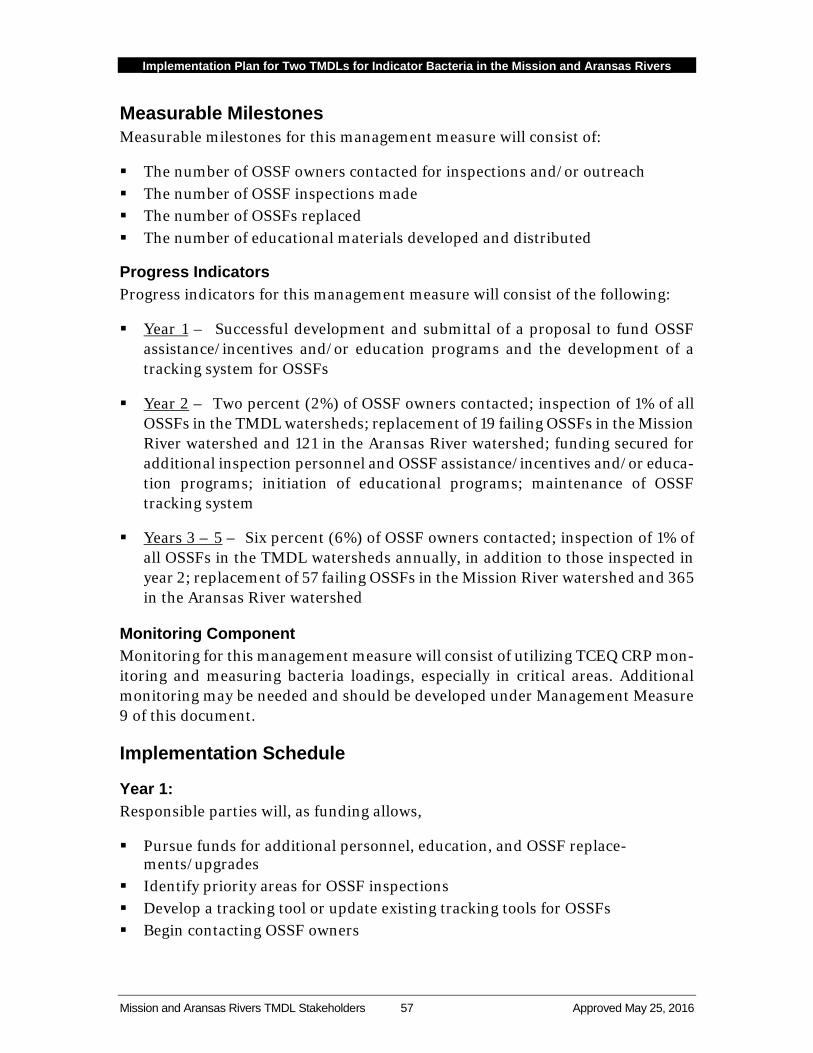
Implementation Plan for Two TMDLs for Indicator Bacteria in the Mission and Aransas Rivers
Mission and Aransas Rivers TMDL Stakeholders 57 Approved May 25, 2016
Measurable Milestones Measurable milestones for this management measure will consist of:
The number of OSSF owners contacted for inspections and/or outreach The number of OSSF inspections made The number of OSSFs replaced The number of educational materials developed and distributed
Progress Indicators Progress indicators for this management measure will consist of the following:
Year 1 – Successful development and submittal of a proposal to fund OSSF assistance/incentives and/or education programs and the development of a tracking system for OSSFs
Year 2 – Two percent (2%) of OSSF owners contacted; inspection of 1% of all OSSFs in the TMDL watersheds; replacement of 19 failing OSSFs in the Mission River watershed and 121 in the Aransas River watershed; funding secured for additional inspection personnel and OSSF assistance/incentives and/or educa-tion programs; initiation of educational programs; maintenance of OSSF tracking system
Years 3 – 5 – Six percent (6%) of OSSF owners contacted; inspection of 1% of all OSSFs in the TMDL watersheds annually, in addition to those inspected in year 2; replacement of 57 failing OSSFs in the Mission River watershed and 365 in the Aransas River watershed
Monitoring Component Monitoring for this management measure will consist of utilizing TCEQ CRP mon-itoring and measuring bacteria loadings, especially in critical areas. Additional monitoring may be needed and should be developed under Management Measure 9 of this document.
Implementation Schedule
Year 1: Responsible parties will, as funding allows,
Pursue funds for additional personnel, education, and OSSF replace-ments/upgrades
Identify priority areas for OSSF inspections Develop a tracking tool or update existing tracking tools for OSSFs Begin contacting OSSF owners
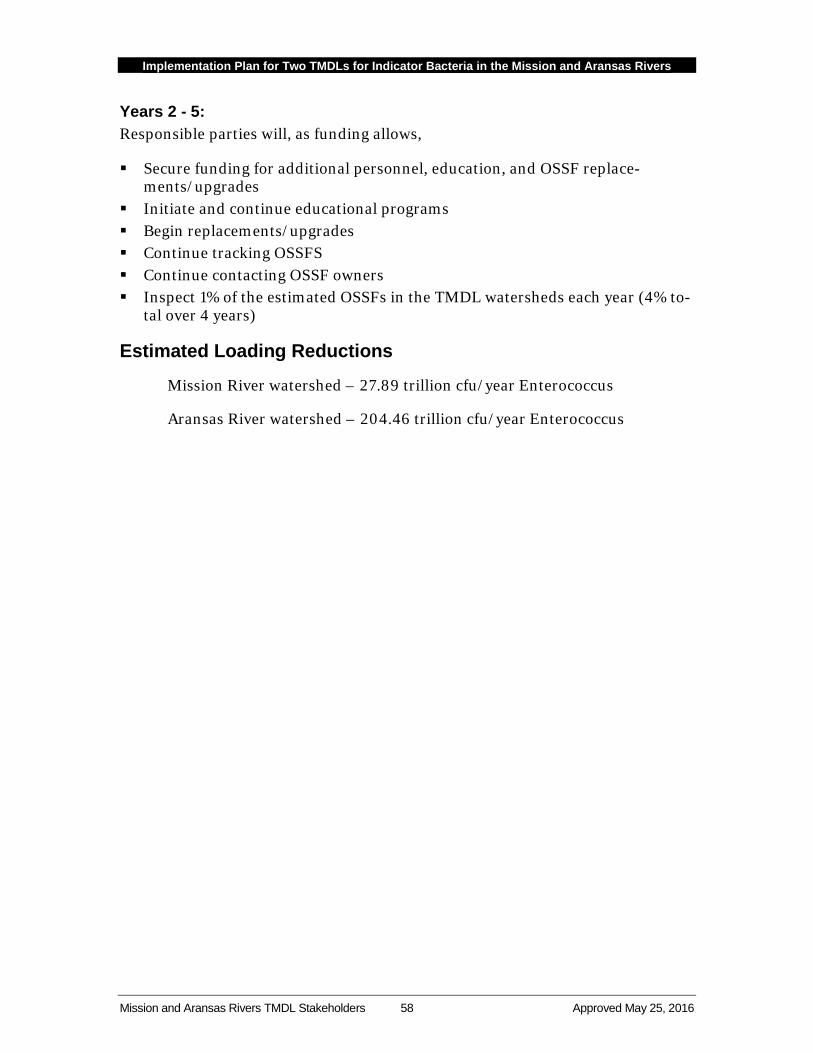
Implementation Plan for Two TMDLs for Indicator Bacteria in the Mission and Aransas Rivers
Mission and Aransas Rivers TMDL Stakeholders 58 Approved May 25, 2016
Years 2 - 5: Responsible parties will, as funding allows,
Secure funding for additional personnel, education, and OSSF replace-ments/upgrades
Initiate and continue educational programs Begin replacements/upgrades Continue tracking OSSFS Continue contacting OSSF owners Inspect 1% of the estimated OSSFs in the TMDL watersheds each year (4% to-
tal over 4 years)
Estimated Loading Reductions
Mission River watershed – 27.89 trillion cfu/year Enterococcus
Aransas River watershed – 204.46 trillion cfu/year Enterococcus
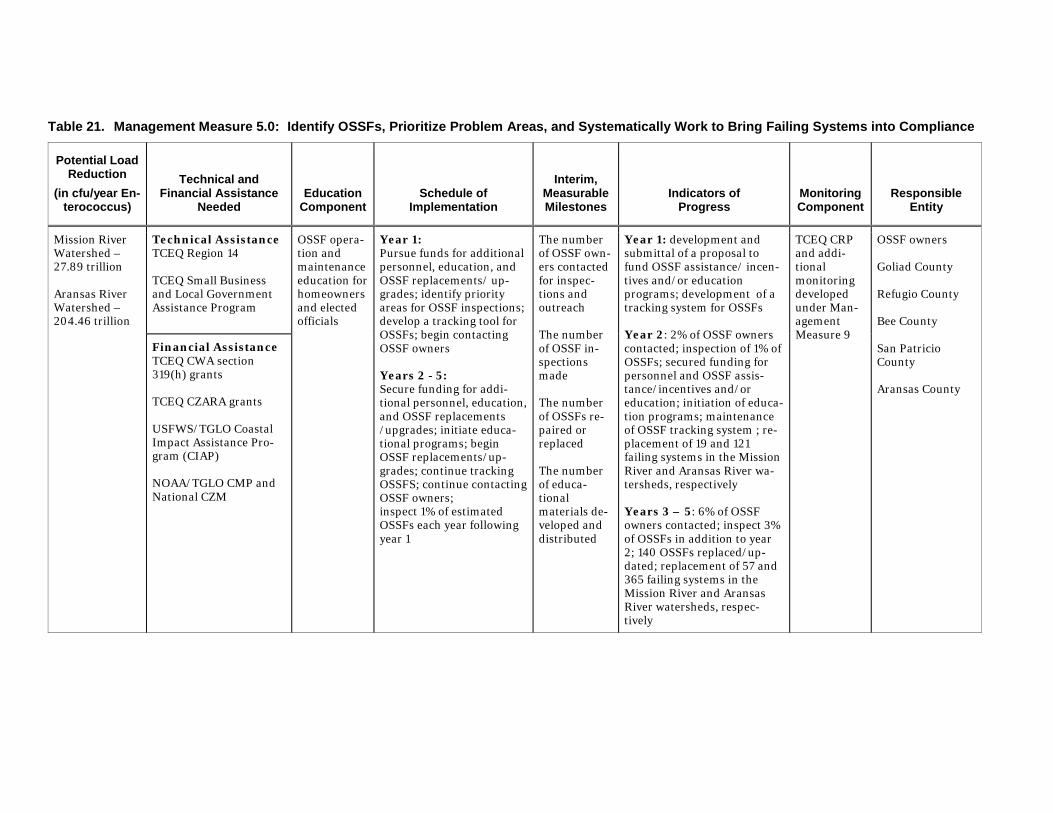
Table 21. Management Measure 5.0: Identify OSSFs, Prioritize Problem Areas, and Systematically Work to Bring Failing Systems into Compliance
Potential Load Reduction
(in cfu/year En-terococcus)
Technical and Financial Assistance
Needed Education
Component Schedule of
Implementation
Interim, Measurable Milestones
Indicators of Progress
Monitoring Component
Responsible Entity
Mission River Watershed – 27.89 trillion Aransas River Watershed – 204.46 trillion
Technical Assistance TCEQ Region 14 TCEQ Small Business and Local Government Assistance Program
OSSF opera-tion and maintenance education for homeowners and elected officials
Year 1: Pursue funds for additional personnel, education, and OSSF replacements/ up-grades; identify priority areas for OSSF inspections; develop a tracking tool for OSSFs; begin contacting OSSF owners Years 2 - 5: Secure funding for addi-tional personnel, education, and OSSF replacements /upgrades; initiate educa-tional programs; begin OSSF replacements/up-grades; continue tracking OSSFS; continue contacting OSSF owners; inspect 1% of estimated OSSFs each year following year 1
The number of OSSF own-ers contacted for inspec-tions and outreach The number of OSSF in-spections made The number of OSSFs re-paired or replaced The number of educa-tional materials de-veloped and distributed
Year 1: development and submittal of a proposal to fund OSSF assistance/ incen-tives and/or education programs; development of a tracking system for OSSFs Year 2: 2% of OSSF owners contacted; inspection of 1% of OSSFs; secured funding for personnel and OSSF assis-tance/incentives and/or education; initiation of educa-tion programs; maintenance of OSSF tracking system ; re-placement of 19 and 121 failing systems in the Mission River and Aransas River wa-tersheds, respectively Years 3 – 5: 6% of OSSF owners contacted; inspect 3% of OSSFs in addition to year 2; 140 OSSFs replaced/up-dated; replacement of 57 and 365 failing systems in the Mission River and Aransas River watersheds, respec-tively
TCEQ CRP and addi-tional monitoring developed under Man-agement Measure 9
OSSF owners Goliad County Refugio County Bee County San Patricio County Aransas County
Financial Assistance TCEQ CWA section 319(h) grants TCEQ CZARA grants USFWS/TGLO Coastal Impact Assistance Pro-gram (CIAP) NOAA/TGLO CMP and National CZM
Implementation Plan for Two TMDLs for Indicator Bacteria in the Mission and Aransas Rivers
Mission and Aransas Rivers TMDL Stakeholders 60 Approved May 25, 2016
Management Measure 6 Promote the Improved Quality and Management of Urban Stormwater
Description Bacteria sources, such as waste from pets, wildlife, and even humans, can be washed into storm drains and then discharged into local waterways. Because stormwater systems are designed to quickly and efficiently remove stormwater from developed areas, stormwater often bypasses the natural vegetative barriers that filter rainfall runoff over the land. Hence, bacteria loading may be more con-centrated in stormwater than in other sources of stream flow. In the Mission River and Aransas River watersheds, there are no large Phase I or small Phase II MS4 stormwater permits; therefore, urban stormwater is not regulated in the TMDL watersheds. However, several local governmental entities in the watershed have taken voluntary efforts to mitigate the effects of urban stormwater on water quality in the region. For example, Aransas County’s Stormwater Management Plan in-cludes a sediment and erosion control plan as well as a public education program. Aransas County also provides free information to developers on low impact devel-opment (LID) practices and structural stormwater BMPs.
Structural BMPs, such as modifications to stormwater outfalls designed to increase bacteria aeration, treatment by sunlight, or physical removal of contaminants, have the potential to reduce bacteria loading into waterways. Education and out-reach regarding these BMPs may increase the likelihood of their adoption by local governments, leading to the development of local strategies to reduce bacteria loading in stormwater in the TMDL watersheds. Non-structural BMPs, such as municipal pet waste programs, though often rooted in local ordinances, also rely heavily on education and outreach for success. Therefore, education and outreach are a key short-term focus of this management measure; however, development of local strategies for adoption of urban BMPs is a long-term goal of Management Measure 6 and could result in potential pollutant loading reductions.
The long-term goal of this management measure is to decrease nonpoint source pollution from stormwater runoff in urban areas in the TMDL watersheds, through the adoption of structural and non-structural urban BMPs (the number of acres proposed to be under BMPs for each watershed can be found in Appendix B) and also to raise awareness among local residents about how urban stormwater im-pacts local water quality.
Educational Component Targeting both homeowners and elected officials, educational and outreach pro-grams will be delivered that highlight various practices designed to reduce the impact of stormwater on water quality; the programs will also be designed to help local governments develop strategies for reducing potential bacteria loadings to
Implementation Plan for Two TMDLs for Indicator Bacteria in the Mission and Aransas Rivers
Mission and Aransas Rivers TMDL Stakeholders 61 Approved May 25, 2016
local water bodies from urban stormwater. Some local entities may use this infor-mation and the technical and financial assistance provided by state and federal agencies to develop comprehensive urban stormwater assessments. These programs will be implemented through a variety of methods including, but not limited to, public service announcements (PSAs), utility bill inserts, other di-rect mailing, educational kiosks, and pet waste stations at parks, and at public environmental events (e.g., Earth Day Celebrations, etc.). These educational events will include seminars on LID and retrofitting strategies that can be implemented on existing stormwater structures or incorporated into the designs of new struc-tures. These programs can lead to the selection of appropriate BMPs tailored to the specific needs of each municipality or CCN.
Priority Areas Priority areas for this management measure consist of urban areas within the Mis-sion River and Aransas River watersheds. The focus should be on areas of the watersheds that discharge stormwater into or near the impaired segments, but the effort should not be limited to those areas.
Responsible Parties and Funding
Responsible Parties The City of Beeville, City of Sinton, Town of Woodsboro, Town of Refugio, City of Taft, Pettus Municipal Utility District (MUD), Town of Skidmore, Town of St. Paul, and Town of Odem are responsible for pursuing funds to support educational ac-tivities and, once funds have been secured, the cities and service providers will conduct educational activities to raise awareness of the impacts of stormwater on local water quality. The cities and service providers will also identify locations for potential implementation of urban BMPs and, if found feasible, will implement these practices.
Technical Assistance TCEQ Region 14 will, as resources are available, provide local governments with support and/or assistance in implementing activities covered in this management measure by providing general information on stormwater management.
Financial Assistance EPA/TWDB Clean Water State Revolving Fund (CWSRF) Program - The CWSRF program provides low-interest loans to local governments and service providers for infrastructure projects that include stormwater BMPs. The loans can spread project costs over a repayment period of up to twenty years. Repayments are cycled back into the fund and used to pay for additional projects.
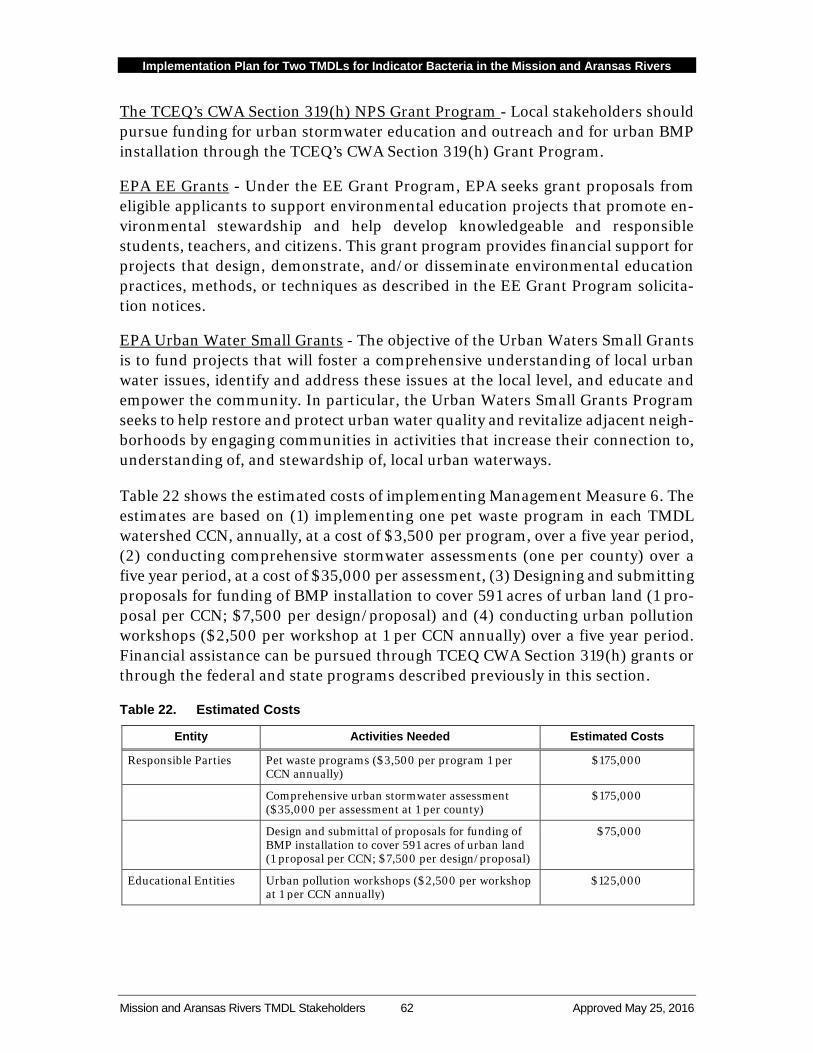
Implementation Plan for Two TMDLs for Indicator Bacteria in the Mission and Aransas Rivers
Mission and Aransas Rivers TMDL Stakeholders 62 Approved May 25, 2016
The TCEQ’s CWA Section 319(h) NPS Grant Program - Local stakeholders should pursue funding for urban stormwater education and outreach and for urban BMP installation through the TCEQ’s CWA Section 319(h) Grant Program.
EPA EE Grants - Under the EE Grant Program, EPA seeks grant proposals from eligible applicants to support environmental education projects that promote en-vironmental stewardship and help develop knowledgeable and responsible students, teachers, and citizens. This grant program provides financial support for projects that design, demonstrate, and/or disseminate environmental education practices, methods, or techniques as described in the EE Grant Program solicita-tion notices.
EPA Urban Water Small Grants - The objective of the Urban Waters Small Grants is to fund projects that will foster a comprehensive understanding of local urban water issues, identify and address these issues at the local level, and educate and empower the community. In particular, the Urban Waters Small Grants Program seeks to help restore and protect urban water quality and revitalize adjacent neigh-borhoods by engaging communities in activities that increase their connection to, understanding of, and stewardship of, local urban waterways.
Table 22 shows the estimated costs of implementing Management Measure 6. The estimates are based on (1) implementing one pet waste program in each TMDL watershed CCN, annually, at a cost of $3,500 per program, over a five year period, (2) conducting comprehensive stormwater assessments (one per county) over a five year period, at a cost of $35,000 per assessment, (3) Designing and submitting proposals for funding of BMP installation to cover 591 acres of urban land (1 pro-posal per CCN; $7,500 per design/proposal) and (4) conducting urban pollution workshops ($2,500 per workshop at 1 per CCN annually) over a five year period. Financial assistance can be pursued through TCEQ CWA Section 319(h) grants or through the federal and state programs described previously in this section.
Table 22. Estimated Costs
Entity Activities Needed Estimated Costs
Responsible Parties Pet waste programs ($3,500 per program 1 per CCN annually)
$175,000
Comprehensive urban stormwater assessment ($35,000 per assessment at 1 per county)
$175,000
Design and submittal of proposals for funding of BMP installation to cover 591 acres of urban land (1 proposal per CCN; $7,500 per design/proposal)
$75,000
Educational Entities Urban pollution workshops ($2,500 per workshop at 1 per CCN annually)
$125,000
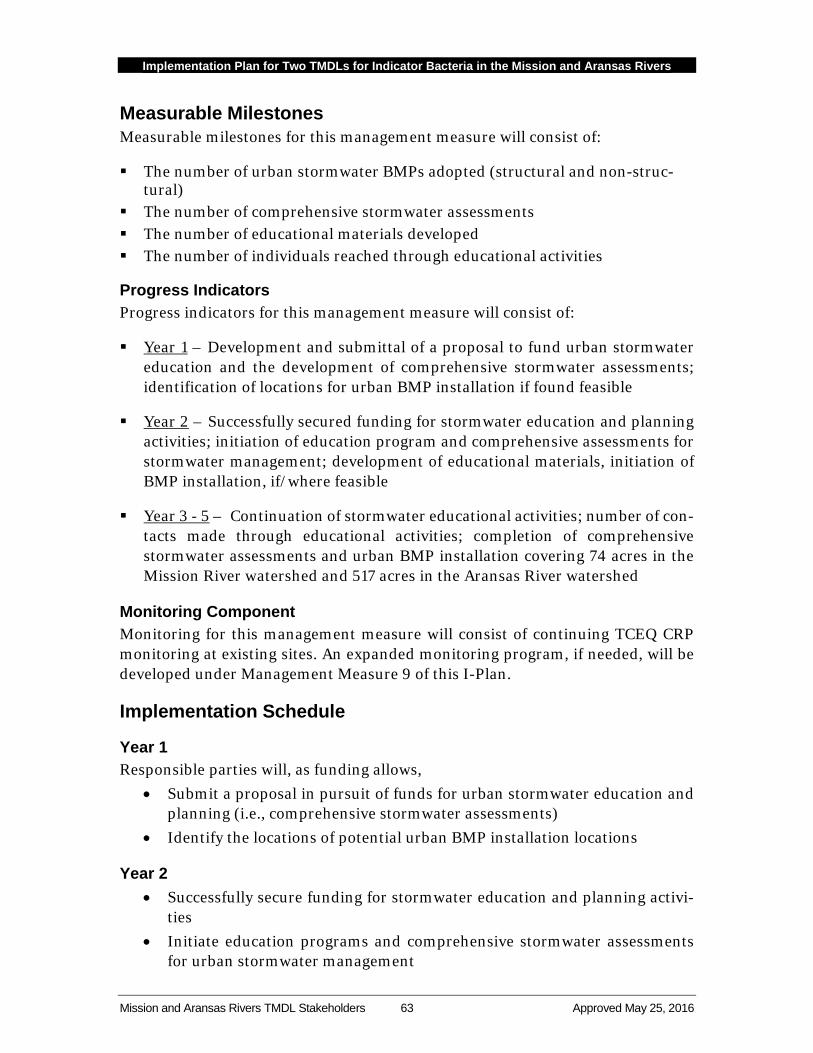
Implementation Plan for Two TMDLs for Indicator Bacteria in the Mission and Aransas Rivers
Mission and Aransas Rivers TMDL Stakeholders 63 Approved May 25, 2016
Measurable Milestones Measurable milestones for this management measure will consist of:
The number of urban stormwater BMPs adopted (structural and non-struc-tural)
The number of comprehensive stormwater assessments The number of educational materials developed The number of individuals reached through educational activities
Progress Indicators Progress indicators for this management measure will consist of:
Year 1 – Development and submittal of a proposal to fund urban stormwater education and the development of comprehensive stormwater assessments; identification of locations for urban BMP installation if found feasible
Year 2 – Successfully secured funding for stormwater education and planning activities; initiation of education program and comprehensive assessments for stormwater management; development of educational materials, initiation of BMP installation, if/where feasible
Year 3 - 5 – Continuation of stormwater educational activities; number of con-tacts made through educational activities; completion of comprehensive stormwater assessments and urban BMP installation covering 74 acres in the Mission River watershed and 517 acres in the Aransas River watershed
Monitoring Component Monitoring for this management measure will consist of continuing TCEQ CRP monitoring at existing sites. An expanded monitoring program, if needed, will be developed under Management Measure 9 of this I-Plan.
Implementation Schedule
Year 1 Responsible parties will, as funding allows,
• Submit a proposal in pursuit of funds for urban stormwater education and planning (i.e., comprehensive stormwater assessments)
• Identify the locations of potential urban BMP installation locations
Year 2 • Successfully secure funding for stormwater education and planning activi-
ties • Initiate education programs and comprehensive stormwater assessments
for urban stormwater management
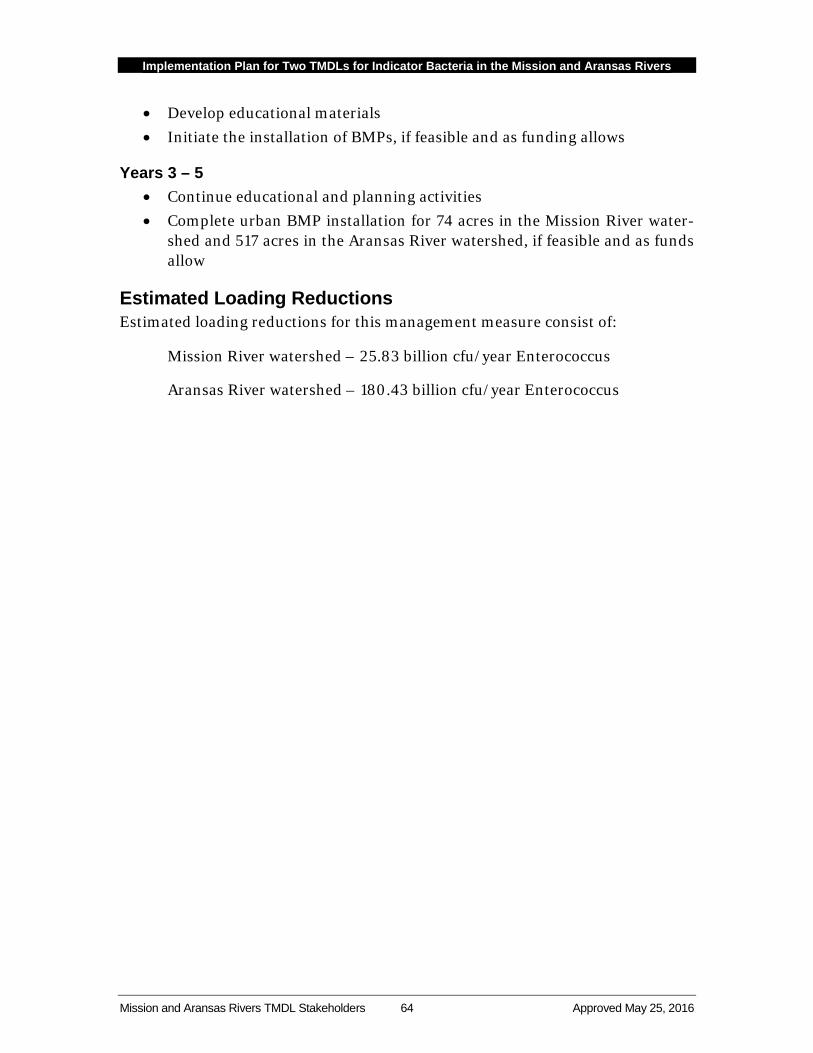
Implementation Plan for Two TMDLs for Indicator Bacteria in the Mission and Aransas Rivers
Mission and Aransas Rivers TMDL Stakeholders 64 Approved May 25, 2016
• Develop educational materials • Initiate the installation of BMPs, if feasible and as funding allows
Years 3 – 5 • Continue educational and planning activities • Complete urban BMP installation for 74 acres in the Mission River water-
shed and 517 acres in the Aransas River watershed, if feasible and as funds allow
Estimated Loading Reductions Estimated loading reductions for this management measure consist of:
Mission River watershed – 25.83 billion cfu/year Enterococcus
Aransas River watershed – 180.43 billion cfu/year Enterococcus
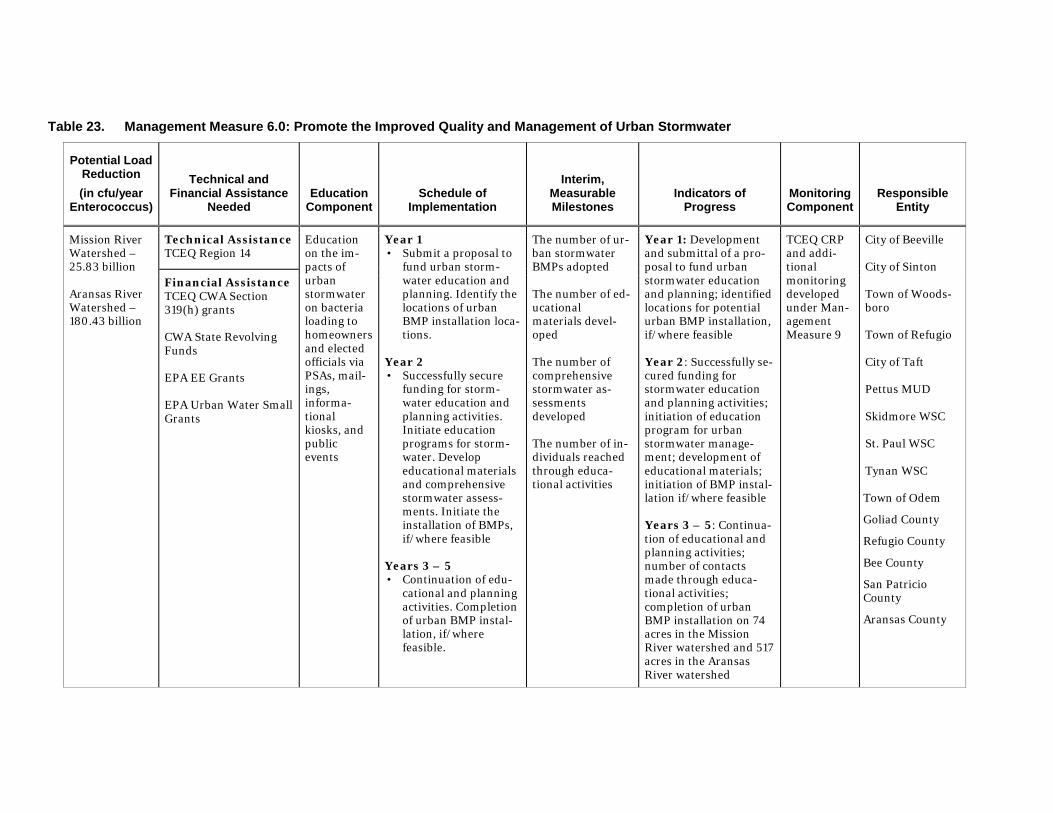
Table 23. Management Measure 6.0: Promote the Improved Quality and Management of Urban Stormwater
Potential Load Reduction (in cfu/year
Enterococcus)
Technical and Financial Assistance
Needed Education
Component Schedule of
Implementation
Interim, Measurable Milestones
Indicators of Progress
Monitoring Component
Responsible Entity
Mission River Watershed – 25.83 billion Aransas River Watershed – 180.43 billion
Technical Assistance TCEQ Region 14
Education on the im-pacts of urban stormwater on bacteria loading to homeowners and elected officials via PSAs, mail-ings, informa-tional kiosks, and public events
Year 1 • Submit a proposal to
fund urban storm-water education and planning. Identify the locations of urban BMP installation loca-tions.
Year 2 • Successfully secure
funding for storm-water education and planning activities. Initiate education programs for storm-water. Develop educational materials and comprehensive stormwater assess-ments. Initiate the installation of BMPs, if/where feasible
Years 3 – 5 • Continuation of edu-
cational and planning activities. Completion of urban BMP instal-lation, if/where feasible.
The number of ur-ban stormwater BMPs adopted The number of ed-ucational materials devel-oped The number of comprehensive stormwater as-sessments developed The number of in-dividuals reached through educa-tional activities
Year 1: Development and submittal of a pro-posal to fund urban stormwater education and planning; identified locations for potential urban BMP installation, if/where feasible Year 2: Successfully se-cured funding for stormwater education and planning activities; initiation of education program for urban stormwater manage-ment; development of educational materials; initiation of BMP instal-lation if/where feasible Years 3 – 5: Continua-tion of educational and planning activities; number of contacts made through educa-tional activities; completion of urban BMP installation on 74 acres in the Mission River watershed and 517 acres in the Aransas River watershed
TCEQ CRP and addi-tional monitoring developed under Man-agement Measure 9
City of Beeville City of Sinton Town of Woods-boro Town of Refugio City of Taft Pettus MUD Skidmore WSC St. Paul WSC Tynan WSC Town of Odem
Goliad County
Refugio County
Bee County
San Patricio County
Aransas County
Financial Assistance TCEQ CWA Section 319(h) grants CWA State Revolving Funds EPA EE Grants EPA Urban Water Small Grants
Implementation Plan for Two TMDLs for Indicator Bacteria in the Mission and Aransas Rivers
Mission and Aransas Rivers TMDL Stakeholders 66 Approved May 25, 2016
Management Measure 7 Coordinate Efforts to Reduce Unauthorized Discharges
Description This implementation strategy focuses on the prevention of unauthorized dis-charges of wastewater from treatment facilities or collection system infrastructure, such as underground sewer lines (pipes), ancillary support processes (lift stations), and the management of the network of infrastructure that is connected to the WWTF itself. Activities in the WWTFs are discussed in other sections of this I-Plan. Efforts associated with this management measure include a host of activities that each city or utility district will carry out in efforts to reduce the number of unau-thorized discharges that occur within their respective service areas, especially within portions of the Mission River and Aransas River watersheds.
To reduce unauthorized discharges, CCN holders will (1) conduct routine sewer pipe inspections, (2) undertake visual inspections of existing manholes, and (3) engage in other surveillance activities, identified by each entity, to mitigate unau-thorized discharges of wastewater. To the extent possible, CCN holders will use inflow and infiltration studies and methods to prioritize needed system repairs and/or replacements.
Tracking unauthorized discharge mitigation activities using GIS, when feasible, and documenting the sources of the unauthorized discharges will also serve to pri-oritize future repairs. Repairs and replacements will be tracked annually. Also, to assist in prioritizing areas for improvements, the responsible parties may develop an annual plan for improvements slated for the subsequent year. It is understood that failures may occur at random and some of these failures will need immediate attention. Therefore, the annual plan is simply meant to be a guide for prioritizing improvements on a continuing basis.
Education Component Education is needed for both city and utility district personnel and citizens that reside within the CCN boundaries. First, it is important for city personnel to know how to inspect infrastructure for needed repairs and to be able to identify areas that may fail in the near future. It is also important for those conducting inspec-tions to report needed repairs to decision makers, so that prioritization of repairs can be made for the system as a whole. Secondly, residents in the respective service areas should be educated on how to identify wastewater infrastructure failures and how to report these failures to the appropriate authorities. Residents must also be educated on how they can help prevent infrastructure failures.
Implementation Plan for Two TMDLs for Indicator Bacteria in the Mission and Aransas Rivers
Mission and Aransas Rivers TMDL Stakeholders 67 Approved May 25, 2016
Priority Areas Priority areas for this management measure are simply the CCN boundaries that fall within the Mission and Aransas River watersheds. Focus should be given to those areas that are near the impaired water bodies but should not be limited to those areas.
Responsible Parties and Funding
Responsible Parties The cities of Beeville, Sinton, and Taft, along with the towns of Refugio, Skidmore, St. Paul and Tynan and the Pettus MUD will conduct routine inspections of wastewater infrastructure to identify repairs that are needed and reduce unauthor-ized discharges. Repairs will be tracked to help CCN holders prioritize areas that need more immediate attention in the near future. An annual plan, to serve as a guide, will be developed to help personnel prioritize improvements/repairs needed for the upcoming year. Both city personnel and residents should be educated to identify failures that are occurring and to know where to report such failures. Fi-nally, unauthorized discharges will be reported to TCEQ.
Technical Assistance TCEQ Region 14 will receive and record unauthorized discharge information from respective CCN holders and assist cities with TCEQ rules and regulations.
Financial Assistance EPA/TWDB CWSRF - The CWSRF program provides low-interest loans that can spread the costs of infrastructure repair projects over a repayment period of up to twenty years. Repayments are cycled back into the fund and used to pay for addi-tional infrastructure projects.
TWDB Economically Distressed Areas Program - The Economically Distressed Ar-eas Program (EDAP) provides financial assistance to fund water and wastewater services in economically distressed areas where such services do not exist or where services do not meet minimum state standards.
USDA RUS WWD Loans and Grants- The RUS is amending its regulations related to the Section 306C WWD Loans and Grants Program, which provides water and waste disposal facilities and services to low-income rural communities whose res-idents face significant health risks. Specifically, RUS is modifying the priority points system in order to give additional priority points to colonias that lack access to water or waste disposal systems and, which face significant health problems. The intent of the amended regulations is to ensure that the neediest areas receive funding.
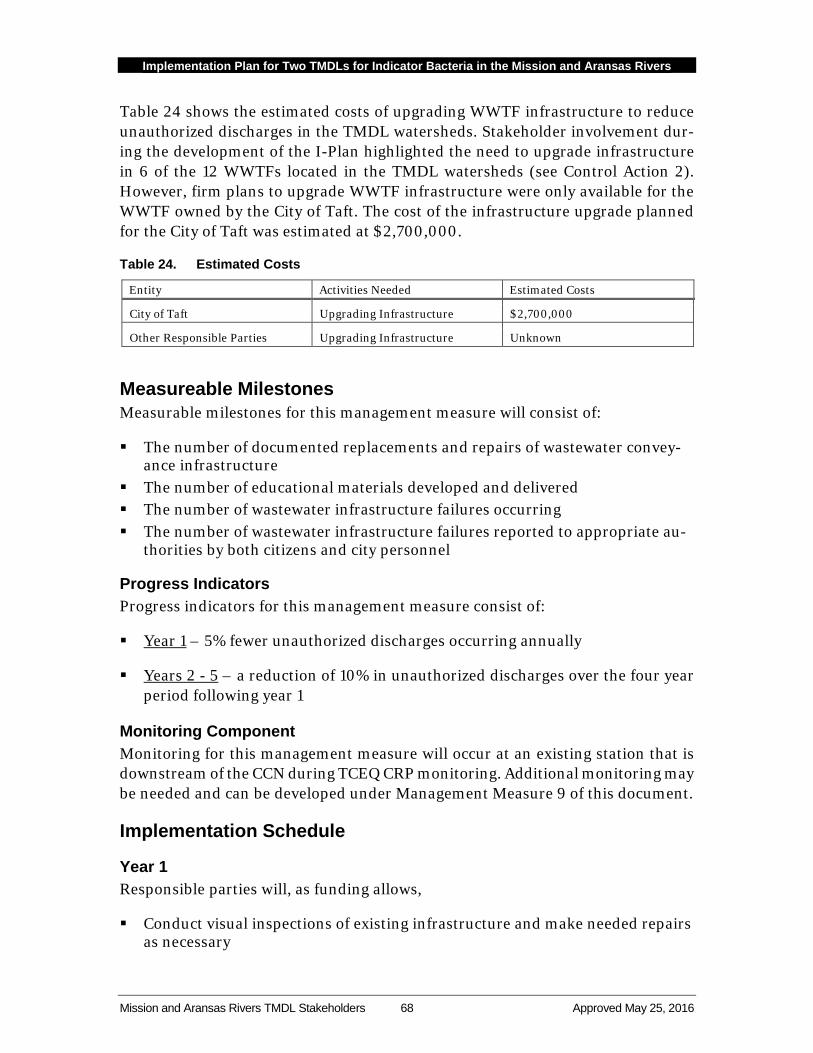
Implementation Plan for Two TMDLs for Indicator Bacteria in the Mission and Aransas Rivers
Mission and Aransas Rivers TMDL Stakeholders 68 Approved May 25, 2016
Table 24 shows the estimated costs of upgrading WWTF infrastructure to reduce unauthorized discharges in the TMDL watersheds. Stakeholder involvement dur-ing the development of the I-Plan highlighted the need to upgrade infrastructure in 6 of the 12 WWTFs located in the TMDL watersheds (see Control Action 2). However, firm plans to upgrade WWTF infrastructure were only available for the WWTF owned by the City of Taft. The cost of the infrastructure upgrade planned for the City of Taft was estimated at $2,700,000.
Table 24. Estimated Costs
Entity Activities Needed Estimated Costs
City of Taft Upgrading Infrastructure $2,700,000
Other Responsible Parties Upgrading Infrastructure Unknown
Measureable Milestones Measurable milestones for this management measure will consist of:
The number of documented replacements and repairs of wastewater convey-ance infrastructure
The number of educational materials developed and delivered The number of wastewater infrastructure failures occurring The number of wastewater infrastructure failures reported to appropriate au-
thorities by both citizens and city personnel
Progress Indicators Progress indicators for this management measure consist of:
Year 1 – 5% fewer unauthorized discharges occurring annually
Years 2 - 5 – a reduction of 10% in unauthorized discharges over the four year period following year 1
Monitoring Component Monitoring for this management measure will occur at an existing station that is downstream of the CCN during TCEQ CRP monitoring. Additional monitoring may be needed and can be developed under Management Measure 9 of this document.
Implementation Schedule
Year 1 Responsible parties will, as funding allows,
Conduct visual inspections of existing infrastructure and make needed repairs as necessary
Implementation Plan for Two TMDLs for Indicator Bacteria in the Mission and Aransas Rivers
Mission and Aransas Rivers TMDL Stakeholders 69 Approved May 25, 2016
Document repairs, using methods already utilized by CCN holders and, if pos-sible, also map the failures and repairs using GIS
Develop a plan for the upcoming year to help prioritize efforts Pursue funds for educational activities
Years 2 – 5 Responsible parties will, as funding allows,
Continue to conduct visual inspections of infrastructure Plan for the forthcoming year’s repairs Continue to document all repairs using methods already utilized by CCN hold-
ers and, if possible, also map the failures and repairs using GIS Continue to pursue and secure funding for education and outreach programs Initiate education and outreach programs if funding has been secured
Estimated Loading Reductions Estimated loading reductions for this management measure consist of:
Mission River watershed – 130.36 billion cfu/year Enterococcus
Aransas River watershed – 130.36 billion cfu/year Enterococcus
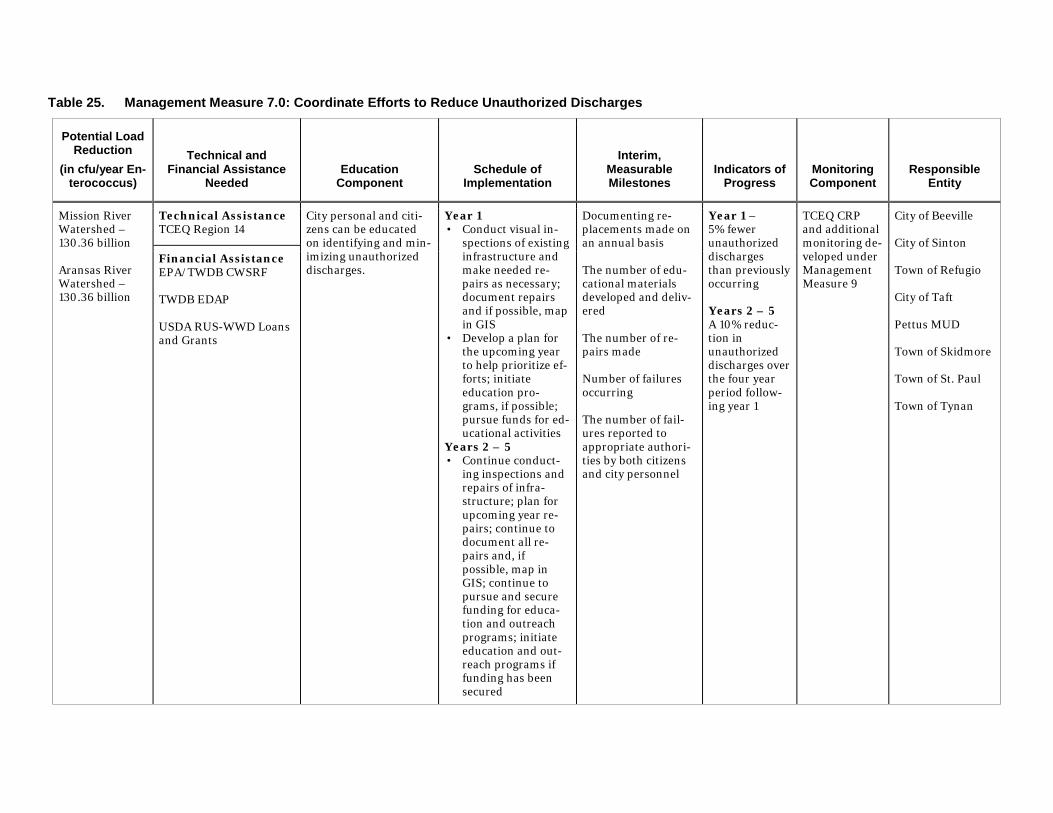
Table 25. Management Measure 7.0: Coordinate Efforts to Reduce Unauthorized Discharges
Potential Load Reduction
(in cfu/year En-terococcus)
Technical and Financial Assistance
Needed Education
Component Schedule of
Implementation
Interim, Measurable Milestones
Indicators of Progress
Monitoring Component
Responsible Entity
Mission River Watershed – 130.36 billion Aransas River Watershed – 130.36 billion
Technical Assistance TCEQ Region 14
City personal and citi-zens can be educated on identifying and min-imizing unauthorized discharges.
Year 1 • Conduct visual in-
spections of existing infrastructure and make needed re-pairs as necessary; document repairs and if possible, map in GIS
• Develop a plan for the upcoming year to help prioritize ef-forts; initiate education pro-grams, if possible; pursue funds for ed-ucational activities
Years 2 – 5 • Continue conduct-
ing inspections and repairs of infra-structure; plan for upcoming year re-pairs; continue to document all re-pairs and, if possible, map in GIS; continue to pursue and secure funding for educa-tion and outreach programs; initiate education and out-reach programs if funding has been secured
Documenting re-placements made on an annual basis The number of edu-cational materials developed and deliv-ered The number of re-pairs made Number of failures occurring The number of fail-ures reported to appropriate authori-ties by both citizens and city personnel
Year 1 – 5% fewer unauthorized discharges than previously occurring Years 2 – 5 A 10% reduc-tion in unauthorized discharges over the four year period follow-ing year 1
TCEQ CRP and additional monitoring de-veloped under Management Measure 9
City of Beeville City of Sinton Town of Refugio City of Taft Pettus MUD Town of Skidmore Town of St. Paul Town of Tynan
Financial Assistance EPA/TWDB CWSRF TWDB EDAP USDA RUS-WWD Loans and Grants
Implementation Plan for Two TMDLs for Indicator Bacteria in the Mission and Aransas Rivers
Mission and Aransas Rivers TMDL Stakeholders 71 Approved May 25, 2016
Management Measure 8 Reduce WWTF Contributions by Meeting Half of the Permitted Bacteria Limit
Description This implementation measure focuses on reducing the amount of bacteria contrib-uted by WWTFs to surface water in the TMDL watersheds. Currently, WWTFs are permitted to discharge wastewater containing bacteria concentrations that do not exceed surface water quality standards, which are 126 MPN/100 mL E. coli for fresh water bodies and 35 MPN/100mL Enterococcus for saline water bodies, such as the tidal segments of the Mission and Aransas Rivers. Keeping the concentration of bacteria in wastewater effluent below half of the permitted limits was part of the discussion at the various wastewater workgroup meetings and several of the WWTF operators considered adopting measures that would keep bacteria concen-trations in the effluent of their facilities below half of the surface water quality standards.
Through the implementation of this management measure, participating WWTFs will endeavor to keep bacteria concentrations in the effluent of their facilities below half of the surface water quality standards. In doing so, participating WWTFs will not exceed a bacteria concentration of 63 MPN/100mL, for E. coli, and 17.5 MPN/100mL, for Enterococcus, in their treated wastewater effluent. It should be noted that the adoption of half the permitted discharge limit is a voluntary measure undertaken by participating WWTFs.
Education Component Education is needed for both city personnel, as well as elected officials, for two reasons. First, it is importation to educate elected officials, especially of non-par-ticipating jurisdictions, about the environmental and economic benefits of voluntarily reducing bacteria concentrations in treated wastewater effluent, so that better informed fiscal decisions can be made at the local level. Second, it is im-portant to educate WWTF operators and personnel about the capabilities of their respective WWTF systems and about methods and practices that can be adopted to maximize the treatment potential of each facility.
Priority Areas Priority areas for this management measure will be all WWTFs within the Mission River and Aransas River watersheds. The focus will be on those WWTFs located near the impaired water bodies, but should not be limited to just those facilities.
Implementation Plan for Two TMDLs for Indicator Bacteria in the Mission and Aransas Rivers
Mission and Aransas Rivers TMDL Stakeholders 72 Approved May 25, 2016
Responsible Parties and Funding
Responsible Parties The cities of Beeville, Sinton, and Taft, as well as the towns of Refugio, Skidmore, St. Paul, Tynan, and the Pettus MUD will determine the feasibility of adopting the goal of keeping the concentration of bacteria in the wastewater discharge of WWTFs within their jurisdictions below half surface water quality standard. The City of Beeville will work with the TCEQ and Texas A&M Engineering Extension (TEEX) to evaluate the capabilities and current operating procedures of their wastewater treatment systems and will make an informed determination about adopting this goal within the first two years of the term of this I-Plan.
Technical Assistance The TEEX and other relevant organizations can provide technical assistance to the WWTF owners and operators in the TMDL watersheds. TCEQ’s Small Business and Local Government Assistance Program can also provide, as resources are available, technical assistance to local governments for evaluating the capabilities and operating procedures of existing wastewater systems. TEEX provides educa-tion and training to wastewater operators and focuses training on optimizing treatment quality.
Financial Assistance Existing local funding for improvements/upgrades may be used but it is likely that additional funds will be needed. Examples of potential funding sources include:
TWDB EDAP - The EDAP provides financial assistance for water and wastewater infrastructure projects in economically distressed areas where water and wastewater services do not exist or systems do not meet minimum state standards.
USDA RUS-WWD - The RUS is amending its regulations related to 7 U.S.C. 1926(c) Section 306C of Consolidated Farm and Rural Development Act, WWD Loans and Grants Program, which provides water and waste disposal facilities and services to low-income rural communities whose residents face significant health risks. Specifically, RUS is modifying the priority points system in order to give ad-ditional priority points to colonias that lack access to water or waste disposal systems and face significant health problems. The intent of the program is to en-sure that the neediest areas receive funding.
EPA/TWDB CWSRF - The CWSRF program provides low-interest loans for water and wastewater infrastructure projects that spread project costs over a repayment period of up to twenty years. Repayments are cycled back into the fund and used to pay for additional clean water projects.
There are no estimated costs for this management measure.
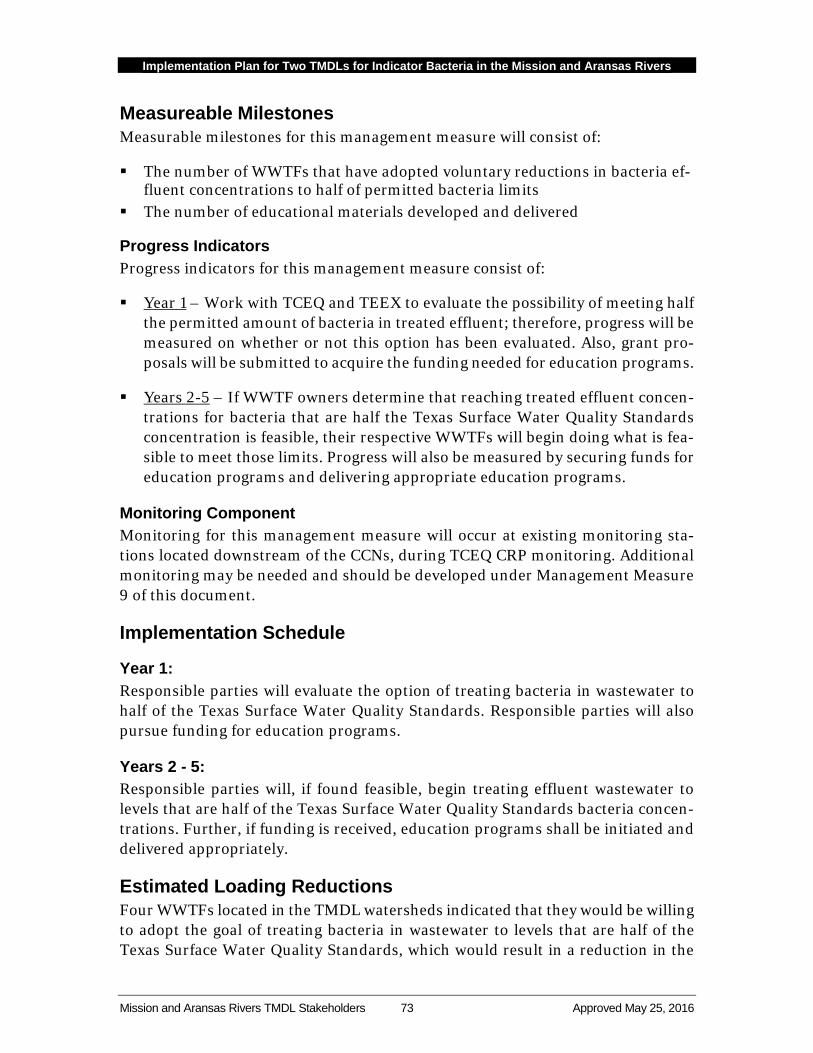
Implementation Plan for Two TMDLs for Indicator Bacteria in the Mission and Aransas Rivers
Mission and Aransas Rivers TMDL Stakeholders 73 Approved May 25, 2016
Measureable Milestones Measurable milestones for this management measure will consist of:
The number of WWTFs that have adopted voluntary reductions in bacteria ef-fluent concentrations to half of permitted bacteria limits
The number of educational materials developed and delivered
Progress Indicators Progress indicators for this management measure consist of:
Year 1 – Work with TCEQ and TEEX to evaluate the possibility of meeting half the permitted amount of bacteria in treated effluent; therefore, progress will be measured on whether or not this option has been evaluated. Also, grant pro-posals will be submitted to acquire the funding needed for education programs.
Years 2-5 – If WWTF owners determine that reaching treated effluent concen-trations for bacteria that are half the Texas Surface Water Quality Standards concentration is feasible, their respective WWTFs will begin doing what is fea-sible to meet those limits. Progress will also be measured by securing funds for education programs and delivering appropriate education programs.
Monitoring Component Monitoring for this management measure will occur at existing monitoring sta-tions located downstream of the CCNs, during TCEQ CRP monitoring. Additional monitoring may be needed and should be developed under Management Measure 9 of this document.
Implementation Schedule
Year 1: Responsible parties will evaluate the option of treating bacteria in wastewater to half of the Texas Surface Water Quality Standards. Responsible parties will also pursue funding for education programs.
Years 2 - 5: Responsible parties will, if found feasible, begin treating effluent wastewater to levels that are half of the Texas Surface Water Quality Standards bacteria concen-trations. Further, if funding is received, education programs shall be initiated and delivered appropriately.
Estimated Loading Reductions Four WWTFs located in the TMDL watersheds indicated that they would be willing to adopt the goal of treating bacteria in wastewater to levels that are half of the Texas Surface Water Quality Standards, which would result in a reduction in the
Implementation Plan for Two TMDLs for Indicator Bacteria in the Mission and Aransas Rivers
Mission and Aransas Rivers TMDL Stakeholders 74 Approved May 25, 2016
current loading of fecal bacteria into the Aransas River. As a result, bacteria load-ing reductions were calculated and resulted in the following:
Mission River watershed – N/A
Aransas River watershed – 1.58 trillion cfu/year Enterococcus
It should be noted that the load reductions shown above were calculated using each participating facility’s full permitted flow as the benchmark.
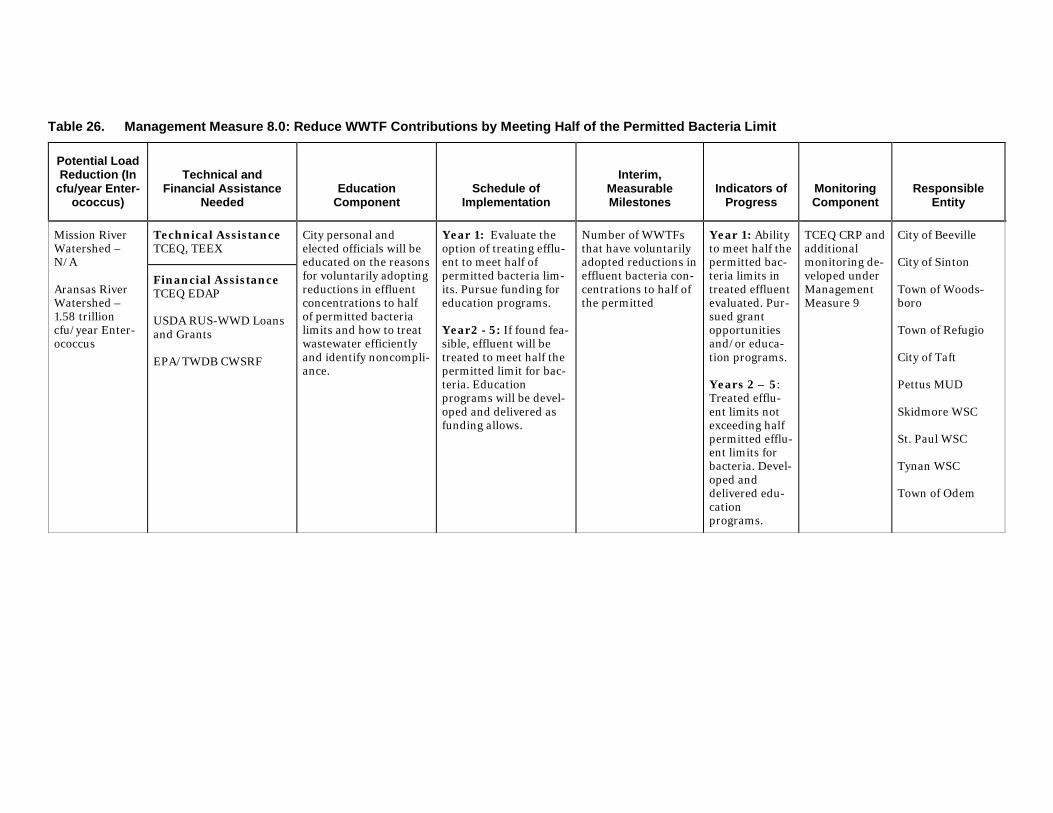
Table 26. Management Measure 8.0: Reduce WWTF Contributions by Meeting Half of the Permitted Bacteria Limit
Potential Load Reduction (In
cfu/year Enter-ococcus)
Technical and Financial Assistance
Needed Education
Component Schedule of
Implementation
Interim, Measurable Milestones
Indicators of Progress
Monitoring Component
Responsible Entity
Mission River Watershed – N/A Aransas River Watershed – 1.58 trillion cfu/year Enter-ococcus
Technical Assistance TCEQ, TEEX
City personal and elected officials will be educated on the reasons for voluntarily adopting reductions in effluent concentrations to half of permitted bacteria limits and how to treat wastewater efficiently and identify noncompli-ance.
Year 1: Evaluate the option of treating efflu-ent to meet half of permitted bacteria lim-its. Pursue funding for education programs. Year2 - 5: If found fea-sible, effluent will be treated to meet half the permitted limit for bac-teria. Education programs will be devel-oped and delivered as funding allows.
Number of WWTFs that have voluntarily adopted reductions in effluent bacteria con-centrations to half of the permitted
Year 1: Ability to meet half the permitted bac-teria limits in treated effluent evaluated. Pur-sued grant opportunities and/or educa-tion programs. Years 2 – 5: Treated efflu-ent limits not exceeding half permitted efflu-ent limits for bacteria. Devel-oped and delivered edu-cation programs.
TCEQ CRP and additional monitoring de-veloped under Management Measure 9
City of Beeville City of Sinton Town of Woods-boro Town of Refugio City of Taft Pettus MUD Skidmore WSC St. Paul WSC Tynan WSC Town of Odem
Financial Assistance TCEQ EDAP USDA RUS-WWD Loans and Grants EPA/TWDB CWSRF
Implementation Plan for Two TMDLs for Indicator Bacteria in the Mission and Aransas Rivers
Mission and Aransas Rivers TMDL Stakeholders 76 Approved May 25, 2016
Management Measure 9 Coordinate and Expand Existing Water Quality Monitoring in the Watershed
Description Expanding water quality monitoring in the watershed has been a primary goal of the Mission River and Aransas River watersheds stakeholder workgroups. Current quarterly monitoring is not sufficient to aid watershed managers in identifying and addressing water quality problems. An expanded monitoring network that collects data at strategic locations on a refined time scale will aid entities involved in the management of their watersheds, identifying where problem areas for bacteria loading may be and when they are most problematic.
Monitoring is needed in the watersheds to accomplish two primary goals:
1) Better define where the problem areas are in the watersheds
2) Monitor long-term trends in water quality prior to and post BMP implemen-tation
Further evaluation of potential sources in the watersheds is also needed. Some in-formation exists across the watersheds regarding potential sources of pollution. A physical survey of the stream network in the watersheds should be conducted and paired with a GIS source survey to further understand potential sources of bacteria in the watersheds.
To fulfill these needs, stakeholders will work together to facilitate development of proposals that refine desired water quality monitoring goals, objectives, tasks, and expected outcomes of special monitoring and source assessment projects. Funding will be sought through various sources including, but not limited to, the TCEQ’s and TSSWCB’s NPS programs, as well as the TGLO CMP, to implement this meas-ure.
A volunteer monitoring program should also be utilized to conduct supplemental monitoring in the watershed to help target future BMP implementation. Stake-holders will work with Texas State University’s Texas Stream Team Program to promote volunteer monitoring in the TMDL watersheds, with the goal of reactivat-ing the two, currently inactive, monitoring sites established on the Aransas River and to establish additional volunteer monitoring sites on the Mission and/or Aransas rivers.
The data produced through the monitoring projects will provide valuable infor-mation to state agencies and watershed stakeholders, aiding them in better managing local water resources and planning future improvements in water qual-ity. All additional monitoring projects identified will be conducted contingent upon the receipt of funding targeted specifically for additional water quality monitoring.
Implementation Plan for Two TMDLs for Indicator Bacteria in the Mission and Aransas Rivers
Mission and Aransas Rivers TMDL Stakeholders 77 Approved May 25, 2016
Some stakeholders in the TMDL watersheds have expressed concerns over the de-clining population of dung beetles (Phanaeus vindex MacLachlan; Onthophagus gazella Fabricius), which are known to help break down fecal matter. Research should be conducted to better understand the population dynamics of dung beetles and potential methods of mitigating the impacts of human and invasive species on these insects in an effort to increase their populations. Possible introduction of ad-ditional dung beetles may be needed in some areas to reestablish depleted beetle populations. More information about dung beetles can be found at <https://in-sects.tamu.edu/fieldguide/bimg146.html>.
The overall purpose of this management measure is to develop a more refined un-derstanding of the spatial and temporal dynamics of bacteria loading in the Mission River Tidal and Aransas River Tidal segments. The water quality impair-ments in the two segments are based on quarterly data collected at a total of three sampling locations (TCEQ stations 12943, 12947, and 12948). To accurately iden-tify and address the sources of water quality impairments in the watershed, an intensified monitoring effort is needed.
Education Component Educating stakeholders about ongoing monitoring and how to access monitoring results would be beneficial to stakeholders by allowing them to track water quality in the Mission and Aransas Rivers throughout the implementation process. Easily accessible websites containing monitoring results and other related information, such as land use, hydrology, soils, and other data and information would be a val-uable planning and management tool for watershed stakeholders as well as natural resource managers and the public. A good example of a website which currently provides valuable data and information to a watershed stakeholder group in south Texas is the Arroyo Colorado Watershed Partnership website: <http://arroyocol-orado.org/map/>.
A watershed website for the Mission and Aransas Rivers would be a beneficial learning tool for stakeholders as monitoring results can be easily accessed and tracked within a number of contexts. Furthermore, stakeholders should be edu-cated on the various types of monitoring, benefits of different monitoring frequencies, identification of sites, etc., so that an appropriate monitoring regime could be developed that would capture the effectiveness of TMDL implementation. Forums for stakeholder input could be provided by local entities such as the coor-dinated monitoring meetings hosted by the NRA. Finally, stakeholders should be engaged by learning through experience utilizing a voluntary monitoring program.
Priority Areas Priority areas for this management measure will be identified by the stakeholders as data quality objectives are refined.
Implementation Plan for Two TMDLs for Indicator Bacteria in the Mission and Aransas Rivers
Mission and Aransas Rivers TMDL Stakeholders 78 Approved May 25, 2016
Responsible Parties and Funding
Responsible Parties
Nueces River Authority The NRA will continue to monitor the Mission River and Aransas River watersheds under the state’s CRP, as funding allows.
TCEQ The TCEQ’s CRP will continue to support monitoring of the Mission and Aransas River watersheds.
TCEQ The TCEQ Region 14 Office will continue to support monitoring efforts in the wa-tershed through their involvement in coordinated monitoring efforts.
Stakeholders will assist in determining and refining data and data quality objec-tives for future monitoring programs so that activities can be targeted in priority areas.
Technical Assistance Texas Water Resources Institute (TWRI) will assist, as funding allows, in coordi-nating monitoring efforts in the watershed; TWRI will assist watershed stakeholders in the development of monitoring proposals, and will manage the monitoring projects to ensure that they are completed as described.
Nueces River Authority – The NRA can provide monitoring services through TCEQ’s CRP or through grant-funded projects, as funding allows. The NRA can also provide technical assistance to other responsible parties.
TCEQ CRP can provide further technical assistance in determining monitoring fre-quency and locations.
Financial Assistance TCEQ and TSSWCB – The state’s NPS and State General Revenue funds may be used to fund monitoring efforts in addition to the ongoing CRP efforts.
GLO – The CMP may also be a source of funds to continue and to enhance moni-toring efforts.
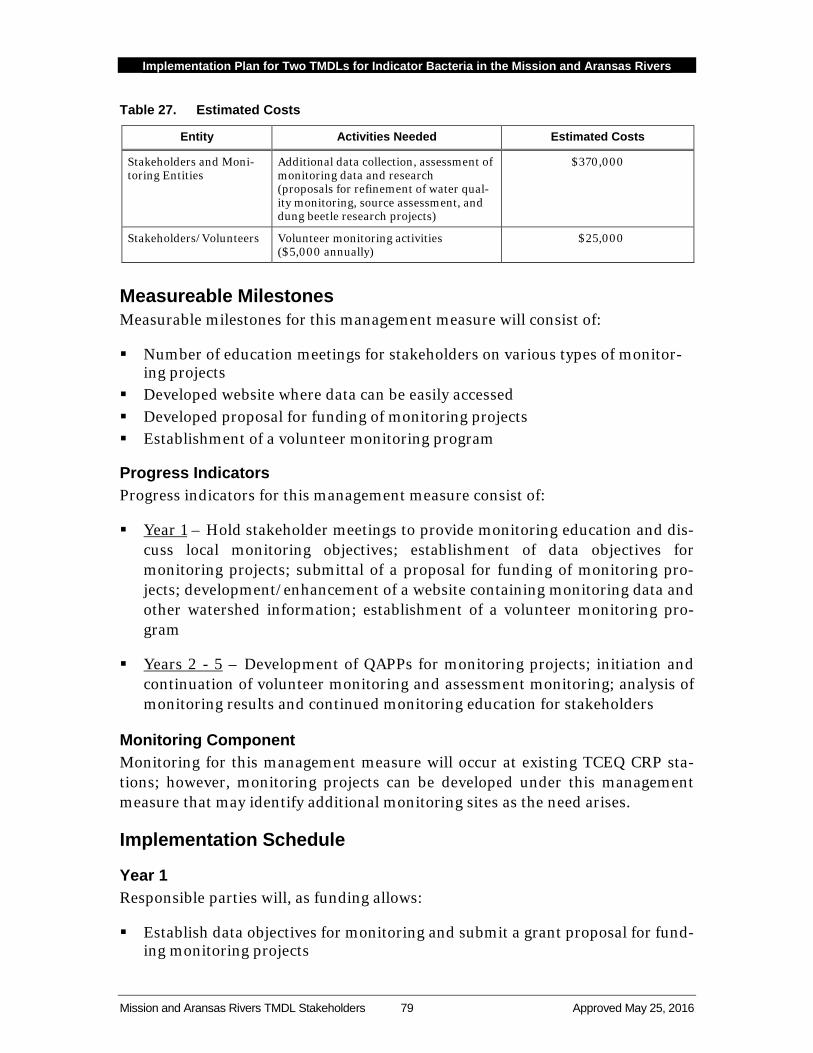
Implementation Plan for Two TMDLs for Indicator Bacteria in the Mission and Aransas Rivers
Mission and Aransas Rivers TMDL Stakeholders 79 Approved May 25, 2016
Table 27. Estimated Costs
Entity Activities Needed Estimated Costs
Stakeholders and Moni-toring Entities
Additional data collection, assessment of monitoring data and research (proposals for refinement of water qual-ity monitoring, source assessment, and dung beetle research projects)
$370,000
Stakeholders/Volunteers Volunteer monitoring activities ($5,000 annually)
$25,000
Measureable Milestones Measurable milestones for this management measure will consist of:
Number of education meetings for stakeholders on various types of monitor-ing projects
Developed website where data can be easily accessed Developed proposal for funding of monitoring projects Establishment of a volunteer monitoring program
Progress Indicators Progress indicators for this management measure consist of:
Year 1 – Hold stakeholder meetings to provide monitoring education and dis-cuss local monitoring objectives; establishment of data objectives for monitoring projects; submittal of a proposal for funding of monitoring pro-jects; development/enhancement of a website containing monitoring data and other watershed information; establishment of a volunteer monitoring pro-gram
Years 2 - 5 – Development of QAPPs for monitoring projects; initiation and continuation of volunteer monitoring and assessment monitoring; analysis of monitoring results and continued monitoring education for stakeholders
Monitoring Component Monitoring for this management measure will occur at existing TCEQ CRP sta-tions; however, monitoring projects can be developed under this management measure that may identify additional monitoring sites as the need arises.
Implementation Schedule
Year 1 Responsible parties will, as funding allows:
Establish data objectives for monitoring and submit a grant proposal for fund-ing monitoring projects
Implementation Plan for Two TMDLs for Indicator Bacteria in the Mission and Aransas Rivers
Mission and Aransas Rivers TMDL Stakeholders 80 Approved May 25, 2016
Develop a website containing water quality data and watershed information Promote volunteer monitoring
Years 2 – 5 Responsible parties will, as funding allows:
Develop QAPPs for monitoring projects; Initiate and continue both targeted monitoring and volunteer monitoring; an-
alyze monitoring results and continue monitoring education
Estimated Loading Reductions Loading reductions from additional water quality monitoring cannot be quanti-fied.
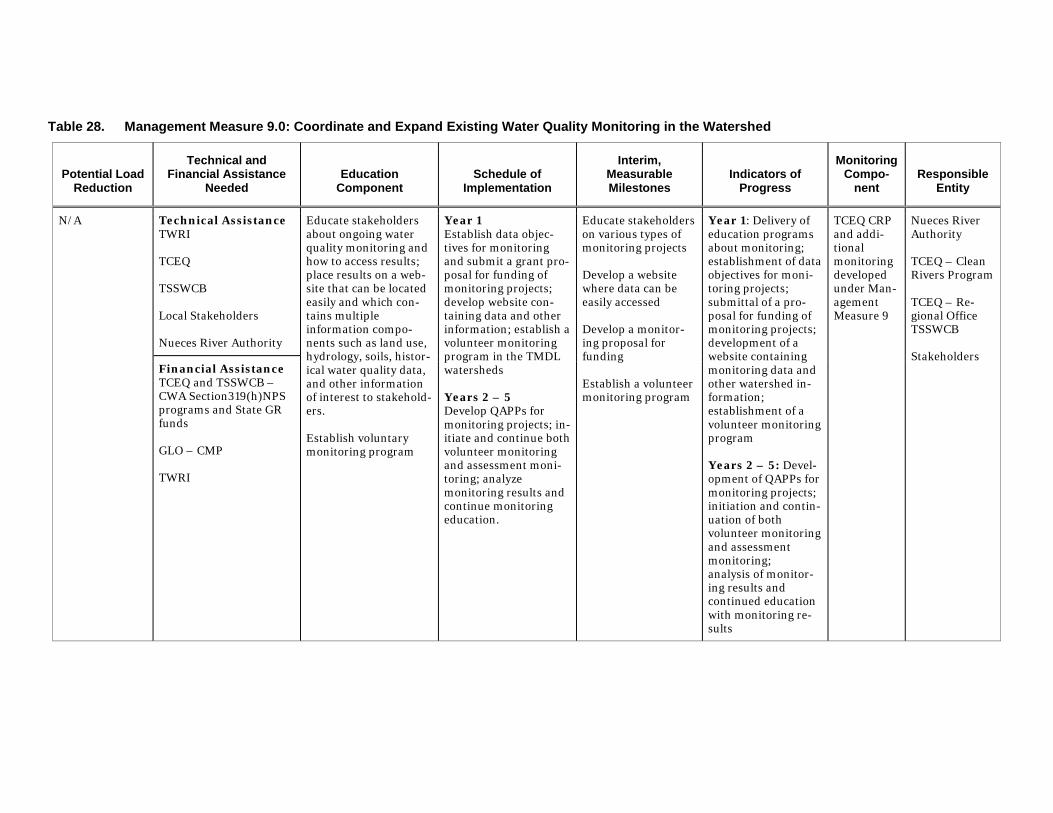
Table 28. Management Measure 9.0: Coordinate and Expand Existing Water Quality Monitoring in the Watershed
Potential Load Reduction
Technical and Financial Assistance
Needed Education
Component Schedule of
Implementation
Interim, Measurable Milestones
Indicators of Progress
Monitoring Compo-
nent Responsible
Entity
N/A Technical Assistance TWRI TCEQ TSSWCB Local Stakeholders Nueces River Authority
Educate stakeholders about ongoing water quality monitoring and how to access results; place results on a web-site that can be located easily and which con-tains multiple information compo-nents such as land use, hydrology, soils, histor-ical water quality data, and other information of interest to stakehold-ers. Establish voluntary monitoring program
Year 1 Establish data objec-tives for monitoring and submit a grant pro-posal for funding of monitoring projects; develop website con-taining data and other information; establish a volunteer monitoring program in the TMDL watersheds Years 2 – 5 Develop QAPPs for monitoring projects; in-itiate and continue both volunteer monitoring and assessment moni-toring; analyze monitoring results and continue monitoring education.
Educate stakeholders on various types of monitoring projects Develop a website where data can be easily accessed Develop a monitor-ing proposal for funding Establish a volunteer monitoring program
Year 1: Delivery of education programs about monitoring; establishment of data objectives for moni-toring projects; submittal of a pro-posal for funding of monitoring projects; development of a website containing monitoring data and other watershed in-formation; establishment of a volunteer monitoring program Years 2 – 5: Devel-opment of QAPPs for monitoring projects; initiation and contin-uation of both volunteer monitoring and assessment monitoring; analysis of monitor-ing results and continued education with monitoring re-sults
TCEQ CRP and addi-tional monitoring developed under Man-agement Measure 9
Nueces River Authority TCEQ – Clean Rivers Program TCEQ – Re-gional Office TSSWCB Stakeholders
Financial Assistance TCEQ and TSSWCB – CWA Section319(h)NPS programs and State GR funds GLO – CMP TWRI
Implementation Plan for Two TMDLs for Indicator Bacteria in the Mission and Aransas Rivers
Mission and Aransas Rivers TMDL Stakeholders 82 Approved May 25, 2016
Control Action 1 Improved Monitoring of WWTF Effluent to Ensure Permit Compliance
Description In November 2009, the TCEQ commissioners approved Rule Project No. 2009-005-309-PR. This rule requires the addition of bacteria limits for all TPDES do-mestic permits. The rule places E. coli discharge limits for wastewater discharged to freshwater and Enterococcus for wastewater discharged into saltwater. Accord-ing to the rule, the bacteria limits are to be included in the permit during the permittee’s next permit amendment or renewal. This rule is defined in Title 30, Texas Administrative Code, Chapter 309 and the frequency of testing is defined in Chapter 319.
Through this control action, each permit holder will continue to monitor for E. coli or Enterococcus concentrations in WWTF effluent as required by individual WWTF permits and any subsequent permit amendments or revisions. Each permit specifically outlines the effluent constituents that require monitoring as well as the monitoring frequency to which the permittee must adhere. If the permit does not specify a sampling frequency for bacteria, the permittee should begin sampling no less than once per quarter. The TCEQ reviews and documents compliance with in-dividual permits. WWTF permits must be renewed by the permittee every five years.
Currently, there are 12 permitted WWTFs in the Mission River and Aransas River watersheds; nine are required to monitor for E. coli and one is required to monitor for Enterococcus levels in their wastewater effluent. The other two WWTFs will be required to monitor for E. coli or Enterococcus upon renewal of (or amendment to) their permits. Table 29 provides information regarding current bacteria limits, treatment type, and monitoring frequency for each individual WWTF.
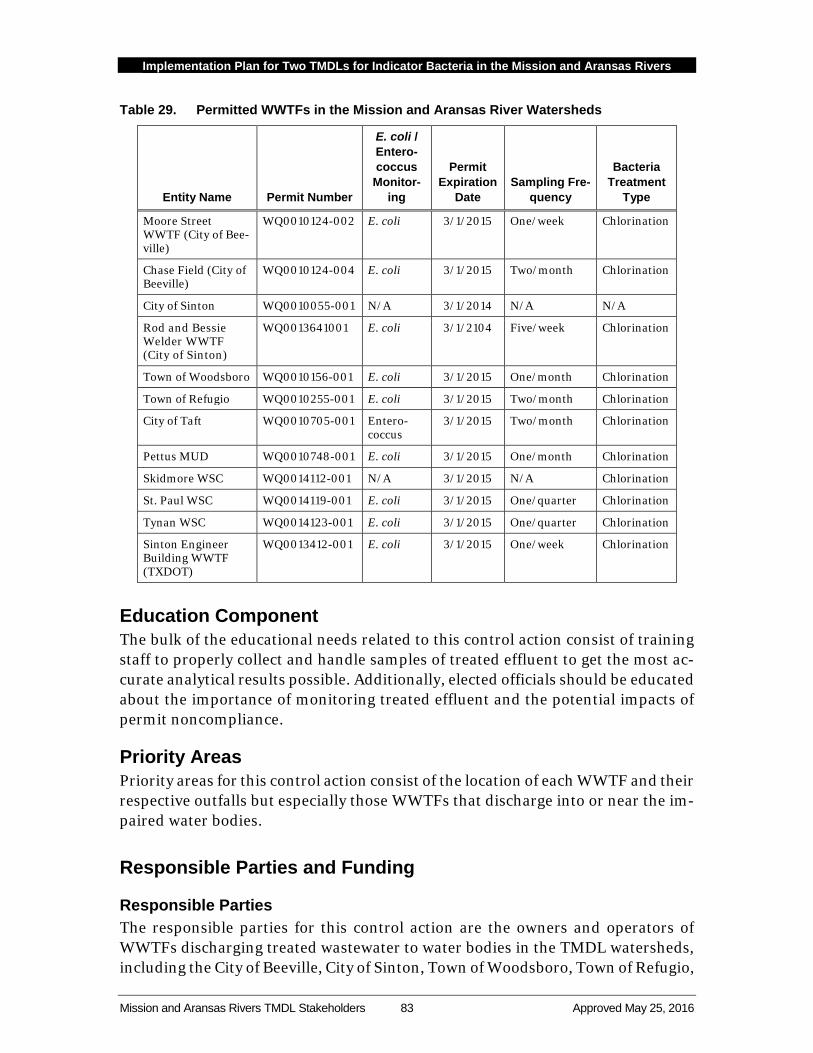
Implementation Plan for Two TMDLs for Indicator Bacteria in the Mission and Aransas Rivers
Mission and Aransas Rivers TMDL Stakeholders 83 Approved May 25, 2016
Table 29. Permitted WWTFs in the Mission and Aransas River Watersheds
Entity Name Permit Number
E. coli / Entero-coccus
Monitor-ing
Permit Expiration
Date Sampling Fre-
quency
Bacteria Treatment
Type
Moore Street WWTF (City of Bee-ville)
WQ0010124-002 E. coli 3/1/2015 One/week Chlorination
Chase Field (City of Beeville)
WQ0010124-004 E. coli 3/1/2015 Two/month Chlorination
City of Sinton WQ0010055-001 N/A 3/1/2014 N/A N/A
Rod and Bessie Welder WWTF (City of Sinton)
WQ0013641001
E. coli 3/1/2104 Five/week Chlorination
Town of Woodsboro WQ0010156-001 E. coli 3/1/2015 One/month Chlorination
Town of Refugio WQ0010255-001 E. coli 3/1/2015 Two/month Chlorination
City of Taft WQ0010705-001 Entero-coccus
3/1/2015 Two/month Chlorination
Pettus MUD WQ0010748-001 E. coli 3/1/2015 One/month Chlorination
Skidmore WSC WQ0014112-001 N/A 3/1/2015 N/A Chlorination
St. Paul WSC WQ0014119-001 E. coli 3/1/2015 One/quarter Chlorination
Tynan WSC WQ0014123-001 E. coli 3/1/2015 One/quarter Chlorination
Sinton Engineer Building WWTF (TXDOT)
WQ0013412-001 E. coli 3/1/2015 One/week Chlorination
Education Component The bulk of the educational needs related to this control action consist of training staff to properly collect and handle samples of treated effluent to get the most ac-curate analytical results possible. Additionally, elected officials should be educated about the importance of monitoring treated effluent and the potential impacts of permit noncompliance.
Priority Areas Priority areas for this control action consist of the location of each WWTF and their respective outfalls but especially those WWTFs that discharge into or near the im-paired water bodies.
Responsible Parties and Funding
Responsible Parties The responsible parties for this control action are the owners and operators of WWTFs discharging treated wastewater to water bodies in the TMDL watersheds, including the City of Beeville, City of Sinton, Town of Woodsboro, Town of Refugio,
Implementation Plan for Two TMDLs for Indicator Bacteria in the Mission and Aransas Rivers
Mission and Aransas Rivers TMDL Stakeholders 84 Approved May 25, 2016
City of Taft, Pettus MUD, Skidmore WSC, St. Paul WSC, Tynan WSC and the Texas Department of Transportation (TXDOT), will be responsible for maintaining com-pliance with the monitoring requirements specified in their respective TPDES permits.
Technical Assistance TCEQ is responsible for monitoring permit compliance and enforcement and can also provide technical assistance to the WWTF owners and operators through the TCEQ’s Small Business and Local Government Assistance Program.
TEEX offers a Water and Wastewater Technical Assistance Program for small wastewater systems within the state. The program provides technical assistance and training to small wastewater systems to help correct operational problems common to small WWTFs. One-on-one technical assistance is available for these small wastewater systems to determine the causes of common performance prob-lems and to ensure that the small wastewater systems are operating within permit requirements and in compliance with effluent limits.
The Texas Rural Water Association (TRWA) has two wastewater training and tech-nical assistance providers who assist wastewater system operators across the state. They provide training workshops across the state that include topics like wastewater operations and maintenance, testing procedures, rule updates, facility management, security, and other topics, as needed or requested, that relate to WWTF operations. TRWA staff also provide on-site technical assistance to non-profit wastewater systems, districts, and small cities with populations of less than 10,000. This technical assistance deals with operations, maintenance, collection systems, treatment facilities, rates, system management, rule changes, state laws, and other topics or issues that affect small wastewater systems.
Private firms also offer onsite training to their customers as part of their water and wastewater treatment services. This is accomplished through hands-on instruction and seminars on basic water treatment practices and procedures-control testing, and the safe handling of chemicals.
Financial Assistance TWDB EDAP- EDAP provides financial assistance to fund water and wastewater services in economically distressed areas, where services do not exist, or where these services do not meet minimum state standards.
USDA RUS-WWD Loans and Grants- The RUS is amending its regulations related to 7 U.S.C. 1926(c) Section 306C, WWD Loans and Grants Program, which funds construction of water and waste disposal facilities and services in low-income rural communities whose residents face significant health risks.
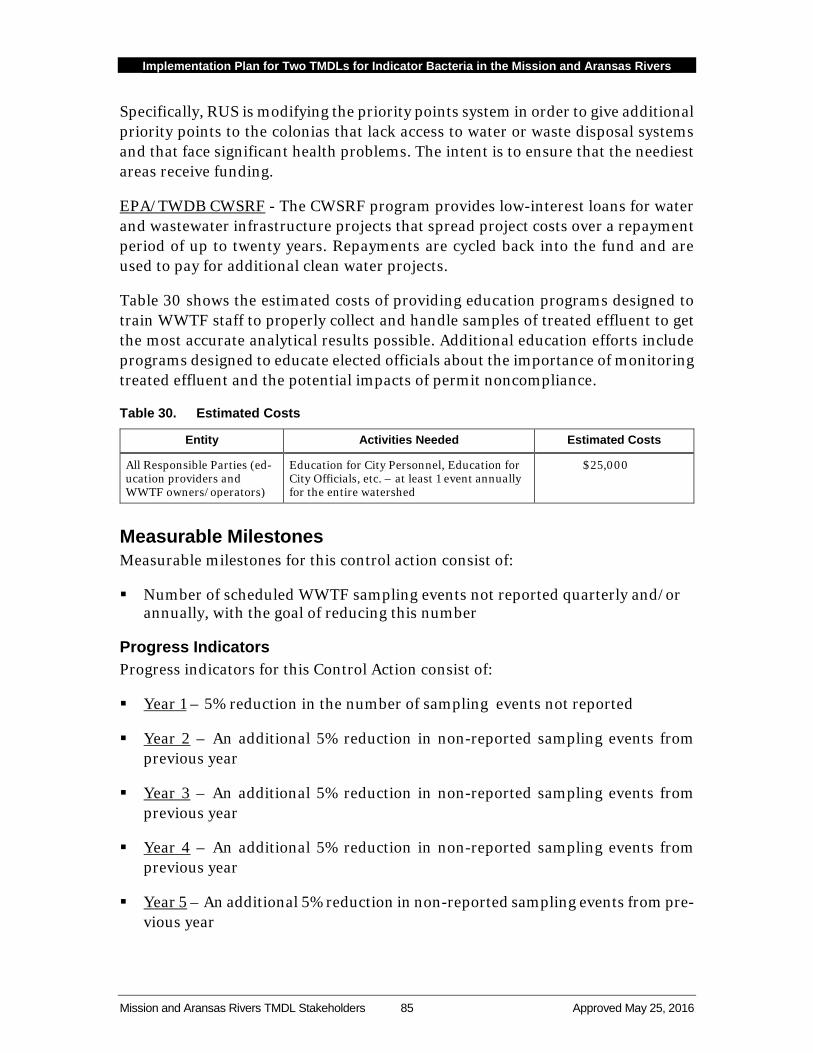
Implementation Plan for Two TMDLs for Indicator Bacteria in the Mission and Aransas Rivers
Mission and Aransas Rivers TMDL Stakeholders 85 Approved May 25, 2016
Specifically, RUS is modifying the priority points system in order to give additional priority points to the colonias that lack access to water or waste disposal systems and that face significant health problems. The intent is to ensure that the neediest areas receive funding.
EPA/TWDB CWSRF - The CWSRF program provides low-interest loans for water and wastewater infrastructure projects that spread project costs over a repayment period of up to twenty years. Repayments are cycled back into the fund and are used to pay for additional clean water projects.
Table 30 shows the estimated costs of providing education programs designed to train WWTF staff to properly collect and handle samples of treated effluent to get the most accurate analytical results possible. Additional education efforts include programs designed to educate elected officials about the importance of monitoring treated effluent and the potential impacts of permit noncompliance.
Table 30. Estimated Costs
Entity Activities Needed Estimated Costs
All Responsible Parties (ed-ucation providers and WWTF owners/operators)
Education for City Personnel, Education for City Officials, etc. – at least 1 event annually for the entire watershed
$25,000
Measurable Milestones Measurable milestones for this control action consist of:
Number of scheduled WWTF sampling events not reported quarterly and/or annually, with the goal of reducing this number
Progress Indicators Progress indicators for this Control Action consist of:
Year 1 – 5% reduction in the number of sampling events not reported
Year 2 – An additional 5% reduction in non-reported sampling events from previous year
Year 3 – An additional 5% reduction in non-reported sampling events from previous year
Year 4 – An additional 5% reduction in non-reported sampling events from previous year
Year 5 – An additional 5% reduction in non-reported sampling events from pre-vious year
Implementation Plan for Two TMDLs for Indicator Bacteria in the Mission and Aransas Rivers
Mission and Aransas Rivers TMDL Stakeholders 86 Approved May 25, 2016
Monitoring Component To ensure in-stream compliance with the standards for this management measure, TCEQ CRP monitoring stations will be utilized for measuring bacteria concentra-tions, especially in critical areas. Additional special monitoring may be needed and can be developed under Management Measure 9 of this document.
Implementation Schedule All WWTF permittees will monitor effluent quality according to their permit re-quirements and will report monitoring results appropriately throughout the implementation term of this plan and beyond. Progress indicators will be tracked by TCEQ and communicated to stakeholders annually.
Estimated Loading Reductions No loading reductions can be estimated in association with this control action.
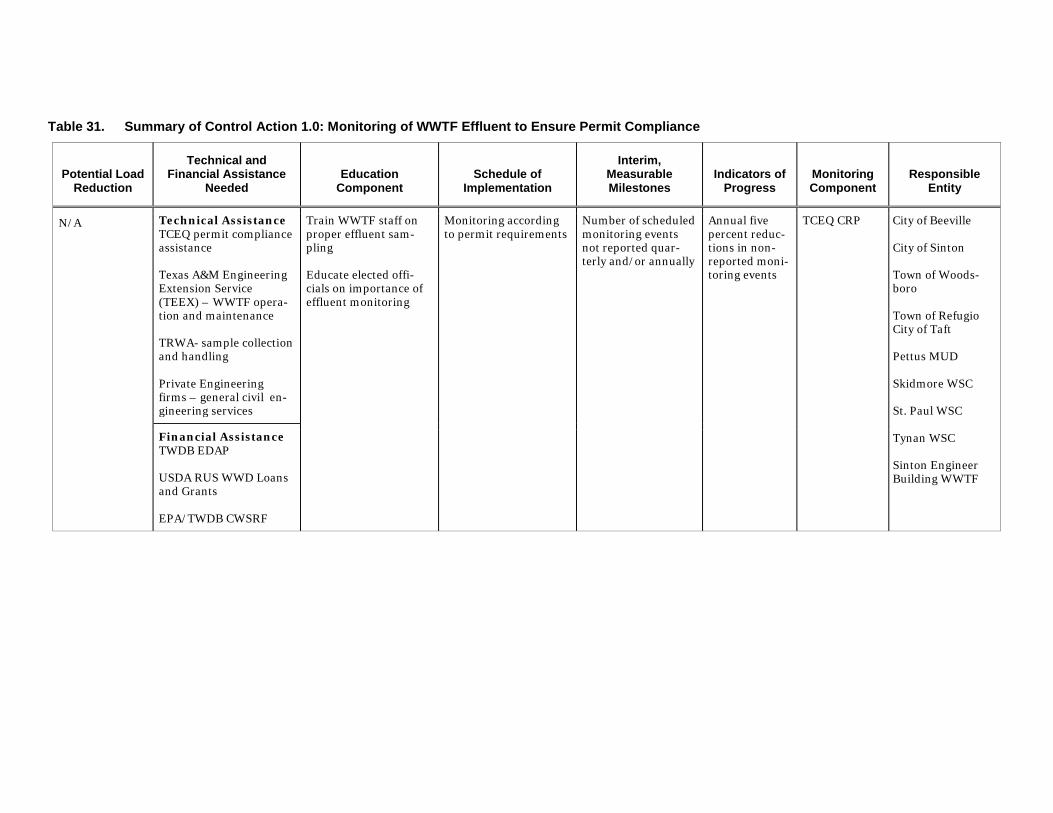
Table 31. Summary of Control Action 1.0: Monitoring of WWTF Effluent to Ensure Permit Compliance
Potential Load Reduction
Technical and Financial Assistance
Needed Education
Component Schedule of
Implementation
Interim, Measurable Milestones
Indicators of Progress
Monitoring Component
Responsible Entity
N/A
Technical Assistance TCEQ permit compliance assistance Texas A&M Engineering Extension Service (TEEX) – WWTF opera-tion and maintenance TRWA- sample collection and handling Private Engineering firms – general civil en-gineering services
Train WWTF staff on proper effluent sam-pling Educate elected offi-cials on importance of effluent monitoring
Monitoring according to permit requirements
Number of scheduled monitoring events not reported quar-terly and/or annually
Annual five percent reduc-tions in non-reported moni-toring events
TCEQ CRP City of Beeville City of Sinton Town of Woods-boro Town of Refugio City of Taft Pettus MUD Skidmore WSC St. Paul WSC Tynan WSC Sinton Engineer Building WWTF
Financial Assistance TWDB EDAP USDA RUS WWD Loans and Grants EPA/TWDB CWSRF
Implementation Plan for Two TMDLs for Indicator Bacteria in the Mission and Aransas Rivers
Mission and Aransas Rivers TMDL Stakeholders 88 Approved May 25, 2016
Control Action 2 Improve and Upgrade WWTFs
Description All WWTFs in the Mission River and Aransas River watersheds collect wastewater from small urban areas and treat the wastewater prior to discharging it into one of several receiving water bodies in the watershed. WWTF operators in the TMDL wa-tersheds recognize the importance of treating wastewater effluent to eliminate bacteria and are aware of the recent changes to permit requirements. To date, some investments have already been made in improving WWTFs to treat bacteria.
The purpose of this management measure is to update WWTFs that are not currently treating their effluent to the lowest bacteria levels possible, so that bacteria treat-ment is optimized for each facility, as appropriate. Further, those WWTFs in the TMDL watersheds that currently treat bacteria to acceptable levels may need to im-prove/upgrade their treatment process to accommodate population growth and to more efficiently treat effluent and reduce periodic exceedances. Responsible parties will identify whether or not bacteria treatment levels need to be improved in any of the WWTFs in the watersheds and will also identify the need to improve/upgrade the general treatment process at each facility. Also, as WWTF capacity is reached in some facilities, there may be a need to expand treatment capacity. Responsible par-ties will evaluate the inflow and capacity of each WWTF in the TMDL watersheds and identify expansion needs.
Following the assessment of WWTFs described above, responsible parties will pur-sue funding and make appropriate improvements/upgrades as funding allows.
Education Component Education for this control action will consist of general WWTF operator training, which can help facility staff identify malfunctioning equipment, determine the need for system upgrades, and anticipate and identify problems with plant capacity. Ad-ditionally, educating elected officials regarding the importance of efficient treatment processes will also be a critical component of this control action. Furthermore, re-sponsible parties in the TMDL watersheds may need to be educated on how to pursue funds for making necessary upgrades and improvements.
Priority Areas Priority areas for this management measure will be the locations of each WWTF, but the highest priority will be given to those WWTFs that discharge into or near the impaired water bodies. In terms of temporal priority, first priority will be given to WWTFs that are currently not treating their wastewater effluent for bacteria effec-tively and/or are not meeting their permitted bacteria limits. Subsequent priority will be given to WWTFs where upgrades and improvements are needed, with special
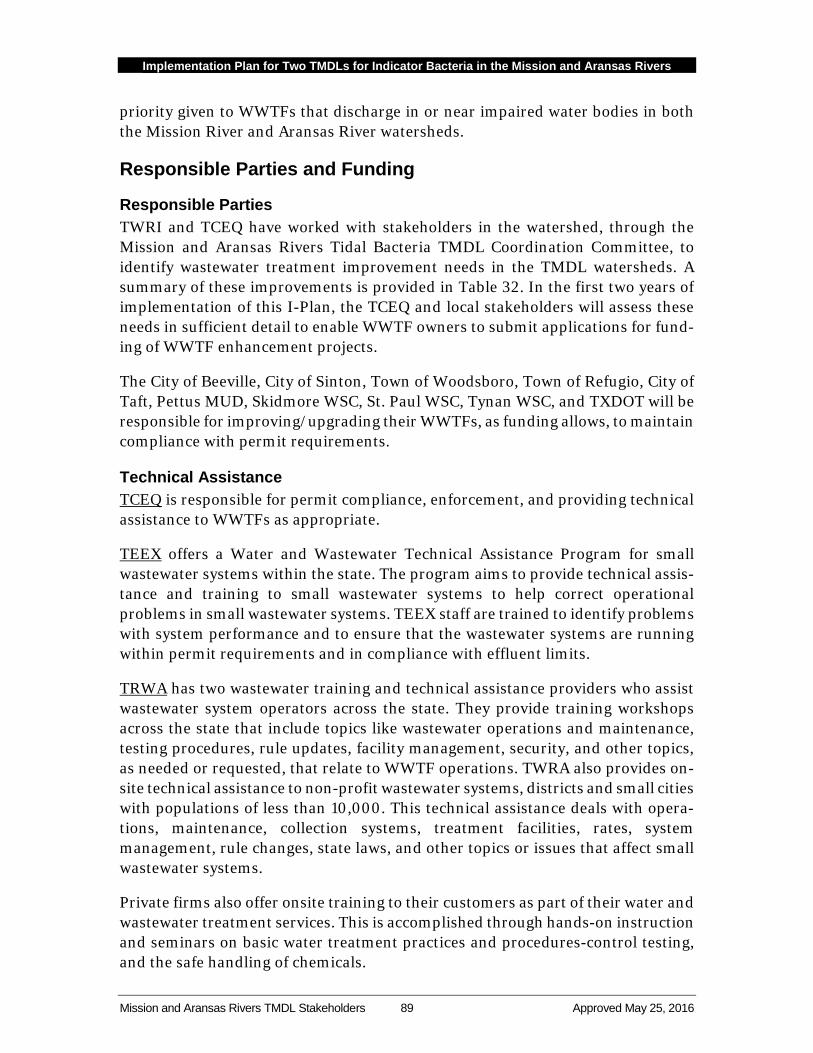
Implementation Plan for Two TMDLs for Indicator Bacteria in the Mission and Aransas Rivers
Mission and Aransas Rivers TMDL Stakeholders 89 Approved May 25, 2016
priority given to WWTFs that discharge in or near impaired water bodies in both the Mission River and Aransas River watersheds.
Responsible Parties and Funding
Responsible Parties TWRI and TCEQ have worked with stakeholders in the watershed, through the Mission and Aransas Rivers Tidal Bacteria TMDL Coordination Committee, to identify wastewater treatment improvement needs in the TMDL watersheds. A summary of these improvements is provided in Table 32. In the first two years of implementation of this I-Plan, the TCEQ and local stakeholders will assess these needs in sufficient detail to enable WWTF owners to submit applications for fund-ing of WWTF enhancement projects.
The City of Beeville, City of Sinton, Town of Woodsboro, Town of Refugio, City of Taft, Pettus MUD, Skidmore WSC, St. Paul WSC, Tynan WSC, and TXDOT will be responsible for improving/upgrading their WWTFs, as funding allows, to maintain compliance with permit requirements.
Technical Assistance TCEQ is responsible for permit compliance, enforcement, and providing technical assistance to WWTFs as appropriate.
TEEX offers a Water and Wastewater Technical Assistance Program for small wastewater systems within the state. The program aims to provide technical assis-tance and training to small wastewater systems to help correct operational problems in small wastewater systems. TEEX staff are trained to identify problems with system performance and to ensure that the wastewater systems are running within permit requirements and in compliance with effluent limits.
TRWA has two wastewater training and technical assistance providers who assist wastewater system operators across the state. They provide training workshops across the state that include topics like wastewater operations and maintenance, testing procedures, rule updates, facility management, security, and other topics, as needed or requested, that relate to WWTF operations. TWRA also provides on-site technical assistance to non-profit wastewater systems, districts and small cities with populations of less than 10,000. This technical assistance deals with opera-tions, maintenance, collection systems, treatment facilities, rates, system management, rule changes, state laws, and other topics or issues that affect small wastewater systems.
Private firms also offer onsite training to their customers as part of their water and wastewater treatment services. This is accomplished through hands-on instruction and seminars on basic water treatment practices and procedures-control testing, and the safe handling of chemicals.
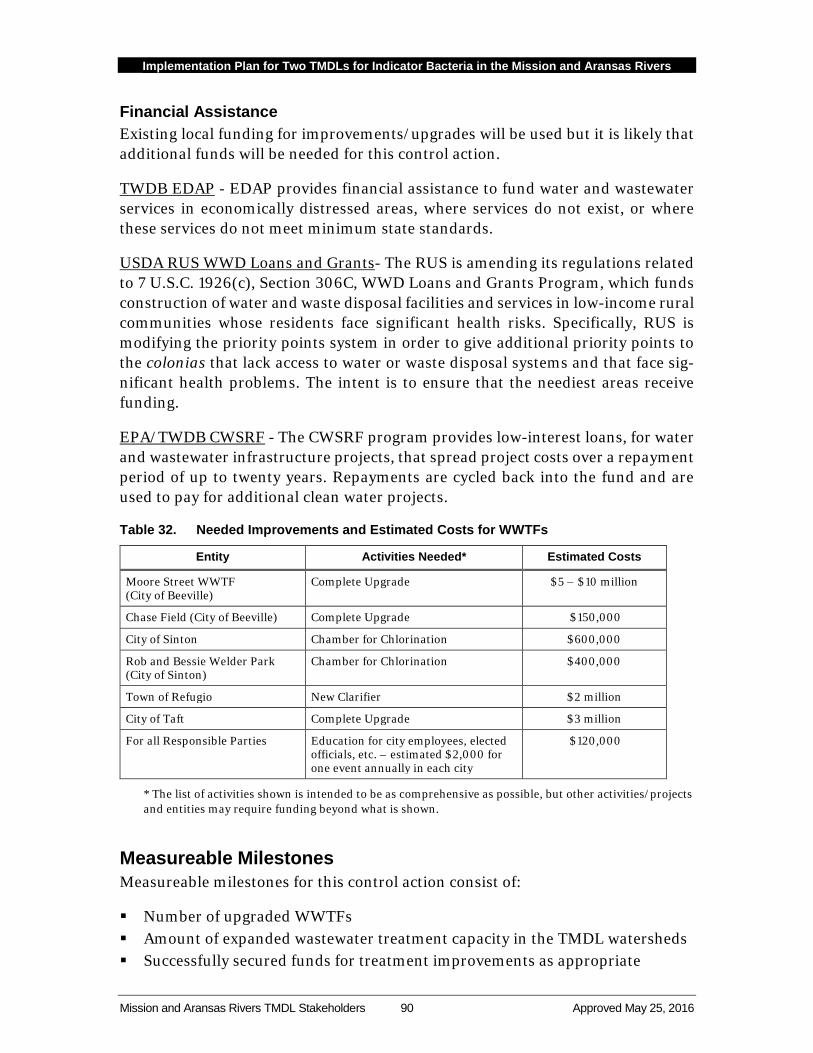
Implementation Plan for Two TMDLs for Indicator Bacteria in the Mission and Aransas Rivers
Mission and Aransas Rivers TMDL Stakeholders 90 Approved May 25, 2016
Financial Assistance Existing local funding for improvements/upgrades will be used but it is likely that additional funds will be needed for this control action.
TWDB EDAP - EDAP provides financial assistance to fund water and wastewater services in economically distressed areas, where services do not exist, or where these services do not meet minimum state standards.
USDA RUS WWD Loans and Grants- The RUS is amending its regulations related to 7 U.S.C. 1926(c), Section 306C, WWD Loans and Grants Program, which funds construction of water and waste disposal facilities and services in low-income rural communities whose residents face significant health risks. Specifically, RUS is modifying the priority points system in order to give additional priority points to the colonias that lack access to water or waste disposal systems and that face sig-nificant health problems. The intent is to ensure that the neediest areas receive funding.
EPA/TWDB CWSRF - The CWSRF program provides low-interest loans, for water and wastewater infrastructure projects, that spread project costs over a repayment period of up to twenty years. Repayments are cycled back into the fund and are used to pay for additional clean water projects.
Table 32. Needed Improvements and Estimated Costs for WWTFs
Entity Activities Needed* Estimated Costs
Moore Street WWTF (City of Beeville)
Complete Upgrade $5 – $10 million
Chase Field (City of Beeville) Complete Upgrade $150,000
City of Sinton Chamber for Chlorination $600,000
Rob and Bessie Welder Park (City of Sinton)
Chamber for Chlorination $400,000
Town of Refugio New Clarifier $2 million
City of Taft Complete Upgrade $3 million
For all Responsible Parties Education for city employees, elected officials, etc. – estimated $2,000 for one event annually in each city
$120,000
* The list of activities shown is intended to be as comprehensive as possible, but other activities/projects and entities may require funding beyond what is shown.
Measureable Milestones Measureable milestones for this control action consist of:
Number of upgraded WWTFs Amount of expanded wastewater treatment capacity in the TMDL watersheds Successfully secured funds for treatment improvements as appropriate
Implementation Plan for Two TMDLs for Indicator Bacteria in the Mission and Aransas Rivers
Mission and Aransas Rivers TMDL Stakeholders 91 Approved May 25, 2016
Progress Indicator Progress indicators for this management measure consist of:
Years 1 – 2 – identification of wastewater treatment improvement needs
Years 3 – 5 – as funding allows, make upgrades/improvements to WWTFs to ensure adequate treatment of effluent for bacteria
Monitoring Component TCEQ CRP monitoring stations will be utilized for measuring instream bacteria loadings, especially in critical areas. Additional special monitoring may be needed and can be developed under Management Measure 9 of this document.
Implementation Schedule
Years 1 - 2: Responsible parties will, as funding allows:
Identify WWTFs with substandard bacteria treatment systems Pursue technical assistance as appropriate Identify improvements that can be made in treating wastewater effluent for
bacteria Identify potential capacity and expansion needs Pursue funding for upgrades/improvements
Years 3 – 5: Responsible parties will, as funding allows:
Begin making upgrades to WWTFs with substandard bacteria treatment lev-els, improve bacteria treatment levels at some facilities, and expand treatment capacities at facilities that are running at or near their current capacity.
Estimated Loading Reductions Mission River Watershed - All WWTFs in the Mission River watershed are cur-rently meeting their permit requirements, including bacteria effluent limits. Therefore, no loading reductions can be estimated from continued compliance. Af-ter wastewater treatment improvements are made, some WWTFs owners may opt to set effluent concentration goals, under Management Measure 8, that are below their TPDES permit limits.
Aransas River Watershed – Actions taken to bring all WWTFs in this watershed into compliance with their respective permit limits may result in a load reduction of 737.63 billion cfu/year Enterococcus.
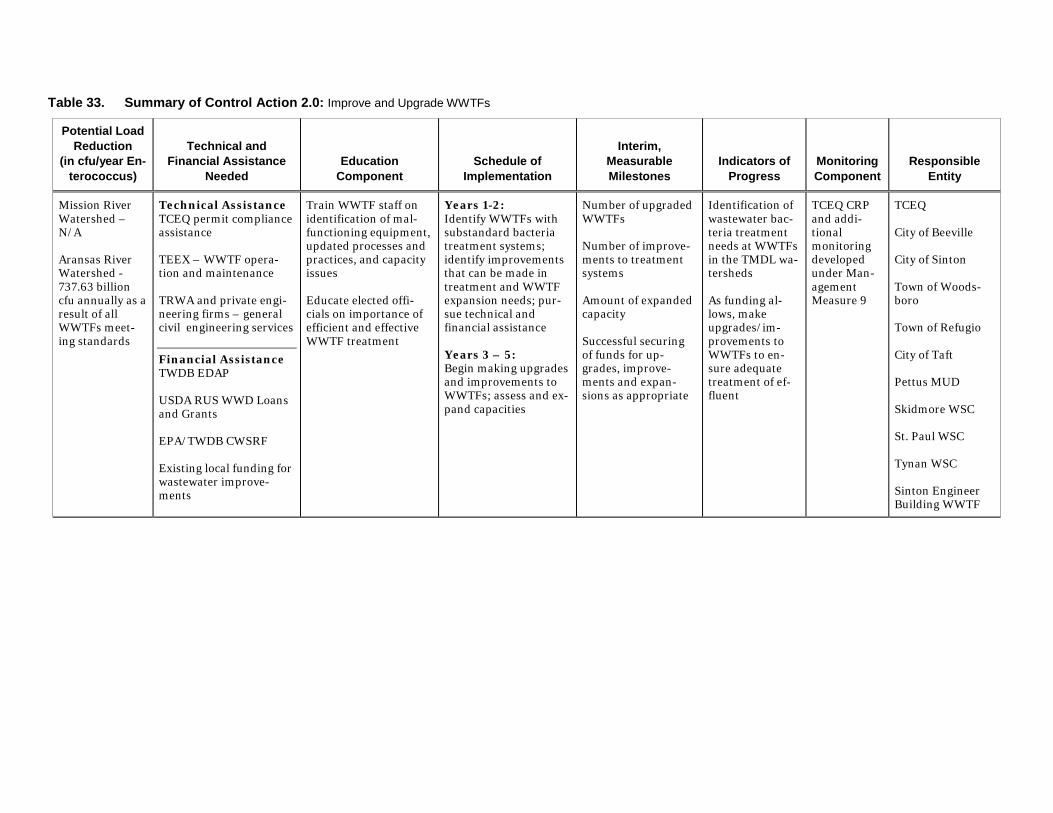
Table 33. Summary of Control Action 2.0: Improve and Upgrade WWTFs
Potential Load Reduction
(in cfu/year En-terococcus)
Technical and Financial Assistance
Needed Education
Component Schedule of
Implementation
Interim, Measurable Milestones
Indicators of Progress
Monitoring Component
Responsible Entity
Mission River Watershed – N/A Aransas River Watershed - 737.63 billion cfu annually as a result of all WWTFs meet-ing standards
Technical Assistance TCEQ permit compliance assistance TEEX – WWTF opera-tion and maintenance TRWA and private engi-neering firms – general civil engineering services Financial Assistance TWDB EDAP USDA RUS WWD Loans and Grants EPA/TWDB CWSRF Existing local funding for wastewater improve-ments
Train WWTF staff on identification of mal-functioning equipment, updated processes and practices, and capacity issues Educate elected offi-cials on importance of efficient and effective WWTF treatment
Years 1-2: Identify WWTFs with substandard bacteria treatment systems; identify improvements that can be made in treatment and WWTF expansion needs; pur-sue technical and financial assistance Years 3 – 5: Begin making upgrades and improvements to WWTFs; assess and ex-pand capacities
Number of upgraded WWTFs Number of improve-ments to treatment systems Amount of expanded capacity Successful securing of funds for up-grades, improve-ments and expan-sions as appropriate
Identification of wastewater bac-teria treatment needs at WWTFs in the TMDL wa-tersheds As funding al-lows, make upgrades/im-provements to WWTFs to en-sure adequate treatment of ef-fluent
TCEQ CRP and addi-tional monitoring developed under Man-agement Measure 9
TCEQ City of Beeville City of Sinton Town of Woods-boro Town of Refugio City of Taft Pettus MUD Skidmore WSC St. Paul WSC Tynan WSC Sinton Engineer Building WWTF
Implementation Plan for Two TMDLs for Indicator Bacteria in the Mission and Aransas Rivers
Mission and Aransas Rivers TMDL Stakeholders 93 Approved May 25, 2016
Sustainability The TCEQ and stakeholders in TMDL implementation projects periodically assess the results of the planned activities and other sources of information to evaluate the effectiveness of the I-Plan. Stakeholders evaluate several factors, such as the pace of implementation, the effectiveness of BMPs, load reductions, and progress toward meeting water quality standards. The TCEQ will document the results of these evaluations and the rationale for maintaining or revising elements of the I-Plan.
The TCEQ and stakeholders will track the progress of the I-Plan using both imple-mentation milestones and water quality indicators. These terms are defined as:
Water Quality Indicator – A measure of water quality conditions for compari-son to pre-existing conditions, constituent loadings, and water quality standards.
Implementation Milestones – A measure of administrative actions undertaken to effect an improvement in water quality.
Water Quality Indicators Water quality monitoring staff of the NRA and TCEQ will monitor the status of water quality during implementation. Additional funding will be sought to conduct supplemental monitoring in the watersheds at various locations. The NRA cur-rently monitors the tidal segments of the Mission and Aransas Rivers on a quarterly basis under the Texas CRP.
The following paragraphs describe the routine water-quality monitoring activities for each of the AUs in the Mission River and Aransas River watersheds. The pur-pose of this monitoring is to ensure that adequate Enterococcus data is collected in each of the impaired AUs to determine water quality standards attainment.
Mission River Tidal (AU 2001_01): Station 12943, near south bank, immedi-ately downstream of the FM 2678 bridge between Refugio and Bayside. This site is currently being monitored quarterly by NRA and is both a current and historic wa-ter quality site with Enterococcus data dating back to 1999.
Aransas River Tidal (AU 2003_01): Station 12947, at the boat ramp on the FM 629 Terminus, south of Bonnie View, has been monitored for Enterococcus since 2004, and is still being monitored on a quarterly basis. Station 12948, imme-diately upstream of the US 77 bridge between Woodsboro and Sinton, is a site that is no longer monitored but contains data ranging from 1999 – 2011. This site may be monitored again if funding can be secured.
Implementation Plan for Two TMDLs for Indicator Bacteria in the Mission and Aransas Rivers
Mission and Aransas Rivers TMDL Stakeholders 94 Approved May 25, 2016
The indicators that will be used to measure improvement in water quality are im-provements in bacteria levels at the stations mentioned above.
Implementation Milestones Implementation tracking provides information that can be used to determine if progress is being made toward meeting the goals of the TMDL. Tracking also al-lows stakeholders to evaluate actions taken, identify those actions that may not be working, and make any changes that may be necessary to get the plan back on tar-get. Schedules of implementation activities and milestones for this I-Plan are included in Appendix A.
Communication Strategy The TCEQ will host annual meetings for up to five years so stakeholders may eval-uate their progress. Stakeholders and responsible parties will continue to take part in annual meetings over the five-year period to evaluate implementation efforts. At the completion of the scheduled I-Plan activities, stakeholders will assemble and evaluate the actions, overall impacts, and results of their implementation ef-forts.
Implementation Plan for Two TMDLs for Indicator Bacteria in the Mission and Aransas Rivers
Mission and Aransas Rivers TMDL Stakeholders 95 Approved May 25, 2016
References Borel, K., & Karthikeyan, R. 2013. Support for the Aransas River and Mission River Wa-
tersheds Bacteria Assessment Using the Spatially Explicit Load Enrichment Calculation Tool. Texas A&M University, Biological and Agricultural Engineering.
Burns, R. (2011). Like the critters themselves, myths abound about feral hogs. AgriLife Today, Texas A&M.
Cleland, B. (2013). TMDL Development from the “Bottom Up - Part III: Duration Curves and Wet-Weather Assessments. Retrieved 5/23/2013, from <engineering.pur-due.edu/~ldc/JG/duration/PDF/TMDL_Development_from_the_Bottom_UP_PartIII.pdf>.
Center for Watershed Protection. 2007. National Pollutant Removal Performance Data-base (version 3). <www.stormwaterok.net/CWP%20Documents/CWP-07%20Natl%20Pollutant%20Removal%20Perform%20Database.pdf>
Herrera. April 2011. Best Available Science for Stormwater Management Alternatives. <www.co.san-juan.wa.us/cdp/docs/CAO_BASsynthesis/FINAL_Stormwater.pdf>
Horsley and Witten, Inc. (1996). Identification and Evaluation of Nutrient and Bacterial Loadings to Maquoit Bay, New Brunswick and Freeport, Maine. Final Report.
Metcalf and Eddy Inc. 1991. Wastewater Engineering: Disposal, and Reuse. 3rd ed. New York: McGraw-Hill, Co.
Painter, S., L. Hauck and D. Pendergrass (2013). Allocation Support Document for Total Maximum Daily Loads for Indicator Bacteria in the Watersheds of the Mission and Aransas Rivers. Tarleton State University, Stephenville, Texas, Texas Institute for Applied Environmental Research.
Porteous, N., Luo, J., Hererra, M., Schoolfield, J., & Sun, Y. (2011). Growth and identifi-cation of bacteria in N-halamine dental unit waterline tubing using an ultrapure water source. International Journal of Microbiology, 2011.
Texas A&M AgriLife. (2013). V.G. Young Institute of County Government. Retrieved 8/16/2013, from <http://vgyi.tamu.edu/>.
Texas Agriculture Code (2007). Nonpoint Source Pollution. §201.026, State of Texas.
TPWD. (2004) A guide for wildlife management associations and co-ops. Retrieved 5/20/14 from <www.tpwd.state.tx.us/publications/pwdpubs/media/ pwd_bk_w7000_0336.pdf>.
TWDB. (2013). Draft Population and Municipal Water Demand Projections. 2016 Re-gional and 2017 State Water Plan Projections Data, from <www.twdb.state.tx.us/waterplanning/data/projections/2017/demandproj.asp>.
Wagner, K., and Moench, E. (2009). Education Program for Improved Water Quality in Copano Bay: Task Two Report. Retrieved 8/21/14, from <http://twri.tamu.edu/reports/2009/tr347.pdf>.
Wagner, K., L. Redmon, T. Gentry, R.D. Harmel. 2012. Assessment of cattle grazing ef-fects on E. coli runoff. Transactions of the ASABE 55(6):2111-2122.
Implementation Plan for Two TMDLs for Indicator Bacteria in the Mission and Aransas Rivers
Mission and Aransas Rivers TMDL Stakeholders 96 Approved May 25, 2016
Appendix A. I-Plan Matrix and Schedule
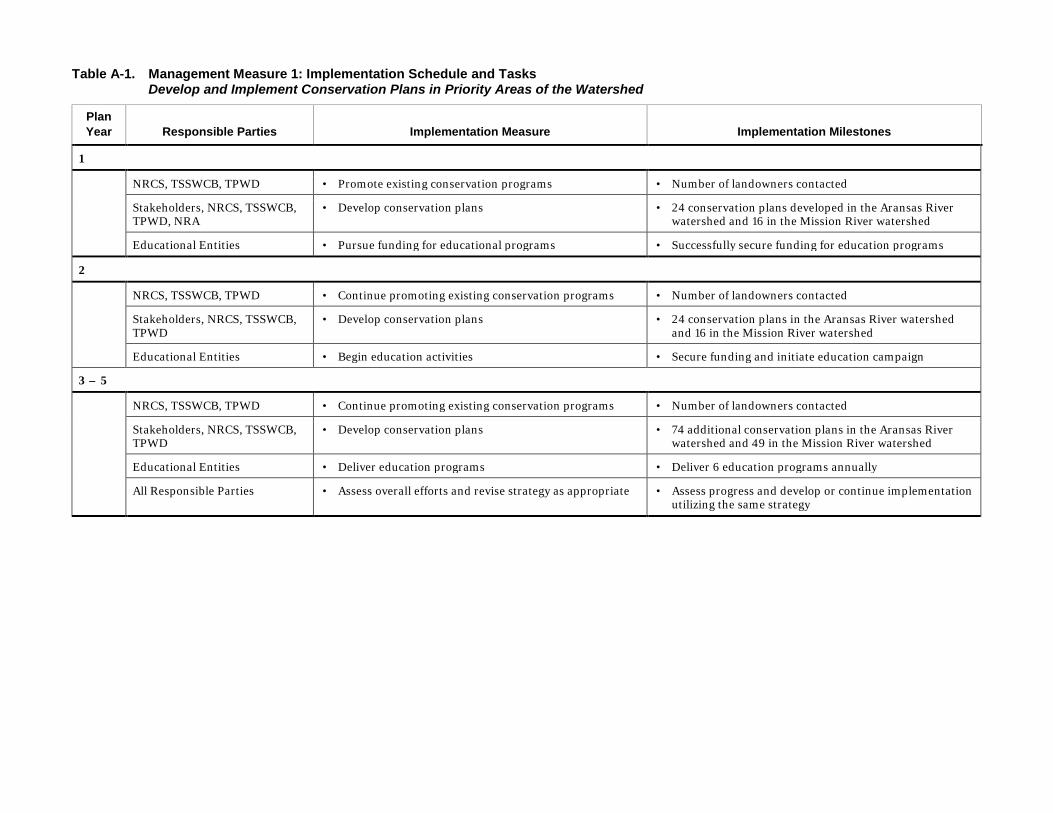
Table A-1. Management Measure 1: Implementation Schedule and Tasks Develop and Implement Conservation Plans in Priority Areas of the Watershed
Plan Year Responsible Parties Implementation Measure Implementation Milestones
1
NRCS, TSSWCB, TPWD • Promote existing conservation programs • Number of landowners contacted
Stakeholders, NRCS, TSSWCB, TPWD, NRA
• Develop conservation plans • 24 conservation plans developed in the Aransas River watershed and 16 in the Mission River watershed
Educational Entities • Pursue funding for educational programs • Successfully secure funding for education programs
2
NRCS, TSSWCB, TPWD • Continue promoting existing conservation programs • Number of landowners contacted
Stakeholders, NRCS, TSSWCB, TPWD
• Develop conservation plans • 24 conservation plans in the Aransas River watershed and 16 in the Mission River watershed
Educational Entities • Begin education activities • Secure funding and initiate education campaign
3 – 5
NRCS, TSSWCB, TPWD • Continue promoting existing conservation programs • Number of landowners contacted
Stakeholders, NRCS, TSSWCB, TPWD
• Develop conservation plans • 74 additional conservation plans in the Aransas River watershed and 49 in the Mission River watershed
Educational Entities • Deliver education programs • Deliver 6 education programs annually
All Responsible Parties • Assess overall efforts and revise strategy as appropriate • Assess progress and develop or continue implementation utilizing the same strategy
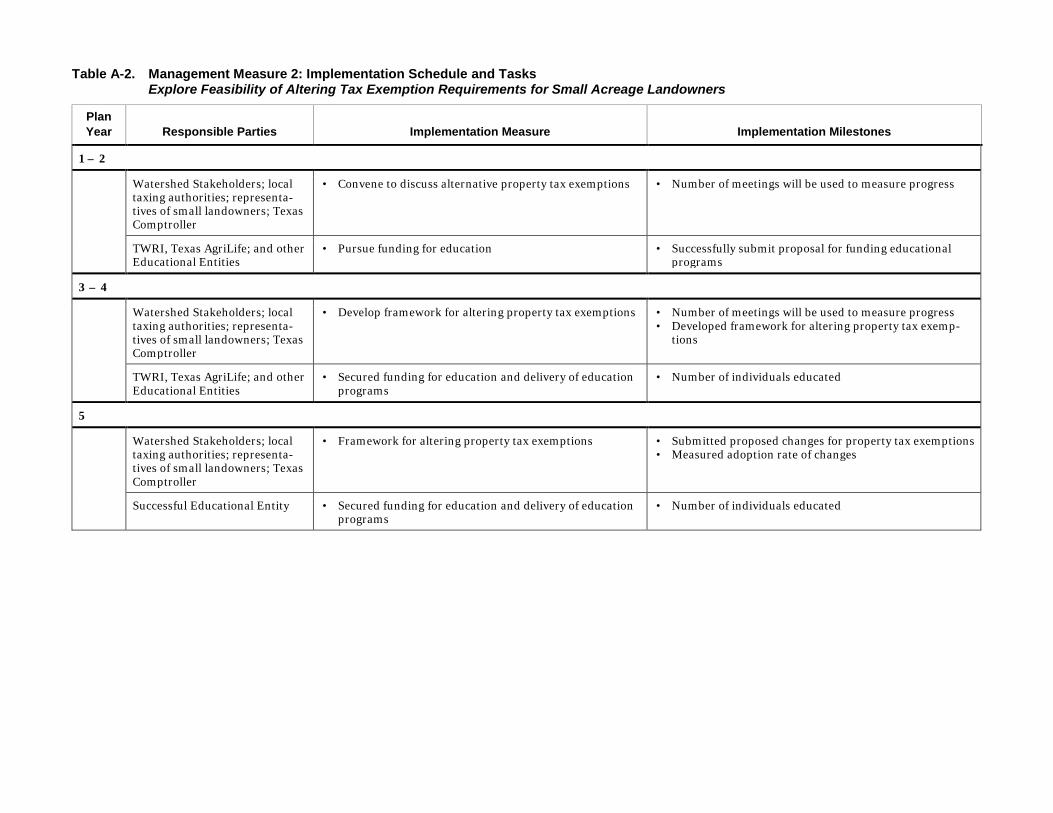
Table A-2. Management Measure 2: Implementation Schedule and Tasks Explore Feasibility of Altering Tax Exemption Requirements for Small Acreage Landowners
Plan Year Responsible Parties Implementation Measure Implementation Milestones
1 – 2
Watershed Stakeholders; local taxing authorities; representa-tives of small landowners; Texas Comptroller
• Convene to discuss alternative property tax exemptions • Number of meetings will be used to measure progress
TWRI, Texas AgriLife; and other Educational Entities
• Pursue funding for education • Successfully submit proposal for funding educational programs
3 – 4
Watershed Stakeholders; local taxing authorities; representa-tives of small landowners; Texas Comptroller
• Develop framework for altering property tax exemptions • Number of meetings will be used to measure progress • Developed framework for altering property tax exemp-
tions
TWRI, Texas AgriLife; and other Educational Entities
• Secured funding for education and delivery of education programs
• Number of individuals educated
5
Watershed Stakeholders; local taxing authorities; representa-tives of small landowners; Texas Comptroller
• Framework for altering property tax exemptions • Submitted proposed changes for property tax exemptions • Measured adoption rate of changes
Successful Educational Entity • Secured funding for education and delivery of education programs
• Number of individuals educated
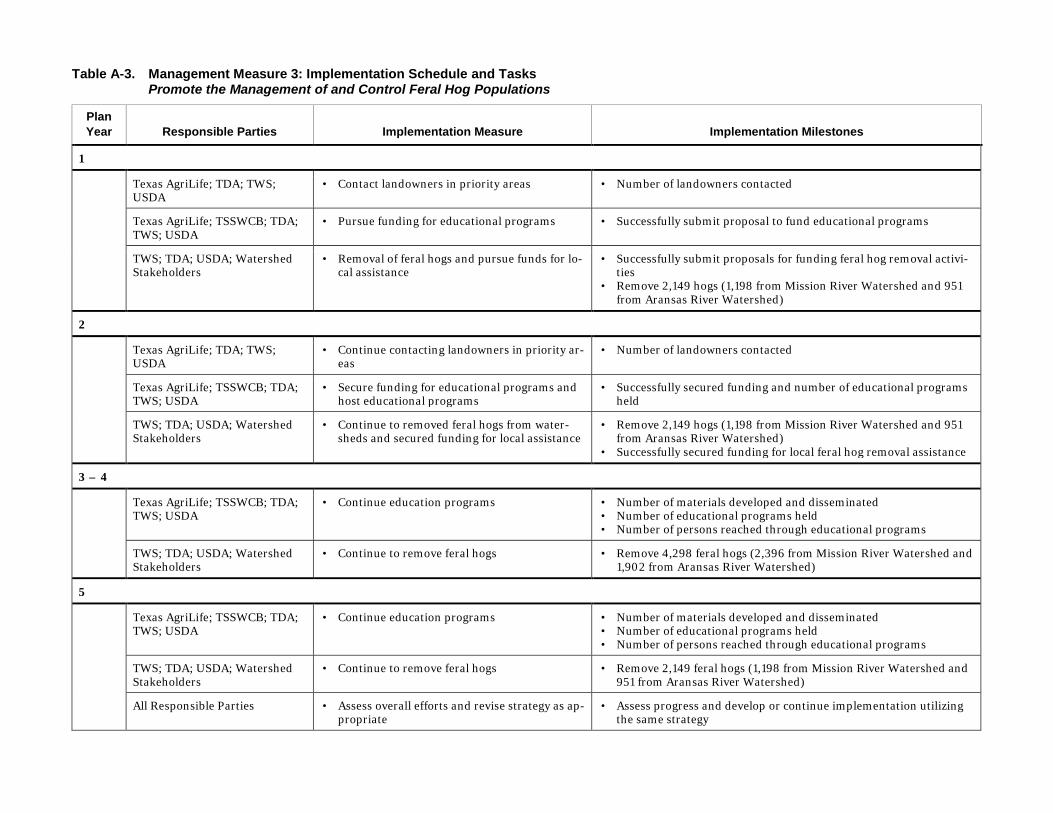
Table A-3. Management Measure 3: Implementation Schedule and Tasks Promote the Management of and Control Feral Hog Populations
Plan Year Responsible Parties Implementation Measure Implementation Milestones
1
Texas AgriLife; TDA; TWS; USDA
• Contact landowners in priority areas • Number of landowners contacted
Texas AgriLife; TSSWCB; TDA; TWS; USDA
• Pursue funding for educational programs • Successfully submit proposal to fund educational programs
TWS; TDA; USDA; Watershed Stakeholders
• Removal of feral hogs and pursue funds for lo-cal assistance
• Successfully submit proposals for funding feral hog removal activi-ties
• Remove 2,149 hogs (1,198 from Mission River Watershed and 951 from Aransas River Watershed)
2
Texas AgriLife; TDA; TWS; USDA
• Continue contacting landowners in priority ar-eas
• Number of landowners contacted
Texas AgriLife; TSSWCB; TDA; TWS; USDA
• Secure funding for educational programs and host educational programs
• Successfully secured funding and number of educational programs held
TWS; TDA; USDA; Watershed Stakeholders
• Continue to removed feral hogs from water-sheds and secured funding for local assistance
• Remove 2,149 hogs (1,198 from Mission River Watershed and 951 from Aransas River Watershed)
• Successfully secured funding for local feral hog removal assistance
3 – 4
Texas AgriLife; TSSWCB; TDA; TWS; USDA
• Continue education programs • Number of materials developed and disseminated • Number of educational programs held • Number of persons reached through educational programs
TWS; TDA; USDA; Watershed Stakeholders
• Continue to remove feral hogs • Remove 4,298 feral hogs (2,396 from Mission River Watershed and 1,902 from Aransas River Watershed)
5
Texas AgriLife; TSSWCB; TDA; TWS; USDA
• Continue education programs • Number of materials developed and disseminated • Number of educational programs held • Number of persons reached through educational programs
TWS; TDA; USDA; Watershed Stakeholders
• Continue to remove feral hogs • Remove 2,149 feral hogs (1,198 from Mission River Watershed and 951 from Aransas River Watershed)
All Responsible Parties • Assess overall efforts and revise strategy as ap-propriate
• Assess progress and develop or continue implementation utilizing the same strategy
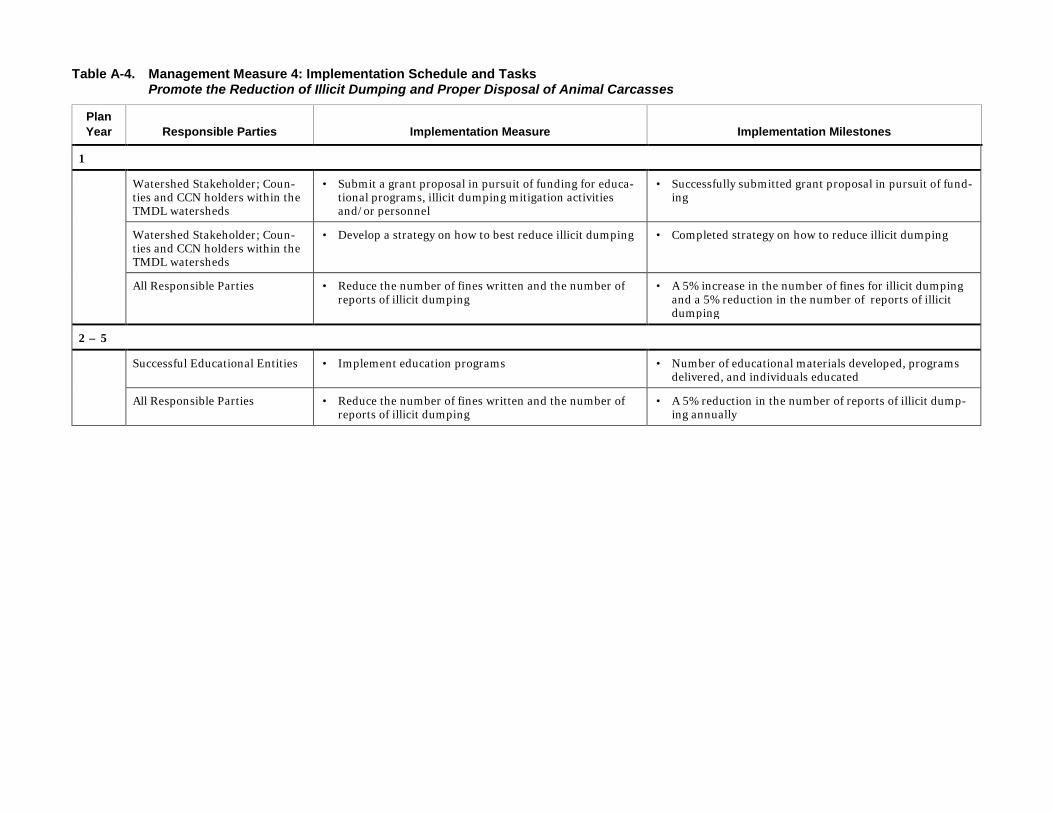
Table A-4. Management Measure 4: Implementation Schedule and Tasks Promote the Reduction of Illicit Dumping and Proper Disposal of Animal Carcasses
Plan Year Responsible Parties Implementation Measure Implementation Milestones
1
Watershed Stakeholder; Coun-ties and CCN holders within the TMDL watersheds
• Submit a grant proposal in pursuit of funding for educa-tional programs, illicit dumping mitigation activities and/or personnel
• Successfully submitted grant proposal in pursuit of fund-ing
Watershed Stakeholder; Coun-ties and CCN holders within the TMDL watersheds
• Develop a strategy on how to best reduce illicit dumping • Completed strategy on how to reduce illicit dumping
All Responsible Parties • Reduce the number of fines written and the number of reports of illicit dumping
• A 5% increase in the number of fines for illicit dumping and a 5% reduction in the number of reports of illicit dumping
2 – 5
Successful Educational Entities • Implement education programs • Number of educational materials developed, programs delivered, and individuals educated
All Responsible Parties • Reduce the number of fines written and the number of reports of illicit dumping
• A 5% reduction in the number of reports of illicit dump-ing annually
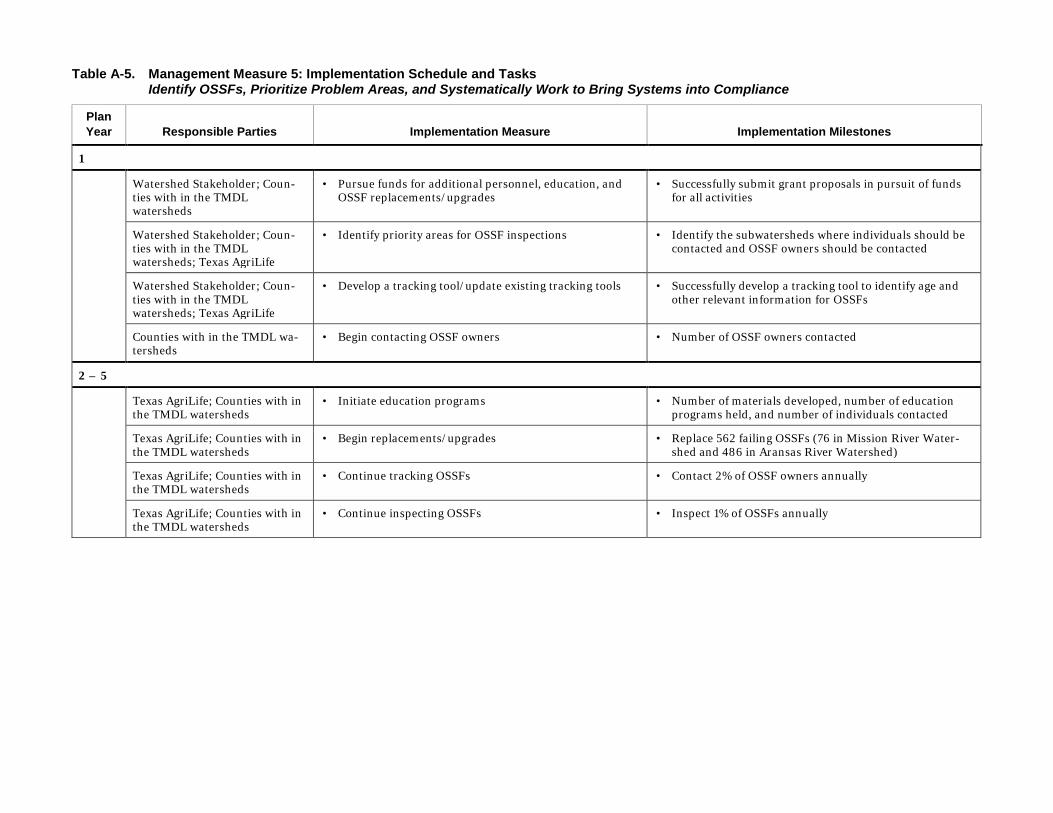
Table A-5. Management Measure 5: Implementation Schedule and Tasks Identify OSSFs, Prioritize Problem Areas, and Systematically Work to Bring Systems into Compliance
Plan Year Responsible Parties Implementation Measure Implementation Milestones
1
Watershed Stakeholder; Coun-ties with in the TMDL watersheds
• Pursue funds for additional personnel, education, and OSSF replacements/upgrades
• Successfully submit grant proposals in pursuit of funds for all activities
Watershed Stakeholder; Coun-ties with in the TMDL watersheds; Texas AgriLife
• Identify priority areas for OSSF inspections • Identify the subwatersheds where individuals should be contacted and OSSF owners should be contacted
Watershed Stakeholder; Coun-ties with in the TMDL watersheds; Texas AgriLife
• Develop a tracking tool/update existing tracking tools • Successfully develop a tracking tool to identify age and other relevant information for OSSFs
Counties with in the TMDL wa-tersheds
• Begin contacting OSSF owners • Number of OSSF owners contacted
2 – 5
Texas AgriLife; Counties with in the TMDL watersheds
• Initiate education programs • Number of materials developed, number of education programs held, and number of individuals contacted
Texas AgriLife; Counties with in the TMDL watersheds
• Begin replacements/upgrades • Replace 562 failing OSSFs (76 in Mission River Water-shed and 486 in Aransas River Watershed)
Texas AgriLife; Counties with in the TMDL watersheds
• Continue tracking OSSFs • Contact 2% of OSSF owners annually
Texas AgriLife; Counties with in the TMDL watersheds
• Continue inspecting OSSFs • Inspect 1% of OSSFs annually
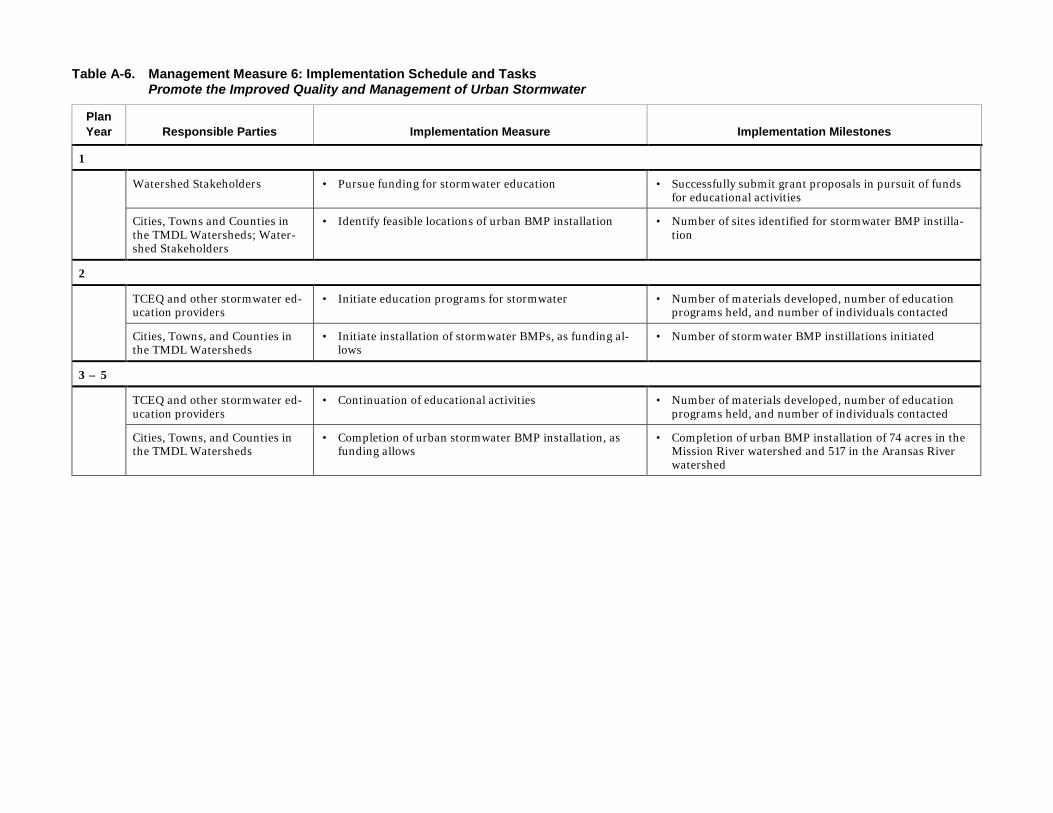
Table A-6. Management Measure 6: Implementation Schedule and Tasks Promote the Improved Quality and Management of Urban Stormwater
Plan Year Responsible Parties Implementation Measure Implementation Milestones
1
Watershed Stakeholders • Pursue funding for stormwater education • Successfully submit grant proposals in pursuit of funds for educational activities
Cities, Towns and Counties in the TMDL Watersheds; Water-shed Stakeholders
• Identify feasible locations of urban BMP installation • Number of sites identified for stormwater BMP instilla-tion
2
TCEQ and other stormwater ed-ucation providers
• Initiate education programs for stormwater • Number of materials developed, number of education programs held, and number of individuals contacted
Cities, Towns, and Counties in the TMDL Watersheds
• Initiate installation of stormwater BMPs, as funding al-lows
• Number of stormwater BMP instillations initiated
3 – 5
TCEQ and other stormwater ed-ucation providers
• Continuation of educational activities • Number of materials developed, number of education programs held, and number of individuals contacted
Cities, Towns, and Counties in the TMDL Watersheds
• Completion of urban stormwater BMP installation, as funding allows
• Completion of urban BMP installation of 74 acres in the Mission River watershed and 517 in the Aransas River watershed
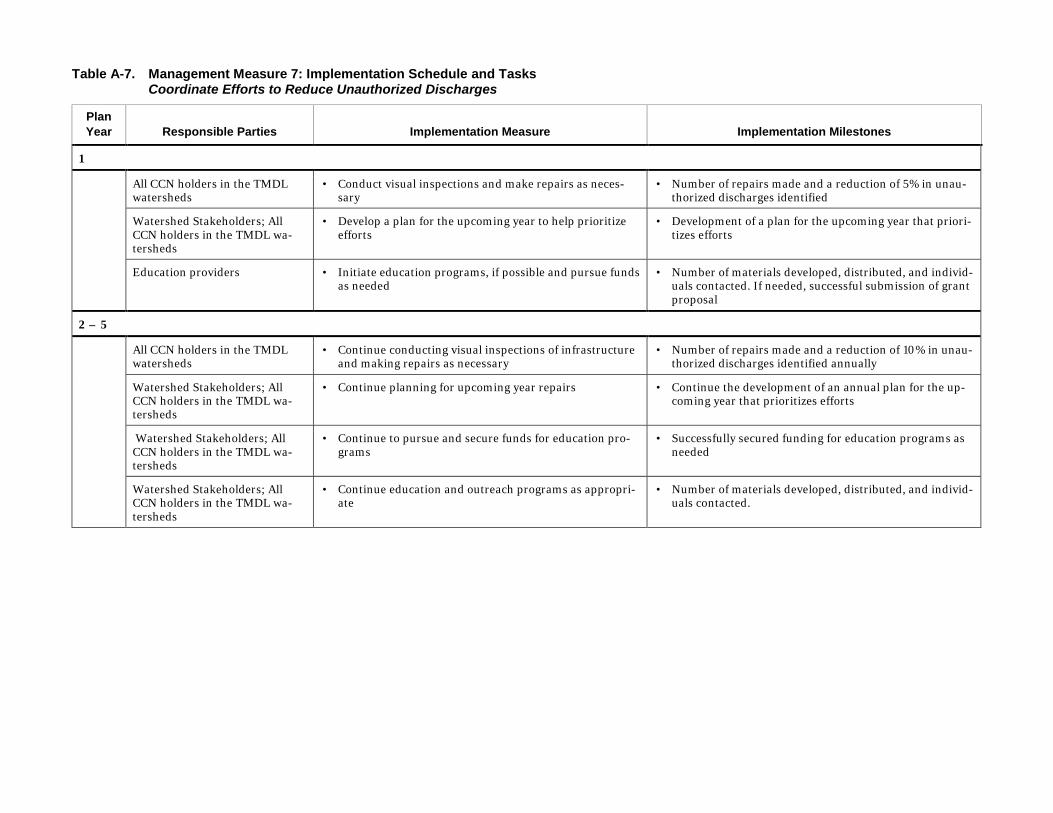
Table A-7. Management Measure 7: Implementation Schedule and Tasks Coordinate Efforts to Reduce Unauthorized Discharges
Plan Year Responsible Parties Implementation Measure Implementation Milestones
1
All CCN holders in the TMDL watersheds
• Conduct visual inspections and make repairs as neces-sary
• Number of repairs made and a reduction of 5% in unau-thorized discharges identified
Watershed Stakeholders; All CCN holders in the TMDL wa-tersheds
• Develop a plan for the upcoming year to help prioritize efforts
• Development of a plan for the upcoming year that priori-tizes efforts
Education providers • Initiate education programs, if possible and pursue funds as needed
• Number of materials developed, distributed, and individ-uals contacted. If needed, successful submission of grant proposal
2 – 5
All CCN holders in the TMDL watersheds
• Continue conducting visual inspections of infrastructure and making repairs as necessary
• Number of repairs made and a reduction of 10% in unau-thorized discharges identified annually
Watershed Stakeholders; All CCN holders in the TMDL wa-tersheds
• Continue planning for upcoming year repairs • Continue the development of an annual plan for the up-coming year that prioritizes efforts
Watershed Stakeholders; All CCN holders in the TMDL wa-tersheds
• Continue to pursue and secure funds for education pro-grams
• Successfully secured funding for education programs as needed
Watershed Stakeholders; All CCN holders in the TMDL wa-tersheds
• Continue education and outreach programs as appropri-ate
• Number of materials developed, distributed, and individ-uals contacted.
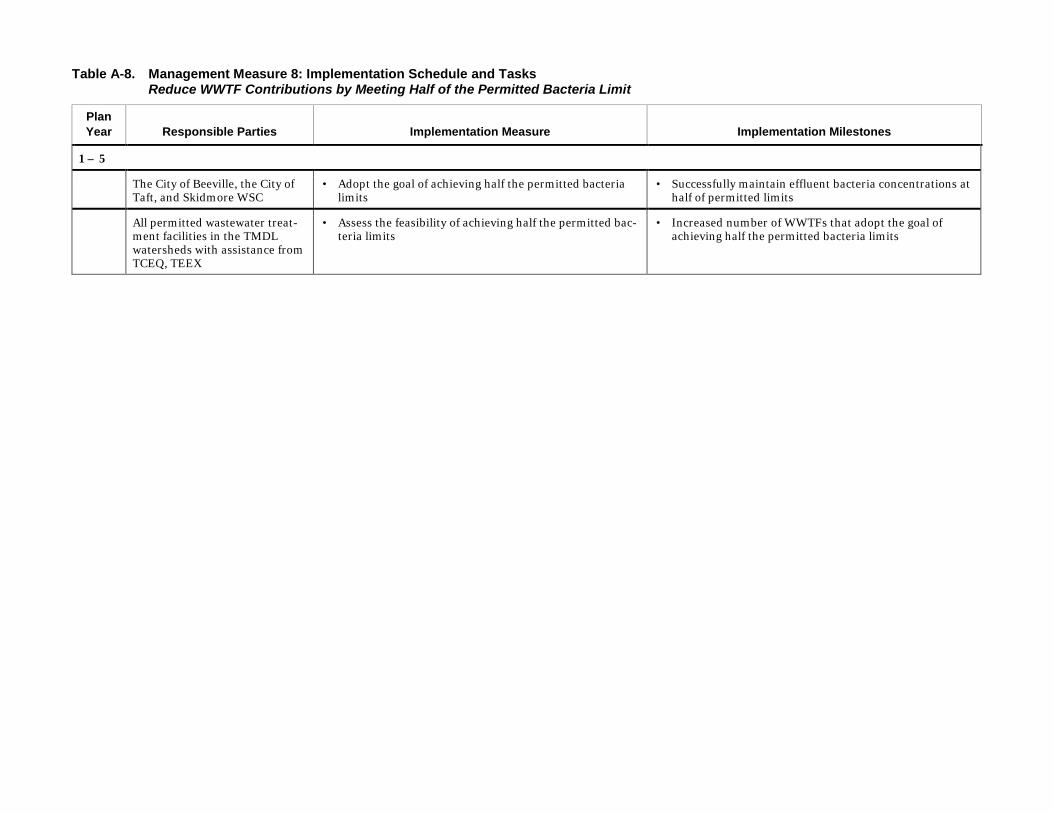
Table A-8. Management Measure 8: Implementation Schedule and Tasks Reduce WWTF Contributions by Meeting Half of the Permitted Bacteria Limit
Plan Year Responsible Parties Implementation Measure Implementation Milestones
1 – 5
The City of Beeville, the City of Taft, and Skidmore WSC
• Adopt the goal of achieving half the permitted bacteria limits
• Successfully maintain effluent bacteria concentrations at half of permitted limits
All permitted wastewater treat-ment facilities in the TMDL watersheds with assistance from TCEQ, TEEX
• Assess the feasibility of achieving half the permitted bac-teria limits
• Increased number of WWTFs that adopt the goal of achieving half the permitted bacteria limits
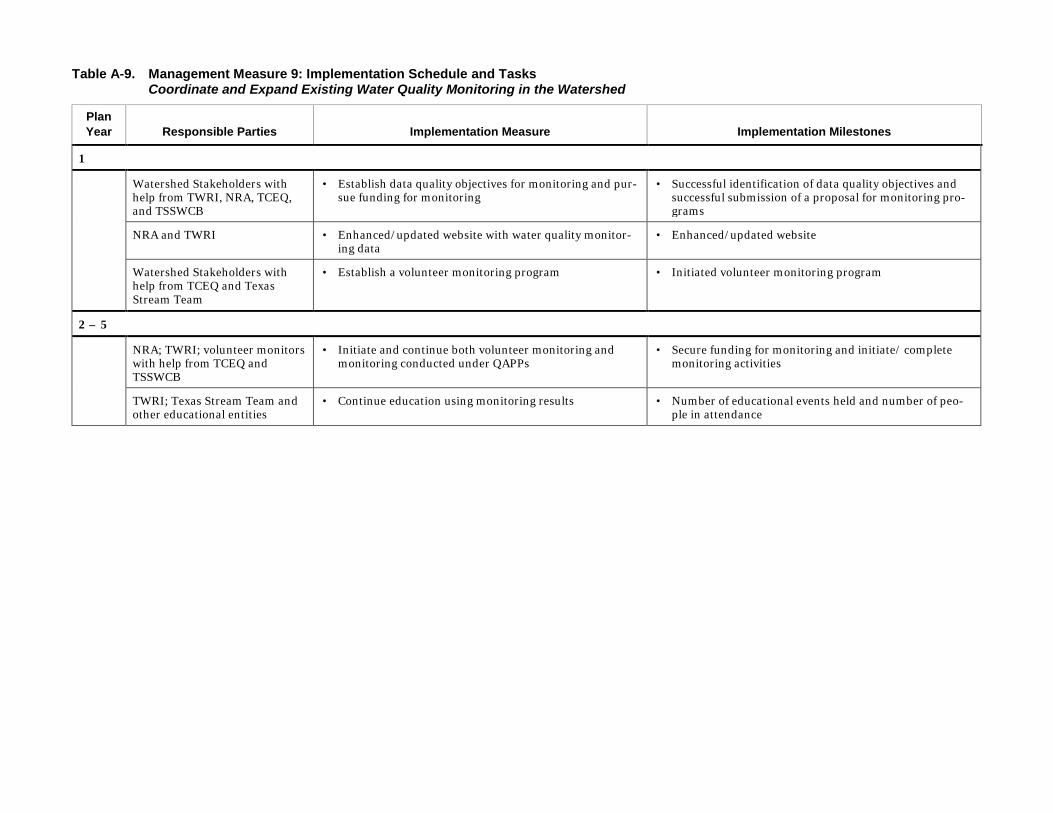
Table A-9. Management Measure 9: Implementation Schedule and Tasks Coordinate and Expand Existing Water Quality Monitoring in the Watershed
Plan Year Responsible Parties Implementation Measure Implementation Milestones
1
Watershed Stakeholders with help from TWRI, NRA, TCEQ, and TSSWCB
• Establish data quality objectives for monitoring and pur-sue funding for monitoring
• Successful identification of data quality objectives and successful submission of a proposal for monitoring pro-grams
NRA and TWRI • Enhanced/updated website with water quality monitor-ing data
• Enhanced/updated website
Watershed Stakeholders with help from TCEQ and Texas Stream Team
• Establish a volunteer monitoring program • Initiated volunteer monitoring program
2 – 5
NRA; TWRI; volunteer monitors with help from TCEQ and TSSWCB
• Initiate and continue both volunteer monitoring and monitoring conducted under QAPPs
• Secure funding for monitoring and initiate/ complete monitoring activities
TWRI; Texas Stream Team and other educational entities
• Continue education using monitoring results • Number of educational events held and number of peo-ple in attendance
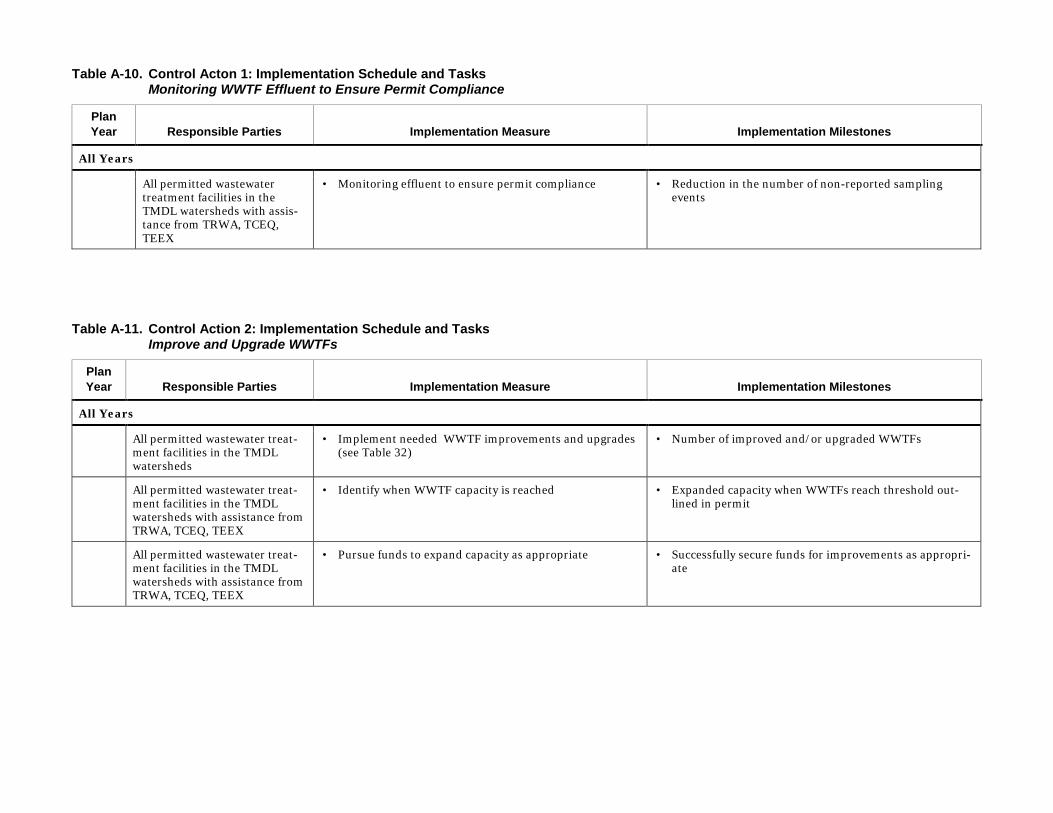
Table A-10. Control Acton 1: Implementation Schedule and Tasks Monitoring WWTF Effluent to Ensure Permit Compliance
Plan Year Responsible Parties Implementation Measure Implementation Milestones
All Years
All permitted wastewater treatment facilities in the TMDL watersheds with assis-tance from TRWA, TCEQ, TEEX
• Monitoring effluent to ensure permit compliance • Reduction in the number of non-reported sampling events
Table A-11. Control Action 2: Implementation Schedule and Tasks Improve and Upgrade WWTFs
Plan Year Responsible Parties Implementation Measure Implementation Milestones
All Years
All permitted wastewater treat-ment facilities in the TMDL watersheds
• Implement needed WWTF improvements and upgrades (see Table 32)
• Number of improved and/or upgraded WWTFs
All permitted wastewater treat-ment facilities in the TMDL watersheds with assistance from TRWA, TCEQ, TEEX
• Identify when WWTF capacity is reached • Expanded capacity when WWTFs reach threshold out-lined in permit
All permitted wastewater treat-ment facilities in the TMDL watersheds with assistance from TRWA, TCEQ, TEEX
• Pursue funds to expand capacity as appropriate • Successfully secure funds for improvements as appropri-ate
Implementation Plan for Two TMDLs for Indicator Bacteria in the Mission and Aransas Rivers
Mission and Aransas Rivers TMDL Stakeholders 107 Approved May 25, 2016
Appendix B. Load Reduction Estimates
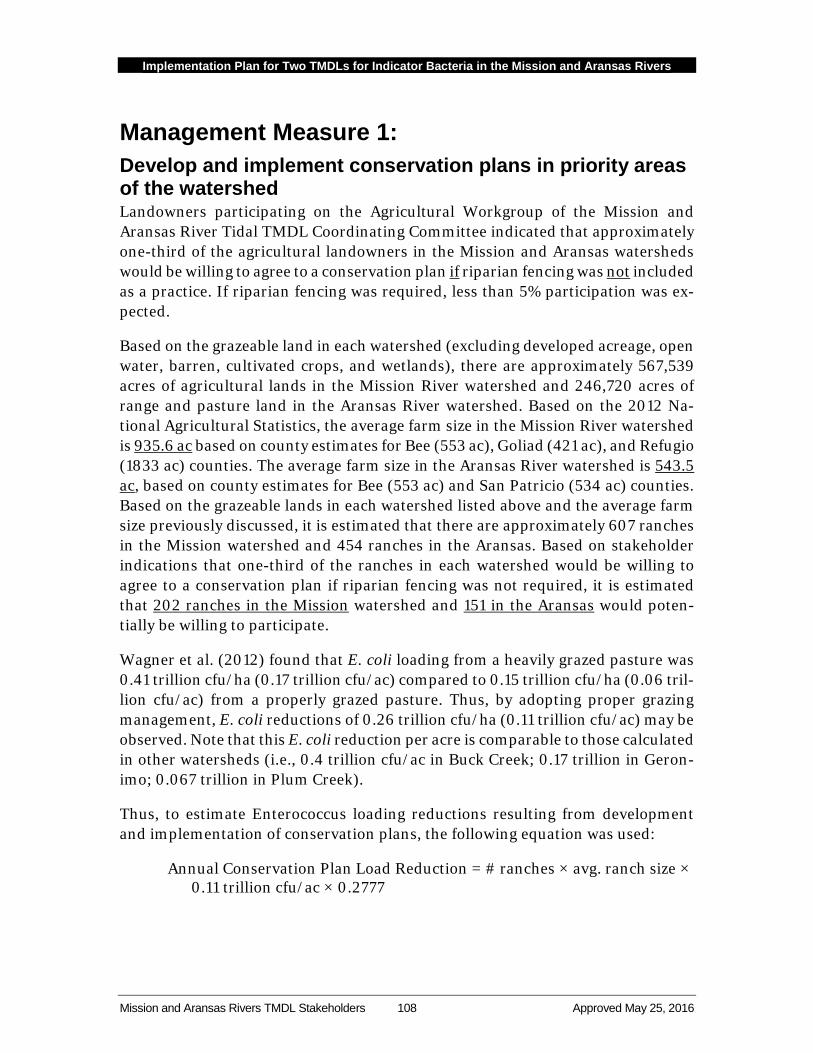
Implementation Plan for Two TMDLs for Indicator Bacteria in the Mission and Aransas Rivers
Mission and Aransas Rivers TMDL Stakeholders 108 Approved May 25, 2016
Management Measure 1: Develop and implement conservation plans in priority areas of the watershed Landowners participating on the Agricultural Workgroup of the Mission and Aransas River Tidal TMDL Coordinating Committee indicated that approximately one-third of the agricultural landowners in the Mission and Aransas watersheds would be willing to agree to a conservation plan if riparian fencing was not included as a practice. If riparian fencing was required, less than 5% participation was ex-pected.
Based on the grazeable land in each watershed (excluding developed acreage, open water, barren, cultivated crops, and wetlands), there are approximately 567,539 acres of agricultural lands in the Mission River watershed and 246,720 acres of range and pasture land in the Aransas River watershed. Based on the 2012 Na-tional Agricultural Statistics, the average farm size in the Mission River watershed is 935.6 ac based on county estimates for Bee (553 ac), Goliad (421 ac), and Refugio (1833 ac) counties. The average farm size in the Aransas River watershed is 543.5 ac, based on county estimates for Bee (553 ac) and San Patricio (534 ac) counties. Based on the grazeable lands in each watershed listed above and the average farm size previously discussed, it is estimated that there are approximately 607 ranches in the Mission watershed and 454 ranches in the Aransas. Based on stakeholder indications that one-third of the ranches in each watershed would be willing to agree to a conservation plan if riparian fencing was not required, it is estimated that 202 ranches in the Mission watershed and 151 in the Aransas would poten-tially be willing to participate.
Wagner et al. (2012) found that E. coli loading from a heavily grazed pasture was 0.41 trillion cfu/ha (0.17 trillion cfu/ac) compared to 0.15 trillion cfu/ha (0.06 tril-lion cfu/ac) from a properly grazed pasture. Thus, by adopting proper grazing management, E. coli reductions of 0.26 trillion cfu/ha (0.11 trillion cfu/ac) may be observed. Note that this E. coli reduction per acre is comparable to those calculated in other watersheds (i.e., 0.4 trillion cfu/ac in Buck Creek; 0.17 trillion in Geron-imo; 0.067 trillion in Plum Creek).
Thus, to estimate Enterococcus loading reductions resulting from development and implementation of conservation plans, the following equation was used:
Annual Conservation Plan Load Reduction = # ranches × avg. ranch size × 0.11 trillion cfu/ac × 0.2777
Implementation Plan for Two TMDLs for Indicator Bacteria in the Mission and Aransas Rivers
Mission and Aransas Rivers TMDL Stakeholders 109 Approved May 25, 2016
Where:
# ranches = number of participating ranches (202 in Mission and 151 in Aransas)
Ranch size = average farm size (935.6 ac/ranch in Mission and 543.5 in Aransas)
0.11 trillion cfu/ac = E. coli reductions from adopting proper grazing man-agement (Wagner et al. 2012)
0.2777 = conversion factor to convert between E. coli and Enterococcus (35/126)
Potential Annual Ag NPS Load Reduction – Aransas Watershed:
= 151 × 543.5 × 0.11 trillion × 0.2777 = 2,393.66 trillion cfu Enterococcus
Potential Annual Ag NPS Load Reduction – Mission Watershed:
= 202 × 935.6 × 0.11 trillion × 0.2777 = 5,512.24 trillion cfu Enterococcus
Total Potential Annual Ag NPS Load Reduction – Mission and Aransas Wa-tersheds:
7,905.91 trillion cfu Enterococcus
To achieve the goals of the TMDL, this level of implementation is not expected to be required. Implementation of an estimated 122 conservation plans in the Aransas watershed and 81 in the Mission is projected to provide the needed reduc-tions to meet the TMDL. Based on this level of implementation, the following loading reductions are estimated.
Potential Annual Ag NPS Load Reduction – Aransas Watershed:
= 122 × 543.5 × 0.11 trillion × 0.2777 = 1,933.95 trillion cfu Enterococcus
Potential Annual Ag NPS Load Reduction – Mission Watershed:
= 81 × 935.6 × 0.11 trillion × 0.2777 = 2,201.36 trillion cfu Enterococcus
Total Potential Annual Ag NPS Load Reduction – Mission and Aransas Wa-tersheds:
4,144.31 trillion cfu Enterococcus
In the Aransas watershed, subbasins 4, 8, 10-13, 15, and 17-20 are of highest pri-ority for conservation plan development due to their proximity to the impaired segment and also on the estimated loadings from livestock in these subbasins
Implementation Plan for Two TMDLs for Indicator Bacteria in the Mission and Aransas Rivers
Mission and Aransas Rivers TMDL Stakeholders 110 Approved May 25, 2016
(Borel and Karthi 2013). Similarly, in the Mission watershed, subbasins 2, 5, 7-9, 14, 17, 19-22, and 24-25 are of highest priority.
These potential load reductions are loadings that would normally be deposited to land surfaces; only some fraction of this load would be expected to reach the re-ceiving water bodies under normal circumstances. Nevertheless, the potential load reductions that could be achieved by implementing conservation plans through the TSSWCB WQMP Program, NRCS EQIP Program, and other conservation pro-grams will depend specifically on the particular BMPs implemented by each individual land owner, the location and characteristics of the land to which suite of BMPs are applied, and the number of livestock in each landowner’s operation. Landowners indicated that the practices most feasible for inclusion in conservation plans for the TMDL watershed area included, but were not limited to, brush man-agement, cross fencing, prescribed burning, and water wells. Other practices considered highly feasible for the area included mechanical treatment (aeration) of grazing land, installation of ponds, prescribed grazing, supplemental feeding lo-cations, supplemental watering facilities, conservation cover, early successional habitat development, restoration and management of declining habitats, wetland wildlife habitat management, and installation of wildlife watering facilities.
Management Measure 3: Promote the Management of Feral Hogs and Control Their Populations The feral hog population is estimated to be 33,573 animals, which is estimated to be equivalent to 4,198 animal units for the Mission and Aransas River watersheds (Borel and Karthikeyan 2013). Animal unit equivalents, which are simply the ani-mal population numbers multiplied by the ratio of the mean animal weights for each animal type to the mean weight of cattle provide a more useful way of com-paring the pollution impact, per capita, of different animal types. Of the 4,198 animal units in the watershed, 1,870 animal units are estimated in the Aransas watershed and 2,328 animal units in the Mission. This population estimate was derived using a density of 33.3 ac/hog and an animal unit conversion of 0.125 ap-plied uniformly across deciduous forest, evergreen forest, mixed forest, shrub/scrub, grassland/herbaceous, pasture/hay, cultivated crops, and woody wetlands (Wagner and Moench, 2009).
Management reduction goals for feral hogs focus on removing animals from each watershed and keeping populations at a static level. The goal established by the Mission and Aransas River Tidal Bacteria TMDL Coordination Committee, based largely on feasibility of implementation, is to remove 32% of the total hog popula-tion from each watershed (i.e., remove 598 animal units from the Aransas and 745 animal units from the Mission). This equates to removal of 4,786 individual hogs from the Aransas River watershed and 5,958 from the Mission River Watershed.
Implementation Plan for Two TMDLs for Indicator Bacteria in the Mission and Aransas Rivers
Mission and Aransas Rivers TMDL Stakeholders 111 Approved May 25, 2016
By removing the hogs from each watershed completely, the potential Enterococcus load from feral hogs will be removed by an equal amount times the average daily cfu fecal coliform production rate per hog. In the Aransas watershed, subbasins 1-4, 6, 7, 9, and 11 are of highest priority due to their proximity to the impaired seg-ment of the Aransas River and the estimated feral hog populations in these subbasins (Borel and Karthikeyan, 2013). Similarly, in the Mission watershed, sub-basins 2, 4, 5, 8, 9, and 14 are of highest priority.
The potential annual Enterococcus load reduction from feral hogs was estimated using:
Annual Feral Hog Load Reduction = # hog animal units removed × 1.21bil-lion × 0.175 × 365
Where:
1.21billion = average daily cfu fecal coliform production rate per hog ani-mal units (Wagner and Moench, 2009)
0.175 = conversion factor to convert between fecal coliform and Enterococ-cus by dividing the current Enterococcus standard of 35 cfu/100 mL by the previously used fecal coliform standard of 200 cfu/100 mL
365 = days per year
Potential Annual Feral Hog Enterococcus Load Reduction – Aransas Water-shed:
=598 feral hog animal units removed × 1.21billion cfu (fecal coliforms) /animal unit-day × 0.175 × 365 days/year = 46.22 trillion cfu
Potential Annual Feral Hog Enterococcus Load Reduction – Mission Water-shed:
= 745 feral hog animal units removed × 1.21billion cfu (fecal coli-forms)/animal unit-day × 0.175 × 365 days/year = 57.58 trillion cfu
Total Potential Annual Feral Hog Enterococcus Reduction – Mission and Aransas watersheds:
103.80 trillion cfu
This annual load reduction estimate represents the total annual reduction in po-tential Enterococcus production in the TMDL watersheds after full implementation of Management Measure 3 is achieved. The estimate assumes fe-ral hog populations will remain at 68% of their current levels after implementation

Implementation Plan for Two TMDLs for Indicator Bacteria in the Mission and Aransas Rivers
Mission and Aransas Rivers TMDL Stakeholders 112 Approved May 25, 2016
is completed. However, the validity of this assumption hinges on a commitment to sustain the efforts associated for this management measure.
Although reproduction rates are implicitly incorporated in the initial estimates of animal densities per unit of land, the calculations presented above do not explicitly take reproduction rates into account.
The yearly enterococcus reductions over the 5-year implementation period will vary, increasing gradually every year until implementation is completed.
Management Measure 5: Identify OSSFs, Prioritize Problem Areas, and Systemati-cally Work to Bring Systems into Compliance According to Borel and Karthikeyan (2013), the total number of households with OSSFs in the Mission and Aransas watersheds was 10,047. Using an OSSF failure rate determined by applying the soil drainfield limitation classes as follows: very limited 15%, somewhat limited 10%, not limited 5%, and not rated 15%, it was es-timated that 1,408 of these systems are potentially failing. Of these, 562 OSSFs are located in high priority subbasins (Subbasins 1-3, 5-7, and 10-11 of the lower Aransas River watershed and Subbasins 2-3 of the lower Mission River watershed) as identified by Borel and Karthikeyan (2013). A further breakdown of these po-tentially failing OSSFs reveals that 76 OSSFs are located in the Mission River watershed and 486 in the Aransas River watershed. These high priority subwater-sheds of the lower Mission and Aransas Rivers are predominately in San Patricio and Refugio Counties where the impaired segments are located.
Potential loading from these failing OSSFs was estimated using the methodology presented in EPA (2001) and used in many other watersheds in Texas as well as watershed-specific population estimates and other assumptions.
Assumptions:
562 failing OSSFs in the critical area of the watersheds may be replaced 1 million cfu/100 mL fecal coliform concentration in OSSF effluent as re-
ported by Metcalf & Eddy 1991. 0.175 is the conversion factor to convert between fecal coliform and Entero-
coccus by dividing the current Enterococcus standard of 35 cfu/100 mL by the previously used fecal coliform standard of 200 cfu/100 mL
3785.2 mL/gallon = number of milliliters in a gallon 60 gallons per person per day is estimated discharge in OSSFs as reported by
Horsley and Witten (1996) 2.53 persons per household in Refugio County (Mission watershed)
<http://quickfacts.census.gov/qfd/states/48/48391.html> and 2.9 in San
Implementation Plan for Two TMDLs for Indicator Bacteria in the Mission and Aransas Rivers
Mission and Aransas Rivers TMDL Stakeholders 113 Approved May 25, 2016
Patricio County (Aransas watershed) <http://quickfacts.cen-sus.gov/qfd/states/48/48409.html>
Potential Annual OSSF Enterococcus Load Reduction – Mission Watershed:
= 76 failing septic systems * 1 million fecal coliforms/100 mL * 0.175 * 60 gal./person/day * 3785.2 mL/gal. * 2.53 persons/household * 365 days/year = 27.89 trillion cfu
Potential Annual OSSF Enterococcus Load Reduction – Aransas Watershed:
= 486 failing septic systems * 1 million fecal coliforms/100 mL * 0.175 * 60 gal./person/day * 3785.2 mL/gal. * 2.9 persons/household * 365 days/year = 204.46 trillion cfu
Total Potential Annual Enterococcus OSSF Reduction – Mission and Aransas Watersheds:
= 232.35 trillion cfu
Management Measure 6: Promote the Improved Quality and Management of Urban Stormwater According to the Technical Support Document for Two Total Maximum Daily Loads for Indicator Bacteria in Tidal Portions of the Mission and Aransas Rivers (Segments 2001 and 2003), regulated stormwater comprises only a very small por-tion of the areas of the subject watersheds (0.06% for Mission River watershed and 0.04% for Aransas River watershed) and must be considered only a minor contrib-utor.
In both the Mission River and Aransas River watersheds, stakeholders indicated that there is very little stormwater management implemented in the towns and communities within the watershed. This is primarily a factor of the size of these communities. Phase II (small) MS4 permit requirements generally do not apply to these predominantly small, rural communities. Further, these communities lack the funding to implement stormwater management BMPs. However, this is an area of significant opportunity for pollutant load reductions. If funding is available, these communities indicated they would be willing to adopt and implement BMPs to better manage their stormwater. However, the type and number of these BMPs has not been determined at this point.
Land use and land cover information indicates that there are 25,698 acres devel-oped in the Mission River watershed and 32,661 acres developed in the Aransas River watershed. Of these, there are 74 high intensity developed acres in the Mis-sion watershed and 517 acres of this category in the Aransas watershed which could
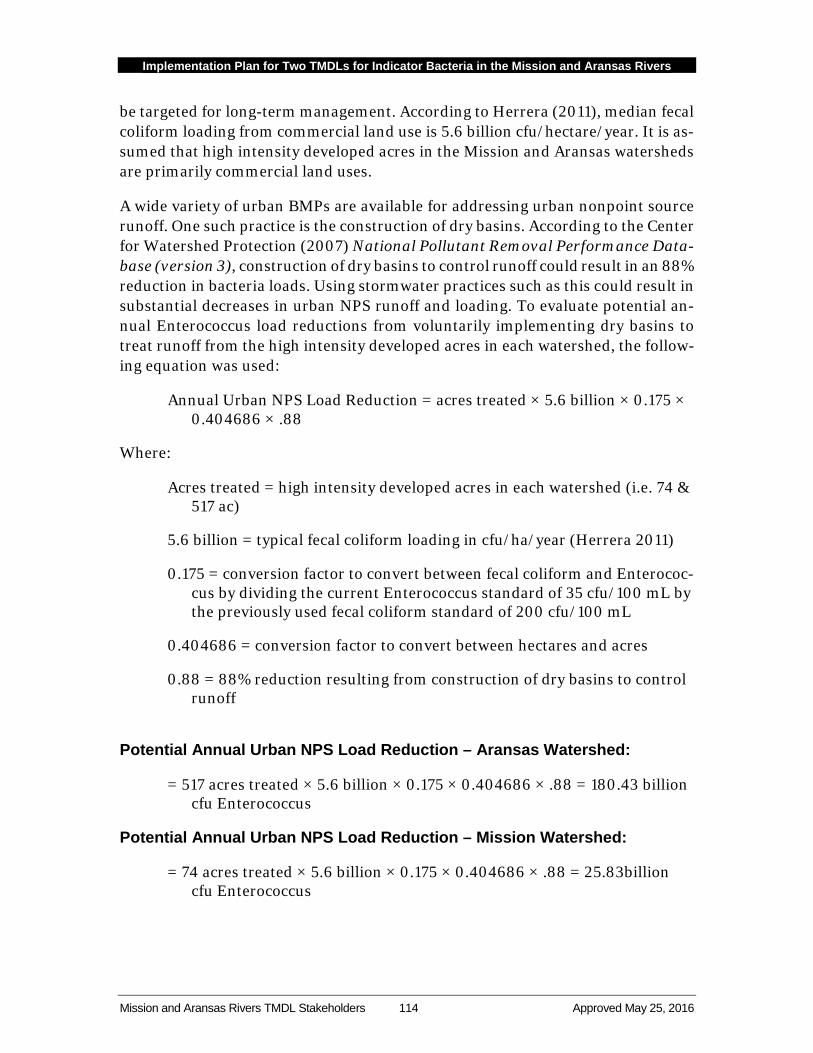
Implementation Plan for Two TMDLs for Indicator Bacteria in the Mission and Aransas Rivers
Mission and Aransas Rivers TMDL Stakeholders 114 Approved May 25, 2016
be targeted for long-term management. According to Herrera (2011), median fecal coliform loading from commercial land use is 5.6 billion cfu/hectare/year. It is as-sumed that high intensity developed acres in the Mission and Aransas watersheds are primarily commercial land uses.
A wide variety of urban BMPs are available for addressing urban nonpoint source runoff. One such practice is the construction of dry basins. According to the Center for Watershed Protection (2007) National Pollutant Removal Performance Data-base (version 3), construction of dry basins to control runoff could result in an 88% reduction in bacteria loads. Using stormwater practices such as this could result in substantial decreases in urban NPS runoff and loading. To evaluate potential an-nual Enterococcus load reductions from voluntarily implementing dry basins to treat runoff from the high intensity developed acres in each watershed, the follow-ing equation was used:
Annual Urban NPS Load Reduction = acres treated × 5.6 billion × 0.175 × 0.404686 × .88
Where:
Acres treated = high intensity developed acres in each watershed (i.e. 74 & 517 ac)
5.6 billion = typical fecal coliform loading in cfu/ha/year (Herrera 2011)
0.175 = conversion factor to convert between fecal coliform and Enterococ-cus by dividing the current Enterococcus standard of 35 cfu/100 mL by the previously used fecal coliform standard of 200 cfu/100 mL
0.404686 = conversion factor to convert between hectares and acres
0.88 = 88% reduction resulting from construction of dry basins to control runoff
Potential Annual Urban NPS Load Reduction – Aransas Watershed:
= 517 acres treated × 5.6 billion × 0.175 × 0.404686 × .88 = 180.43 billion cfu Enterococcus
Potential Annual Urban NPS Load Reduction – Mission Watershed:
= 74 acres treated × 5.6 billion × 0.175 × 0.404686 × .88 = 25.83billion cfu Enterococcus
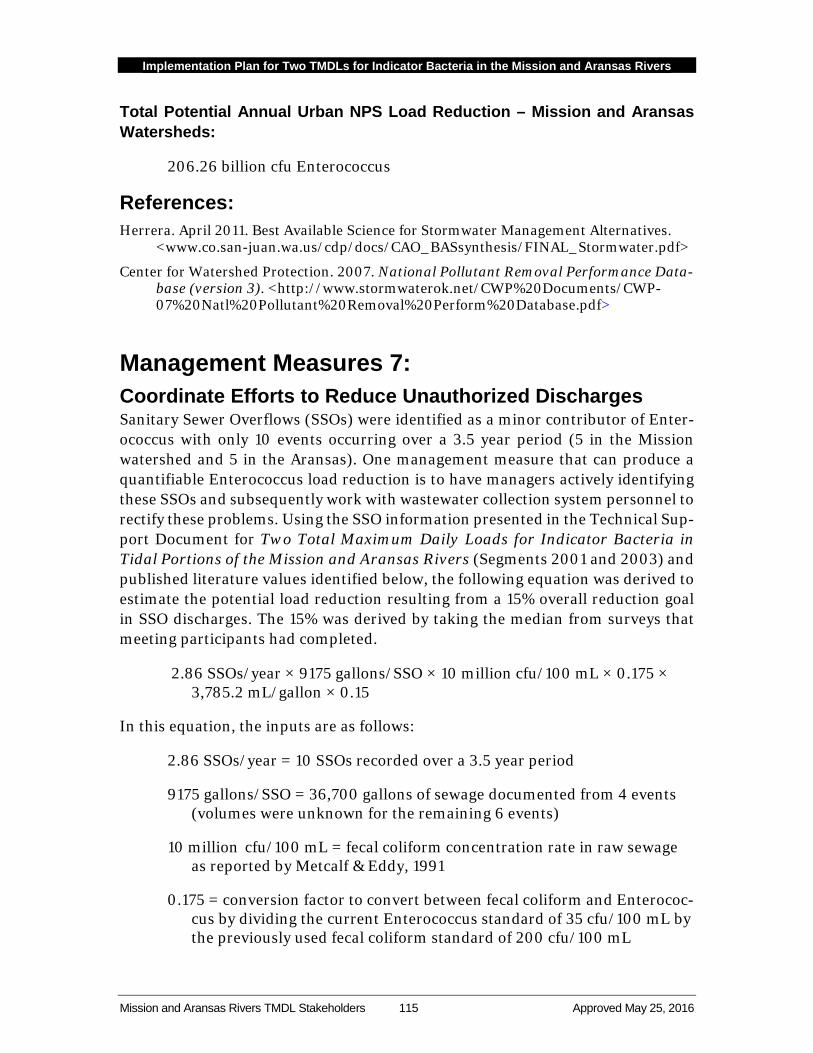
Implementation Plan for Two TMDLs for Indicator Bacteria in the Mission and Aransas Rivers
Mission and Aransas Rivers TMDL Stakeholders 115 Approved May 25, 2016
Total Potential Annual Urban NPS Load Reduction – Mission and Aransas Watersheds:
206.26 billion cfu Enterococcus
References: Herrera. April 2011. Best Available Science for Stormwater Management Alternatives.
<www.co.san-juan.wa.us/cdp/docs/CAO_BASsynthesis/FINAL_Stormwater.pdf>
Center for Watershed Protection. 2007. National Pollutant Removal Performance Data-base (version 3). <http://www.stormwaterok.net/CWP%20Documents/CWP-07%20Natl%20Pollutant%20Removal%20Perform%20Database.pdf>
Management Measures 7: Coordinate Efforts to Reduce Unauthorized Discharges Sanitary Sewer Overflows (SSOs) were identified as a minor contributor of Enter-ococcus with only 10 events occurring over a 3.5 year period (5 in the Mission watershed and 5 in the Aransas). One management measure that can produce a quantifiable Enterococcus load reduction is to have managers actively identifying these SSOs and subsequently work with wastewater collection system personnel to rectify these problems. Using the SSO information presented in the Technical Sup-port Document for Two Total Maximum Daily Loads for Indicator Bacteria in Tidal Portions of the Mission and Aransas Rivers (Segments 2001 and 2003) and published literature values identified below, the following equation was derived to estimate the potential load reduction resulting from a 15% overall reduction goal in SSO discharges. The 15% was derived by taking the median from surveys that meeting participants had completed.
2.86 SSOs/year × 9175 gallons/SSO × 10 million cfu/100 mL × 0.175 × 3,785.2 mL/gallon × 0.15
In this equation, the inputs are as follows:
2.86 SSOs/year = 10 SSOs recorded over a 3.5 year period
9175 gallons/SSO = 36,700 gallons of sewage documented from 4 events (volumes were unknown for the remaining 6 events)
10 million cfu/100 mL = fecal coliform concentration rate in raw sewage as reported by Metcalf & Eddy, 1991
0.175 = conversion factor to convert between fecal coliform and Enterococ-cus by dividing the current Enterococcus standard of 35 cfu/100 mL by the previously used fecal coliform standard of 200 cfu/100 mL
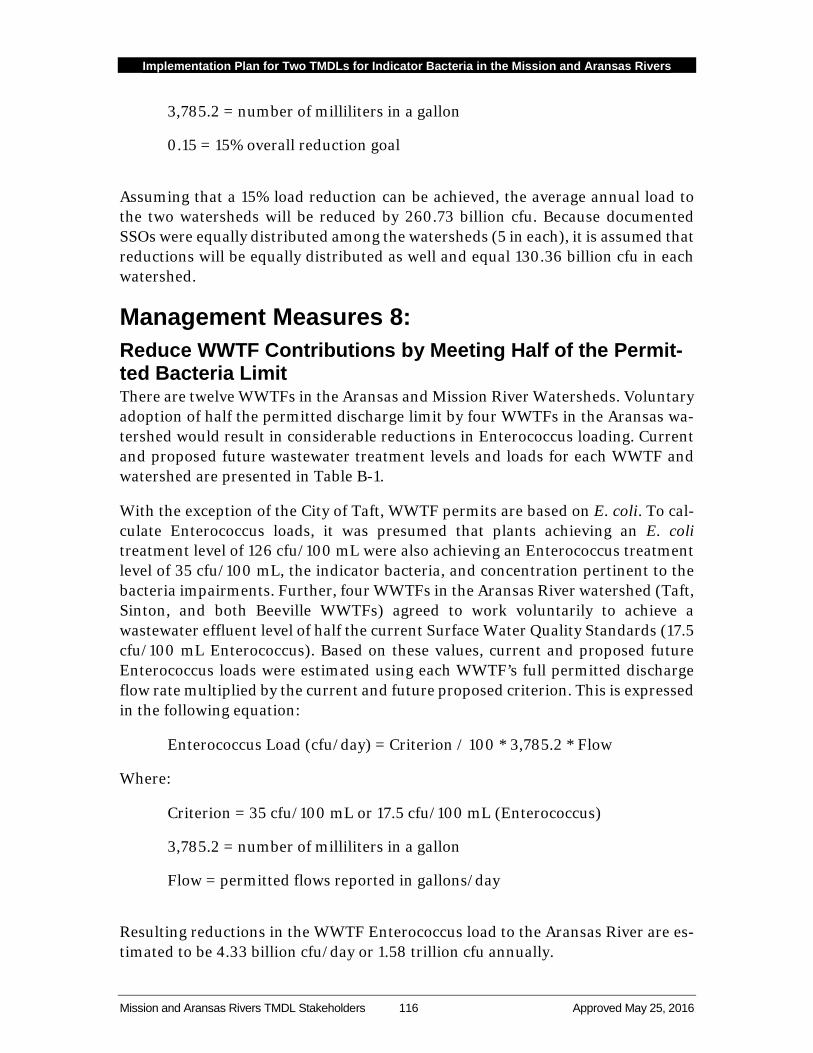
Implementation Plan for Two TMDLs for Indicator Bacteria in the Mission and Aransas Rivers
Mission and Aransas Rivers TMDL Stakeholders 116 Approved May 25, 2016
3,785.2 = number of milliliters in a gallon
0.15 = 15% overall reduction goal
Assuming that a 15% load reduction can be achieved, the average annual load to the two watersheds will be reduced by 260.73 billion cfu. Because documented SSOs were equally distributed among the watersheds (5 in each), it is assumed that reductions will be equally distributed as well and equal 130.36 billion cfu in each watershed.
Management Measures 8: Reduce WWTF Contributions by Meeting Half of the Permit-ted Bacteria Limit There are twelve WWTFs in the Aransas and Mission River Watersheds. Voluntary adoption of half the permitted discharge limit by four WWTFs in the Aransas wa-tershed would result in considerable reductions in Enterococcus loading. Current and proposed future wastewater treatment levels and loads for each WWTF and watershed are presented in Table B-1.
With the exception of the City of Taft, WWTF permits are based on E. coli. To cal-culate Enterococcus loads, it was presumed that plants achieving an E. coli treatment level of 126 cfu/100 mL were also achieving an Enterococcus treatment level of 35 cfu/100 mL, the indicator bacteria, and concentration pertinent to the bacteria impairments. Further, four WWTFs in the Aransas River watershed (Taft, Sinton, and both Beeville WWTFs) agreed to work voluntarily to achieve a wastewater effluent level of half the current Surface Water Quality Standards (17.5 cfu/100 mL Enterococcus). Based on these values, current and proposed future Enterococcus loads were estimated using each WWTF’s full permitted discharge flow rate multiplied by the current and future proposed criterion. This is expressed in the following equation:
Enterococcus Load (cfu/day) = Criterion / 100 * 3,785.2 * Flow
Where:
Criterion = 35 cfu/100 mL or 17.5 cfu/100 mL (Enterococcus)
3,785.2 = number of milliliters in a gallon
Flow = permitted flows reported in gallons/day
Resulting reductions in the WWTF Enterococcus load to the Aransas River are es-timated to be 4.33 billion cfu/day or 1.58 trillion cfu annually.
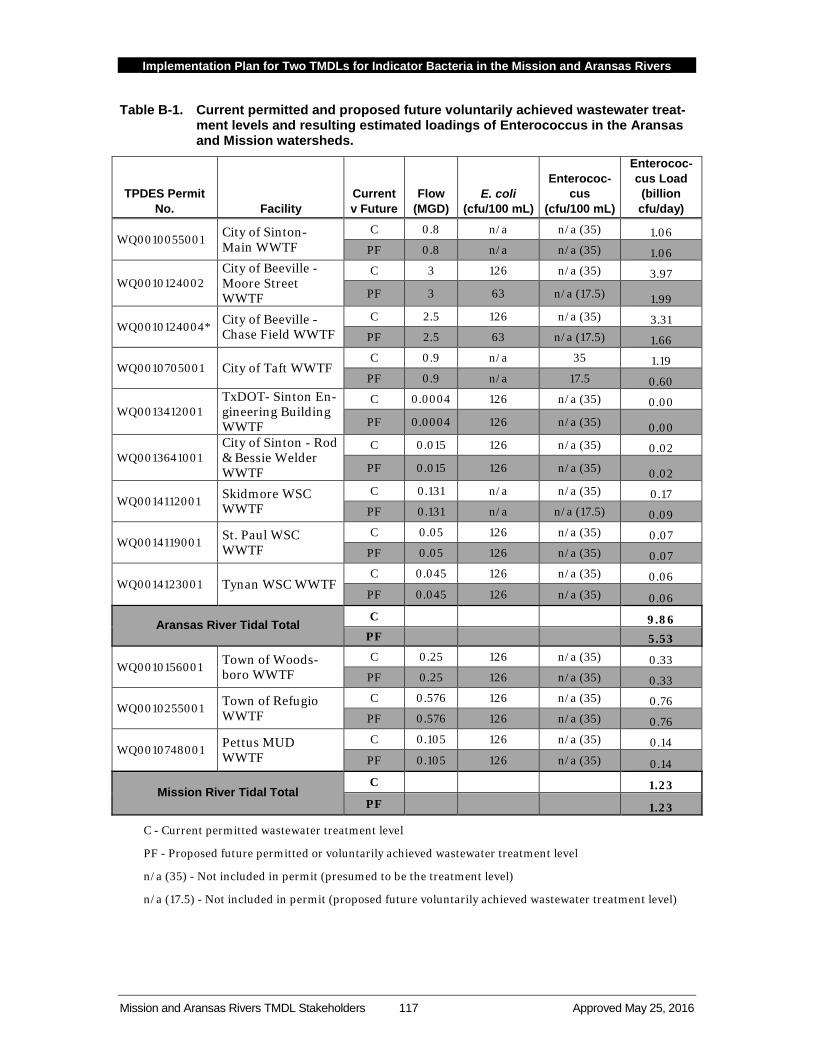
Implementation Plan for Two TMDLs for Indicator Bacteria in the Mission and Aransas Rivers
Mission and Aransas Rivers TMDL Stakeholders 117 Approved May 25, 2016
Table B-1. Current permitted and proposed future voluntarily achieved wastewater treat-ment levels and resulting estimated loadings of Enterococcus in the Aransas and Mission watersheds.
TPDES Permit No. Facility
Current v Future
Flow (MGD)
E. coli (cfu/100 mL)
Enterococ-cus
(cfu/100 mL)
Enterococ-cus Load (billion cfu/day)
WQ0010055001 City of Sinton- Main WWTF
C 0.8 n/a n/a (35) 1.06 PF 0.8 n/a n/a (35) 1.06
WQ0010124002 City of Beeville - Moore Street WWTF
C 3 126 n/a (35) 3.97
PF 3 63 n/a (17.5) 1.99
WQ0010124004* City of Beeville - Chase Field WWTF
C 2.5 126 n/a (35) 3.31 PF 2.5 63 n/a (17.5) 1.66
WQ0010705001 City of Taft WWTF C 0.9 n/a 35 1.19
PF 0.9 n/a 17.5 0.60
WQ0013412001 TxDOT- Sinton En-gineering Building WWTF
C 0.0004 126 n/a (35) 0.00
PF 0.0004 126 n/a (35) 0.00
WQ0013641001 City of Sinton - Rod & Bessie Welder WWTF
C 0.015 126 n/a (35) 0.02
PF 0.015 126 n/a (35) 0.02
WQ0014112001 Skidmore WSC WWTF
C 0.131 n/a n/a (35) 0.17 PF 0.131 n/a n/a (17.5) 0.09
WQ0014119001 St. Paul WSC WWTF
C 0.05 126 n/a (35) 0.07 PF 0.05 126 n/a (35) 0.07
WQ0014123001 Tynan WSC WWTF C 0.045 126 n/a (35) 0.06
PF 0.045 126 n/a (35) 0.06
Aransas River Tidal Total C 9.86
PF 5.53
WQ0010156001 Town of Woods-boro WWTF
C 0.25 126 n/a (35) 0.33 PF 0.25 126 n/a (35) 0.33
WQ0010255001 Town of Refugio WWTF
C 0.576 126 n/a (35) 0.76 PF 0.576 126 n/a (35) 0.76
WQ0010748001 Pettus MUD WWTF
C 0.105 126 n/a (35) 0.14 PF 0.105 126 n/a (35) 0.14
Mission River Tidal Total C 1.23
PF 1.23
C - Current permitted wastewater treatment level
PF - Proposed future permitted or voluntarily achieved wastewater treatment level
n/a (35) - Not included in permit (presumed to be the treatment level)
n/a (17.5) - Not included in permit (proposed future voluntarily achieved wastewater treatment level)
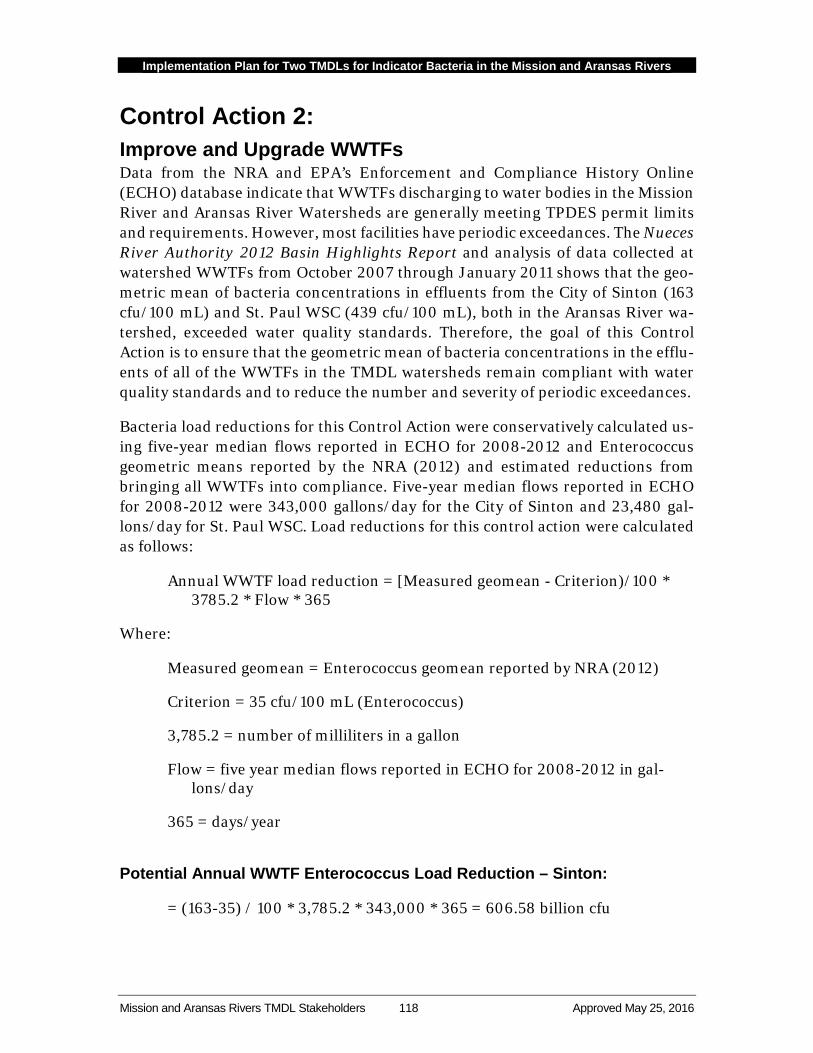
Implementation Plan for Two TMDLs for Indicator Bacteria in the Mission and Aransas Rivers
Mission and Aransas Rivers TMDL Stakeholders 118 Approved May 25, 2016
Control Action 2: Improve and Upgrade WWTFs Data from the NRA and EPA’s Enforcement and Compliance History Online (ECHO) database indicate that WWTFs discharging to water bodies in the Mission River and Aransas River Watersheds are generally meeting TPDES permit limits and requirements. However, most facilities have periodic exceedances. The Nueces River Authority 2012 Basin Highlights Report and analysis of data collected at watershed WWTFs from October 2007 through January 2011 shows that the geo-metric mean of bacteria concentrations in effluents from the City of Sinton (163 cfu/100 mL) and St. Paul WSC (439 cfu/100 mL), both in the Aransas River wa-tershed, exceeded water quality standards. Therefore, the goal of this Control Action is to ensure that the geometric mean of bacteria concentrations in the efflu-ents of all of the WWTFs in the TMDL watersheds remain compliant with water quality standards and to reduce the number and severity of periodic exceedances.
Bacteria load reductions for this Control Action were conservatively calculated us-ing five-year median flows reported in ECHO for 2008-2012 and Enterococcus geometric means reported by the NRA (2012) and estimated reductions from bringing all WWTFs into compliance. Five-year median flows reported in ECHO for 2008-2012 were 343,000 gallons/day for the City of Sinton and 23,480 gal-lons/day for St. Paul WSC. Load reductions for this control action were calculated as follows:
Annual WWTF load reduction = [Measured geomean - Criterion)/100 * 3785.2 * Flow * 365
Where:
Measured geomean = Enterococcus geomean reported by NRA (2012)
Criterion = 35 cfu/100 mL (Enterococcus)
3,785.2 = number of milliliters in a gallon
Flow = five year median flows reported in ECHO for 2008-2012 in gal-lons/day
365 = days/year
Potential Annual WWTF Enterococcus Load Reduction – Sinton:
= (163-35) / 100 * 3,785.2 * 343,000 * 365 = 606.58 billion cfu
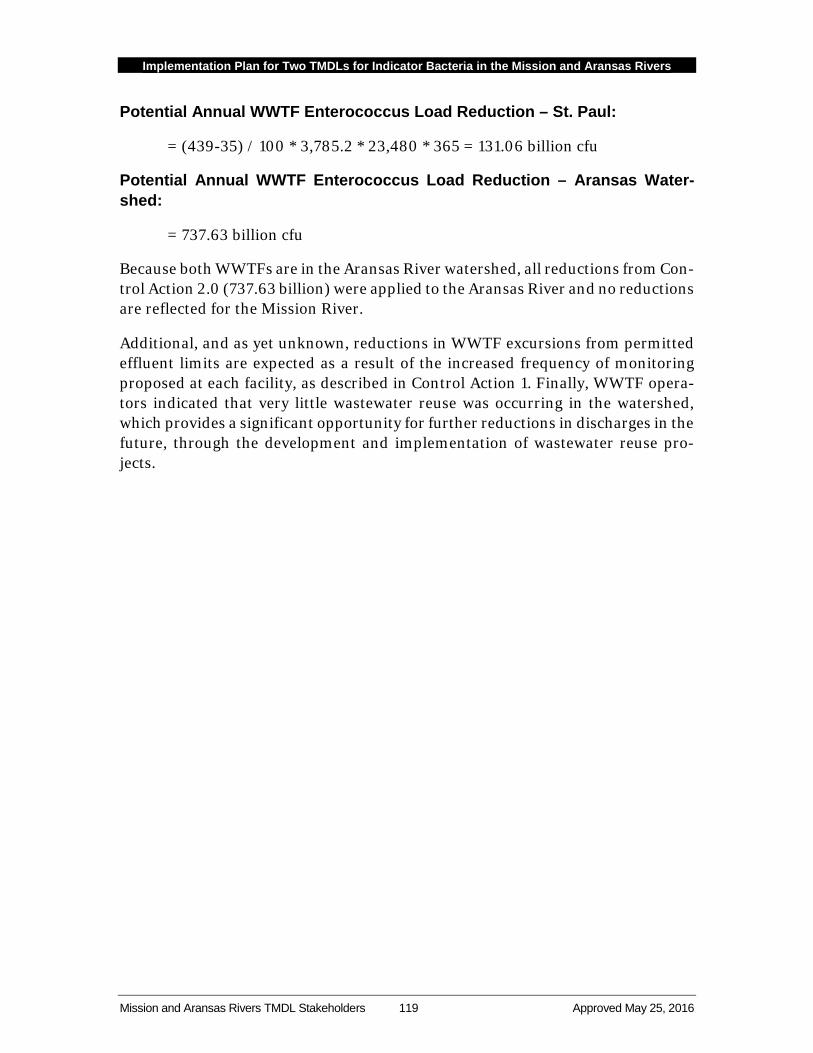
Implementation Plan for Two TMDLs for Indicator Bacteria in the Mission and Aransas Rivers
Mission and Aransas Rivers TMDL Stakeholders 119 Approved May 25, 2016
Potential Annual WWTF Enterococcus Load Reduction – St. Paul:
= (439-35) / 100 * 3,785.2 * 23,480 * 365 = 131.06 billion cfu
Potential Annual WWTF Enterococcus Load Reduction – Aransas Water-shed:
= 737.63 billion cfu
Because both WWTFs are in the Aransas River watershed, all reductions from Con-trol Action 2.0 (737.63 billion) were applied to the Aransas River and no reductions are reflected for the Mission River.
Additional, and as yet unknown, reductions in WWTF excursions from permitted effluent limits are expected as a result of the increased frequency of monitoring proposed at each facility, as described in Control Action 1. Finally, WWTF opera-tors indicated that very little wastewater reuse was occurring in the watershed, which provides a significant opportunity for further reductions in discharges in the future, through the development and implementation of wastewater reuse pro-jects.
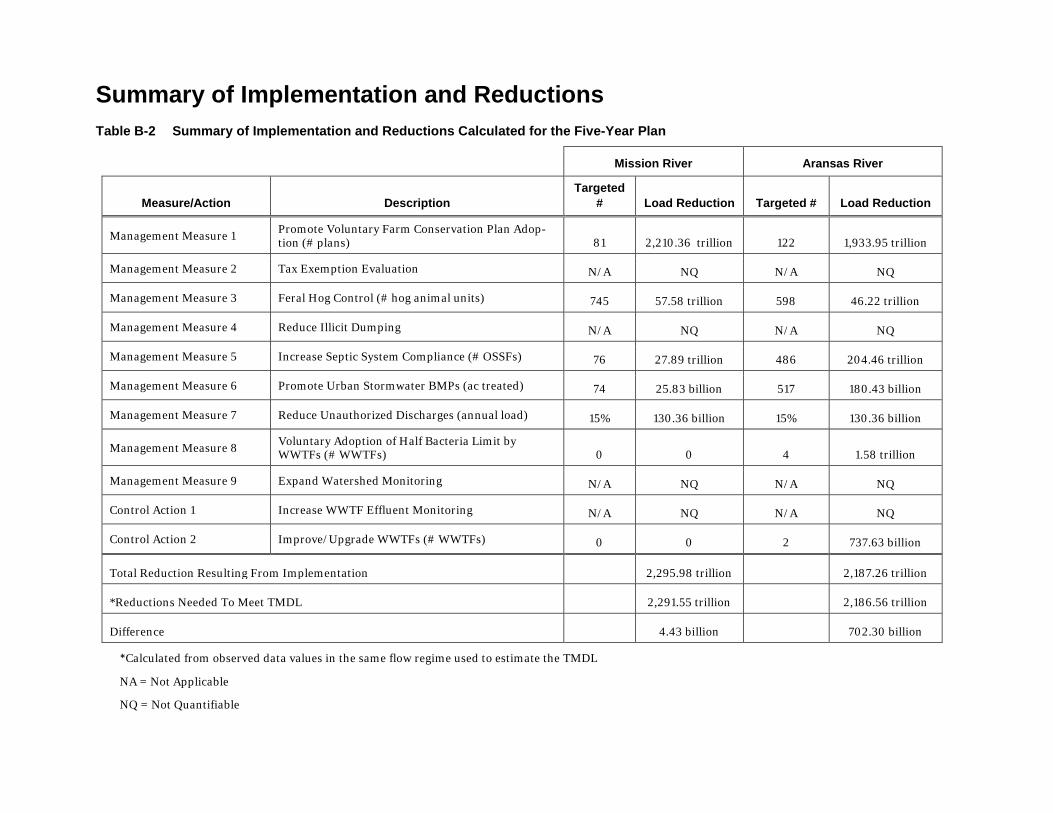
Summary of Implementation and Reductions Table B-2 Summary of Implementation and Reductions Calculated for the Five-Year Plan
Mission River Aransas River
Measure/Action Description Targeted
# Load Reduction Targeted # Load Reduction
Management Measure 1 Promote Voluntary Farm Conservation Plan Adop-tion (# plans) 81 2,210.36 trillion 122 1,933.95 trillion
Management Measure 2 Tax Exemption Evaluation N/A NQ N/A NQ
Management Measure 3 Feral Hog Control (# hog animal units) 745 57.58 trillion 598 46.22 trillion
Management Measure 4 Reduce Illicit Dumping N/A NQ N/A NQ
Management Measure 5 Increase Septic System Compliance (# OSSFs) 76 27.89 trillion 486 204.46 trillion
Management Measure 6 Promote Urban Stormwater BMPs (ac treated) 74 25.83 billion 517 180.43 billion
Management Measure 7 Reduce Unauthorized Discharges (annual load) 15% 130.36 billion 15% 130.36 billion
Management Measure 8 Voluntary Adoption of Half Bacteria Limit by WWTFs (# WWTFs) 0 0 4 1.58 trillion
Management Measure 9 Expand Watershed Monitoring N/A NQ N/A NQ
Control Action 1 Increase WWTF Effluent Monitoring N/A NQ N/A NQ
Control Action 2 Improve/Upgrade WWTFs (# WWTFs) 0 0 2 737.63 billion
Total Reduction Resulting From Implementation 2,295.98 trillion 2,187.26 trillion
*Reductions Needed To Meet TMDL 2,291.55 trillion 2,186.56 trillion
Difference 4.43 billion 702.30 billion
*Calculated from observed data values in the same flow regime used to estimate the TMDL
NA = Not Applicable
NQ = Not Quantifiable