Embed Size (px)
Citation preview
Implementation of MultidimensionalProtein Identification Technology
and its Application to theCharacterization of ProteinComplexes in Bakers Yeast
Thesis by
Johannes Graumann
In Partial Fulfillment of the Requirementsfor the Degree of Doctor of Philosophy
California Institute of TechnologyPasadena, California
2006(Defended May 24, 2006)

ii
© 2006Johannes GraumannAll Rights Reserved.

iii
“. . . when one is writing a letter, he should think that the re-cipient will make it into a hanging scroll.”
Yamamoto Tsunetomo, “Hagakure”
iv
Acknowledgments
Many steps led to this work and every single one was helped along by people I would
like to thank.
I thank my parents for shaping my curiosity and supporting my academic en-
deavors. Special credits for directing my inquisitiveness towards scientific questions
goes to my grandfather Rudolf Budenz. Only the readiness of my wife Birgit to join
me in California created the environment in which this work could eventually come
about. I cannot thank her enough for her patience in dealing with a biochemists
sense of time (tbiochem ≈ 2tstandard) and managing our life and son Leo—especially
in the last months.
I also hold deep gratitude for the long line of teachers who laid the foundation
to this thesis. Klaus Müller and Horst Christmann (both Gymnasium am Kreb-
sberg, Neunkirchen/Saar, Germany) inspired me to take up biology in the first
place, Rolf Knippers, Ulrich Krawinkel, and Peter Kroneck at the University of
Konstanz (Germany) made me stick with it and Jon Beckwith (Harvard Medical
School, Boston, MA), Jim Bardwell, and Ursula Jakob (both University of Michigan,
Ann Arbor, MI) showed me that a future in academic research might be feasible.
Given the technical nature of the work described here, I would like to thank espe-
cially Peter Kroneck (University of Konstanz, Germany) for acquainting me with
instrumentation–driven biochemistry.
I thankfully acknowledge the contribution of the entire Division of Biology at
the California Institute of Technology to the incredible scientific environment that
formed the backdrop to much of this work. The members of my thesis committee—
Pamela Björkman, Bill Dunphy, Bruce Hay, and Mel Simon—contributed to this
v
thesis their advice, criticism, and time. Barbara Wold provided invaluable insight
into the politics of scientific interaction in general and adviser/advisee quarrels
specifically. Many friends also contributed to the Caltech experience—too many
to list them all, but a few shall be singled out. Dan Gold’s restaurant scouting
was instrumental to stylish acquisition of graduate school weight and his critical
reading of manuscripts was indispensable. Erik Griffin contributed discussion and
inspiration, as did David Walker. Chris Hart, Diane Trout and Dave Mathog were
essential to the fixing of the occasional going awry of the author’s computational
autodidactism. Dirk Walther, Kerstin Preuschoff, Daniela Dieterich and Marco
Landwehr provided a little bit of home away from home.
Without John Yates and his laboratory at The Scripps Research Institute (La
Jolla, CA) the work described here would simply not have been possible. I would
like to thank John for generously hosting me for nine months and sharing the know–
how of his lab. Special thanks go to the former Yates’ laboratory members Eberhard
Dürr (Merck, Philadelphia, PA), Hayes McDonald (ORNL, Oak Ridge, TN), Mike
MacCoss (University of Washington, Seattle, WA) and Dave Tabb (Vanderbilt Uni-
versity, Nashville, TN). Their mentorship regarding mass spectrometry and data
analysis yielded the foundation to this thesis.
I thank all former and present members of the Deshaies’ laboratory at Caltech
for advice, criticism and composure with which they have escorted this thesis and
its author. I would like to especially thank Rusty Lipford (Amgen, Thousand Oaks,
CA) for many an insight into the English language, Rati Verma for her bottomless
treasure trove of biochemical advice, Geoff Smith for his unwavering reliability,
Leslie Dunipace for countless packed capillary columns and Gabi Alexandru and
Thibault Mayor, my fellow Euro–room constituents, for being there in times good

vi
and not so good, scientifically and otherwise.
Last, but not least, I would like to express my gratitude toward my adviser
and mentor Ray Deshaies. I am grateful for the challenge he presented me with
in the shape of the project described here and the confidence he put in me while
letting me go off into scientific territory entirely new to him as well. I would like
to thank him for his patience while putting me back onto the right path numerous
times and the constant challenge of his scientific wit. I highly value the countless
political lessons taught by him—consciously or not—and the example he sets by his
ambition. Thank you for being available when needed and thank you also for many
insightful discussions on science and academic life in general.
vii
Abstract
The analysis of complex polypeptide mixtures poses a central and ubiquitous prob-
lem to biochemistry, molecular and cellular biology. Historically the problem has
been approached by means of gel electrophoretic separation, coupled to immune–
chemistry or Edman degradation (Edman 1949) based identification of separated
components. These approaches as well as those based on liquid chromatography are
hampered by a central issue: the wide spectrum of polypeptide characteristics that
renders their separation difficult. A recent strategy termed multidimensional pro-
tein identification technology (MudPIT) tackles this problem by capillary chromato-
graphic separation of not the complete polypeptides, but rather peptides yielded
by them through proteolytic digest and analyzing them in–line using ion trap mass
spectrometry (Link et al. 1999; Washburn et al. 2001; and Wolters et al. 2001).
This work describes the implementation of MudPIT outside of the analytical
chemistry environment of its inception. Robustness and generalizability of the tech-
nique are tested by analysis of polypeptide complexes copurifyed with 25 selected
gene products from Saccharomyces cerevisiae (Graumann et al. 2004). The pilot
study reveals MudPIT to be mature enough for use outside of specialized environ-
ments and, by yielding with Rtt102p a novel component of the Swi/Snf and RSC
chromatin remodelling complexes, to have potential for delivering new insights even
into extensively studied systems.
Subsequent application of MudPIT to the characterization of components of
the ubiquitin–proteasome system (Verma et al. 2004; and Mayor et al. 2005) and
mitochondrial fission (Griffin et al. 2005) in S. cerevisiae further emphasize its
potential to contribute to biochemical research.
viii
Table of Contents
Acknowledgments iv
Abstract vii
Table of Contents viii
Figures xii
1 Introduction 1
1.1 The Problem of a Complex Protein Mixture 1
1.2 Multidimensional Protein Identification Technology 7
1.3 Mass Spectrometric Quantification of Polypeptides 11
1.4 MudPIT at Caltech 14
1.5 References 19
2 Applicability of TAP–MudPIT to Pathway Proteomics in Yeast 28
2.1 Summary 28
2.2 Introduction 29
2.3 Experimental Procedures 32
2.4 Results 39
2.5 Discussion 53
2.6 Acknowledgements 59
2.7 Note Added in Proof 59
2.8 References 59
ix
Part Appendices 66
A Multiubiquitin Chain Receptors Define a Layer of Substrate
Selectivity in the Ubiquitin–Proteasome System 67
A.1 Abstract 67
A.2 Introduction 68
A.3 Results and Discussion 72
A.4 Experimental Procedures 94
A.5 References 95
B MS1, MS2, and SQT—Three Unified, Compact, and Easily Parsed
File Formats for the Storage of Shotgun Proteomic Spectra and
Identifications 103
B.1 Abstract 103
B.2 Introduction 104
B.3 Format Descriptions 106
B.4 Results and Discussion 114
B.5 References 118
C Analysis of Polyubiquitin Conjugates Reveals that the Rpn10
Substrate Receptor Contributes to the Turnover of Multiple
Proteasome Targets 121
C.1 Abstract 121
C.2 Introduction 122
C.3 Experimental Procedures 125
C.4 Results 129
x
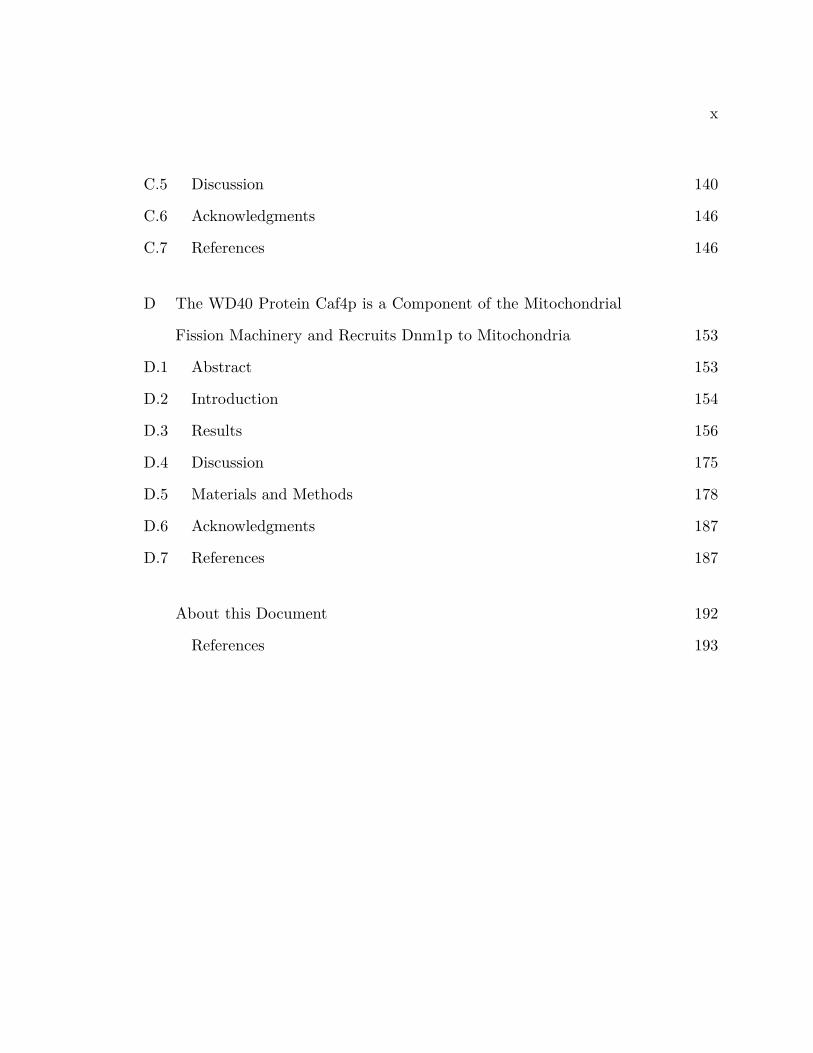
C.5 Discussion 140
C.6 Acknowledgments 146
C.7 References 146
D The WD40 Protein Caf4p is a Component of the Mitochondrial
Fission Machinery and Recruits Dnm1p to Mitochondria 153
D.1 Abstract 153
D.2 Introduction 154
D.3 Results 156
D.4 Discussion 175
D.5 Materials and Methods 178
D.6 Acknowledgments 187
D.7 References 187
About this Document 192
References 193
xi
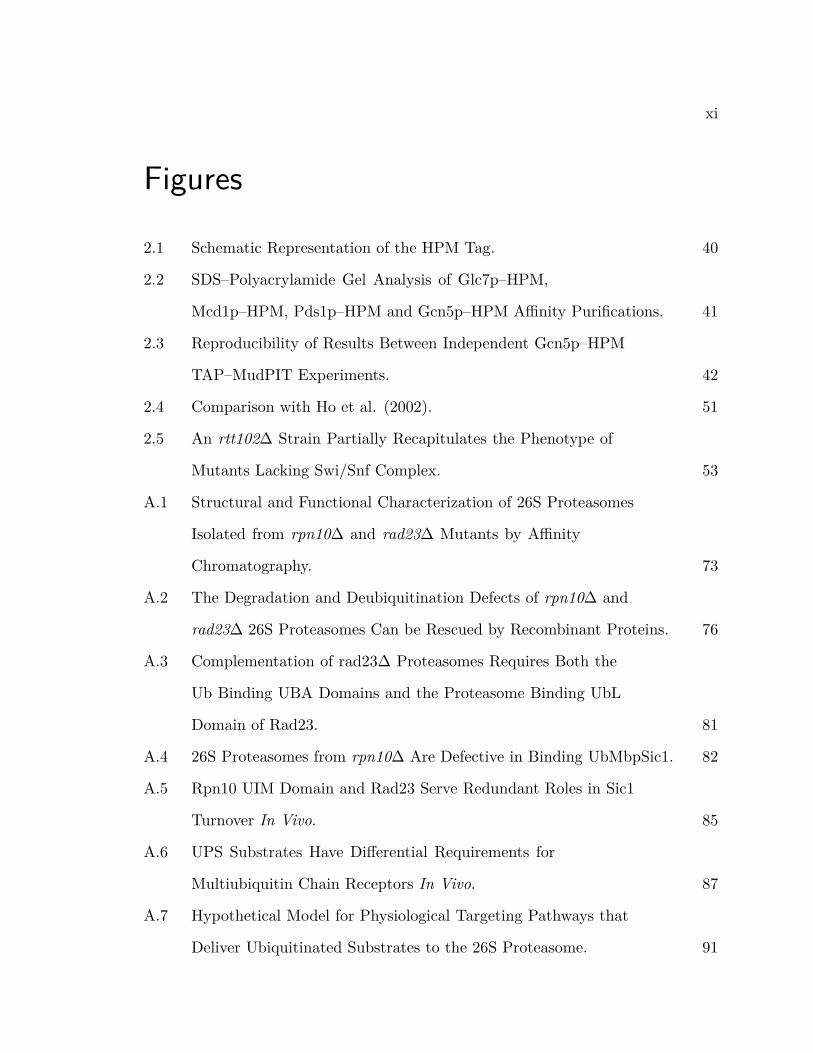
Figures
2.1 Schematic Representation of the HPM Tag. 40
2.2 SDS–Polyacrylamide Gel Analysis of Glc7p–HPM,
Mcd1p–HPM, Pds1p–HPM and Gcn5p–HPM Affinity Purifications. 41
2.3 Reproducibility of Results Between Independent Gcn5p–HPM
TAP–MudPIT Experiments. 42
2.4 Comparison with Ho et al. (2002). 51
2.5 An rtt102∆ Strain Partially Recapitulates the Phenotype of
Mutants Lacking Swi/Snf Complex. 53
A.1 Structural and Functional Characterization of 26S Proteasomes
Isolated from rpn10∆ and rad23∆ Mutants by Affinity
Chromatography. 73
A.2 The Degradation and Deubiquitination Defects of rpn10∆ and
rad23∆ 26S Proteasomes Can be Rescued by Recombinant Proteins. 76
A.3 Complementation of rad23∆ Proteasomes Requires Both the
Ub Binding UBA Domains and the Proteasome Binding UbL
Domain of Rad23. 81
A.4 26S Proteasomes from rpn10∆ Are Defective in Binding UbMbpSic1. 82
A.5 Rpn10 UIM Domain and Rad23 Serve Redundant Roles in Sic1
Turnover In Vivo. 85
A.6 UPS Substrates Have Differential Requirements for
Multiubiquitin Chain Receptors In Vivo. 87
A.7 Hypothetical Model for Physiological Targeting Pathways that
Deliver Ubiquitinated Substrates to the 26S Proteasome. 91
xii
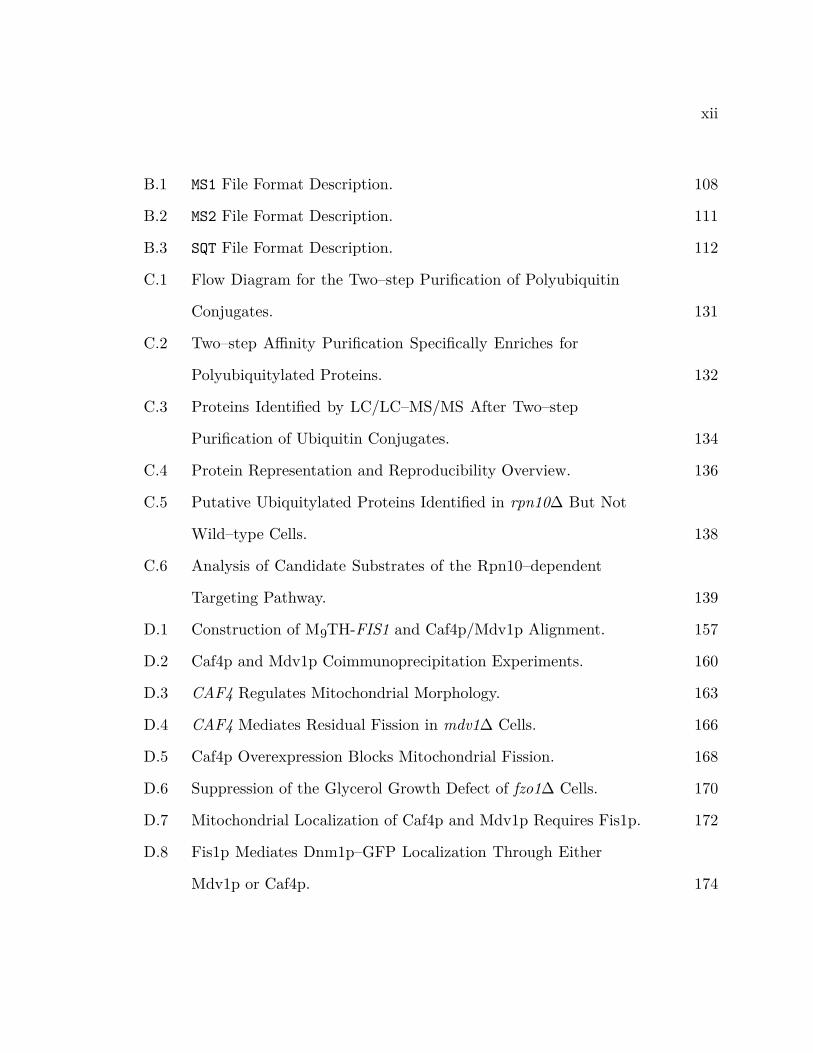
B.1 MS1 File Format Description. 108
B.2 MS2 File Format Description. 111
B.3 SQT File Format Description. 112
C.1 Flow Diagram for the Two–step Purification of Polyubiquitin
Conjugates. 131
C.2 Two–step Affinity Purification Specifically Enriches for
Polyubiquitylated Proteins. 132
C.3 Proteins Identified by LC/LC–MS/MS After Two–step
Purification of Ubiquitin Conjugates. 134
C.4 Protein Representation and Reproducibility Overview. 136
C.5 Putative Ubiquitylated Proteins Identified in rpn10∆ But Not
Wild–type Cells. 138
C.6 Analysis of Candidate Substrates of the Rpn10–dependent
Targeting Pathway. 139
D.1 Construction of M9TH-FIS1 and Caf4p/Mdv1p Alignment. 157
D.2 Caf4p and Mdv1p Coimmunoprecipitation Experiments. 160
D.3 CAF4 Regulates Mitochondrial Morphology. 163
D.4 CAF4 Mediates Residual Fission in mdv1∆ Cells. 166
D.5 Caf4p Overexpression Blocks Mitochondrial Fission. 168
D.6 Suppression of the Glycerol Growth Defect of fzo1∆ Cells. 170
D.7 Mitochondrial Localization of Caf4p and Mdv1p Requires Fis1p. 172
D.8 Fis1p Mediates Dnm1p–GFP Localization Through Either
Mdv1p or Caf4p. 174
1
1 Introduction
The work presented in this thesis describes the implementation of a set of techniques
termed “Multidimensional Protein Identification Technology” or MudPIT (Link et
al. 1999; Washburn et al. 2001; and Wolters et al. 2001), that enables the analysis of
complex protein mixtures. This chapter provides an introduction to the significance
of the analysis of complex protein mixtures in molecular biology and biochemistry,
as well as describing MudPIT in detail.
1.1 The Problem of a Complex Protein Mixture
Polypeptides dominate the spectrum of biological functions as both mediators and
catalysts. Although knowledge of biological processes mediated by nucleic acids has
expanded dramatically as a result of whole genome sequencing projects (Storz 2002),
polypeptides provide the greater variety of building blocks—20 amino acids vs. four
nucleotides—and as a result the larger spectrum of possible conformations and
chemistries. The array of possible posttranscriptional modifications of nucleic acids
(Gott and Emeson 2000) is met by an equally extensive variety of posttranslational
modifications in polypeptides (Creighton 1993) and does not shift the balance.
A significant part, if not the majority, of protein–mediated biological reactions
is dependent not on a single functional polypeptide, but rather a group of polypep-
tides working together in a concerted manner, often forming subunits of one protein
complex, one “molecular machine” (Alberts 1998). Gavin et al. (2006), for exam-
ple, estimate that S. cerevisiae contains 800 core “protein complexes”—condition–
2
independent protein complexes, whose composition is modulated in a condition–
dependent manner by “attachment proteins.” Conservatively assuming two polypep-
tide chains per “core complex” and disregarding all transient interactions with “at-
tachment proteins,” this amounts to 27 % of all systematically named open reading
frames in yeast being assembled into complexes. This number rises to 41 % for an
average of three polypeptide chains per complex.1
These two points—the domination of biological processes by proteinaceous agents
and the prevalence of these polypeptides in heterogeneous complexes—present a
challenge: separation of a complex protein mixture and the identification of its com-
ponents, even if one is interested in a single biological process rather than questions
of global changes in a cellular or organellar protein complement.
1.1.1 Separation of complex protein mixtures
Separation of protein mixtures is commonly handled by one of two technically di-
vergent approaches: gel electrophoresis or liquid chromatography. Gel electrophore-
sis separates proteins by a combination of their electrostatic and size properties,
whether native or conferred by agents such as sodium dodecyl sulfate as introduced
by Laemmli (1970). While immensely popular, the technique in both its one– as well
as two–dimensional form (see, e. g., Klose 1975; and O’Farrell 1975), has inherent
disadvantages:
Based on 5872 nondubious and nonpseudogene open reading frames present in the Saccharomyces1
Genome Database (Cherry et al. 1998) as of 03/31/2006.
3
1. Both one– and two–dimensional gel electrophoresis have severely reduced resolv-
ing power for polypeptides of extremely small or large sizes.
2. Similarly, the isoelectric–focusing–based first dimension of conventional two–
dimensional gel electrophoresis biases against polypeptides with very high or
low isoelectric points.
3. Gel electrophoresis is notoriously unsuited for the separation of polypeptides
with extreme hydrophobicity, such as membrane proteins.
4. Although more mechanized approaches have been made (see, e. g., Gavin et
al. 2002), selection of separated polypeptide chains is commonly done visually,
opening the technique to bias against weakly staining or diffusely migrating
polypeptides.
5. Gel electrophoresis delivers the separated polypeptide chains embedded in a gel
matrix, which implies the potential for low extraction efficiency.
6. The conventional workflow (see, e. g., Shevchenko et al. 2002) of gel electrophoretic
mixture separation, gel block excision and in–gel digest results in the case of com-
plex mixtures in massive sample parallelization, requiring a significant degree of
automation. This problem is partially remedied by slicing groups of polypeptide
bands rather than individual bands and subsequent chromatographic separation
of the electrophoretically prefractionated mixture (Gavin et al. 2002).
Traditional protein mixture separation by chromatographic methods—the mix-
ture is carried through a column of chromatography matrix by a liquid phase and
separated by differential interaction with the matrix—implies a similar set of prob-
lems, for example:
1. Depending on the polypeptide property by which the matrix separates in a given
4
experiment (e. g., hydrophobicity, hydrophilicity, charge, size), there are gel elec-
trophoresis analogous problems in separating polypeptides in the extremes of the
property spectrum. Extremely hydrophobic proteins are, for example, difficult
to separate by reverse phase liquid chromatography, as are extremely hydrophilic
ones.
2. Conventional chromatography workflows involving fraction collection potentially
yield, just as in the case of gel electrophoretic separation, massive sample paral-
lelization and the necessity of automation.
3. Varying with the liquid phase throughput through the column, chromatographic
methods have the inherent problem of volume expansion, necessitating addi-
tional procedures as precipitation or lyophilization, implying the risk of sample
loss by, e. g., surface coating.
The preceding lists concentrate on the drawbacks of the two most popular means
to separate complex polypeptide mixtures. Evidently, the two approaches also have
distinct advantages. Gel electrophoresis for example is uniquely suited for separa-
tion of posttranslationally modified polypeptide forms (for an example see Larsen et
al. 2001), while liquid chromatographic methods are very well suited for subsequent
biochemical manipulations as functional assays or crystallographic analysis of the
separated polypeptides. Approach–specific problems aside, the methodologies essen-
tially struggle with the same issue: the wide spectrum of biochemical/biophysical
characteristics associated with polypeptides in the complex mixtures to be sepa-
rated. Section 1.2 describes in detail how MudPIT tries to remedy this problem.
5
1.1.2 Identification of the components of a complex protein mixture
The second step in characterization of a complex polypeptide mixture is the iden-
tification of separated components. The methodologies to achieve this fall into
two categories: before and after the application of mass spectrometry to the prob-
lem. Pre–mass–spectrometry methods for the analysis of an unknown proteina-
ceous agent include Edman degradation (Edman 1949) as well as raising antibodies
against a purified polypeptide, which is then identified by screening through of a
phage expression library and sequencing. The first mass spectrometric approach
to join the canon of techniques applied to polypeptide analysis was peptide mass
fingerprinting (Henzel et al. 1993; James et al. 1993; Mann et al. 1993; Pappin et
al. 1993; and Yates et al. 1993). This technique is based on the proteolytic digest
of the polypeptide to be analyzed with a site–specific protease and the subsequent
mass spectrometric analysis of the resulting peptide mixture. The measured pep-
tide masses are matched with the in silico digest of a protein database, yielding
the protein with the closest hypothetical spectrum as the identification candidate.
Peptide mass fingerprinting shares a major drawback with pre–mass–spectrometric
methods: they require polypeptide mixture components to be highly purified, which
poses a significant challenge when dealing with highly complex mixtures.
While peptide mass fingerprinting already took advantage of some of the follow-
ing innovations (e. g., electrospray ionization), the application of the complete set
was necessary in order for mass spectrometry to emerge as the dominating technique
with respect to polypeptide mixture analysis:
1. The development of postsource decay (PSD, Spengler et al. 1992) and collision
induced dissociation (CID, Hunt et al. 1986) changed the field dramatically: the
6
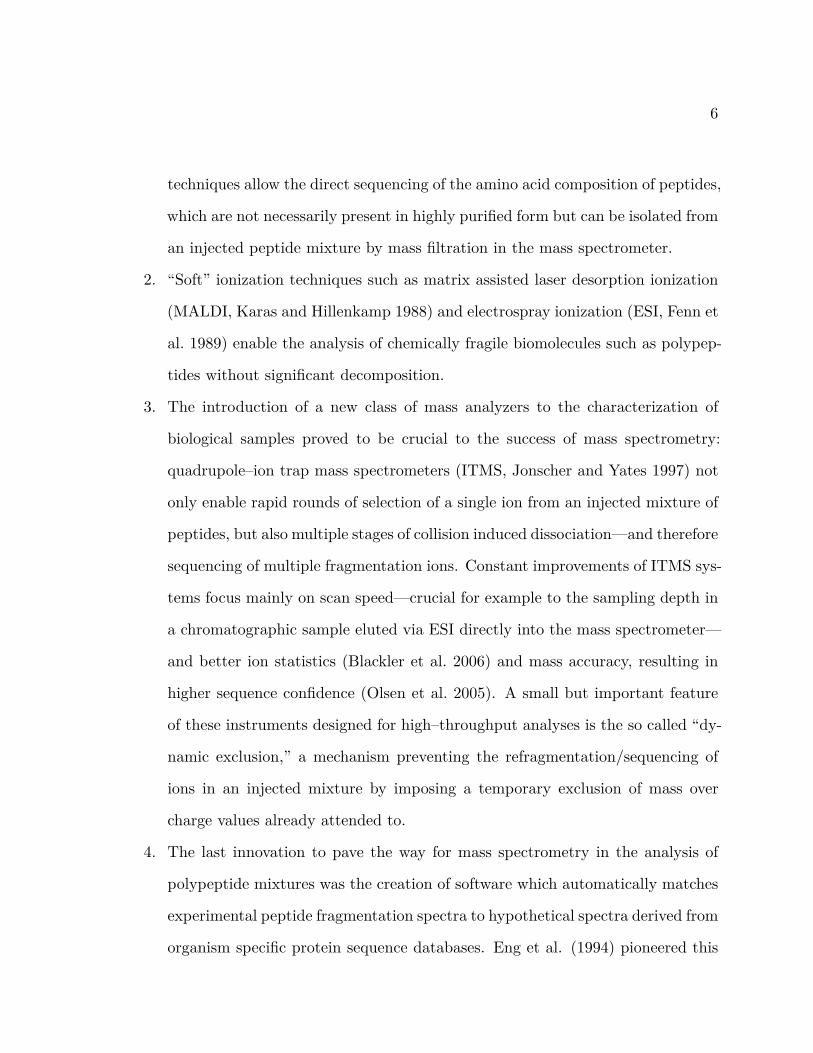
techniques allow the direct sequencing of the amino acid composition of peptides,
which are not necessarily present in highly purified form but can be isolated from
an injected peptide mixture by mass filtration in the mass spectrometer.
2. “Soft” ionization techniques such as matrix assisted laser desorption ionization
(MALDI, Karas and Hillenkamp 1988) and electrospray ionization (ESI, Fenn et
al. 1989) enable the analysis of chemically fragile biomolecules such as polypep-
tides without significant decomposition.
3. The introduction of a new class of mass analyzers to the characterization of
biological samples proved to be crucial to the success of mass spectrometry:
quadrupole–ion trap mass spectrometers (ITMS, Jonscher and Yates 1997) not
only enable rapid rounds of selection of a single ion from an injected mixture of
peptides, but also multiple stages of collision induced dissociation—and therefore
sequencing of multiple fragmentation ions. Constant improvements of ITMS sys-
tems focus mainly on scan speed—crucial for example to the sampling depth in
a chromatographic sample eluted via ESI directly into the mass spectrometer—
and better ion statistics (Blackler et al. 2006) and mass accuracy, resulting in
higher sequence confidence (Olsen et al. 2005). A small but important feature
of these instruments designed for high–throughput analyses is the so called “dy-
namic exclusion,” a mechanism preventing the refragmentation/sequencing of
ions in an injected mixture by imposing a temporary exclusion of mass over
charge values already attended to.
4. The last innovation to pave the way for mass spectrometry in the analysis of
polypeptide mixtures was the creation of software which automatically matches
experimental peptide fragmentation spectra to hypothetical spectra derived from
organism specific protein sequence databases. Eng et al. (1994) pioneered this
7
approach with their program Sequest, but a number of competing programs as,
e. g., Mascot (Perkins et al. 1999) and X! Tandem (Craig and Beavis 2004) have
followed suit.
MudPIT incorporates a number of these innovations to tackle the problem of the
analysis of a complex polypeptide mixture, which is described in detail in section
1.2.
1.2 Multidimensional Protein Identification Technology
Multidimensional protein identification technology (MudPIT) was introduced by
Link et al. (1999) as “Direct Analysis of Large Protein Complexes” (DALPC). Gen-
eralization of the concept lead to the coining of the term MudPIT (Washburn et
al. 2001; and Wolters et al. 2001). The workflow established by the authors com-
bines multidimensional capillary chromatography of complex polypeptide mixtures
digested in solution with in–line electrospray–ionization ion–trap tandem mass–
spectrometry and automated matching of the acquired fragmentation spectra to
translated genomic sequence via Sequest (Eng et al. 1994). The strategy addresses
many of the challenges to the analysis of complex polypeptide mixtures laid out in
section 1.1.
MudPIT strives to separate proteins that have been digested into peptides rather
than the intact polypeptides. This approach—also termed bottom up (Wysocki et
al. 2005) or shotgun proteomics (Wolters et al. 2001)—levels the biochemical/biophy-
sical properties and therefore reduces the problems polypeptides pose to separation
techniques with their wide property spectrums.
8
Reliance on capillary chromatography with low liquid phase flow rates2 remedies
the issue of volume expansion connected to conventional high pressure liquid chro-
matography (HPLC), while directly interfacing the separation setup to the mass
spectrometer via electrospray ionization. The latter prevents the need for sam-
ple collection, thereby rendering further automation unnecessary, reducing manual
intervention and preempting sample loss by surface coating. The use of a two–
dimensional chromatography column significantly improves the resolution of the
setup by utilizing two independent biophysical characteristics of the peptides to be
separated: charge by the strong cation exchanger (SCX) phase and hydrophobic-
ity by the reverse phase. It extends prior work (e. g., Lundell and Markides 1992;
and Takahashi et al. 1985) and transfers the principles long utilized in twodimen-
sional gel electrophoresis (O’Farrell 1975) to liquid chromatography. McDonald et
al. (2002) further enhanced the approach by adding a third phase—a second reverse
phase chromatography matrix—to the capillary column, allowing sample desalting
in–line to the mass spectrometer, further reducing handling requirements and cap-
turing a class of hydrophilic peptides missed when using the twophasic column
layout.
The utilization of iontrap mass spectrometers—for reasons of patent protection
of key scan features predominantly ThermoElectron’s line of Deca, DecaXP, and
LTQ mass spectrometers (historically successive in this order)—enables the analysis
of ions eluting into the mass spectrometer with increasing speed and sensitivity
(for the LTQ see Blackler et al. 2006). Together with the mechanism of dynamic
exclusion discussed above, this renders possible increasingly comprehensive analysis
50 µl/min in the original publication, in further works reduced to the order of 100 nl/min.2
9
of peptides of ever lower abundance eluting into the spectrometer.
All the advantages of MudPIT aside, the technique also meets with valid criti-
cisms. Through the projects described in this work, the hand–crafted, single–use
capillary chromatography columns used emerged incontestably as the weekest link
in the chain of procedures constituting MudPIT. Packing the 100 µm inner diame-
ter columns on customized pressure vessels is tedious work, often requiring multiple
attempts. After successful packing, some columns clog during sample loading3 or
produce suboptimal electrospray due to inadequate tip shape. Custom capillary
columns are commercially available (e. g., New Objective, Woburn, MA), but the
high price together with the triphasic nature of the columns, which interferes with
effective cleaning and leave the column a single–use item, did prohibit their use for
this work. Although there are promising microfluidic approaches emerging (e. g.,
Xie et al. 2005), mass production of multiphase capillary columns seems far in the
future. The single–use characteristic of the capillary chromatography columns im-
plies (together with the stochastic nature of peak sampling by the ion trap mass
spectrometer) relatively low reproducibility when analyzing the same sample on dif-
ferent columns. Multidimensional chromatography is also possible with traditional
HPLC columns, but their reliability, reproducibility, reusability and ready commer-
cial availability comes with a significant hit to analysis sensitivity4—a fact very
much undesirable when analyzing highly complex mixtures with low polypeptide
Promoted by the high urea concentrations regularly present.3
According to Abian et al. (1999), the maximum peak concentration of the sample eluate Cmax4
increases by a factor of 100 when reducing the column diameter from the commonly used 1 mm to
100 µm.
10
abundance (as, e. g., polyubiquitin conjugates; see appendix C).
Another critical point is the use of in–line electrospray ionization itself. While
reducing manual intervention and analysis time by directly linking the chromatog-
raphy setup with the mass analyzer, this methodology also requires extreme spec-
trum acquisition speeds to be able to sample deeply into the injected ion mix-
tures. It also possesses the inherent drawback of producing multiply charged ions
(which complicates subsequent spectrum matching) and—in conjunction with in–
line chromatography—restricts the time window for analyzing a chromatographi-
cally separated peptide peak to its actual elution from the column.
The speed of spectrum acquisition in an ion trap mass spectrometer traditionally
comes at the expense of mass accuracy, but this criticism is slowly disappearing
due to the combination of ion traps with high mass accuracy mass analyzers as
Fourier–transform mass spectrometers (e. g., ThermoElectron’s LTQ–FTMS, see
Olsen et al. 2004) and orbi–traps (e. g., ThermoElectron’s LTQ–Orbitrap, see Olsen
et al. 2005).
Shotgun shotgun proteomic data pose significant analysis challenges (Steen and
Mann 2004). Improved precursor scan mass accuracy, as delivered by instruments
similar to the ones described in the previous paragraph, remedies a part of that
problem, but what remains—especially when dealing with higher eukaryotes—is
the problem of polypeptide isoform multiplicity due to differential splicing, alter-
native promoter usage and other mechanisms, as well as often extensive groups of
homologous polypeptides, which make pinpointing a polypeptide from a collection
of sequenced peptides very difficult (Nesvizhskii and Aebersold 2005; and Godovac-
Zimmermann et al. 2005). While this problem is triggering the field to revisit top
down proteomics with its significant separation challenges (see above), the work pre-
11
sented here concentrates on the model organism Saccharomyces cerevisiae, which
carries introns in only ≈ 4 % of its open reading frames (Spingola et al. 1999) leaving
a bottom up approach as MudPIT in a favorable light.
After evaluation of these arguments, MudPIT emerges as a viable candidate for
complex polypeptide analysis—especially for Saccharomyces cerevisiae as a model
organism—for the foreseeable future.
A more trivial data analysis problem also arises in conjunction with shotgun ap-
proaches: the sheer scale of spectra to be searched and their computational handling.
The original Sequest Eng et al. (1994) read in input files containing information for
a single spectrum and produced an output file for every single one of those. Given
the tens of thousands of spectra a single MudPIT experiment produces, this strat-
egy taxed even industry grade UNIX file systems to their limits. For Sequest the
problem was fixed with unified input and output formats (Eng et al. 1994; Sadygov
et al. 2002; and McDonald et al. 2004), providing all spectral information from one
MudPIT step in one single file and the results inferred from it in another. J. G. was
involved in the setup of this infrastructure, which is covered in detail in appendix B
(p. 103). All spectrum matching programs in use today apply similar approaches.
1.3 Mass Spectrometric Quantification of Polypeptides
Knowing the constituents of a complex mixture of polypeptides represents valuable
information in itself, but a large group of biological problems require the identifica-
tion of differences in polypeptide representation between different biological states,
such as wildtype versus mutant or untreated versus pharmacologically manipulated.
MudPIT alone delivers excellent data on the composition of a polypeptide mixture,
12
but the issues of reproducibility discussed above render comparison of independent
MudPIT analyses for different biological states difficult (see appendix C), which
leaves MudPIT largely incompatible with so–called label–free approaches (Old et
al. 2005) to the problem of polypeptide quantification that rely either on mea-
surements and comparison of ion intensities (Bondarenko et al. 2002; Chelius and
Bondarenko 2002; and Wang et al. 2003) or spectral counting (Liu et al. 2004).
The major class of solutions to the quantification problem that remains available
is isotope or mass tag labeling (Old et al. 2005). The different approaches that can
be combined in this category follow one theme: isotopically marking the states to
be compared differentially and comparing the abundance of different forms of the
same peptide mass spectrometrically—in the same analysis, using the same column,
which implies compatibility with MudPIT despite its low reproducibility.
The first subclass in this collection includes the approaches termed ICAT (iso-
tope coded affinity tags; Gygi et al. 1999), its successor cICAT (cleavable ICAT;
Hansen et al. 2003; and Yu et al. 2004) and iTRAQ (isobaric tags for relative and
absolute quantification; Ross et al. 2004).
(c)ICAT works by mass–differential chemical derivatization of peptides on cys-
teine residues. The restriction to cysteine–containing peptides along with differen-
tial reverse–phase elution behavior of heavy and light forms (Goshe and Smith 2003;
Leitner and Lindner 2004; and Wu et al. 2006) are major criticisms facing the tech-
niques. iTRAQ overcomes the residue specificity problem by targeting amines, so
that all peptide N–termini, along with lysine side chains, are potential tag receptors.
It also enables the direct comparison of up to four samples in the same experiment—
a feat no other technique described here accomplishes. Since the tagged peptides
have the same mass independent from which of the up to four tested conditions
13
they arise, the peptide mixture complexity is not increased (all other isotope label-
ing strategies described here raise it by a factor of two), which relieves the scan
burden of the mass spectrometer (Wolff et al. 2006). However, iTRAQ requires
high mass resolution fragmentation spectra, since quantification is achieved from
small, low m/z–difference daughter ions of the fragmented linkers the peptides are
derivatized with (114, 115, 116, 117 kDa), which in turn takes a toll in the achiev-
able sequencing speed. (c)ICAT and iTRAQ share a central disadvantage: samples
to be compared using these techniques have to be prepared in parallel, indepen-
dently derivatized and then mixed, which obviously opens the door to asymmetric
processing errors.
This caveat is not present with the second subclass of isotope tag labeling tech-
niques: metabolic labeling. These approaches are based on the utilization of iso-
topically different polypeptide precursors in one of the biological samples to be
compared. Polypeptides from the tagged and untagged samples are as a result
available in vivo in mass spectrometric distinguishable populations and analytes
are prepared from mixed samples rather than in parallel.
Metabolic labeling is generally available in two flavors: SILAC–like (stable iso-
tope labeling by amino acids in cell culture; Ong et al. 2002) approaches based
on the incorporation of selected, isotopically labeled amino acids and approaches
providing solely heavy nitrogen (15N) in the form of ammonium acetate to the or-
ganism under study (Oda et al. 1999; and MacCoss et al. 2003). SILAC approaches
elegantly combine applicability to difficult model systems such as culture cells (see
acronym) with easy predictability of sister ion mass: when using arginine and lysine
as the isotopically tagged amino acids, each peptide produced by trypsin—which
hydrolyzes polypeptides specifically c–terminally of those two amino acids— will
14
carry the additional mass conferred by its c–terminal residue. Isotopically modified
amino acids are, however, very expensive and imply the problem of being rerouted
by the organisms metabolism, potentially resulting in the isotopic labeling of unin-
tended amino acids, posing problems to accurate peptide sequencing. Approaches
based on minimal diets solely providing heavy nitrogen (15N, mostly in the form
of ammonium acetate) are in comparison significantly more affordable and, since
all nitrogen atoms indiscriminately represent the heavy or light form, do not suffer
from metabolic rerouting. This makes them applicable to all systems able to grow
on minimal media (a minimal diet). Wu et al. (2004) even managed to raise a rat
(R. norwegicus) on a diet including 15N–grown algae as the only source of nitrogen.
Given the modell organism this study centers on—S. cerevisiae—and the con-
siderations above, metabolic labeling by 15N on minimal media was implemented in
the course of the work, additionally profiting from seamless integration of the ap-
propriate quantification software RelEx (MacCoss et al. 2003) in the data analysis
infrastructure consisting from Sequest (Eng et al. 1994; Sadygov et al. 2002; and
McDonald et al. 2004) and DTASelect/Contrast (Tabb et al. 2002).
1.4 MudPIT at Caltech
Motivated by the advantages of MudPIT laid out in the preceding sections, we set
out to implement the technique in a biochemistry laboratory at Caltech. MudPIT
was—and may still be—considered experimental technology and had not spread far
beyond the labs of John R. Yates III at The Scripps Research Institute (TSRI) and
Torrey Mesa Research Institute (TMRI) in La Jolla, California, where the Yates
groups were honing the technique (Washburn et al. 2001; and Wolters et al. 2001)
15
after having moved there from its birthplace at the University of Washington in
Seattle (Link et al. 1999). The main challenge in doing so was to implement the
setup without the analytical chemistry environment that had bred it: our labora-
tory had, as is to be expected for the majority of biochemistry/molecular biology
laboratories, no expertise in mass spectrometry and very little in information tech-
nology and HPLC separation, yet all three fields are required for running a MudPIT
facility. To overcome this obstacle J. G. spent 9 months in the Yates lab at TSRI,
intensely immersed in all aspects of the labs operation: sample preparation, mass
spectrometric and data analysis, as well as hardware maintenance.
Back at Caltech, we proceeded to emulate the Yates lab setup in small scale.
The setup initially consisted of
− A P–2000 LASER needle puller by Sutter Instrument Co. (Novato, CA). This
instrument is used to outfit the fused silica capillaries from which capillary chro-
matography columns are constructed (inner diameter: 100 µm) with a ≈ 5 µm
diameter tip required for electrospray ionization and chromatography matrix
retention.
− Two capillary chromatography column packing stations. These stainless steel
pressure vessels, which were produced in–house according to drawings provided
by the Yates lab, utilize helium pressures of up to 7 × 10⁶ N/m2 to pack chro-
matography matrices into tipped capillary chromatography columns and after
equilibration load sample onto the finished columns.
− ThermoElectron’s DecaXP+ ion trap mass spectrometer for spectrometric analy-
sis of sample peptides eluted from MudPIT columns.
− An HP–1100 HPLC pump and solvent degasser combination with four solvent
16
channels by Agilent (Palo Alto, CA). The extremely low flow rates used by Mud-
PIT (100 nl/min and less) in combination with the required solvent gradients
between low and high organic solvents with preceding salt bumps cannot be
delivered by standard HPLC pumps. The HP–1100 system is therefore used at
100 µl/min and interfaces to the mass spectrometer via
− A custom capillary column electrospray ionization source, which splits the col-
umn flow (100 nl/min) from the pump–delivered solvent flow (100 µl/min). The
source also provides a liquid phase/voltage junction, applying the 2.4 kV elec-
trospray ionization voltage to the waste arm of the split flow, which prevents
gas bubbles resulting from electrochemistry on the electrode from entering the
capillary chromatography column. The original design for this ionization source
was also provided by the Yates lab and the source manufactured in–house.
− A Linux cluster for data analysis. The cluster consists from twenty 1.8 GHz
RS–1200 computation nodes, provided by Verari Systems (formerly RackSaver,
San Diego, CA). Mass spectrometric data is transferred to a central file server
and undergoes charge state analysis as well as data quality filtration by 2to3
(Sadygov et al. 2002). Sequest search jobs using unified input and output for-
mats (Eng et al. 1994; Sadygov et al. 2002; and McDonald et al. 2004) can than
be queued on the cluster, using GridEngine (http://gridengine.sunsource.net/).
The queuing mechanism as well as user account dependence are significant en-
hancements in comparison with the original Yates lab setup, where all members
logged on as one user to execute Sequest, verbal agreements were necessary
concerning how many jobs to run at one time and manual checking of running
processes with low–level system commands provided the only handle on avail-
able slots. In order to coerce the experimental Sequest binary provided by
17
the Yates lab through a collaboration (Graumann et al. 2004) into conforming
to the requirements of this system, GNU screen (http://www.gnu.org/software
/screen/) has to be used to mimic a terminal interactively open to the binary—
on the original setup remote users had to leave a terminal open on the computer
they were acessing the cluster from. After Sequest analysis on the cluster, data
filtration and annotation is performed by DTASelect (Tabb et al. 2002) on the
fileserver and the results are immediately available for browsing through a html
interface from the outside.
The MudPIT setup was later enhanced by the acquisition of ThermoElectron’s
next generation ion trap mass spectrometer: the LTQ linear ion trap instrument
(Blackler et al. 2006). This instruments provides much higher scan rates as well as
higher sensitivity and better signal–to–noise ratios due to a bigger ion capacity of
the trap. It interfaces to a Surveyor four solvent channel HPLC pump (Thermo-
Electron, Waltham, MA) and a MicroAS autosampler (ThermoElectron, Waltham,
MA). In this setup the HPLC pump only provides the low to high organic solvent
gradients specific to the reverse phase parts of a MudPIT column, while the salt
bumps necessary to elute subsets of peptides from the SCX phase are provided by in-
jection of defined volumes and concentrations through the autosampler—potentially
delivering much sharper salt peaks. Beyond that, quantitative mass spectrometric
polypeptide analysis via metabolic incorporation of 15N and the program RelEx
(MacCoss et al. 2003) have been included as well.
To test the MudPIT setup established, we proceeded to analyze a diverse collec-
tion of affinity purified polypeptide complexes using baits mainly involved in cell
cycle progression and transcription in the yeast Saccharomyces cerevisiae (Grau-
18
mann et al. 2004). This pilot study, which represents the core of this thesis, is
documented in detail in chapter 2 (p. 28). The ORFs (open reading frames) to be
studied were chromosomally tagged with a tandem affinity purification tag (TAP
tag) analogous the the pioneering construct by Rigaut et al. (1999) and purified
under native conditions from whole cell extract. Twentytwo out of 26 attempted
chromosomal taggings succeeded. The study revealed 102 previously known and 279
potential new physical interactions to the set of tagged gene products. It includes
among other things the characterization of a new subunit of the intensely studied
Swi/Snf (Fry and Peterson 2001) and RSC (Sanders et al. 2002; Damelin et al. 2002;
and Cairns et al. 1998) chromatin remodelling complexes. MudPIT proved mature
enough for migration into less specialized environments and presented immediately
new insights into systems extensively studied with more traditional techniques.
The technique has consequently been applied to a variety of problems linked with
moderately complex polypeptide mixtures as delivered by affinity purified protein
complexes. Appendices A (p. 67) and D (p. 153) present two such examples in
detail.
We have also extended the use of MudPIT—in the spirit of Washburn et al.
(2001), who analyzed whole cell lysates from S. cerevisiae by MudPIT—to much
more complex mixtures with low abundant components. Appendix C (p. 121)
presents an example for this with the analysis of affinity purified multiubiquitin
conjugates from whole cell lysate.
19
1.5 References
Abian, J., Oosterkamp, A. J. and Gelpi, E. (1999). Comparison of conventional,
narrow-bore and capillary liquid chromatography/mass spectrometry for elec-
trospray ionization mass spectrometry: Practical considerations. J Mass Spec-
trom, 34(4):244–54.
Alberts, B. (1998). The cell as a collection of protein machines: preparing the next
generation of molecular biologists. Cell, 92(3):291–4.
Blackler, A. R., Klammer, A. A., MacCoss, M. J. and Wu, C. C. (2006). Quanti-
tative comparison of proteomic data quality between a 2D and 3D quadrupole
ion trap. Anal Chem, 78(4):1337–44.
Bondarenko, P. V., Chelius, D. and Shaler, T. A. (2002). Identification and rela-
tive quantitation of protein mixtures by enzymatic digestion followed by cap-
illary reversed–phase liquid chromatography–tandem mass spectrometry. Anal
Chem, 74(18):4741–9.
Cairns, B. R., Erdjument-Bromage, H., Tempst, P., Winston, F. and Kornberg,
R. D. (1998). Two actin–related proteins are shared functional components of
the chromatin–remodeling complexes RSC and SWI/SNF. Mol Cell, 2(5):639–
51.
Chelius, D. and Bondarenko, P. V. (2002). Quantitative profiling of proteins in
complex mixtures using liquid chromatography and mass spectrometry. J Pro-
teome Res, 1(4):317–23.
Cherry, J. M., Adler, C., Ball, C., Chervitz, S. A. and Dwight, S. S. et al. (1998).
SGD: Saccharomyces genome database. Nucleic Acids Res, 26(1):73–9.
20
Craig, R. and Beavis, R. C. (2004). TANDEM: Matching proteins with tandem
mass spectra. Bioinformatics, 20(9):1466–7.
Creighton, T. E. (1993). Proteins, Structures and Molecular Properties. W. H.
Freemann and Company, New York, 2nd edition.
Damelin, M., Simon, I., Moy, T. I., Wilson, B. and Komili, S. et al. (2002).
The genome–wide localization of Rsc9, a component of the RSC chromatin–
remodeling complex, changes in response to stress. Mol Cell, 9(3):563–73.
Edman, P. (1949). A method for the determination of the amino acid sequence in
peptides. Arch Biochem, 22(3):475–476.
Eng, J. K., McCormack, A. L. and Yates III, J. R. (1994). An approach to correlate
tandem mass–spectral data of peptides with amino–acid sequences in a protein
database. J Am Soc Mass Spectr, 5(11):976–989.
Fenn, J. B., Mann, M., Meng, C. K., Wong, S. F. and Whitehouse, C. M. (1989).
Electrospray ionization for mass spectrometry of large biomolecules. Science,
246(4926):64–71.
Fry, C. J. and Peterson, C. L. (2001). Chromatin remodeling enzymes: Who’s on
first?. Curr Biol, 11(5):R185–97.
Gavin, A. C., Aloy, P., Grandi, P., Krause, R. and Boesche, M. et al. (2006).
Proteome survey reveals modularity of the yeast cell machinery. Nature,
440(7084):631–636.
Gavin, A. C., Bosche, M., Krause, R., Grandi, P. and Marzioch, M. et al. (2002).
Functional organization of the yeast proteome by systematic analysis of protein
complexes. Nature, 415(6868):141–7.
Godovac-Zimmermann, J., Kleiner, O., Brown, L. R. and Drukier, A. K. (2005).
Perspectives in spicing up proteomics with splicing. Proteomics, 5(3):699–709.
21
Goshe, M. B. and Smith, R. D. (2003). Stable isotope–coded proteomic mass spec-
trometry. Curr Opin Biotechnol, 14(1):101–9.
Gott, J. M. and Emeson, R. B. (2000). Functions and mechanisms of RNA editing.
Annu Rev Genet, 34:499–531.
Graumann, J., Dunipace, L. A., Seol, J. H., McDonald, W. H. and Yates III, J. R.
et al. (2004). Applicability of tandem affinity purification MudPIT to pathway
proteomics in yeast. Mol Cell Proteomics, 3(3):226–37.
Griffin, E. E., Graumann, J. and Chan, D. C. (2005). The WD40 protein Caf4p
is a component of the mitochondrial fission machinery and recruits Dnm1p to
mitochondria. J Cell Biol, 170(2):237–48.
Gygi, S. P., Rist, B., Gerber, S. A., Turecek, F. and Gelb, M. H. et al. (1999).
Quantitative analysis of complex protein mixtures using isotope–coded affinity
tags. Nat Biotechnol, 17(10):994–9.
Hansen, K. C., Schmitt-Ulms, G., Chalkley, R. J., Hirsch, J. and Baldwin, M. A. et
al. (2003). Mass spectrometric analysis of protein mixtures at low levels using
cleavable 13C–isotope–coded affinity tag and multidimensional chromatogra-
phy. Mol Cell Proteomics, 2(5):299-314.
Henzel, W. J., Billeci, T. M., Stults, J. T., Wong, S. C. and Grimley, C. et al. (1993).
Identifying proteins from two–dimensional gels by molecular mass searching of
peptide fragments in protein sequence databases. Proc Natl Acad Sci USA,
90(11):5011–5.
Hunt, D. F., Yates III, J. R., Shabanowitz, J., Winston, S. and Hauer, C. R. (1986).
Protein sequencing by tandem mass spectrometry. Proc Natl Acad Sci USA,
83(17):6233–7.
22
James, P., Quadroni, M., Carafoli, E. and Gonnet, G. (1993). Protein identification
by mass profile fingerprinting. Biochem Biophys Res Commun, 195(1):58–64.
Jonscher, K. R. and Yates III, J. R. (1997). The quadrupole ion trap mass
spectrometer—a small solution to a big challenge. Anal Biochem, 244(1):1–
15.
Karas, M. and Hillenkamp, F. (1988). Laser desorption ionization of proteins with
molecular masses exceeding 10,000 daltons. Anal Chem, 60(20):2299–301.
Klose, J. (1975). Protein mapping by combined isoelectric focusing and elec-
trophoresis of mouse tissues. A novel approach to testing for induced point
mutations in mammals. Humangenetik, 26(3):231–43.
Laemmli, U. K. (1970). Cleavage of structural proteins during the assembly of the
head of bacteriophage T4. Nature, 227(5259):680–5.
Larsen, M. R., Larsen, P. M., Fey, S. J. and Roepstorff, P. (2001). Characterization
of differently processed forms of enolase 2 from Saccharomyces cerevisiae by
two-dimensional gel electrophoresis and mass spectrometry. Electrophoresis,
22(3):566–75.
Leitner, A. and Lindner, W. (2004). Current chemical tagging strategies for pro-
teome analysis by mass spectrometry. J Chromatogr B Analyt Technol Biomed
Life Sci, 813(1–2):1–26.
Link, A. J., Eng, J., Schieltz, D. M., Carmack, E. and Mize, G. J. et al. (1999).
Direct analysis of protein complexes using mass spectrometry. Nat Biotechnol,
17(7):676–82.
Liu, H., Sadygov, R. G. and Yates III, J. R. (2004). A model for random sampling
and estimation of relative protein abundance in shotgun proteomics. Anal
Chem, 76(14):4193–201.
23
Lundell, N. and Markides, K. (1992). Two–dimensional liquid chromatography of
peptides: An optimization strategy. Chromatographia, 34(5–8):369–375.
MacCoss, M. J., Wu, C. C., Liu, H., Sadygov, R. and Yates III, J. R. (2003).
A correlation algorithm for the automated quantitative analysis of shotgun
proteomics data. Anal Chem, 75(24):6912–21.
Mann, M., Hojrup, P. and Roepstorff, P. (1993). Use of mass spectrometric molec-
ular weight information to identify proteins in sequence databases. Biol Mass
Spectrom, 22(6):338–45.
Mayor, T., Lipford, J., Graumann, J., Smith, G. and Deshaies, R. (2005). Analy-
sis of polyubiquitin conjugates reveals that the rpn10 substrate receptor con-
tributes to the turnover of multiple proteasome targets. Mol Cell Proteomics,
4(6):741–51.
McDonald, W. H., Ohi, R., Miyamoto, D. T., Mitchison, T. J. and Yates III,
J. R. (2002). Comparison of three directly coupled hplc ms/ms strategies for
identification of proteins from complex mixtures: Single–dimension lc–ms/ms,
2–phase mudpit, and 3–phase mudpit. Int J Mass Spectrom, 219(1):245–251.
McDonald, W. H., Tabb, D. L., Sadygov, R. G., MacCoss, M. J. and Venable, J.
et al. (2004). MS1, MS2, and SQT—three unified, compact, and easily parsed
file formats for the storage of shotgun proteomic spectra and identifications.
Rapid Commun Mass Spectrom, 18(18):2162–2168.
Nesvizhskii, A. I. and Aebersold, R. (2005). Interpretation of shotgun proteomic
data: The protein inference problem. Mol Cell Proteomics, 4(10):1419–40.
O’Farrell, P. H. (1975). High resolution two–dimensional electrophoresis of proteins.
J Biol Chem, 250(10):4007–21.
24
Oda, Y., Huang, K., Cross, F. R., Cowburn, D. and Chait, B. T. (1999). Accurate
quantitation of protein expression and site–specific phosphorylation. Proc Natl
Acad Sci USA, 96(12):6591–6.
Old, W. M., Meyer-Arendt, K., Aveline-Wolf, L., Pierce, K. G. and Mendoza, A. et
al. (2005). Comparison of label–free methods for quantifying human proteins
by shotgun proteomics. Mol Cell Proteomics, 4(10):1487–502.
Olsen, J. V., de Godoy, L. M., Li, G., Macek, B. and Mortensen, P. et al. (2005).
Parts per million mass accuracy on an Orbitrap mass spectrometer via lock
mass injection into a C–trap. Mol Cell Proteomics, 4(12):2010–21.
Olsen, J. V., Ong, S. E. and Mann, M. (2004). Trypsin cleaves exclusively C–
terminal to arginine and lysine residues. Mol Cell Proteomics, 3(6):608–14.
Ong, S. E., Blagoev, B., Kratchmarova, I., Kristensen, D. B. and Steen, H. et al.
(2002). Stable isotope labeling by amino acids in cell culture, SILAC, as a
simple and accurate approach to expression proteomics. Mol Cell Proteomics,
1(5):376–86.
Pappin, D. J., Hojrup, P. and Bleasby, A. J. (1993). Rapid identification of proteins
by peptide–mass fingerprinting. Curr Biol, 3(6):327–32.
Perkins, D. N., Pappin, D. J., Creasy, D. M. and Cottrell, J. S. (1999). Probability-
based protein identification by searching sequence databases using mass spec-
trometry data. Electrophoresis, 20(18):3551–67.
Rigaut, G., Shevchenko, A., Rutz, B., Wilm, M. and Mann, M. et al. (1999). A
generic protein purification method for protein complex characterization and
proteome exploration. Nat Biotechnol, 17(10):1030–2.

25
Ross, P. L., Huang, Y. N., Marchese, J. N., Williamson, B. and Parker, K. et al.
(2004). Multiplexed protein quantitation in Saccharomyces cerevisiae using
amine–reactive isobaric tagging reagents. Mol Cell Proteomics, 3(12):1154–69.
Sadygov, R. G., Eng, J., Durr, E., Saraf, A. and McDonald, H. et al. (2002).
Code developments to improve the efficiency of automated MS/MS spectra
interpretation. J Proteome Res, 1(3):211–5.
Sanders, S. L., Jennings, J., Canutescu, A., Link, A. J. and Weil, P. A. (2002).
Proteomics of the eukaryotic transcription machinery: identification of pro-
teins associated with components of yeast TFIID by multidimensional mass
spectrometry. Mol Cell Biol, 22(13):4723–38.
Shevchenko, A., Chernushevic, I., Shevchenko, A., Wilm, M. and Mann, M. (2002).
“De novo” sequencing of peptides recovered from in-gel digested proteins by
nanoelectrospray tandem mass spectrometry. Mol Biotechnol, 20(1):107–18.
Spengler, B., Kirsch, D., Kaufmann, R. and Jaeger, E. (1992). Peptide sequencing
by matrix–assisted laser–desorption mass spectrometry. Rapid Commun Mass
Spectrom, 6(2):105–8.
Spingola, M., Grate, L., Haussler, D. and Ares Jr., M. (1999). Genome–wide bioin-
formatic and molecular analysis of introns in saccharomyces cerevisiae. RNA,
5(2):221–34.
Steen, H. and Mann, M. (2004). The ABC’s (and XYZ’s) of peptide sequencing.
Nat Rev Mol Cell Biol, 5(9):699–711.
Storz, G. (2002). An expanding universe of noncoding RNAs. Science,
296(5571):1260–3.
26
Tabb, D. L., McDonald, W. H. and Yates III, J. R. (2002). DTASelect and Con-
trast: Tools for assembling and comparing protein identifications from shotgun
proteomics. J Proteome Res, 1(1):21–6.
Takahashi, N., Ishioka, N., Takahashi, Y. and Putnam, F. W. (1985). Automated
tandem high–performance liquid chromatographic system for separation of ex-
tremely complex peptide mixtures. J Chromatogr, 326:407–18.
Verma, R., Oania, R., Graumann, J. and Deshaies, R. J. (2004). Multiubiqui-
tin chain receptors define a layer of substrate selectivity in the ubiquitin–
proteasome system. Cell, 118(1):99–110.
Wang, W., Zhou, H., Lin, H., Roy, S. and Shaler, T. A. et al. (2003). Quantification
of proteins and metabolites by mass spectrometry without isotopic labeling or
spiked standards. Anal Chem, 75(18):4818–26.
Washburn, M. P., Wolters, D. and Yates III, J. R. (2001). Large–scale analysis of
the yeast proteome by multidimensional protein identification technology. Nat
Biotechnol, 19(3):242–7.
Wolff, S., Otto, A., Albrecht, D., Stahl Zeng, J. and Buttner, K. et al. (2006).
Gel–free and gel–based proteomics in Bacillus subtilis: A comparative study.
Mol Cell Proteomics.
Wolters, D. A., Washburn, M. P. and Yates III, J. R. (2001). An automated mul-
tidimensional protein identification technology for shotgun proteomics. Anal
Chem, 73(23):5683–90.
Wu, C. C., MacCoss, M. J., Howell, K. E., Matthews, D. E. and Yates III, J. R.
(2004). Metabolic labeling of mammalian organisms with stable isotopes for
quantitative proteomic analysis. Anal Chem, 76(17):4951–9.
27
Wu, W. W., Wang, G., Baek, S. J. and Shen, R. F. (2006). Comparative study of
three proteomic quantitative methods, DIGE, cICAT, and iTRAQ, using 2D
gel– or LC–MALDI TOF/TOF. J Proteome Res, 5(3):651–8.
Wysocki, V. H., Resing, K. A., Zhang, Q. and Cheng, G. (2005). Mass spectrometry
of peptides and proteins. Methods, 35(3):211–22.
Xie, J., Miao, Y., Shih, J., Tai, Y. C. and Lee, T. D. (2005). Microfluidic platform
for liquid chromatography-tandem mass spectrometry analyses of complex pep-
tide mixtures. Anal Chem, 77(21):6947–53.
Yates III, J. R., Speicher, S., Griffin, P. R. and Hunkapiller, T. (1993). Peptide mass
maps: A highly informative approach to protein identification. Anal Biochem,
214(2):397–408.
Yu, L. R., Conrads, T. P., Uo, T., Issaq, H. J. and Morrison, R. S. et al. (2004).
Evaluation of the acid–cleavable isotope-coded affinity tag reagents: Applica-
tion to camptothecin–treated cortical neurons. J Proteome Res, 3(3):469–77.