Embed Size (px)
Citation preview
Implementation of Management information system in Ukraine
.
PATH Project team “TB Control partnership in Ukraine”
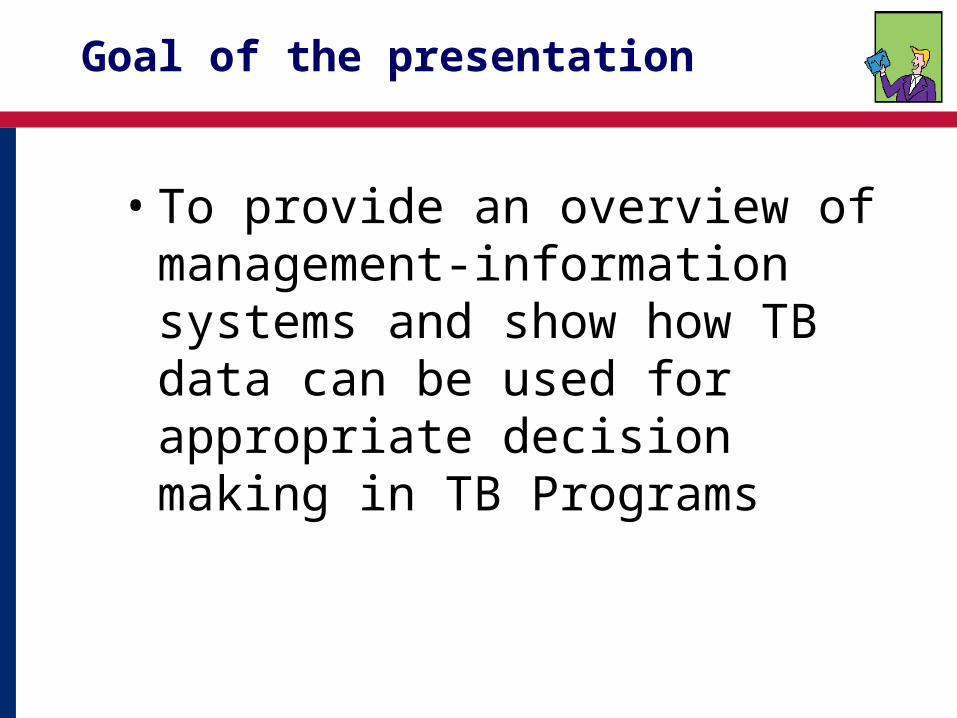
• To provide an overview of management-information systems and show how TB data can be used for appropriate decision making in TB Programs
Goal of the presentation
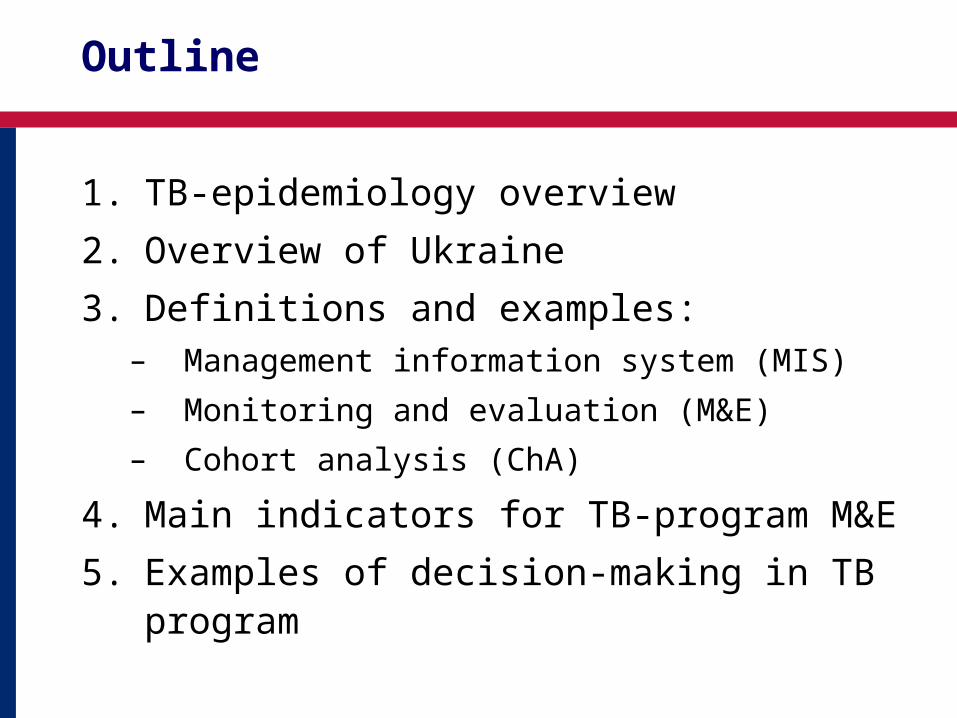
Outline
1. TB-epidemiology overview
2. Overview of Ukraine
3. Definitions and examples:– Management information system (MIS)
– Monitoring and evaluation (M&E)
– Cohort analysis (ChA)
4. Main indicators for TB-program M&E
5. Examples of decision-making in TB program
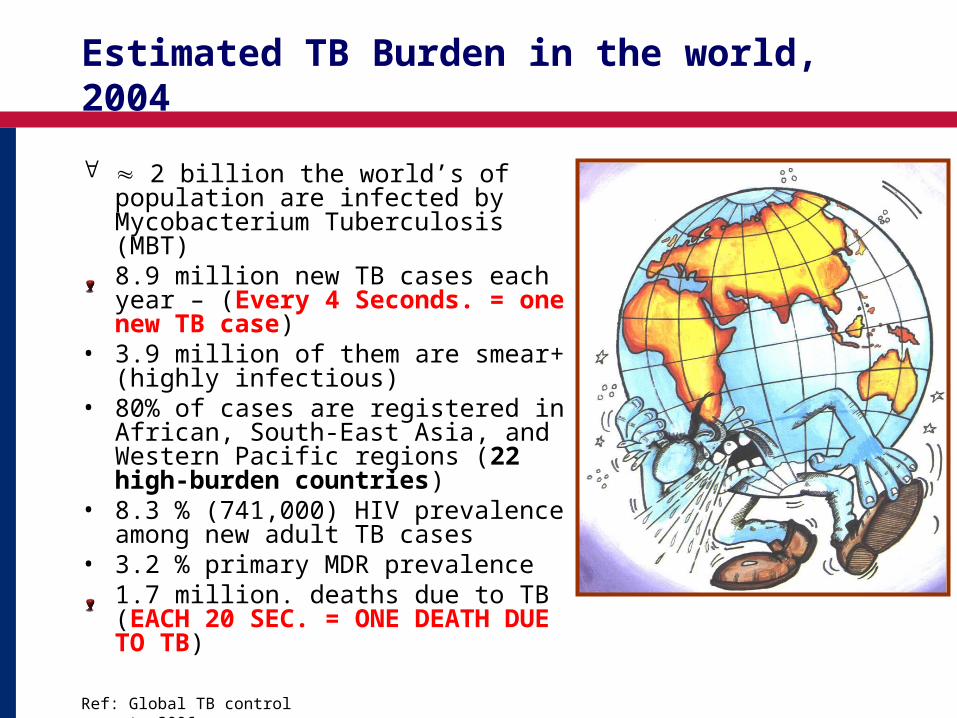
2 billion the world’s of population are infected by Mycobacterium Tuberculosis (MBT)8.9 million new TB cases each year – (Every 4 Seconds. = one new TB case)
• 3.9 million of them are smear+ (highly infectious)
• 80% of cases are registered in African, South-East Asia, and Western Pacific regions (22 high-burden countries)
• 8.3 % (741,000) HIV prevalence among new adult TB cases
• 3.2 % primary MDR prevalence1.7 million. deaths due to TB (EACH 20 SEC. = ONE DEATH DUE TO TB)
Estimated TB Burden in the world, 2004
Ref: Global TB control report, 2006
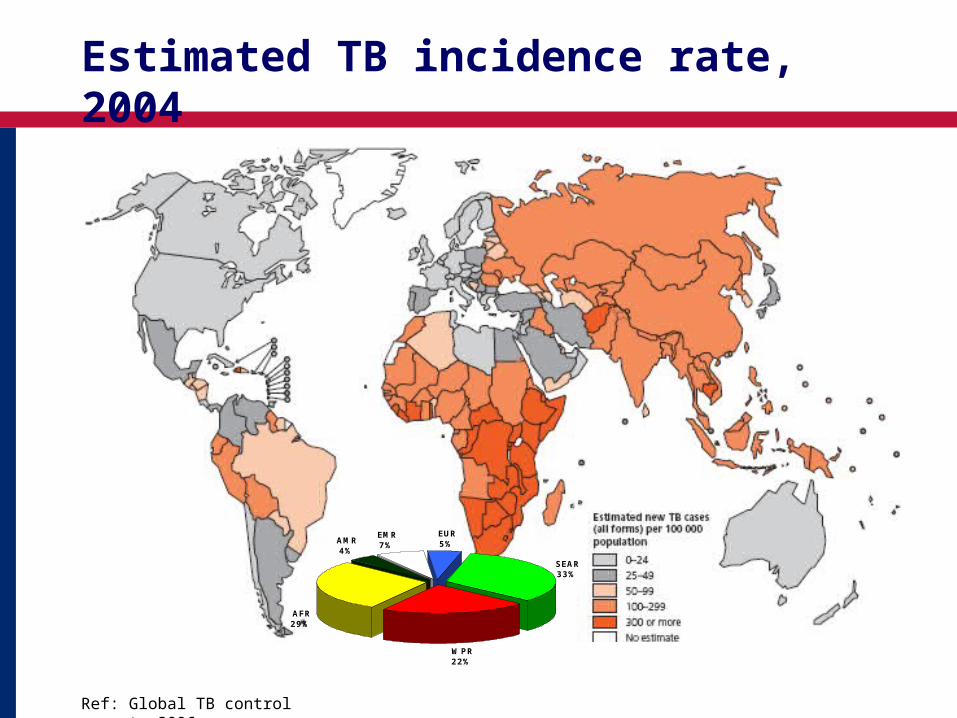
Estimated TB incidence rate, 2004
Ref: Global TB control report, 2006
AFR29%
AMR4%
EMR7%
EUR5%
SEAR33%
WPR22%
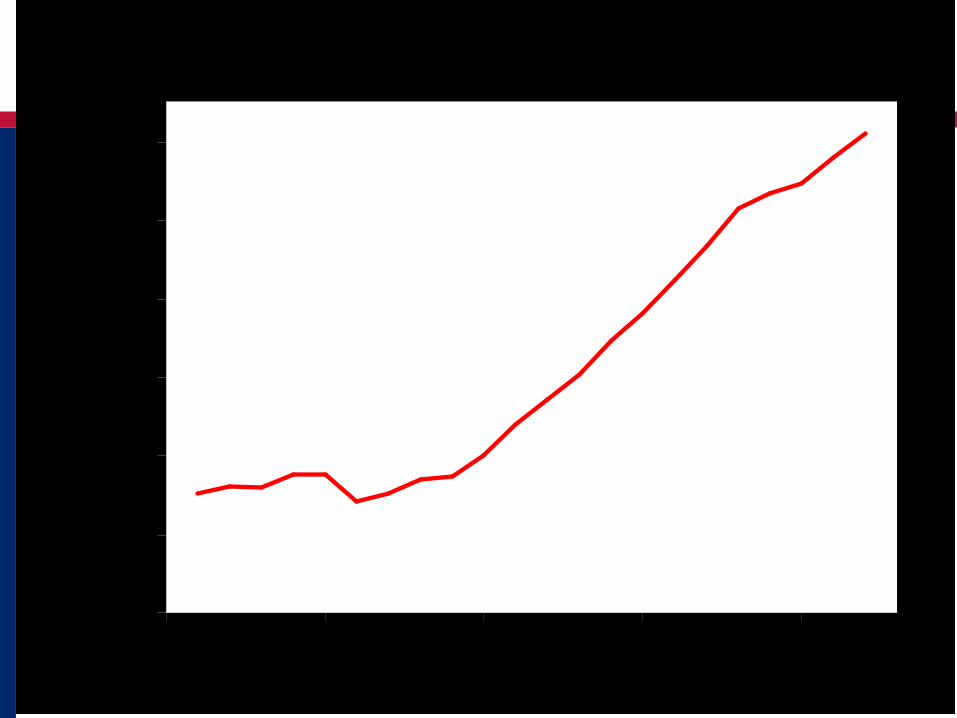
Growth of TB in Africa and Eastern Europe
0
50
100
150
200
250
300
1980 1985 1990 1995 2000
Sta
nd
ard
ize
d n
oti
fic
ati
on
ra
te
Africa - high HIV
Eastern Europe
Africa - low HIV
v
Ref: Global TB control report, 2006
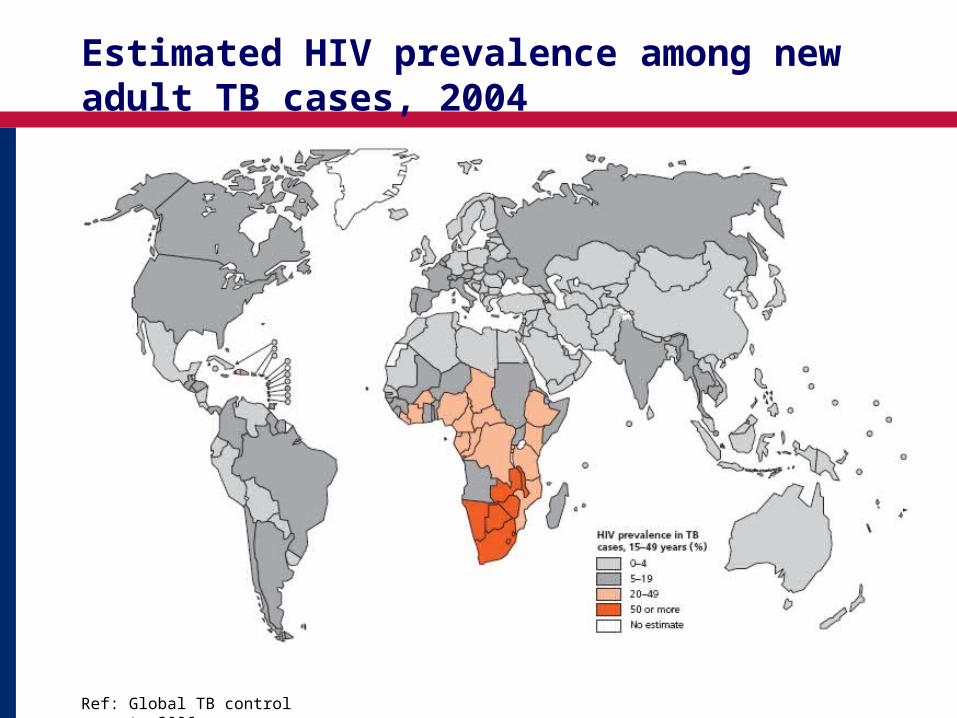
Estimated HIV prevalence among new adult TB cases, 2004
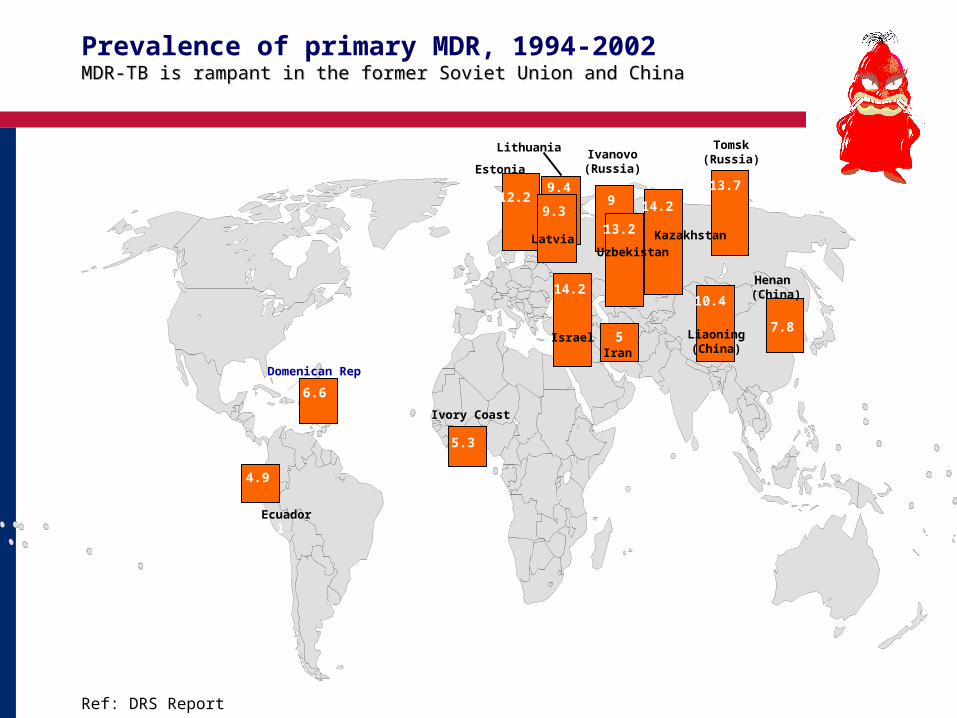
Ref: DRS Report
9.4Estonia
Ivanovo(Russia)
Latvia
Henan (China)
Iran
Liaoning(China)
Domenican Rep
3.1
57.8
10.4
99.3
12.2
Tomsk(Russia)
13.7
Israel
14.2
6.6
5.3
Ivory Coast
4.9
Ecuador
14.2
14.2
Kazakhstan13.2
Uzbekistan
Lithuania
Prevalence of primary MDR, 1994-2002MDR-TB is rampant in the former Soviet Union and ChinaMDR-TB is rampant in the former Soviet Union and China
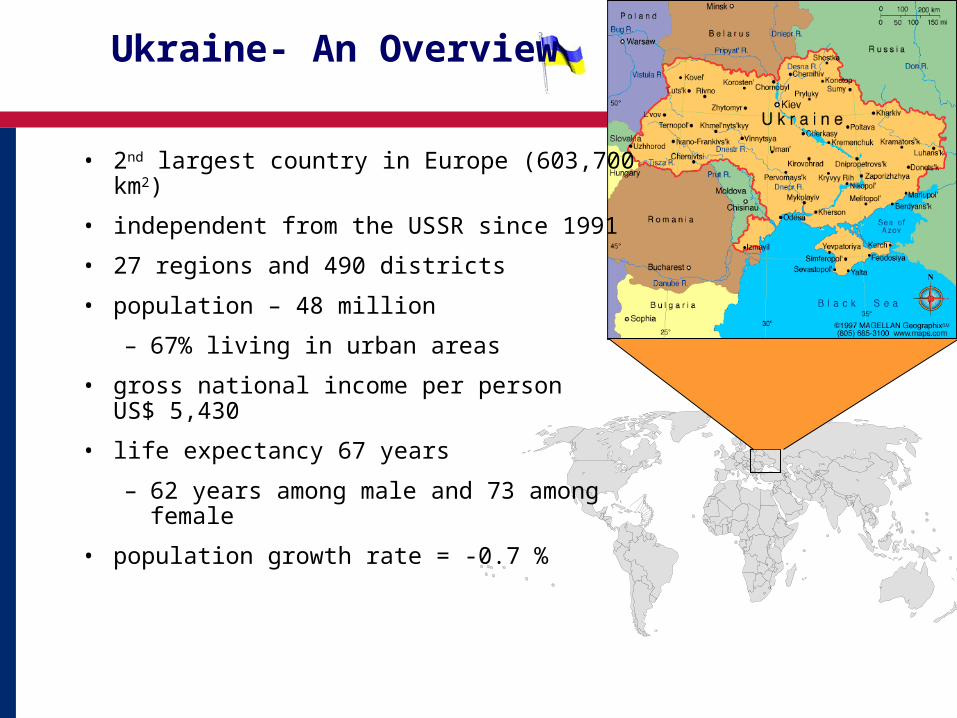
Ukraine- An Overview
• 2nd largest country in Europe (603,700 km2)
• independent from the USSR since 1991
• 27 regions and 490 districts
• population – 48 million
– 67% living in urban areas
• gross national income per person US$ 5,430
• life expectancy 67 years
– 62 years among male and 73 among female
• population growth rate = -0.7 %
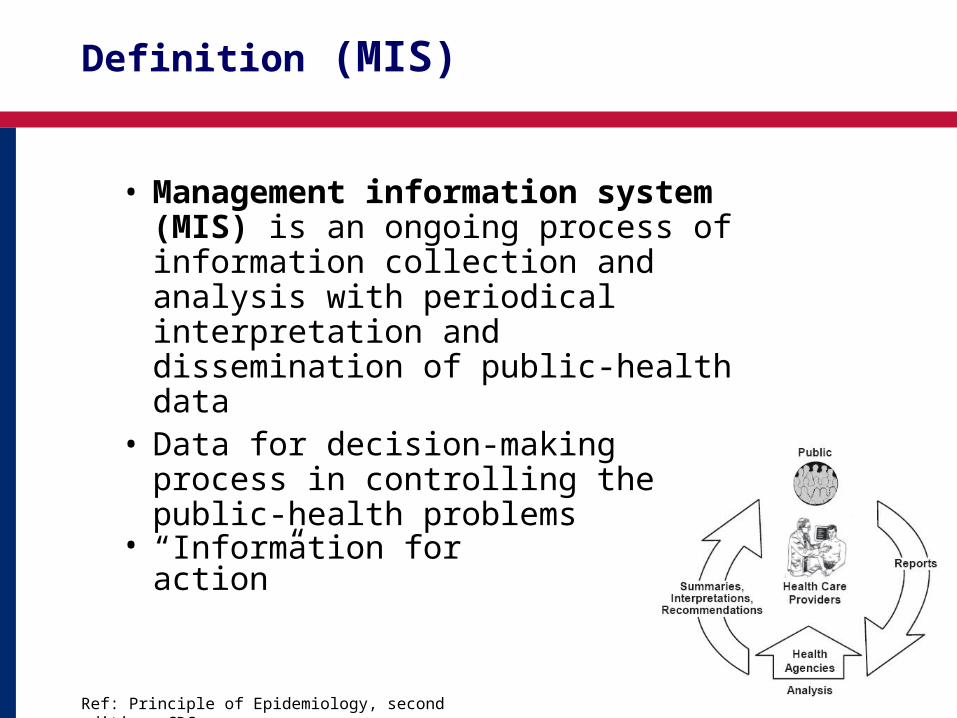
Definition (MIS)
• Management information system (MIS) is an ongoing process of information collection and analysis with periodical interpretation and dissemination of public-health data
• Data for decision-making process in controlling the public-health problems
• “Information for action”
Ref: Principle of Epidemiology, second edition, CDC
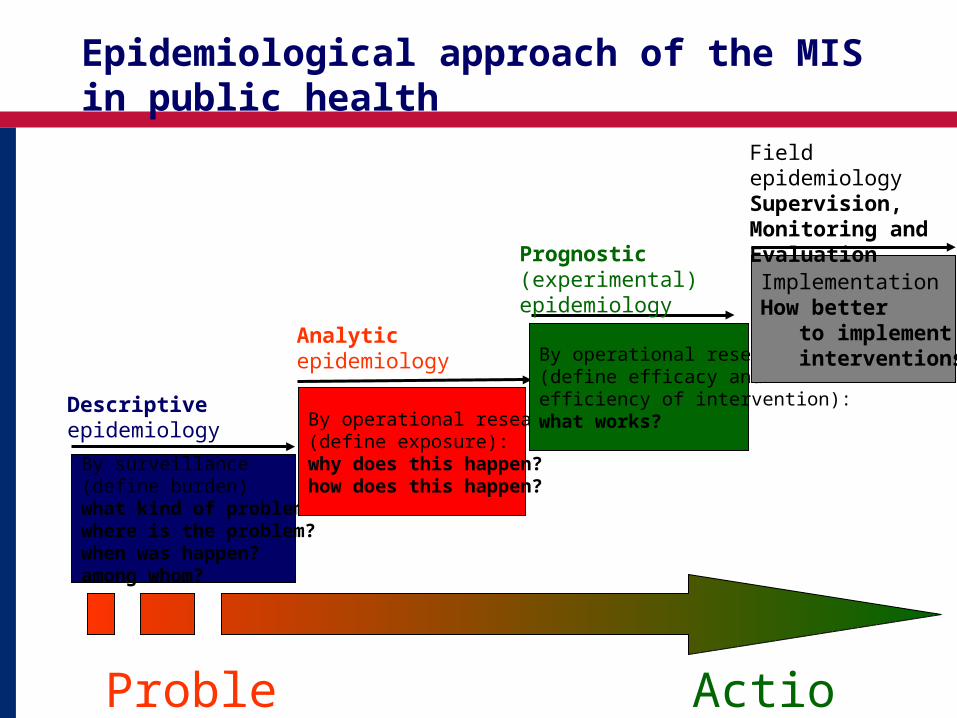
Epidemiological approach of the MIS in public health
Problem Action
By surveillance (define burden)what kind of problem?where is the problem?when was happen?among whom?
Descriptiveepidemiology By operational research
(define exposure):why does this happen? how does this happen?
Analytic epidemiology By operational research
(define efficacy and efficiency of intervention):what works?
Prognostic(experimental) epidemiology
Implementation :How better to implement interventions?
Field epidemiologySupervision, Monitoring and Evaluation
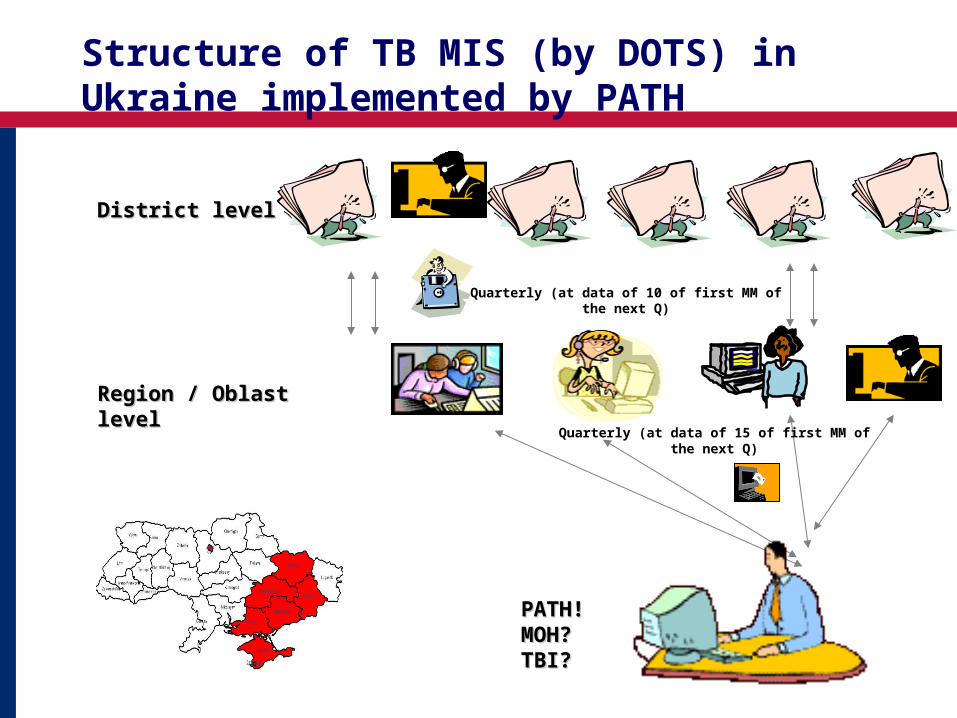
PATH!PATH!MOH? MOH? TBI?TBI?
Region / Oblast levelRegion / Oblast level
Quarterly (at data of 10 of first MM of the next Q)
District levelDistrict level
Structure of TB MIS (by DOTS) in Ukraine implemented by PATH
Quarterly (at data of 15 of first MM of the next Q)
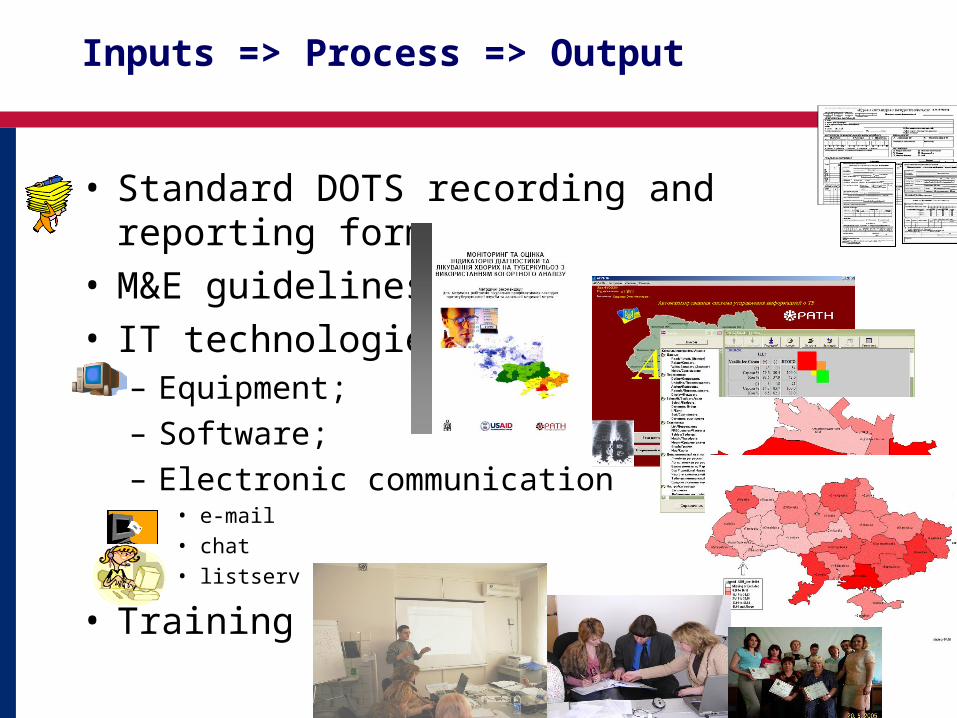
• Standard DOTS recording and reporting forms
• M&E guidelines• IT technologies
– Equipment; – Software; – Electronic communication
• e-mail• chat• listserv
• Training
Inputs => Process => Output
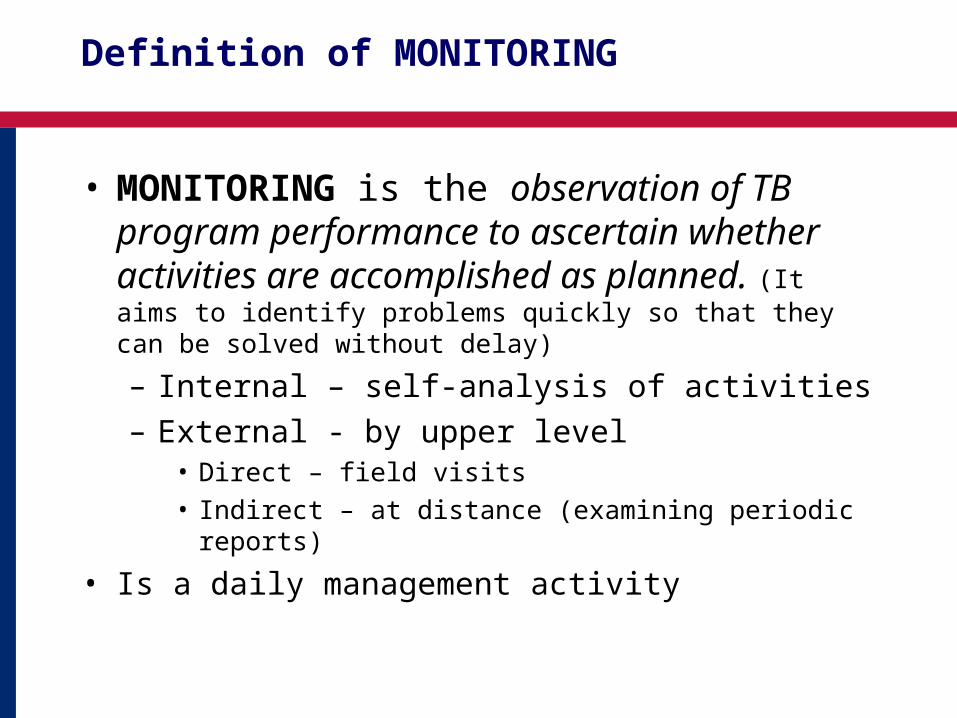
Definition of MONITORING
• MONITORING is the observation of TB program performance to ascertain whether activities are accomplished as planned. (It aims to identify problems quickly so that they can be solved without delay)
– Internal – self-analysis of activities – External - by upper level
• Direct – field visits• Indirect – at distance (examining periodic reports)
• Is a daily management activity
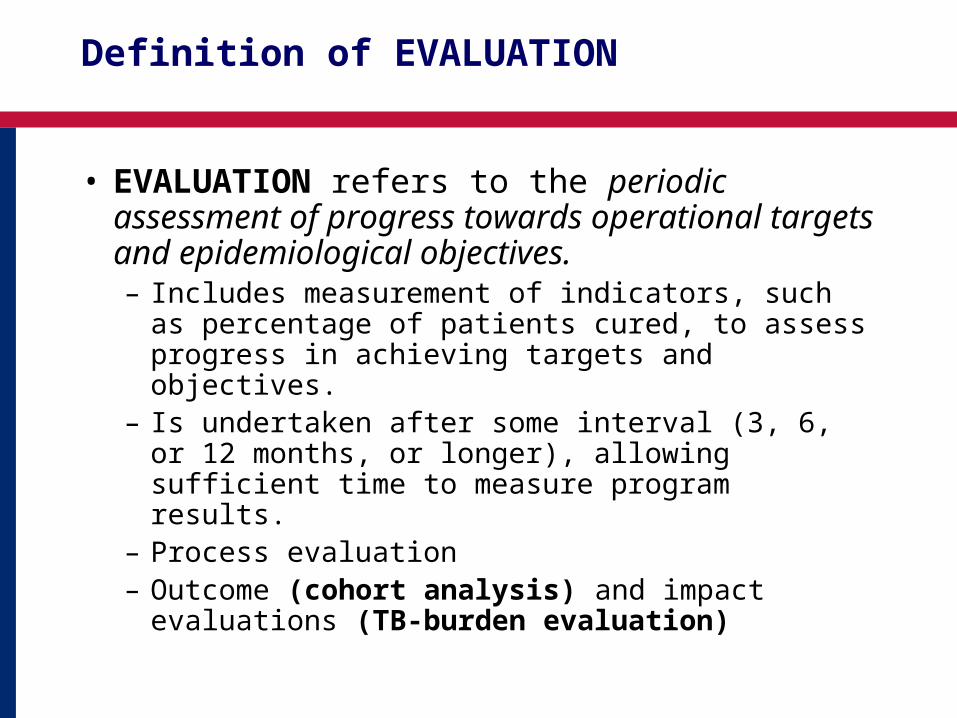
Definition of EVALUATION
• EVALUATION refers to the periodic assessment of progress towards operational targets and epidemiological objectives.– Includes measurement of indicators, such as
percentage of patients cured, to assess progress in achieving targets and objectives.
– Is undertaken after some interval (3, 6, or 12 months, or longer), allowing sufficient time to measure program results.
– Process evaluation – Outcome (cohort analysis) and impact
evaluations (TB-burden evaluation)
Definition: COHORT ANALYSIS
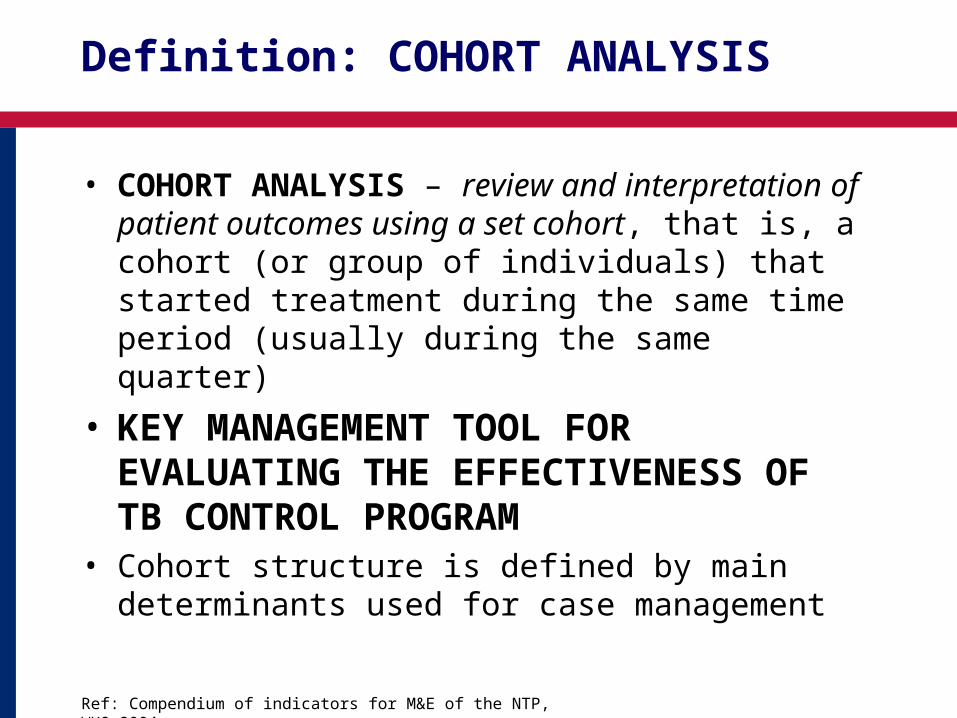
• COHORT ANALYSIS – review and interpretation of patient outcomes using a set cohort, that is, a cohort (or group of individuals) that started treatment during the same time period (usually during the same quarter)
• KEY MANAGEMENT TOOL FOR EVALUATING THE EFFECTIVENESS OF TB CONTROL PROGRAM
• Cohort structure is defined by main determinants used for case management
Ref: Compendium of indicators for M&E of the NTP, WHO 2004
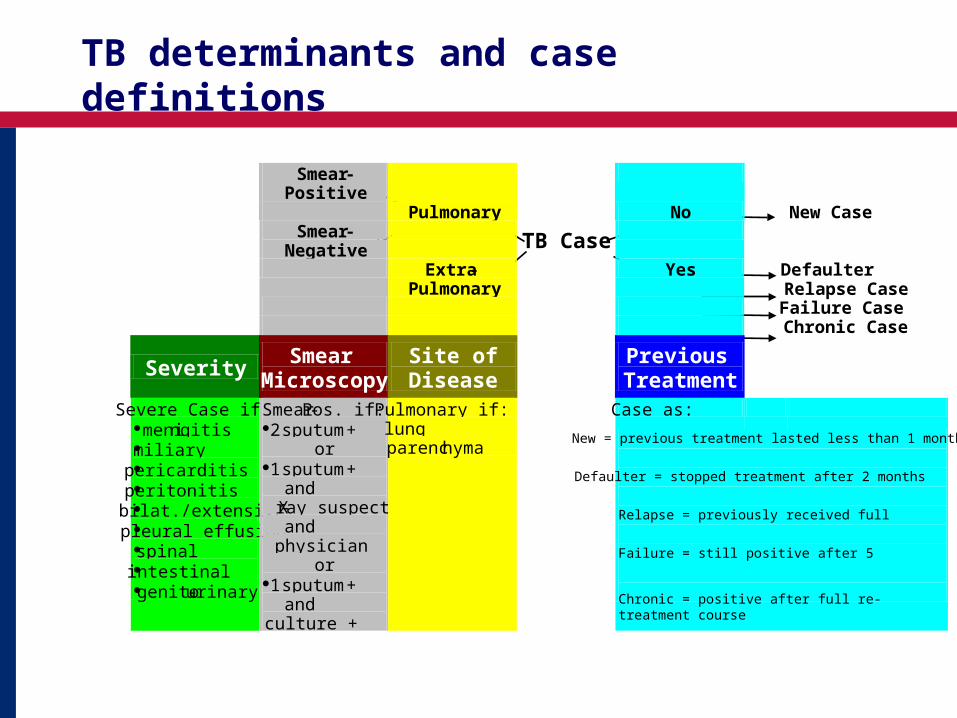
TB determinants and case definitions
Smear- Positive
Pulmonary No New Case Smear-
Negative TB Case
Extra- Pulmonary
Yes
Defaulter Relapse Case Failure Case Chronic Case
Severity Smear
Microscopy Site of
Disease
Previous Treatment
Case as: Severe Case if: meningitis miliary pericarditis peritonitis bilat./extensive pleural effusion spinal intestinal genito-urinary
Smear-Pos. if: 2 sputum +
or 1 sputum + and X-ray suspect and physician
or 1 sputum + and culture +
Pulmonary if: lung parenchyma New = previous treatment lasted less than 1 month
Defaulter = stopped treatment after 2 months Relapse = previously received full treatment and was cured
Failure = still positive after 5 months of treatment Chronic = positive after full re-treatment course
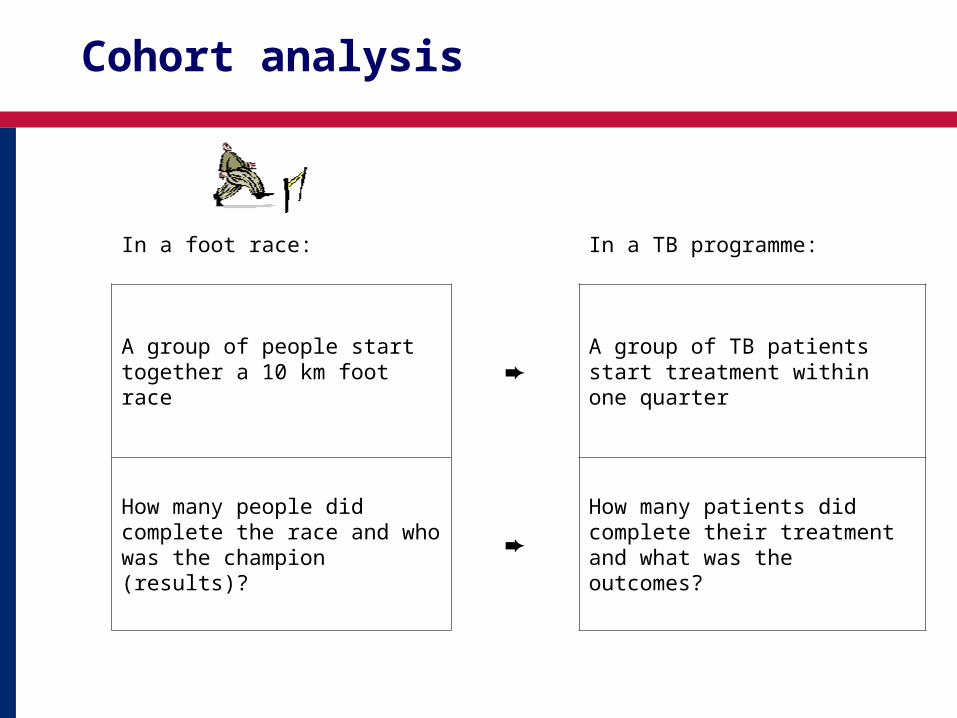
Cohort analysis
In a foot race: In a TB programme:
A group of people start together a 10 km foot race
➨A group of TB patients start treatment within one quarter
How many people did complete the race and who was the champion (results)?
➨How many patients did complete their treatment and what was the outcomes?
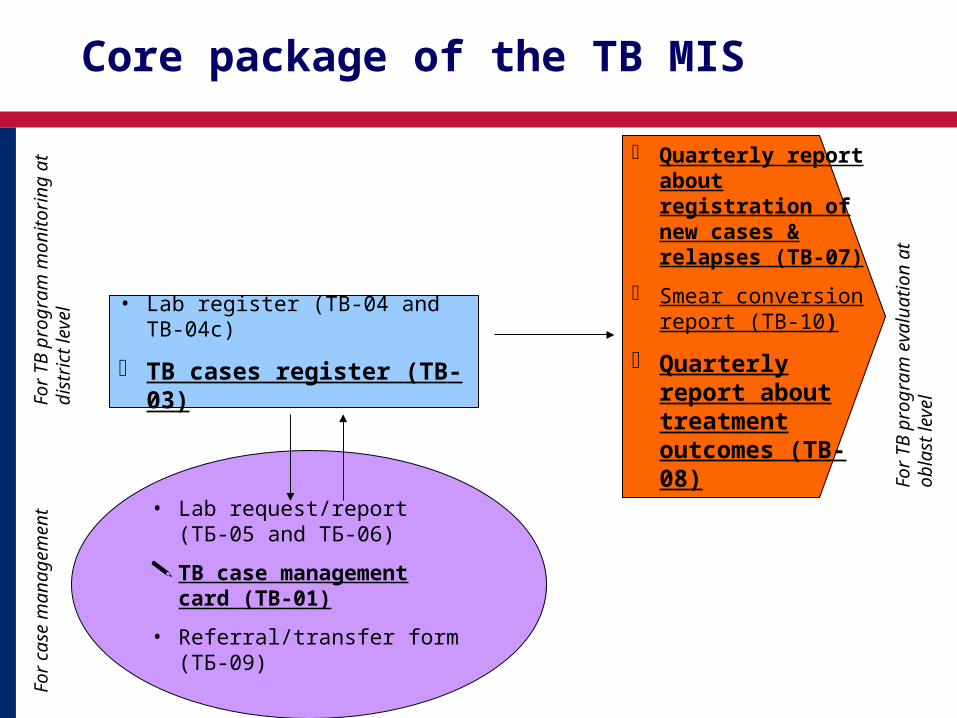
Core package of the TB MIS
• Lab request/report (TБ-05 and ТБ-06)
TB case management card (TB-01)
• Referral/transfer form (TБ-09)
• Lab register (TB-04 and ТB-04c)
TB cases register (TB-03)
Quarterly report about registration of new cases & relapses (TB-07)
Smear conversion report (TB-10)
Quarterly report about treatment outcomes (TB-08)
For
cas
e m
anag
em
ent
For
TB
pro
gra
m m
onito
ring
at
dist
rict
leve
l
For
TB
pro
gra
m e
valu
atio
n at
ob
last
leve
l
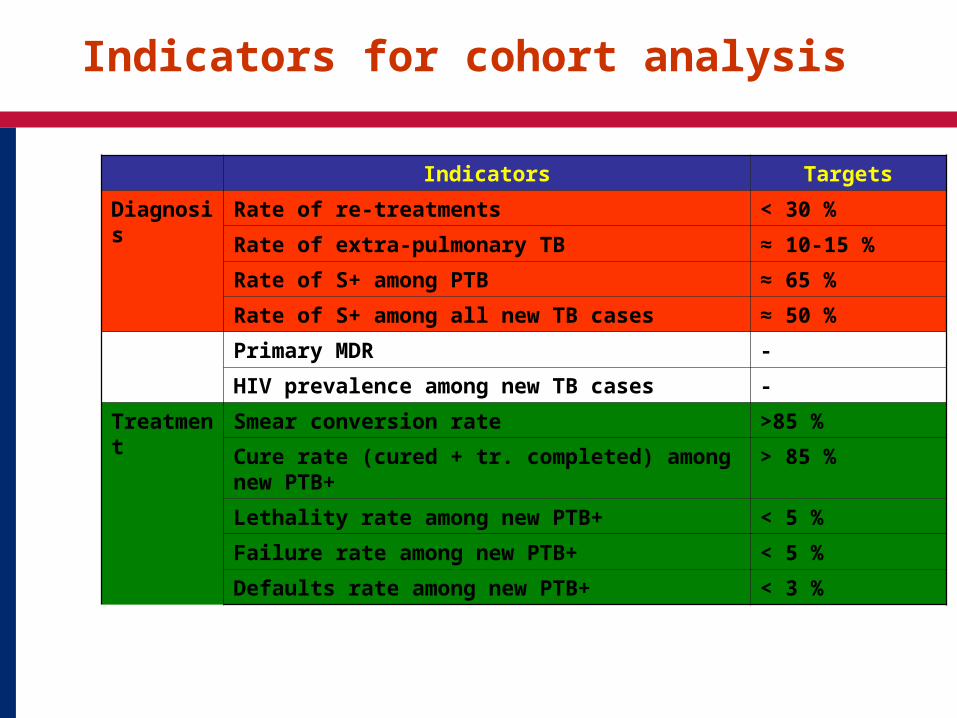
Indicators for cohort analysis
Indicators Targets
Diagnosis Rate of re-treatments < 30 %
Rate of extra-pulmonary TB ≈ 10-15 %
Rate of S+ among PTB ≈ 65 %
Rate of S+ among all new TB cases ≈ 50 %
Primary MDR -
HIV prevalence among new TB cases -
Treatment Smear conversion rate >85 %
Cure rate (cured + tr. completed) among new PTB+
> 85 %
Lethality rate among new PTB+ < 5 %
Failure rate among new PTB+ < 5 %
Defaults rate among new PTB+ < 3 %
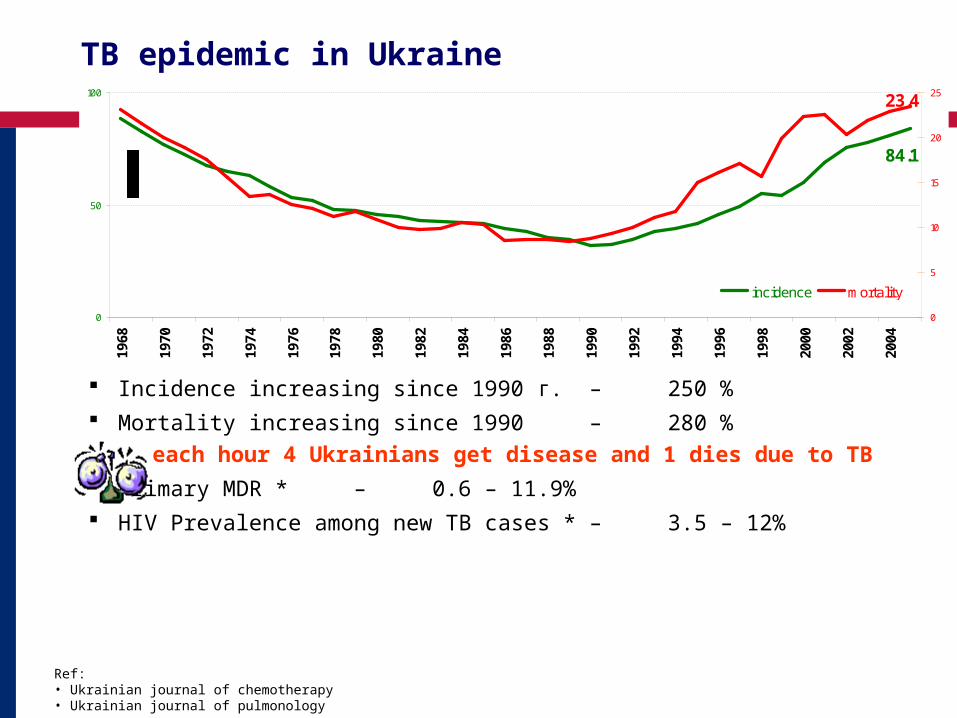
Incidence increasing since 1990 г. – 250 %
Mortality increasing since 1990 – 280 %
each hour 4 Ukrainians get disease and 1 dies due to TB
Primary MDR * – 0.6 – 11.9%
HIV Prevalence among new TB cases * – 3.5 – 12%
Ref:• Ukrainian journal of chemotherapy• Ukrainian journal of pulmonology
84.1
23.4
0
50
100
1968
1970
1972
1974
1976
1978
1980
1982
1984
1986
1988
1990
1992
1994
1996
1998
2000
2002
2004
0
5
10
15
20
25
incidence mortality
TB epidemic in Ukraine
0
20
40
60
80
100
120
140
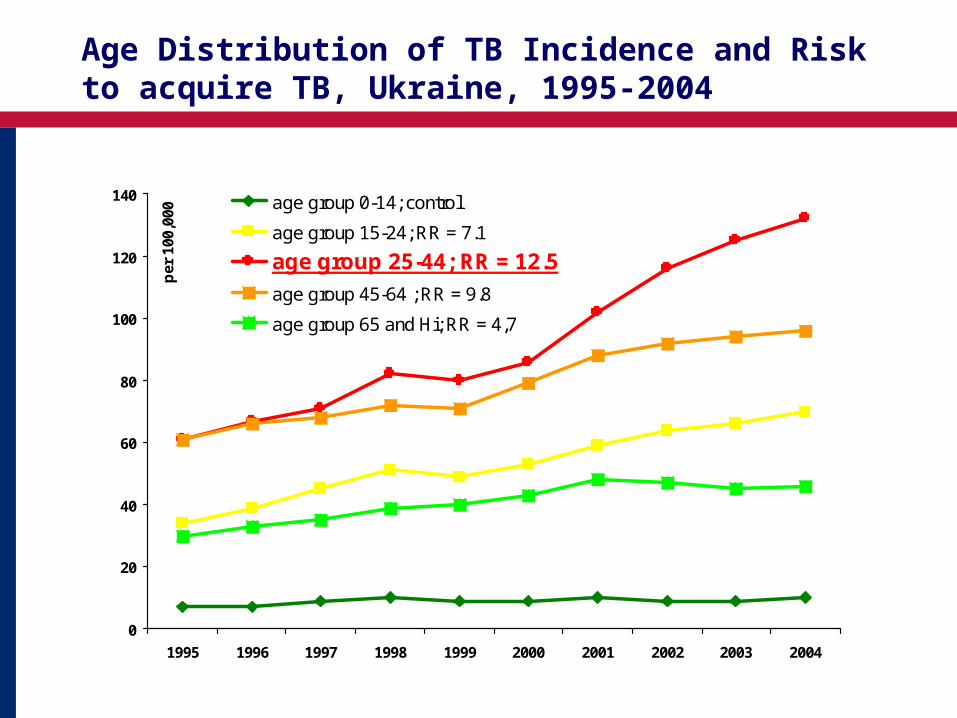
1995 1996 1997 1998 1999 2000 2001 2002 2003 2004
per
100
,000
age group 0-14; control
age group 15-24; RR = 7.1
age group 25-44; RR = 12.5
age group 45-64 ; RR = 9.8
age group 65 and Hi; RR = 4,7
Age Distribution of TB Incidence and Risk to acquire TB, Ukraine, 1995-2004
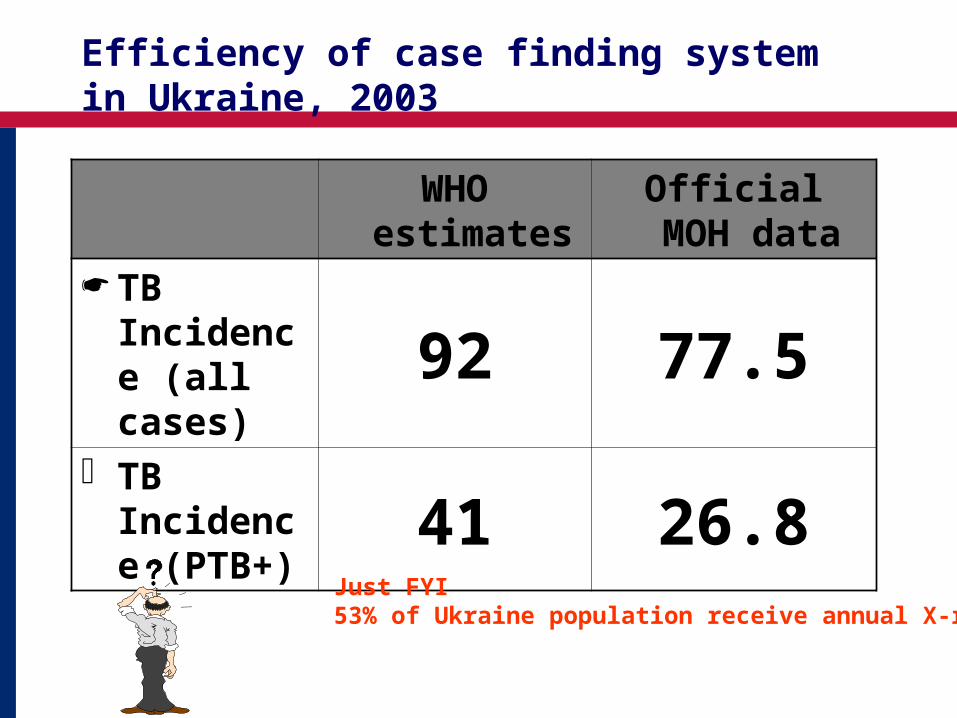
Efficiency of case finding system in Ukraine, 2003
WHO
estimatesOfficial MOH
data TB
Incidence (all cases)
92 77.5 TB
Incidence (PTB+)
41 26.8
Just FYI53% of Ukraine population receive annual X-rays
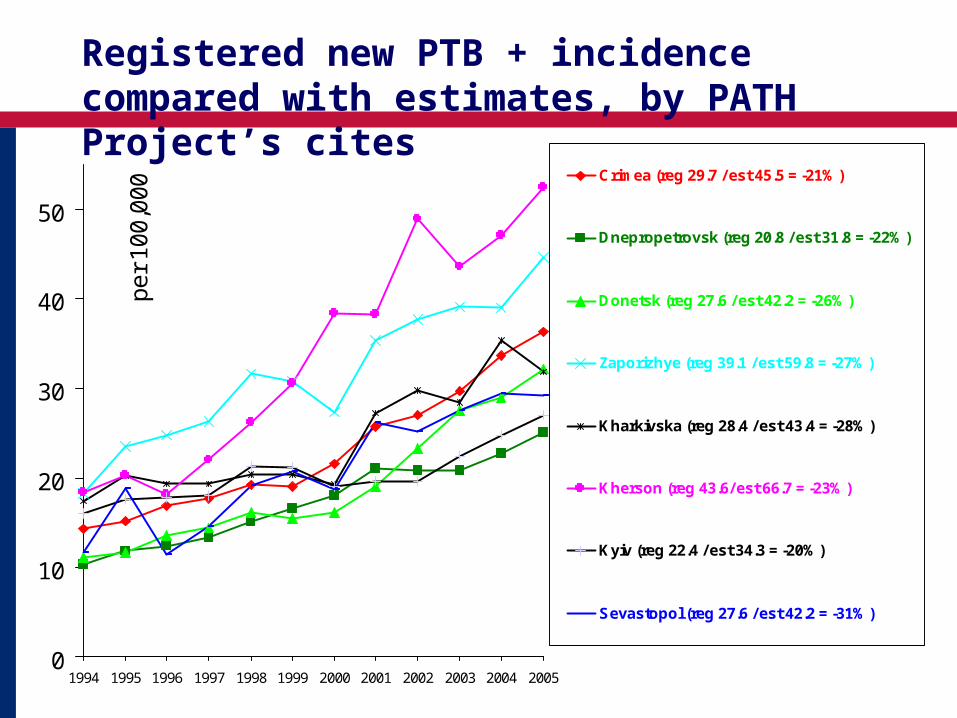
Registered new PTB + incidence compared with estimates, by PATH Project’s cites
0
10
20
30
40
50
1994 1995 1996 1997 1998 1999 2000 2001 2002 2003 2004 2005
pe
r 1
00
,00
0 Crimea (reg 29.7 / est 45.5 = -21%)
Dnepropetrovsk (reg 20.8 / est 31.8 = -22%)
Donetsk (reg 27.6 / est 42.2 = -26%)
Zaporizhye (reg 39.1 / est 59.8 = -27%)
Kharkivska (reg 28.4 / est 43.4 = -28%)
Kherson (reg 43.6/ est 66.7 = -23%)
Kyiv (reg 22.4 / est 34.3 = -20%)
Sevastopol (reg 27.6 / est 42.2 = -31%)
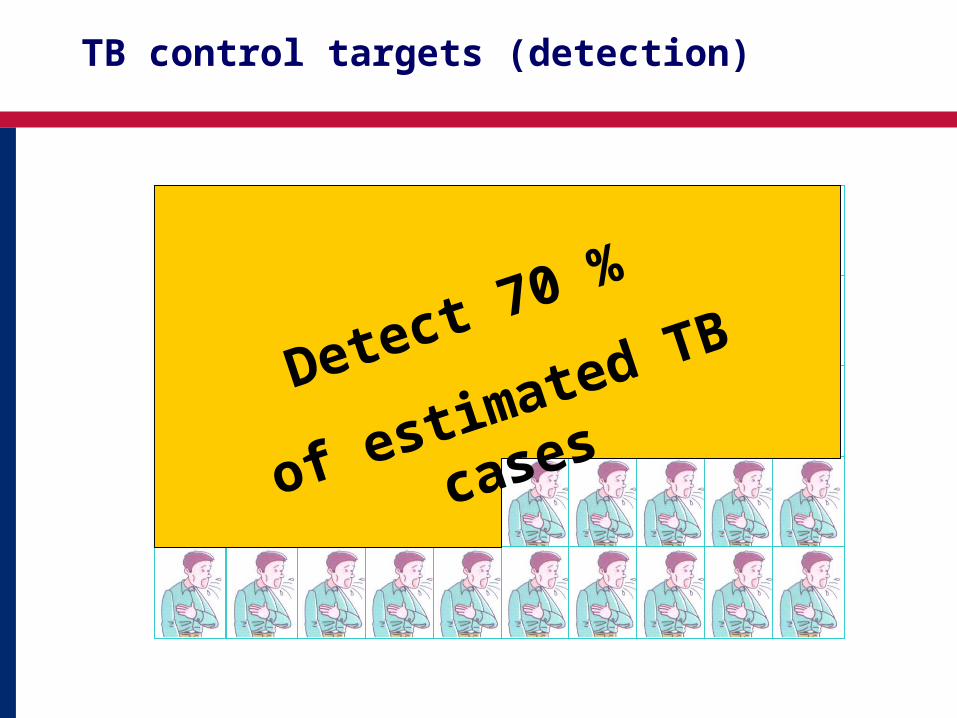
TB control targets (detection)
Detect 70 %
of estimated TB cases
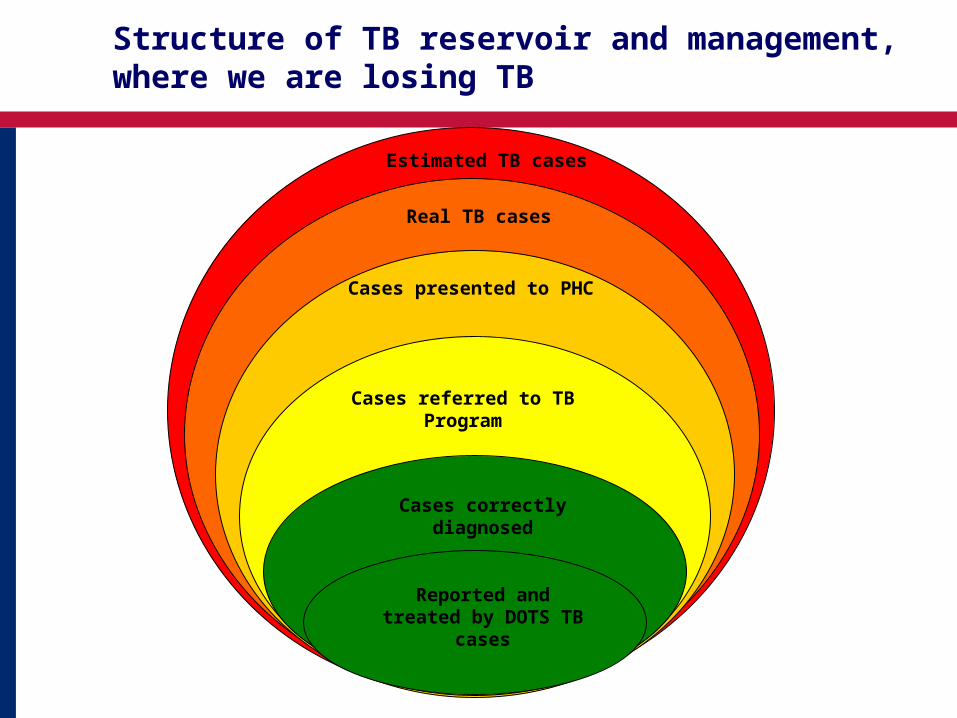
Estimated TB cases
Real TB cases
Cases presented to PHC
Cases referred to TB Program
Cases correctly diagnosed
Reported and treated by DOTS TB cases
Structure of TB reservoir and management, where we are losing TB
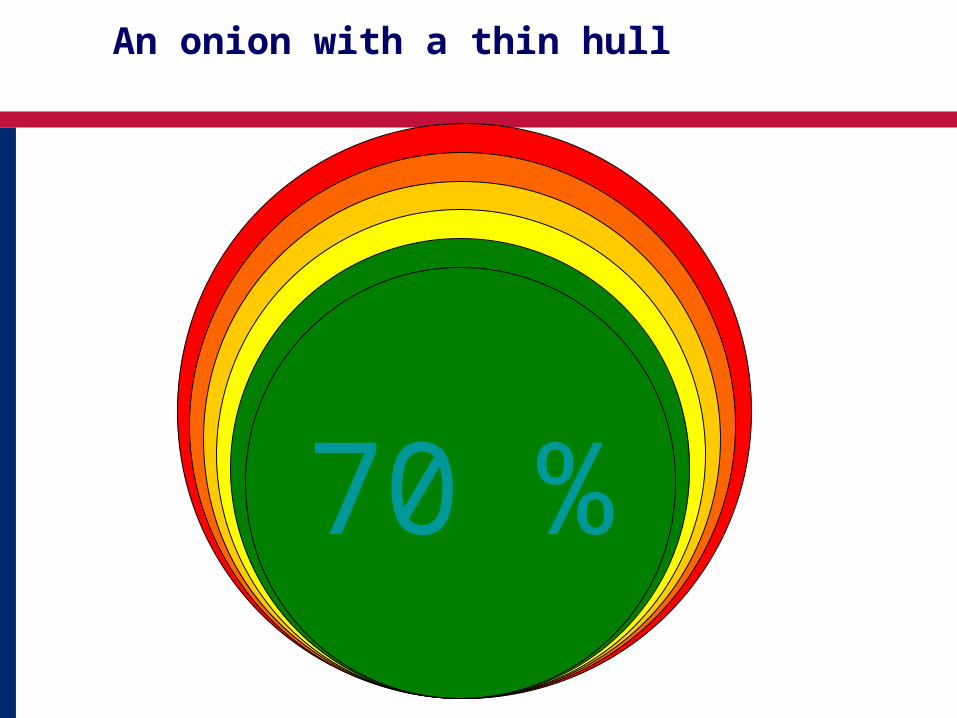
70 %
An onion with a thin hull
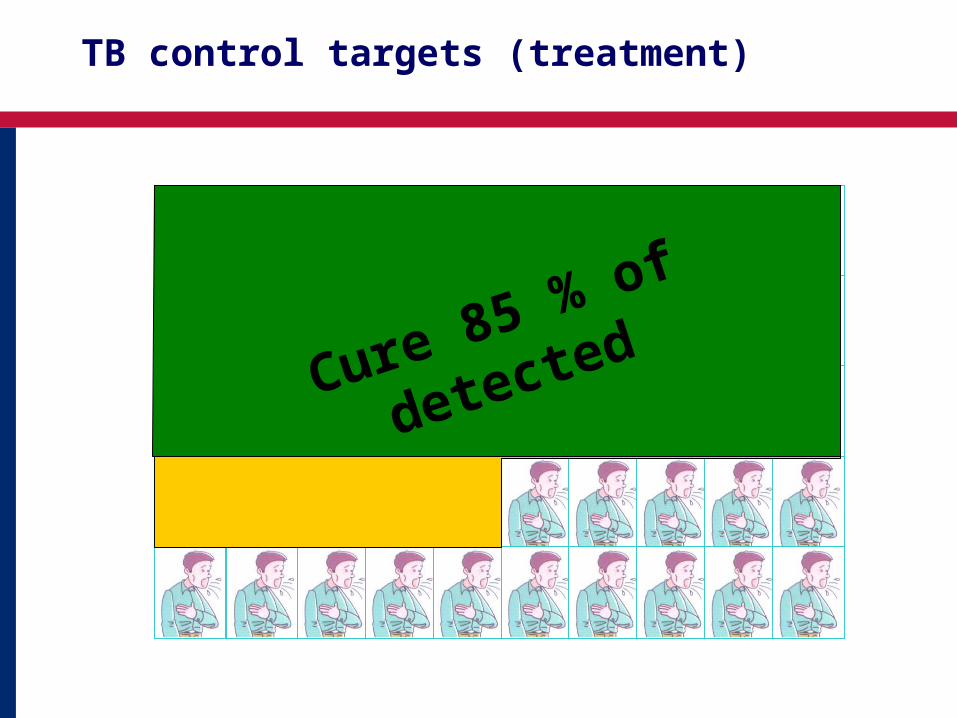
TB control targets (treatment)
Cure 85 % of detected
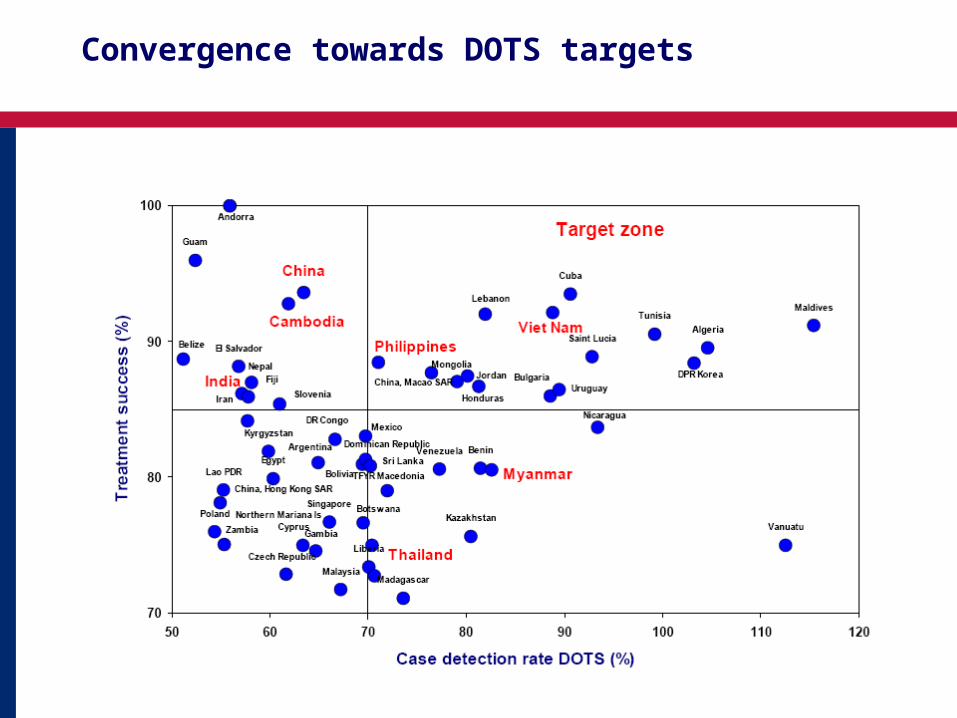
Convergence towards DOTS targets
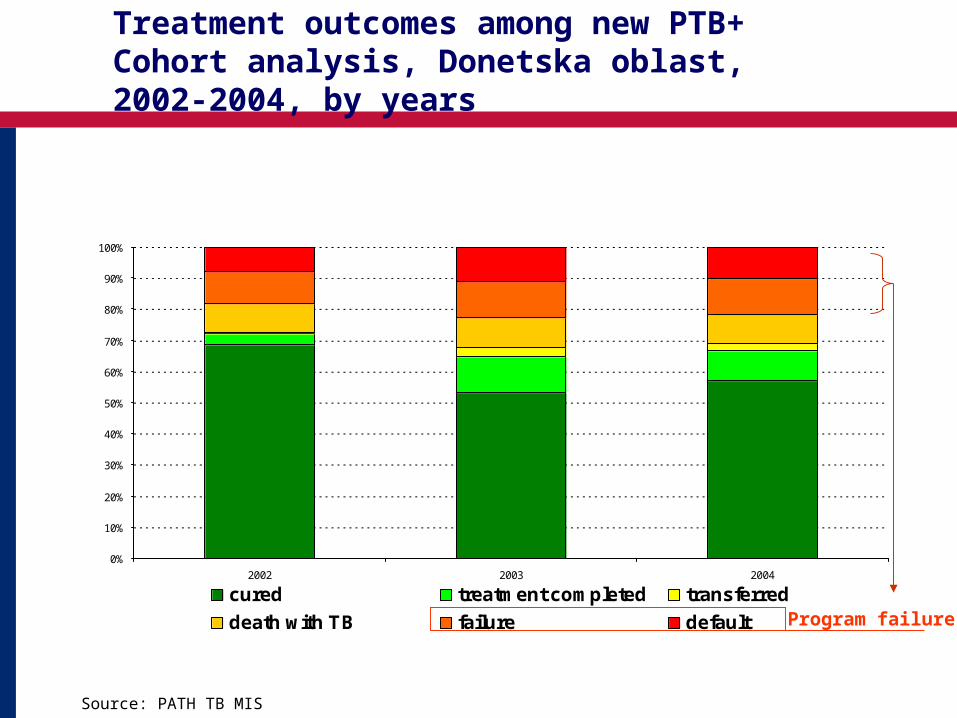
Treatment outcomes among new PTB+Cohort analysis, Donetska oblast, 2002-2004, by years
Source: PATH TB MIS
0%
10%
20%
30%
40%
50%
60%
70%
80%
90%
100%
2002 2003 2004
cured treatment completed transferred
death with TB failure default
N=236 N=718 N=954
Program failure
0
2
4
6
8
10
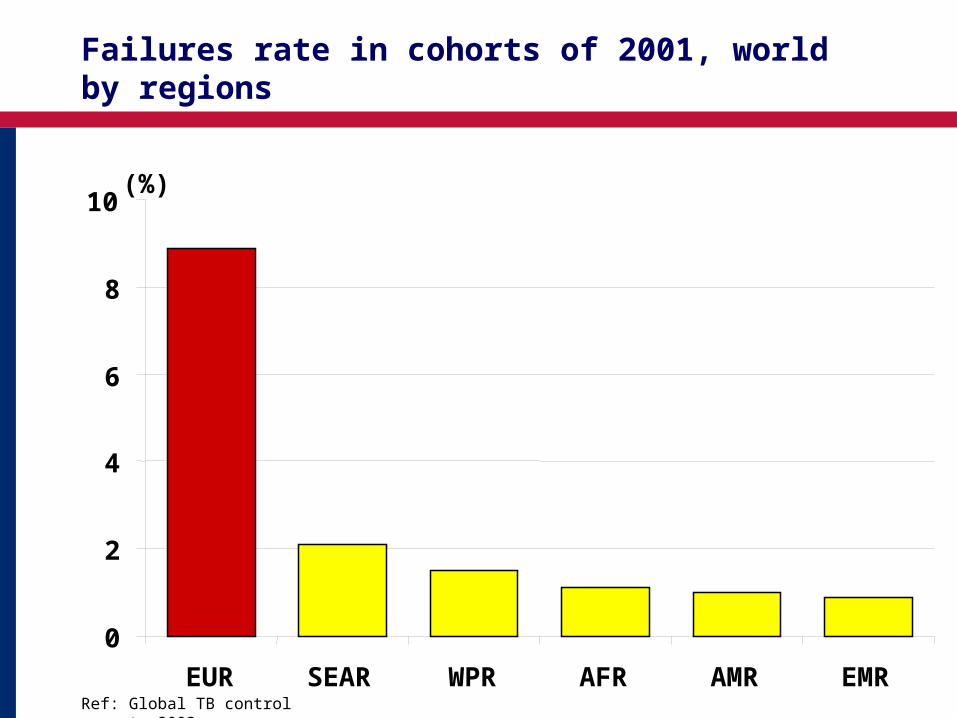
EUR SEAR WPR AFR AMR EMR
(%)
Ref: Global TB control report, 2003
Failures rate in cohorts of 2001, world by regions
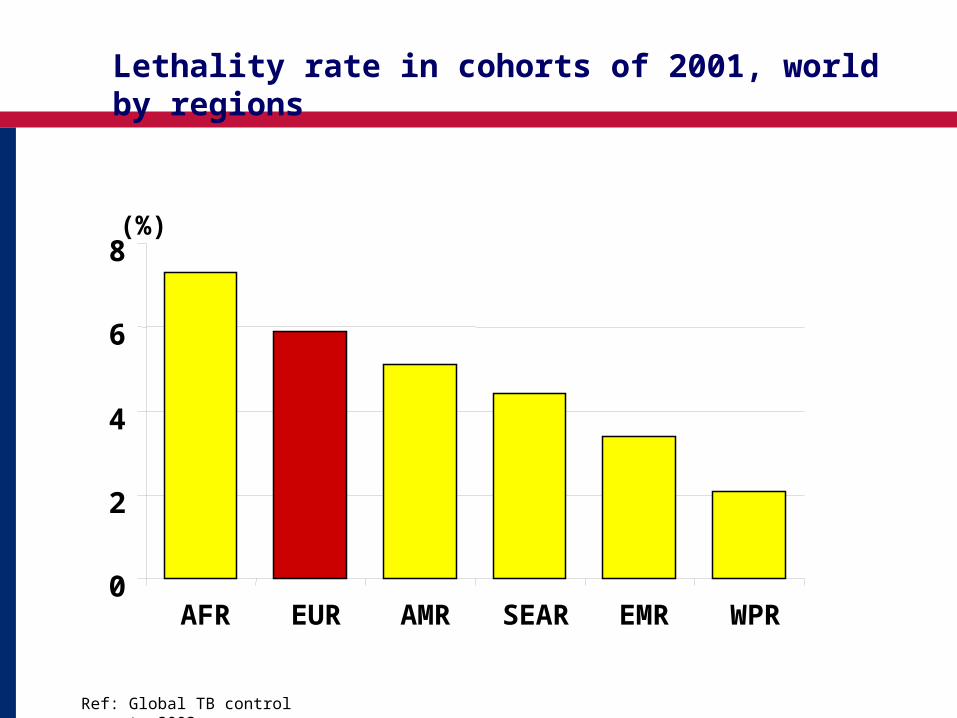
Lethality rate in cohorts of 2001, world by regions
Ref: Global TB control report, 2003
0
2
4
6
8
AFR EUR AMR SEAR EMR WPR
(%)
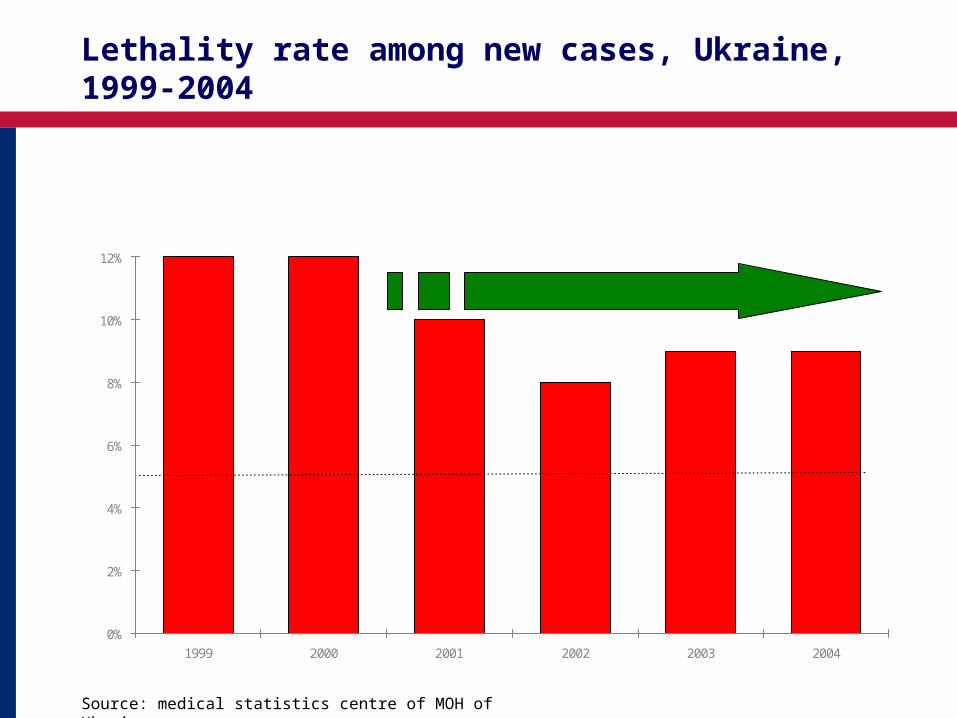
Lethality rate among new cases, Ukraine, 1999-2004
0%
2%
4%
6%
8%
10%
12%
1999 2000 2001 2002 2003 2004
!! Target for TB Program
!!! Centrilised first line TB drugs providing
Source: medical statistics centre of MOH of Ukraine
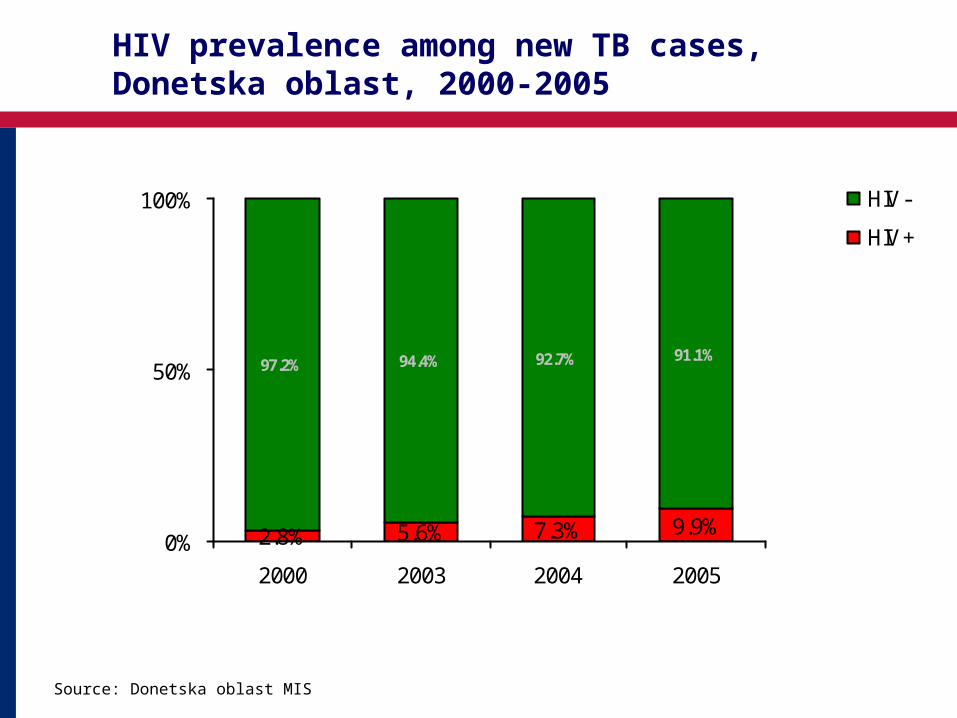
HIV prevalence among new TB cases, Donetska oblast, 2000-2005
Source: Donetska oblast MIS
2.8% 5.6% 7.3% 9.9%
91.1%94.4%97.2% 92.7%
0%
50%
100%
2000 2003 2004 2005
HIV-
HIV+
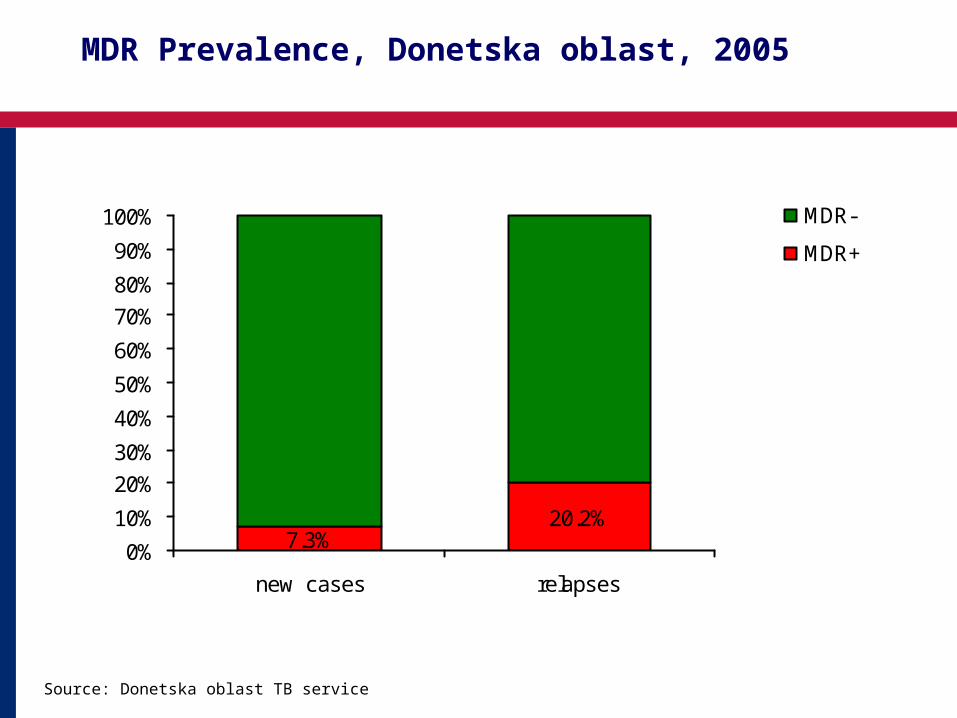
MDR Prevalence, Donetska oblast, 2005
Source: Donetska oblast TB service
7.3%20.2%
0%
10%
20%
30%
40%
50%
60%
70%
80%
90%
100%
new cases relapses
MDR-
MDR+
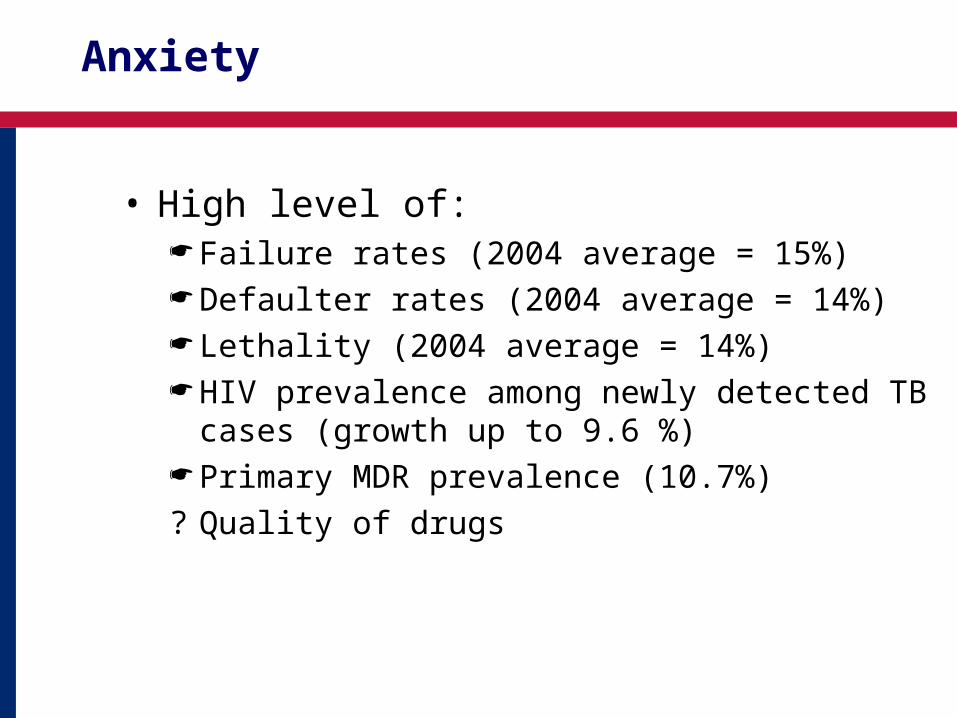
Anxiety
• High level of: Failure rates (2004 average = 15%) Defaulter rates (2004 average = 14%) Lethality (2004 average = 14%) HIV prevalence among newly detected TB cases
(growth up to 9.6 %) Primary MDR prevalence (10.7%)? Quality of drugs
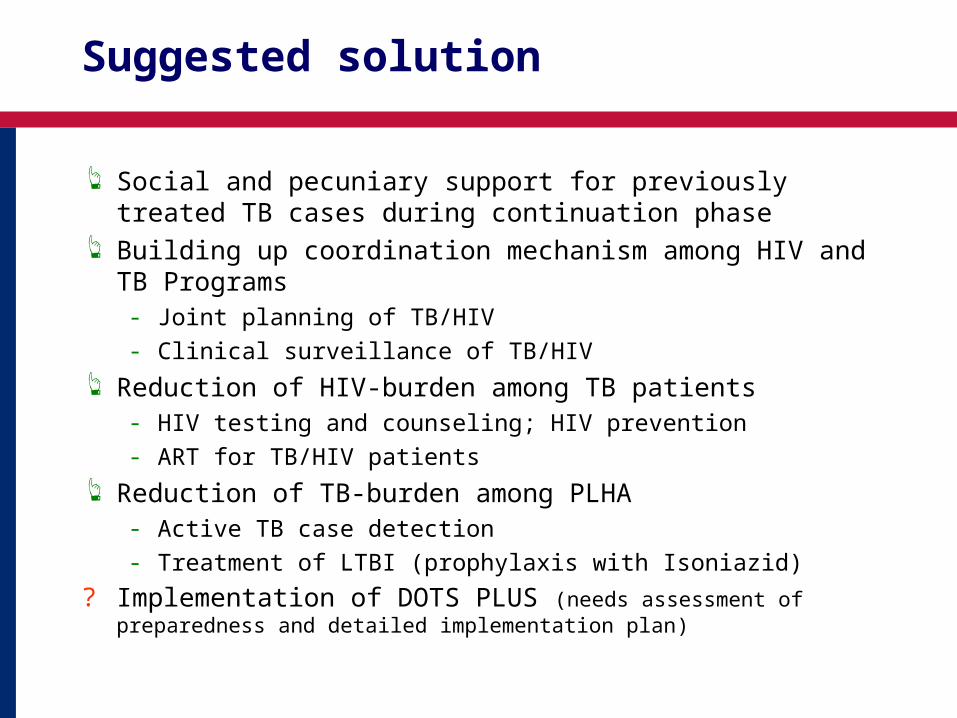
Suggested solution
Social and pecuniary support for previously treated TB cases during continuation phase
Building up coordination mechanism among HIV and TB Programs- Joint planning of TB/HIV
- Clinical surveillance of TB/HIV
Reduction of HIV-burden among TB patients- HIV testing and counseling; HIV prevention
- ART for TB/HIV patients
Reduction of TB-burden among PLHA- Active TB case detection
- Treatment of LTBI (prophylaxis with Isoniazid)
? Implementation of DOTS PLUS (needs assessment of preparedness and detailed implementation plan)
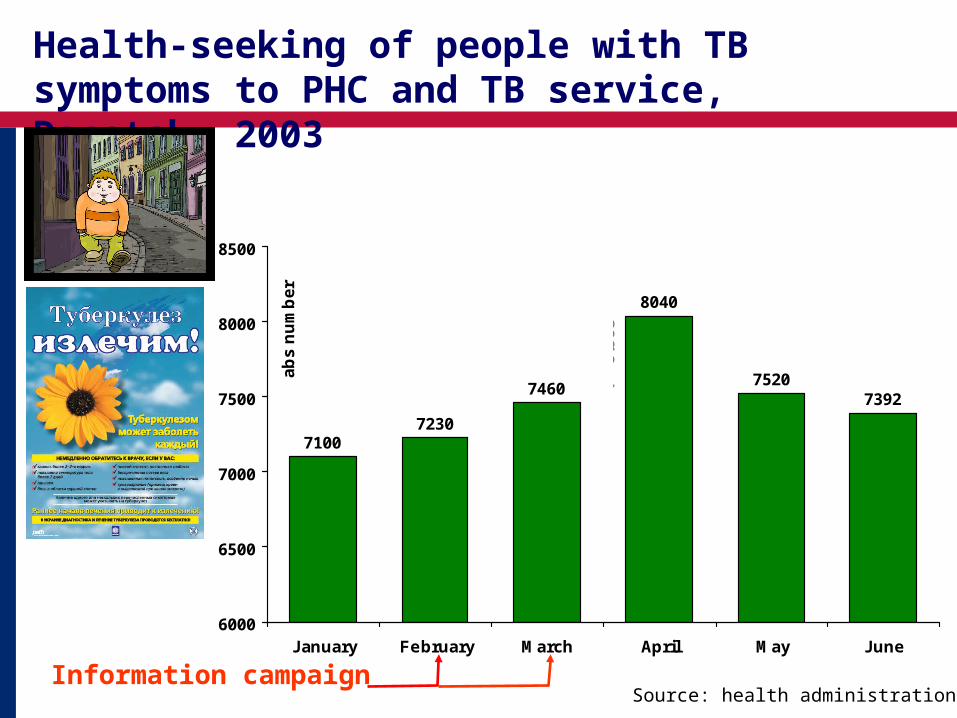
73927520
8040
7460
72307100
6000
6500
7000
7500
8000
8500
January February March April May June
ab
s n
um
be
r
P<
0.0
05
Health-seeking of people with TB symptoms to PHC and TB service, Donetsk, 2003
Information campaignSource: health administration
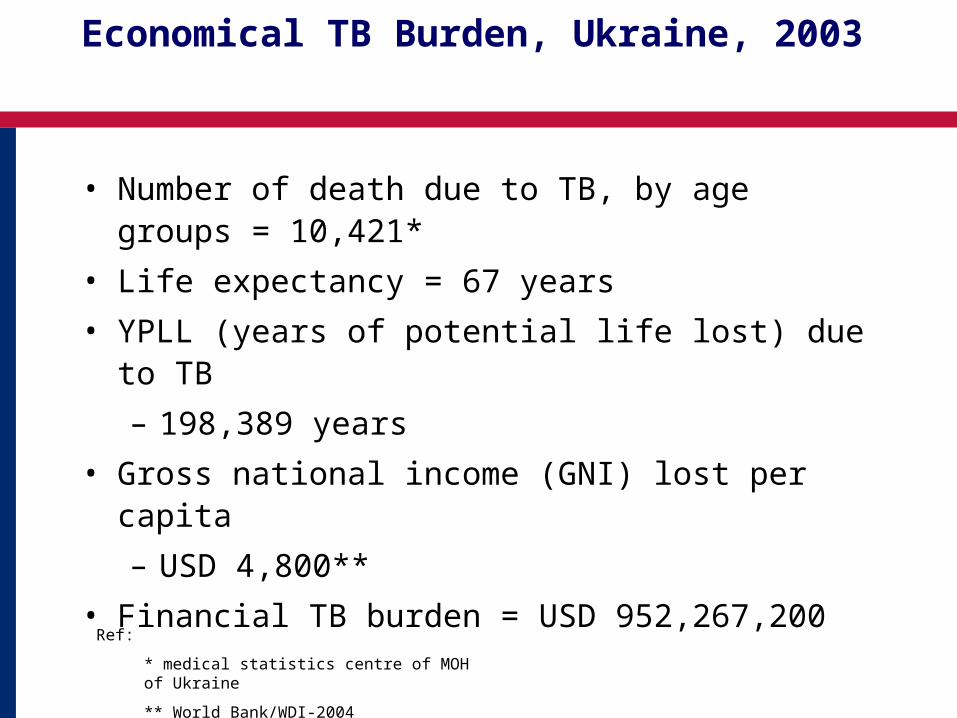
Economical TB Burden, Ukraine, 2003
• Number of death due to TB, by age groups = 10,421*
• Life expectancy = 67 years
• YPLL (years of potential life lost) due to TB
– 198,389 years
• Gross national income (GNI) lost per capita
– USD 4,800**
• Financial TB burden = USD 952,267,200
Ref:
* medical statistics centre of MOH of Ukraine
** World Bank/WDI-2004
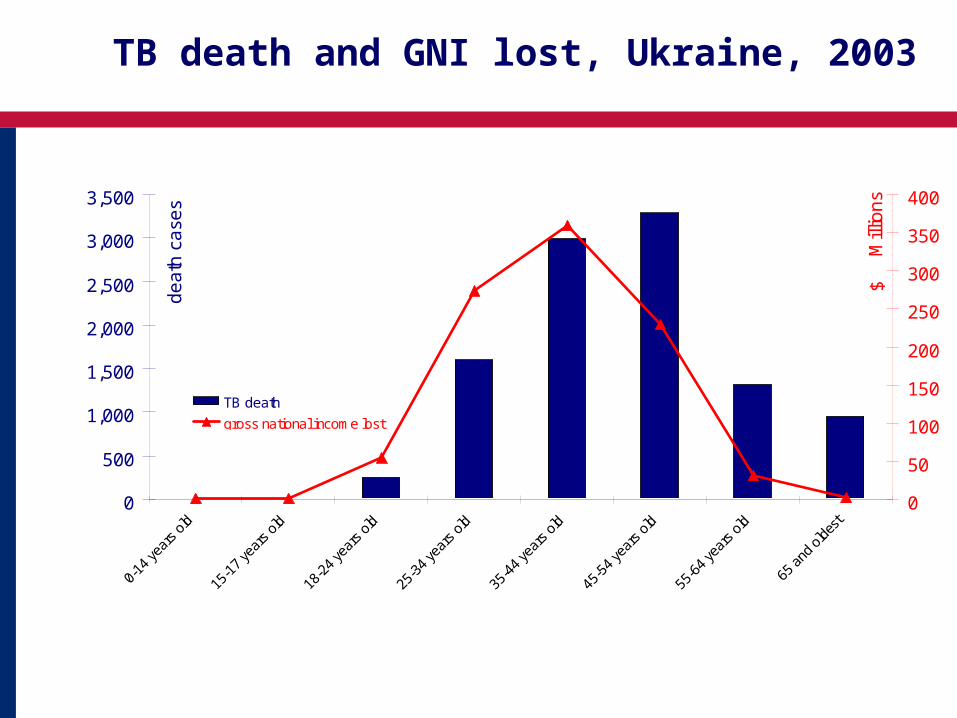
TB death and GNI lost, Ukraine, 2003
0
500
1,000
1,500
2,000
2,500
3,000
3,500d
ea
th c
ase
s
0
50
100
150
200
250
300
350
400
Mill
ion
s$
TB death
gross national income lost
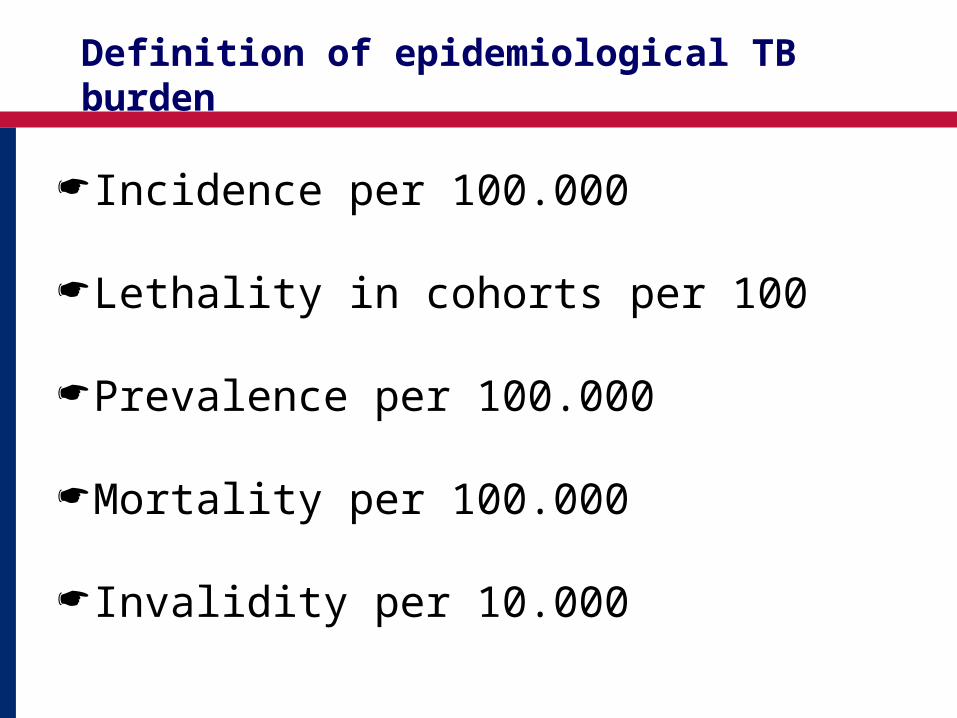
Definition of epidemiological TB burden
Incidence per 100.000
Lethality in cohorts per 100
Prevalence per 100.000
Mortality per 100.000
Invalidity per 10.000
Область Заболеваемость (всего)
Заболеваемость (0-14)
Смертность (всего)
Летальность (всего)
Распространенность (всего)
Распространенность (0-14)
Инвалидность
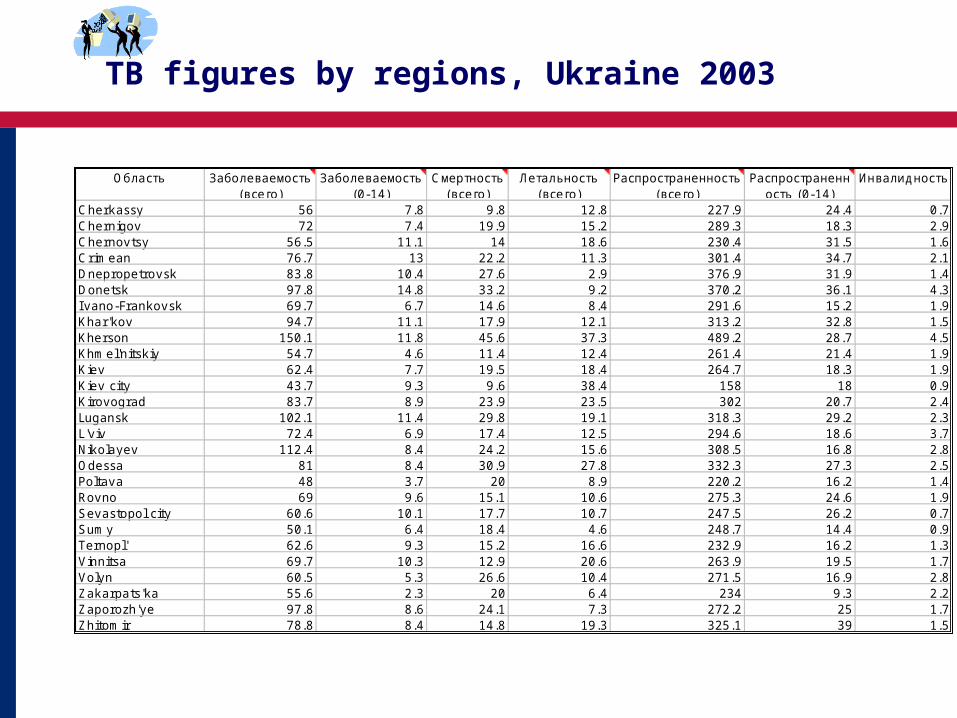
Cherkassy 56 7.8 9.8 12.8 227.9 24.4 0.7Chernigov 72 7.4 19.9 15.2 289.3 18.3 2.9Chernovtsy 56.5 11.1 14 18.6 230.4 31.5 1.6Crimean 76.7 13 22.2 11.3 301.4 34.7 2.1Dnepropetrovsk 83.8 10.4 27.6 2.9 376.9 31.9 1.4Donetsk 97.8 14.8 33.2 9.2 370.2 36.1 4.3I vano-Frankovsk 69.7 6.7 14.6 8.4 291.6 15.2 1.9Khar'kov 94.7 11.1 17.9 12.1 313.2 32.8 1.5Kherson 150.1 11.8 45.6 37.3 489.2 28.7 4.5Khmel'nitskiy 54.7 4.6 11.4 12.4 261.4 21.4 1.9Kiev 62.4 7.7 19.5 18.4 264.7 18.3 1.9Kiev city 43.7 9.3 9.6 38.4 158 18 0.9Kirovograd 83.7 8.9 23.9 23.5 302 20.7 2.4Lugansk 102.1 11.4 29.8 19.1 318.3 29.2 2.3L'viv 72.4 6.9 17.4 12.5 294.6 18.6 3.7Nikolayev 112.4 8.4 24.2 15.6 308.5 16.8 2.8Odessa 81 8.4 30.9 27.8 332.3 27.3 2.5Poltava 48 3.7 20 8.9 220.2 16.2 1.4Rovno 69 9.6 15.1 10.6 275.3 24.6 1.9Sevastopol city 60.6 10.1 17.7 10.7 247.5 26.2 0.7Sumy 50.1 6.4 18.4 4.6 248.7 14.4 0.9Ternopl' 62.6 9.3 15.2 16.6 232.9 16.2 1.3Vinnitsa 69.7 10.3 12.9 20.6 263.9 19.5 1.7Volyn 60.5 5.3 26.6 10.4 271.5 16.9 2.8Zakarpats'ka 55.6 2.3 20 6.4 234 9.3 2.2Zaporozh'ye 97.8 8.6 24.1 7.3 272.2 25 1.7Zhitomir 78.8 8.4 14.8 19.3 325.1 39 1.5
TB figures by regions, Ukraine 2003
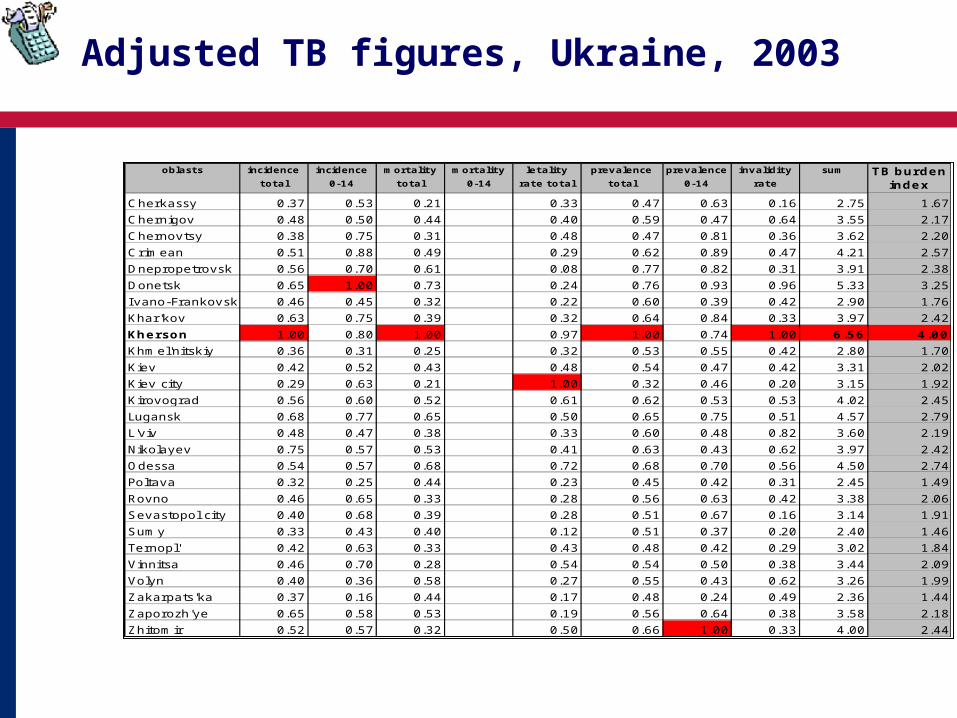
Adjusted TB figures, Ukraine, 2003
oblasts incidence
total
incidence
0-14
mortality
total
mortality
0-14
letality
rate total
prevalence
total
prevalence
0-14
invalidity
rate
sum TB burden index
Cherkassy 0.37 0.53 0.21 0.33 0.47 0.63 0.16 2.75 1.67
Chernigov 0.48 0.50 0.44 0.40 0.59 0.47 0.64 3.55 2.17
Chernovtsy 0.38 0.75 0.31 0.48 0.47 0.81 0.36 3.62 2.20
Crimean 0.51 0.88 0.49 0.29 0.62 0.89 0.47 4.21 2.57
Dnepropetrovsk 0.56 0.70 0.61 0.08 0.77 0.82 0.31 3.91 2.38
Donetsk 0.65 1.00 0.73 0.24 0.76 0.93 0.96 5.33 3.25
I vano-Frankovsk 0.46 0.45 0.32 0.22 0.60 0.39 0.42 2.90 1.76
Khar'kov 0.63 0.75 0.39 0.32 0.64 0.84 0.33 3.97 2.42
Kherson 1.00 0.80 1.00 0.97 1.00 0.74 1.00 6.56 4.00
Khmel'nitskiy 0.36 0.31 0.25 0.32 0.53 0.55 0.42 2.80 1.70
Kiev 0.42 0.52 0.43 0.48 0.54 0.47 0.42 3.31 2.02
Kiev city 0.29 0.63 0.21 1.00 0.32 0.46 0.20 3.15 1.92
Kirovograd 0.56 0.60 0.52 0.61 0.62 0.53 0.53 4.02 2.45
Lugansk 0.68 0.77 0.65 0.50 0.65 0.75 0.51 4.57 2.79
L'viv 0.48 0.47 0.38 0.33 0.60 0.48 0.82 3.60 2.19
Nikolayev 0.75 0.57 0.53 0.41 0.63 0.43 0.62 3.97 2.42
Odessa 0.54 0.57 0.68 0.72 0.68 0.70 0.56 4.50 2.74
Poltava 0.32 0.25 0.44 0.23 0.45 0.42 0.31 2.45 1.49
Rovno 0.46 0.65 0.33 0.28 0.56 0.63 0.42 3.38 2.06
Sevastopol city 0.40 0.68 0.39 0.28 0.51 0.67 0.16 3.14 1.91
Sumy 0.33 0.43 0.40 0.12 0.51 0.37 0.20 2.40 1.46
Ternopl' 0.42 0.63 0.33 0.43 0.48 0.42 0.29 3.02 1.84
Vinnitsa 0.46 0.70 0.28 0.54 0.54 0.50 0.38 3.44 2.09
Volyn 0.40 0.36 0.58 0.27 0.55 0.43 0.62 3.26 1.99
Zakarpats'ka 0.37 0.16 0.44 0.17 0.48 0.24 0.49 2.36 1.44
Zaporozh'ye 0.65 0.58 0.53 0.19 0.56 0.64 0.38 3.58 2.18
Zhitomir 0.52 0.57 0.32 0.50 0.66 1.00 0.33 4.00 2.44
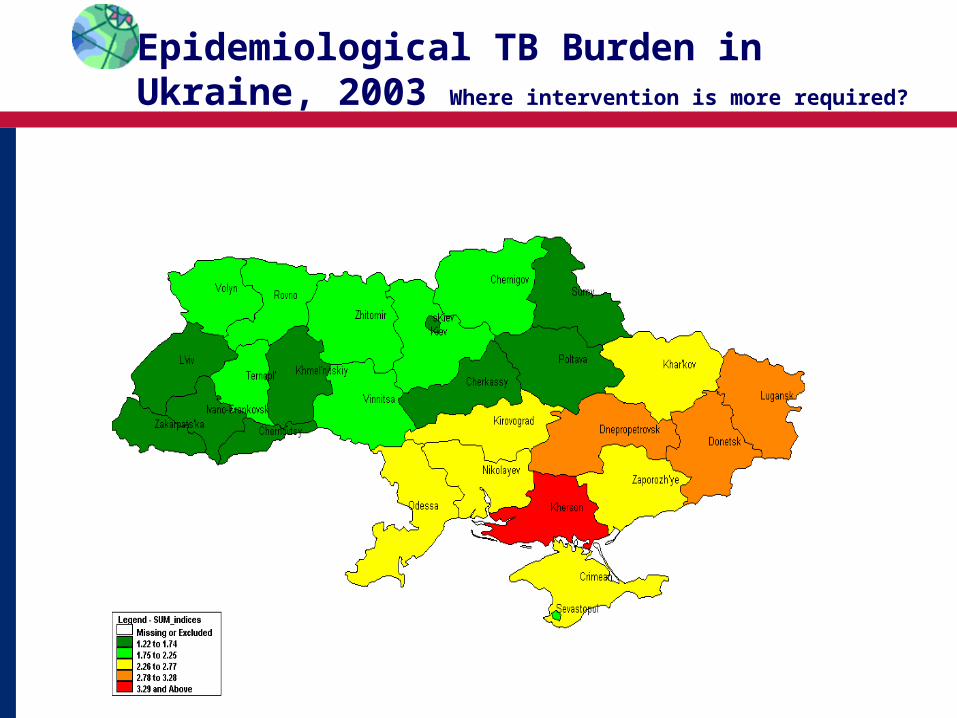
Epidemiological TB Burden in Ukraine, 2003 Where intervention is more required?
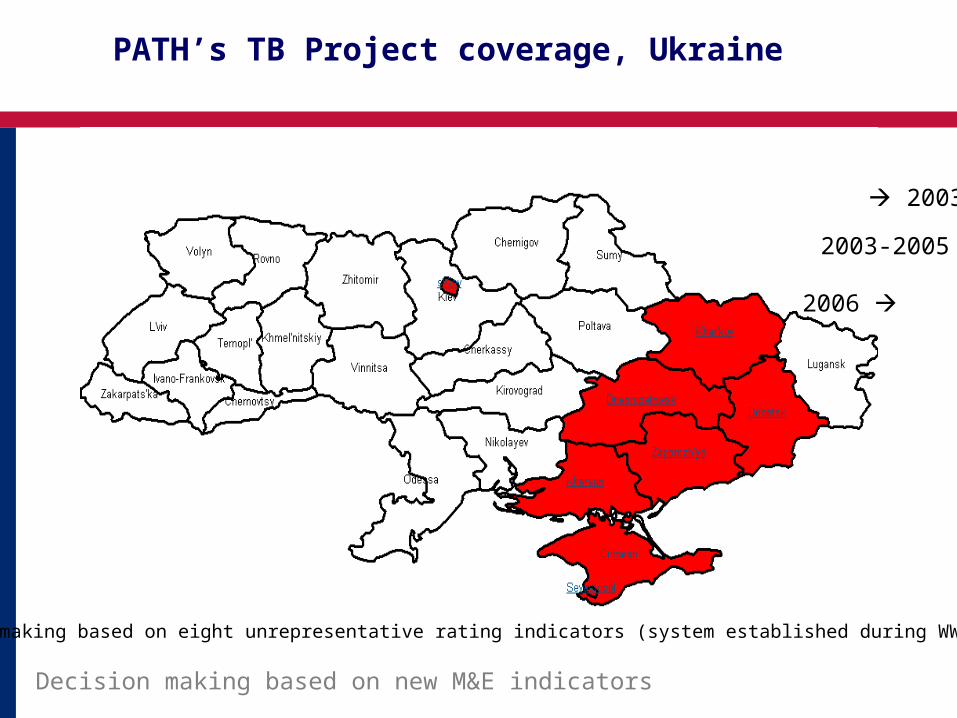
2003-2005
2006
2003
Decision making based on eight unrepresentative rating indicators (system established during WWII)
Decision making based on new M&E indicators
PATH’s TB Project coverage, Ukraine
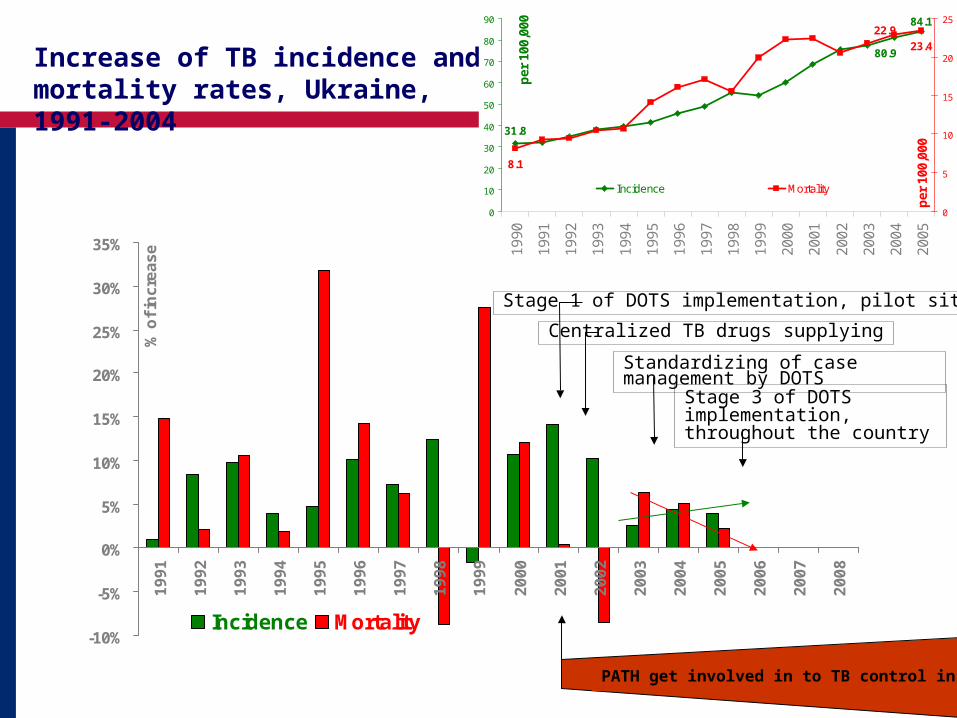
Increase of TB incidence and mortality rates, Ukraine, 1991-2004
-10%
-5%
0%
5%
10%
15%
20%
25%
30%
35%
19
91
19
92
19
93
19
94
19
95
19
96
19
97
19
98
19
99
20
00
20
01
20
02
20
03
20
04
20
05
20
06
20
07
20
08
% o
f in
cre
as
e
Incidence Mortality
31.8
84.1
80.9
8.1
23.4
22.9
0
10
20
30
40
50
60
70
80
90
19
90
19
91
19
92
19
93
19
94
19
95
19
96
19
97
19
98
19
99
20
00
20
01
20
02
20
03
20
04
20
05
per
100
,000
0
5
10
15
20
25
per
100
,000
Incidence Mortality
Standardizing of case management by DOTS
Stage 1 of DOTS implementation, pilot sites
Centralized TB drugs supplying
Stage 3 of DOTS implementation, throughout the country
PATH get involved in to TB control in Ukraine
Interpretation
Providing task-oriented, efficient technical support to reduce morbidity and mortality in Ukraine
Recommendation/Conclusion
TB Burden Evaluation should be performed every 3 to 5 years to determine the extent (prevalence) of the problem
Quarterly Cohort Analysis provides specific and sensitive surveillance data for TB program evaluation and monitoring
MIS is one of the most important components of TB Program, providing information on intervention efficiency