Embed Size (px)
Citation preview

NRIAG Journal of Astronomy and Geophysics (2016) 5, 147–159
National Research Institute of Astronomy and Geophysics
NRIAG Journal of Astronomy and Geophysics
www.elsevier.com/locate/nrjag
Implementation of ground penetrating radar
and electrical resistivity tomography for inspecting
the Greco-Roman Necropolis at Kilo 6 of the
Golden Mummies Valley, Bahariya Oasis, Egypt
* Corresponding author.
Peer review under responsibility of National Research Institute of
Astronomy and Geophysics.
Production and hosting by Elsevier
http://dx.doi.org/10.1016/j.nrjag.2016.01.0032090-9977 � 2016 Production and hosting by Elsevier B.V. on behalf of National Research Institute of Astronomy and Geophysics.This is an open access article under the CC BY-NC-ND license (http://creativecommons.org/licenses/by-nc-nd/4.0/).
Abbas M. Abbasa, Hosni H. Ghazala
b, Hany S. Mesbah
a, Magdy A. Atya
a,
Ali Radwana, Diaa E. Hamed
a,*
aNational Research Institute of Astronomy and Geophysics, 11421 Helwan, EgyptbGeology Dept., Mansoura University, Egypt
Received 7 April 2015; revised 24 January 2016; accepted 24 January 2016
Available online 19 February 2016
KEYWORDS
Archeology;
Bahariya Oasis;
GPR;
ERT;
Golden Mummies
Abstract Bahariya Oasis is one of the lately inspected spots in Egypt and has a long historical
record extending from the old kingdom till the emergence of Islam. Since June 1999, the Valley
of the Golden Mummies near Bawiti (at kilometer 6 on the road leads to Farafra Oasis) became
significant due to the discoveries of amazing mummies of gelded faces. The archeologists believe
that the Valley has more valuable tombs that still unrevealed. Also, the possibility that the
Greco-Roman Necropolis extends to areas other than Kilo-6 is sustainable.
The ground penetrating radar and electrical resistivity tomography are two geophysical tools that
have successful applications in archeological assessment. The two techniques were used in integra-
tion plan to assert the archeological potentiality of the studied site and to map the feasible tombs.
Sum of 798 GPR profiles and 19 ERT cross sections was carried out over the study area. The results
of them were analyzed to envisage these results in archeological terms.� 2016 Production and hosting by Elsevier B.V. on behalf of National Research Institute of Astronomy
and Geophysics. This is an open access article under the CC BY-NC-ND license (http://creativecommons.
org/licenses/by-nc-nd/4.0/).
1. Introduction
Bahariya Oasis is a large, oval-shaped NE-oriented depressionin the north-central part of the Western Desert of Egypt. It isone of seven major depressions in the Western Desert. It lies
between latitudes 27�480 and 28�300N, and between longitudes28�300 and 29�100E, at distance of about 300 km southwest ofCairo (Fig. 1). The average depth of the depression from thegeneral desert plateau is less than 100 m (Said, 1962). It has

Figure 1 Location map of the study area at Bahariya Oasis.
Figure 2 The shape of one of the reference stations.
148 A.M. Abbas et al.
a surface area of about 1800 sq. km and is surrounded by pla-teaus at about 250 m above sea level (Moustafa et al., 2002).
The study area is located in Bahariya Oasis between
latitudes 28�19043.7463900 and 28�19051.736200N, and longitudes28�49030.0185000 and 28�49042.865800E.
The study area is divided into grids in order to apply the
geophysical measurements. To allocate the grids in optimumprecise, the Global Positioning System ‘‘GPS” is used whichallows users to determine their location on land, sea, and in
the air around the Earth.
The first stage has been to initiate three cement bases to fixthree GPS devices (GPS 4000 SSI) on them as referencestations (Fig. 2). These bases are called Bases 1, 2 and 3. To
compute the corrected coordinates of these bases accurately,we used the static survey model with interval time 30 s perepoch and left the device working for about 8 h.
The second stage of work was to divide the area underinvestigation into cells (50 m � 50 m) where we observed everycell uses the Stop and go technique using a very high resolu-
tion, an observation per two seconds. The topographic data

Figure 3 Topographic map of the study area.
Implementation of ground penetrating radar and electrical resistivity tomography 149
were collected using a GPS survey with a very high accuracy
reaching less than one centimeter. The collected data were pro-cessed using the GPS Processing Program Trimble BusinessCenter (TBC) to get the coordinates of this area, these coordi-nates are referenced to the Ellipsoid, the projection used was
UTM (Universal Transverse Mercator) Zone 36N, the Datumis WGS 84 (World Geodetic System 1984), and the GeoidalModel is EGM96 (Earth Geoidal Model 1996). The main
target is to make a topographic map for the study area (Fig. 3).Bahariya Oasis has several archeological remains, one of
them is the Valley of Golden Mummies. This archeological
valley holds the largest collection of Egyptian mummies everfound. The present study aims at investigating the potential
Figure 4 Location map of GPR grids at the study area.
archeological areas that still unrevealed two geophysical tools:
GPR and ERT which are used to verify this aim.Ground Penetrating Radar (GPR) is commonly used in
archeological investigations. It allows the archeologist to covera wide area in a short period of time, with excellent resolution.
It images structures in the ground that are related to changesin dielectric properties. In particular,GPR iswell suited to inves-tigate the foundation geometry of archaeological buildings
where it is impossible to apply any destructive technique(Abbas et al., 2005).
Electrical Resistivity Tomography (ERT) is an effective
tool in archeological investigations as it can show the differ-ence in resistance between air-filled cavities and the surround-ing rocks. The air-filled cavity gives high resistivity values
compared to the surrounding sandstone which is consideredthe most outstanding physical feature of a cave (tomb), andfor this reason the resistivity method has been the most widelyused for cave detection.
2. Acquisition of GPR and ERT data
The study area that has been surveyed by GPR is subdivided
into 12 grids (Fig. 4). The detailed GPR traverses were accom-plished on Zig–Zag patterns. SIR 3000 control unit attached to400 MHz center frequency antennas is used to carry out the
detailed archeological prospection to outline the subsurfacetombs and archeological features that may present at the studyarea (Fig. 6a). The total number of profiles measured on the
study area is 798.Nineteen parallel ERT profiles have been conducted at the
study area directed from the West to the East. Fig. 5 shows thedistribution of ERT profiles at the study area. Syscal-R2

Figure 5 Distribution of ERT profiles at the study area.
Figure 6 (a) Field photograph during the acquisition of GPR profiles, (b) Syscal R2 and multi-electrode system that used during the field
survey.
150 A.M. Abbas et al.
Resistivity meter (IRIS-company, France) and Multi-electrode
system with 48 electrodes (Fig. 6b) have been used to carry outthe ERT profiles.
Ten parallel profiles P1, P2, P3, P4, P5, P15, P16, P17, P18,
and P19 have been carried out at area ‘‘A1” of total profilelength 141 m and 3 m spacing between the successive elec-trodes and nine parallel profiles P6, P7, P8, P9, P10, P11,P12, P13, and P14 have been carried out at area ‘‘A2” with
profile length = 94 m and 2 m spacing between the successive
electrodes (see Table 1).
3. Processing of GPR and ERT Data
Although the collected data were generally of good quality,some processing steps were applied using REFLEX software,version 6.0 to increase S/N ratio (Abbas et al., 2015).

Table 1 Parameters of the survey GPR grids.
No. Name of grid Dimensions of the grid (m) Number of profiles Profile length (m) Profile intervals (m) Direction of profiles
1 G1 50 � 100 52 50 2 From W to E
2 G2 50 � 100 53 50 2 From W to E
3 G3 50 � 100 101 50 1 From W to E
4 G4 50 � 100 100 50 1 From W to E
5 G5 50 � 150 76 50 2 From S to N
6 G6 50 � 60 32 50 2 From W to E
7 G7 50 � 100 52 50 2 From W to E
8 G8 50 � 150 76 50 2 From W to E
9 G9 50 � 150 76 50 2 From W to E
10 G10 50 � 100 51 50 2 From W to E
11 G11 50 � 100 52 50 2 From W to E
12 G12 50 � 100 51 50 2 From W to E
Figure 7 Expected buried features at profile P29.
Figure 8 Expected buried features at profile P30.
Implementation of ground penetrating radar and electrical resistivity tomography 151
It is very important after data acquisition to purify the raw
data from any noise and unwanted reflections that are pro-duced by antenna ‘‘ringing”, differences in the coupling ofenergy with the ground, multiple reflections that occur between
the antenna and the ground surface and also background noise(Conyers, 1997), enhance the desired reflections, and correctthe horizontal and vertical scales of the raw data. The final
steps in data processing involve transforming radar data intousable images. There are certain steps of data processingapplied on the raw GPR data using REFLEX program. These
steps are Static Correction, A band pass filter, Running Aver-
age, Background-Removing Filter, Energy decay filter, X Flipthe Profile, and Trace Interpol-3D File.
The 2D electrical resistivity data obtained from the field
represent the apparent resistivity of the subsurface whereasthe true resistivity is required to reflect the best subsurfacestructures (Loke, 1997). The computer program RES2DINV
is used to automatically subdivide the subsurface into a num-ber of blocks, and it then uses a least-squares inversion schemeto determine the appropriate resistivity value for each block so

Figure 9 Expected buried features at profile P31.
Figure 10 Profiles P29, P30 and P34 in 3D intersect.
Table 2 Summarize the parameters of the detected anomalies
along grid G1.
Profile Object Surface distance (m) Depth (m)
P22 1 45 0.8
P29 1 8.7 1.28
2 15.3 1.17
3 22.97 0.9
P30 1 7.5 2
2 15.4 1.3
P31 1 4.77 1.26
2 9 1.15
P32 1 7.12 0.75
P33 1 15.68 0.85
P34 1 11 1.18
2 10.78 3.1
152 A.M. Abbas et al.
that the calculated apparent resistivity values agree with the
measured values from the field survey. When the subsurfacebodies of interest have gradational boundaries, theconventional smoothness-constrained inversion method (De
Groot-Hedlin and Constable, 1990) gives a model which moreclosely corresponds with reality.
4. Interpretation of GPR and ERT Data
GPR data interpretation is an essential step to determine thelocation of the anomalies that appears on the processed
sections and discriminate them from the other undesired
Table 3 Recognized anomalies at the area ‘‘A1”.
Profile No. Recognized archeological anomaly Horizontal lo
P1 1 94
2 118
P5 1 110
P16 1 32
2 55
3 70
reflections. It also involves tracing the anomalies that appearon the successive sections to determine the subsurface extent
and the expected depth of the buried objects that found inthe surveyed grids. The results are displayed in three categories:one dimension trace (1D), two dimension cross section (2D)
and three dimension block view. In the present study we haveachieved the next three procedures on the processed GPR data:
(1) The first step of the interpretation of radar data for eacharea starts with displaying 2D cross sections that containthe expected buried features.
cation (m) Depth (m) Width (m) Resistivity range
1.4 5 High
1.4 9 High
1.4 20 Very high to high
1.4 26 High
1.4 5 Very high
1.4 6 High
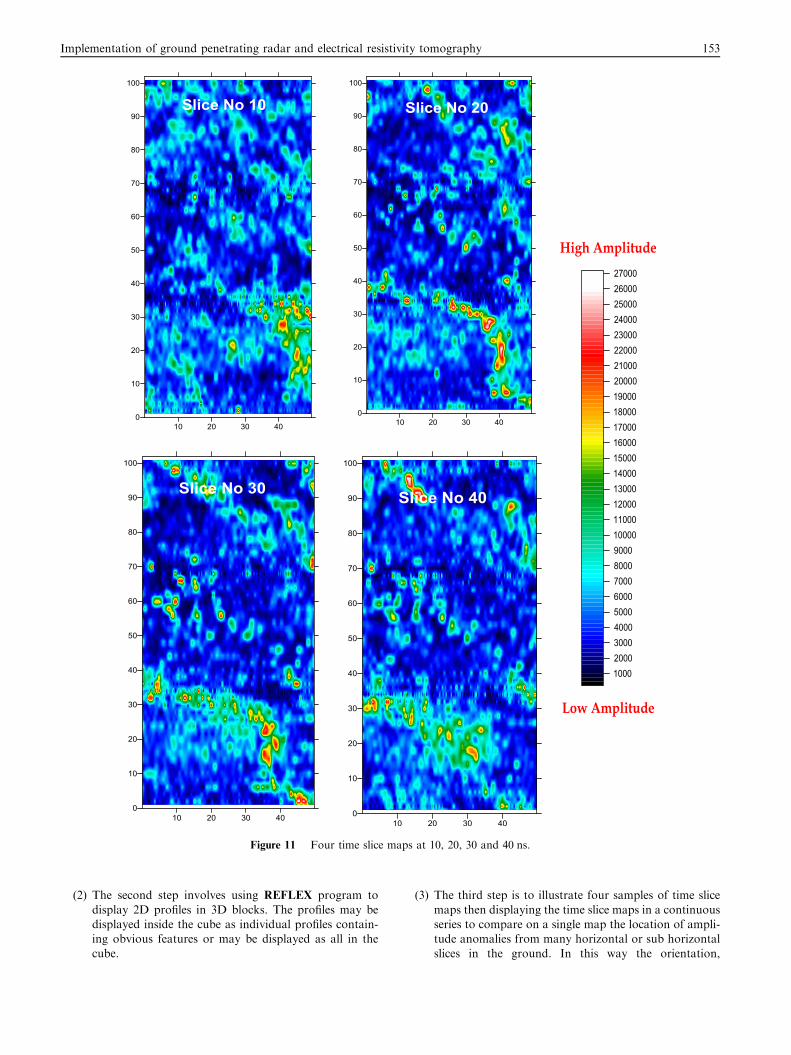
Figure 11 Four time slice maps at 10, 20, 30 and 40 ns.
Implementation of ground penetrating radar and electrical resistivity tomography 153
(2) The second step involves using REFLEX program to
display 2D profiles in 3D blocks. The profiles may bedisplayed inside the cube as individual profiles contain-ing obvious features or may be displayed as all in the
cube.
(3) The third step is to illustrate four samples of time slice
maps then displaying the time slice maps in a continuousseries to compare on a single map the location of ampli-tude anomalies from many horizontal or sub horizontal
slices in the ground. In this way the orientation,
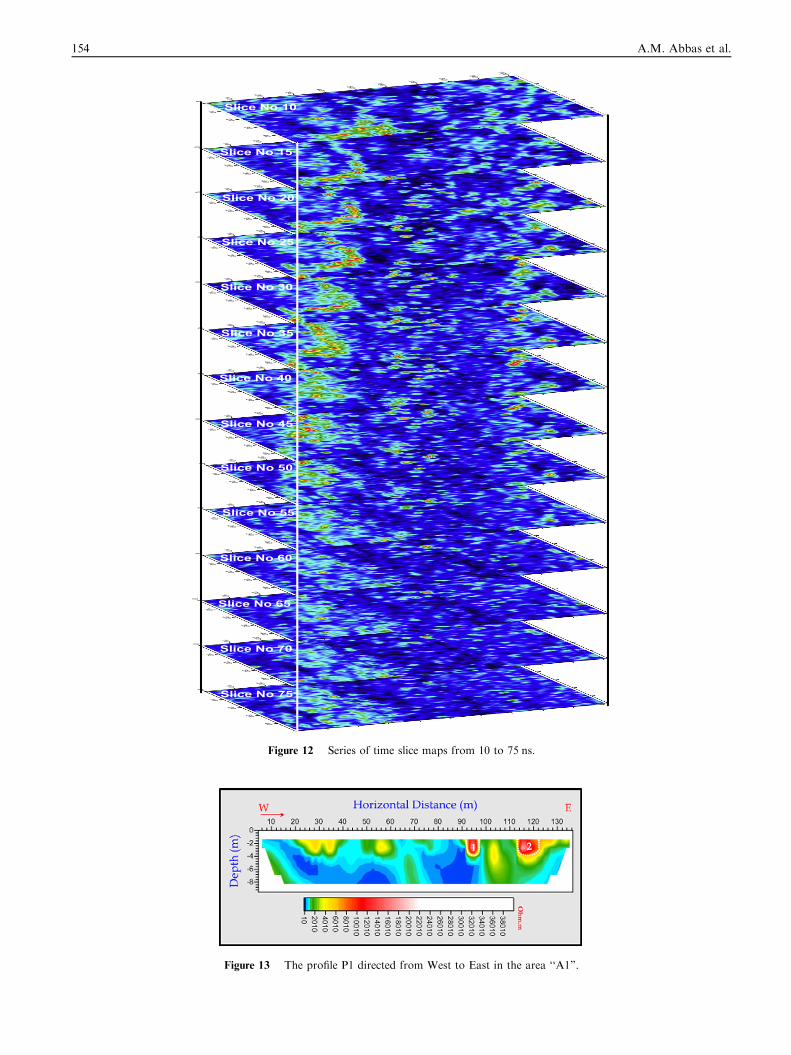
Figure 12 Series of time slice maps from 10 to 75 ns.
Figure 13 The profile P1 directed from West to East in the area ‘‘A1”.
154 A.M. Abbas et al.

Figure 14 The profile P5 directed from West to East in the area ‘‘A1”.
Figure 15 The profile P16 directed from West to East in the area ‘‘A1”.
Figure 16 The profile P13 directed from West to East in the area ‘‘A2”.
Figure 17 The profile P14 directed from West to East in the area ‘‘A2”.
Implementation of ground penetrating radar and electrical resistivity tomography 155

Table 4 Recognized anomalies at area ‘‘A2‘‘.
Profile No. Recognized archeological anomaly Horizontal location (m) Depth (m) Width (m) Resistivity range
P13 1 52 2.8 8 High
P14 1 32 1.4 8 High
2 58 2.4 10 High
Figure 18 (a) Block of depth slice maps from 0.25 m to 5 m for the area ‘‘A1”, and (b) Block of depth slice maps from 0.5 m to 16 m for
the area ‘‘A2”.
156 A.M. Abbas et al.

Figure 19 Location map of GPR survey together with ERT
survey.
Implementation of ground penetrating radar and electrical resistivity tomography 157
thickness, and relative amplitudes of anomalies arevisible in three-dimensions. Amplitude slices are usuallymade in equal time intervals, with each slice representing
an approximate thickness of buried material. The timeslice maps are made at each 5 ns for each area.
Grid G1Some of 2D Sections are illustrated in Figs. 7–9.The Compiled 3D-intersect of grid G1 is shown in Fig. 10.
Fig. 11 Illustrates sample of the Time Slices of grid G1.Fig. 12 shows combined map for the time slices of grid G1.The detected anomalous features are listed in Table 2.The ERT profiles show areas of very high resistivity values
that appeared as white color and high resistivity values thatappeared as red color. These values could indicate an empty
Figure 20 (a) The profile P9 in the area A2 and the radar profiles a
profiles adjacent to it.
volume (Open cavity, Shafts, Halls, Rooms, etc.) which in turncould reflect a subsurface archeological potentiality.
Table 3 gathers some of recognized anomalies, their hori-
zontal location, their depth, their width and the resistivityrange for each profile of ten profiles covered the area ‘‘A1”.The 2D profiles are arranged according to the table (Figs. 13–
15).Table 4 lists some of outlined anomalies, their horizontal
location, their depth, their width and the resistivity range for
each profile of nine profiles covered the area ‘‘A2”. The 2Dprofiles are arranged according to the table (Figs. 16 and 17).
5. Electrical resistivity tomography data in 3D
The parallel 2D survey lines for areas A1 and A2 can be com-bined to 3D maps by using program RES3DINV.
The RES3DINV program carries out a true 3D inversion(in that the resistivity values are allowed to vary in all threedirections simultaneously during the inversion process),whether the data set contains sufficient 3-D information to
produce a reasonably accurate 3D model. This program usesthe Gauss–Newton method that recalculates the Jacobeanmatrix of partial derivatives after each iteration (Loke and
Dahlin, 2002). The inversion program divides the subsurfaceinto a number of small rectangular prisms, and attempts todetermine the resistivity values of the prisms so as to minimize
the difference between the calculated and observed apparentresistivity values. The optimization method tries to reducethe difference between the calculated and measured apparentresistivity values by adjusting the resistivity of the model
blocks. A measure of this difference is given by the root-mean-squared (RMS) error (Geotomo Software, 2014).
The output of RES3DINV Program for the Area ‘‘A1” and
the area ‘‘A2” is exported as xyz format and then has drawnon SURFER 11 (Golden Software, Inc., 2012) program totrace the buried features that found in three dimension in the
subsurface.For the area ‘‘A1”, the depth of the last slice that resulted
from the program is at 25 m, but the lower surface of the
expected buried features is appeared till a maximum depth5 m, so illustration down to depth 5 m was done to concentrate
djacent to it, and (b) the profile P10 in the area A2 and the radar

Figure 21 The result of GPR and ERT anomalies at depth from 0.44 m to 2.64 m.
158 A.M. Abbas et al.
on the anomalous features that may be found in that area atthat depth (Fig. 18).
For the area ‘‘A2”, the depth of the last slice that resultsfrom the program is at 16 m and the anomalous features areextended to that mentioned depth, so illustration down to
depth 16 m was done to concentrate on the anomalous featuresthat may be found in that area (Fig. 19).
6. Integration between GPR profiles and ERT profiles
The emulation between the outcomes ofGPR and ERT requires
to exhibit the survey location of these two techniques (Fig. 19).The following figure illustrates an example of the integra-
tion between GPR profiles and corresponding ERT profilesmeasured at the same line (see Fig. 20).

Implementation of ground penetrating radar and electrical resistivity tomography 159
7. Results of this research
In this research, to integrate the outcomes of the applied twogeophysical techniques in one massive result indicating the
probable archeological targets, we decided to designate threeconstrains that are as follows:
� If the two geophysical techniques are affirming the sameanomaly, this anomaly is 100% factual archeologicalstructure.
� If the anomaly under investigation was detected due to
matching of one technique, then this anomaly is 50% truearcheological target.
Fig. 21 illustrates the anomalies that have outlined fromboth the 3D inversion of ERT profiles and the time-depthslices of the GPR profiles for depth from 0.44 m to 2.64 m.
This figure shows many anomalous features as follows:
� The expected buried anomalies resulted from GPR only are
shown in green color. According to the previously assignedconstrain, their potentiality of existence is 50%.
� The same due to anomalies resulted from ERT that isshown in dashed lines. According to the above mentioned
constrains, their potentiality of existence is 50%.� The anomalies delineated due to both ERT and GPR areshown in red color and their potentiality of existence is
100%.
References
Abbas, A.M., Kamei, H., Helal, A., Atya, M.A., Shabaan, F.A., 2005.
Contribution of geophysics to outlining the foundation structure of
the IslamicMuseum, Cairo. Egypt. Archaeol. Prospect. 12, 167–176.
Abbas, Abbas M., Salah, Hany., Massoud, Usama., Fouad, Mona.,
Abdel-Hafez, Mahmoud., 2015. GPR scan assessment at Mekaad
Radwan Ottoman – Cairo, Egypt.
Conyers, Lawrence, B., 1997 Ground Penetrating Radar: an intro-
duction for archaeologists/Lawrence B. Conyers and Dean Good-
man, pp. 1–232.
De Groot-Hedlin, C., Constable, S., 1990. Occam’s inversion to
generate smooth, two dimensional models form Magnetotelluric
data. Geophysics 55, 1613–1624.
Geotomo Software, 2014. Rapid 3-D Resistivity & IP inversion using
the least-squares method (For 3-D surveys using the pole–pole,
pole–dipole, dipole–dipole, rectangular, Wenner, Wenner-Schlum-
berger and non-conventional arrays) On land, aquatic and cross-
borehole surveys, 122 p.
Golden Software, Inc., 2012. Surfer for Windows, Version 11,
Powerful contouring and Gridding, and 3-D Surfer Mapping.
Loke, M.H., 1997. Electrical imaging surveys for environmental and
engineering studies, 63 p.
Loke, M.H., Dahlin, T., 2002. A comparison of the Gauss–Newton
and quasi-Newton methods in resistivity imaging inversion. J.
Appl. Geophys. 49, 149–162.
Moustafa, Adel R., Saoudi Ati, Moubasher Alaa, Ibrahim Ibrahim
M., Molokhia Hesham, Schwartz Bernie, 2002. Structural setting
and tectonic evolution of the Bahariya Depression, Western Desert,
Egypt, 34 p.
Said, R., 1962. The Geology of Egypt. Elsevier, Amsterdam, 377 p.