Embed Size (px)
Citation preview

ARTICLE IN PRESS
Nuclear Instruments and Methods in Physics Research A 602 (2009) 537–544
Contents lists available at ScienceDirect
Nuclear Instruments and Methods inPhysics Research A
0168-90
doi:10.1
� Tel.:
E-m
journal homepage: www.elsevier.com/locate/nima
Implementation of complex signal-processing algorithms forposition-sensitive microcalorimeters
Stephen J. Smith �
NASA Goddard Space Flight Center, Greenbelt, MD 20771, USA
a r t i c l e i n f o
Article history:
Received 1 December 2008
Accepted 28 January 2009Available online 6 February 2009
Keywords:
Transition-edge sensor
Position-sensitive X-ray detector
Microcalorimeter
International X-ray observatory
Correlated energy-position optimal filter
02/$ - see front matter & 2009 Elsevier B.V. A
016/j.nima.2009.01.158
+1301 286 3719; fax: +1301 286 1684.
ail address: [email protected]
a b s t r a c t
We have recently reported on a theoretical digital signal-processing algorithm for improved energy and
position resolution in position-sensitive, transition-edge sensor (PoST) X-ray detectors [Smith et al.,
Nucl. Instr. and Meth. A 556 (2006) 237]. PoST’s consists of one or more transition-edge sensors (TES’s)
on a large continuous or pixellated X-ray absorber and are under development as an alternative to
arrays of single-pixel TES’s. PoST’s provide a means to increase the field-of-view for the fewest number
of read-out channels. In this contribution we extend the theoretical correlated energy-position optimal
filter (CEPOF) algorithm (originally developed for 2-TES continuous absorber PoST’s) to investigate the
practical implementation on multi-pixel single TES PoST’s or Hydras. We use numerically simulated
data for a nine-absorber device, which includes realistic detector noise, to demonstrate an iterative
scheme that enables convergence on the correct photon absorption position and energy without any a
priori assumptions. The position sensitivity of the CEPOF implemented on simulated data agrees very
well with the theoretically predicted resolution. We discuss practical issues such as the impact of
random arrival phase of the measured data on the performance of the CEPOF. The CEPOF algorithm
demonstrates that full-width-at-half-maximum energy resolution ofo8 eV coupled with position-
sensitivity down to a few 100 eV should be achievable for a fully optimized device.
& 2009 Elsevier B.V. All rights reserved.
1. Introduction
Microcalorimeters such as transition-edge sensors (TES’s) [1]and metallic magnetic calorimeters (MMC’s) [2] are underdevelopment by numerous groups worldwide for future X-rayastronomy missions such as the International X-ray Observatory(IXO), jointly under study by NASA and ESA. IXO is a merger ofNASA’s Constellation-X [3] and ESA’s XEUS [4] mission concepts.Beyond IXO, this development is targeted at NASA’s Generation-X‘vision mission’ [5]. Arrays of single-pixel TES’s offer impressivefull-width-at-half-maximum (FWHM) energy resolution of DE
�2–3 eV in the soft X-ray energy range coupled with count-ratesthat can accommodate up to 100’s per pixel per second [6–8].Alternatives to single-pixel arrays are position-sensitive TES’s(PoST’s) [9]. PoST’s consist of either a single large absorber or aseries of segmented absorbers, which are thermally coupled toone or more read-out sensor [10–13]. Heat diffusion between theabsorber(s) and the TES’s gives rise to position dependence of thepulse shapes and enables position discrimination. Such devicesare aimed at reducing the number of read-out channels for a given
ll rights reserved.
focal plane area at some expense in energy resolution and count-rate capability.
We are currently pursuing single-channel PoST’s, commonlyreferred to as Hydras, which consist of multiple absorber elementseach with a different thermal coupling to a single TES readoutchannel [13–15]. Fig. 1 shows a schematic diagram of a 9-pixelHydra. Results from first-generation 4-pixel Hydras have demon-strated FWHM energy resolution of between 5 and 6 eV at anenergy of 5.9 keV for devices with a 250mm pixel pitch. We areextending this approach to incorporate more absorber elements,enabling further increases in the field-of-view for missions suchas IXO, and further, to investigate alternative MMC Hydra designs.
The ability to differentiate between different pulse shapesscales with the photon energy E [16]. For a segmented absorberPoST, such as the Hydra, the pulse shapes are quantized and theposition resolution (Dx) is constrained by the pixel size. Belowsome threshold energy, the signal-to-noise ratio will be degradedsuch that it is not possible to distinguish between different shapesof pulse and position sensitivity will be lost. For a continuousabsorber device it follows that Dx p 1/E. Thus, continuous PoST’scan potentially achieve very high position resolution. However, inthe continuous devices, the position x and energy E areintrinsically correlated such that an error in the x (due to noise)will propagate into an error in E. Depending upon the specificdevice design, this can result in a significant degradation in DE.

ARTICLE IN PRESS
Fig. 1. Schematic diagram of the Hydra concept, showing nine absorbers each with
a different thermal conductance to a single TES. Each absorber is supported above
the TES and membrane via a ‘T’-shaped absorber stem (color online).
Table 19-Pixel Hydra model parameters.
Parameter Symbol
(units)
Value
Heat capacity per absorber C (pJ/K) 0.35
Thermal conductance to heat sink Gb (pW/K) 650
TES transition temperature Tc (mK) 90
Bath temperature Tb (mK) 50
TES normal state resistance RN (mO) 7
Fractional bias point R0/RN (%) 15
Bias circuit load resistor Rl (mO) 0.25
Internal thermal conductances for
absorbers 2–9
GL (nW/K) 34, 21, 14, 10.3, 7.3, 5,
3.7, 3
TES resistance sensitivity a 60
TES current sensitivity b 2.0
SQUID input coil inductance Lin (nH) 90
Integration step size Dt (ms) 1.0
Number of samples per record Ns 215
Note that absorber 1 is assumed infinitely well coupled to the TES.
S.J. Smith / Nuclear Instruments and Methods in Physics Research A 602 (2009) 537–544538
The signal processing analysis is typically more computationallyintense for the continuous absorber case since there is acontinuous population of different pulse shapes, as opposed to adiscrete set corresponding to each element of a segmentedabsorber. The energy of the photon is found using a digitaloptimal filter [17], optimized for a specific pulse shape. Conse-quently, a much larger number of template filters will be required(of the order L/Dx, where L is the linear dimension of the detector),otherwise the filters will not be well matched to the pulse shapesand some loss in resolution will result.
We are developing complex signal-processing algorithms forposition-sensitive microcalorimeters [15,16,18]. In Ref. [16] wereported a theoretical signal-processing algorithm for simulta-neous determination of the energy and position in one-dimen-sional (continuous absorber) 2-TES PoST’s. In this contribution weadapt this correlated energy-position optimal filter (CEPOF)algorithm to investigate segmented absorber devices such as theHydra, which we are currently developing for IXO. We usenumerically simulated pulses (for a 9-pixel Hydra), which includerealistic detector noise to demonstrate an iterative implementa-tion method, which converges on the correct photon position andenergy without any a priori assumptions.
2. Hydra numerical model
To simulate realistic pulse and noise data we use the fourth-order Runge-Kutta [19] technique to integrate a system ofordinary non-linear differential equations that describes theHydra. For this study we assume a 9-pixel Hydra (see Fig. 1),which is an alternative to the 4-pixel device already experimen-tally characterised. Each Hydra absorber is modelled as a singleheat capacity C coupled to a TES via a link conductance GL. The TESis electrically voltage biased using a load resistor of RL, and is fluxcoupled to a SQUID read-out and electronics chain via an inputcoil with inductance Lin. We use typical design parameters fromthe experimental characterisation of the 4-pixel designs (see
Table 1). We assume a linear current- and temperature-dependentresistive transition of the form
RðT ; IÞ ¼ R0 þ aR0
T0DT þ b
R0
I0DI, (1)
where R0, T0 and I0 are the detector resistance, temperature andcurrent at the quiescent operating point and a and b are the unit-less TES resistance and current sensitivities, respectively. Overtypical resistance excursions due to 5.9 keV photons, such atransition shape is found to describe the experimentally measuredpulse shapes accurately. To incorporate realistic detector noise weuse a random number generator with Gaussian distribution,which is added to the input of the model at every time step. Forthe TES near equilibrium, non-linear Johnson noise [20] we set thevariance of our Gaussian noise to (4kbT0R0DB(1+2b))1/2 (in units ofvolts) where kb is the Boltzmann constant and DB is thebandwidth of the noise, which in the context of our numericalmodel is equivalent to 1/(2Dt), where Dt is the integration stepsize. We also include the Johnson noise from the TES bias circuit,which has the same form except it is in equilibrium and hence wedrop the b dependence. For the thermal fluctuation (phonon)noise between the different detector heat capacities as well as thedetector and the heat sink, we have (4kbT0
2GgDB)1/2 (in units ofwatts), where G is the thermal conductance between the relevantdetector elements and g is a unit-less constant which describesthe temperature gradient across the conductance link [21]. It is�0.5 for the thermal fluctuation noise between the TES and theheat sink and is �1 for the internal thermal links which areapproximately isothermal. In our 4-pixel Hydras we observed anexcess in the low-frequency noise of approximately 1.2 times thelevel of the phonon noise to the heat sink [14], which we alsoinclude in this model. A white readout noise equivalent to 5 pA/OHz on the TES input is also assumed. This model intrinsicallyincludes non-linearity of the pulse shape as well as any associatednon-stationary noise. Fig. 2a shows a plot of the simulated pulseshapes for the 9-pixel Hydra with design parameters as listed inTable 1, the noise terms are set to zero. The internal thermalconductances are chosen to give approximately equal spacingbetween the pulse shapes. Fig. 2b then shows the frequencydomain plot of the same pulse shapes as well as the noise powerspectral density averaged over 400 simulated noise traces. Boththe pulses and the noise spectral density agree well with thatpredicted from linear small signal responsivity models (such asthat described in Refs. [14,22]) using the same device parameters.

ARTICLE IN PRESS
180
150
120
90
60
30
0
Cur
rent
(nA
)
2.52.01.51.00.50.0Time (ms)
Absorber 1Absorber 2Absorber 3Absorber 4Absorber 5Absorber 6Absorber 7Absorber 8Absorber 9
10-12
246
10-11
246
10-10
246
10-9
Spec
tral D
ensi
ty (A
/sqr
t (H
z))
100 Hz 1 kHz 10 kHz 100 kHzFrequency
Absorber 1Absorber 2Absorber 3Absorber 4Absorber 5Absorber 6Absorber 7Absorber 8Absorber 9
Average Noise
Fig. 2. (a) Simulated 9-pixel Hydra noise-less pulse shapes for a photon energy of
100 eV. Absorber 1 is the most strongly coupled absorber to the TES. (b) Power
spectral density averaged from 400 simulated noise records and spectral density of
the noise-free pulse shapes (color online).
S.J. Smith / Nuclear Instruments and Methods in Physics Research A 602 (2009) 537–544 539
3. Correlated energy-position optimal filter (CEPOF) algorithm
The CEPOF algorithm is an adaptation of the standard digitaloptimal filter for determining photon energy in single-pixelcalorimeters [17]. In a PoST we want to solve for both the energyand the position simultaneously. When a photon is absorbed atposition xg on a one-dimensional absorber, the measured data D
can be modelled as a (first-order) Taylor expansion around somereference position x such that D ¼ H(S+(xg-x)S/), where S is thesignal responsivity, S/
¼ dS/dx is derivative of S with respect to x
and H is a scalar representing the photon energy. Thus, toconstruct our CEPOF we minimise the difference between themeasured data and our modelled pulse. In one dimension, with n
TES readout channels, the w2 condition to minimise is [16]:
w2 ¼X½D� HðSþ dxS=Þ�nT W ½D� HðSþ dxS=Þ�, (2)
where D, S are S/ are n element vectors containing the data,responsivity and derivative of the responsivity, respectively, foreach TES. W is the weight matrix and is the inverse of the n�n
variance–covariance matrix, which describes the detector noise.Eq. (2) is easily adapted for the Hydra case, which consists of asinge TES (n ¼ 1) connected to a series of m absorber elements:
w2 ¼X ðD� HðSi þ diS=i ÞÞ
2
hjNj2i, (3)
here /|N2|Sis the measured power spectral density of the noise.Even though they may not be physically positioned in anyparticular order, for the purpose of this algorithm we canreference the absorbers in order of most similar pulse shapesfrom i ¼ 1; . . . ;m. Thus we replace the continuous positionvariable x with an integer position i. Then, Si is calculated foreach absorber i and their derivatives are evaluated betweensequentially ordered absorbers such that S/
i ¼ dSi/di. di is thensimply (ig�i). As described in Ref. [16], we can minimise Eq. (3)with respect to di and H, which leads to a pair of simultaneousequations in Hdi and H which have the solution:
H
Hdi
� �¼
XFiSi
XF=i S=i �
XF=i Si
� �2� ��1
PF=i S=i �
PF=i Si
�P
F=i Si
PFiSi
0@
1A
PFiDPF=i D
!.
(4a)
Collecting normalization terms into the constants ki1, ki2 and ki3,we can write
H ¼ ki1
XFiDi þ ki2
XF=i Di (4b)
and
Hdi ¼ ki2
XFiDi þ ki3
XF=i Di. (4c)
For our Hydra we have m template optimal filters of the formFi ¼ Si
*/N2. Fi/ is then the derivative of the filter with respect to
position i. Thus if we apply a filter corresponding to an absorber i
the CEPOF will give a self-consistent estimate of both the energy H
and the relative position di from the assumed starting position i. Ifthe first-order derivatives exactly match the variation in pulseshape across all absorbers, then this will give the correct energyand position. However, in reality the first-order terms may only beaccurate close to the true absorber position. Consequently, someiteration may be required to converge on the correct pixel. Fig. 3ashows, for the Hydra case outlined in Section 2, the calculatedvalue of di (using Eq. (4)) for each pixel i, for a single 100 eV X-raywith no noise, absorbed in pixel i ¼ 5. The filters and derivativesare all calculated using the 100 eV template pulse and the averageof 400 noise traces. The presence of noise and error in thederivative function at larger di means that di may not be an exactinteger value. Thus to converge on a solution we must round di tothe nearest integer value. In this example, the maximum numberof iterations after the initial estimate required to converge todi ¼ 0 is 3, though the typical result is only 1 iteration. Fig. 3bshows the calculated value of the photon energy H for the sametest case. Also shown in this plot is the effect of dropping thecorrelation term in Eq. (4) F/S, then our energy calculationbecomes independent of position and Hi–E (for iaig) becomessignificantly larger.
4. Energy resolution and position sensitivity
Assuming we have converged to the correct pixel (di ¼ 0), thetheoretical root-mean-squared (rms) energy resolution andposition resolution are found from the variance on H and Hdi
[16,23]:
Di ¼
PFiSi
� 1=2
2EP
FiSi
PF=i S=i �
PF=i Si
� �2� �1=2
(5a)
and
DE ¼
PF=i S=i
h i1=2
2P
FiSi
PF=i S=i �
PF=i Si
� �2� �1=2
. (5b)

ARTICLE IN PRESS
-5
-4
-3
-2
-1
0
1
2
3
987654321Pixel
110
100
90
80
70
60
H (e
V)
δiδi rounded to integer
Full algorithm Energy-position correlation set to zero
δi
Fig. 3. (a) Calculated value for di at each of the 9 Hydra absorber pixels for a 100 eV
photon absorber at pixel i ¼ 5. (b) For the same example we show the calculated
photon energy H using the complete algorithm and calculated assuming that the
position and energy are independent (color online).
70
60
50
40
30
20
10
0
Pos
ition
err
or a
t 50
eV (%
)
987654321Pixel
Theoretically CalculatedSimulated DataSimulated Data (converging from pixel 5)
Fig. 4. Theoretically calculated position error for each pixel at a photon energy of
50 eV. Also shown is the actual position error for a population of 100 simulated
pulses assuming a starting position of i ¼ ig and then for the case i ¼ 5 (color
online).
S.J. Smith / Nuclear Instruments and Methods in Physics Research A 602 (2009) 537–544540
For our segmented absorber example, the units of Di are in pixelnumber or i. Assuming a Gaussian distribution of di around di ¼ 0,we can convert Di into a probability Pi that a photon will beassigned to the correct pixel or its neighbouring pixels. Theprobability of an event with |di|Xx can be found from thecomplementary Gaussian error function, erfc,
Pi xað Þ ¼ A2ffiffiffiffipp
Z 1xa
e�u2du ¼ Aerfc xað Þ, (6a)
where
a ¼1
2ffiffiffi2p
1
Di(6b)
For the end pixels (i ¼ 0 and i ¼ m) we set A ¼ 0.5 and for allother pixels (i ¼ 1; . . . ;m�1), A ¼ 1. For x ¼ 1, Eq. (6) gives theprobability that the photon will be assigned to the incorrect pixel(i a ig), for x ¼ 3 this is the probability that the photon will havean assignment error of greater than 1 pixel on either side of ig.Fig. 4 shows the calculated probability of an incorrect pixelassignment (x ¼ 1) using Eq. (6) for all the absorber pixels with aphoton energy of E ¼ 50 eV. Also shown in this plot is the actualerror in a sample of 100 simulated photons in which we calculatethe pixel assignment using Eq. (4). To demonstrate the intrinsicposition error at di ¼ 0 we assume a starting position of i ¼ ig(circle symbols). Both the theoretically calculated error and theactual position error show on average very good agreement acrossall pixels. In a real detector where we have no a priori informationabout the event, we must start at some fixed pixel, such as the
center pixel i ¼ 5, for example, and allow the CEPOF algorithm toconverge to a solution. Depending upon the level of noise and theaccuracy of the derivative functions this can result in aconvergence error due to a local minimum in di. This data is alsoshown in Fig. 4 (asterisks). The total average position error isslightly degraded from 33.2% to 34.7%. Fig. 5a shows, for pixel 5only, the theoretically calculated position error as a function ofenergy as well as the actual position error for 100 simulatedpulses at 20, 50, 100 and 300 eV. In Fig. 5b we show, for the samedata at 20, 50 and 100 eV, a histogram of the actual pixelassignments. Thus even if the pixel error is relatively high; themajority of incorrectly assigned events are assigned to the nearestneighbour pixels so the position resolution will not be completelylost. At 50 eV the average number of iterations (across all pixels)after the initial position estimate is 1.23, this falls to 1.12 at 100 eVand 1.02 at 300 eV. For the latter there is o0.1% position erroracross all pixels. Depending upon the number of absorberelements the number of iterations could be reduced by makingan initial position estimate using some other measure such asrise-time for example.
At an energy of 50 eV, it was found that approximately 10% ofthe total events, averaged over all absorbers, would fail toconverge on a solution and iterated continuously between twopixels, where in both cases jdijX0.5. In the implementation of theCEPOF we set the final pixel assignment to correspond towhichever pixel had the smallest jdij. Of these events approxi-mately 50% were then correctly assigned. By rejecting theseevents some modest improvement in the total position error from35% to 33% can be achieved, at the expense of a 10% drop inthroughput.
The term Fi/S is a measure of the intrinsic correlation between
energy and position and is required to give a self-consistent valueof H and di. In a continuous absorber PoST this energy-positioncorrelation results in a degradation of the energy resolution andposition resolution. In the segmented PoST, however, once wehave converged on the correct pixel, the position-energy correla-tion disappears and this term can be dropped in calculating thephoton energy. Eq. (6b) then reduces to the single pixel form ofthe energy resolution given by DEi ¼ (4
PFiSi)
�0.5. Fig. 6 shows thecalculated FWHM energy resolution (2.355DEi) using the fullCEPOF and that with the correlation term dropped. Thus droppingthis term gives a more accurate estimate of the energy. At lower

ARTICLE IN PRESS
100
80
60
40
20
0
Pos
ition
err
or (%
)
12 3 4 5 6
102 3 4 5 6
1002 3 4 5
Energy (eV)
Theoretically Calculated Simulated Data
100
90
80
70
60
50
40
30
20
10
0
Cou
nts/
pixe
l (%
)
1 2 3 4 5 6 7 8 9Pixel
100eV50eV20eV
Fig. 5. (a) Theoretically calculated position error as a function of energy for pixel 5.
Also shown is the actual position error for a population of 100 simulated pulses at
the energies of 20, 50, 100 and 300 eV. (b) Histogram of pixel assignments for
simulated data at 20, 50 and 100 eV (color online).
7.5
7.0
6.5
6.0
5.5
5.0
4.5
FWH
M E
nerg
y R
esol
utio
n (e
V)
987654321Pixel
Full algorithmEnergy-position correlation set to zero
Fig. 6. FWHM energy resolution calculated using both the full CEPOF algorithm
and dropping the energy-position correlation (color online).
S.J. Smith / Nuclear Instruments and Methods in Physics Research A 602 (2009) 537–544 541
photon energies where we may have error in the position, thenthe resolution calculated using the full algorithm gives a betterapproximation to the actual energy resolution.
So far the analysis has assumed that the template responsiv-ities and derivatives are calibrated in the small signal limit wherethe pulses are linear with energy. Assuming a higher calibrationenergy such as that from an 55Fe source of 5.9 keV has thepotential to introduce some level of non-linearity in the detector
16
14
12
10
8
6
4
FWH
M E
nerg
y R
esol
utio
n (e
V)
0.12 3 4 5 6 7 8 9
12 3 4 5 6
Normalized link conductances
Pixel 1Pixel 5Pixel 8
Fig. 7. FWHM energy resolution calculated using both the full CEPOF algorithm
(solid lines) and dropping the energy-position correlation (dashed lines) as a
function of the internal link thermal conductances GL (GL is normalized to
configuration described in Table 1. Data is shown for pixels 1, 5 and 8 (color
online).
80
60
40
20
0
Pos
ition
Err
or (%
)
0.12 3 4 5 6 7 8 9
12 3 4 5 6
Normalized link conductances
Pixel 1 Pixel 2Pixel 5 Pixel 8
Fig. 8. Position error at 50 eV as a function of normalized link conductance for
pixels 1, 2, 5 and 8 (color online).

ARTICLE IN PRESS
S.J. Smith / Nuclear Instruments and Methods in Physics Research A 602 (2009) 537–544542
response. This has the potential to degrade the position sensitivitysince the high-energy template may not be well matched to thelow-energy linear pulse. The vast majority of non-linearity comesabout from the dis-proportionality between the measured changein current DI and the TES resistance R (DIp1/R2); this effect isintrinsically included in our model. The significance of this effectwill depend upon the specific design parameters of the device inquestion. For our current Hydra example we find that by using thenon-linear 5.9 keV template, we introduce no additional error inthe position sensitivity though, as is conventional for a single-pixel TES, a small correction is required to re-calibrate the gainscale. At higher energies further non-linearity can occur due to thedependence of a and b on the resistive transition and saturationcan occur when the TES is driven fully into the normal state. Thiseffect does represent an extreme case and is neglected in ourmodel since we keep a and b constant. If non-linearity effects arefound to be a problem for a specific detector, then using multiplecalibration lines, or implementing non-linear optimal filteringtechniques as discussed in Refs. [24,25] can be used to improveperformance.
PoST’s have an intrinsic trade-off between energy resolutionand position sensitivity that depends upon the ratio of theinternal to external thermal conductances [16]. If the absorbers
350
300
250
200
150
Ene
rgy
(eV
)
-40 -30 -20 -10Phas
320
310
300
290
280
270
Ene
rgy
(eV
)
-4
-3
-2
-1
0
1
2
δi (p
ixel
)
Pixel 1Pixel 8
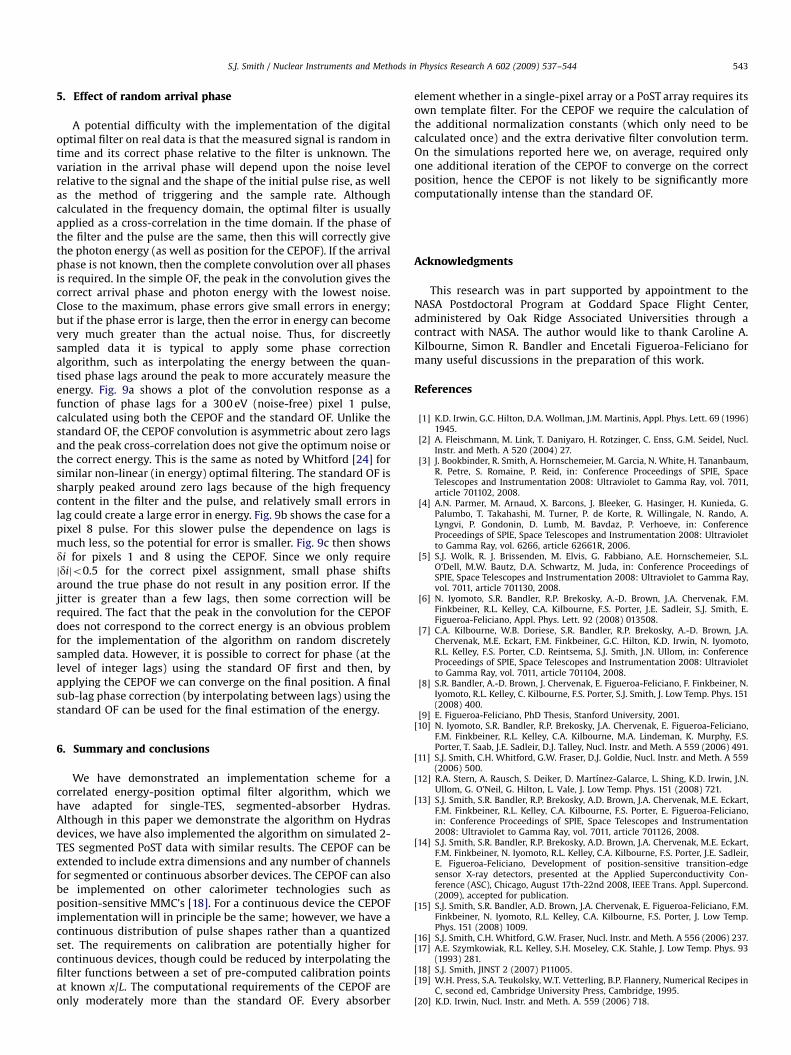
Fig. 9. (a) Convolution of the CEPOF and standard OF with a 300 eV pulse from pixel 1
pulse relative to the filter. (b) Same as for Fig. 9a using a pixel 8 pulse. (c) di for both
are all strongly thermally coupled to the TES, then the energyresolution will be optimal but there will be no signal variationwith position. Reducing the internal conductances relative to thebath conductance introduces position dependence but attenuatesthe decoupled absorber signal relative to the noise, as well asadding more internal thermal noise. This is illustrated in Figs. 7and 8 where we show the calculated FWHM energy resolution andposition error, respectively, at 50 eV as a function of the internallink conductances, which are normalized to the configurationdescribed in Table 1. Only a subset of pixel data is shown. As thelink conductances are reduced, the position error passes through aminimum and then starts to degrade. This is because thedegradation in signal-to-noise ratio out-weighs any improvementsdue to increasing the separation of the pulse shapes. The minimumoccurs at different conductances for each pixel but are relativelybroad, meaning it is possible to achieve both good positionsensitivity and energy resolution across all absorber pixels. As theGL’s are reduced, the TES and most strongly coupled absorberbecome more and more isolated from the other elements and theenergy resolution (without position correlation) improves. In theextreme limit of GL-0 we find DE ¼ 1.7 eV; since the energyresolution scales as the square root of the total heat capacity this isO9 times lower than the GL-N case where DE ¼ 5.1 eV.
0 10 20 30 40e Lags
Pixel 1 CEPOF OF
Pixel 8
CEPOFOF
as a function of phase lags. Zero lags correspond to the correct arrival phase of the
pixel 1 and pixel 8 (color online).
ARTICLE IN PRESS
S.J. Smith / Nuclear Instruments and Methods in Physics Research A 602 (2009) 537–544 543
5. Effect of random arrival phase
A potential difficulty with the implementation of the digitaloptimal filter on real data is that the measured signal is random intime and its correct phase relative to the filter is unknown. Thevariation in the arrival phase will depend upon the noise levelrelative to the signal and the shape of the initial pulse rise, as wellas the method of triggering and the sample rate. Althoughcalculated in the frequency domain, the optimal filter is usuallyapplied as a cross-correlation in the time domain. If the phase ofthe filter and the pulse are the same, then this will correctly givethe photon energy (as well as position for the CEPOF). If the arrivalphase is not known, then the complete convolution over all phasesis required. In the simple OF, the peak in the convolution gives thecorrect arrival phase and photon energy with the lowest noise.Close to the maximum, phase errors give small errors in energy;but if the phase error is large, then the error in energy can becomevery much greater than the actual noise. Thus, for discreetlysampled data it is typical to apply some phase correctionalgorithm, such as interpolating the energy between the quan-tised phase lags around the peak to more accurately measure theenergy. Fig. 9a shows a plot of the convolution response as afunction of phase lags for a 300 eV (noise-free) pixel 1 pulse,calculated using both the CEPOF and the standard OF. Unlike thestandard OF, the CEPOF convolution is asymmetric about zero lagsand the peak cross-correlation does not give the optimum noise orthe correct energy. This is the same as noted by Whitford [24] forsimilar non-linear (in energy) optimal filtering. The standard OF issharply peaked around zero lags because of the high frequencycontent in the filter and the pulse, and relatively small errors inlag could create a large error in energy. Fig. 9b shows the case for apixel 8 pulse. For this slower pulse the dependence on lags ismuch less, so the potential for error is smaller. Fig. 9c then showsdi for pixels 1 and 8 using the CEPOF. Since we only requirejdijo0.5 for the correct pixel assignment, small phase shiftsaround the true phase do not result in any position error. If thejitter is greater than a few lags, then some correction will berequired. The fact that the peak in the convolution for the CEPOFdoes not correspond to the correct energy is an obvious problemfor the implementation of the algorithm on random discretelysampled data. However, it is possible to correct for phase (at thelevel of integer lags) using the standard OF first and then, byapplying the CEPOF we can converge on the final position. A finalsub-lag phase correction (by interpolating between lags) using thestandard OF can be used for the final estimation of the energy.
6. Summary and conclusions
We have demonstrated an implementation scheme for acorrelated energy-position optimal filter algorithm, which wehave adapted for single-TES, segmented-absorber Hydras.Although in this paper we demonstrate the algorithm on Hydrasdevices, we have also implemented the algorithm on simulated 2-TES segmented PoST data with similar results. The CEPOF can beextended to include extra dimensions and any number of channelsfor segmented or continuous absorber devices. The CEPOF can alsobe implemented on other calorimeter technologies such asposition-sensitive MMC’s [18]. For a continuous device the CEPOFimplementation will in principle be the same; however, we have acontinuous distribution of pulse shapes rather than a quantizedset. The requirements on calibration are potentially higher forcontinuous devices, though could be reduced by interpolating thefilter functions between a set of pre-computed calibration pointsat known x/L. The computational requirements of the CEPOF areonly moderately more than the standard OF. Every absorber
element whether in a single-pixel array or a PoST array requires itsown template filter. For the CEPOF we require the calculation ofthe additional normalization constants (which only need to becalculated once) and the extra derivative filter convolution term.On the simulations reported here we, on average, required onlyone additional iteration of the CEPOF to converge on the correctposition, hence the CEPOF is not likely to be significantly morecomputationally intense than the standard OF.
Acknowledgments
This research was in part supported by appointment to theNASA Postdoctoral Program at Goddard Space Flight Center,administered by Oak Ridge Associated Universities through acontract with NASA. The author would like to thank Caroline A.Kilbourne, Simon R. Bandler and Encetali Figueroa-Feliciano formany useful discussions in the preparation of this work.
References
[1] K.D. Irwin, G.C. Hilton, D.A. Wollman, J.M. Martinis, Appl. Phys. Lett. 69 (1996)1945.
[2] A. Fleischmann, M. Link, T. Daniyaro, H. Rotzinger, C. Enss, G.M. Seidel, Nucl.Instr. and Meth. A 520 (2004) 27.
[3] J. Bookbinder, R. Smith, A. Hornschemeier, M. Garcia, N. White, H. Tananbaum,R. Petre, S. Romaine, P. Reid, in: Conference Proceedings of SPIE, SpaceTelescopes and Instrumentation 2008: Ultraviolet to Gamma Ray, vol. 7011,article 701102, 2008.
[4] A.N. Parmer, M. Arnaud, X. Barcons, J. Bleeker, G. Hasinger, H. Kunieda, G.Palumbo, T. Takahashi, M. Turner, P. de Korte, R. Willingale, N. Rando, A.Lyngvi, P. Gondonin, D. Lumb, M. Bavdaz, P. Verhoeve, in: ConferenceProceedings of SPIE, Space Telescopes and Instrumentation 2008: Ultravioletto Gamma Ray, vol. 6266, article 62661R, 2006.
[5] S.J. Wolk, R. J. Brissenden, M. Elvis, G. Fabbiano, A.E. Hornschemeier, S.L.O’Dell, M.W. Bautz, D.A. Schwartz, M. Juda, in: Conference Proceedings ofSPIE, Space Telescopes and Instrumentation 2008: Ultraviolet to Gamma Ray,vol. 7011, article 701130, 2008.
[6] N. Iyomoto, S.R. Bandler, R.P. Brekosky, A.-D. Brown, J.A. Chervenak, F.M.Finkbeiner, R.L. Kelley, C.A. Kilbourne, F.S. Porter, J.E. Sadleir, S.J. Smith, E.Figueroa-Feliciano, Appl. Phys. Lett. 92 (2008) 013508.
[7] C.A. Kilbourne, W.B. Doriese, S.R. Bandler, R.P. Brekosky, A.-D. Brown, J.A.Chervenak, M.E. Eckart, F.M. Finkbeiner, G.C. Hilton, K.D. Irwin, N. Iyomoto,R.L. Kelley, F.S. Porter, C.D. Reintsema, S.J. Smith, J.N. Ullom, in: ConferenceProceedings of SPIE, Space Telescopes and Instrumentation 2008: Ultravioletto Gamma Ray, vol. 7011, article 701104, 2008.
[8] S.R. Bandler, A.-D. Brown, J. Chervenak, E. Figueroa-Feliciano, F. Finkbeiner, N.Iyomoto, R.L. Kelley, C. Kilbourne, F.S. Porter, S.J. Smith, J. Low Temp. Phys. 151(2008) 400.
[9] E. Figueroa-Feliciano, PhD Thesis, Stanford University, 2001.[10] N. Iyomoto, S.R. Bandler, R.P. Brekosky, J.A. Chervenak, E. Figueroa-Feliciano,
F.M. Finkbeiner, R.L. Kelley, C.A. Kilbourne, M.A. Lindeman, K. Murphy, F.S.Porter, T. Saab, J.E. Sadleir, D.J. Talley, Nucl. Instr. and Meth. A 559 (2006) 491.
[11] S.J. Smith, C.H. Whitford, G.W. Fraser, D.J. Goldie, Nucl. Instr. and Meth. A 559(2006) 500.
[12] R.A. Stern, A. Rausch, S. Deiker, D. Martı́nez-Galarce, L. Shing, K.D. Irwin, J.N.Ullom, G. O’Neil, G. Hilton, L. Vale, J. Low Temp. Phys. 151 (2008) 721.
[13] S.J. Smith, S.R. Bandler, R.P. Brekosky, A.D. Brown, J.A. Chervenak, M.E. Eckart,F.M. Finkbeiner, R.L. Kelley, C.A. Kilbourne, F.S. Porter, E. Figueroa-Feliciano,in: Conference Proceedings of SPIE, Space Telescopes and Instrumentation2008: Ultraviolet to Gamma Ray, vol. 7011, article 701126, 2008.
[14] S.J. Smith, S.R. Bandler, R.P. Brekosky, A.D. Brown, J.A. Chervenak, M.E. Eckart,F.M. Finkbeiner, N. Iyomoto, R.L. Kelley, C.A. Kilbourne, F.S. Porter, J.E. Sadleir,E. Figueroa-Feliciano, Development of position-sensitive transition-edgesensor X-ray detectors, presented at the Applied Superconductivity Con-ference (ASC), Chicago, August 17th-22nd 2008, IEEE Trans. Appl. Supercond.(2009), accepted for publication.
[15] S.J. Smith, S.R. Bandler, A.D. Brown, J.A. Chervenak, E. Figueroa-Feliciano, F.M.Finkbeiner, N. Iyomoto, R.L. Kelley, C.A. Kilbourne, F.S. Porter, J. Low Temp.Phys. 151 (2008) 1009.
[16] S.J. Smith, C.H. Whitford, G.W. Fraser, Nucl. Instr. and Meth. A 556 (2006) 237.[17] A.E. Szymkowiak, R.L. Kelley, S.H. Moseley, C.K. Stahle, J. Low Temp. Phys. 93
(1993) 281.[18] S.J. Smith, JINST 2 (2007) P11005.[19] W.H. Press, S.A. Teukolsky, W.T. Vetterling, B.P. Flannery, Numerical Recipes in
C, second ed, Cambridge University Press, Cambridge, 1995.[20] K.D. Irwin, Nucl. Instr. and Meth. A. 559 (2006) 718.

ARTICLE IN PRESS
S.J. Smith / Nuclear Instruments and Methods in Physics Research A 602 (2009) 537–544544
[21] D. McCammon, Thermal Equilibrium Calorimeters – An Introduction, in: C.Enns (Ed.), Cryogenic Particle Detection, Topics in Applied Physics, vol. 99,Springer, 2005.
[22] E. Figueroa-Feliciano, J. Appl. Phys. 99 (2006) 114513.
[23] S.J. Smith, PhD Thesis, University of Leicester, 2006.[24] C.H. Whitford, Nucl. Instr. and Meth. A 555 (2005) 255.[25] D.J. Fixsen, S.H. Moseley, B. Cabrera, E. Figueroa-Feliciano, Nucl. Instr. and
Meth. A 520 (2004) 555.


![An Efficient Recommender System Using Locality Sensitive ... · Netflix.com [6], social networks [7], and research papers [8]. Collaborative filtering algorithms have been widely](https://img.pdfslide.us/doc/110x75/5f16ccc158f82f78b854a577/an-efficient-recommender-system-using-locality-sensitive-netflixcom-6-social.jpg)