Embed Size (px)
Citation preview
C L I N I C A L D I A B E T E S 1
Type 2 diabetes is a major cause of morbidity and mortality. In 2015, 9.4% of the U.S. popu-
lation had diabetes, and diabetes was the seventh leading cause of death (1). The direct and indirect costs associat-ed with diabetes were $245 billion in the United States in 2012, an aver-age of 2.3 times higher than costs in those without diabetes (1). Minorities including American Indians/Alaska Natives, non-Hispanic blacks, and Hispanics have the highest prevalence of diabetes (1).
Social determinants of health in- fluence outcomes with any chronic disease. According to the American Academy of Family Physicians, social determinants of health are the conditions in which individuals are born, grow, live, work, and age. Determinants include socioeconomic status, lack of community resources, and any forms of racism or discrimi-nation (2). These economic and social conditions influence the health of the community and the attainment of education, food security, housing, income, social support, and access to health services. Social determinants can negatively affect glycemic control
in people with diabetes in under- resourced populations (3).
In 2015, 9.6% of the population in North Carolina had diabetes (4). Social determinants in North Carolina reveal racial disparities; 15% of non-Hispanic African Americans have a diagnosis of diabetes compared to 10.7% of non-Hispanic whites. Additionally, diabetes is the fourth leading cause of death for African Americans (43.7 per 100,000) and the seventh leading cause of death for whites (19.3 per 100,000) in the state (5).
The health status of individuals living in southeastern areas of North Carolina is likely to be influenced by social determinants, particularly low income, high crime, and poor social support. From 2011 to 2015, the rates of unemployment, residents living in poverty, teen pregnancy, crime, infant death, and heart disease, as well as rates of death from diabetes, cancer, and chronic respiratory disease were higher in Cumberland County com-pared to neighboring counties and the state as a whole (6).
A public health department in southeastern North Carolina serv-ing adult patients revealed that 31%
Implementation of A1C Point-of-Care Testing: Serving Under-Resourced Adults With Type 2 Diabetes in a Public Health DepartmentMary Nicole John, Kathryn E. Kreider, Julie A. Thompson, and Katherine Pereira
Duke University School of Nursing, Durham, N.C.
Corresponding author: Mary Nicole John, [email protected].
https://doi.org/10.2337/cd18-0082
©2018 by the American Diabetes Association. Readers may use this article as long as the work is properly cited, the use is educational and not for profit, and the work is not altered. See www. diabetesjournals.org/content/license for details.
■ IN BRIEF A1C point-of-care testing (POCT) paired with face-to-face education potentially improves glycemic control in under-resourced populations. In this study, A1C POCT was implemented with same-day face- to-face medication management and education for adults with type 2 diabetes in a public health department in southeastern North Carolina. The combination of POCT, medication management, and education provided together improved glycemic control and decreased clinical inertia in a setting in which access to health care is limited.
FE
AT
UR
E A
RT
ICL
E
Clinical Diabetes Online Ahead of Print, published online December 19, 2018
2 C L I N I C A L . D I A B E T E S J O U R N A L S . O R G
F E AT U R E A R T I C L E
of the 993 patients seen annually in 2016 had a diagnosis of diabetes. In that year, a chart audit of 30 adult patients with diabetes revealed that 80% were not at a goal A1C of <7%, despite the clear evidence that patients with an A1C <7% have reduced risk for complications associated with hyperglycemia (7–12).
The standard of care for this health department was to measure A1C using standardized laboratory testing, which meant that the A1C was sent to an outside laboratory. Results could take up to 1 week to reach providers, delaying timely medical decision- making. Many patients could not be reached by phone or letter after a visit and never received new orders to change their treatment plan. In addition, other activities best done in person, including dietary counseling, shared goal-setting, and medication intensification, were less likely to occur. Thus, the current standard of care hindered patients from achieving their A1C goal.
The American Diabetes Asso-ciation’s (ADA’s) Standards of Medical Care in Diabetes (13) recommends point-of-care testing (POCT) for measurement of A1C, which allows patients to know right away how well their diabetes is controlled and to dis-cuss medication and lifestyle changes to improve their glycemic control before leaving their office visit. By implementing A1C POCT in this set-ting, some of the barriers to achieving improved outcomes can be removed.
A1C POCT: Literature ReviewIn populations where resources are limited and communication is a barri-er to treatment, care is improved with access to POCT and prevents delays in care (14,15). Face-to-face diabe-tes education, including immediate feedback of A1C results and intensi-fication of medication plans, resulted in improved glycemic control in di-verse populations (16–21). Providers are apt to intensify medications more frequently during face-to-face patient visits due to the rapid availability of
A1C POCT results, and this ensures that patients have the information before they leave their appointment, overcoming any obstacles associated with the inability to contact patients after their office visits (20–22). This is especially true when the majority of under-resourced populations may be difficult to reach due to the lack of telephones, homelessness, or insecure living situations.
In African-American populations, A1C POCT results in improved A1C values. Two studies conducted in urban primary care settings with a majority of female African-American participants found that immediate availability of A1C results through POCT resulted in an increase in the frequency of medication intensifica-tion for those not a goal A1C. This in turn led to a significant reduction in mean A1C over time, thus reducing patients’ risk for complications from poorly managed diabetes (19,20). A study comparing a group getting A1C POCT to a group getting standard A1C testing found a 51% increase in intensification of pharmacologi-cal agents and a significant reduction in A1C for the intervention group between baseline and 6-month follow- up (from 8.4 to 8.1%, P = 0.04). There was a nonsignificant reduction in A1C in the standard A1C testing group (from 8.1 to 8.0%, P = 0.31) (20).
A separate study compared A1C POCT to traditional laboratory A1C testing 3 months before the POCT intervention and found a signifi-cant reduction in A1C (from 8.55 to 7.84%, P = 0.004) and a significant increase in the number of patients who had intensification of medica-tions (from 28.6 to 53.8%, P = 0.03 (19). A reduction in A1C was also found in socioeconomically and eth-nically diverse populations who were provided their A1C result and an explanation of the context and mean-ing of the measurement (17).
In summary, A1C POCT improves glycemic control and decreases clin-ical inertia. This testing is ideal for under-resourced populations afflicted
by social determinants of health. The quality of care for under-resourced patients with type 2 diabetes is augmented by real-time results, face-to-face education, and intensification of medications. Complications and poor outcomes associated with uncon-trolled diabetes can be reduced.
ObjectivesThe first objective of this study was to determine whether A1C POCT and face-to-face education improved gly-cemic control for under-resourced pa-tients with type 2 diabetes compared to standardized laboratory testing and telephone/letter communication as ev-idenced by A1C trending downward to a goal of <7%. The second objec-tive was to determine whether clini-cal inertia decreased with A1C POCT compared to standardized laboratory in under-resourced patients with type 2 diabetes and an A1C >7%, as ev-idenced by the clinician intensifying medication at face-to-face visits.
Methods
DesignThis quality improvement (QI) proj-ect involved a retrospective chart re-view of 74 adult patients with type 2 diabetes and implementation of A1C POCT for this convenience sample in a public health department in southeastern North Carolina. Implementation began in March 2017 and extended through July 2017. The QI project used a within-subject pre-post design, and data were collected at baseline (clinic visits held 3–6 months before project implementation) and two additional time points: an initial A1C POCT implementation visit and a follow-up visit held 3 months later.
The standardized laboratory A1C measurement was collected at baseline (3–6 months before implementation of POCT) for all 74 patients. The first time point post-implementation (PI1) included the initial POCT A1C. The second time-point post-implementation (PI2) was a 3-month follow-up at which A1C POCT was again performed.
Clinical Diabetes Online Ahead of Print, published online December 19, 2018
C L I N I C A L D I A B E T E S 3
j o h n e t a l .
Independent variables were A1C POCT and face-to-face education. Dependent variables were partici-pants’ A1C values and whether the provider intensified medication at a face-to-face visit if patients’ A1C was >7% at that visit.
This QI project has been formally evaluated using a QI checklist and determined not to be human sub-jects research by an internal review process at Duke University School of Nursing. The project was approved by the health department where it was implemented.
Setting and Patient PopulationPatients included in the QI project were adults (≥18 years of age) with a diagnosis of type 2 diabetes and an A1C >7% at baseline. Exclusion criteria included anemia, a history of severe hypoglycemia, limited life ex-pectancy, advanced microvascular or macrovascular complications, exten-sive comorbid conditions, end-stage renal disease, and pregnancy. New patients were also excluded from data analysis due to the unavailability of pre-implementation A1C results.
The staff involved in implemen-tation of A1C POCT included three registered nurses (RNs), one full-time family nurse practitioner (NP), one per diem adult NP, one per diem phy-sician assistant, one medical assistant (MA), the laboratory supervisor, and four in-house laboratory technicians, who assisted in processing specimens.
The setting was a public health department in southeastern North Carolina serving under-resourced patients with social determinants of health that made it difficult for them to engage in lifestyle habits suitable for diabetes management.
ImplementationThe QI project was conducted by the full-time family NP with the as-sistance of two clinic RNs and one MA. The DCA Vantage Analyzer (Seimens, Germany) was the ma-chine used to measure A1C from the POC blood samples and is certified by the National Glycohemoglobin
Standardization Program (14). This portable machine is used to analyze capillary blood to determine A1C with results available in minutes. The machine was kept in the in-house laboratory.
Before project implementation, the lab supervisor trained the laboratory technicians on how to operate the POCT machine. Daily internal con-trols were run to maintain a standard internal linearity of the low and high A1C ranges (2–14%), ensuring accu-rate results.
Patients eligible for A1C POCT at PI1 were identified by the provider and reviewed with staff during morn-ing huddles. During initial intake and vital sign checks, the RN or MA would collect capillary blood samples. The samples were processed within 6 minutes at the in-house laboratory and reviewed by the provider before patient encounters. The results, mean-ing of the A1C test, and treatment options were discussed with patients during their visit.
Modifications to the plan of care included medication intensification, lifestyle risk modification education (nutrition, weight management, exer-cise, and self-monitoring of blood glucose [SMBG]), and brief diabe-tes education based on the ADA Standards of Care (23). Diabetes education included diabetes self-man-agement, healthy lifestyle choices, medication management, SMBG, and barriers to self-management. Based on need and access to trans-portation, referrals were made to local community resources for diabe-tes management, diabetes education classes, and endocrinology care. A patient-centered collaborative approach considering comorbidities, patient preferences, and prognosis, as recommended by the ADA, was inte-grated into the POC provider-patient communication (13).
If initial A1C POCT was >7% at PI1, the patient was scheduled to return for a 3-month follow-up appointment (PI2), and the process was repeated. If the initial A1C was
<7%, the patient was censored out of the study and scheduled to return for regular follow-up in 6 months.
Data CollectionData were collected from retrospective review of charts of the 74 patients in-cluded in the POCT QI project. Demographic data included age, sex, race, underlying comorbidities (hyper-tension, hyperlipidemia, smoking sta-tus, heart disease, kidney disease, and microalbuminuria), medical insurance status, and annual household income. Blood pressure, BMI, types of diabe-tes medications, and modifications in care plan were recorded. Medication intensification and A1C were recorded at baseline, PI1, and PI2.
Data AnalysisA sample size estimate was calcu-lated using G*Power software (24), based on the more advanced statisti-cal test (one-way repeated measures ANOVA). Using an effect size of 0.25, α set to 0.05, and power set to 0.80, the suggested sample size was at least 28. Statistical analysis was conducted using SPSS software version 24 (IBM Corp. Armonk, NY).
Data were entered into an Excel (Microsoft, Redmond, Wash.) spread- sheet before entry into SPSS for statistical analysis. All data were de-identified before entry. Descriptive statistics were used to analyze baseline characteristics and demo-graphics. A one-way analysis of variance (ANOVA) was used to com-pare the change in patients’ A1C using standard laboratory analysis versus POCT over the three time points. A χ2 test was used to compare baseline, PI1, and PI2 with regard to medica-tion intensification after A1C POCT.
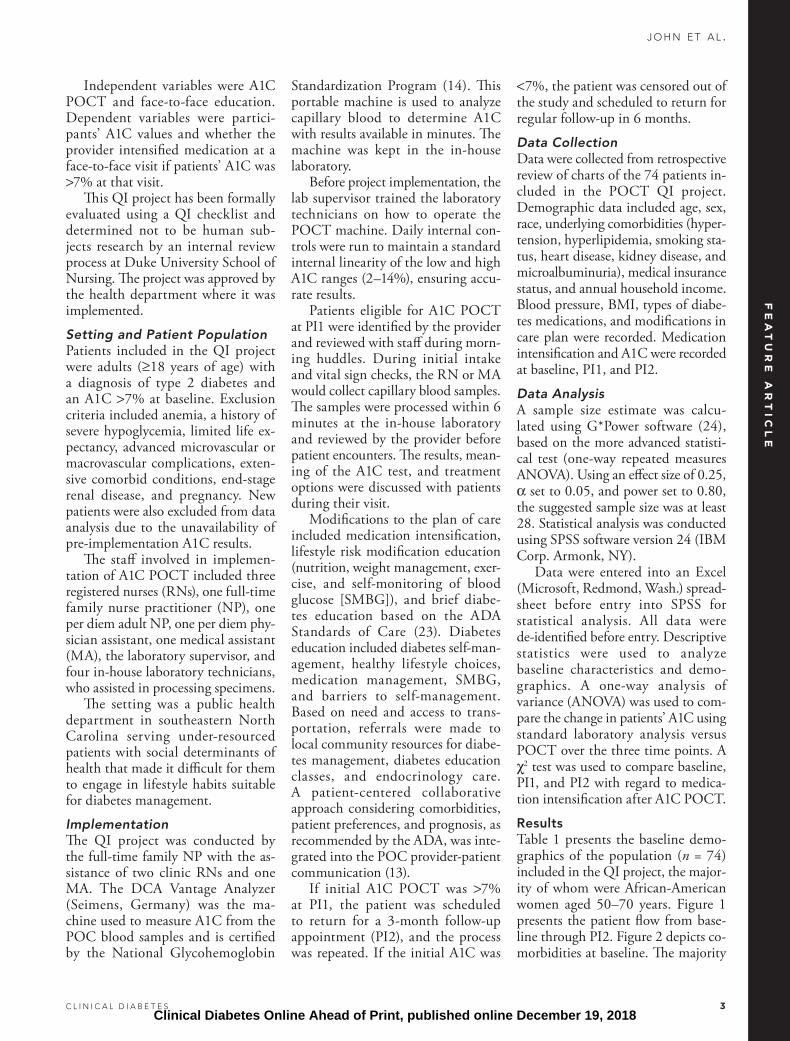
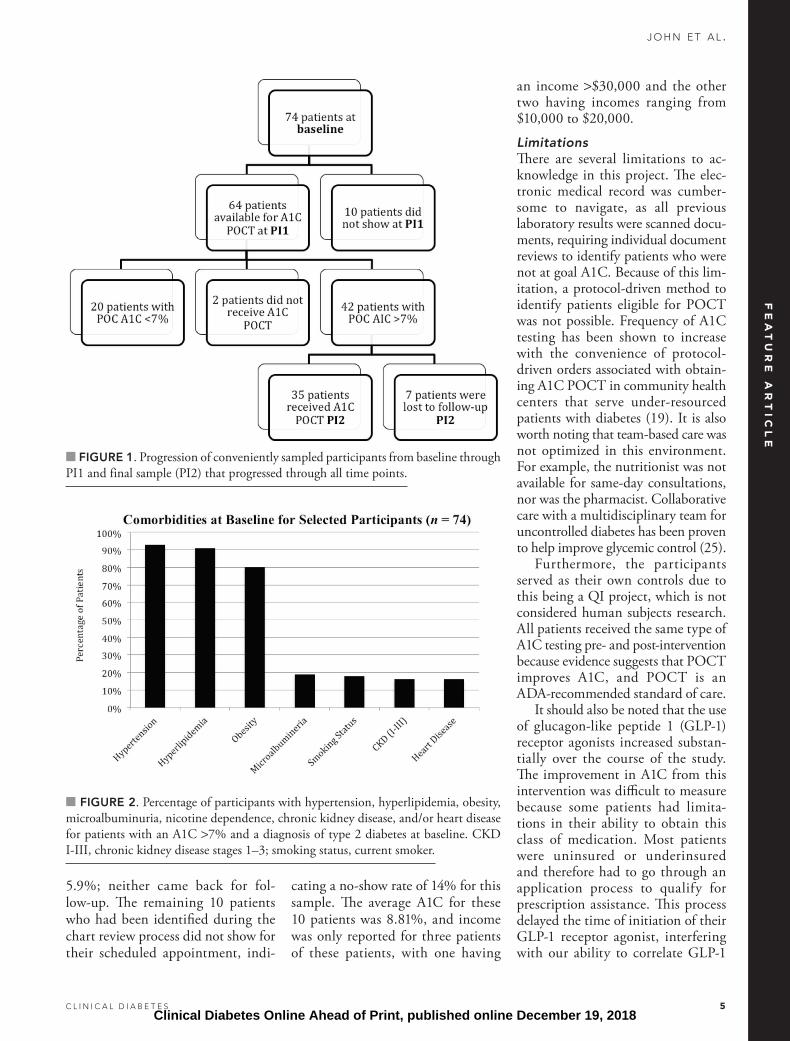
ResultsTable 1 presents the baseline demo-graphics of the population (n = 74) included in the QI project, the major-ity of whom were African-American women aged 50–70 years. Figure 1 presents the patient flow from base-line through PI2. Figure 2 depicts co-morbidities at baseline. The majority
FE
AT
UR
E A
RT
ICL
E
Clinical Diabetes Online Ahead of Print, published online December 19, 2018
4 C L I N I C A L . D I A B E T E S J O U R N A L S . O R G
F E AT U R E A R T I C L E
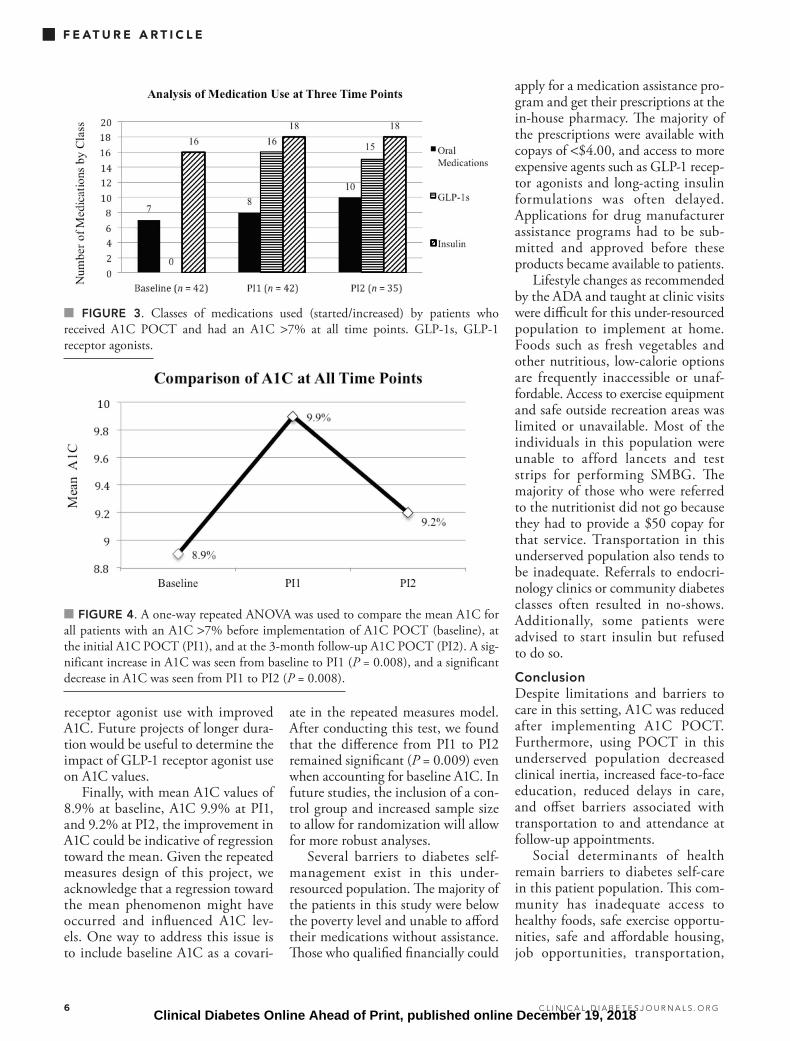
of the participants had hypertension, hyperlipidemia, uncontrolled blood glucose, and obesity, indicating a pop-ulation of patients at high risk for de-veloping complications from diabetes (1). Figure 3 presents the categories of diabetes medications used at each time point.
Figure 4 presents A1C results for the three time points for the imple-
mentation group, evaluating the first objective of the study. A1C POCT was measured at all points of time for 35 total participants, indicating an adequately powered sample size. A one-way repeated measures ANOVA revealed an overall significant effect of time, F(2, 68) = 5.87, P = 0.004. Post hoc pairwise comparisons showed that A1C increased significantly from
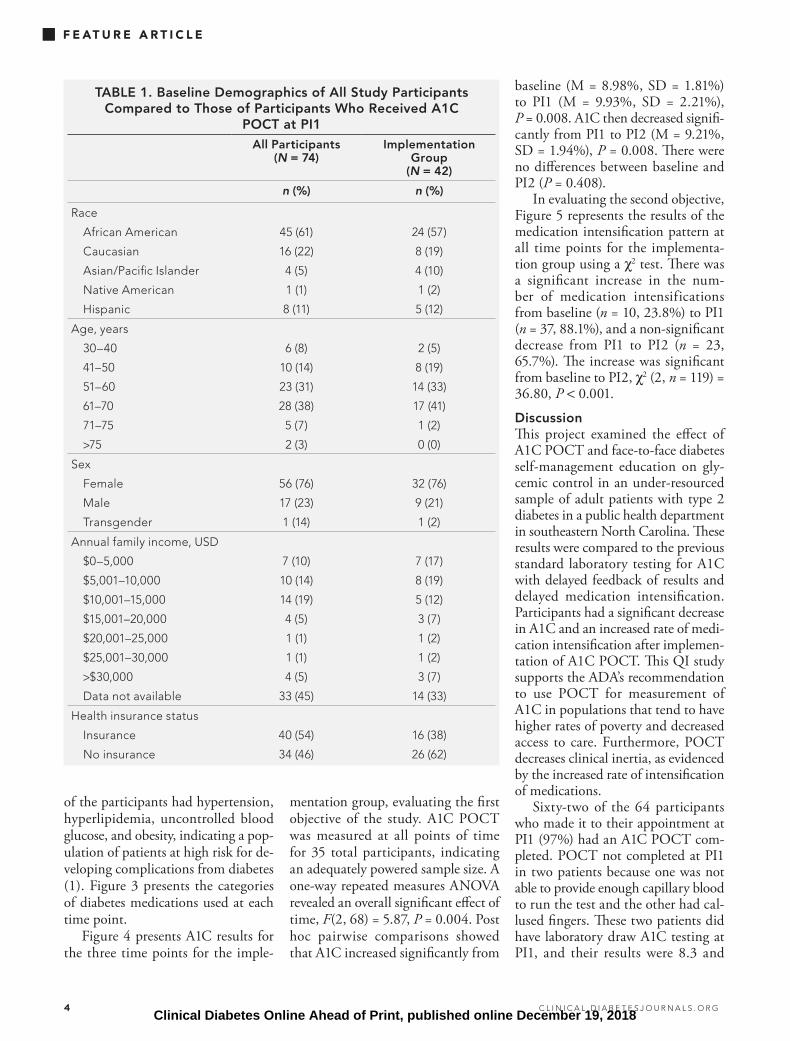
TABLE 1. Baseline Demographics of All Study Participants Compared to Those of Participants Who Received A1C
POCT at PI1All Participants
(N = 74)Implementation
Group (N = 42)
n (%) n (%)
Race
African American
Caucasian
Asian/Pacific Islander
Native American
Hispanic
45 (61)
16 (22)
4 (5)
1 (1)
8 (11)
24 (57)
8 (19)
4 (10)
1 (2)
5 (12)
Age, years
30–40
41–50
51–60
61–70
71–75
>75
6 (8)
10 (14)
23 (31)
28 (38)
5 (7)
2 (3)
2 (5)
8 (19)
14 (33)
17 (41)
1 (2)
0 (0)
Sex
Female
Male
Transgender
56 (76)
17 (23)
1 (14)
32 (76)
9 (21)
1 (2)
Annual family income, USD
$0–5,000
$5,001–10,000
$10,001–15,000
$15,001–20,000
$20,001–25,000
$25,001–30,000
>$30,000
Data not available
7 (10)
10 (14)
14 (19)
4 (5)
1 (1)
1 (1)
4 (5)
33 (45)
7 (17)
8 (19)
5 (12)
3 (7)
1 (2)
1 (2)
3 (7)
14 (33)
Health insurance status
Insurance
No insurance
40 (54)
34 (46)
16 (38)
26 (62)
baseline (M = 8.98%, SD = 1.81%) to PI1 (M = 9.93%, SD = 2.21%), P = 0.008. A1C then decreased signifi-cantly from PI1 to PI2 (M = 9.21%, SD = 1.94%), P = 0.008. There were no differences between baseline and PI2 (P = 0.408).
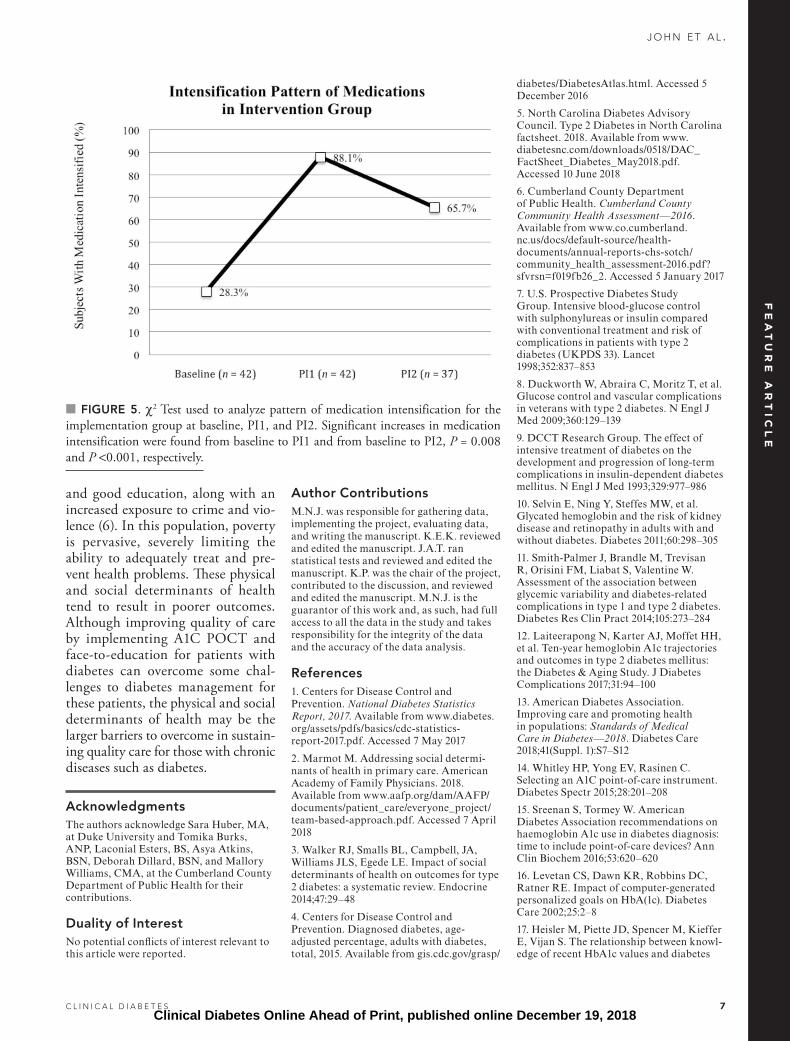
In evaluating the second objective, Figure 5 represents the results of the medication intensification pattern at all time points for the implementa-tion group using a χ2 test. There was a significant increase in the num-ber of medication intensifications from baseline (n = 10, 23.8%) to PI1 (n = 37, 88.1%), and a non-significant decrease from PI1 to PI2 (n = 23, 65.7%). The increase was significant from baseline to PI2, χ2 (2, n = 119) = 36.80, P < 0.001.
DiscussionThis project examined the effect of A1C POCT and face-to-face diabetes self-management education on gly-cemic control in an under-resourced sample of adult patients with type 2 diabetes in a public health department in southeastern North Carolina. These results were compared to the previous standard laboratory testing for A1C with delayed feedback of results and delayed medication intensification. Participants had a significant decrease in A1C and an increased rate of medi-cation intensification after implemen-tation of A1C POCT. This QI study supports the ADA’s recommendation to use POCT for measurement of A1C in populations that tend to have higher rates of poverty and decreased access to care. Furthermore, POCT decreases clinical inertia, as evidenced by the increased rate of intensification of medications.
Sixty-two of the 64 participants who made it to their appointment at PI1 (97%) had an A1C POCT com-pleted. POCT not completed at PI1 in two patients because one was not able to provide enough capillary blood to run the test and the other had cal-lused fingers. These two patients did have laboratory draw A1C testing at PI1, and their results were 8.3 and
Clinical Diabetes Online Ahead of Print, published online December 19, 2018
C L I N I C A L D I A B E T E S 5
j o h n e t a l .
5.9%; neither came back for fol-low-up. The remaining 10 patients who had been identified during the chart review process did not show for their scheduled appointment, indi-
cating a no-show rate of 14% for this sample. The average A1C for these 10 patients was 8.81%, and income was only reported for three patients of these patients, with one having
an income >$30,000 and the other two having incomes ranging from $10,000 to $20,000.
LimitationsThere are several limitations to ac-knowledge in this project. The elec-tronic medical record was cumber-some to navigate, as all previous laboratory results were scanned docu-ments, requiring individual document reviews to identify patients who were not at goal A1C. Because of this lim-itation, a protocol-driven method to identify patients eligible for POCT was not possible. Frequency of A1C testing has been shown to increase with the convenience of protocol- driven orders associated with obtain-ing A1C POCT in community health centers that serve under-resourced patients with diabetes (19). It is also worth noting that team-based care was not optimized in this environment. For example, the nutritionist was not available for same-day consultations, nor was the pharmacist. Collaborative care with a multidisciplinary team for uncontrolled diabetes has been proven to help improve glycemic control (25).
Furthermore, the participants served as their own controls due to this being a QI project, which is not considered human subjects research. All patients received the same type of A1C testing pre- and post-intervention because evidence suggests that POCT improves A1C, and POCT is an ADA-recommended standard of care.
It should also be noted that the use of glucagon-like peptide 1 (GLP-1) receptor agonists increased substan-tially over the course of the study. The improvement in A1C from this intervention was difficult to measure because some patients had limita-tions in their ability to obtain this class of medication. Most patients were uninsured or underinsured and therefore had to go through an application process to qualify for prescription assistance. This process delayed the time of initiation of their GLP-1 receptor agonist, interfering with our ability to correlate GLP-1
■ FIGURE 1. Progression of conveniently sampled participants from baseline through PI1 and final sample (PI2) that progressed through all time points.
■ FIGURE 2. Percentage of participants with hypertension, hyperlipidemia, obesity, microalbuminuria, nicotine dependence, chronic kidney disease, and/or heart disease for patients with an A1C >7% and a diagnosis of type 2 diabetes at baseline. CKD I-III, chronic kidney disease stages 1–3; smoking status, current smoker.
FE
AT
UR
E A
RT
ICL
E
Clinical Diabetes Online Ahead of Print, published online December 19, 2018
6 C L I N I C A L . D I A B E T E S J O U R N A L S . O R G
F E AT U R E A R T I C L E
receptor agonist use with improved A1C. Future projects of longer dura-tion would be useful to determine the impact of GLP-1 receptor agonist use on A1C values.
Finally, with mean A1C values of 8.9% at baseline, A1C 9.9% at PI1, and 9.2% at PI2, the improvement in A1C could be indicative of regression toward the mean. Given the repeated measures design of this project, we acknowledge that a regression toward the mean phenomenon might have occurred and influenced A1C lev-els. One way to address this issue is to include baseline A1C as a covari-
ate in the repeated measures model. After conducting this test, we found that the difference from PI1 to PI2 remained significant (P = 0.009) even when accounting for baseline A1C. In future studies, the inclusion of a con-trol group and increased sample size to allow for randomization will allow for more robust analyses.
Several barriers to diabetes self- management exist in this under- resourced population. The majority of the patients in this study were below the poverty level and unable to afford their medications without assistance. Those who qualified financially could
apply for a medication assistance pro-gram and get their prescriptions at the in-house pharmacy. The majority of the prescriptions were available with copays of <$4.00, and access to more expensive agents such as GLP-1 recep-tor agonists and long-acting insulin formulations was often delayed. Applications for drug manufacturer assistance programs had to be sub-mitted and approved before these products became available to patients.
Lifestyle changes as recommended by the ADA and taught at clinic visits were difficult for this under-resourced population to implement at home. Foods such as fresh vegetables and other nutritious, low-calorie options are frequently inaccessible or unaf-fordable. Access to exercise equipment and safe outside recreation areas was limited or unavailable. Most of the individuals in this population were unable to afford lancets and test strips for performing SMBG. The majority of those who were referred to the nutritionist did not go because they had to provide a $50 copay for that service. Transportation in this underserved population also tends to be inadequate. Referrals to endocri-nology clinics or community diabetes classes often resulted in no-shows. Additionally, some patients were advised to start insulin but refused to do so.
ConclusionDespite limitations and barriers to care in this setting, A1C was reduced after implementing A1C POCT. Furthermore, using POCT in this underserved population decreased clinical inertia, increased face-to-face education, reduced delays in care, and offset barriers associated with transportation to and attendance at follow-up appointments.
Social determinants of health remain barriers to diabetes self-care in this patient population. This com-munity has inadequate access to healthy foods, safe exercise opportu-nities, safe and affordable housing, job opportunities, transportation,
■ FIGURE 3. Classes of medications used (started/increased) by patients who received A1C POCT and had an A1C >7% at all time points. GLP-1s, GLP-1 receptor agonists.
■ FIGURE 4. A one-way repeated ANOVA was used to compare the mean A1C for all patients with an A1C >7% before implementation of A1C POCT (baseline), at the initial A1C POCT (PI1), and at the 3-month follow-up A1C POCT (PI2). A sig-nificant increase in A1C was seen from baseline to PI1 (P = 0.008), and a significant decrease in A1C was seen from PI1 to PI2 (P = 0.008).
Clinical Diabetes Online Ahead of Print, published online December 19, 2018
C L I N I C A L D I A B E T E S 7
j o h n e t a l .
and good education, along with an increased exposure to crime and vio-lence (6). In this population, poverty is pervasive, severely limiting the ability to adequately treat and pre-vent health problems. These physical and social determinants of health tend to result in poorer outcomes. Although improving quality of care by implementing A1C POCT and face-to-education for patients with diabetes can overcome some chal-lenges to diabetes management for these patients, the physical and social determinants of health may be the larger barriers to overcome in sustain-ing quality care for those with chronic diseases such as diabetes.
AcknowledgmentsThe authors acknowledge Sara Huber, MA, at Duke University and Tomika Burks, ANP, Laconial Esters, BS, Asya Atkins, BSN, Deborah Dillard, BSN, and Mallory Williams, CMA, at the Cumberland County Department of Public Health for their contributions.
Duality of InterestNo potential conflicts of interest relevant to this article were reported.
Author ContributionsM.N.J. was responsible for gathering data, implementing the project, evaluating data, and writing the manuscript. K.E.K. reviewed and edited the manuscript. J.A.T. ran statistical tests and reviewed and edited the manuscript. K.P. was the chair of the project, contributed to the discussion, and reviewed and edited the manuscript. M.N.J. is the guarantor of this work and, as such, had full access to all the data in the study and takes responsibility for the integrity of the data and the accuracy of the data analysis.
References1. Centers for Disease Control and Prevention. National Diabetes Statistics Report, 2017. Available from www.diabetes.org/assets/pdfs/basics/cdc-statistics- report-2017.pdf. Accessed 7 May 2017
2. Marmot M. Addressing social determi-nants of health in primary care. American Academy of Family Physicians. 2018. Available from www.aafp.org/dam/AAFP/documents/patient_care/everyone_project/team-based-approach.pdf. Accessed 7 April 2018
3. Walker RJ, Smalls BL, Campbell, JA, Williams JLS, Egede LE. Impact of social determinants of health on outcomes for type 2 diabetes: a systematic review. Endocrine 2014;47:29–48
4. Centers for Disease Control and Prevention. Diagnosed diabetes, age- adjusted percentage, adults with diabetes, total, 2015. Available from gis.cdc.gov/grasp/
diabetes/DiabetesAtlas.html. Accessed 5 December 2016
5. North Carolina Diabetes Advisory Council. Type 2 Diabetes in North Carolina factsheet. 2018. Available from www.diabetesnc.com/downloads/0518/DAC_FactSheet_Diabetes_May2018.pdf. Accessed 10 June 2018
6. Cumberland County Department of Public Health. Cumberland County Community Health Assessment—2016. Available from www.co.cumberland. nc.us/docs/default-source/health- documents/annual-reports-chs-sotch/ community_health_assessment-2016.pdf? sfvrsn=f019fb26_2. Accessed 5 January 2017
7. U.S. Prospective Diabetes Study Group. Intensive blood-glucose control with sulphonylureas or insulin compared with conventional treatment and risk of complications in patients with type 2 diabetes (UKPDS 33). Lancet 1998;352:837–853
8. Duckworth W, Abraira C, Moritz T, et al. Glucose control and vascular complications in veterans with type 2 diabetes. N Engl J Med 2009;360:129–139
9. DCCT Research Group. The effect of intensive treatment of diabetes on the development and progression of long-term complications in insulin-dependent diabetes mellitus. N Engl J Med 1993;329:977–986
10. Selvin E, Ning Y, Steffes MW, et al. Glycated hemoglobin and the risk of kidney disease and retinopathy in adults with and without diabetes. Diabetes 2011;60:298–305
11. Smith-Palmer J, Brandle M, Trevisan R, Orisini FM, Liabat S, Valentine W. Assessment of the association between glycemic variability and diabetes-related complications in type 1 and type 2 diabetes. Diabetes Res Clin Pract 2014;105:273–284
12. Laiteerapong N, Karter AJ, Moffet HH, et al. Ten-year hemoglobin A1c trajectories and outcomes in type 2 diabetes mellitus: the Diabetes & Aging Study. J Diabetes Complications 2017;31:94–100
13. American Diabetes Association. Improving care and promoting health in populations: Standards of Medical Care in Diabetes—2018. Diabetes Care 2018;41(Suppl. 1):S7–S12
14. Whitley HP, Yong EV, Rasinen C. Selecting an A1C point-of-care instrument. Diabetes Spectr 2015;28:201–208
15. Sreenan S, Tormey W. American Diabetes Association recommendations on haemoglobin A1c use in diabetes diagnosis: time to include point-of-care devices? Ann Clin Biochem 2016;53:620–620
16. Levetan CS, Dawn KR, Robbins DC, Ratner RE. Impact of computer-generated personalized goals on HbA(1c). Diabetes Care 2002;25:2–8
17. Heisler M, Piette JD, Spencer M, Kieffer E, Vijan S. The relationship between knowl-edge of recent HbA1c values and diabetes
■ FIGURE 5. χ2 Test used to analyze pattern of medication intensification for the implementation group at baseline, PI1, and PI2. Significant increases in medication intensification were found from baseline to PI1 and from baseline to PI2, P = 0.008 and P <0.001, respectively.
FE
AT
UR
E A
RT
ICL
E
Clinical Diabetes Online Ahead of Print, published online December 19, 2018
8 C L I N I C A L . D I A B E T E S J O U R N A L S . O R G
F E AT U R E A R T I C L E
care understanding and self-management. Diabetes Care 2005;28:816–822
18. Bray P, Cummings DM, Morrissey S, et al. Improved outcomes in diabetes care for rural African Americans. Ann Fam Med 2013;11:145–150
19. Rust G, Gailor M, Daniels E, et al. Point of care testing to improve glycemic control. Int J Health Care Qual Assur. 2008;21:325–335
20. Miller CD, Barnes CS, Phillips LS, et al. Rapid A1c availability improves clinical decision-making in an urban primary care
clinic. Diabetes Care 2003;26:1158–1163
21. Cagliero E, Levina EV, Nathan DM. Immediate feedback of HbA1c levels improves glycemic control in type 1 and insulin-treated type 2 diabetic patients. Diabetes Care 1999;22:1785–1789
22. Petersen JR, Finley JB, Okorodudu AO, Mohammad AA, Grady JJ, Bajaj M. Effect of point-of-care on maintenance of glycemic control as measured by A1C. Diabetes Care 2007;30:713–715
23. American Diabetes Association. Lifestyle management: Standards of Medical
Care in Diabetes—2018. Diabetes Care 2018;41(Suppl. 1):S38–S50
24. Faul F, Erdfelder E, Lang A, Buchner A. G*Power 3: a flexible statistical power anal-ysis program for the social, behavioral, and biomedical sciences. Behav Res Methods 2007;39:175–191
25. McAdam-Marx C, Dahal A, Jennings B, Singhal M, Gunning K. The effect of a diabetes collaborative care management program on clinical and economical outcomes in patients with type 2 diabetes. J Manag Care Spec Pharm 2015;21;452–468
Clinical Diabetes Online Ahead of Print, published online December 19, 2018