Embed Size (px)
Citation preview

Master’s Thesis 2018 60 ECTS
Faculty of Chemistry, Biotechnology and Food Sciences
Implementation of a two-plasmid
CRISPR/Cas9 system in
Lactobacillus plantarum:
A new approach in the development
of a novel vaccine against
Mycobacterium tuberculosis
Kamilla Wiull Master of Technology, Chemistry and Biotechnology


I
Acknowledgements
The work presented in this thesis was carried out at the Faculty of Chemistry, Biotechnology
and Food science of the Norwegian University of Life Sciences, supervised by Dr. Geir
Mathiesen.
I want to thank everyone who has helped me in my work on this thesis. First and foremost, I
would like to thank my supervisor Dr. Geir Mathiesen. I am so grateful for all the conversations
and discussions we have had regarding this thesis. Despite all challenges I have met through
the experimental work, you have always kept my spirit up. I would also like to thank the rest of
the PEP group, and especially former department engineer Lise Øverland. Furthermore, thank
you to Dr. Morten Kjos for sharing your knowledge on the CRISPR/Cas system.
Last but not least, I am beyond grateful for the support and encouragement provided by my
family and boyfriend. You are all invaluable to me.
Ås, December 2018
Kamilla Wiull

II
Abstract
Tuberculosis (TB) is the leading cause of deaths from a single infectious agent, and in 2017 1.7
million people died from TB. To date the only available vaccine against the disease is the bacille
Calmette-Guèrin (BCG) vaccine. The BCG vaccine does not ensure full protection against the
mature form of TB, and is not recommended to immunocompromised patients. Therefore, a
new and more effective vaccine is urgently needed. This study is a part of a larger project with
a long-term goal to develop mucosal vaccines, utilizing the lactic acid bacteria (LAB)
Lactobacillus plantarum as delivery vectors of antigens. LAB occurs in a wide range of
habitats, ranging from food products such as fruit and dairy, but also human mucosal surfaces
such as the small intestine and colon. Lactobacilli are natural inhabitants of the human gastro
intestinal tract (GIT) and are generally regarded as safe (GRAS). Some Lactobacilli are believed
to have probiotic properties and live in close association with the intestinal epithelium and have
shown immunomodulatory effects in human. These properties make Lactobacilli, such as L.
plantarum, an ideal candidate as a delivery vector of immunogens.
In the present study, pSIP inducible vectors for cytoplasmic and membrane anchoring of the
TB fusion antigen Ag85B_TB10.4 in L. plantarum were constructed, and production of surface
localized antigen was confirmed. Currently, the production of the antigen is plasmid based. To
reduce the number of heterologous genes of the recombinant L. plantarum, it is desirable to
integrate the antigen production into genome of the bacteria. In this thesis, methods for
utilization of the CRISPR/Cas system was attempted developed for integration of the antigen.
To simplify integration, as it is independent of helper genes unlike the pSIP system,
construction of vectors for constitutive production of Ag85B_TB10.4 were attempted.
Evaluation of the functionality of the CRISPR/Cas system in L. plantarum was performed
through experiments of gene editing, replacement and depletion with Cas9, Cas9D10A and
dCas9.
In conclusion, Ag85B_TB10.4 was successfully anchored to the cell membrane of L. plantarum
by using the pSIP system, while construction of a vector for constitutive production of
Ag85B_TB10.4 failed. Conceivably due to toxicity of the constitutive production of the antigen
in E. coli. The CRISPR/dCas9 system was successfully developed, and reduction of transcripts
of target genes was confirmed by ddPCR. Gene editing and exchange with Cas9 and Cas9D10A
gave the expected phenotype, but no mutations were detected from DNA sequencing. These
methods require further optimisations.

III
Sammendrag
Tuberkulose (TB) er hovedårsaken til dødsfall forårsaket av en infeksjonssykdom. I 2017 døde
1.7 millioner mennesker av TB. Per dags dato er bacille Calmette-Guèrin (BCG) vaksinen den
eneste tilgjengelige vaksinen som beskytter mot sykdommen. En stor svakhet ved BCG-
vaksinen er at den ikke sørger for full beskyttelse mot den modne og smittsomme formen av
TB, og anbefales ikke til immunkompromitterte pasienter. På grunn av dette er utvikling av en
ny vaksine mot TB høyst nødvendig. Denne studien er en del av et større prosjekt, hvor
langtidsmålet er å utvikle slimhinne vaksiner, ved å utnytte melkesyrebakterien Lactobacillus
plantarum som leverings vektor av antigener. Melkesyrebakteriene finnes i mange varierte
habitater, fra matprodukter som frukt og melkeprodukter, men også som en del av den naturlige
tarmfloraen hos mennesker. På bakgrunn av dette regnes melkesyrebakteriene generelt som
trygge. Noen Laktobasiller er også kjent for å ha probiotiske egenskaper, nær tilknytning til
tarmepitelet, samt immunmodulerende effekter. Disse egenskapene bidrar til at Laktobasiller,
som L. plantarum, anses som ideelle kandidater som leverings vektorer av immunogener.
I denne studien ble pSIP induserbare vektorer for intracellulær og membranankret produksjon
av TB hybridantigenet Ag85B_TB10.4 i L. plantarum konstruert, og produksjon av overflate
lokalisert antigen ble bekreftet. Foreløpig har produksjonen av antigener vært plasmidbasert.
For å redusere antall heterologe gener i rekombinante L. plantarum, er det fordelaktig å
integrere antigen produksjonen inn i genomet til bakterien. I denne oppgaven ble ulike metoder
for bruk av CRISPR/Cas systemet forsøkt utviklet, for integrering av antigenet. For å forenkle
integreringen ble det forsøkt konstruert vektorer for konstitutiv produksjon av Ag85B_TB10.4.
I motsetning til pSIP systemet, avhenger ikke det konstitutive ekspresjonssystemet av andre
gener for aktivering. Funksjonaliteten til CRISPR/Cas systemet i L. plantarum ble evaluert ved
utførelse av eksperimenter for gen-editering, -utbytte og -nedregulering mediert av Cas9,
Cas9D10A og dCas9.
Arbeidet som er beskrevet i denne masteroppgaven viser at en vektor for overflateankret
Ag85B_TB10.4 produsert av pSIP systemet ble konstruert, mens konstruksjon av en vektor for
konstitutiv produksjon av Ag85B_TB10.4 mislyktes. En mulig årsak til den mislykkede
konstruksjon kan være at konstitutiv produksjon av antigenet er toksisk for Escherichia coli.
CRISPR/dCas9 systemet, for nedregulering av genuttrykk, ble utviklet og nedreguleringen av
målgenene ble bekreftet med ddPCR. Gen-editering og -utbytte av gener med Cas9 og Cas9D10A
produserte den forventede fenotypen, men sekvensering avslørte villtype sekvens. Disse
metodene behøver derfor videre optimering.
IV
Abbreviations
BCG Bacillus Calmette-Guérin
BSA Bovine Serum Albumin
Cas protein CRISPR associated protein
CRISPR Clustered regularly interspaced palindromic repeats
CRISPRi CRISPR interference
crRNA CRISPR RNA
DC Dendritic cell
ddPCR Droplet digital PCR
dNTP Deoxyribonucleotide triphosphate
FITC Fluorescein isothiocyanate
GIT Gastrointestinal tract
GRAS Generally Recognised As Safe
HDR Homology directed repair
HRP Horseradish Peroxidase
IgA Immunoglobulin A
LAB Lactic acid bacteria
NHEJ Non-homologous end joining pathway
PAM Protospacer adjacent motif
PAMP Pathogen-associated molecular patterns
PCR Polymerase Chain Reaction
SDS-PAGE Sodium dodecyl sulphate polyacrylamide gel
SgRNA Single guide RNA

V
TALEN Transcription activator-like effector nucleases
TB Tuberculosis
tracrRNA Trans-activating crRNA
ZFN Zinc-finger nucleases

VI
Table of contents
1 Introduction ......................................................................................................................... 1
1.1 Lactic acid bacteria ...................................................................................................... 1
1.2 Lactobacillus plantarum .............................................................................................. 2
1.3 Gene expression systems in L. plantarum ................................................................... 3
1.3.1 Inducible gene expression systems ...................................................................... 3
1.3.2 Constitutive gene expression systems .................................................................. 5
1.4 Bacteria as vectors for antigen delivery ...................................................................... 5
1.5 Secretion and anchoring of proteins in Gram-positive bacteria .................................. 7
1.6 Tuberculosis ............................................................................................................... 11
1.7 The CRISPR/Cas9-system ......................................................................................... 12
1.7.1 Repair systems in bacteria .................................................................................. 15
1.7.2 Use of CRISPR systems in Gram-positive bacteria ........................................... 17
1.8 Aim of this study ....................................................................................................... 18
2 Materials ........................................................................................................................... 19
2.1 Laboratory Equipment ............................................................................................... 19
2.2 Chemicals .................................................................................................................. 22
2.3 Proteins and enzymes ................................................................................................ 23
2.4 DNA ........................................................................................................................... 24
2.5 Primers ....................................................................................................................... 24
2.6 Bacterial strains and plasmids ................................................................................... 26
2.7 Kits ............................................................................................................................. 29
2.8 Agars and media ........................................................................................................ 32
2.9 Buffers and solutions ................................................................................................. 34
3 Methods ............................................................................................................................. 36
3.1 Cultivation of bacteria ............................................................................................... 36
3.2 Storage of bacteria ..................................................................................................... 36
3.3 Plasmid isolation from bacteria ................................................................................. 37
3.4 Isolation of microbial DNA ....................................................................................... 37
3.5 Digestion of DNA with restriction enzymes ............................................................. 37
3.6 Ligation ...................................................................................................................... 39
3.6.1 In-Fusion Cloning .............................................................................................. 39
3.6.2 Quick Ligation .................................................................................................... 40
3.6.3 Ligation with ElectroLigase ............................................................................... 41
VII
3.7 Agarose gel electrophoresis ....................................................................................... 42
3.8 Purification of DNA and extraction of DNA fragments from agarose gels .............. 43
3.9 Determination of RNA and DNA concentration ....................................................... 43
3.10 DNA sequencing of plasmids and PCR fragments .................................................... 43
3.11 Preparation of electrocompetent Lactobacillus plantarum WCFS1 .......................... 44
3.12 Transformation .......................................................................................................... 45
3.12.1 Transformation of Chemically Competent E. coli ............................................. 45
3.12.2 Transformation of Electrocompetent Competent Cells ...................................... 46
3.13 Polymerase Chain Reaction ....................................................................................... 47
3.13.1 PCR using Q5® Hot Start High-Fidelity 2x Master Mix ................................... 47
3.13.2 PCR with VWR Red Taq Polymerase Master Mix ............................................ 48
3.14 Preparation of samples for analysis of gene products in L. plantarum ..................... 49
3.14.1 Cultivation and harvesting of bacteria ............................................................... 49
3.14.2 Harvesting of bacterial cells for transcriptional analysis with ddPCR and ........ 50
3.15 Gel electrophoresis of proteins .................................................................................. 50
3.16 Western blotting analysis ........................................................................................... 51
3.16.1 Blotting with the iBlot™ Dry Blot System ........................................................ 52
3.16.2 SNAP i.d.® immunodetection ............................................................................ 53
3.16.3 Chemiluminescent detection of proteins ............................................................ 54
3.17 Detection of antigens localized on the surface of L. plantarum ................................ 54
3.17.1 Flow cytometry .................................................................................................. 55
3.17.2 Cell staining with FITC for flow cytometry and confocal laser scanning
microscopy ........................................................................................................................ 55
3.18 Confocal laser scanning microscopy ......................................................................... 56
3.18.1 Cell staining with DAPI and Nile-Red ............................................................... 56
3.19 Preparation of samples for transcriptional analyses .................................................. 57
3.19.1 Isolation of RNA ................................................................................................ 57
3.19.2 Treatment with DNase for removal of genomic DNA ....................................... 57
3.19.3 Reverse transcription .......................................................................................... 58
3.20 Droplet digital PCR ................................................................................................... 59
4 Results ............................................................................................................................... 63
4.1 Construction of the inducible vectors ........................................................................ 64
4.2 Construction of the constitutive vectors .................................................................... 66
4.2.1 Trouble shooting of construction of the constitutive expression ....................... 68
4.3 Growth curve analysis on L. plantarum harbouring different plasmids .................... 70

VIII
4.4 Western blot analysis of antigen production ............................................................. 71
4.5 Detection of antigen on the surface of L. plantarum using flow cytometry .............. 73
4.6 Detection of Antigen on the Surface of L. plantarum with Immunofluorescent
Microscopy ........................................................................................................................... 74
4.7 Adaption of the CRISPR/Cas system for use in L. plantarum .................................. 76
4.7.1 The CRISPR/Cas-system developed as a two-plasmid system in L. plantarum 77
4.7.2 Construction of a new SgRNA-plasmid ............................................................. 79
4.7.3 Construction of a SgRNA with homologous arms for CRISPR/Cas9 mediated
gene exchange ................................................................................................................... 81
4.7.4 Growth curve analysis of L. plantarum harbouring the two-plasmid system .... 83
4.8 Microscopy analysis of L. plantarum harbouring CRISPR/Cas-plasmids ................ 84
4.9 Transcription analysis with droplet digital PCR ........................................................ 87
4.9.1 Transcriptional analysis of L. plantarum depleted of the lp_2217 and lp_1247
genes 87
4.9.2 Dose response analysis using ddPCR ................................................................. 90
4.10 CRISPR/Cas9 assisted genome editing in L. plantarum ........................................... 92
5 Discussion ......................................................................................................................... 95
5.1 Construction of AgTB-producing plasmids .............................................................. 95
5.2 Growth of L. plantarum harbouring antigen plasmids .............................................. 96
5.3 Characterization of AgTB production and localization ............................................. 97
5.4 Development of the two-plasmid CRISPR/Cas9 system .......................................... 99
5.5 Growth curves of L. plantarum harbouring CRISPR/Cas9 plasmids ...................... 100
5.6 Microscopy analysis of L. plantarum harbouring the CRISPR/dCas9 system ........ 100
5.7 Transcription analysis with ddPCR ......................................................................... 102
5.8 CRISPR/Cas9 assisted genome modification of L. plantarum................................ 104
5.9 Concluding remarks and future prospects ............................................................... 108
6 References ....................................................................................................................... 110
7 Appendix ......................................................................................................................... 118

1
Introduction
1 Introduction
Lactic acid bacteria (LAB) are a genetically and ecologically diverse group of Gram-positive
bacteria. Due to their role in fermentation and conservation of foods, LAB have been of interest
to humans for hundreds of years. However, the last three decades the interest has significantly
increased due to their believed health-promoting effects as probiotics. LAB strains are also
robust and versatile organisms, able to withstand harsh conditions and even survive through the
human gastrointestinal tract (GIT). This has made them attractive candidates as delivery vectors
for therapeutic molecules. LAB are the most abundant group of Gram-positive bacteria used in
industry and medicine and represent a major economic factor.
Another promising potential of the lactic acid bacteria are as live delivery vectors of medical
interesting proteins such as immunogens. To progress from vector produced immunogens,
which often also introduce unnecessary heterologous genes, to integration of the expression
system into the genome of the bacteria a gene editing system like the CRISPR/Cas system could
be utilized.
After the discovery of clustered regulatory interspaced short palindromic repeats (CRISPR), it
has revolutionized genomic engineering. The CRISPR-Cas9 system, naturally responsible for
adaptive immunity in prokaryotes, can in principle generate double stranded breaks at any
genomic locus, making it widely available. The present study describes the construction of
recombinant Lactobacillus plantarum for antigen production, as well as the development of a
CRISPR/Cas system in L. plantarum WCFS1.
1.1 Lactic acid bacteria
Lactic acid bacteria (LAB) are gram positive, non-sporulating rods or cocci. They are
facultative anaerobe and can perform fermentation of carbohydrates by two different metabolic
pathways, either by the homofermentative pathway or the heterofermentative pathway. From
the homofermentative pathway, lactic acid is the main end product, while the
heterofermentative pathway also produces CO2, acetic acid and/or ethanol in equal amounts
(Kandler, 1983).
LAB occurs in a wide range of habitats, e.g. different food products such as fruit, vegetable,
meat and dairy, but also in mucosal surfaces of animals such as the small intestine, colon and

2
Introduction
vagina (Makarova et al., 2006). As they are natural inhabitants of animals’ gastro intestinal tract
(GIT), LAB has not been associated with any pathogenic effect. Rather, they have a “Generally
regarded as safe status” (GRAS).
In addition to being GRAS organisms, some specific lactic acid bacterial strains are being
marketed as probiotic with health-promoting effect for the consumer. Probiotics are defined as
“live microorganisms which administered in adequate amounts confer a health benefit on the
host” by the Food and Agriculture Organization/World Health organisation. A key property of
probiotic bacteria is the ability to survive the passage through the GIT. To do so, the bacteria
must have protection systems against the low pH in the stomach, digestive enzymes and the
bile in the small intestine (Jensen et al., 2012).
As well as being able to survive through the GIT, combined with several other properties LAB
makes an ideal candidate as a live delivery vector of immunogens. Some of the most important
properties are the close association with the intestinal epithelium, immunomodulatory
properties and that the consumption of LAB in large amounts are regarded as safe
(Mohamadzadeh et al., 2009).
1.2 Lactobacillus plantarum
The largest group of lactic acid bacteria are the genus Lactobacillus, which comprises of more
than 200 different species and subspecies(Sun et al., 2015). One of the most versatile lactic acid
bacteria, Lactobacillus plantarum, belongs to this genus. L. plantarum can be found both in
different foods and in the GIT. It is also involved in the spoilage of foods, such as wine, meat
and orange juice (de Vries et al., 2006).
L. plantarum was selected as the first to be completely sequenced based on its accessible to
high efficiency genetic transformation, as well as it was found to efficiently survive the GIT
making it a potentially ideal probiotic or delivery strain (de Vos, 2011). In 2003, Kleerebezem
and co-workers sequenced the full genome of L. plantarum WCFS1, and it was found to have
one of the largest genomes known for lactic acid bacteria. The authors suggested that the
flexible and adaptive behaviour of the bacteria was reflected by the relatively large amount of
regulatory and transport proteins (Kleerebezem et al., 2003). To date, there are 72 complete
genome sequence assemblies of different L. plantarum strains available in the NCBI database.
There is a lot of genetic variation among the sequenced L. plantarum strains (Molenaar et al.,
2005), with L. plantarum WCFS1 perhaps being one of the best studied strains.
3
Introduction
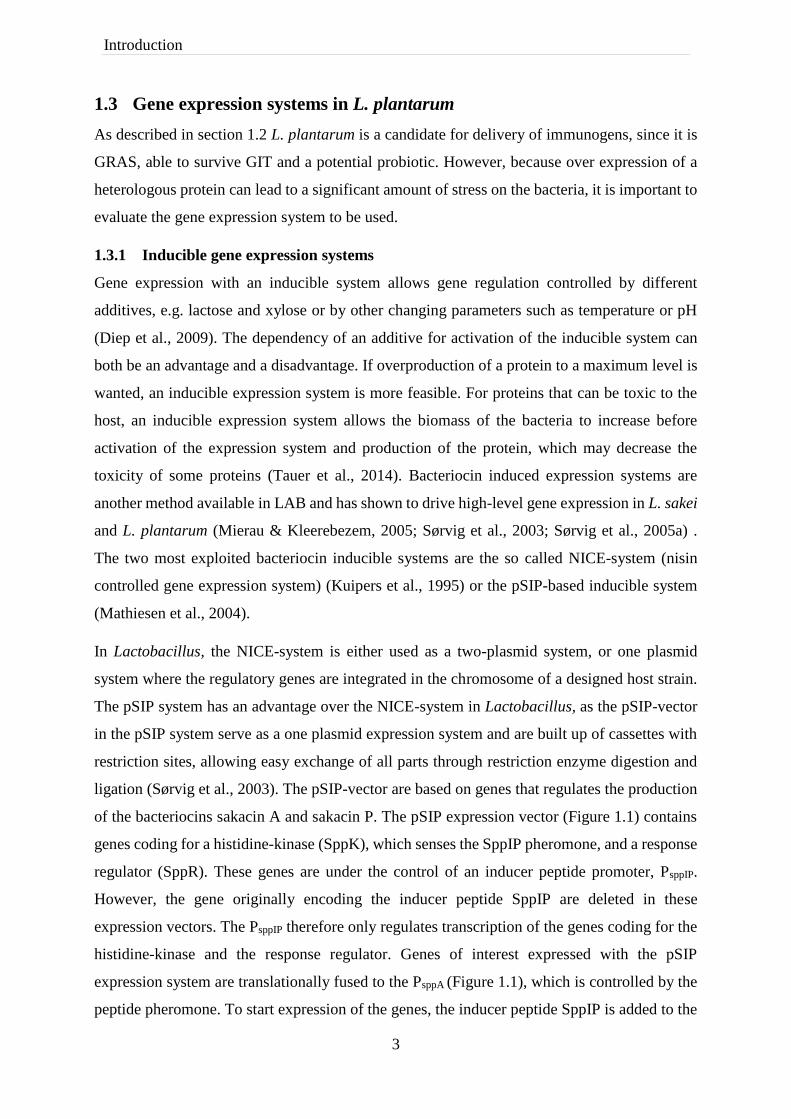
1.3 Gene expression systems in L. plantarum
As described in section 1.2 L. plantarum is a candidate for delivery of immunogens, since it is
GRAS, able to survive GIT and a potential probiotic. However, because over expression of a
heterologous protein can lead to a significant amount of stress on the bacteria, it is important to
evaluate the gene expression system to be used.
1.3.1 Inducible gene expression systems
Gene expression with an inducible system allows gene regulation controlled by different
additives, e.g. lactose and xylose or by other changing parameters such as temperature or pH
(Diep et al., 2009). The dependency of an additive for activation of the inducible system can
both be an advantage and a disadvantage. If overproduction of a protein to a maximum level is
wanted, an inducible expression system is more feasible. For proteins that can be toxic to the
host, an inducible expression system allows the biomass of the bacteria to increase before
activation of the expression system and production of the protein, which may decrease the
toxicity of some proteins (Tauer et al., 2014). Bacteriocin induced expression systems are
another method available in LAB and has shown to drive high-level gene expression in L. sakei
and L. plantarum (Mierau & Kleerebezem, 2005; Sørvig et al., 2003; Sørvig et al., 2005a) .
The two most exploited bacteriocin inducible systems are the so called NICE-system (nisin
controlled gene expression system) (Kuipers et al., 1995) or the pSIP-based inducible system
(Mathiesen et al., 2004).
In Lactobacillus, the NICE-system is either used as a two-plasmid system, or one plasmid
system where the regulatory genes are integrated in the chromosome of a designed host strain.
The pSIP system has an advantage over the NICE-system in Lactobacillus, as the pSIP-vector
in the pSIP system serve as a one plasmid expression system and are built up of cassettes with
restriction sites, allowing easy exchange of all parts through restriction enzyme digestion and
ligation (Sørvig et al., 2003). The pSIP-vector are based on genes that regulates the production
of the bacteriocins sakacin A and sakacin P. The pSIP expression vector (Figure 1.1) contains
genes coding for a histidine-kinase (SppK), which senses the SppIP pheromone, and a response
regulator (SppR). These genes are under the control of an inducer peptide promoter, PsppIP.
However, the gene originally encoding the inducer peptide SppIP are deleted in these
expression vectors. The PsppIP therefore only regulates transcription of the genes coding for the
histidine-kinase and the response regulator. Genes of interest expressed with the pSIP
expression system are translationally fused to the PsppA (Figure 1.1), which is controlled by the
peptide pheromone. To start expression of the genes, the inducer peptide SppIP is added to the

4
Introduction
growth medium, which ultimately leads to binding between the phosphorylated response
regulator and segments of the PsppA and PsppIP. The binding leads to an explosive production of
the target protein, the histidine-kinase and the response regulator (Risøen et al., 2000). The
pSIP-system has later been further modified for protein secretion (Mathiesen et al., 2008;
Mathiesen et al., 2009) and for anchoring of heterologous proteins to the bacterial cell surface
(Fredriksen et al., 2010; Fredriksen et al., 2012; Kuczkowska et al., 2017).
Figure 1.1. Schematic representation of pSIP401. Light grey regions show replicons pUC(pGEM)ori from E.
coli and 256rep from L. plantarum. Dark grey regions mark the Erythromycin (ermB) resistance gene. The
inducible promoter PsppIP is shown by the white region. The vertically hatched regions show the histidine kinase
(sppR) and response regulator genes. Dotted region shows the inducible promoter PsppA. The black box is a multiple
cloning site region. Target genes will be cloned downstream of the PsppA promoter. The figure is taken from Sørvig
et al. (2005).

5
Introduction
1.3.2 Constitutive gene expression systems
The strength of a constitutive promoter can vary, which can be used to ensure expression of
genes at a suitable level for different applications. For expression of a potential toxic protein, a
weak constitutive promoter can be chosen to keep proteins levels at a non-toxic level. For
applications where it is desirable to produce as much protein as possible, a strong constitutive
promoter can be chosen. Unlike the inducible promoter, the constitutive promoter is not
dependent on other genes for activation, thereby making the system less complicated. This
might be beneficial e.g. if integration into the chromosome is desirable. Integration of a gene
controlled by an inducible promoter would require concomitant integration of the helper genes,
while a gene controlled by a constitutive promoter would be expressed on the genome as long
as the promoter is integrated. Several constitutive promoters have been exploited in
heterologous gene expression studies in L. plantarum. Rud et al. (2006) constructed a library
consisting of 35 constitutive promoters, where some of the most potent constitutive promoters
showed higher activities than those of the inducible pSIP system. Promoters from the synthetic
promoter library was constructed in the inducible vector pSIP409 in L. plantarum NC8, by
replacing the inducible promoter of the vector with synthetic constitutive promoters. Sasikumar
et al. (2014) constitutively expressed the heterologous enzyme oxalate decarboxylase, fused to
the signal peptide Lp_0373, using the homologous promoter PldhL in L. plantarum WCFS1.
Tauer et al. (2014) showed constitutive expression of the model protein mCherry with four
different constitutive promoters, where two where homologous, one where heterologous and
one where the synthetic promoter P11 from the synthetic promoter library made by Rud et al.
(2006), in L. plantarum CD033.
1.4 Bacteria as vectors for antigen delivery
Most infectious agents enter the body through mucosal surfaces, thus mucosal immune
responses are most efficiently induced by immunization through oral, nasal, rectal or vaginal
routes. However, most vaccines in use today are administered by injection. The reason for this,
is because the amount of antigen delivered into the body by an injection is a known quantity
and results in generation of specific antibodies and other immune cells, that can be measured in
blood samples. Measurements of the mucosal immune responses on the other hand is more
complicated, as the uptake of the antigens can vary depending on the mucosal surface (Neutra
& Kozlowski, 2006).

6
Introduction
Pathogenic bacteria with reduced virulence have been successfully used as delivery vectors of
antigens to mucosal sites. Pathogenic bacteria contain pathogen-associated molecular patterns
(PAMPs), which include lipopolysaccharides (LPS), lipoproteins and flagellin. These
molecular patterns gives pathogenic bacteria an advantage over other non-pathogenic bacteria
as delivery vectors, because the PAMPs are recognized, and activates the immune system
(Toussaint et al., 2013). However, there is a risk that attenuated pathogenic bacteria may
reactivate their virulence. Although the pathogen used as delivery vectors are attenuated, in
immunocompromised patients they still have the potential to proliferate freely and therefore
poses a significant health risk (Sartori, 2004).
To overcome the safety problems associated with attenuated pathogenic bacteria, GRAS
bacteria such as lactic acid bacteria, have been extensively studied as delivery vectors of
therapeutic molecules. In addition to LAB strains having a GRAS status, another advantage is
the believed potential for LAB to stimulate both systemic and mucosal immune responses by
the mucosal route of administration (Wells & Mercenier, 2008). This may lead to the production
of immunoglobulin A (IgA), which can be a controlling factor in bacterial persistence and
uptake. These properties make LAB attractive candidates for the delivery of heterologous
antigens. Some lactic acid bacteria, such as L. lactis and L. plantarum are also proved to survive
the passage through the GIT and withstand the low pH of the stomach (Wells & Mercenier,
2008).
Recombinant strains can produce heterologous proteins to be localized either in the cytosol, at
the cell surface or secreted into the environments. All protein anchoring mechanisms are
described in section 1.4. A landmark study by Bermudez-Humaran et al. (2005) performed on
mice, revealed the protective effects of live L. lactis strains expressing cell wall-anchored E7
Ag and a secreted form of IL-12 to treat HPV-16-induced tumours by mucosal administration.
When the mice were challenged with a lethal level of tumour cells expressing E7, the
immunized mice showed full prevention of tumour growth. In another experiment, mice
received therapeutic immunization with L. lactis seven days after tumour cell-injection. The
therapeutic immunization showed tumour regression in treated mice (Bermudez-Humaran et
al., 2005).
However, the use of recombinant bacteria raises some concerns regarding patient and
environmental safety. Clinical reports have also been made on infection with Lactobacillus spp.
in severely immunocompromised patients, although these cases are rather rare (Doron &
Snydman, 2015). Other concerns include how heterologous genes affect LAB, and whether

7
Introduction
such genes will affect their status as safe. There are also uncertainties about unwanted host
responses to recombinant gene products, like allergenicity or autoimmunity. Other problems
associated with recombinant strains are propagation outside the host and gene transfer to other
organisms (Wells & Mercenier, 2008). This leads to a strong preference to L. lactis as delivery
vector, because this lactic acid bacteria is able to survive through the GIT, without colonizing,
and therefore limits the concern of propagation in the environment (Song, A. A.-L. et al., 2017).
For live bacteria as delivery vectors surviving through the entire GIT, a solution might be to
eliminate essential genes. Steidler et al. (2003) eliminated the thymidylate synthase gene thyA
in L. lactis and replaced it with a gene encoding interleukin-10. As a result, Steidler and co-
workers generated bacteria entirely dependent on the presence of thymidine in the environment.
These thyA depleted bacteria would not survive in the environment without a steady supply of
thymidine. In a phase I trial with transgenic bacteria expressing interleukin -10 for treatment of
Chron’s disease, it was shown that the transgenic bacteria did not survive outside and was safe
for the host (Braat et al., 2006).
Although live bacteria as delivery vectors in vaccines are extensively researched, a licensed
vaccine is yet to come. However, a genetically modified version of the bacille Calmette-Guérin
(BCG) vaccine is currently in phase III of clinical testing. In this version, the immunogenicity
of the BCG-vaccine is improved by replacing the intrinsic urease C encoding gene with the
listeriolysin encoding gene from Listeria monocytogenes. The delivery vector is the live,
attenuated bacteria Mycobacterium bovis (Nieuwenhuizen et al., 2017).
1.5 Secretion and anchoring of proteins in Gram-positive bacteria
In Gram-positive bacteria, the cytoplasmic membrane is covered with a thick peptidoglycan
layer, unlike the Gram-negative bacteria where there is only a thin layer of peptidoglycan.
However, to compensate for the thin peptidoglycan layer, Gram-negative bacteria contains an
additional outer membrane. All proteins are synthesized at the ribosomes (Balchin et al., 2016),
but not all have their function intracellularly. Proteins functioning on the outside of the cytosol
has a special, mainly N-terminal, peptide sequence, giving the cell information about the end-
localization of the protein (Kleerebezem et al., 2010). Secretion of proteins with a N-terminal
peptide sequence are simpler in Gram-positive bacteria than in Gram-negative bacteria, since

8
Introduction
they are monoderm. This makes Gram-positive bacteria promising candidates for production of
secreted proteins.
There are seven known protein secretion pathways for Gram-positive bacteria: the secretion
(sec), twin-arginine translocation (Tat), flagella export apparatus (FEA), fimbrillin-protein
exporter (FPE), holing (pore forming), peptide efflux ABC and the WXG100 secretion system
(Wss) pathways (Desvaux et al., 2009).
Most proteins are secreted by the Sec translocase (Figure 1.2), which mediates protein transfer
across the cytoplasmic membrane in Gram-positive bacteria. Proteins that are translocated by
the Sec pathway are targeted through a N-terminal signal peptide, which are removed after
translocation, consisting of three distinct parts: a N-domain with 1-3 positively charged amino
acids, a hydrophobic domain of 10-15 amino acids (H-domain) and a polar C-domain with a
signal peptidase cleavage site (Driessen & Nouwen, 2008). If the cleavage site of the signal
peptide contains the motif A-X-X-A the peptide will be cleaved by signal peptidase I, this leads
to secretion of the protein (van Roosmalen et al., 2004). However, if the signal peptide contains
the motif L-X-X-C (lipobox) it is cleaved by signal peptidase II. Subsequently to the cleavage
by signal peptidase II, the protein is covalently attached to the lipid bilayer (Sutcliffe &
Harrington, 2002). All Lactobacillus genomes encode a single signal peptidase II, while the
number of signal peptidase I ranges from one in most species to three in L. plantarum
(Kleerebezem et al., 2010).

9
Introduction
Figure 1.2. Schematic illustration of the Sec secretion system and components involved. Secretory proteins
are synthesized on ribosomes in the cytoplasm as preproteins with a N-terminal signal peptide. A signal recognition
particle (SRP) binds to the signal peptide of the preprotein. The protein FtsY binds to SRP for stabilisation during
the transport of the preprotein to the Sec translocase. The Sec translocase is a protein complex embedded in the
cell membrane and consists of an ATP driven motorprotein (SecA) and a protein channel SecYEG. The signal
peptide is cleaved by a signal peptidase during or directly after the translocation. For more details about the other
components illustrated on the figure see Tjalsma et al. (2014). The figure is taken from Tjalsma et al. (2014).
Gram-positive bacteria employ several different mechanisms for anchoring of protein to the
cell surface, either in the membrane or to the cell wall. The anchoring mechanisms can be sorted
into four different classes of either transmembrane anchoring, lipoprotein- and LPXTG-
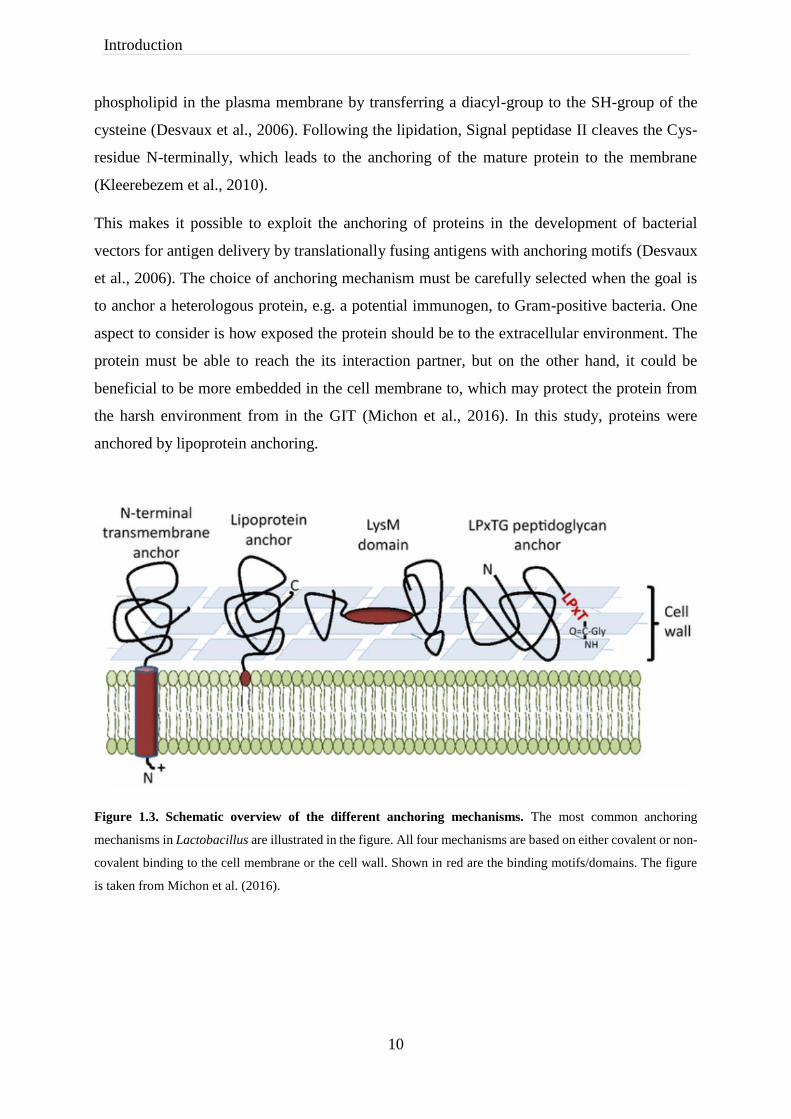
anchoring or non-covalent binding to the cell wall. Figure 1.3 shows a schematic illustration of
the different anchoring mechanisms.
A protein containing a L-X-X-C motif (lipobox) in the signal peptide leads to lipoprotein
anchoring to the plasma membrane. After complete secretion of the protein through the Sec
pathway, the enzyme diacylglycerol transferase couples cysteine (C) of the lipobox to a
10
Introduction
phospholipid in the plasma membrane by transferring a diacyl-group to the SH-group of the
cysteine (Desvaux et al., 2006). Following the lipidation, Signal peptidase II cleaves the Cys-
residue N-terminally, which leads to the anchoring of the mature protein to the membrane
(Kleerebezem et al., 2010).
This makes it possible to exploit the anchoring of proteins in the development of bacterial
vectors for antigen delivery by translationally fusing antigens with anchoring motifs (Desvaux
et al., 2006). The choice of anchoring mechanism must be carefully selected when the goal is
to anchor a heterologous protein, e.g. a potential immunogen, to Gram-positive bacteria. One
aspect to consider is how exposed the protein should be to the extracellular environment. The
protein must be able to reach the its interaction partner, but on the other hand, it could be
beneficial to be more embedded in the cell membrane to, which may protect the protein from
the harsh environment from in the GIT (Michon et al., 2016). In this study, proteins were
anchored by lipoprotein anchoring.
Figure 1.3. Schematic overview of the different anchoring mechanisms. The most common anchoring
mechanisms in Lactobacillus are illustrated in the figure. All four mechanisms are based on either covalent or non-
covalent binding to the cell membrane or the cell wall. Shown in red are the binding motifs/domains. The figure
is taken from Michon et al. (2016).

11
Introduction
1.6 Tuberculosis
According to the World Health Organization’s Global Tuberculosis report from 2017,
Tuberculosis (TB) is the ninth leading cause of deaths worldwide and the leading cause of
deaths from a single infectious agent, ranking above HIV/AIDS. In 2017 there were an
estimated 1.7 million people died of TB and 10.4 million people fell ill with TB in 2017. An
increasing threat is the prevalence of drug-resistant TB, with 490 000 million cases of
multidrug-resistant TB in 2017. TB is normally treated for six months with antibiotics, but for
patients with drug resistant TB, the treatment can take up to twenty months.
Mycobacterium tuberculosis is the causative agent of TB. The M. tuberculosis is taken up by
phagocytic cells which either leads to destruction of the bacteria, or induction of an
inflammatory response which leads to recruitment of immune cells and later the formation of
granulomas (Russell et al., 2010). The bacterium can stay latent in granulomas for years. M.
tuberculosis is released when the granulomas dies and can end up in the lungs and is spread by
aerosols.
TB is most common in poor countries and among people who are malnourished,
immunocompromised, homeless or imprisoned. The question of why these vulnerable groups
have reduced resistance is not yet answered. Vaccination is the most effective tool to defeat TB,
and to date the only available vaccine is the bacille Calmette-Guèrin (BCG) vaccine. The BCG
vaccine does not ensure full protection against the mature form of TB, pulmonary- or lung-TB,
which is the contagious and transmittable form of the disease. Neither is the BCG vaccine
recommended for use in HIV-infected or other immunocompromised patients (Crum-Cianflone
& Sullivan, 2017). Therefore, a new and more effective vaccine than the BCG-vaccine is
urgently needed.
However, research have been done on developing a novel vaccine against TB. According to the
World Health Organization Global Report on Tuberculosis from 2017, there are 12 vaccine
candidates in clinical trials. In addition to these, the use of lactic acid bacteria (LAB) has been
explored as a vector for TB-antigen delivery to mucosal sites. Kuczkowska et al. (2016)
successfully surface displayed and expressed a fusion antigen from M. tuberculosis on L.
plantarum. The fusion antigen comprised the two antigens Ag85B and ESAT-6 and was
anchored to the bacterial cell by two different mechanisms, a lipoprotein anchor and a covalent
cell wall anchor. Proteins from the antigen 85 family are the most commonly used M.
tuberculosis antigens. Another family of proteins that have shown strong antigenic properties

12
Introduction
are proteins from the ESAT-6 family (Armitige et al., 2000; Okkels & Andersen, 2004). The
study showed that strains with different anchoring both induced immune response in mice after
nasal or oral immunization (Kuczkowska et al., 2016). However, although ESAT-6 have shown
strong antigenic properties, it is also a valuable diagnostic reagent. Therefore, finding other
antigens inducing strong immune responses are important. A protein that has been raising
interest as a substitute for ESAT-6 is the M. tuberculosis expressed protein TB10.4, which is
strongly recognized in infected humans (Dietrich et al., 2005; Kou et al., 2018). The H4:IC31
BCG booster vaccine comprises the fusion protein Ag85B-TB10.4 and is one of the 12 vaccine
candidates in clinical trials. As of 2017, it was in phase II of clinical testing.
1.7 The CRISPR/Cas9-system
The Clustered Regularly interspaced short palindromic repeat (CRISPR) system is an array
built up of nucleotide sequences called repeats and spacers and is a defence mechanism against
invading agents in bacteria and archaea (Sorek et al., 2008). The first CRISPR array was
described by Ishinio and co-workers in 1987, who found 14 repeats of 29 base pairs,
interspersed by 32-33 base pairs of non-repeating spacer sequences in E. coli (Ishino et al.,
1987; Nakata et al., 1989). Similar CRISPR arrays were later found in other bacteria and
archaea, for example Thermotoga maritima and M. tuberculosis (Hermans et al., 1991; Nelson
et al., 1999). As sequencing of full genomes became available, researchers were able to perform
genome-wide computational searches for CRISPR arrays. These analyses revealed that such
CRISPR arrays was found in approximately 40% and 90% of sequenced bacterial and archaeal
genomes, respectively (Grissa et al., 2007). Simultaneously, four genes encoding the CRISPR
associated protein (Cas protein), located adjacent to the repeat arrays was identified (Jansen et
al., 2002). Later, another 25-45 additional Cas encoding genes was found in multiple
prokaryotic genomes. These genes are not found in genomes lacking the CRISPR arrays (Haft
et al., 2005). Several hypotheses were made regarding the function of the CRISPR arrays. The
repeats were suggested to be involved in replicon partitioning, that they were mobile elements
or involved in DNA repair (Jansen et al., 2002; Makarova et al., 2002; Mojica et al., 1995).
However, in 2005 three individual research groups reported that the spacer sequences often
contained plasmid- or phage-derived DNA. Based on these findings, they suggested that the
CRISPR arrays mediated immunity of the host against invading agents (Sorek et al., 2008).

13
Introduction
The Cas proteins (Figure 1.4) has since its discovery been established as important components
for simplifying genome engineering. An advantage the CRISPR-system holds over previously
used genetic editing tools, such as zinc-finger nucleases (ZFN) and transcription activator-like
effector nucleases (TALEN), is it simplicity. ZFN and TALENs requires labourous engineering
of target specific proteins for each new experiments, while the Cas-protein in CRISPR can
remain the same (Kim & Kim, 2014). The Cas-protein is an endonuclease that induces double
stranded break in DNA. Several different Cas9-proteins exists in prokaryotes, but the proteins
are highly variable in sequence and size. However, all known Cas9 enzymes have two domains:
the HNH and RuvC domains. The HNH domain cleaves the DNA strand complementary to the
single guide RNA (SgRNA) sequence, while the RuvC nuclease domain cleaves the non-
complementary strand. Together, the HNH and RuvC domains assure double-stranded DNA
breaks (Jinek et al., 2014). While the HNH and RuvC domains is responsible for cleavage of
the DNA, Cas9 enzymes also contains a highly conserved arginine-rich region, which is thought
to mediate binding of DNA (Sampson et al., 2013).
Figure 1.4. The 3-D structure of the CRISPR-associated (Cas) protein. The Cas9 protein consists of two
catalytical domains, the RuvC and the HNH domains, which together with the SgRNA induced double stranded
breaks in the DNA. If one of the domains are mutated, the protein will only induce single stranded break of the
DNA. In catalytically inactive dead Cas (dCas), both RuvC and HNH are mutated. The Cas protein contains a
conserved, arginine-rich region which is believed to mediate the binding of the DNA. The figure is taken from
(Kim & Kim, 2014).
Several mutants have been made from the model Cas9 enzyme, derived from Streptococcus
pyogenes (Sp). In the SpCas9 mutant Cas9D10A, an Aspartate residue in position 10 of the
protein has been changed to Alanine, resulting in inactivation of the RuvC domain. With only

14
Introduction
one functioning endonuclease domain in Cas9D10A, only single stranded DNA breaks are
induced when binding DNA. In the catalytical inactive Cas, so-called dead Cas9 (dCas9), the
HNH domain is also inactivated by introduce a substitution of a Histidine to an Alanine at
position 840 (Jinek et al., 2012). Because both enzymatic domains (HNH and RuvC) are
inactivated in dCas9, the dCas9 protein will not digest DNA. However, dCas9 still binds to the
DNA, and thereby blocking transcription by acting as a repressor.
CRISPR mediates protection of prokaryotes against invading viruses through events of
capturing DNA fragments of about 20 base pairs from the invading virus. These fragments are
inserted as spacers into a CRISPR locus of the bacterial chromosome. RNA transcribed from
these spacers, are responsible for guiding the Cas-protein to its target. In bacteria harbouring a
CRISPR system, the CRISPR locus of spacers and repeats are first transcribed to make CRISPR
RNA (crRNA). From the same locus, the trans-activating crRNA (tracrRNA) is also
transcribed. In vitro, the crRNA and tracrRNA can be fused together to form a single guide
RNA (SgRNA). The crRNA is the target-specific part of sgRNA, with its 20 nt complementarity
to the genomic DNA. The complementarity guides the Cas-protein to potential cutting sites on
the genome. The role of the tracrRNA on the other hand, is to assure binding between sgRNA
and the Cas-protein through the Cas-handle (Deltcheva et al., 2011).
An active Cas9 endonuclease is obtained by formation of a complex between the Cas9 and the
sgRNA (Figure 1.5). Binding of sgRNA to the Cas9 induces conformational changes in Cas9,
forming a central channel that may accommodate target DNA (Jinek et al., 2014). The activated
endonuclease Cas9 is then able to cleave a 23 bp target DNA sequence. As previously described,
the first twenty base pairs are complementary to the crRNA, however, the last three base pairs
on the targeted DNA sequence are the so called protospacer adjacent motif (PAM) site (Jiang
et al., 2013). For Cas9-proteins derived from S. pyogenes, the PAM site is normally 5’-NGG-
3’, but can also be 5’-NAG-3’. The PAM site is recognized by the Cas9 itself (Sternberg et al.,
2014). Before the discovery of CRISPR, a widely used editing tool was the loxP/Cre system,
which is used several times for knock out of genes in L. plantarum (Chen et al., 2018; Lambert
et al., 2007; Yang et al., 2017; Yang et al., 2015). The system consists of the recombinase Cre,
that recombines specific loxP restriction sites. The loxP restriction sites are defined sites of 34
bp, which are not commonly found in the genome, or in all genomes. The CRISPR/Cas system
however, can target any site on the genome containing the 3 bp PAM-site, which makes it a
more available tool compared to its precursors (Maizels, 2013).

15
Introduction
Figure 1.5 Schematic overview of the CRISPR/Cas9 system. An active endonuclease is achieved by complex
formation between Cas9 and SgRNA, which induces conformational changes of Cas9. The Cas9-SgRNA complex
is guided to the target DNA by the target specific crRNA-part of SgRNA. Through the conformational change, a
central channel is formed, where the target DNA can be cleaved. Illustration is taken from (Kim & Kim, 2014).
1.7.1 Repair systems in bacteria
Double or single stranded breaks induced by Cas-proteins must be repaired by the cell. For
bacteria unable to repair DNA damage, the CRISPR-system will be lethal. Double stranded
breaks induced by Cas9 can be repaired in one of two ways. Either by the non-homologous end
joining pathway (NHEJ) or by homology directed repair (HDR) (Figure 1.6). The NHEJ
pathway is used in the absence of a DNA template. This repair mechanism is often error-prone
and can create insertion or deletion mutations at the junctional site. This results in a frameshift,
and thereby disruption of the targeted gene. However, NHEJ pathways are not prevalent in
prokaryotes (Su et al., 2016).
In a second strategy, HDR, the genetic information at the break is restored by utilizing an
undamaged template. Because HDR uses a template, this repair mechanism is not mutagenic.
By taking advantage of this repair mechanism, precise editing can be obtained by cutting with
a Cas-protein and relying on HDR (Hiom, 2009). To perform precise editing with HDR the
insertion, e.g. of a desired mutation or a new gene must have sequences homologous to the
target site (homologous arms) on each side. These homologous arms will then act as the
template in the repairing mechanism, and the region between the template regions will be
inserted into the genome through homologous recombination. Reparation of single stranded
breaks can also be obtained by HDR (Song, X. et al., 2017).

16
Introduction
Figure 1.6. The two main pathways for repairing double-stranded DNA break in bacteria. Double-strand
breaks induced by the endonuclease Cas9 can either be repaired by nonhomologous end joining (NHEJ) or
homology-directed repair pathways. The NHEJ repair is an imprecise mechanism which often produce insertion
or deletion mutations of variable length. The precise mechanism HDR can introduce point mutations or insertions
from a DNA donor template. The figure is taken from (Sander & Joung, 2014).
All homologous recombination pathways are dependent on the recruitment of a recombinase.
The Red/RecET dsDNA recombination system in E. coli is a well-known system of
recombinases. However, a homolog recombination system to the Red/RecET system has been
identified in L. plantarum WCFS1. Yang et al. (2015) identified an exonuclease encoded by
lp_0642 and a potential host-nuclease inhibitor encoded by lp_0640 from a prophage P1 locus
in L. plantarum WCFS1. They discovered that these two proteins combined with the previously
characterized single strand annealing protein encoded by lp_0641, could perform homologous
recombination between a heterologous dsDNA substrate and host genomic DNA. Unlike the
Red/RecET recombineering system in E. coli, which only requires homologies of 50 bp for
maximum recombination efficiency, the lp_0640-41-42 system in L. plantarum WCFS1
required long homologies of >1 kb between the heterologous substrate and the host genome,
for efficient recombination. It was also found that recombination is more favoured in WCFS1
when the sequence to be inserted on the recombination substrate is shorter than the region on
the genome being deleted. The lp_0640-41-42 system have previously been used in
combination with the loxP/Cre system for disruption of D-lactate dehydrogenase (ldhD) gene,
and concomitant insertion of the gusA gene and a Chloramphenicol resistance gene (Yang et
al., 2015).

17
Introduction
1.7.2 Use of CRISPR systems in Gram-positive bacteria
The catalytically inactive dCas9 is often used to study the functionality of genes. As dCas9
interfere with the transcription of the gene it is bound to, this type of experiment is often termed
CRISPR interference (CRISPRi). In a recent study by Stamsås et al. (2018), the CRISPRi
system was developed in Staphylococcus aureus to study the functionality of the cell division
proteins CozEa and CozEb. A homolog to these two proteins, CozE, in Streptococcus
pneumoniae has previously been found to be an essential regulator of cell elongation in the oval
shaped cocci bacteria. Stamsås and co-workers found that CozEa and CozEb played
overlapping roles to control proper cell cycle progression in the spherical S. aureus cells. Using
the CRISPRi system, they showed that knock down of one of the proteins only had a minor
effect. However, knock down of cozEa and cozEb simultaneously affected the cell division
drastically. S. aureus cells normally divide in consecutive, perpendicular planes, meaning that
the new septum is formed perpendicular to the previous and thereby splitting daughter cells. In
bacterial cells were both cozEa and cozEb were knocked down, cell division was not performed
according to this intricate system, resulting in elongated daughter cells (Stamsås et al., 2018).
Other LAB strains with successful development of a CRISPR/Cas-system is e.g. Lactobacillus
reuteri, Lactobacillus casei and Lactococcus lactis (Oh & van Pijkeren, 2014; Song, X. et al.,
2017; van der Els et al., 2018). In L. casei systems has been developed to use for both gene
deletion and insertion. This was achieved using the mutated version of Cas9, Cas9D10A, which
induces single stranded breaks. The expression of Cas9D10A was optimized by exchanging the
wild type promoter with the strong constitutive promoter P23. Deletions or insertions of
fragments were performed by using homologous arms and taking advantage of the endogenous
repair system of the bacterial cell. One of the aspects investigated in L. casei was the impact of
deletion size. When a fragment of 1.1 kb was deleted from the gene LC2W_2179, the editing
efficiency was 36 %. However, the efficiency was reduced drastically when the deletion size
increased to 3 kb and for a deletion size of 5 kb, no colonies were obtained. The protein eGFP
was also successfully inserted into the genome of L. casei, although the fluorescence intensity
was about 33% lower than if the bacteria harboured a multicopy plasmid with eGFP (Song, X.
et al., 2017).

18
Introduction
1.8 Aim of this study
This study is part of a larger project, where the goal is to produce mucosal administrated LAB-
based vaccines against Mycobacterium tuberculosis. The three goals for the study was (1) to
express and display the tuberculosis antigen hybrid Ag85B_TB10.4 on the surface of
Lactobacillus plantarum WCFS1. (2) to implement the CRISPR/Cas system for use in
Lactobacillus plantarum WCFS1. (3) To utilize the CRISPR/Cas system to integrate
constitutive expression of the tuberculosis antigen into the genome of Lactobacillus plantarum
WCFS1.
In previous research, the antigens have been produced using the pSIP system, which the gene
expression is induced by addition of the pheromone SppIP. Recombinant Lactobacillus
constructed for production of the novel fusion antigen Ag85B_TB10.4 were made using the
pSIP vectors. The antigen production and localization of the constructed strains was
characterized. As another goal was integration of the antigen into the genome, a constitutively
expression system where thought to simplify the integration process, as briefly described in
section 1.3.2. Therefore, attempts at construction of plasmids constitutively producing
Ag85B_TB10.4 were conducted. The purpose of implementing the CRISPR/Cas system in L.
plantarum was to potentially utilize the system to mediate integration of the hybrid antigen into
the genome of the bacteria. The CRISPR/Cas system was developed as a two-plasmid system,
where the Cas-gene were inducible expressed on one plasmid and the SgRNA was
constitutively expressed on the second plasmid. The starting point for all vector constructions
in this study was derivatives of the pSIP 401 vector (Table 2.4). The ultimate goal of this study
was to develop the CRISPR/Cas system in L. plantarum and use the system to integrate the
tuberculosis antigens into the genome.
The experimental work of this study was carried out in the following steps:
• Construction of inducible vectors for expression of Ag85B_TB10.4
• Construction of vectors for constitutive expression of Ag85B_TB10.4
• Investigation of production and surface localization of the antigen in L. plantarum using
western blotting, flow cytometry and confocal laser scanning microscopy.
• Construction of the two-plasmid CRISPR/Cas-system in L. plantarum, using three
different variants of the Cas-protein: Cas9, Cas9D10A and catalytically inactive dCas9
• Transcription analyses of genes depleted with the CRISPR/dCas9 system by droplet
digital PCR and confocal laser scanning microscopy

19
Materials
2 Materials
2.1 Laboratory Equipment
Laboratory equipment
Supplier
Cryovials, 1.5 mL
Various glassware
Electroporation cuvette, Gene Pulser®, 0.2 cm
Disposable cuvette, 1.5 mL
1 mm cuvette
Eppendorf tube, 1.5 and 2.0 mL
Falcon 2059 Polypropylene Round Bottom tube, 14 mL
FastPrep® tube
Glass beads
Microwell plate, 96 wells
Nunc tube, 15 and 50 mL
Slides and cover slip, Menzel-gläser
PCR tube, 0.2 mL
Pipetboy comfort
Serological pipette, 5, 10 and 25 mL
Syringe, 10-60 mL
Sterile filter, 0.20 µM in pore size
Water bath
8- well strips
Multiplate Unskirted 96-Well PCR Plates
DG8™ Cartridges
DG8™ Gaskets
Pierceable Foil Heat Seals
Lysing matrix 2 tubes, 2 mL
Sarstedt
Bio-Rad
Brand
Bio-Rad
Axygen
Becton Dickinson
Fisher Scientific
Sigma
Thermo Scientific
Nunc
Thermo Scientific
Axygen
Integra
Sarstedt
Plastipak
Sarstedt
Julaba
VWR
Bio-Rad
Bio-Rad
Bio-Rad
Bio-Rad
MP Biomedicals
Instrument
Supplier

20
Materials
Azure c400
CertoClav
Electrophoresis electricity supplier
FastPrep® -24 Tissue and Cell Homogenizer
GelDoc EZ imager
Gene Pulser II
Incubator
Inverted Light Microscope, Leica DM IL
Leica TCS SP5 Confocal laser scanning microscope
MacsQuant®Analyser
PCR machine
Mastercycler gradient
SimpliAmp Thermal Cycler
pH-meter
Pulse Controller Plus
Centrifuge
Allegra X-30R Centrifuge
Eppendorf centrifuge 5418R
Heraeus Pico 21 centrifuge
Micro centrifuge MiniStar silverline
SNAP i.d. Protein Detection System
Ultrospec 10 Cell Density Meter
QX200 Droplet Generator
QX200 Droplet Reader
Multiskan FC
BioPhotometer D30
PX1™ PCR-Plate sealer
NanoDrop
Azure biosystems
OneMed
Bio-Rad
MP Biomedicals
Bio-Rad
Bio-Rad
Termaks
Leica Microsystems
Leica Microsystems
Miltenyi Biotec
Eppendorf
Applied Biosystems
Metrohm
Bio-Rad
Beckman Coulter
Eppendorf
Thermo Scientific
VWR
Millipore
Amersham Biosciences
Bio-Rad
Bio-Rad
Thermo Scientific
Eppendorf
Bio-Rad
Thermo Fisher
Software Supplier
AzureSpot Analysis Software
CLC DNA Main Workbench 7
Azure Biosystems
Qiagen

21
Materials
ImageJ
MacsQuantify™ Software
pDRAW32
QuantaSoft Software
CRISPR Primer designer
Fiji
Miltenyi Biotec
www.acaclone.com
Bio-rad
www.plantsignal.cn

22
Materials
2.2 Chemicals
Chemical Supplier
Acetone, C3H6O
Acetonitrile, C2H3N
Ammonium Citrate Tribasic, C6H17N3O7
Ampicillin, C16H19N3O4S
Brain-Heart Infusion (BHI)
Chloramphenicol, C₁₁H₁₂Cl₂N₂O₅
De Man, Rogosa, Sharpe (MRS)
Dithiothreitol (DTT), C4H10O2S2
Ethylenediaminetetraacetic acid (EDTA),
C10H16N2O8
Erythromycin, C37H67NO13
Ethanol, C2H5OH
D-(+)- Glucose, C6H12O6
Glycerol, C3H8O3
Glycine, C2H5NO2
Kanamycin, C18H36N4O11
Magnesium Chloride, MgCl2
Magnesium Phosphate, MgSO4
Peqlab
Polyethylene glycol, PEG1450
SeaKem® LE Agarose
Sodium Acetate, C2H3NaO2
Sodium Chloride, NaCl
Sodium hydroxide, NaOH
Super Optimal broth with Catabolite
repression (S. O. C.)
Trichloracetic acid (TCA), C2HCl3O2
Tris-base, C4H11NO3
Tween-20
Merck
Sigma-Aldrich
VWR
Sigma-Aldrich
Oxoid
Merck
Oxoid
Sigma-Aldrich
Merck
Merck
Sigma-Aldrich
VWR
Merck
Duchefa Biochemie
Sigma-Aldrich
Merck
Sigma
Peqlab
Aldrich
Lonza
Sigma-Aldrich
Merck
Sigma
Invitrogen
Sigma
Sigma
Sigma-Aldrich

23
Materials
β-mercaptoethanol
Bacteria protect
Droplet generation Oil for EvaGreen
Sigma-Aldrich
Qiagen
Bio-Rad
2.3 Proteins and enzymes
Protein/Enzyme Supplier
Antibodies
Anti-Rabbit IgG-FITC
Anti-Mouse IgG-FITC
HRP-Rabbit Anti-Mouse IgG
HRP-Goat Anti-Rabbit IgG
Anti Mycobacterium tuberculosis Ag85 ABIN361295
ESAT6 Mouse mcAb (ab26246)
The BenchMark™ Protein Ladder
Bovine Serum Albumin (BSA)
FastDigest® Green Buffer
FastDigest® Restriction enzymes
Acc65I
AgeI
BglII
Bsu15I
DpnI
EcoRI
EcoRI31
HindIII
NcoI
NdeI
NotI
SalI
XhoI
Sigma
Sigma
Invitrogen
Invitrogen
Antibodies-online
Abcam
Invitrogen
Sigma
Thermo Scientific
Thermo Scientific

24
Materials
Inducer peptide SppIP
Lysozyme
Mutanolysin
MagicMark® XP Western Protein Standard
RED Taq DNA Polymerase Master Mix
ElectroLigase®
ElectroLigase® Reaction Buffer
CASLO
Sigma
Sigma
Invitrogen
VWR
NEB
NEB
2.4 DNA
DNA Supplier
DNA-standards
GeneRuler™ 1 kb DNA ladder
Quick-Load® Purple 1 kb DNA Ladder
100 bp DNA ladder
Fermentas
NEB
NEB
2.5 Primers
In this study, several primers were used for different approaches. The names and sequence of
all primers used in this study are presented in table 2.1. The purpose of each primer is described
in table 2.2.
Table 2.1 – Primers and their sequence used in this study
Name Sequence* Restriction
site
SekF GGCTTTTATAATATGAGATAATGCCGAC
SekR CCTTATGGGATTTATCTTCCTTATTCTC
Tb10.4F
CGATTGCGGCGGTCGACTTTAGTCGTCC
Tb10.4R
TCGAACCCGGGGTACCGAATTCTTATGGCC
SeqAg85_R CCCATTGATGGACTTGGAAC
SekFBsaI_F ACGTTAATCCGAAAAAAACTAACGTT
Cm1F GGAGAGATTACATGAACTTTAATAAAATTGATTTAGA
CAATT

25
Materials
pCasR ACCGAATTCCTCGAGTCAGTCACCTCCTAGCT
Cas9NcoI_F AGTATGATTCCCATGGATAAGAAATACTCAATAGGCT
T
NcoI
Lp_2645_F ATTCTGGAAAGTGGTTGGGG
Lp_2645_R ACTTCCGAAAAGCGTCTTGA
Lp_1247_F CACGATTACGAGTGTGACGA
Lp_1247_R CTAGAAATCGTGTCGCCCAT
Lp_2217_F CCATGGATGTTGGTCCAAGT
Lp_2217_R CAAGATCGCATAGCCTGGAA
Phospho-
SgRNA_R
TATAGTTATTATACCAGGGGGACAGTGC
ThyA_SgRNA_F TGTATGTTCCCGTGCCGGTAGTTTAAGAGCTATGCTG
GAAACAG
SgRNA-HL2_F CGAACCCGGGGTACCGTATTGGCTATTAAAGAAGAA
AAATGT
Acc65I
HL-NucA2_R AGTTGACAATGGCATTCCAATTTTCAATTTTAAAATCC
CCAAACTT
HL-NucA2_F AAATTGAAAATTGGAATGCCATTGTCAACTAAAAAAT
TACATA
NucA-HH2_R ACAACTAATATGCCTATTGACCTGAATCAGCGTTG
NucA-HH2_F CTGATTCAGGTCAATAGGCATATTAGTTGTTCCGGC
SgRNA-HH2_R CTCCAGTAACTCGAGTCGGGACTGTTAGCGCCT XhoI
* Restriction sites in the sequences are underlined.
Table 2.2 – Description of the primers used in this study
Name Description
SekF Forward primer for sequencing of all pSIP derivatives
SekR Reverse primer for sequencing of all pSIP derivates
Tb10.4F
Forward In-Fusion primer for insertion of the Lp1261_Ag85B_TB10.4
into pLp1261_InvS
Tb10.4R
Reverse In-Fusion primer for insertion of the Lp1261_Ag85B_TB10.4
into pLp1261_InvS
SeqAg85_R Reverse primer for sequencing of the antigen Ag85

26
Materials
SekFBsaI_F Forward primer for sequencing of all pSIP derivates from the BsaI
restriction site
Cm1F Binds to the chloramphenicol resistance gene
pCasR In-Fusion reverse primer for insertion of Cas-genes into pSIP_403
vector
Cas9NcoI_03_F In-Fusion forward primer for insertion of Cas-genes into pSIP_403
vector
Lp_2645_F Forward primer that binds to the gene lp_2645. Used in ddPCR
Lp_2645_R Reverse primer that binds to the gene lp_2645. Used in ddPCR
Lp_1247_F Forward primer that binds to the gene lp_1247. Used in ddPCR
Lp_1247_R Reverse primer that binds to the gene lp_1247. Used in ddPCR
Lp_2217_F Forward primer that binds to the gene lp_2217. Used in ddPCR
Lp_2217_R Reverse primer that binds to the gene lp_2217. Used in ddPCR
Phospho-
sgRNA_promoter_R
Phosphorylated primer that binds to the SgRNA-plasmid. Used for
insertion of new base-pairing sequences
ThyA_SgRNA_F Primer that binds to the SgRNA-plasmid and inserts a base-pairing
sequence targeting the gene ThyA
SgRNA-HL_F In-Fusion forward primer for insertion of the left homology arm into
the SgRNA-plasmid
HL-NucA_R Reverse primer with specificity to the left homology arm. Tail is
homologous to NucA
HL-NucA_F Forward primer with specificity to NucA. Tail is homologous with the
left homology arm
NucA-HR_R Reverse primer with specificity to NucA. Tail is homologous with the
right homology arm
NucA-HR_F Forward primer with specificity to the right homology arm. Tail is
homologous to NucA
SgRNA-HR_R In-Fusion reverse primer for insertion of the right homology arm into
the SgRNA-plasmid
2.6 Bacterial strains and plasmids
All bacterial strains and plasmids used in this study is presented in tables 2.3 and 2.4
respectively.

27
Materials
Table 2.3 – Bacterial strains
Strain Source
Escherichia coli TOP10 Invitrogen
Lactobacillus plantarum WCFS1 (Kleerebezem et al., 2003)
Lactobacillus plantarum WCFS1 ΔLp_2645
K10 (NZ3557)
(Fredriksen et al., 2012)
Lactococcus lactis MG1363 (Wegmann et al., 2007)
Table 2.4 – Plasmids used in this study
Plasmid name
(abbreviation)*
Description Source
EPI300_P5_1261_Ag85B_TB10.4_DC
The EPI300 plasmid containing
the constitutive promoter P5, the
lipoanchor Lp_1261, the
synthetic gene Ag85B-TB10.4
and a dendritic cellbinding peptid
(DC)
GenScript, USA
pJET1.2_P11_1261 The pJET1.2 plasmid containing
the constitutive promoter P11 and
the lipoanchor Lp_1261
GenScript, USA
pLp1261_InvS pSIP401 derivative with the lipo-
anchor Lp_1261 attached to the
gene inv
(Fredriksen et al., 2012)
pLp_3050_Nuc pSIP401 derivative with signal
sequence for secretion
(Lp_3050) attached to the
reporter protein NucA.
(Mathiesen et al., 2009)
pLP_1261-Ag85B-ESAT6
(pAgE6)
pSIP401 derivative for
production of Ag85B-ESAT6
with the Lp_1261 lipo-anchor
signal sequence
(Øverland, 2013)
pELS100 Derivative of pLPV111 shuttle
vector
(Sørvig et al., 2005b)
pCas A vector that contains the gene
Cas9, encoding the double-
https://www.addgene.or
g/62225/

28
Materials
strand digesting endonuclease
Cas9
(Song, X. et al., 2017)
pLCNICK A vector that contains the gene
Cas9D10A, encoding the single-
strand digesting nickase
Cas9D10A
https://www.addgene.or
g/84653/
(Song, X. et al., 2017)
pLp_1261-Ag85B-TB10.4
(p1261AgTB)
pSIP401 derivative for
production of Ag85B-Tb10.4
with the lipo- anchor Lp_1261
signal sequence
This study
pAg85B-TB10.4
(pCytAgTB)
pSIP401 derivative for
intracellular production of
Ag85B-Tb10.4
This study
P5*_Lp1261_Ag85_TB10.4
(pP5*AgTB)
pSIP401 derivative for
production of Ag85B-Tb10.4
with the lipo- anchor Lp_1261
signal sequence and the
constitutive (mutated) promoter
P5
This study
pEV Empty vector. pSIP401
derivative lacking any target
genes
(Fredriksen et al., 2010)
pSIP_403 pSIP401 derivative with a 256
replicon
(Sørvig et al., 2003)
pSIP_411 pSIP401 derivative with a Sh71
replicon
(Sørvig et al., 2005a)
pSIP_411_dCas9_Sh71
(pdCas9Sh71)
pSIP401 derivative with the
Sh71 replicon, and the
catalytically inactive Cas gene
dCas9
Constructed by
G. Mathiesen
pSgRNA_2645
(pSg2645)
SgRNA-plasmid with a base-
pairing sequence that targets the
lp_2645 gene in L. plantarum
Constructed by
G. Mathiesen
pSgRNA_ThyA
(pSgThyA)
SgRNA-plasmid with a base-
pairing sequence that targets the
lp_ThyA gene in L. plantarum
This study

29
Materials
pSIP_403_Cas9 pSIP401 derivative with an
inducible expression of the Cas9-
gene
This study
pSIP_403_Cas9D10A pSIP401 derivative with an
inducible expression of the
CasD10A-gene
This study
pSIP_411_Cas9_Sh71
(pCas9Sh71)
pSIP401 derivative with an
inducible expression of the Cas9-
gene and a Sh71 replicon
This study
pSIP_411_Cas9D10A _Sh71
(pCas9D10ASh71)
pSIP401 derivative with the
CasD10A-gene and a Sh71
replicon
This study
pSgRNA_2645_HL_NucA_HH
(pSg2645Ha)
SgRNA-plasmid with a base-
pairing sequence that targets the
lp_2645 gene. NucA-gene
inserted between sequences
homologous upstream and
downstream of lp_2645 to the
genome of L. plantarum
This study
*Abbreviations will be used in the text
2.7 Kits
Kit Supplier
GenElute® HP Plasmid Midiprep Kit
GenElute® HP MIdiprep Filter Syringes
GenElute® HP Midiprep Binding Columns
Collection tubes, 15 mL conical
Column Preparation solution
RNase A Solution
Resuspension solution
Lysis Solution
Neutralization Solution
Binding Solution
Sigma-Aldrich

30
Materials
Wash Solution 1
Wash Solution 2
Elution Buffer (10 mM Tris-HCL, pH 8,5)
iBlot® Dry Blotting System
iBlot® Gel Transfer Device
Blotting roller
iBlot® Gel Transfer Stack, Regular
iBlot® Cathode stack, Top
iBlot® Anode stack, bottom
iBlot® Disposable sponge
iBlot® Filter Paper
In-Fusion® HD Cloning kit
5X In-Fusion® HD Enzyme Premix
Novex® NuPAGE® SDS-PAGE Gel system
NuPAGE® Novex Bis-Tris gels 8 cm x 8 cm x 1 mm, 10 and 15 wells
NuPAGE® LDS Sample Buffer (4X)
NuPAGE® Reducing agent (10X)
The NucleoSpin® Gel and PCR Clean-up
The NucleoSpin® Gel and PCR Clean-up columns
Collections Tubes, 2 mL
Binding Buffer NTI
Wash Buffer NT3
Elution Buffer NE
NucleoSpin® Plasmid
Buffer A1
Buffer A2
Buffer A3
Buffer A4
Invitrogen
Clontech
Invitrogen
Macherey-Nagel
Macherey-Nagel

31
Materials
Elution Buffer AE
NucleoSpin® Plasmid/Plasmid (NoLid) column
Collection Tubes, 2 mL
Quick Ligation® kit
Quick T4 DNA Ligase
2X Quick Ligation Reaction Buffer
SNAP i.d. ® Protein Detection System
SNAP i.d. ® Single Well Blot Holder
SNAP i.d. ® Spacer
SNAP i.d. ® Blot roller
Filter paper
SuperSignal® West Pico Chemiluminescent Substrate
Luminol/Enhancer
Stable Peroxide Buffer
RNeasy Mini Kit
RNeasy Mini Spin Columns (pink)
Collection Tubes (1.5 ml)
Collection Tubes (2 ml)
Buffer RLT
Buffer RW1
Buffer RPE
RNase-Free Water
NucleoSpin® Microbial DNA
Lysis Buffer MG
Wash Buffer BW
Wash Buffer B5
Elution Buffer BE
Liquid Proteinase K
NEB
Millipore
Thermo Scientific
Qiagen
Macherey-Nagel

32
Materials
NucleoSpin® Bead Tubes Type B
NucleoSpin® Microbial DNA
Columns (light green rings)
Collection Tubes (2 mL)
Q5® Hot Start High-Fidelity 2X Master Mix
Heat&Run gDNA removal kit
10X reaction Buffer
HL-dsDNase
iScript™ Reverse Transcription Supermix
2x QX200 ddPCR EvaGreen Supermix
NEB
ArcticZymes
Bio-Rad
Bio-Rad
2.8 Agars and media
All components and suppliers are listed in section 2.2.
Brain-Heart-Infusion (BHI)
Medium:
37 g BHI dissolved in 1 L dH2O.
Sterilized in a CertoClav at 115 °C for 15 minutes.
Agar:
BHI broth supplemented with 1.5 % (w/v) agar.
After sterilization in a Certoclav, the medium was allowed to cool down to ~60 °C,
before the addition of the appropriate antibiotic. The medium was poured into petri
dishes, and allowed to solidify, before storage at 4°C.

33
Materials
De Man, Rogosa, Sharpe (MRS)
Medium:
52 g MRS broth in 1 L dH2O.
Sterilized in a CertoClav at 115 °C for 15 minutes.
Agar:
MRS broth supplemented with 1.5 % (w/v) agar.
After sterilization in a Certoclav, the medium was allowed to cool down to ~60 °C,
before the addition of appropriate antibiotic. The medium was poured into petri dishes,
and allowed to solidify, before storing them at 4°C
MRSSM medium
5.2 g MRS
17.1 g Sucrose (0.5 M)
2.0 g MgCl2 (0.1 M)
in 100 mL dH2O
Sterile filtrated using a 0.2 μm pore size filter.
GM17
Medium:
37.25 g M17
dH2O to 1 Litre
Sterilized in a CertoClav at 115 °C for 15 minutes.
After sterilization, the medium was cooled to ~60°C before adding 0.5% sterile filtered
glucose.

34
Materials
Agar:
M17 medium with 1.5% (w/v) agar
After sterilization, the medium was cooled to ~60°C before adding appropriate
antibiotics. The medium was poured into petri dishes, and allowed to solidify, before
storing them at 4°C
SGM17 medium
GM17 medium
0.5 M Sucrose (sterile filtered using 0.2 µM pore sized filter)
Super Optimal broth with Catabolite repression (S. O. C.)
Pre-made by the manufacturer of competent cells.
2.9 Buffers and solutions
Phosphate Buffered Saline (PBS)
8 g/l NaCl
0.2 g/l KCl
1.44 g/l Na2HPO4
0.24 g/l KH2PO4
Tris Buffered Saline (TBS)
150 mM NaCl
10 mM Tris-HCl, pH 8
35
Materials
TTBS
TBS
0.1 % (w/v) Tween-20
Tris-acetate/EDTA (TAE) 50X
242 g Tris base
57.1 mL Acetic acid
100 mL 0.5 M EDTA, pH 8
dH2O to 1 L
Tris-Glycine-SDS (TGS) 10X
From manufacturer

36
Methods
3 Methods
3.1 Cultivation of bacteria
Bacteria was cultured in liquid medium or on agar plates and enriched with appropriate
antibiotics for selection.
Escherichia coli was cultured overnight at 37°C in BHI for both liquid medium and agar plates.
Liquid medium was incubated with vigorously shaking. L. plantarum was cultured overnight
in liquid or solid MRS at either 30°C or 37°C without shaking. L. lactis was cultured overnight
in liquid or solid GM17 at 30°C without shaking.
Table 3.1 – The type of antibiotics to be added depended on the plasmid, and the amount
of antibiotics to be added based on type of media.
Antibiotics Solid
medium– E.
coli (µg/ml)
Liquid
medium – E.
coli (µg/ml)
Solid medium
– Lactic acid
bacteria
(µg/ml)
Liquid medium
– Lactic acid
bacteria
(µg/ml)
Erythromycin 200-300 200 5-10 5-10
Chloramphenikol 34 34 5-10 5-10
Ampicillin 100 200 - -
Kanamycin 50-100 100 - -
3.2 Storage of bacteria
For long-term storage of bacteria, glycerol stocks were made and kept at -80°C. The glycerol
prevents disruption of the cells when stored at low temperatures.
Materials
Cultured bacteria in suitable medium
87% (w/v) Glycerol
1.5 mL Cryovial
Procedure

37
Methods
Bacteria was cultured overnight in 10 mL growth medium. 1 mL of the culture was transferred
to a 1.5 mL cryovial. Then 300 µL 87% (w/v) sterile glycerol was added, the tube was inverted
a few times for mixing and kept in a -80°C freezer.
To later cultivate bacteria from a glycerol stock, a toothpick was used to pluck a small amount
of frozen glycerol stock and transferred to a tube containing appropriate growth medium.
3.3 Plasmid isolation from bacteria
For plasmid isolation from bacteria, the NucleoSpin® Plasmid Kit (MACHEREY-NAGEL,
Düren, Germany) were used. Depending on whether the replicon of the plasmid was high- or
low-copy, either the NucleoSpin® Plasmid Kit protocol 5.1 or 5.2 was followed.
Isolation of L. lactis required some additional lysis steps. In the first step of cell lysis, the
bacterial pellet was resuspended in 220 µL buffer A1(from NucleoSpin® Plasmid Kit), 25 µL
of 100 mg/mL lysozyme and 5 µL of 5000 U/mL mutanolysin. The suspension was incubated
at 37°C for 30 minutes, before continuing as described in NucleoSpin® Plasmid Kit protocol.
For a larger volume of plasmid eluate, the GeneJET Plasmid Midiprep Kit (ThermoFisher
Scientific) was used, following the manufacture’s protocol.
3.4 Isolation of microbial DNA
Genomic DNA was isolated from bacterial cultures by using the NucleoSpin® Microbial DNA
Kit (MACHEREY-NAGEL). Isolation was performed by following the manufacturer’s
Standard protocol for gram-positive and gram-negative bacteria.
The cells were lyzed using a FastPrep-24 instrument (MP Biomedicals) at 6.5 m/s2 for 30
seconds. The agitation was repeated three times, with one-minute pause between each run.
3.5 Digestion of DNA with restriction enzymes
Restriction enzymes cleaves double stranded DNA at or near sites of the genome containing a
specific sequence. The restriction enzymes can either cut the two DNA strands at the same
position on each strand, creating blunt ends, or at slightly different positions on each strand to
create overhangs. Digestion of DNA by restriction enzymes is a commonly used method for

38
Methods
preparing DNA fragments for ligation. Each DNA fragment is then double digested, meaning
that two different restriction enzymes are used for excision of the fragment. This creates
compatible ends between the fragments to be ligated. After incubation, the digestion mixtures
are loaded onto an agarose gel for separation using agarose gel electrophoresis of the digested
fragments and further isolation (See 3.7).
Materials
dH2O
10X FastDigest Green Buffer
DNA
FastDigest Enzyme
Procedure
1. The reaction was combined at room temperature in the order indicated as shown in Table
3.2.
Table 3.2 - Restriction enzyme digestion(setup) using FastDigest Restriction enzymes
Component Volume (µL)
dH2O up to 50
10X FastDigest Green Buffer 5
DNA x
RE Enzyme 5
2. The mixture was gently mixed and spun down
3. The reaction was incubated at 37°C for 45 minutes.
4. The mixture was directly loaded into a gel.

39
Methods
3.6 Ligation
Ligation of DNA fragments is normally done using a DNA ligase. The ligase facilitates the
formation of phosphodiester bonds between the 5’- phosphate and 3’ hydroxyl- ends of adjacent
DNA bases. The enzymatic reaction uses ATP and the cofactor Mg+, these components are
supplied in the ligation buffer.
3.6.1 In-Fusion Cloning
In-Fusion HD Cloning Kit was used for cloning of genes into a linearized vector. The enzymes
in this kit recognizes a 15 base pair overhang at each end of the DNA-fragment to be inserted
(Figure 3.1). These 15 base pairs are homolog to the ends of the linearized vector. The
overhangs are inserted by PCR using primers which are specific to the DNA-fragment target
sequence and have a 15 base pair tail. In the first round of PCR, only the gene specific part of
the primer binds (section 3.13).
Figure 3.1. A simplified illustration of the In-Fusion cloning procedure. A linearized vector is generated, and
gene specific primers with a 15 bp overhang with homology to the vector (red and yellow blocks) are designed.
The insert is PCR-amplified with the In-Fusion primers. The reaction mix containing a linearized vector and the
amplified insert is incubated at 50°C for 15 minutes, before being transformed. The illustration is a modified
version from the original taken from the In-Fusion® HD Cloning Kit User Manual.
Materials
5X In-Fusion HD Enzyme Premix
Linearized vector
Purified PCR fragment
dH2O

40
Methods
Procedure
1. The In-Fusion® Molar Calculator (http://bioinfo.clontech.com/infusion/molarRatio.do)
was used to determine the amount of purified PCR product and linearized vector needed
for each reaction. The insert was added in a 2-fold excess to the vector.
2. The components shown in table 3.3 was added to an Eppendorf tube
Table 3.3 – Components used for In-Fusion cloning.
Component Volume (µL)
5X In-Fusion HD Enzyme Premix 2
Linearized vector X
Purified PCR fragment X
dH2O as needed X
Total volume 10
3. The reaction was incubated at 50°C for 15 minutes, and subsequently placed on ice for
2 min.
4. The mixture was either transformed into competent cells or stored at -20°C.
3.6.2 Quick Ligation
The Quick T4 DNA Ligase is an enzyme that can ligate both sticky- and blunt-ends, in 5
minutes.
Materials
dH2O
Vector
Insert
2X Quick Ligation Reaction Buffer

41
Methods
Quick T4 DNA Ligase
Procedure
1. In a 1.5 mL Eppendorf tube, 50 ng of the vector and a 3-fold molar excess of insert was
mixed. The volume was adjusted to 10 µL with dH2O.
2. 10 µL 2X Quick Ligation Reaction Buffer was added and mixed.
3. 1 µL Quick T4 DNA Ligase was added and mixed thoroughly.
4. The tube was briefly centrifugated and incubated at room temperature for 5 minutes.
5. After incubation, the ligation mixture was chilled on ice and transformed within a few
hours, or stored at -20°C.
3.6.3 Ligation with ElectroLigase
For constructs that was transformed directly into an electrocompetent bacteria, the ligation was
performed using ElectroLigase to minimize the concentration of salt.
Materials
dH2O
Insert
Vector
ElectroLigase Reaction Buffer
ElectroLigase
Procedure
1. 20-100 ng of vector was combined with a 3-fold molar excess of insert and the volume
was adjusted with dH2O to 5 µL.

42
Methods
2. 5 µL of ElectroLigase Reaction Buffer and 1 µL of ElectroLigase was added to the
reaction and mixed by pipetting up and down 7-10 times.
3. The ligation reaction was incubated at room temperature (25°C) for 30-60 minutes.
4. Inactivation of the ligase was done by incubating the reaction at 65°C for 15 minutes.
5. The ligation mix was then chilled on ice if transformed within a few hours, or stored at
-20°C.
3.7 Agarose gel electrophoresis
Agarose gel electrophoresis is a method used for separation of DNA fragments based on their
size. Fragments are separated using an electric current that moves the negatively charged DNA
fragments through the agarose gel towards the positive pole. Because the agarose gel contains
pores, smaller fragments will move faster than bigger fragments. Fragments >200 bp was
separated by a 1.2% agarose gel, while fragments <200 bp was separated by a 2% agarose gel.
The fragments were then compared to a DNA ladder with known sizes to determine the size of
the fragments.
Materials
SeaKem® LE Agarose
1 x TAE Buffer
peqGREEN
Loading dye
DNA ladder
Procedure
1. 12 g of SeaKem® LE Agarose was dissolved in 1 L of 1 x TAE buffer to make a 1.2%
Agarose gel.
43
Methods
2. The solution was sterilized in a CertoClav for 15 minutes at 115°C. The 1L stock
solution of 1.2% Agarose gel was kept at 60°C until use.
3. One gel was prepared by taking 60 mL from the 1 L stock solution and adding 2.5 µL
peqGREEN. The mix was poured into a moulding tray with combs.
4. After about 20 minutes the gel had harden, and the combs was removed.
5. The gel was transferred to an electrophoresis chamber and covered with 1 x TAE buffer.
6. Loading dye was added to the samples to be run, and the samples was loaded into wells
in the gel. A ladder was also added in one well.
7. The gel was run at 90V for up to 60 minutes, depending on the fragment sizes.
3.8 Purification of DNA and extraction of DNA fragments from agarose gels
The NucleoSpin® Gel and PCR Clean-up from MACHEREY-NAGEL was used to purify DNA
amplified with PCR and for DNA extraction from agarose gels. The purification and extraction
steps were carried out according to the relevant protocol supplied by the manufacturer.
3.9 Determination of RNA and DNA concentration
The DNA concentration of eluates were determined with a spectrophotometer and a 1 mm
cuvette. 2 µL of the eluate was placed on the cuvette and placed in the BioPhotometer D30. The
spectrophotometer measures absorbance at 260 nm for DNA. RNA concentrations were
determined by using a NanoDrop Spectrophotometer. 1 µL of the RNA sample was placed on
the NanoDrop, and the concentration was measured. The NanoDrop spectrophotometer
measured the absorbance at 230 nm for RNA.
3.10 DNA sequencing of plasmids and PCR fragments
Plasmids or amplified PCR fragments was sequenced by GATC biotech for verification of
relevant sequences. Sequencing of a plasmid required 400 ng template, while sequencing of a
PCR fragment required 100-400 ng template. This was added in an Eppendorf tube and
combined with 25 pmol primer and dH2O to a total volume of 11 µL. Each tube was labelled

44
Methods
with a unique barcode and sent to Eurofins for Sanger sequencing. The returned sequences were
analysed using CLC DNA Main Workbench 7.
3.11 Preparation of electrocompetent Lactobacillus plantarum WCFS1
Bacteria must have the ability to take up free, extracellular genetic material to be able to undergo
transformation. Such a bacterial cell is called competent. Bacterial cells are made artificially
competent either chemically or by electrical pulses. The electrical pulse makes the cell wall
permeable.
Electrocompetent Lactobacillus plantarum cells were grown in MRS medium containing
glycine. The glycine replaces the L-alanine in the cell wall, which makes it more permeable for
uptake of plasmids. The procedure was done in accordance to the protocol described in (Aukrust
et al., 1995).
Materials
L. plantarum
MRS medium
MRS + 1% glycine
30% w/v PEG1450
MRS + 0.5 M Sucrose + 0.1 M MgCl2
Procedure
1. L. plantarum from glycerol stock was cultured overnight in 10 mL MRS at 37°C.
2. 1 mL of the overnight culture was used to make a serial dilution (10-1-10-10) in MRS +
1 % glycine. The cultures were incubated overnight at 37°C.
3. 1 mL of the culture with an OD600 of 2.5 ± 0.5 was further diluted in 20 mL MRS + 1%
glycine. The culture was then grown until it reached the logarithmic phase (OD600 of 0.7
± 0.07) and placed on ice for 10 minutes.

45
Methods
4. The culture was centrifuged at 5000x g for 5-10 minutes at 4°C and the supernatant
discarded.
5. The pellet was resuspended in 5 mL ice cold 30% w/v PEG1450 (freshly made),
additional 20 mL of the PEG1450 was added, before the tube was inverted gently and
placed on ice for 10 minutes.
6. The cells were collected by centrifugation at 5000x g for 5-10 minutes at 4°C.
7. The pellet was resuspended in 400 µL 30% w/v PEG1450 and portions of 40 µL were
pipetted into Eppendorf tubed and immediately frozen at -80°C.
3.12 Transformation
3.12.1 Transformation of Chemically Competent E. coli
Materials
OneShot TOP10 chemically competent cells
Ligation mix
S.O.C media
BHI agar plates with appropriate antibiotic
Procedure
1. One vial for each transformation of OneShot TOP10 chemically competent cells was
thawed on ice.
2. 1-5 µL of the DNA was added into a vial of OneShot TOP10 cells, and gently mixed.
3. The vials were then incubated on ice for 30 minutes.
4. The cells were heat-shocked for 30 seconds at 42°C without shaking.
5. After the heat shock, the cells were placed on ice for 2 minutes.
6. Aseptically, 250 µL pre-warmed S.O.C. medium was added to each of the vials and
placed in 225 rpm shaking-incubator at 37°C for 1 hour.

46
Methods
7. 100 µL of the incubated transformation mix was spread out on BHI agar plates with
appropriate antibiotics and incubated at 37°C overnight.
3.12.2 Transformation of Electrocompetent Competent Cells
Materials
Electrocompetent cells
Plasmid/ligation mix
Appropriate media
GenePulser® Electroporation cuvette 0.2 cm on ice
Bio-Rad GenePulser® II
Bio-Rad Pulse controller plus
Agar plates
Table 3.4 – Settings on the GenePulser, media and incubation conditions vary between
different bacterial strains.
Strain Cuvette
(cm)
Capacitance
(µF)
Volt
(kV)
Resistance
(Ω)
Media Incubation
L. plantarum 0.2 25 1.5 400 950 µL
MRSSM
37°C, 2-4
hours
L. lactis 0.2 25 2.0 200 700 µL
SGM17MC
30°C, 2-4
hours
Procedure
1. Electrocompetent cells was thawed on ice.
2. 5 µL of the plasmid was transferred to each tube with electrocompetent cells.
3. The mixture was transferred to the electroporation cuvette

47
Methods
4. The cuvette was placed in the electroporator and subjected to optimal current (Table
3.4).
5. Immediately after, the appropriate media (Table 3.4) was added to the cuvette, and the
transformed cells were transferred to a sterile Eppendorf tube.
6. The cells were incubated at the appropriate temperature without shaking for 2-4 hours
7. After incubation, 100 µL of the cells were spread out on either MRS or GM17 agar plate
with appropriate antibiotics and incubated overnight.
3.13 Polymerase Chain Reaction
The polymerase chain reaction (PCR) is a method used for in vitro amplification of a specific
DNA fragment. PCR relies on thermocycling. Double stranded DNA is heated to 94-98°C,
which causes the strands to separate. When the strands are separated, they can be used as
template for synthesis of a new strand. When the temperature is lowered, specific
oligonucleotides (primers) bind to the single stranded target DNA sequence and serve as
primers for the DNA polymerase which extends the strands by incorporating deoxynucleotides
(dNTPs) from the solution. This cycle of heating, annealing and extension is repeated in a
thermal cycling device, leading to an exponential increase in the number of synthesized
fragments.
3.13.1 PCR using Q5® Hot Start High-Fidelity 2x Master Mix
1. The PCR reactions was carried out as suggested by the manufacturer of the Q5® Hot Start
High-Fidelity 2x Master Mix. The Master Mix contains dNTPs, Mg++ and proprietary
broad use buffer. In the order indicated by table 3.5, the reactants were mixed in a sterile
0.2 mL PCR tube
Table 3.5 – Q5 PCR components
Components Volume (µL) Final concentration
dH2O Up to 50 -
10 µM Forward primer 2.5 0.5 µM
10 µM Reverse primer 2.5 0.5 µM
Template variable <1 µg
Q5® Hot Start High-Fidelity 2x Master Mix 25 1X

48
Methods
2. The reactions were placed in a thermal cycler, and the cycling program showed in table
3.6 was applied
Table 3.6 – Q5 Cycling program
Step Temperature (°C) Time Cycles
Initial denaturation 98 30 seconds 1
Denaturing 98 10 seconds 25-35
Annealing 50-72* 30 seconds 25-35
Elongation 72 20-30 sec/kb 25-35
Fina elongation 72 2 minutes 1
*The annealing temperature is dependent on the primers.
3.13.2 PCR with VWR Red Taq Polymerase Master Mix
The Red Taq DNA polymerase was normally used to check if colonies harboured the desired
plasmids. Colonies were transferred directly from agar plates to a PCR tube with a toothpick.
Colonies of gram-positive bacteria was microwaved for 1 minute on full effect to ensure lysis,
before adding the other components.
1. The PCR reactions was carried out as suggested by the manufacturer of the Red Taq DNA
Polymerase 2x Master Mix (VWR). In the order indicated by table 3.7, the reactants were
mixed in a sterile 0.2 mL PCR tube
Table 3.7 – Taq PCR components
Components Volume (µL) Final concentration
dH2O Up to 50 -
10 µM Forward primer 1 0.2 µM
10 µM Reverse primer 1 0.2 µM
Template variable <1000 ng
Red Taq DNA Polymerase 2x Master Mix 25 1X
2. The reactions were placed in a thermal cycler, and the cycling program showed in table
3.8 was applied

49
Methods
Table 3.8 – Red Taq Polymerase Cycling program
Step Temperature (°C) Time Cycles
Initial denaturation 95 2 minutes 1
Denaturing 95 10 seconds 25-35
Annealing 50-65* 30 seconds 25-35
Elongation 72 30 sec/kb 25-35
Fina elongation 72 5 minutes 1
*The annealing temperature is dependent on the primers.
3.14 Preparation of samples for analysis of gene products in L. plantarum
Genes expressed by the inducible system pSIP are under the control of SppIP promoter, which
requires the presence of an inducer peptide, SppIP to initiate expression. To analyse the
production of the target genes in L. plantarum harbouring different plasmids, the expression
was induced by addition of the inducer peptide. Induced bacteria were harvested, and the
products were investigated through Western blot analysis. Flow cytometry and confocal laser
scanning microscopy was used to determine the localization of the target proteins. Droplet
digital PCR was used to perform transcriptional analysis. Bacteria harbouring non-pSIP vectors
was harvested equally to bacteria harbouring pSIP vectors.
3.14.1 Cultivation and harvesting of bacteria
Materials
MRS medium
Inducing peptide SppIP
Antibiotics
Procedure
1. L. plantarum strains were grown at 37°C overnight in MRS medium containing
appropriate antibiotics.

50
Methods
2. The overnight cultures were diluted in 10 mL prewarmed MRS medium to an OD600 of
0.13-0.15.
3. The culture was incubated at 37°C until it reached an OD600 of 0.3. and the gene
expression was induced with SppIP (25 ng/mL).
4. The induced cells were further incubated for 2 hours, and harvested by centrifugation at
5000x g for 10 minutes at 4°C.
3.14.2 Harvesting of bacterial cells for transcriptional analysis with ddPCR and
Bacterial cells were harvested for isolation of RNA in a similar way as described in section
3.14.1 However, From the overnight culture, only 50 µL was transferred to 10 mL prewarmed
MRS, to achieve an OD600 ~0.01, and immediately induced. The bacteria were harvested at
OD600 = 0.4.
3.15 Gel electrophoresis of proteins
The technique Sodium dodecyl sulphate-polyacrylamide gel electrophoresis (SDS-page)
separates denatured proteins according to mass. Due to the availability of precast gels and
automated gel imaging, the SDS-page is a rapid and safe method for visualization and analysis
of protein samples.
Addition of the anionic detergent lithium dodecyl sulphate (LDS) leads to breakage of non-
covalent bindings, while addition of the reducing agent dithiothreitol (DTT) causes disulphide
bridges to break. The denaturation of the proteins gives the proteins a uniform negative charge
which is used to separate the proteins in a stain-free polyacrylamide gel, according to molecular
weight.
By applying an electric current to the gel, the negatively charged proteins will migrate towards
the anode, analogue to DNA gel electrophoresis. The pore structure of the SDS-page gel leads
to more rapid migration of proteins with lower molecular weight (kDa) than heavier proteins,
allowing effective separation of proteins. The molecular weight of the proteins is determined
using a protein standard.
Materials

51
Methods
Mini-PROTEAN® TGX Stain-Free™ Precast Gels
NuPAGE® LDS Sample Buffer (4X)
NuPAGE® Reducing agent (10X)
TGS Buffer (Section 2.9)
Benchmark™ Protein Ladder
MagicMark™ XP Western Protein Standard
Procedure
1. A 2X working solution was prepared by mixing NuPAGE® LDS Sample Buffer (4X)
and NuPAGE® Reducing agent (10X)
2. Protein solution and working solution were mixed 1:1 and boiled for 10 minutes.
3. The Mini-PROTEAN® TGX Stain-Free™ Precast Gel was assembled in the
electrophoresis chamber, and TGS buffer was added.
4. The boiled samples and ladders were applied to the gel, and the gel was run at 280 V
for 18 minutes.
5. After electrophoresis, the gel was placed briefly in dH2O before further analysis.
3.16 Western blotting analysis
Western blot analysis is a method for detection of proteins using antibody hybridisation.
Proteins are first separated by SDS-PAGE gel electrophorese (section 3.15), before the proteins
in the gel are blotted to a nitrocellulose membrane using electroblotting. Prior to the antibody
hybridisation, the membrane is treated with a blocking solution, containing bovine serum
albumin (BSA) which binds and block potential sites for nonspecific interactions of the
antibody. The primary antibody binds specifically to epitopes on the protein of interest. After
incubation, excess of primary antibody is washed away, before a new incubation with the
secondary antibody. The secondary antibody binds to the primary antibody. The secondary
antibody is conjugated with a reporter enzyme that gives a detectable fluorescent signal when
appropriate substrate is added. The secondary antibody is conjugated with the enzyme horse
radish peroxidase (HRP) which oxidizes luminol. The oxidation releases a detectable light,
which leads to visualisation of the protein of interest, if present.

52
Methods
3.16.1 Blotting with the iBlot™ Dry Blot System
Proteins were blotted from the SDS-page gel to the nitrocellulosemembrane using the iBlot™
Dry Blot System. The components necessary for performing the transfer was arranged as shown
in figure 3.2.
Figure 3.2. Assembly of the components of the iBlot™ Dry Blot System. The bottom part consists of a copper
anode, one layer of the buffer gel and the nitrocellulose membrane. On top of the nitrocellulose membrane is the
polyacrylamide gel with the proteins covered with a wet filter paper (not shown). The top part consists of another
layer of the buffer gel and a copper cathode. The figure is taken from the iBlot® Dry Blotting system manual.
Materials
iBlot™ Dry Blotting system (section 2.7)
TBS, pH 7.4
Procedure
1. The SDS-page gel was washed for 5 minutes in dH2O.
2. The anode stack (Figure 3.2), containing the nitrocellulose membrane, was placed in the
gel transfer device and the gel was placed on top of the membrane. Air bubbles trapped
between the gel and membrane was removed by using a blotting roller.
3. A filter paper wetted in dH2O was placed on top of the gel.
4. The cathode stack (Figure 3.2) was placed on top of the filter paper, with the copper
electrode side facing up.
5. A disposable sponge was placed in the lid of the transfer device before closing the lid.
53
Methods
6. The blotting was carried out at 20 V for 7 minutes.
7. After the blotting, the membrane was placed in TBS before antibody hybridisation.
3.16.2 SNAP i.d.® immunodetection
The SNAP i.d.® immunodetection system is a fast and easy method for hybridization of
antibodies to proteins on a membrane. The membrane is placed in a blot holder, that is placed
on top of the SNAP i.d.® immunodetection device, which utilizes vacuum to pull the reagents
through the membrane, which is faster than more traditional hybridization methods.
Materials
SNAP i.d.® Protein detection system (section 2.7)
TTBS
TTBS/ 0.5% BSA (blocking solution)
Primary antibody Ag85 (1 mg/mL)
Secondary antibody HRP-Goat Anti-Rabbit IgG (1 mg/mL)
Procedure
1. The blot holder was wetted with dH2O before the blotted membrane was placed in the
middle of the blot holder with the protein side facing down.
2. A wetted filter paper was placed on top of the membrane and the blot holder was closed.
In case of air bubbles, a blotting roller was used to remove them.
3. The blot holder was placed in the SNAP i.d.® Protein detection system device.
4. 30 mL of the blocking solution was poured on to blot holder, and the vacuum was turned
on until all the solution had moved through the membrane.
5. 3 mL of TTBS/ 0.5% BSA with 2 µg/mL primary antibody was added to the membrane
and incubated for 10 minutes.
6. The membrane was washed three times with TTBS, with the vacuum continuously
running. The vacuum was turned off after the last wash.

54
Methods
7. 3 mL of TTBS/0.5 % BSA with 0.4 µg/mL secondary antibody was added and incubated
for 10 minutes.
8. Step 6 was repeated.
9. The membrane was removed from the blot holder for incubation with an appropriate
detection agent.
3.16.3 Chemiluminescent detection of proteins
Materials
SuperSignal® West Pico PLUS Chemiluminescent Substrate
Luminol/Ehancer
Stable peroxide buffer
Procedure
1. The substrate working solution was made by mixing 10 mL Luminol/Enhancer with 10
mL Stable Peroxide Buffer.
2. The membrane was incubated with the substrate working solution for 5 minutes in the
dark.
3. Azure c400 was used for visualisation of the membrane. Pictures of the membrane was
also captured with the same instrument.
3.17 Detection of antigens localized on the surface of L. plantarum
One commonly used method for detection of surface localized proteins is the use of antibodies
conjugated with different fluorochromes. In this kind of method, the primary antibody binds to
a specific protein, while the secondary antibody binds to the primary antibody. In this study the
secondary antibody is attached to the fluorochrome Fluorescein Isothiocyanate (FITC). The
fluorochrome FITC emits light when excited by a laser beam. Through analysing FITC-stained
bacterial cells with flow cytometry or confocal laser scanning microscopy, surface localized
proteins can be visualised.

55
Methods
3.17.1 Flow cytometry
In flow cytometry, cells are detected by passing a laser beam one by one. Detectors register
forward scatter (FSC) and side scatter (SSC) as respectively cell size and the granularity of the
cell. Cells with antigens localized on the surface will be detected when the laser beam hits the
FITC conjugated molecule, which causes excitation of light, and registration of a fluorescent
signal. Based on these data, cell populations can be compared. Detection of antigens localized
on the surface a bacterial cell by confocal laser scanning microscopy follows the same
principles as flow cytometry.
3.17.2 Cell staining with FITC for flow cytometry and confocal laser scanning
microscopy
Materials
PBS
PBS + 2% BSA
Primary antibody (Anti Ag85)
Secondary antibody Anti-Rabbit IgG-FITC
Procedure
1. Recombinant L. plantarum was cultivated and induced as described in section 3.14.1
2. The cells were harvested three hours after induction and centrifuged at 5000x g at 4°C
for 5 minutes. The supernatant was discarded.
3. The cells were resuspended in 1 mL cold PBS, and centrifuged at 5000x g at 4°C. The
supernatant was discarded, and the washing step was repeated one more time.
4. The cells were then resuspended in 50 µL PBS + 2 % BSA with 5 µL of the primary
antibody. The suspension was incubated at room temperature for 30 minutes.
5. After incubation, excess antibody was removed by centrifugation at 5000x g for 1
minute.

56
Methods
6. The cells were washed with 600 µL PBS + 2 % BSA and centrifuged at 5000x g for 2
minutes. This step was repeated three times. The supernatant was discarded.
7. An extra centrifugation at 5000x g for 1 minute was performed after the last wash to
remove all the supernatant.
8. The cells were the resuspended in 50 µL PBS + 2 % BSA with 0.8 µL secondary
antibody. The sample was incubated for 30 minutes at room temperature in the dark.
9. Steps 5-7 was repeated. Step 6 was repeated four times.
10. The cells were resuspended in 100 µL PBS and immediately analysed by MacsQuant®
Analyser and MacsQuantify™ software.
3.18 Confocal laser scanning microscopy
All microscopy analyses were performed on a Zeiss LSM 700 Confocal Microscope by using
Zen software.
3.18.1 Cell staining with DAPI and Nile-Red
To do morphological analyses of L. plantarum strains, bacterial cultures were stained with
DAPI and Nile-Red. The fluorescent stain DAPI (4,6-diamidino-2-phenylindole) can penetrate
the cell membrane and bind strongly to thymidine-adenine rich regions in the DNA. Nile-Red
is a lipophilic stain, which binds to the cell membrane. Nile-Red is highly fluorescent in lipid-
rich environments.
Materials
0.1 mg/mL Nile-Red
0.1 mg/mL DAPI
Bacterial culture
Procedure
1. In an Eppendorf tube, 80 µL of the bacterial culture with an OD600 = 0.4 was combined
with 0.5 µL DAPI and 0.5 µL Nile-Red, and gently mixed.
2. The solution was kept in the dark until analysis.

57
Methods
3.19 Preparation of samples for transcriptional analyses
To perform transcriptional analyses on samples harvested as described in section 3.14.2, the
total RNA from the samples had to be isolated. To further purify the isolated RNA, the RNA-
samples were treated with DNase to remove residual genomic DNA (gDNA), as the
transcriptional analyses would be affected by gDNA in the samples. Due to the highly unstable
nature of RNA, it is often reverse transcribed into complementary DNA (cDNA) by reverse
transcriptase before further analyses.
3.19.1 Isolation of RNA
Before harvesting, 5 mL of RNAprotect Bacteria was added in a 50 mL, to ensure immediate
stabilization of RNA in the bacterial samples. 5 mL of the bacterial culture was combined with
the 5 mL of RNAprotect Bacteria. The solution was vortexed for 5 s and incubated for 5 minutes
at room temperature. The cells were then harvested by centrifugation at 5000x g for 10 minutes
at room temperature.
RNA was isolated from the harvested cultures using the RNeasy Mini Kit following the
manufacturer’s protocols for “Mechanical Disruption of Bacteria” and “Purification of Total
RNA from Bacterial Lysate Using the RNeasy Mini Kit”.
3.19.2 Treatment with DNase for removal of genomic DNA
Residual genomic DNA (gDNA) of the isolated RNA samples affects quantification of RNA in
downstream analyses. To further purify the RNA-samples, the Heat&Run gDNA (section 2.7)
removal kit were utilized.
Materials
10x Rxn Buffer
HL-dsDNase
RNA
Procedure
1. 8-50 µL of the RNA sample was transferred to an empty Eppendorf tube on ice.
2. 1 µL of 10x Rxn Buffer was added for each 10 µL of RNA-sample added.

58
Methods
3. Subsequently, 1 µL HL-dsDNase was added. The suspension was gently mixed.
4. The mixture was then incubated at 37°C for 10 minutes, then at 58°C for 5 minutes for
deactivation of the enzyme.
The RNA concentration of the samples was measured after this step, as described in section
3.9, before proceeding to reverse transcription.
3.19.3 Reverse transcription
Reverse transcription was performed with the iScript™ Reverse Transcription Supermix for
RT-qPCR. The Supermix contains all necessary components (RNase H+ Moloney murine
leukemia virus reverse transcriptase, RNase inhibitor, dNTPs, oligo(dT), random primers,
buffer, MgCl2 and stabilizers), except the template RNA. To control gDNA levels in the RNA-
samples, negative controls were made by adding the iScript No-RT Control Supermix instead
of the iScript RT Supermix.
Table 3.9 – Reaction set up for reverse transcription of RNA to cDNA
Component Volume per Reaction (µL)
iScript RT Supermix
4
RNA template
Variable
Nuclease free water To 20
Components were assembled in a 0.2 mL PCR tube on ice, mixed and placed in a thermal
cycler.
Table 3.10 – Reaction protocol for synthesis of RNA to cDNA
Step Temperature (°C) Time (min)
Priming 25 5
Reverse transcription 46 20
RT inactivation 95 1

59
Methods
The resulting cDNA samples was either used right away in downstream analyses, or stored at
-20°C until further use.
3.20 Droplet digital PCR
Droplet digital PCR (ddPCR) is a method for calculation of absolute concentration of RNA, by
using gene specific primers. ddPCR is a digital PCR method using end-point analysis to
calculate the absolute concentration of a given sample. In ddPCR, the target molecules of a
sample are randomly fractioned into 20,000 droplets, resulting in some droplets containing the
template and other droplets lacking the template. In a droplet generator device, the original
sample containing target molecules, primers and PCR reaction mix is mixed with droplet
generator oil. The droplet generator vacuums both the sample and the oil through a tube. Due
to the hydrophobic properties of oil, the sample will disperse when mixed with the sample,
resulting in equally nanolitre-sized droplets. Subsequently, the template in the droplets are
amplified by qualitative PCR containing a DNA dye, such as the non-specific dsDNA-binding
dye EvaGreen. Following amplification, droplets containing a template molecule binds to the
dsDNA-binding dye in the PCR reaction mix and each sample is analysed by a droplet reader.
The total number of droplets in the sample are counted, as well as the number of droplets
containing template based on fluorophore readings (positive droplets).
Unlike other quantitative PCR methods, such as Real-Time PCR (RT PCR), ddPCR does not
require a standard curve to calculate the concentrations of the samples. In ddPCR, the
concentration is calculated by the statistical Poission model. The Poission model utilizes the
number of positive droplets containing one or more template fragments and calculates the
absolute concentration of the fragments in the sample.
Figure 3.3. Droplet digital PCR is a method based on water-oil emulsion droplet technology. In the droplet
generator, the sample is divided into 20,000 equally small droplets by exploiting water-in-oil traits. This leads to
a random partitioning of target DNA in the droplets. Instead of one PCR-reaction, there will be as many individual
PCR-reactions as there are droplets.
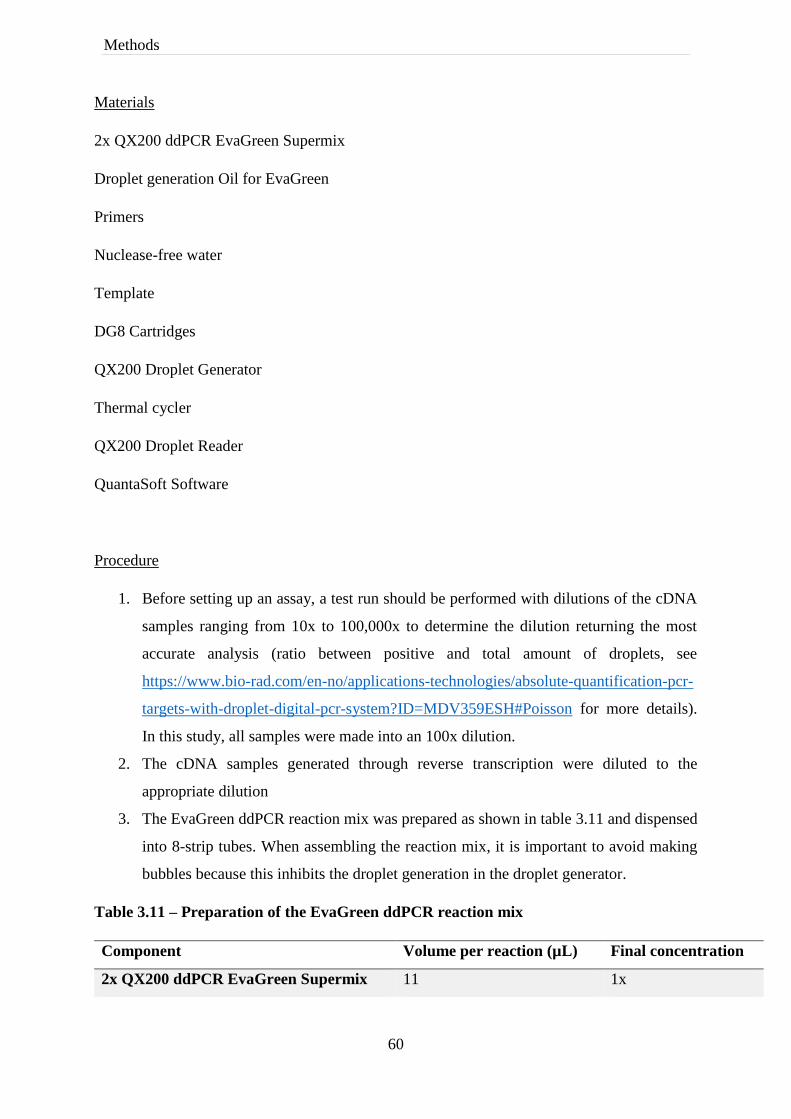
60
Methods
Materials
2x QX200 ddPCR EvaGreen Supermix
Droplet generation Oil for EvaGreen
Primers
Nuclease-free water
Template
DG8 Cartridges
QX200 Droplet Generator
Thermal cycler
QX200 Droplet Reader
QuantaSoft Software
Procedure
1. Before setting up an assay, a test run should be performed with dilutions of the cDNA
samples ranging from 10x to 100,000x to determine the dilution returning the most
accurate analysis (ratio between positive and total amount of droplets, see
https://www.bio-rad.com/en-no/applications-technologies/absolute-quantification-pcr-
targets-with-droplet-digital-pcr-system?ID=MDV359ESH#Poisson for more details).
In this study, all samples were made into an 100x dilution.
2. The cDNA samples generated through reverse transcription were diluted to the
appropriate dilution
3. The EvaGreen ddPCR reaction mix was prepared as shown in table 3.11 and dispensed
into 8-strip tubes. When assembling the reaction mix, it is important to avoid making
bubbles because this inhibits the droplet generation in the droplet generator.
Table 3.11 – Preparation of the EvaGreen ddPCR reaction mix
Component Volume per reaction (µL) Final concentration
2x QX200 ddPCR EvaGreen Supermix 11 1x

61
Methods
2 µM Forward primer 1 100 nM
2 µM Reverse primer 1 100 nM
RNase/DNase-free water 7 -
cDNA template 2 Up to 100 ng
4. To the 20 µL reaction mix, 2 µL of the cDNA template was added.
5. 20 µL of each reaction was loaded into a sample well of the DG8™ Cartridge, followed
by 70 µL of QX200 Droplet generation Oil for EvaGreen into the oil wells.
6. When the DG8™ Cartridge was placed into the QX200 Droplet Generator, and the
instrument was closed, the droplet generation started.
7. After completion of droplet generation, 40 µL of the droplet-suspension was transferred
to a 96-well PCR plate.
8. The all samples were transferred to the PCR plate, it was sealed with foil by the PX1
plate sealer.
9. The sealed 96-well plate was loaded into a standard thermocycler, and the PCR was
carried out by the program shown in table 3.12.
Table 3.12 – Cycling program for 2x QX200 ddPCR EvaGreen Supermix
Step Temperature (°C) Time Cycles
Enzyme activation 95 5 min 1
Denaturation 95 30 sec 40
Annealing/extension 60 1 min 40
Signal stabilization 4 5 min 1
90 5 min 1
Hold 4 Infinite 1
10. Upon completion of the PCR, the 96-well plate was loaded into the QX200 Droplet
Reader for analysis of the droplets.
11. Results were analysed using the QuantaSoft Software.
12. The QuantaSoft Software reports the concentration as Copies/ 20 µL well. Copies refers
to the target molecule. In the present study, 2 µL were used as template for the PCR
reaction. The Copies/ 20 µL value is therefore divided by two obtain Copies/µL.
Copies/µL is then multiplied by the dilution factor, which in the present study was 100x.

62
Methods
As 100 ng RNA was revers transcribed into cDNA, the template of this analysis, the
final formula for calculating Copies/ng RNA is:
(𝐶𝑜𝑝𝑖𝑒𝑠∗µL−1)∗𝑑𝑖𝑙𝑢𝑡𝑖𝑜𝑛 𝑓𝑎𝑐𝑡𝑜𝑟
𝐴𝑚𝑜𝑢𝑛𝑡 𝑜𝑓 𝑅𝑁𝐴 𝑖𝑛 𝑟𝑒𝑣𝑒𝑟𝑠 𝑡𝑟𝑎𝑛𝑠𝑐𝑟𝑖𝑝𝑡𝑖𝑜𝑛 (𝑛𝑔)=
(𝐶𝑜𝑝𝑖𝑒𝑠∗µL−1)∗100
100=Copies/ng RNA

63
Results
4 Results
The antigen used in the present study is Ag85B_TB10.4_DC, a fusion protein of the two
Mycobacterium tuberculosis derived antigens Ag85B and TB10.4. As described in section 1.6,
the antigens, both individually and fused together, have shown promising immune response.
Vectors have previously been constructed for production and anchoring of another hybrid
antigen, Ag85B_ESAT-6, which have shown to induce antigen specific immune responses in
mice after nasal and oral immunization (Kuczkowska et al., 2016). The novel antigen
combination Ag85B_TB10.4_DC (AgTB) has not previously been expressed in L. plantarum.
Therefore, the first step in developing a new recombinant strain was to construct vectors for
production of AgTB analogous to the Ag85B_ESAT-6 vectors, to have the ability to compare
the production of AgTB with the already characterized AgESAT-6.
The present study is a part of a project where the long-term goal is to develop a new vaccine
against M. tuberculosis, hence potential safety issues must be addressed. Plasmid-based
production of tuberculosis antigens in L. plantarum have been successful. However, plasmids
carry other heterologous genes in addition to the antigen is disadvantageous in regard to
horizontal gene transfer. It is therefore desirable that the bacteria as delivery vectors contains
as few heterologous genes as possible. By moving onward from plasmid-based production of
antigens, to integration of only the antigen expression system in the bacteria’s genome, the
number of heterologous genes would decrease. Current plasmid-based antigen production is
controlled by the pSIP expression system. As the pSIP expression system is dependent on two
regulatory genes (see section 1.3.1), integration of the system would be complicated. An
alternative to overcome this issue is the utilization of a constitutive expression system for
antigen production, as it is not dependent on neither helper genes nor additives for activation
(see section 1.3.2). To mediate integration of antigen production into the genome of L.
plantarum, a gene editing tool such as the CRISPR/Cas9 system can be exploited.
Initially, the goal of the present study was to construct a total of four vectors for expression of
AgTB. To obtain the four new vectors, the pSIP-vector pLp1261_InvS (Fredriksen et al., 2012)
was utilized as the backbone starting point. Construction of the two constitutive vectors were
meant to be performed by replacing the original inducible promoter PSppA in the pSIP-vector by
the constitutive promoters P5 and P11, respectively. The last two vectors expressed AgTB
through the inducible system of the pSIP vector, where one vector surface displayed the

64
Results
antigens through the lipoprotein anchor derived from the L. plantarum gene; Lp_1261, and the
second with intracellular localization of the antigen.
The AgTB gene was codon optimized for expression in L. plantarum to facilitate efficient gene
expression and ordered from GenScript, as the full-length sequence of
P5_Lp1261_Ag85B_TB10.4_DC (Table 2.4), that consist of the P5 promotor upstream of the
lipo-anchor Lp_1261, which was translationally fused to the Ag85B_TB10.4_DC sequence.
GenScript cloned the fragment into a plasmid called EPI300. EPI300 is a low copy vector, that
was utilized because GenScript had problems cloning the sequence in the normally used high
copy pUC57 plasmid. In addition, the promoter P11 was ordered from GenScript translationally
fused to the lipoprotein Lp_1261. The P11_Lp1261 sequence was delivered in the cloning
vector pJET1.2 (Table 2.4).
4.1 Construction of the inducible vectors
The first step in construction of the inducible vectors were to isolate the EPI300 plasmid
containing the P5_Lp1261_Ag85B_TB10.4 sequence from the E. coli culture. The
concentration of the plasmid after isolation was low, because the EPI300 was a low copy
plasmid. Therefore, the fragment P5_Lp1261_Ag85B_TB10.4 was amplified using PCR, to
achieve a high concentration of the target sequence Ag85B_TB10.4. For construction of
p1261AgTB (Table 2.4), primers TB10.4F and TB10.4R (Table 2.1) were used to amplify the
P5_Lp1261_Ag85B_TB10.4. The PCR reaction was run on agarose gel and the PCR product
was cut out from the gel and purified. The PCR amplified P5_Lp1261_Ag85B_TB10.4
fragment was digested with SalI and Acc65I to remove the P5 promoter and the lipo-anchor,
and the remaining AgTB fragment was ligated into SalI/Acc65I digested pLp1261_InvS (Tab
2.4), yielding p1261AgTB (Figure 4.1).

65
Results
Figure 4.1. Strategy for construction of the vector p1261AgTB. The antigen was first amplified by PCR with
primers TB10.4F and TB10.4R. Subesquently, the purified PCR product and the pLp1261_InvS vector were both
digested with the restriction enzymes SalI and Acc65I. The digested fragments were then ligated, yielding the
vector p1261AgTB.
To construct the plasmid for inducible cytoplasmic expression of AgTB, the sequence
P5_Lp1261_Ag85B_TB10.4 from the EPI300 plasmid served as a template for amplification
of Ag85B_TB10.4 with In-Fusion primers NdeISIP_F and TB10.4R (Table 2.1). The vector
pLp1261_InvS was digested with the restriction enzymes NdeI and Acc65I. In-Fusion cloning
(see section 3.6.1 for details) was utilized to insert the PCR-fragment into the digested
pLp1261_InvS vector to obtain the vector pCytAgTB (Figure 4.2).

66
Results
Figure 4.2. Strategy for construction of the vector pCytAgTB. The antigen was first amplified by PCR with
primers NdeISIP_F and TB10.4R. Then, the pLp1261_InvS vector was digested with the restriction enzymes NdeI
and Acc65I. The inducible vector pCytAgTB was obtained through In-Fusion ligation of the fragments.
Subsequently, the constructed p1261AgTB and pCytAgTB were transformed into OneShot®
TOP10 chemically competent E. coli cells. Correct clones were first verified by colony PCR,
and subsequently all PCR amplified parts of the constructed plasmids were verified by DNA
sequencing (data not shown), before transformation into L. plantarum. The inducible antigen
vectors p1261AgTB and pCytAgTB were both successfully constructed at the first attempt.
4.2 Construction of the constitutive vectors
As one of the goals of this study was to constitutively express the fusion protein AgTB, two
promoters from the synthetic constitutive promoter library constructed by Rud et al. (2006) was
chosen. One weak and one strong promoter, P5 and P11, respectively.
Several strategies were attempted for constructing the vectors with constitutive production of
AgTB. An overview of the strategies that were tested are given in table 4.1 and 4.2. The plasmid
map of pP5AgTB and pP11AgTB can be seen in figure A-1 of the Appendix.
Table 4.1 – Different cloning strategies utilized for construction of the constitutive vector
pP11AgTB.
5’ Cut EcoRI31 Bsu15I BglII EcoRI31 Bsu15I Bsu15I
3’ Cut SalI SalI SalI SalI SalI SalI

67
Results
Ligation
method
T4 quick
ligase
T4 quick
ligase
T4 ligase -
overnight
T4 ligase -
overnight
T4 ligase -
overnight
T4 quick
ligase
Incubation
temperature
Room
temperature
Room
temperature
16°C 16°C 16°C Room
temperature
None of the strategies attempted for the P11 constructs resulted in successful cloning, although
colonies always appeared on the agar plates after transformation to E. coli. Although fewer than
on the positive plates, colonies did also appear on the negative control plates, indicating some
relegation of the vector backbone, which was confirmed by colony PCR.
Table 4.2 – Different cloning strategies utilized for construction of the constitutive vector
pP5AgTB.
5’ Cut SalI Bsu15I Bsu15I Bsu15I BglII Eco31I*
3’ Cut Acc65I Acc65I Acc65I Acc65I SalI EcoRI*
Ligation
method
T4 quick
ligase
In-Fusion T4 ligase –
overnight
ElectroLigase T4 ligase –
overnight
T4 ligase –
overnight*
Incubation
temperature
Room
temperature
50°C 16°C Room
temperature
16°C 16°C*
*One colony gave correct size
As for the P11 constructs, the P5 constructs some colonies appeared on the agar plates, but most
of them showed to be relegated vector. However, after several attempts with different strategies,
finally when using Eco31I and EcoRI for digestion and overnight ligation with T4 ligase, 1
colony out of 15 tested on a plate gave correct fragment size after colony PCR.
After verification by colony PCR, the colony was sent for sequencing. The results from
sequencing revealed that the colony had a mutation in the -35 box of the promoter. The mutant
colony had substituted a Guanine with an Adenine compared to the original sequence of the P5
promoter and the consensus sequence that was compiled for the synthetic library (Figure 4.3).

68
Results
Figure 4.3. Mutation of the P5 promoter in the colony-PCR verified colony. As illustrated by the figure, there
is a deviation in the -35 box of the mutant promoter compared to the original P5 and consensus sequence from the
synthetic promoter library constructed by Rud et al. (2006). R= A or G, W= A or T, D= A, G or T, N= A, G, C or
T.
4.2.1 Trouble shooting of construction of the constitutive expression
Due to a promoter mutation in the only correct colony after several attempts to construct a
constitutive vector, some measures were taken to overcome the putatively toxicity of
constitutive expression of AgTB in E. coli. It could be that the constitutive promoter is
functional in E. coli and AgTB is produced, this might explain the toxicity.
The number of low copy plasmids in a cell is usually around 1-10 copies (Baldridge et al.,
2010), while the number of high copy plasmids can be over 1000 copies (Jones et al., 2000). If
the constitutive promoters P5 and P11 are functional in E. coli, and the antigen is toxic to the
cell, a reduced copy number of plasmids might decrease the toxicity in E. coli. Therefore, one
strategy was to replace the high copy pSIP-vector with the low copy pELS100-vector (Sørvig
et al., 2005b) (Table 2.4) (Figure 4.4). In an attempt to insert the P5_Lp1261_Ag85B_TB10.4
fragment into pELS100, the restriction site of NotI was implemented to the insert through PCR.
The insert and low copy vector were both digested with NotI and HindIII and ligated with T4
Quick ligase.
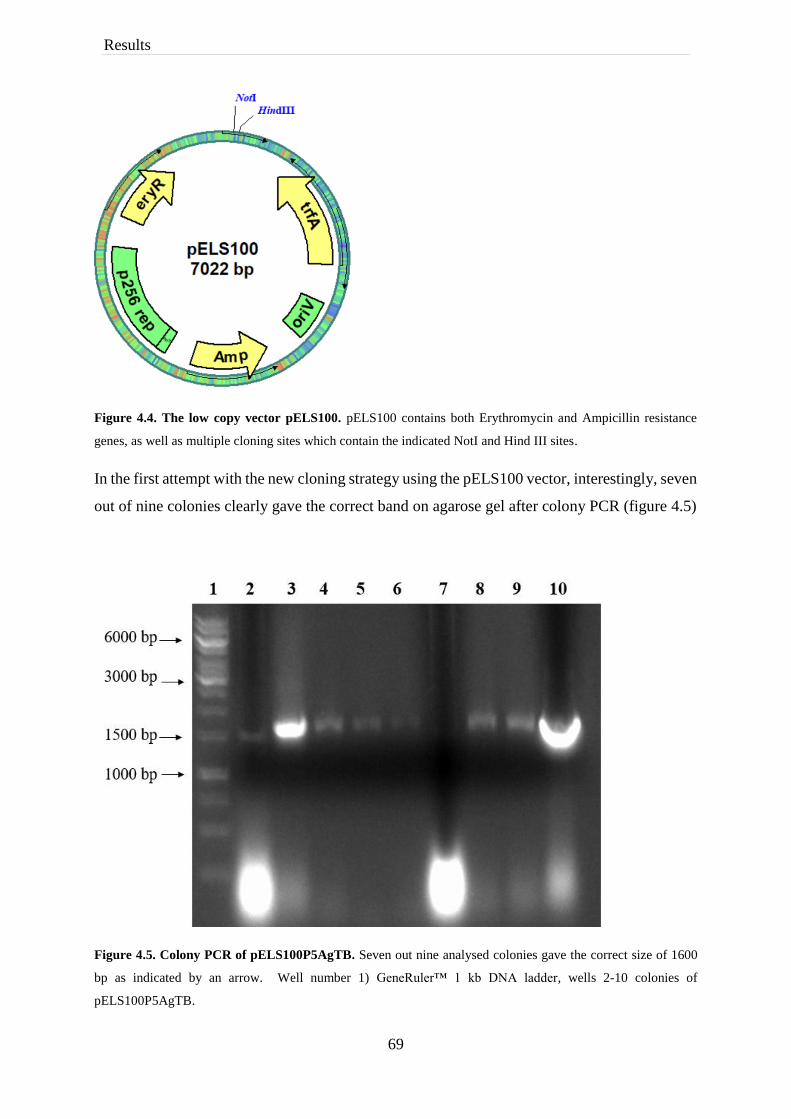
69
Results
Figure 4.4. The low copy vector pELS100. pELS100 contains both Erythromycin and Ampicillin resistance
genes, as well as multiple cloning sites which contain the indicated NotI and Hind III sites.
In the first attempt with the new cloning strategy using the pELS100 vector, interestingly, seven
out of nine colonies clearly gave the correct band on agarose gel after colony PCR (figure 4.5)
Figure 4.5. Colony PCR of pELS100P5AgTB. Seven out nine analysed colonies gave the correct size of 1600
bp as indicated by an arrow. Well number 1) GeneRuler™ 1 kb DNA ladder, wells 2-10 colonies of
pELS100P5AgTB.

70
Results
The correct colonies were grown overnight in BHI medium containing Erythromycin (Table
3.1) for low copy plasmid isolation. Surprisingly, after isolation of the pELS100P5AgTB
plasmid from TOP10 cells, the antigen-insert of the plasmid was no longer detected by PCR.
Concomitantly, sequencing confirmed that the antigen-insert was in fact no longer present on
the plasmid. The purification process was repeated several times, always resulting in the
disappearance of the insert.
As the low copy pELS100-vector appeared to be unstable, all further experiments were carried
out with the pSIP-vector. To check whether the constitutive promoter, the antigen or possibly
the combination of the two were the reason for the problems, the antigen was replaced by a
gene encoding the small reporter protein NucA (Table 2.4). This protein has successfully been
used in the inducible pSIP vectors previously (Mathiesen et al., 2009). Construction of three
vectors attempted, containing the P5 promoter upstream of the NucA gene: intracellular
expression, secretion with the signal sequence Lp_3050 and surface localization by the
lipoprotein Lp_1261. The plasmid maps are shown in figure A-2 of the Appendix. However,
the replacement of the antigen with NucA did not solve any problems.
4.3 Growth curve analysis on L. plantarum harbouring different plasmids
Several studies have shown that production of heterologous proteins may reduce the bacterial
growth (Fredriksen et al., 2010; Kuczkowska et al., 2015; Lulko et al., 2007). Overnight
cultures of L. plantarum harbouring different plasmids for AgTB production was grown
overnight. The overnight cultures were diluted to an OD600 of 0.15 in pre-warmed MRS, and
200 µL of the diluted culture was transferred to a 96-well microtiter plate. The absorbance of
the cultures was measured for one hour, before induction of the cultures with 25 ng/mL SppIP.
After induction, the OD595 was measured every fifth minute for 20 hours by MultiSkan FC
microplate reader. L. plantarum carrying the pEV plasmid was used as a control, as it lacks
PsppA expressed genes.

71
Results
Figure 4.6. Growth curves of recombinant L. plantarum harbouring plasmids for antigen production. The
bacterial cultures were induced with 25 ng/mL SppIP one hour after start (approx. ~OD600=0.3), indicated by the
stapled line. The presented results are an average of three independent experiments.
Figure 4.6 shows the growth of the recombinant L. plantarum harbouring either pCytAgTB,
p1261AgTB or the control pEV. The wild-type L. plantarum were also included in the analysis.
L. plantarum harbouring the pEV and the pCytAgTB showed similar growth rates, while the
wild type bacteria grew slightly faster. However, L. plantarum harbouring the p1261AgTB
plasmid showed clearly reduced growth after induction compared to pEV and pCytAgTB.
4.4 Western blot analysis of antigen production
Western blot analysis was utilized to investigate antigen production in bacteria harbouring
p1261AgTB and pP5*AgTB, using Ag85B specific antibodies for detection (section 3.16). The
wild type strain of L. plantarum was included as a negative control, while protein extract from
L. plantarum harbouring pAgESAT6 (Table 2.4) served as the positive control (Figure 4.7).
The bacterial cultures were cultivated and harvested as described in sections 3.14.1 and
mechanically disrupted as described in section 3.4. The OD600 of the cultures were measured
and based on this, the volume taken from each culture were adjusted to ensure an equal number
of cells was used in the experiment.

72
Results
Figure 4.7. Western blot of cell-free protein extracts from L. plantarum harbouring p1261AgTB and
pP5*AgTB. Well number 1) MagicMark® XP Western Protein Standard, 2) pP5*AgTB 3) wild type strain of L.
plantarum (negative control), 4) p1261AgTB 5) empty 6) Protein extract from L. plantarum harbouring
pAgESAT6. A band at about 52 kDa is indicated in the positive control by an arrow.
The size of the fusion protein AgTB is 52 kDa, and a weak band at this size is visible in well 6
for the positive control in figure 4.7. In well 2-4 however, probably due to unspecific binding
of the secondary antibody, more than one band is visible in the crude protein extracts.
The experiment was repeated, using the same protein extracts with some adjustments. Figure
4.7 shows strong protein bands on the membrane. Therefore, to reduce the amount of protein
applied to the gel, the volume of protein extract was halved. In addition, the concentration of
the primary antibody was increased, from 2 to 4 µg/mL. The concentration of the secondary
antibody was decreased from 0.4 to 0.2 µg/mL, to potentially reduce the unspecific binding of
the secondary antibody. However, the adjustments did not affect the unspecific binding (data
not shown).

73
Results
4.5 Detection of antigen on the surface of L. plantarum using flow
cytometry
Flow cytometry of the bacterial cells was performed to investigate whether the antigen was
successfully localized and exposed at the surface of the bacteria. The data generated from the
flow cytometry analysis may be presented in a histogram where the y-axis represents the
number of bacterial cells sampled and the x-axis represents the relative fluorescence of FITC
as measured by the flow cytometer. Therefore, a higher intensity of fluorescent signal is
indicated by a shift along the x-axis to the right.
Bacterial cultures of L. plantarum carrying the inducible constructs p1261AgTB and
pCytAgTB, as well as the constitutive plasmid pP5*AgTB were cultivated and harvested
according to section 3.14.1. The bacterial cells were stained as described in section 3.17.2 and
analysed by Flow cytometry (Figure 4.8).
Figure 4.8. Flow Cytometry analysis of FITC stained recombinant L. plantarum. Histogram A-C shows L.
plantarum harbouring plasmids producing A) intracellular pCytAgTB, B) lipo-anchored p1261AgTB, C) lipo-
anchored pP5*AgTB. Bacteria harbouring pEV are indicated as a black line in the histograms A-C, and serves as
a negative control with no fluorescent signal. The results are shown as histograms with the relative fluorescence
(x-axis) plotted against number of events (y-axis). The y-axis was normalized and smoothed by the
MacsQuantify™ Software.
As expected, no fluorescent signal was detected for the negative control pEV (Figure 4.8A-C).
Neither was a signal detected for the bacteria harbouring pCytAgTB (Figure 4.8A). However,
for the bacteria harbouring p1261AgTB a slight shift to the right were detected (Figure 4.8B).
Some optimisation of the procedure had to be done to obtain this result, by adding more of the
primary antibody and increase the incubation times of the antibodies. No shift was detected for
the bacteria harbouring pP5*AgTB (Figure 4.8C).

74
Results
Figure 4.9 shows the flow cytometry analysis of L. plantarum harbouring lipo-anchored
pAgESAT6 (2.4) stained with both primary antibody Anti Ag85 (A) and Anti ESAT-6 (B). This
analysis was performed to compare the fluorescent signal emitted from hybridizing with
primary antibodies Ag85 and ESAT-6, because the fluorescent signal detected from Anti
Ag85B- hybridized p1261AgTB was weak (Figure 4.8B).
Figure 4.9. Flow Cytometry analysis of recombinant L. plantarum harbouring AgESAT-6 stained with
different antibodies. A) L. plantarum harbouring pAgESAT6 hybridized with primary antibody anti Ag85. B)
L. plantarum harbouring pAgESAT6 hybridized with primary antibody anti ESAT-6. Bacteria harbouring pEV
are shown as a black line in histogram A and B, and serves as a negative control. The results are shown as
histograms with the relative fluorescence (x-axis) plotted against number of events (y-axis). The y-axis was
normalized and smoothed by the MacsQuantify™ Software.
L. plantarum harbouring pAgESAT6 stained with the primary antibody anti ESAT-6, shown in
figure 4.9B, is clearly more shifted compared to the bacteria stained with primary antibody anti
Ag85 shown in figure 4.9A. A possible explanation for the difference in emitted fluorescent
signal might be that the Ag85B part of the fusion protein Ag85B_ESAT-6 is more embedded
in the membrane compared to the ESAT-6 part of the fusion protein, making it more unavailable
for interactions with the antibody.
4.6 Detection of Antigen on the Surface of L. plantarum with
Immunofluorescent Microscopy
To further confirm the presence of antigen on the surface of L. plantarum harbouring
p1261AgTB, Immunofluorescent microscopy was utilized. The immunofluorescent analysis

75
Results
was performed on bacterial cells stained as described for Flow cytometry. The results of the
microscopy analysis are shown in Figure 4.10.
Figure 4.10. Immunofluorescent microscopy of FITC stained recombinant L. plantarum. Only a few green
fluorescent bacteria (indicated by white arrows) are detected in the two bottom rows, showing L. plantarum
harbouring p1261AgTB. No fluorescent bacteria are detected in the top and middle row windows showing L.

76
Results
plantarum harbouring pCytAgTB or pEV. Bacteria harbouring the mutated constitutive construct were not
included in this analysis.
No fluorescent signal was detected in bacteria harbouring either the pEV or pCytAgTB (Figure
4.10). For p1261AgTB, only a few fluorescent bacteria were seen with the immunofluorescence
analysis (Figure 4.10). However, although the Flow cytometry results (Figure 4.8A-B) were
weak, the number of green fluorescent bacteria observed with immunofluorescence analysis
was fewer than expected.
4.7 Adaption of the CRISPR/Cas system for use in L. plantarum
In the present study, the CRISPR/Cas system was developed as a two-plasmid system to exploit
the system for genomic modification. One plasmid contained the Cas-coding gene under the
control of an inducible promoter PsppA, a selection marker (Ery) and the L. lactis derived, broad-
host-range Sh71 replicon (Figure 4.12). L. lactis was utilized as a subcloning host for the Cas-
plasmids. The second plasmid contained the Cas-handle and the 20 nucleotide (nt) base pairing
region (SgRNA) under the control of the constitutive promoter P3 and a resistance gene (Cat)
(Figure 4.13). The SgRNA-transcribing vector also contains an E. coli replicon (pUC ori) in
addition to the L. plantarum 256 replicon (see Figure 1.1).
The system was developed to mediate integration of genes of interest, as well as depletion and
editing of L. plantarum native genes. Table 4.3 shows the combinations of plasmids that were
used in this study. The abbreviations will be used in the text.
Table 4.3 – L. plantarum harbouring the two-plasmid CRISPR/Cas9 system
Plasmids Abbreviation Description
pSgRNA_luc+ psIP_411_dCas9_Sh71 pSgluc-dCas9 Empty vector plasmid.
Contains the complete
CRISPR/dCas9 system, but the
target gene, luc, is not present
on the L. plantarum genome.
pSgRNA_2645+ pSIP_411_dCas9_Sh71 pSg2645-dCas9 Two-plasmid system for
depletion of lp_2645 using
inducible dCas9

77
Results
pSgRNA_1247+ pSIP_411_dCas9_Sh71 pSg1247-dCas9 Two-plasmid system for
depletion of lp_1247 with
dCas9
pSgRNA_2217+ pSIP_411_dCas9_Sh71 pSg2217-dCas9 Two-plasmid system for
depletion of lp_2217 with
dCas9
pSgRNA_1247_2217+
pSIP_411_dCas9_Sh71
pSg1247_2217-
dCas9
Two-plasmid system for
depletion of lp_1247 and
lp_2217 with dCas9
pSgRNA_2645+ pSIP_411_Cas9_Sh71 pSg2645-Cas9 Two-plasmid system for
editing of lp_2645 mediated by
double strand cleavage with
Cas9.
pSgRNA_2645+
pSIP_411_Cas9D10A_Sh71
pSg2645-Cas9D10A Two-plasmid system for
editing of lp_2645 mediated by
single strand cleavage with
Cas9D10A
pSgRNA_2645_HLNucAHH+
pSIP_411_Cas9_Sh71
pSg2645Ha-Cas9 Two-plasmid system for
exchange of native lp_2645 in
L. plantarum with NucA
mediated by double strand
cleavage with Cas9.
pSgRNA_2645_HLNucAHH+
pSIP_411_Cas9D10A_Sh71
pSg2645Ha-Cas9D10A Two-plasmid system for
exchange of native lp_2645 in
L. plantarum with
NucA mediated by single strand
cleavage with Cas9D10A.
4.7.1 The CRISPR/Cas-system developed as a two-plasmid system in L. plantarum
The construction, and primers used for construction, of the Cas-plasmid was similar for all three
variants of the Cas-genes utilized in this study: Cas9, Cas9D10A and dCas9. The plasmids
containing the Cas9 (pCas) and Cas9D10A (pLCNICK) genes were ordered from Addgene (Table
2.4). Cas9 was amplified from pCas and Cas9D10A was amplified from pLCNICK, using the In-
Fusion primers CasNcoF and pCasR (Table 2.1). The construction process is only showed for

78
Results
construction of pCas9Sh71 (Figure 4.11 & 4.12), although the same construction was
performed to obtain pCas9D10ASh71 (Table 2.4). Firstly, the inducible vector pSIP_403 (Table
2.4) were digested with NcoI and XhoI. Subsequently, an In-Fusion cloning between the Cas9
fragment, amplified using the primer pair CasNcoF/pCasR, and the digested pSIP403 vector
were performed to obtain pSIP403_Cas9 (Figure 4.11).
Figure 4.11. The first step in construction of the Cas-plasmid with an inducible promoter. The Cas-gene was
amplified with the primer pair CasNcoF/pCasR with pCas as the template (Table 2.1 and 2.4). At the same time,
the inducible vector pSIP403 was digested with NcoI and XhoI. The digested vector and PCR-amplified fragment
were cloned through In-Fusion cloning to obtain the plasmid on the right: pSIP403_Cas9. pSIP403_Cas9 was
transformed into E. coli.
Next step in the construction was to replace the 256-replicon in pSIP_403_Cas9 (Figure 4.11)
with the Sh71 replicon. Both pSIP403_Cas9 and pSIP411 were digested with AgeI and XhoI,
the fragments were then ligated using ElectroLigase as described in figure 4.12 and transformed
into electrocompetent L. lactis to obtain pCas9Sh71 (Figure 4.12).

79
Results
Figure 4.12: Change of replicon to obtain the pCas9Sh71 vector. The pSIP403_Cas9 plasmid from figure 4.11
are digested with AgeI and XhoI. pSIP411, containing the Sh71-replicon, are digested with the same restriction
enzymes. The digested fragments are ligated with ElectroLigase and transformed into electrocompetent L. lactis
to obtain the pCas9Sh71 vector.
The construction of pCas9Sh71 and pCas9D10ASh71 was both successfully performed at the first
attempt. The two constructed Cas-plasmids with the Sh71-replicon were subsequently isolated
from L. lactis and transformed into L. plantarum.
4.7.2 Construction of a new SgRNA-plasmid
The software CRISPR primer designer (section 2.1) was utilized to construct 20 nucleotide (nt)
SgRNA sequence with target gene specificity. The open reading frame of the target gene or
region served as input into the designer software, which created a list of potential 20 nt SgRNA-
sequences adjacent PAM sequences. CRISPR primer designer also provides information about
whether the sequence is located on the positive or negative strand, and its position on the gene.
For SgRNA used in combination with catalytically inactive dCas9, sequences from the negative
strand are most effective (Rossi et al., 2015). To avoid off target binding with suggested SgRNA
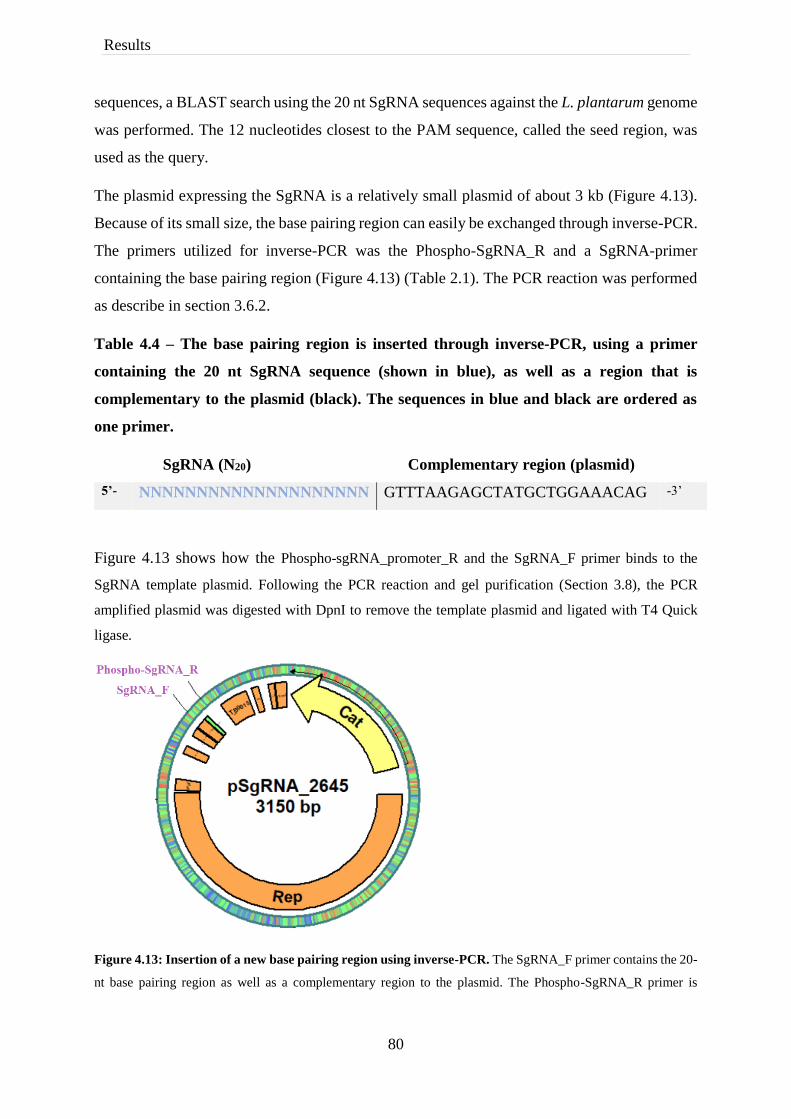
80
Results
sequences, a BLAST search using the 20 nt SgRNA sequences against the L. plantarum genome
was performed. The 12 nucleotides closest to the PAM sequence, called the seed region, was
used as the query.
The plasmid expressing the SgRNA is a relatively small plasmid of about 3 kb (Figure 4.13).
Because of its small size, the base pairing region can easily be exchanged through inverse-PCR.
The primers utilized for inverse-PCR was the Phospho-SgRNA_R and a SgRNA-primer
containing the base pairing region (Figure 4.13) (Table 2.1). The PCR reaction was performed
as describe in section 3.6.2.
Table 4.4 – The base pairing region is inserted through inverse-PCR, using a primer
containing the 20 nt SgRNA sequence (shown in blue), as well as a region that is
complementary to the plasmid (black). The sequences in blue and black are ordered as
one primer.
SgRNA (N20) Complementary region (plasmid)
5’- NNNNNNNNNNNNNNNNNNNN GTTTAAGAGCTATGCTGGAAACAG -3’
Figure 4.13 shows how the Phospho-sgRNA_promoter_R and the SgRNA_F primer binds to the
SgRNA template plasmid. Following the PCR reaction and gel purification (Section 3.8), the PCR
amplified plasmid was digested with DpnI to remove the template plasmid and ligated with T4 Quick
ligase.
Figure 4.13: Insertion of a new base pairing region using inverse-PCR. The SgRNA_F primer contains the 20-
nt base pairing region as well as a complementary region to the plasmid. The Phospho-SgRNA_R primer is

81
Results
complementary to the plasmid and is phosphorylated. The primers bind to the plasmid on each side of the base
pairing region (green region) to replace or insert a new 20 nt base pairing region.
All constructed SgRNA plasmids (Table 2.4) was transformed into electrocompetent L.
plantarum which already harboured a Cas9 expressing plasmid. L. plantarum with both
plasmids contain a complete CRISPR/Cas-system. As the Cas-gene is under the control of an
inducible promoter, the bacteria must be induced for the system to be activated.
4.7.3 Construction of a SgRNA with homologous arms for CRISPR/Cas9 mediated
gene exchange
CRISPR/Cas9-mediated gene exchange between native lp_2645 and the reporter protein NucA
was attempted as a proof-of-concept experiment, due to problems with constructing vectors for
constitutive production of AgTB. When Cas9 introduces double stranded break in the DNA,
the damage can be repaired either through nonhomologous end joining (NHEJ) or homology
directed repair (HDR) mechanisms (see section 1.7.1). HDR can be utilized for gene editing by
delivery of the desired sequence into the cell as a repair template together with a SgRNA and a
Cas9 protein. The repair template must contain the edit or gene, as well as additional
homologous sequences immediately upstream and downstream of the target on the genome.
In this study, to replace the native L. plantarum gene lp_2645, NucA was flanked by 1000 bp
on each side homologous to the sequence upstream and downstream of lp_2645, and co-
localized on the plasmid expressing the SgRNA (Figure 4.14 and 4.15).

82
Results
Figure 4.14. Construction of the fragment HL_NucA_HR through PCR. Primers with 15 bp overhangs
complementary to the adjacent fragment where designed for each of the three fragments, the individual fragments
were fused together in a second PCR reaction (right). The figure shows both a schematic overview of the process,
as well as pictures taken of the agarose gel after running the PCR-reactions. The size of the homologous arms- and
the NucA- fragments are ~1000 and ~500 bp respectively. The size of the constructed HL_NucA_HR fragment
are ~2500 bp.
Primers SgRNA-HL_F, HL-NucA_R, NucA-HH_F and SgRNA-HH_R (Table 2.1) were
designed to amplify the Left and Right homologous arm from the L. plantarum genome, with a
15 bp overhang complementary to the NucA gene on one end, and to the pSgRNA_2645 plasmid
on the other end. Primers HL-NucA_F and NucA-HH_R (Table 2.1) were also made to amplify
the NucA gene with 15 bp overhangs on each side, complementary to the left and right
homologous arm respectively. The three fragments were amplified by their respective primer
pair, in individual PCR reactions (Figure 4.14). After purification of the PCR-fragments, the
three fragments, with complementary overhangs, were combined in a PCR-tube with only the
outer primers. The outer primers were made as In-Fusion primers between the homologous
arms and the pSgRNA_2645 plasmid. This PCR-reaction were performed to obtain one full-
length fragment of the left homologous arm (HL), the NucA-gene and the right homologous
arm (HR) (Figure 4.14). Subsequently, the pSgRNA_2645 plasmid was digested with Acc65I
and XhoI. The PCR-fragment HL_NucA_HR were ligated with the digested pSgRNA_2645
obtaining pSg2645Ha (Table 2.4) (Figure 4.15).

83
Results
Figure 4.15: Plasmid map of pSg2645Ha. The red region marks the S. pyogenes constitutive promoter (P3), the
green region marks the Cas-handle and the short pink region marks the 20 nucleotides. In addition, it contains the
NucA gene flanked by homologous arms, a Chloramphenicol resistance gene (Cat) and a 256 replicon (Rep).
4.7.4 Growth curve analysis of L. plantarum harbouring the two-plasmid system
As per usual for recombinant strains, the growth of the individual strains was characterized.
The growth curves were constructed to investigate whether production of the heterologous
dCas9 protein and the SgRNA affected the growth rate of the bacteria.
Overnight cultures of the samples were diluted to an OD600 ~0.15 and induced directly. The
samples were measured every fifth minute for 20 hours.
Included in the analysis were the wild type L. plantarum, L. plantarum harbouring the
individual dCas9- and SgRNA_2645 plasmids and L. plantarum containing pSg2645-dCas9, as
well as the lp_2645 knock out (Δ2645) (Figure 4.16).

84
Results
Figure 4.16. Growth curves of recombinant L. plantarum harbouring plasmids CRISPR-plasmids. All
bacterial cultures were induced with 25 ng/mL SppIP at start (OD600=0.15). The growth of the cultures was
measured by MultiSkan FC every fifth minute for 20 hours. The absorbance values at each time point is the average
of three biological replicates
Figure 4.16 shows inhibited growth for the L. plantarum strain harbouring the inducible
pdCas9Sh71 plasmid and the two-plasmid system pSg2645-dCas9. The L. plantarum strain
harbouring only the pSgRNA_2645 plasmid or the L. plantarum Δ2645 (knock out) strain, did
not show considerable inhibited growth rate compared to the wild type strain.
4.8 Microscopy analysis of L. plantarum harbouring CRISPR/Cas-
plasmids
Microscopy analysis of L. plantarum harbouring the CRISPR/dCas9 system was performed to
assess the functionality of the system. It was expected that successful depletion of lp_2645 with
the CRISPR/dCas9 system would lead to drastic morphological changes based on pervious
analyses of the lp_2645 knock out Δ2645 (Fredriksen et al., 2012). Therefore, L. plantarum
harbouring Sg2645-dCas9 (Table 4.3) was the first to be analysed (Figure 4.17).

85
Results
Figure 4.17. Microscopy analysis of lp_2645 depleted L. plantarum. A) wild type L. plantarum, B) L. plantarum
Δlp_2645 (knock-out), C) lp_2645 depleted L. plantarum harbouring pSg2645-dCas9.
Figure 4.17 shows a clear morphological difference between wild type L. plantarum and the
Δ2645 strain. The Δ2645 strain seems to consist of longer chains of cells compared to the wild
type cells. There is a resemblance between the phenotype of the Δ2645 strain and L. plantarum
harbouring pSg2645-dCas9, which indicates that the two-plasmid CRISPR/dCas9 system
successfully knocked down the gene expression of lp_2645.
As mentioned in section 1.7.2, the genes cozE in Streptococcus pneumoniae (oval shaped cocci)
and its homologs cozEa and cozEb in Staphylococcus aureus (cocci) have been shown to be
involved with the cell division and elongation of the bacteria, and depletion of the cozE genes
affects their morphology (Fenton et al., 2016; Stamsås et al., 2018). In the present study,
analyses were performed on the cozEa and cozEb homologs in L. plantarum: lp_1247 and
lp_2217. The genes were depleted by dCas9 to investigate if it affected the morphology in the
rod-shaped L. plantarum as well. Both phase contrast (PC) and fluorescent microscopy were
utilized to investigate the morphology of these genes in L. plantarum.
Bacterial overnight cultures were diluted to an OD600 of ~0.01 and induced with 25 ng/mL
SppIP. Addition of the inducer led to activation of the CRISPR/dCas9-system, and
subsequently depletion of the SgRNA-targeting genes (lp_1247 and lp_2217). The cultures
were harvested at an OD600 of 0.4. Harvested bacterial culture was stained with Nile-Red
(membrane staining) and DAPI (DNA staining) as described in section 3.18.1. Three different
L. plantarum strains harbouring either pSg1247-dCas9, pSg2217-dCas9 or pSg1247_2217-
dCas9 was harvested, stained and analysed by microscopy (Figure 4.18). Wild type L.
plantarum was included as a control.

86
Results
Figure 4.18. Investigation of the functions of the genes lp_1247 and lp_2217 in L. plantarum through
microscopy. The top row shows the phase contrast microscopy pictures of the four strains. The second row shows
bacteria stained with DNA-binding DAPI. The third row shows bacteria stained with membrane-binding Nile Red.
The arrows indicate bright red spots detected. The scale bar is 10 µM.
The phase contrast microscopy pictures (Figure 4.18, PC) does not indicate a change in
morphology when L. plantarum is depleted of lp_1247, lp_2217 or when both genes are
depleted compared to the wild type. Neither does the DAPI stained cells in Figure 4.18 differ,
which indicates that depletion of the genes does not affect the arrangement of DNA in the cells.
For the Nile Red stained bacteria (Figure 4.18), a few bright spots at random localizations can
be observed for depleted bacteria (indicated by the white arrows), which may indicate that
depletion affects arrangement of the membrane.

87
Results
4.9 Transcription analysis with droplet digital PCR
4.9.1 Transcriptional analysis of L. plantarum depleted of the lp_2217 and lp_1247
genes
As the microscopy analyses did not reveal a clear morphological change in L. plantarum
depleted of lp_1247, lp_2217 or both genes, further analyses were performed to determine if
the CRISPR/dCas9 system was functional. dCas9 is not catalytically active, but binds to the
DNA, and thereby blocking transcription. Therefore, transcription level analysis of depleted
genes would indicate if the CRISPR/dCas9 system was functional. Droplet digital PCR was
utilized to determine transcript copies per ng RNA of the gene of interest. For a more detailed
description of the method, see section 3.20. p-values are calculated using the student t-test.
Overnight cultures of the recombinant strains were grown as described for microscopy in
section 3.14.2. In short, the overnight cultures were diluted to an OD600 of ~0.01, induction with
25 ng/mL SppIP and harvested at an OD600 of 0.4. Harvested samples was prepared for
transcription analysis with ddPCR as described in section 3.19.1, 3.19.2 and 3.19.3.
The total RNA from the recombinant strains and the wild type was diluted into stock solutions
of 50 ng/µL RNA. To achieve similar concentrations of cDNA in each sample, 2 µL was taken
from each stock solution to get a total of 100 ng RNA in the reverse transcription (RT) reactions.
As the primers in the downstream PCR reaction would bind to gDNA as well as cDNA if
present, negative controls were made for each RNA sample without adding reverse
transcriptase, to control the amount of residual gDNA in the samples. These negative control
samples (RT-) were treated the exact same way as the positive samples (RT+).
The transcription level of lp_1247 and lp_2217 was analysed in L. plantarum strains harbouring
pSg1247-dCas9, pSg2217-dCas9 and pSg1247_2217-dCas9 (Figure 4.19, 4.20 and 4.21). Wild
type L. plantarum served as a positive control for RNA isolation and reverse transcription, as
well as indicating the baseline transcription level of lp_1247 and lp_2217. L. plantarum
harbouring pSgluc-dCas9 (Table 4.3) targeting the luciferase gene, a gene that is not present in
L. plantarum, was to control that the target genes are not depleted simply by the presence of
dCas9. Ideally, the transcription levels of the genes in the two control strains would be similar.
As the fluorochrome used in this study, EvaGreen, does not allow multiplexing, each sample
was added in two separate wells and analysed with both primer pair Lp_1247_F/Lp_1247_R
and Lp_2217_F/Lp_2217_R (Table 2.1).

88
Results
Figure 4.19 shows the transcription level of lp_2217 in L. plantarum strains harbouring
pSg1247-dCas9, pSg2217-dCas9, pSg1247_2217-dCas9 and pSgluc-dCas9 as well as wild type
L. plantarum.
Figure 4.19. Transcriptional levels of lp_2217 in RT+ samples and negative control RT- samples for L.
plantarum harbouring the CRISPR/dCas9 system. Each sample in this experiment represents three biological
replicates and four technical replicates. The standard deviation is calculated between the biological replicates.
The transcription level of lp_2217 are much higher in the two control strains pSgluc-dCa9s and
wild type L. plantarum compared to the strains with targeting SgRNA’s (Figure 4.19).
However, a slight decrease is observed in pSgluc-dCas9 compared to the wild type, but the
difference is not statistically significant (p=0.09). In theory, for L. plantarum harbouring
pSg1247-dCas9, lp_2217 should not be depleted compared to the wild type, since
pSgRNA_1247 only represses transcription of lp_1247. Despite this, there are fewer detected
copies/ng RNA in this sample compared to the controls, which indicates a slight depletion.
As expected, the samples containing L. plantarum harbouring either pSg2217-dCas9 or
pSg1247_2217-dCas9, the transcription level of lp_2217 are significantly decreased compared
to the other three (Figure 4.19), which strongly indicates depletion of the gene. The RT- sample-
bars are much lower than the RT+ sample-bars, which indicates minimal residual gDNA from
RNA isolation, and does not seem to affect the interpretation of the transcriptional levels.
Figure 4.20 shows the transcription level of lp_1247 in L. plantarum strains harbouring
pSg1247-dCas9, pSg2217-dCas9, pSg1247_2217-dCas9 and pSgluc-dCas9 as well as wild type
L. plantarum without any plasmids.
0
20
40
60
80
100
120
140
160
180
200
Co
pie
s/ n
g R
NA
RT+ RT-

89
Results
Figure 4.20. Transcriptional levels of lp_1247 in RT+ samples and negative control RT- samples for L.
plantarum harbouring the CRISPR/dCas9 system. Each sample in this experiment represents three biological
replicates and four technical replicates. The standard deviation is calculated between the biological replicates.
The transcription level of lp_1247 in the two control strains, pSgluc-dCas9 and wild type L.
plantarum is not significant different (p=0.45) (Figure 4.20). The transcription level of lp_1247
in the strain harbouring pSgRNA_2217-dCas9, where only lp_2217 are depleted, are slightly
higher compared to the controls, but not significantly (p=0.19). However, for L. plantarum
strains harbouring either pSg1247-dCas9 or pSg1247_2217-dCas9 the transcription levels
decreased by 93 % compared to the wild type. This strongly indicates that lp_1247 is indeed
depleted in these strains by the CRISPR/dCas9-system. The RT- sample-bars of figure 4.20 are
much lower than the RT+ sample-bars and does not seem to affect the interpretation of the
transcriptional levels, as in figure 4.19.
Figure 4.21 compares the transcription levels of lp_2217 (dark blue) and lp_1247 (light blue)
in all five L. plantarum strains, harbouring pSg1247-dCas9, pSg2217-dCas9, pSg1247_2217-
dCas9 and pSgluc-dCas9 as well as wild type L. plantarum.
020406080
100120140160180200
Co
pie
s/ng R
NA
RT+ RT-

90
Results
Figure 4.21. Comparison of transcription levels of the genes lp_1247 and lp_2217 in the five strains. The
transcription level of the two genes lp_1247 (light blue) and lp_2217 (dark blue) of the five L. plantarum strains
harbouring either pSg2217dCas9, pSg1247-dCas9, pSg1247_2217-dCas9, pSgluc-dCas9 or wild type L.
plantarum are shown.
4.9.2 Dose response analysis using ddPCR
A dose response analysis was carried out to investigate if the depletion of target genes could be
regulated by adding different concentrations of the inducer SppIP to the bacteria containing
pSg2645-dCas9.
An overnight culture of L. plantarum harbouring pSg2645-dCas9 was diluted to an OD600 of
0.15 and incubated with different concentrations of the inducer peptide (SppIP): 0, 1, 10 and 25
ng/mL to investigate if it affected transcription of lp_2645. The wild type strain of L. plantarum,
as well as L. plantarum harbouring pSgluc-dCas9 were included as controls (Figure 4.22). After
induction, the cultures were grown for three hours before harvesting and RNA purification.
020406080
100120140160180200
Co
pie
s/ng R
NA
lp_2217 lp_1247

91
Results
Figure 4.22. SppIP response in L. plantarum harbouring pSg2645-dCas9. The graph shows the transcription
level of lp_2645 in cultures induced with different concentrations of SppIP. All samples in the experiment
represents three biological replicates and two technical replicates. The standard deviation is calculated from the
biological replicates.
Figure 4.22 shows that highest transcription level of lp_2645 was detected in the uninduced
sample of L. plantarum harbouring pSg2645-dCas9, as expected. There is not a statistically
significant difference of the transcription level of lp_2645 between the uninduced sample and
the sample induced with 25 ng/mL SppIP (p=0.42). The transcription level in the sample
induced with 25 ng/mL only decreased by 34 % compared to the uninduced sample.
Figure 4.23 compares the transcription level of lp_2645 in L. plantarum strains harbouring
pSg2645-dCas9 induced with concentration 0-25 ng/mL to the wild type L. plantarum and L.
plantarum harbouring pSgluc-dCas9.
10
12
14
16
18
20
22
-1 1 3 5 7 9 11 13 15 17 19 21 23 25
Co
pie
s/ng R
NA
ng/mL SppIP

92
Results
Figure 4.23. Transcription level of lp_2645 in cultures induced with SppIP to different final concentrations,
compared to the controls.
The difference observed between the wild type L. plantarum and the uninduced L. plantarum
harbouring pSg2645-dCas9 in figure 4.23 is 94%. This indicates that the system is poorly
regulated and leakage of the promoter PsppIP. Although not significant (p=0.57), lp_2645 seems
to be depleted in L. plantarum harbouring pSgluc-dCas9 compared to the wild type, despite not
having a lp_2645 targeting SgRNA.
4.10 CRISPR/Cas9 assisted genome editing in L. plantarum
The main purpose of implementing the CRISPR/Cas9 system in L. plantarum was to potentially
utilize the system to mediate integration of the hybrid antigen into the genome of the bacteria.
To perform CRISPR/Cas9 assisted genome editing, electrocompetent L. plantarum harbouring
either the double-strand breaking Cas9- plasmid or the single-strand breaking Cas9D10A-
plasmid was utilized. To obtain all necessary components of the CRISPR/Cas9-system in L.
plantarum a SgRNA plasmid was transformed to competent strains harbouring Cas expression
plasmid (Figure 4.13 & 4.12).
To target lp_2645 and introduce a random mutation, possibly leading to a frameshift of the
gene, the pSgRNA_2645 (Figure 4.13) plasmid was utilized. The gene lp_2645 was selected as
the target gene because it was expected that successful editing of the gene was easily detectable
by microscopy, as depletion and knock out of lp_2645 caused a characteristic change in the
morphology of L. plantarum (Figure 4.17). The SgRNA plasmid that was utilized for the gene
exchange, was pSg2645Ha (Figure 4.15), which contained the NucA gene flanked by 1000 bp
0
50
100
150
200
250
300
350C
op
ies/
ng R
NA

93
Results
of homology to the L. plantarum genome on each side. The strategy followed for gene exchange
and insertion of a random mutation were the same, therefore only the gene exchange method is
described in this section. Both Cas9 and Cas9D10A was utilized in independent experiments in
the attempts of successfully edit the genome L. plantarum. Because NucA is a shorter gene than
lp_2645, a replacement would be easily detectable by PCR. For gene editing without the repair
template, where only random mutations were expected to be inserted, colonies were sequenced
by GATC Biotech, as possible changes would have been undetectable by PCR.
L. plantarum already harbouring pCas9Sh71 was transformed with pSgRNA_2645 to obtain
pSg2645-Cas9 (Table 4.3). Subsequently, the transformed bacteria were induced at different
stages in order to successfully perform a gene exchange between lp_2645 and NucA (Figure
4.24). As it was desirable to develop a quick and easy method as possible, the first stage was to
induce one aliquot of the transformation mixture with 25 ng/mL SppIP. A second aliquot was
spread on agar plates with and without 25 ng/mL SppIP. Colonies from agar plates containing
SppIP were screened with PCR, while colonies on plates without inducer were picked with a
tooth-pick, induced with 25 ng/mL SppIP and grown overnight in 10 mL MRS with proper
antibiotics. The overnight culture was then spread on agar plates, and colonies were screened.
Figure 4.24. Induction of the bacterial culture at different stages. Following transformation, the bacterial
culture was induced for activation of the CRISPR/Cas9 system either at step 2, 3 or 5. Colonies were screened in
either step 4 or 7. The bacteria were always induced with 25 ng/mL SppIP.
Colonies obtained from all strategies were also investigated by microscope, as the characteristic
phenotype of the lp_2645 -knock out and -dCas9 depletion could easily be observed (Figure
4.17). A distinct phenotypic discrepancy was observed between the wild type L. plantarum

94
Results
(Figure 4.25A) and induced L. plantarum harbouring pSg2645-Cas9 (Figure 4.25D). The
phenotype observed in figure 4.25D shows clear similarity to the phenotypes observed in figure
4.25B and 4.25C.
Figure 4.25. Microscopy analysis of L. plantarum colonies harbouring pSg2645-Cas9. A) wild type L.
plantarum, B) L. plantarum lacking the lp_2645 gene. C) L. plantarum harbouring pSg2645-dCas9 D) L.
plantarum harbouring pSg2645-Cas9.
Although most of the colonies showed the characteristic phenotype (Figure 4.25D), the PCR
screenings showed that none of the analysed colonies had exchanged lp_2645 with NucA
through the CRISPR/Cas9 mediated gene editing experiments. Sequencing revealed that none
of the colonies were the characteristic phenotype had been observed had been edited.
On the plates with L. plantarum harbouring pSg2645Ha-Cas9D10A (Table 4.3) more than 100
colonies had appeared. On the plates with L. plantarum harbouring pSg2645Ha-Cas9 (Table
4.3) only five colonies had appeared. This may indicate that Cas9, inducing double-stranded
DNA breaks exerts more strain on the bacteria compared to bacteria harbouring Cas9D10A,
which only induces single-stranded break.
Some of the bacteria that showed the phenotype were grown further in MRS medium without
antibiotics or SppIP, to see whether the phenotype would be reversed or not. After diluting the
culture ten times, three times over three days the phenotype of the bacteria had returned to the
wild type phenotype.

95
Discussion
5 Discussion
5.1 Construction of AgTB-producing plasmids
The tuberculosis antigens Ag85B and TB10.4 was chosen as they have shown to induce a
significant protection against Mycobacterium tuberculosis, both individually and in
combination as a hybrid antigen (Dietrich et al., 2005; Kou et al., 2018). In the present study,
the hybrid antigen Ag85B_TB10.4 (AgTB) was translationally fused to the N-terminal part of
the lipoprotein Lp_1261 for production of surface localized antigen in Lactobacillus plantarum.
A study conducted by Kuczkowska et al. (2016) showed that anchoring of heterologous proteins
with the N-terminal lipoprotein Lp_1261 in L. plantarum induced a higher immune response
compared to other anchors in the study. Although lipo-anchored proteins are sufficiently
exposed to the surroundings to induce an immune response, it is also suggested that the
anchoring mechanism provides beneficial protection against detrimental conditions in the
environment, such as in the gastro intestinal tract (GIT) of humans, compared to other anchoring
mechanisms (Michon et al., 2016).
To compare AgTB with previously constructed and tested inducible plasmids producing
Ag85B_ESAT-6 in L. plantarum, inducible vectors producing AgTB was constructed and
characterized in the present study. The inducible vectors pLp_1261-Ag85B-TB10.4_DC
(p1261AgTB) (Figure 4.1) and pAg85B-TB10.4_DC (pCytAgTB) (Figure 4.2) were
successfully constructed for production of surface and cytoplasmic localization of AgTB,
respectively.
Attempts were made to exchange the inducible PsppA promoter with constitutive promoters P5
and P11 to obtain constitutive expression of AgTB. The colonies obtained from these attempts
mostly contained religated vectors. After several trials, one colony contained a vector with
P5*_Lp1261_Ag85B_TB10.4 (P5*AgTB). However, sequencing revealed a single mutation in
the -35 box of promoter (Figure 4.3). The -35 box is important for proper binding between the
promoter and polymerase (Watson et al., 2014). As the single colony with the correct insert
contains a mutation in the promoter indicates that the constitutive promoter is also active in E.
coli and that production of AgTB is stressful and toxic to the cell. Stress on the bacteria is
known to be able to increase mutation rates (Tenaillon et al., 2004). One way to reduce
expression is to replace the high copy pSIP vector with the low copy vector pELS100, because
this will lower the gene dose of the target gene. Figure 4.5 showed that seven out of nine
colonies clearly contained the plasmid with the constitutive antigen insert. Surprisingly, the

96
Discussion
AgTB-insert could not be detected in the pELS100 vector following overnight growth and
plasmid isolation. The isolated plasmid was sent to sequencing, and it was confirmed that the
pELS100 vector had been isolated, but the constitutive AgTB insert was absent. Construction
of constitutive secretion of the antigen Ag85B_ESAT-6 has been attempted previously. Similar
to the present study, the author concluded that the constitutive secretion of the antigen was toxic
to E. coli, as the promoter sequence of the constitutive promoters P11 and P27 was removed by
the bacteria following transformation (Tjåland, 2011). Direct transformations to L. plantarum
was also attempted, but unsuccessful.
All the promoter sequences from the synthetic promoter library constructed by Rud et al.
(2006), including P5 and P11 utilized in the present study, is based on the sequences of 10 rRNA
promoters from L. plantarum WCFS1. A BLAST search using the promoter sequence as the
query was performed to investigate potential homology between the P5 promoter and native E.
coli promoters. However, the only hits generated was sequences originated from lactobacilli
and lactococci. To further investigate whether the constitutive promoter was active in E. coli,
western blot analysis could have been performed on the plasmid in E. coli. Another strategy
that should be explored is to utilize a L. plantarum homolog constitutive promoter, such as the
lactate dehydrogenase promoter PldhL, which has formerly been employed (Bron et al., 2004;
Sasikumar et al., 2014). Utilization of Lactococcus lactis as a subcloning host rather than E.
coli could also be an option to solve the toxicity problem. An advantage of the gram-positive
L. lactis over the gram-negative E. coli is that it is monoderm, which might reduce potential
toxicity linked to secretion of AgTB.
5.2 Growth of L. plantarum harbouring antigen plasmids
Reduced growth rates are commonly detected in Lactobacilli and other Gram-positive bacteria
producing and secreting heterologous proteins (Antelmann et al., 2003; Bolhuis et al., 1999;
Karlskås et al., 2014; Kuczkowska et al., 2015). L. plantarum harbouring p1261AgTB is no
exception (Figure 4.6). About one hour following induction with SppIP, the growth of L.
plantarum harbouring pCytAgTB and pEV diverged from the growth of the strain harbouring
p1261AgTB. The growth of pEV and pCytAgTB plateaued after approximately 15 hours of
measuring, while the growth of p1261AgTB was still slightly increasing after 20 hours (Figure
4.6). The growth of pCytAgTB did not show any reduction in growth compared to pEV. Both
p1261AgTB and pCytAgTB produces AgTB, and the only difference between the two plasmids

97
Discussion
is the Lp_1261 signal sequence of p1261AgTB. The Lp_1261 signal sequence is therefore the
most likely explanation for the reduction in growth observed for p1261AgTB compared to
pCytAgTB. A reason for the reduction in growth can be linked to secretion stress. Secretion of
a protein can lead to an overload on the translocation machinery and consequently impaired
growth (Mathiesen et al., 2009). However, although growth rate reduction is observed in figure
4.6 for p1261AgTB, previous studies have shown that compared to several other anchors, the
Lp_1261 anchored constructs had the lowest reduction in growth (Fredriksen et al., 2012;
Kuczkowska et al., 2015; Øverland, 2013).
A discrepancy is observed between the positive controls pEV and the wild type L. plantarum
(Figure 4.6) about three hours after induction. From this point, the growth of L. plantarum
harbouring pEV was slightly reduced compared to the wild type. In the pEV plasmid, no gene
is expressed downstream of the promoter PsppA, unlike in pCytAgTB and p1261AgTB. Since a
discrepancy is observed despite this, it might indicate that the presence of an inducible system
alone is enough to inhibit the growth of L. plantarum.
5.3 Characterization of AgTB production and localization
To confirm production of AgTB by L. plantarum harbouring p1261AgTB and pP5*AgTB, cell
free protein extracts of the strains were analysed by Western blot. Figure 4.7 shows unspecific
binding of the secondary antibody, which binds specifically to Ag85B, leading to difficulties in
confirming AgTB production by p1261AgTB and pP5*AgTB. Attempts at optimisation was
performed without affecting the results (data not shown). In further optimisation steps, the BSA
concentration of the blocking solution could have been increased, to prevent unspecific binding.
However, previous testing of the primary and secondary antibody has shown weak signals
(personal communication Lise Øverland (2018)), therefore no further optimisation of the
Western blot analysis was performed.
To ensure that AgTB produced by p1261AgTB and potentially pP5*AgTB was localized on
the surface of L. plantarum, the constructs were analysed by flow cytometry (Figure 4.8). As
no shift were detected between the negative control and the pP5*AgTB histograms from flow
cytometry, it appeared that the -35 box of the P5 promoter was a missense mutation, resulting
in a non-functional promoter. However, although a slight shift was observed between pEV and
p1261AgTB histograms, thereby confirming production and surface localization of AgTB, the
fluorescent signal was weak. The promoter controlling p1261AgTB, the pSIP promoter PsppA,

98
Discussion
is considered a strong promoter unlike the weak constitutive promoter P5. The P5 promoter
originates from a synthetic promoter library, constructed by Rud et al. (2006). In the article,
they state that for the weakest promoters, a higher concentrated aliquot was utilized in a
downstream assay to investigate promoter activity. Out of the 35 constructed promoters in the
synthetic promoter library, P5 was the 15th weakest. In the present study, the same number of
cells were harvested from cultures of both pP5*AgTB and p1261AgTB for downstream
analyses. Based on this, it is possible that no fluorescent signal was detected for pP5*AgTB
because the mutation of the P5 promoter led to an undetectable production of AgTB. Perhaps if
the culture of L. plantarum harbouring P5*AgTB was allowed to grow for a longer period of
time, a fluorescent signal would have been detected from flow cytometry. In the P5* promoter,
one nucleotide of the -35 box is substituted, however for the weakest promoter of the synthetic
promoter library, P15, the -35 box was completely absent. This indicates that the P5* promoter
should not be unfunctional due to only one mutation.
Previous studies have speculated that anchoring of proteins by the lipoprotein Lp_1261 leads
to a less exposed protein, and thereby reducing its ability to be recognized and interact with the
antibody (Michon et al., 2016; Nguyen et al., 2016). The primary antibody utilized in the present
study for antibody hybridization interacts with Ag85B, which is immediately downstream from
the N-terminal lipoprotein anchor. There is reason to assume that Ag85B of the hybrid antigen
AgTB is more embedded in the membrane compared to TB10.4, which might explain the weak
shift presented in Figure 4.8B. The results from Figure 4.9, showing L. plantarum harbouring
AgESAT-6 stained with both Anti Ag85B and anti ESAT-6 primary antibodies, further
substantiated that the position and exposure of the targeted antigen strongly affects emitted
fluorescent signal.
The results from immunofluorescent microscopy analysis of the cells showed only a few green
fluorescent bacteria for L. plantarum harbouring p1261AgTB (Figure 4.10). Although the
fluorescent signal from flow cytometry was weak, the result from the microscopy analysis was
weaker than expected. No fluorescent bacteria were observed for strains harbouring either pEV
or pCytAgTB, which indicates low degree of unspecific binding during the antibody
hybridization.
No conclusions can be made as to whether the P5* promoter is unfunctional or only made weaker
by the mutation. Characterizations of L. plantarum harbouring p1261AgTB confirmed that the
vector produced secreted surface anchored antigen, although the fluorescent signal emitted from
flow cytometry analysis was weak (Figure 4.8). Performing the antibody hybridization with a

99
Discussion
primary antibody with specificity to the probably more exposed TB10.4, might enhance the
results from flow cytometry and immunofluorescent microscopy analyses, as was seen for
AgESAT-6 stained with an antibody specific to ESAT-6 (Figure 4.9).
5.4 Development of the two-plasmid CRISPR/Cas9 system
In previous studies implementing the CRISPR/Cas9 system into various lactobacilli, such as
Lactobacillus casei, Lactobacillus reuteri, and also very recently L. plantarum, the gene
encoding the Cas9 protein and the SgRNA has been delivered into the cell on one plasmid
(Leenay et al., 2018; Oh & van Pijkeren, 2014; Song, X. et al., 2017). In the present study, the
Cas9-gene and the SgRNA was expressed on separate plasmids, controlled by an inducible and
a constitutive promoter respectively (Figure 4.12 & 4.13). By expressing the SgRNA on a
separate plasmid, exchange of the 20 nt base pairing region could easily be performed by
inverse-PCR, providing a simple and fast way of changing the target of SgRNA. Production of
Cas9 through the pSIP inducible system allowed for regulated activation of the system. In the
present study, experiments were performed with three genes encoding different versions of the
Streptococcus pyogenes derived Cas9 protein: original double-strand breaking Cas9, single-
strand breaking Cas9D10A and catalytically inactive dCas9.
Initial experiments conducted in the present study on L. plantarum harbouring the
CRISPR/Cas9 system, targeted genes known to affect the phenotype upon depletion either in
L. plantarum or other LAB. However, as the long-term goal of the project which this study is a
part of is to develop mucosal vaccines, the targets selected in this study is not necessarily the
most advantageous regarding L. plantarum as a delivery vector. An important factor to consider
is to limit the release of the recombinant bacteria. The Thymidylate synthase gene (thyA) is
essential for growth of L. plantarum, and disruption of the gene would lead to dependence on
external thymidine for growth and survival (Paul et al., 2018), and could therefore limit the
release of recombinant L. plantarum. A study by Steidler et al. (2003) replaced the essential
thyA of L. lactis with a synthetic human interleukin 10 gene (IL10), in an effort to prevent
release of genetically modified organisms. The thyA gene was successfully replaced with the
synthetic IL10, a therapeutic protein against inflammatory bowel disease, through homologous
recombination. L. lactis lacking thyA was incubated in thymidine free medium. After 72 hours,
no viable cells could be detected. Based on these findings, the thyA gene can be an advantageous
gene to target for integration of tuberculosis antigens into the genome of L. plantarum. A

100
Discussion
SgRNA plasmid was constructed to target thyA (Table 2.4), but experiments utilizing this
plasmid was not executed due to limited amount of time.
5.5 Growth curves of L. plantarum harbouring CRISPR/Cas9 plasmids
Growth rates of L. plantarum harbouring the CRISPR/dCas9 plasmids are shown in figure 4.16,
and clearly illustrates that only strains harbouring pdCas9Sh71 shows reduced growth
compared to the wild type strain of L. plantarum. The dCas9 protein, produced from the plasmid
pdCas9Sh71, is a large protein of ~159 kDa. Due to its large size, the production of dCas9
might exert additional stress on the bacteria. Figure 4.6 also indicated that solely the presence
of the pSIP inducible expression system led to reduction in growth of the bacteria. A possible
explanation can be because the bacteria have to express two additional genes, the histidine
kinase and response regulator gene, to produce proteins regulated by the pSIP system. Growth
curves comparing inducible and constitutive expression of cytoplasmic Ag85B-ESAT6 made
by Tjåland (2011), showed that L. plantarum harbouring the constitutive vectors had a slightly
higher growth rate compared to the inducible plasmid. In the present study, L. plantarum
constitutively expressing the SgRNA_2645, did not show reduced growth compared to the
growth of the wild type. Whereas SgRNA only has to be transcribed, the mRNA encoding
dCas9 also has to be translated and folded to become a mature, functional protein.
Consequently, it might be much easier for bacteria to produce SgRNA than dCas9,
consequently affecting the growth rates. Importantly, although the growth of L. plantarum
harbouring pdCas9Sh71 showed reduced growth, production of dCas9 does not seem to be toxic
to cell.
5.6 Microscopy analysis of L. plantarum harbouring the CRISPR/dCas9
system
Microscopy analysis was utilized to evaluate the ability of the CRISPR/dCas9 system to repress
selected genes of L. plantarum, by investigating whether a change in morphology followed
depletion of the genes.
L. plantarum harbouring pSg2645-dCas9 was utilized to deplete lp_2645. This gene has
previously been knocked out by the loxP/Cre system and showed that the knock out affected
the phenotype of L. plantarum (Fredriksen et al., 2012). Figure 4.17 shows that depletion of

101
Discussion
lp_2645 by the CRISPR/dCas9 system successfully resulted in a phenotype similar to the knock
out (Δ2645), which strongly suggests that the designed SgRNA manages to guide dCas9 to the
target site, and that dCas9 successfully binds to the DNA.
After confirming that the CRISPR/dCas9 successfully affected the morphology of L. plantarum
by depletion of lp_2645, two new genes were investigated (Figure 4.18). The function of these
two genes, lp_1247 and lp_2217, is unknown in L. plantarum. Proteins encoded by lp_1247
and lp_2217 are homologous to CozEa and CozEb in Staphylococcus aureus and CozE in
Streptococcus pneumoniae. These proteins are known to be involved in cell elongation and
division in S. pneumoniae and S. aureus (Fenton et al., 2016; Stamsås et al., 2018). Based on
BLAST searches, the identity between the amino acid sequences of Lp_1247 and Lp_2217
compared to CozE, CozEa and CozEb was found to be ~33% on average. Lp_1247 has the
highest percentage of identity to CozE and CozEa (35 and 34%, respectively), while Lp_2217
has the highest percentage of identity to CozEb (35%). Previously, it was found that depletion
of cozE in the oval shaped cocci S. pneumoniae, led to less elongated cells, resulting in a
morphology more similar to round cocci such as S. aureus (Fenton et al., 2016). Although
elongation is not performed to the same extent in the round cocci S. aureus as it is in ovococcal
or rod-shaped bacteria, two S. aureus proteins were found to be homologous to the CozE
protein: CozEa and CozEb (Stamsås et al., 2018). Depletion of CozEa and CozEb utilizing the
CRISPR/dCas9 was performed to unravel the function of the proteins in S. aureus. Analyses
suggested that depletion of cozEa and cozEb affected the cells ability to position and correctly
time cell division. The cell division in S. aureus follows an intricate pattern, where the cell
divides in three consecutive planes and each round of division is orthogonal to the previous
plane (Pinho et al., 2013). Depletion of cozEa and cozEb resulted in deformed cells, as they
were no longer able to divide in perpendicular planes. Figure 4.18 shows that depletion of
lp_1247 and lp_2217 in L. plantarum, by the CRISPR/dCas9 system, did not drastically change
the morphology of the rod-shaped L. plantarum, which were seen following depletion of cozE
in S. pneumoniae. Neither the DNA-staining with DAPI gave any indications to the function of
the two genes. Stamsås et al. (2018) revealed by DAPI staining of S. aureus that depletion of
cozEa or cozEb resulted in uneven distribution of DNA, and that some cells did not contain any
DNA due to random division of the cell. Depletion of lp_1247 and/or lp_2217 did not seem to
have any effect on the distribution of DNA in L. plantarum, based on the observations from the
DAPI stained bacteria (Figure 4.18). The most abnormalities seen for lp_1247 and lp_2217
depleted bacteria, was for the Nile Red, membrane stained bacteria (Figure 4.18). Brighter spots

102
Discussion
of fluorescence can be observed, as indicated by white arrows in figure 4.18. No such bright
spots are observed for the wild type bacteria. The bright spots might indicate a thicker
membrane at that point. It can also indicate the formation of new septums, observed as a
dividing line in the bacteria. These results might indicate that the function of Lp_1247 and
Lp_2217 is more involved in cell division as the CozEa and CozEb proteins in S. aureus, rather
than cell elongation as CozE in S. pneumoniae, although no conclusions can be made. An
important distinction between cozEa and cozEb in S. aureus compared to lp_1247 and lp_2217
in L. plantarum is the apparent essentiality of the genes. When Stamsås and co-workers tried to
deplete both cozEa and cozEb simultaneously, the bacteria were not able to survive. However,
in L. plantarum, depletion of both lp_1247 and lp_2217 did not appear to be lethal to the
bacteria. This might indicate that despite homology, the function of the L. plantarum and S.
aureus proteins are not equal. Another possibility is that there are more genes involved in cell
division in L. plantarum, and thereby reducing the effects following depletion of lp_1247 and
lp_2217. A third possibility, that was investigated by transcriptional analysis, was that the genes
were not effectively depleted by the CRISPR/dCas9 system.
5.7 Transcription analysis with ddPCR
To show that the CRISPR/dCas9 system functioned, transcription analyses was conducted
using droplet digital PCR (ddPCR). The ddPCR method are a highly precise, absolute nucleic
quantification method compared to methods such as real-time PCR (Hindson et al., 2013).
Figure 4.19 and 4.20 showed the transcription levels of lp_2217 and lp_1247 in five strains,
both in RT+ and RT- samples. Ideally the concentration of the RT- samples should have been
zero, which would indicate that no residual genomic DNA (gDNA) after RNAase treatment.
However, there were some trace of gDNA in the RT- samples, and therefore probably also in
the RT+ samples. However, the RT- bars are much lower than the RT+ bars for all samples
where no genes are depleted. As the RT+ bars of samples depleted of lp_1247 or lp_2217 (or
both) are so low, the RT- bars cannot be much lower. Despite this, there is no doubt that
transcription of the lp_1247 or lp_2217 are repressed by dCas9 in these samples. Consequently,
the amount of residual gDNA amount does not affect the interpretation of the results.
Both Figure 4.19 and 4.20 shows that the transcription level of the genes is slightly reduced in
the pSgluc-dCas9 samples, compared to the wild type. However, the difference in copies/ng
RNA between the two control samples are not significant (p=0.09, p=0.45). As the

103
Discussion
pSgRNA_luc does not contain a 20 nt sequence complementary to the genome of L. plantarum,
it was expected that the transcription level of the targeted genes would be equal in the two
control strains. However, a discrepancy is observed, and it might be linked to growth. As
observed in Figure 4.16, there is a reduction in the growth rate for strains harbouring the
inducible dCas9-encoding plasmid, compared to the wild type strain. The genes investigated in
the transcription analysis are assumed to be involved with cell division. It is not unreasonable
to believe that the expression of cell division genes needs to be higher in bacteria rapidly
dividing, than in stressed, slower dividing bacteria. Similarly, the transcription level of lp_2217
in the strain depleted only of lp_1247, is significantly lower than in the wild type sample
(p=0.01) (Figure 4.19). Accordingly, this might be due to the slow growth of the strain (data
not shown), affecting the expression of genes encoding cell division proteins. An additional
possibility is that the genes play overlapping roles, as Stamsås et al. (2018) concluded was true
for the S. aureus proteins CozEa and CozEb. If they play overlapping roles, it is possible that
the expression of each gene is affected by the other, consequently leading to a higher or lower
expression of one gene when the other is depleted, to compensate. The transcription level of
lp_1247 of the strain only depleted of lp_2217, is significantly higher than of the wild type
(p=0.02). In samples depleted of either both genes or none of the genes, the expression of
lp_2217 appears to be moderately upregulated compared to the expression of lp_1247. This
dynamic, and the apparent high transcription of lp_1247 in the lp_2217 depleted strain, might
further imply that the two genes in some way are expressed dependently.
In the present study, dCas9 is controlled by the inducible promoter PsppA through the pSIP
expression system. It has previously been investigated how the amount of a reporter protein
produced correlated with different amounts of the peptide pheromone SppIP added to the
culture (Mathiesen et al., 2004). It was found that the protein activity increased almost linearly
when SppIP was added to a final concentration of 0.5-15 ng/mL. The maximum production of
the reporter protein was achieved at 25 ng/mL. Based on these results, the standard for induction
of cultures have become addition of SppIP to a concentration of 25 ng/mL. However,
investigating the effect of different concentrations of SppIP on the transcription level, instead
of the translation level, might provide more information about the regulatory possibilities of the
pSIP expression system. Hence, a dose response analysis was performed on L. plantarum
harbouring pSg2645-dCas9 (Figure 4.22). Cultures were induced with SppIP to concentrations
ranging from 0-25 ng/mL. As expected, the uninduced culture (0 ng/mL SppIP) showed the
highest transcription level of lp_2645. Copies/ng RNA detected in the induced cultures
104
Discussion
decreased concomitantly to increased concentration of SppIP. However, the difference in
copies/ng RNA did not decrease significantly from 1 ng/mL to the culture induced with 25
ng/mL (p=0.63).
Sørvig et al. (2005a) concluded that the pSIP system is suitable for overexpression of
heterologous proteins. This is an advantageous property when expressing the dCas9 protein,
however, it has also been shown that the pSIP-regulatory promoter PsppIP displays some activity
under non-inducing conditions (Nguyen et al., 2011; Risøen et al., 2000). The leakiness of the
pSIP system is clearly displayed in Figure 4.23, comparing the L. plantarum strains harbouring
pSg2645-dCas9 with the wild type strain and the strain harbouring pSgluc-dCas9. The number
of copies/ng RNA decreases by 94% from the wild type to the uninduced sample of L.
plantarum harbouring pSg2645-dCas9. In assays measuring the ability of the expression system
to overexpress heterologous proteins, as was performed by Sørvig et al. (2005a), the activity of
the PsppIP promoter in non-inducing conditions is not an issue, as it only leads to higher
expression of the protein. In the present study however, it was desirable to utilize the pSIP
system as a control switch of the CRISPR/dCas9 system. Therefore, the leakiness of the system
poses a problem. The results from transcriptional analysis of lp_2645 by ddPCR indicate that it
is difficult to regulate the CRISPR/dCas9 system in respect to number of transcripts of the target
gene.
5.8 CRISPR/Cas9 assisted genome modification of L. plantarum
After developing the CRISPR/dCas9 system, attempts were made to develop the CRISPR/Cas9
and CRISPR/Cas9D10A systems. Both gene editing and gene exchange was attempted with both
double-strand breaking Cas9 and single-strand breaking Cas9D10A. Analogous to dCas9, the
genes encoding these proteins were under the control of the pSIP system. Ultimately, the gene
exchange method was meant to mediate genome integration of constitutively expressed
antigens. As the construction of the constitutive vectors were unsuccessful, proof-of-concept
experiments were conducted with NucA.
Double- or single-stranded DNA break are normally repaired through the nonhomologous end
joining pathway (NHEJ). This repair pathway is an error-prone mechanism, resulting in
insertions or deletions of nucleotides of variable size. The mutations can cause a frameshift,
which results in disruption of the gene. In the present study, the target gene lp_2645 was
selected to test the ability of Cas9 and Cas9D10A to mediate genomic modifications in L.

105
Discussion
plantarum. The lp_2645 gene is an ideal target since it is not an essential gene, but at the same
time will an out of frame mutation result in a characteristic phenotype. L. plantarum had to
undergo two consecutive transformations in order to obtain a complete CRISPR/Cas9 system,
containing both Cas9 protein and the SgRNA. The survival of the bacteria following the second
transformation, of the SgRNA plasmid, was poor. Only five colonies combined appeared on
several plates. The survival of the bacteria harbouring the CRISPR/Cas9D10A system was good,
as >100 colonies appeared on the plates. In both colonies containing CRISPR/Cas9 and
CRIPSR/Cas9D10A the observed phenotype was similar to that observed when using dCas9 for
depletion of the gene (Figure 4.25D). All colonies sent for DNA sequencing still exhibited the
wild type lp_2645 sequence. Poor transformation and editing efficiency for strains harbouring
the double-strand breaking Cas9 has previously been detected in experiments performed on
other lactobacilli. A study performed in Lactobacillus casei by Song, X. et al. (2017) increased
the mutation efficiency from no mutants with Cas9 to an efficiency of 65% with Cas9D10A,
following promoter optimisations. In the present study, neither of the Cas9 or Cas9D10A
introduced mutations in the genome. Song and co-workers suggested that Cas9 breaks the DNA,
but that bacteria fails to repair it, which might be true for double-stranded break in L. plantarum
as well. Perhaps is a single-stranded break more rapidly detected by the repair system compared
to double-stranded breaks, although double-stranded breaks might be more lethal to the
bacteria, allowing bacteria harbouring CRISPR/Cas9D10A to grow faster than those harbouring
CRISPR/Cas9. Assuming that is true, the breaks are most likely repaired through another
repairing mechanism than NHEJ, as no mutations were detected. The error-prone NHEJ is
probably only utilized in the absent of a homologous DNA template (Yeeles & Dillingham,
2010).
As the NHEJ activity can be poor in some bacteria (van Pijkeren & Britton, 2014), a new
SgRNA plasmid was constructed for exploitation of the homology directed repair (HDR)
mechanism. The SgRNA plasmid contained regions with homology to the genome of L.
plantarum (Figure 4.15), and can therefore be utilized by the bacteria as a repair template
following double- or single-stranded breaks. Unlike the error-prone NHEJ, HDR utilize precise
repair of the DNA. As a proof-of-concept experiment, lp_2645 was attempted replaced with a
gene encoding the reporter protein NucA, without a promoter. The experiment was performed
in order to establish a method for integration of heterologous genes, and eventually it is
desirable to perform integration of the tuberculosis antigens into to genome of L. plantarum. A
fragment was constructed through PCR, consisting of the NucA gene flanked by 1000 bp on
106
Discussion
each side with homology to the up- and downstream sequence of lp_2645 (homologous arms,
HA) (Figure 4.14). This fragment was ligated into the pSgRNA_2645 plasmid, obtaining
pSg2645Ha (Figure 4.15). A similar experiment was performed in L. casei by Song, X. et al.
(2017), replacing the native gene LC2W1628 with the reporter gene eGFP, where 6 out of 24
transformants was mutants. In the present study, however, the >50 colonies screened were all
wild type L. plantarum. As for the colonies obtained from editing experiments, the Δ2645 and
pSg2645-dCas9 characteristic phenotype was observed in the screened colonies.
The results obtained from attempts at gene editing and gene exchange with both Cas9 and
Cas9D10A was very similar. Fewer colonies appeared for L. plantarum harbouring CRISPR/Cas9
than those harbouring CRISPR/Cas9D10A, regardless of gene editing/exchange. Sequencing and
colony PCR revealed that all colonies contained the wild type sequence of lp_2645. However,
colonies from all experiments showed the Δ2645 characteristic phenotype. In a study conducted
by Sternberg et al. (2014) experiments with wild type Cas9 yielded identical results to those
obtained using dCas9, without cleaving the DNA, analogous to the results of the present study.
Sternberg and co-workers concluded that the Cas9:SgRNA complex only remained tightly
bound to the target DNA. The study also found that Cas9:SgRNA may remain bound to the
cleaved DNA site in vivo, and that the complex are dependent on other cellular factors for
dissociation. A study by Gong et al. (2018) showed that Cas9 had the ability to bind reversible
to the DNA, without cleaving. Another important finding of the study was that the unwinding
of the DNA is the time dependent step when DNA is cleaved by Cas9. The findings of both
Sternberg et al. (2014) and Gong et al. (2018) provides a possible explanation to how L.
plantarum harbouring the CRISPR/Cas9 system in this study could show a phenotype, as
observed in lp_2645 knock out and depleted bacteria, although the sequence had not been
edited. Sternberg and co-workers performed an assay to determine the optimal concentrations
of Cas9:SgRNA and target DNA, respectively, and to investigate the effect it had on the amount
of cleaved DNA. A maximum of 90% cleaved DNA was detected at a concentration of 50 nM
for Cas9:SgRNA, and 25 nM for target DNA. The percentage of cleaved DNA increased as the
concentration of Cas9:SgRNA increased. Song, X. et al. (2017) enhanced the number of
mutants obtained through promoter tuning. The S. pyogenes-derived promoter PCas expressing
Cas9D10A was exchanged with the stronger promoter P23. Following the promoter tuning, the
percentage of recombinant bacteria harbouring the desired mutant increased from 5% to 35%.
This indicates that sufficient expression of the Cas gene is important for efficient editing. All
Cas genes in the present study are expressed by the pSIP promoter PsppA, which should provide

107
Discussion
high expression of the protein. However, the promoter expressing the SgRNA is the P3
promoter, a strong constitutive promoter originally constructed for expression in L. lactis (Sorg
et al., 2015) and might have reduced strength in L. plantarum. A possibility is to exchange P3
with a promoter specifically constructed for high expression in L. plantarum, such as P23
utilized by Song and co-workers or the P11 promoter, to obtain higher expression of the SgRNA.
In a very recently published article, the CRISPR/Cas9 system and an exogenous recombinase
machinery was successfully utilized to perform genomic modifications in three strains of L.
plantarum: WCFS1, NIZO2877, and WJL (Leenay et al., 2018). They compared the
differences between two approaches for genome editing with Cas9. The two methods utilized
were distinguished based on how the recombination machinery was delivered to the bacteria.
While the endogenous recombination machinery was utilized in one of the approaches, the
recombinase was delivered as a single-stranded DNA recombinase in the other. In one
experiment, a point mutation was introduced into the essential rpoB gene, with 100% efficiency
for L. plantarum WCFS1 by providing the recombinase as a single-stranded DNA recombinase.
In the present study however, no exogenous recombinases were provided in order to mediate
genomic modifications, because it was desirable to keep the CRISPR/Cas9 system as simple as
possible. For the strain exploited in the present study, L. plantarum WCFS1, an endogenous
recombination machinery has previously been identified (Yang et al., 2015). To confirm the
functionality of the endogenous recombination machinery, it was exploited by Yang and co-
workers to perform homologous recombination between a heterologous double-stranded DNA
substrate and L. plantarum genomic DNA, mediated by the loxP/Cre system.
In the present study, attempts were made at replacing the ~2.3 kb gene lp_2645 with the smaller
~0.5 kb NucA. Yang et al. (2015) points out that for the endogenous L. plantarum recombination
system, recombination is more favoured when the length of the replacement is shorter than the
native sequence, because chromosome bending is preferred to substrate bending. However,
experiments conducted by Song, X. et al. (2017), investigated the correlation between deletion
size and editing efficiency. It was found that the single-strand breaking Cas9D10A mediated
deletions of 3 kb with 66% efficiency, but when the deletion size was increased to 5 kb the
system failed. Although the efficiency of introduced deletions was relatively high when the
deletion size was 3 kb, the number of transformants decreased to fewer than 10 colonies. In
comparison, the number of colonies when the deletion size was 1.1 kb is described as less than
100 colonies, and 40 colonies were screened for the mutation. This indicates that deletion size
strongly influences editing efficiency. In the present study, it was attempted to delete the entire

108
Discussion
2.3 kb gene from the genome. In further attempts, perhaps reduction of the region for gene
replacement might facilitate the insertion of NucA.
5.9 Concluding remarks and future prospects
This thesis describes the successful production and membrane anchoring of the tuberculosis
hybrid antigen Ag85B_TB10.4 (AgTB) by the inducible pSIP system in L. plantarum WCFS1.
Colonies obtained from attempts of constructing a vector for constitutive production of
membrane anchored AgTB mostly contained religated vectors. Only one colony contained the
insert, but had a mutation in -35 box of the promoter P5. As problems emerged only in the
attempts of constructing the constitutive vectors, it indicates that the constitutive promoter P5
was functional in the subcloning strain E. coli, and that the production of AgTB was toxic. A
solution could be to utilize a different subcloning strain, such as L. lactis. L. lactis has been
utilized for production of antigens previously, although not with the same promoters as those
utilized in the present study.
One of the goals of this study was to develop the CRISPR/Cas9 system in L. plantarum, to
mediate integration of AgTB into the genome of the bacteria. As the construction of vectors for
constitutive production of AgTB failed, only proof-of-concept experiments was conducted to
develop the CRISRP/Cas9 system in L. plantarum. However, if construction of constitutive
expression systems of AgTB continues to be a problem, another possibility is to integrate AgTB
into the genome directly downstream of a native constitutive promoter, such as the promoter
controlling production of thymidylate synthase.
The CRISPR/Cas9 system was implemented as a two-plasmid system, and strains of L.
plantarum harbouring the two plasmids were obtained. Plasmids encoding either the double-
strand breaking Cas9 or the single-strand breaking Cas9D10A was constructed, as well as one
plasmid only producing the SgRNA and separate plasmid both producing the SgRNA and
harbouring a repair template. In total, this resulted in two different systems for gene editing
through NHEJ (pSg2645-Cas9 and pSg2645-Cas9D10A), and two systems for gene exchange
through HDR (pSg2645Ha-Cas9 and pSg2645Ha-Cas9D10A). All four systems were utilized to
target the lp_2645 gene, and resulted in colonies displaying the same phenotype as observed
for the L. plantarum Δ2645. However, none of the colonies had undergone genomic
modification, and when grown in MRS without antibiotics for plasmid curing, the phenotype

109
Discussion
reversed into the wild type phenotype. These observations strongly indicate that the
Cas9/Cas9D10A proteins are able to bind to the target DNA in L. plantarum without cutting.
Several strategies should be further explored to develop a successful CRISPR/Cas9 system for
genomic modification in L. plantarum. One strategy is promoter tuning of the SgRNA plasmid.
A possible replacement for the strong, synthetic L. lactis promoter P3 could be the strong,
synthetic L. plantarum promoter P11. In the present study, the Cas genes are expressed through
the pSIP system, which leads to high expression. Therefore, promoter tuning might not be as
important for this component. Another strategy for successful gene exchange is to reduce the
region of the genome to be exchanged, as reduced efficiency of gene exchange has been
observed with increased deletion size (Song, X. et al., 2017) . A third strategy to explore in
order to obtain successful genome modification, is to overexpress the L. plantarum endogenous
recombination machinery, or introduce an exogenous recombinase such as RecT, to facilitate
homologous recombination equivalent to Leenay et al. (2018) .
The CRISPR/dCas9 system was successfully developed in the present study. The system was
characterized using microscopy analyses for detecting morphological changes, and ddPCR to
investigate the effect on the transcription level. Depletion of lp_2645 in L. plantarum revealed
a significant change in the morphology, while depletion of lp_1247 and lp_2217 did not.
Importantly, the transcription of the two genes was drastically reduced when the
CRISPR/dCas9 system targeting the genes was present, indicating functionality of the
CRISPR/dCas9 system despite no detected changes of morphology.

110
References
6 References
Antelmann, H., Darmon, E., Noone, D., Veening, J.-W., Westers, H., Bron, S., Kuipers, O. P.,
Devine, K. M., Hecker, M. & Van Dijl, J. M. (2003). The extracellular proteome of
Bacillus subtilis under secretion stress conditions. Molecular Microbiology, 49 (1): 143-
156. doi: doi:10.1046/j.1365-2958.2003.03565.x.
Armitige, L. Y., Jagannath, C., Wanger, A. R. & Norris, S. J. (2000). Disruption of the genes
encoding antigen 85A and antigen 85B of Mycobacterium tuberculosis H37Rv: effect
on growth in culture and in macrophages. Infection and Immunity, 68 (2): 767-78.
Aukrust, T. W., Brurberg, M. B. & Nes, I. F. (1995). Transformation of Lactobacillus by
Electroporation. In Nickoloff, J. A. (ed.) Electroporation Protocols for
Microorganisms, pp. 201-208. Totowa, NJ: Humana Press.
Balchin, D., Hayer-Hartl, M. & Hartl, F. U. (2016). In vivo aspects of protein folding and
quality control. Science, 353 (6294): aac4354. doi: 10.1126/science.aac4354.
Baldridge, G. D., Burkhardt, N. Y., Labruna, M. B., Pacheco, R. C., Paddock, C. D.,
Williamson, P. C., Billingsley, P. M., Felsheim, R. F., Kurtti, T. J. & Munderloh, U. G.
(2010). Wide Dispersal and Possible Multiple Origins of Low-Copy-Number Plasmids
in Rickettsia Species Associated with Blood-Feeding Arthropods. Applied and
Environmental Microbiology, 76 (6): 1718. doi: 10.1128/AEM.02988-09.
Bermudez-Humaran, L. G., Cortes-Perez, N. G., Lefevre, F., Guimaraes, V., Rabot, S., Alcocer-
Gonzalez, J. M., Gratadoux, J. J., Rodriguez-Padilla, C., Tamez-Guerra, R. S., Corthier,
G., et al. (2005). A novel mucosal vaccine based on live Lactococci expressing E7
antigen and IL-12 induces systemic and mucosal immune responses and protects mice
against human papillomavirus type 16-induced tumors. Journal of Immunology, 175
(11): 7297-302.
Bolhuis, A., Tjalsma, H., Smith, H. E., de Jong, A., Meima, R., Venema, G., Bron, S. & van
Dijl, J. M. (1999). Evaluation of Bottlenecks in the Late Stages of Protein Secretion in
Bacillus subtilis. Applied and Environmental Microbiology, 65 (7): 2934-2941.
Braat, H., Rottiers, P., Hommes, D. W., Huyghebaert, N., Remaut, E., Remon, J. P., van
Deventer, S. J., Neirynck, S., Peppelenbosch, M. P. & Steidler, L. (2006). A phase I trial
with transgenic bacteria expressing interleukin-10 in Crohn's disease. Clinical
Gastroenterology Hepatology, 4 (6): 754-9. doi: 10.1016/j.cgh.2006.03.028.
Bron, P. A., Grangette, C., Mercenier, A., de Vos, W. M. & Kleerebezem, M. (2004).
Identification of Lactobacillus plantarum genes that are induced in the gastrointestinal
tract of mice. Journal of bacteriology, 186 (17): 5721-5729. doi:
10.1128/JB.186.17.5721-5729.2004.
Chen, C., Lu, Y., Wang, L., Yu, H. & Tian, H. (2018). CcpA-Dependent Carbon Catabolite
Repression Regulates Fructooligosaccharides Metabolism in Lactobacillus plantarum.
Frontiers in Microbiology, 9 (1114). doi: 10.3389/fmicb.2018.01114.
Crum-Cianflone, N. F. & Sullivan, E. (2017). Vaccinations for the HIV-Infected Adult: A
Review of the Current Recommendations, Part II. Infectious diseases and therapy, 6
(3): 333-361. doi: 10.1007/s40121-017-0165-y.
de Vos, W. M. (2011). Systems solutions by lactic acid bacteria: from paradigms to practice.
Microbial Cell Factories, 10 (1): S2. doi: 10.1186/1475-2859-10-s1-s2.
de Vries, M. C., Vaughan, E. E., Kleerebezem, M. & de Vos, W. M. (2006). Lactobacillus
plantarum—survival, functional and potential probiotic properties in the human
intestinal tract. International Dairy Journal, 16 (9): 1018-1028. doi:
https://doi.org/10.1016/j.idairyj.2005.09.003.

111
References
Deltcheva, E., Chylinski, K., Sharma, C. M., Gonzales, K., Chao, Y., Pirzada, Z. A., Eckert, M.
R., Vogel, J. & Charpentier, E. (2011). CRISPR RNA maturation by trans-encoded
small RNA and host factor RNase III. Nature, 471 (7340): 602-7. doi:
10.1038/nature09886.
Desvaux, M., Dumas, E., Chafsey, I. & Hebraud, M. (2006). Protein cell surface display in
Gram-positive bacteria: from single protein to macromolecular protein structure. FEMS
Microbiology Letters, 256 (1): 1-15. doi: 10.1111/j.1574-6968.2006.00122.x.
Desvaux, M., Hébraud, M., Talon, R. & Henderson, I. R. (2009). Secretion and subcellular
localizations of bacterial proteins: a semantic awareness issue. Trends in Microbiology,
17 (4): 139-145. doi: https://doi.org/10.1016/j.tim.2009.01.004.
Diep, D. B., Mathiesen, G., Eijsink, V. G. & Nes, I. F. (2009). Use of lactobacilli and their
pheromone-based regulatory mechanism in gene expression and drug delivery. Current
Pharmaceutical Biotechnology, 10 (1): 62-73.
Dietrich, J., Aagaard, C., Leah, R., Olsen, A. W., Stryhn, A., Doherty, T. M. & Andersen, P.
(2005). Exchanging ESAT6 with TB10.4 in an Ag85B Fusion Molecule-Based
Tuberculosis Subunit Vaccine: Efficient Protection and ESAT6-Based Sensitive
Monitoring of Vaccine Efficacy. The Journal of Immunology, 174 (10): 6332-6339. doi:
10.4049/jimmunol.174.10.6332.
Doron, S. & Snydman, D. R. (2015). Risk and safety of probiotics. Clinical infectious diseases
: an official publication of the Infectious Diseases Society of America, 60 Suppl 2 (Suppl
2): S129-S134. doi: 10.1093/cid/civ085.
Driessen, A. J. & Nouwen, N. (2008). Protein translocation across the bacterial cytoplasmic
membrane. Annual Review of Biochemistry, 77: 643-67. doi:
10.1146/annurev.biochem.77.061606.160747.
Fenton, A. K., El Mortaji, L., Lau, D. T., Rudner, D. Z. & Bernhardt, T. G. (2016). CozE is a
member of the MreCD complex that directs cell elongation in Streptococcus
pneumoniae. Nature Microbiology, 2: 16237. doi: 10.1038/nmicrobiol.2016.237.
Fredriksen, L., Mathiesen, G., Sioud, M. & Eijsink, V. G. (2010). Cell wall anchoring of the
37-kilodalton oncofetal antigen by Lactobacillus plantarum for mucosal cancer vaccine
delivery. Applied Environmental Microbiology, 76 (21): 7359-62. doi:
10.1128/aem.01031-10.
Fredriksen, L., Kleiveland, C. R., Hult, L. T., Lea, T., Nygaard, C. S., Eijsink, V. G. &
Mathiesen, G. (2012). Surface display of N-terminally anchored invasin by
Lactobacillus plantarum activates NF-kappaB in monocytes. Applied Environmental
Microbiology, 78 (16): 5864-71. doi: 10.1128/aem.01227-12.
Gong, S., Yu, H. H., Johnson, K. A. & Taylor, D. W. (2018). DNA Unwinding Is the Primary
Determinant of CRISPR-Cas9 Activity. Cell Reports, 22 (2): 359-371. doi:
10.1016/j.celrep.2017.12.041.
Grissa, I., Vergnaud, G. & Pourcel, C. (2007). The CRISPRdb database and tools to display
CRISPRs and to generate dictionaries of spacers and repeats. BMC Bioinformatics, 8:
172. doi: 10.1186/1471-2105-8-172.
Haft, D. H., Selengut, J., Mongodin, E. F. & Nelson, K. E. (2005). A guild of 45 CRISPR-
associated (Cas) protein families and multiple CRISPR/Cas subtypes exist in
prokaryotic genomes. PLOS Computational Biology, 1 (6): e60. doi:
10.1371/journal.pcbi.0010060.
Hermans, P. W., van Soolingen, D., Bik, E. M., de Haas, P. E., Dale, J. W. & van Embden, J.
D. (1991). Insertion element IS987 from Mycobacterium bovis BCG is located in a hot-
spot integration region for insertion elements in Mycobacterium tuberculosis complex
strains. Infection and Immunity, 59 (8): 2695-705.

112
References
Hindson, C. M., Chevillet, J. R., Briggs, H. A., Gallichotte, E. N., Ruf, I. K., Hindson, B. J.,
Vessella, R. L. & Tewari, M. (2013). Absolute quantification by droplet digital PCR
versus analog real-time PCR. Nature Methods, 10: 1003. doi: 10.1038/nmeth.2633
Hiom, K. (2009). DNA Repair: Common Approaches to Fixing Double-Strand Breaks. Current
Biology, 19 (13): R523-R525. doi: https://doi.org/10.1016/j.cub.2009.06.009.
Ishino, Y., Shinagawa, H., Makino, K., Amemura, M. & Nakata, A. (1987). Nucleotide
sequence of the iap gene, responsible for alkaline phosphatase isozyme conversion in
Escherichia coli, and identification of the gene product. Journal of Bacteriology, 169
(12): 5429-33.
Jansen, R., Embden, J. D., Gaastra, W. & Schouls, L. M. (2002). Identification of genes that
are associated with DNA repeats in prokaryotes. Molecular Microbiology, 43 (6): 1565-
75.
Jensen, H., Grimmer, S., Naterstad, K. & Axelsson, L. (2012). In vitro testing of commercial
and potential probiotic lactic acid bacteria. International Journal of Food Microbiology,
153 (1): 216-222. doi: https://doi.org/10.1016/j.ijfoodmicro.2011.11.020.
Jiang, W., Bikard, D., Cox, D., Zhang, F. & Marraffini, L. A. (2013). RNA-guided editing of
bacterial genomes using CRISPR-Cas systems. Nature Biotechnology, 31 (3): 233-9.
doi: 10.1038/nbt.2508.
Jinek, M., Chylinski, K., Fonfara, I., Hauer, M., Doudna, J. A. & Charpentier, E. (2012). A
programmable dual-RNA-guided DNA endonuclease in adaptive bacterial immunity.
Science, 337 (6096): 816-21. doi: 10.1126/science.1225829.
Jinek, M., Jiang, F., Taylor, D. W., Sternberg, S. H., Kaya, E., Ma, E., Anders, C., Hauer, M.,
Zhou, K., Lin, S., et al. (2014). Structures of Cas9 endonucleases reveal RNA-mediated
conformational activation. Science, 343 (6176): 1247997. doi:
10.1126/science.1247997.
Jones, K. L., Kim, S. W. & Keasling, J. D. (2000). Low-copy plasmids can perform as well as
or better than high-copy plasmids for metabolic engineering of bacteria. Metabolic
engineering, 2 (4): 328. doi: 10.1006/mben.2000.0161.
Kandler, O. (1983). Carbohydrate metabolism in lactic acid bacteria. Antonie van Leeuwenhoek,
49 (3): 209-224. doi: 10.1007/bf00399499.
Karlskås, I. L., Maudal, K., Axelsson, L., Rud, I., Eijsink, V. G. H. & Mathiesen, G. (2014).
Heterologous Protein Secretion in Lactobacilli with Modified pSIP Vectors. PLOS
ONE, 9 (3): e91125. doi: 10.1371/journal.pone.0091125.
Kim, H. & Kim, J.-S. (2014). A guide to genome engineering with programmable nucleases.
Nature Reviews Genetics, 15: 321. doi: 10.1038/nrg3686.
Kleerebezem, M., Boekhorst, J., van Kranenburg, R., Molenaar, D., Kuipers, O. P., Leer, R.,
Tarchini, R., Peters, S. A., Sandbrink, H. M., Fiers, M. W. E. J., et al. (2003). Complete
genome sequence of Lactobacillus plantarum WCFS1. Proceedings of the National
Academy of Sciences, 100 (4): 1990-1995. doi: 10.1073/pnas.0337704100.
Kleerebezem, M., Hols, P., Bernard, E., Rolain, T., Zhou, M., Siezen, R. J. & Bron, P. A.
(2010). The extracellular biology of the lactobacilli. FEMS Microbiology Review, 34
(2): 199-230. doi: 10.1111/j.1574-6976.2010.00208.x.
Kou, Y., Wan, M., Shi, W., Liu, J., Zhao, Z., Xu, Y., Wei, W., Sun, B., Gao, F., Cai, L., et al.
(2018). Performance of Homologous and Heterologous Prime-Boost Immunization
Regimens of Recombinant Adenovirus and Modified Vaccinia Virus Ankara
Expressing an Ag85B-TB10.4 Fusion Protein against Mycobacterium tuberculosis.
Journal of Microbiology and Biotechnology, 28 (6): 1022-1029. doi:
10.4014/jmb.1712.12064.

113
References
Kuczkowska, K., Mathiesen, G., Eijsink, V. G. H. & Øynebråten, I. (2015). Lactobacillus
plantarum displaying CCL3 chemokine in fusion with HIV-1 Gag derived antigen
causes increased recruitment of T cells. Microbial Cell Factories, 14 (1): 169. doi:
10.1186/s12934-015-0360-z.
Kuczkowska, K., Kleiveland, C. R., Minic, R., Moen, L. F., Øverland, L., Tjåland, R., Carlsen,
H., Lea, T., Mathiesen, G. & Eijsink, V. G. H. (2016). Immunogenic Properties of
Lactobacillus plantarum Producing Surface-Displayed Mycobacterium tuberculosis
Antigens. Applied and environmental microbiology, 83 (2): e02782-16. doi:
10.1128/AEM.02782-16.
Kuczkowska, K., Myrbråten, I., Øverland, L., Eijsink, V. G. H., Follmann, F., Mathiesen, G. &
Dietrich, J. (2017). Lactobacillus plantarum producing a Chlamydia trachomatis
antigen induces a specific IgA response after mucosal booster immunization. PLOS
ONE, 12 (5): e0176401. doi: 10.1371/journal.pone.0176401.
Kuipers, O. P., Beerthuyzen, M. M., de Ruyter, P. G., Luesink, E. J. & de Vos, W. M. (1995).
Autoregulation of nisin biosynthesis in Lactococcus lactis by signal transduction.
Journal of Biological Chemistry, 270 (45): 27299-304.
Lambert, J. M., Bongers, R. S. & Kleerebezem, M. (2007). Cre-lox-based system for multiple
gene deletions and selectable-marker removal in Lactobacillus plantarum. Applied and
environmental microbiology, 73 (4): 1126-1135. doi: 10.1128/AEM.01473-06.
Leenay, R. T., Vento, J. M., Shah, M., Martino, M. E., Leulier, F. & Beisel, C. L. (2018).
Genome Editing with CRISPR-Cas9 in Lactobacillus plantarum Revealed That Editing
Outcomes Can Vary Across Strains and Between Methods. Biotechnology Journal:
e1700583. doi: 10.1002/biot.201700583.
Lulko, A. T., Veening, J.-W., Buist, G., Smits, W. K., Blom, E. J., Beekman, A. C., Bron, S. &
Kuipers, O. P. (2007). Production and secretion stress caused by overexpression of
heterologous alpha-amylase leads to inhibition of sporulation and a prolonged motile
phase in Bacillus subtilis. Applied and environmental microbiology, 73 (16): 5354-
5362. doi: 10.1128/AEM.00472-07.
Maizels, N. (2013). Genome engineering with Cre-loxP. Journal of immunology, 191 (1): 5-6.
doi: 10.4049/jimmunol.1301241.
Makarova, K., Slesarev, A., Wolf, Y., Sorokin, A., Mirkin, B., Koonin, E., Pavlov, A., Pavlova,
N., Karamychev, V., Polouchine, N., et al. (2006). Comparative genomics of the lactic
acid bacteria. Proceedings of the National Academy of Sciences, 103 (42): 15611-
15616. doi: 10.1073/pnas.0607117103.
Makarova, K. S., Aravind, L., Grishin, N. V., Rogozin, I. B. & Koonin, E. V. (2002). A DNA
repair system specific for thermophilic Archaea and bacteria predicted by genomic
context analysis. Nucleic Acids Research, 30 (2): 482-96.
Mathiesen, G., Sørvig, E., Blatny, J., Naterstad, K., Axelsson, L. & Eijsink, V. G. H. (2004).
High-level gene expression in Lactobacillus plantarum using a pheromone-regulated
bacteriocin promoter. Letters in Applied Microbiology, 39 (2): 137-143. doi:
doi:10.1111/j.1472-765X.2004.01551.x.
Mathiesen, G., Sveen, A., Piard, J. C., Axelsson, L. & Eijsink, V. G. (2008). Heterologous
protein secretion by Lactobacillus plantarum using homologous signal peptides.
Journal of Applied Microbiology, 105 (1): 215-26. doi: 10.1111/j.1365-
2672.2008.03734.x.
Mathiesen, G., Sveen, A., Brurberg, M. B., Fredriksen, L., Axelsson, L. & Eijsink, V. G. H.
(2009). Genome-wide analysis of signal peptide functionality in Lactobacillus
plantarum WCFS1. BMC Genomics, 10 (1): 425. doi: 10.1186/1471-2164-10-425.
114
References
Michon, C., Langella, P., Eijsink, V. G., Mathiesen, G. & Chatel, J. M. (2016). Display of
recombinant proteins at the surface of lactic acid bacteria: strategies and applications.
Microbial Cell Factories, 15: 70. doi: 10.1186/s12934-016-0468-9.
Mierau, I. & Kleerebezem, M. (2005). 10 years of the nisin-controlled gene expression system
(NICE) in Lactococcus lactis. Applied Microbiology and Biotechnology, 68 (6): 705-
717. doi: 10.1007/s00253-005-0107-6.
Mohamadzadeh, M., Duong, T., Sandwick, S. J., Hoover, T. & Klaenhammer, T. R. (2009).
Dendritic cell targeting of Bacillus anthracis protective antigen expressed by
Lactobacillus acidophilus protects mice from lethal challenge. Proceedings of the
National Academy of Sciences, 106 (11): 4331-4336. doi: 10.1073/pnas.0900029106.
Mojica, F. J., Ferrer, C., Juez, G. & Rodriguez-Valera, F. (1995). Long stretches of short tandem
repeats are present in the largest replicons of the Archaea Haloferax mediterranei and
Haloferax volcanii and could be involved in replicon partitioning. Molecular
Microbiology, 17 (1): 85-93.
Molenaar, D., Bringel, F., Schuren, F. H., de Vos, W. M., Siezen, R. J. & Kleerebezem, M.
(2005). Exploring Lactobacillus plantarum genome diversity by using microarrays.
Journal of Bacteriology, 187 (17): 6119-27. doi: 10.1128/jb.187.17.6119-6127.2005.
Nakata, A., Amemura, M. & Makino, K. (1989). Unusual nucleotide arrangement with repeated
sequences in the Escherichia coli K-12 chromosome. Journal of Bacteriology, 171 (6):
3553-6.
Nelson, K. E., Clayton, R. A., Gill, S. R., Gwinn, M. L., Dodson, R. J., Haft, D. H., Hickey, E.
K., Peterson, J. D., Nelson, W. C., Ketchum, K. A., et al. (1999). Evidence for lateral
gene transfer between Archaea and bacteria from genome sequence of Thermotoga
maritima. Nature, 399 (6734): 323-9. doi: 10.1038/20601.
Neutra, M. R. & Kozlowski, P. A. (2006). Mucosal vaccines: the promise and the challenge.
Nature Review Immunology, 6 (2): 148-58. doi: 10.1038/nri1777.
Nguyen, H.-M., Mathiesen, G., Stelzer, E. M., Pham, M. L., Kuczkowska, K., Mackenzie, A.,
Agger, J. W., Eijsink, V. G. H., Yamabhai, M., Peterbauer, C. K., et al. (2016). Display
of a β-mannanase and a chitosanase on the cell surface of Lactobacillus plantarum
towards the development of whole-cell biocatalysts. Microbial Cell Factories, 15 (1):
169. doi: 10.1186/s12934-016-0570-z.
Nguyen, T.-T., Nguyen, T.-H., Maischberger, T., Schmelzer, P., Mathiesen, G., Eijsink, V. G.,
Haltrich, D. & Peterbauer, C. K. (2011). Quantitative transcript analysis of the inducible
expression system pSIP: comparison of the overexpression of Lactobacillus spp. β-
galactosidases in Lactobacillus plantarum. Microbial cell factories, 10: 46-46. doi:
10.1186/1475-2859-10-46.
Nieuwenhuizen, N. E., Kulkarni, P. S., Shaligram, U., Cotton, M. F., Rentsch, C. A., Eisele, B.,
Grode, L. & Kaufmann, S. H. E. (2017). The Recombinant Bacille Calmette–Guérin
Vaccine VPM1002: Ready for Clinical Efficacy Testing. Frontiers in Immunology, 8:
1147. doi: 10.3389/fimmu.2017.01147.
Oh, J. H. & van Pijkeren, J. P. (2014). CRISPR-Cas9-assisted recombineering in Lactobacillus
reuteri. Nucleic Acids Research, 42 (17): e131. doi: 10.1093/nar/gku623.
Okkels, L. M. & Andersen, P. (2004). Protein-protein interactions of proteins from the ESAT-
6 family of Mycobacterium tuberculosis. Journal of Bacteriology, 186 (8): 2487-91.
Paul, E., Albert, A., Ponnusamy, S., Venkatesan, S. & Govindan Sadasivam, S. (2018).
Chromosomal integration of heterologous oxalate decarboxylase in Lactobacillus
plantarum WCFS1 using mobile genetic element Ll.LtrB. Archives of Microbiology.
doi: 10.1007/s00203-018-1585-0.

115
References
Pinho, M. G., Kjos, M. & Veening, J. W. (2013). How to get (a)round: mechanisms controlling
growth and division of coccoid bacteria. Nat Rev Microbiol, 11 (9): 601-14. doi:
10.1038/nrmicro3088.
Risøen, P. A., Brurberg, M. B., Eijsink, V. G. H. & Nes, I. F. (2000).
Functional analysis of promoters involved in quorum sensing-based regulation of bacteriocin
production in Lactobacillus. Molecular Microbiology, 37 (3): 619-628. doi:
10.1046/j.1365-2958.2000.02029.x.
Rossi, A., Kontarakis, Z., Gerri, C., Nolte, H., Holper, S., Kruger, M. & Stainier, D. Y. (2015).
Genetic compensation induced by deleterious mutations but not gene knockdowns.
Nature, 524 (7564): 230-3. doi: 10.1038/nature14580.
Rud, I., Jensen, P. R., Naterstad, K. & Axelsson, L. (2006). A synthetic promoter library for
constitutive gene expression in Lactobacillus plantarum. Microbiology, 152 (Pt 4):
1011-9. doi: 10.1099/mic.0.28599-0.
Russell, D. G., Barry, C. E. & Flynn, J. L. (2010). Tuberculosis: What We Don't Know Can,
and Does, Hurt Us. Science, 328 (5980): 852-856. doi: 10.1126/science.1184784.
Sampson, T. R., Saroj, S. D., Llewellyn, A. C., Tzeng, Y. L. & Weiss, D. S. (2013). A
CRISPR/Cas system mediates bacterial innate immune evasion and virulence. Nature,
497 (7448): 254-7. doi: 10.1038/nature12048.
Sander, J. D. & Joung, J. K. (2014). CRISPR-Cas systems for editing, regulating and targeting
genomes. Nature Biotechnology, 32: 347. doi: 10.1038/nbt.2842.
Sartori, A. M. (2004). A review of the varicella vaccine in immunocompromised individuals.
International Journal of Infectious Diseases, 8 (5): 259-70. doi:
10.1016/j.ijid.2003.09.006.
Sasikumar, P., Gomathi, S., Anbazhagan, K., Baby, A. E., Sangeetha, J. & Selvam, G. S. (2014).
Genetically engineered Lactobacillus plantarum WCFS1 constitutively secreting
heterologous oxalate decarboxylase and degrading oxalate under in vitro. Current
Microbiology, 69 (5): 708-15. doi: 10.1007/s00284-014-0644-2.
Song, A. A.-L., In, L. L. A., Lim, S. H. E. & Rahim, R. A. (2017). A review on Lactococcus
lactis: from food to factory. Microbial Cell Factories, 16 (1): 55. doi: 10.1186/s12934-
017-0669-x.
Song, X., Huang, H., Xiong, Z., Ai, L. & Yang, S. (2017). CRISPR-Cas9(D10A) Nickase-
Assisted Genome Editing in Lactobacillus casei. Applied Environmental Microbiology,
83 (22). doi: 10.1128/aem.01259-17.
Sorek, R., Kunin, V. & Hugenholtz, P. (2008). CRISPR--a widespread system that provides
acquired resistance against phages in bacteria and archaea. Nature Review
Microbiology, 6 (3): 181-6. doi: 10.1038/nrmicro1793.
Sorg, R. A., Kuipers, O. P. & Veening, J.-W. (2015). Gene Expression Platform for Synthetic
Biology in the Human Pathogen Streptococcus pneumoniae. ACS Synthetic Biology, 4
(3): 228-239. doi: 10.1021/sb500229s.
Stamsås, G. A., Myrbråten, I. S., Straume, D., Salehian, Z., Veening, J.-W., Håvarstein, L. S.
& Kjos, M. (2018). CozEa and CozEb play overlapping and essential roles in controlling
cell division in Staphylococcus aureus. Molecular Microbiology, 109 (5): 615-632. doi:
10.1111/mmi.13999.
Steidler, L., Neirynck, S., Huyghebaert, N., Snoeck, V., Vermeire, A., Goddeeris, B., Cox, E.,
Remon, J. P. & Remaut, E. (2003). Biological containment of genetically modified
Lactococcus lactis for intestinal delivery of human interleukin 10. Nature
Biotechnology, 21 (7): 785-9. doi: 10.1038/nbt840.
Sternberg, S. H., Redding, S., Jinek, M., Greene, E. C. & Doudna, J. A. (2014). DNA
interrogation by the CRISPR RNA-guided endonuclease Cas9. Nature, 507: 62. doi:
10.1038/nature13011

116
References
Su, T., Liu, F., Gu, P., Jin, H., Chang, Y., Wang, Q., Liang, Q. & Qi, Q. (2016). A CRISPR-
Cas9 Assisted Non-Homologous End-Joining Strategy for One-step Engineering of
Bacterial Genome. Scientific Reports, 6: 37895. doi: 10.1038/srep37895.
Sun, Z., Harris, H. M. B., McCann, A., Guo, C., Argimón, S., Zhang, W., Yang, X., Jeffery, I.
B., Cooney, J. C., Kagawa, T. F., et al. (2015). Expanding the biotechnology potential
of lactobacilli through comparative genomics of 213 strains and associated genera.
Nature Communications, 6: 8322. doi: 10.1038/ncomms9322.
Sutcliffe, I. C. & Harrington, D. J. (2002). Pattern searches for the identification of putative
lipoprotein genes in Gram-positive bacterial genomes. Microbiology, 148 (Pt 7): 2065-
77. doi: 10.1099/00221287-148-7-2065.
Sørvig, E., Grönqvist, S., Naterstad, K., Mathiesen, G., Eijsink, V. G. H. & Axelsson, L. (2003).
Construction of vectors for inducible gene expression in Lactobacillus sakei and
Lactobacillus plantarum. FEMS Microbiology Letters, 229 (1): 119-126. doi:
10.1016/S0378-1097(03)00798-5.
Sørvig, E., Mathiesen, G., Naterstad, K., Eijsink, V. G. H. & Axelsson, L. (2005a). High-level,
inducible gene expression in Lactobacillus sakei and Lactobacillus plantarum using
versatile expression vectors. Microbiology, 151 (7): 2439-2449. doi:
doi:10.1099/mic.0.28084-0.
Sørvig, E., Skaugen, M., Naterstad, K., Eijsink, V. G. H. & Axelsson, L. (2005b). Plasmid p256
from Lactobacillus plantarum represents a new type of replicon in lactic acid bacteria,
and contains a toxin–antitoxin-like plasmid maintenance system. Microbiology, 151 (2):
421-431. doi: doi:10.1099/mic.0.27389-0.
Tauer, C., Heinl, S., Egger, E., Heiss, S. & Grabherr, R. (2014). Tuning constitutive
recombinant gene expression in Lactobacillus plantarum. Microbial Cell Factories, 13
(1): 150. doi: 10.1186/s12934-014-0150-z.
Tenaillon, O., Denamur, E. & Matic, I. (2004). Evolutionary significance of stress-induced
mutagenesis in bacteria. Trends in Microbiology, 12 (6): 264-270. doi:
https://doi.org/10.1016/j.tim.2004.04.002.
Tjåland, R. (2011). Secretion and anchoring of Mycobacterium tuberculosis antigens in
Lactobacillus plantarum. Ås: Norwegian University of Life Sciences.
Toussaint, B., Chauchet, X., Wang, Y., Polack, B. & Gouëllec, A. L. (2013). Live-attenuated
bacteria as a cancer vaccine vector, 12: Taylor & Francis. pp. 1139-1154.
van der Els, S., James, J. K., Kleerebezem, M. & Bron, P. A. (2018). Versatile Cas9-Driven
Subpopulation Selection Toolbox for Lactococcus lactis. Applied and Environmental
Microbiology, 84 (8). doi: 10.1128/aem.02752-17.
van Pijkeren, J. P. & Britton, R. A. (2014). Precision genome engineering in lactic acid bacteria.
Microbial Cell Factories, 13 (1): S10. doi: 10.1186/1475-2859-13-S1-S10.
van Roosmalen, M. L., Geukens, N., Jongbloed, J. D., Tjalsma, H., Dubois, J. Y., Bron, S., van
Dijl, J. M. & Anne, J. (2004). Type I signal peptidases of Gram-positive bacteria.
Biochimica et Biophysica Acta, 1694 (1-3): 279-97. doi: 10.1016/j.bbamcr.2004.05.006.
Watson, J. D., Baker, T. A., Bell, S. P., Gann, A. & Losick, R. (2014). Molecular Biology of
the Gene. Cold Spring Harbor, New York: Pearson.
Wegmann, U., O'Connell-Motherway, M., Zomer, A., Buist, G., Shearman, C., Canchaya, C.,
Ventura, M., Goesmann, A., Gasson, M. J., Kuipers, O. P., et al. (2007). Complete
Genome Sequence of the Prototype Lactic Acid Bacterium Lactococcus lactis MG1363.
Journal of Bacteriology, 189 (8): 3256-3270. doi: 10.1128/jb.01768-06.
Wells, J. M. & Mercenier, A. (2008). Mucosal delivery of therapeutic and prophylactic
molecules using lactic acid bacteria. Nature Review Microbiology, 6 (5): 349-62. doi:
10.1038/nrmicro1840.

117
References
Yang, B., Qi, H., Gu, Z., Zhang, H., Chen, W., Chen, H. & Chen, Y. Q. (2017). Characterization
of the triple-component linoleic acid isomerase in Lactobacillus plantarum ZS2058 by
genetic manipulation. Journal of Applied Microbiology, 123 (5): 1263-1273. doi:
doi:10.1111/jam.13570.
Yang, P., Wang, J. & Qi, Q. (2015). Prophage recombinases-mediated genome engineering in
Lactobacillus plantarum. Microbial Cell Factories, 14 (1): 154. doi: 10.1186/s12934-
015-0344-z.
Yeeles, J. T. P. & Dillingham, M. S. (2010). The processing of double-stranded DNA breaks
for recombinational repair by helicase–nuclease complexes. DNA Repair, 9 (3): 276-
285. doi: https://doi.org/10.1016/j.dnarep.2009.12.016.
Øverland, L. (2013). Secretion and anhoring of proteins in Lactobacillus plantarum: Studies of
a dendritic cell-targeted Mycobacterium tuberculosis antigen. Ås: Norwegian
Unversity of Life Sciences.

118
Appendix
7 Appendix
Figure A-1. Plasmid maps of constitutive production of AgTB. The inducible promoter PsppA of the
pLp1262_InvS backbone is replaced by A) the weak constitutive promoter P5 (orange), B) the strong constitutive
promoter P11 (purple). Downstream of the promoters is the lipo-anchored hybrid antigen Ag85B_TB10.4. The
SppK and SppR genes of the inducible system are not removed during construction of the vectors. Both vectors
contain an Erythromycin (Ery) resistance gene.
Figure A-2. Plasmid maps of constitutive production of the reporter protein NucA. Constitutive production
of A) Lp_1261 anchored NucA, B) Lp_3050 secreted NucA, C) cytoplasmic NucA. The SppK and SppR genes of

119
Appendix
the inducible system are not removed during construction of the vectors. Both vectors contain an Erythromycin
(Ery) resistance gene.

![Effect of Probiotics Lactobacillus and Bifidobacterium on ... · Bifidobacterium animalis NCIMB 702242 [27, 39, 47] Lactobacillus plantarum NCIMB 11974 [32, 41, 48, 49] Bifidobacterium](https://img.pdfslide.us/doc/110x75/5f0da2017e708231d43b51a3/effect-of-probiotics-lactobacillus-and-bifidobacterium-on-bifidobacterium-animalis.jpg)