Embed Size (px)
Citation preview
Vol.:(0123456789)1 3
Clim Dyn DOI 10.1007/s00382-017-3677-y
Implementation of a turbulent orographic form drag scheme in WRF and its application to the Tibetan Plateau
Xu Zhou1 · Kun Yang1,2,3 · Yan Wang1,4
Received: 18 September 2016 / Accepted: 20 March 2017 © Springer-Verlag Berlin Heidelberg 2017
when referring to radio sounding data. Meanwhile, the simulated precipitation with the new scheme is improved, with reduced mean bias (from 1.34 to 1.12 mm day−1) and RMSEs, which is due to the weakening of water vapor flux at low-level atmosphere with the new scheme when cross-ing the Himalayan Mountains. However, the simulation of 2-m air temperature is little improved.
Keywords Turbulent orographic form drag · Tibetan Plateau · Complex terrain · WRF
1 Introduction
Topographic drag plays an important role in atmosphere dynamical and surface boundary layer physical processes. It directly controls wind fields, which further modulate water vapor and energy transport.
Topographic drags are generally parameterized by the sub-grid-scale orographic variance in climate mod-els, which can be classified into the following two types: (1) Large-scale drags (larger than 3–5 km, Choi and Hong 2015) including gravity wave drag and blocked flow drag (Lotto and Miller 1997); and (2) Turbulent drags, includ-ing the drag from surface roughness elements and turbu-lent form drag by smaller topographic variance (within the scale of smaller than 5 km, Beljaars et al. 2004). Numer-ous efforts have been made to parameterize the sub-grid-scale orographic drag such as gravity wave drag (Boer et al. 1984; McFarlane 1987), drag owing to low-level flow blocking (Lotto and Miller 1997; Scinocca and Mcfar-lane 2000; Webster et al. 2003; Kim and Doyle 2005), and turbulence-scale orographic form drag (TOFD; Wood-ing et al. 1973; Grant and Mason 1990; Wood and Mason 1993; Wood et al. 2001; Beljaars et al. 2004). These
Abstract Sub-grid-scale orographic variation (smaller than 5 km) exerts turbulent form drag on atmospheric flows and significantly retards the wind speed. The Weather Research and Forecasting model (WRF) includes a tur-bulent orographic form drag (TOFD) scheme that adds the drag to the surface layer. In this study, another TOFD scheme has been incorporated in WRF3.7, which exerts an exponentially decaying drag from the surface layer to upper layers. To investigate the effect of the new scheme, WRF with the old scheme and with the new one was used to sim-ulate the climate over the complex terrain of the Tibetan Plateau from May to October 2010. The two schemes were evaluated in terms of the direct impact (on wind fields) and the indirect impact (on air temperature and precipita-tion). The new TOFD scheme alleviates the mean bias in the surface wind components, and clearly reduces the root mean square error (RMSEs) in seasonal mean wind speed (from 1.10 to 0.76 m s−1), when referring to the station observations. Furthermore, the new TOFD scheme also generally improves the simulation of wind profile, as char-acterized by smaller biases and RMSEs than the old one
* Xu Zhou [email protected]
1 Key Laboratory of Tibetan Environment Changes and Land Surface Processes, Institute of Tibetan Plateau Research, Chinese Academy of Sciences, Building 3, Courtyard 16, Lincui Road, Chaoyang District, Beijing 100101, China
2 Ministry of Education Key Laboratory for Earth System Modeling, Department of Earth System Science, Tsinghua University, Beijing 10084, China
3 CAS Center for Excellence in Tibetan Plateau Earth Sciences, Beijing 100101, China
4 University of Chinese Academy of Sciences, Beijing 100049, China
X. Zhou et al.
1 3
parameterizations have been applied to weather forecasts and climate simulations (e.g., Beljaars et al. 2004; Rontu 2006; Choi and Hong 2015).
In the WRF (weather research and forecasting) model (WRF3.7), sub-grid gravity wave drag and blocked flow drag are parameterized as independent dynamical processes (Kim and Arakawa 1995; Kim and Doyle 2005; Hong et al. 2008; Choi and Hong 2015), which have contributed to improvements of extratropical cyclones and other climate simulations (Hong et al. 2008; Kim 1996; Gegory et al. 1998; Choi and Hong 2015). However, the WRF still over-estimates the wind speed (especially near-surface wind) (Shimada et al. 2011; Mass and Ovens 2011).
To reduce the bias in wind speeds over complex terrain, Jimenez and Dudhia (2012) implemented a TOFD scheme (hereafter JD12 scheme) in WRF by modulating the inten-sity of the surface drag at the surface layer. However, the atmosphere at different levels should be affected by differ-ent scales of drags (Wood et al. 2001; Beljaars et al. 2004). Insufficient TOFD expression can lead to systematic biases in numerical weather prediction models and climate models (Wu and Chen 1985), especially in mountainous regions. A typical example is the Tibetan Plateau (TP), where cold and wet biases exist in almost all current climate models, such as regional climate models (Ji and Kang 2013), general circulation models (Su et al. 2013; Flato et al. 2013; Mul-ler and; Seneviratne 2014), and reanalysis data (Gao et al. 2011; Feng and Zhou 2012; Wang and Zeng 2012). These biases also exist in WRF model, as found by Gao et al. (2015) and Ma et al. (2015) for long term simulation and seasonal simulation, respectively.
In this paper, a TOFD parameterization developed by Bel-jaars et al. (2004) (hereafter BBW scheme) was implemented in WRF 3.7. This scheme exerts momentum loss on the whole atmosphere layer. The difference between the BBW and JD12 TOFD scheme was then investigated using sea-sonal simulations (two sets of simulations with three cumu-lus convection parameterizations for each TOFD scheme) for the complex terrain of the Tibetan Plateau (TP). The simu-lation results were statistically examined against station data from the China Meteorological Administration (CMA) and radio soundings. The paper is organized as follows: brief descriptions of the original TOFD parameterization (JD12 scheme) in WRF, the new TOFD parameterization (BBW scheme), model setup, evaluation metrics and observation data are given in Sect. 2. In Sect. 3, the wind components and wind speed differences between the two sets of simula-tions are given, and the 10-m wind components, wind speed and vertical distributions of wind components are evalu-ated against CMA station data and radio sounding data. In Sect. 4, the simulated precipitation is evaluated against CMA station data. Section 5 presents some discussions about the
evaluation results of the two TOFD schemes. Finally, con-cluding remarks are presented in Sect. 6.
2 Methodology
2.1 JD12 scheme in WRF
The JD12 TOFD scheme in WRF was parameterized by introducing the factor ct to account for the topographic effect on momentum flux. This factor is used to modulate the sur-face drag associated with surface roughness elements in the momentum conservation equation (Jimenez and Dudhia 2012):
where u stands for zonal wind component at the first model level, |Usf | is the total wind speed at the first model level, u* is the friction velocity due to surface roughness ele-ments and it comes from a land surface scheme, and Δz is the thickness of the first model layer. An analogous modifi-cation is also introduced for meridional wind equation.
The parameter ct is a function of the terrain characteristics [e.g., sub-grid orographic standard deviation (SD)]. Physi-cally, this scheme can be interpreted as a modification of the friction velocity, which accounts for the effect of the oro-graphic variability and is calculated assuming homogeneous terrain. Detailed calculations of the above-mentioned param-eters are given in Jimenez and Dudhia (2012). The lower limit of factor ct is equal to 1 in the WRF, which means no TOFD is added to the surface drag.
2.2 BBW TOFD scheme
In this study, the BBW TOFD scheme is implemented in WRF to replace the JD12 scheme to account for the turbu-lent drag caused by small-scale orographic variation (approx-imately smaller than 5 km). The key formula of the TOFD scheme developed by Beljaars et al. (2004) for zonal wind can be expressed as:
with lw = min
(2
k,2
k1
),
(1)�u
�t= ⋯ − ct
u2∗
Δz
u
|Usf |,
(2)
�
�z
(�x
�
)= −2��Cmd ∫
∞
k0
F0(k)||U(2�Cm∕k)
||u(2�Cm∕k)k2
lwe−z∕lwdk,
F0(k) =
{a1k
n1(k0 < k < k1
)
a2kn2(k1 < k < k∞
) ,
a1 = �flt
(Ink
n1flt
)−1
, a2 = a1k1n1−n2 , k∞ = 2�cm∕z0,
Implementation of a turbulent orographic form drag scheme in WRF and its application to the Tibetan…
1 3
where U is the total wind speed of each atmospheric layer, U =
√u2 + v2, with the zonal wind u and the meridional
wind v; � = 12 is a shear-dependent parameter, � = 1 is a shape factor implying isotropic orography; Cmd = 0.005 is the drag coefficient under the assumption of a logarithmic profile for the unperturbed flow; n1 = −1.9, n2 = −2.8,
k is the wave number used for spectral integration from 30 m to 5 km orography variance. k0 = 0.000628 m−1, k1 = 0.003 m−1, kflt = 0.00035 m−1, Ih = 0.00102 m−1, and cm = 0.1 are parameters for the orography spectral integra-tion; and �flt is the SD of the filtered orography (Fig. 1).
In order to improve computational efficiency, Eq. (2) was simplified by Beljaars et al. (2004), as shown below,
where z (m) is the atmosphere layer height. Ccorr = 0.6 is a correction parameter introduced for the simplification. The same parameterization is applied to the meridional wind.
Equation (3) has been used in ECMWF Integrated Fore-casting System (IFS) model since 2006, and in this study we tested its applicability in WRF for the TP region.
The original TOFD scheme in WRF, which was devel-oped by Jimenez and Dudhia (2012), is incorporated to modulate the surface drag based on the characteristics of the orography and it speeds up the winds over the top of mountains and hills. They show reasonable results for 2-km resolution simulations in Iberian Peninsula, and detected to
(3)
�
�z
(�x
�
)= −2��CmdCcorr|U(z)|u(z)2.109e−(z∕1500)
1.5
a2z−1.2,
be atmospheric stability dependent (Lorente-Plazas et al. 2016). However, turbulence-scale orography may not only exert drag at the surface, but also at higher atmosphere. Unlike the JD12 scheme, atmospheric stability is not con-sidered in the BBW scheme. This scheme assumes that the TOFD drag on the atmosphere is a function of the wind speed and experiences exponential decay with altitude from bottom to top.
2.3 Simulation setup
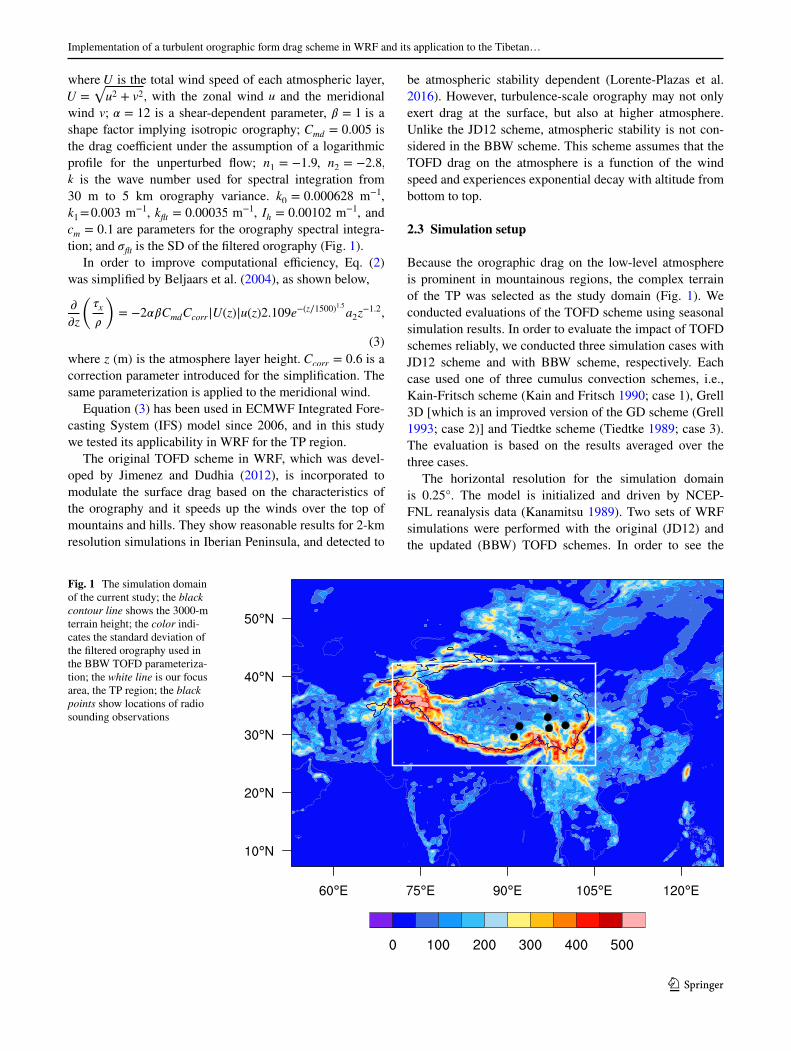
Because the orographic drag on the low-level atmosphere is prominent in mountainous regions, the complex terrain of the TP was selected as the study domain (Fig. 1). We conducted evaluations of the TOFD scheme using seasonal simulation results. In order to evaluate the impact of TOFD schemes reliably, we conducted three simulation cases with JD12 scheme and with BBW scheme, respectively. Each case used one of three cumulus convection schemes, i.e., Kain-Fritsch scheme (Kain and Fritsch 1990; case 1), Grell 3D [which is an improved version of the GD scheme (Grell 1993; case 2)] and Tiedtke scheme (Tiedtke 1989; case 3). The evaluation is based on the results averaged over the three cases.
The horizontal resolution for the simulation domain is 0.25°. The model is initialized and driven by NCEP-FNL reanalysis data (Kanamitsu 1989). Two sets of WRF simulations were performed with the original (JD12) and the updated (BBW) TOFD schemes. In order to see the
Fig. 1 The simulation domain of the current study; the black contour line shows the 3000-m terrain height; the color indi-cates the standard deviation of the filtered orography used in the BBW TOFD parameteriza-tion; the white line is our focus area, the TP region; the black points show locations of radio sounding observations
X. Zhou et al.
1 3
different impacts of the two TOFD schemes on precipita-tion simulation, the simulation period is selected from 1st May to 31st October 2010 that covers the whole monsoon season. Both sets of simulations were configured with the Noah land surface model (Chen and Duhia 2001; Tewari et al. 2004) that comprises the JD12 TOFD scheme, the Yonsei University planetary boundary layer scheme (Hong et al. 2006) with gravity wave scheme (Choi and Hong 2015), the RRTM scheme (Mlawer et al. 1997) for long-wave and solar radiation transfer, and the cloud microphys-ics scheme from Lin et al. (1983).
2.4 Evaluation metrics
The direct impact of TOFD schemes on wind fields and their indirect impact on 2-m air temperature (T2) and pre-cipitation were quantitatively investigated based on obser-vations at 54 CMA stations on the TP. The evaluation met-rics used in this study are mean bias, mean absolute bias (MAB), root mean square error (RMSE) and correlation coefficient (R).
2.5 Observational data
Two types of data were used for the model evaluation. The first one is daily data at 54 CMA weather stations, which was downloaded at (http://data.cma.cn/data/detail/dataCode/A.0012.0001.html). The second one is radio sounding data, which was downloaded from the NOAA Integrated Global Radiosonde Archive (IGRA) website (https://www1.ncdc.noaa.gov/pub/data/igra/). The radio sounding stations are shown in Fig. 1. Monthly mean val-ues were derived if observations are available in more than 20 days in each month, and then the monthly values were used for the model evaluations.
3 Results of wind simulation
In this study, we evaluated zonal wind component (u), meridional wind component (v) and total wind speed, which were averaged over three simulation cases with the BBW scheme (BBW-average) and JD12 scheme (hereafter JD12-average), respectively.
3.1 Impacts of TOFD schemes on wind fields
The spatial distributions of the difference (BBW-average minus JD12-average) of the seasonal mean wind com-ponents and wind speed are shown in Fig. 2a–c for the surface, Fig. 2d–f for the 500 hPa, and Fig. 2g–i for the 250 hPa.
Major differences in 10-m u component between the BBW-average and JD12-average occur over the south-western TP (ca. 2–3 m s−1) and over the western TP (ca. 3–4 m s−1). Obvious southward differences in 10-m v com-ponent are detected in the BBW-average over the southern and western TP (ca. 2–3 m s−1). The BBW TOFD scheme significantly decreases the surface wind speed overall TP region, while increases occur to the southwest of TP. We even found large differences outside the TP (e.g. areas to the southwest of the TP), where the orographic variances are small (see Fig. 1a–c). These results reflect the differ-ent impacts between BBW and JD12 TOFD scheme on the momentum loss and horizontal air transport of surface atmosphere.
At 500 hPa, systematic westward differences between BBW-average and JD12-average are detected, with the maximum over the western TP (ca. 2–3 m s−1). Slight northward differences are seen over the northwestern TP (ca. 0.5 m s−1) and over the interior TP (smaller than 0.5 m s−1). Significant changes in total wind speed are also detected over all TP region, especially over the northwest. At 250 hPa, eastward differences (0.5–1.5 m s−1) between BBW-average and JD12-average in the southeastern TP and slight westward differences (0–2 m s−1) in the northern TP are found, slight southward differences (0.5–1 m s−1) are found in the northern TP, and weaker wind speed is seen in BBW-average than in JD12-average over the northern TP. The above results indicate that the two TOFD schemes also induce differences in the wind components and total wind speed at upper-level atmosphere.
In Fig. 2g–i, we can see that the u, v components and wind speed differences in upper-atmosphere are barely dependent on local orography and its variance. This phe-nomenon was also found in a TOFD experiment using the ECMWF IFS model (Orr 2007). This is consistent with the nature of turbulent orographic drag, which exerts a larger impact on low-level atmosphere than on high-level atmosphere.
3.2 Evaluation of 10‑m wind fields
The 10-m wind components (u10 and v10) and wind speed (U10) from the BBW-average and JD12-average were evaluated against observations at 54 CMA stations on the TP. The seasonal mean 10-m wind was used to investigate the characteristics of its errors. Figure 3a–f show the spa-tial distributions of the biases in the seasonal mean zonal, meridional 10-m wind components and total wind speed of the BBW-average and JD12-average. The comparison between Fig. 3a, b indicates that the BBW-average slightly alleviates the westward biases for some of the stations located in the southern and eastern regions of the TP, and it clearly alleviates the systematic northward biases (Fig. 3c,

Implementation of a turbulent orographic form drag scheme in WRF and its application to the Tibetan…
1 3
a b c
d e f
g h i
Fig. 2 Seasonal mean of the zonal (u), meridional (v) and total (U) wind speed changes (BBW average minus JD12 average over the three simu-lation cases) at 10 m (a–c), 500 hPa (d–f), and 250 hPa (g–i)
Fig. 3 Spatial distribution of the seasonal mean biases in u10 (a, b), v10 (c, d) and total horizontal wind speed (U10; e, f) derived from the BBW and JD12 averages versus the station observations (OBS)
>1.20.8~1.20.4~0.80.0~0.4−0.4~0.0−0.8~−0.4−1.2~0.8<−1.2
a u10: BBW−OBS(m s−1) b u10: JD12−OBS(m s −1)
c v10: BBW−OBS(m s−1) d v10: JD12−OBS(m s−1)
e U10: BBW−OBS(m s−1) f U10: JD12−OBS(m s−1)

X. Zhou et al.
1 3
d) in these regions. Figure 3e, f further indicate that general positive biases in the JD12-average are much reduced in the BBW-average. Nevertheless, the BBW-average has nega-tive biases along Himalayan Mountains.
The spatial statistical metrics (cross-station mean bias, MAB, RMSE, and R) of the seasonal mean u10, v10 and U10 from the BBW-average and JD12-average are shown in Table 1. For u10, the BBW-average slightly alleviates the seasonal mean bias (from −0.30 to −0.26 m s−1) and MAB (from 0.53 to 0.49 ms−1), reduces the RMSE (from 0.65 to 0.60 m s−1), but slightly lowers the R from 0.52 to 0.49. For v10, the BBW-average obviously alleviates the seasonal mean bias (from −0.26 to −0.01 m s−1) and MAB (from 0.47 to 0.38 m s−1), reduces the RMSE (from 0.67 to 0.55 m s−1) and slightly improves the R from 0.66 to 0.67. For U10, the BBW-average obviously underestimates the wind speed by −0.38 m s−1 while JD12-average overesti-mates the wind speed by 0.37 m s−1, but BBW-average alle-viates the MAB from 0.80 to 0.55 m s−1. The RMSE in the BBW-average (0.76 m s−1) is much less than JD12-average (1.10 m s−1). Also, the BBW scheme much increases the R from 0.44 to 0.64.
The temporal statistical metrics (R, RMSE) derived from the daily u10, v10 and U10 in the BBW-average and the JD12-average were calculated for the 54 individual stations. Figure 4a–f show the comparison of the metrics between the two averages. In general, both schemes yield similar and quite low R values (0.24–0.3) and the BBW scheme does not significantly change the correlation coef-ficient. However, the BBW-average yields smaller mean RMSE values in both u10 and v10 than the JD12-average (u10: 0.89 versus 1.10 m s−1; v10: 0.85 versus 1.05 m s−1). For U10, the BBW-average shows higher mean R value (0.36 versus 0.30) and smaller mean RMSE (0.66 versus 0.82 m s−1) than the JD12-average, indicating significant improvements.
These evaluations indicate that the simulation of surface wind components and wind speed are improved over the TP by implementing the BBW TOFD scheme in WRF, though worse performances still exist.
3.3 Evaluation the vertical distribution of wind components
The observed surface wind fields are highly sensitive to the surrounding micro-scale orography variance, and thus the representativeness of station observations may cause uncertainties in the evaluation. In this section, the simu-lated wind components are evaluated against radio sound-ing data. Figure 5a–d show the biases and RMSEs in the wind components (u and v respectively) of the BBW-average and JD12-average versus the radio soundings at six TP stations.
For u component (Fig. 5a, b), the BBW-average gen-erally performs better than JD12-average. It has smaller biases (within the scale of −0.6 to 0.2 m s−1) from the surface to 100 hPa except at 500 hPa, while the biases in the JD12-average range from −0.7 m s−1 at surface, −0.1 m s−1 at 500 hPa, to −1.0 m s−1 at 200 hPa. The BBW-average also shows smaller RMSEs (<0.8 m s−1) from the surface to 100 hPa except at 500 hPa, while the RMSE from the JD12-average at surface is 0.8 m s−1 and then it increase from 0.7 m s−1 at 500 hPa to maximum of 1.5 m s−1 at 300 hPa.
For v component (Fig. 5c, d), the BBW-average also generally performs better than JD12-average. The biases from BBW-average range from 0.1 m s−1 at surface to 1.5 m s−1 at 500 hPa and then to maximum of 2.6 m s−1 at 200 and 150 hPa, while JD12-average shows biases range from 0.2 m s−1 at surface to maximum of 3.5 m s−1 at 150 hPa. The BBW-average shows less RMSE in surface wind than JD12-average (ca. 0.2 versus ca. 0.3 m s−1). RMSEs from the BBW-average range from 1.4 m s−1 at 500 hPa to 3.2 m s−1 at 200 hPa, while JD12-average shows RMSEs range from 1.0 m s−1 at 500 hPa to maxi-mum of 3.8 m s−1 at 150 hPa.
Although there are only six radio sounding stations available, the above evaluations show that the WRF with the BBW scheme simulates better the vertical profile of wind speed than with the JD12 scheme except at 500 hPa.
Table 1 Cross-station statistical metrics [mean bias (m s−1), MAB (m s−1), RMSE (m s−1), and R] for the seasonal mean and monthly mean of u10, v10 and U10 from both BBW and JD12 averages compared with CMA observations
The italics values indicate BBW average shows poorer behavior than the JD12 average
TOFD Metrics
u10 v10 U10
Bias MAB RMSE R Bias MAB RMSE R Bias MAB RMSE R
BBW −0.26 0.49 0.60 0.49 −0.01 0.38 0.55 0.67 −0.38 0.55 0.76 0.64JD12 −0.30 0.53 0.65 0.52 0.26 0.47 0.67 0.66 0.37 0.80 1.10 0.44

Implementation of a turbulent orographic form drag scheme in WRF and its application to the Tibetan…
1 3
4 Evaluation of T2 and precipitation
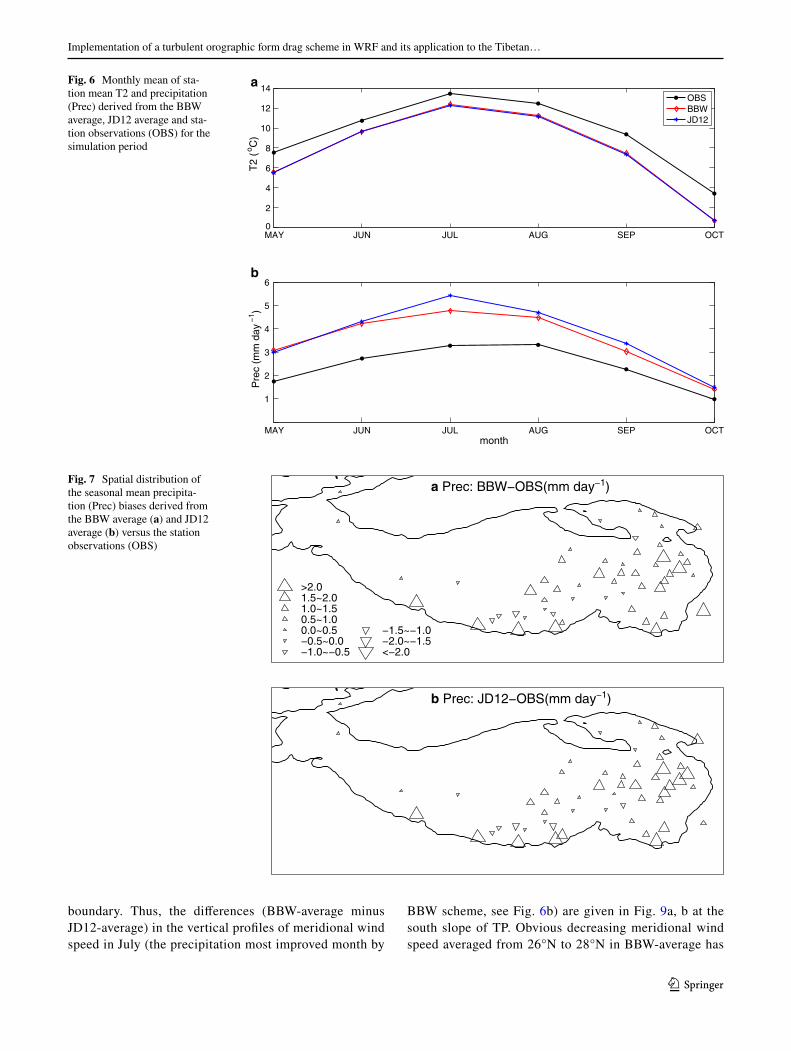
The monthly mean of station mean T2 and precipitation from BBW-average, JD12-average and station observations are given in Fig. 6a, b. The T2 from both BBW-average and JD12-average shows similar cold biases in each month, indicating little improvement in air temperature simulation after implementing the BBW-scheme. However, BBW-average generally shows less precipitation than JD12-aver-age, especially in July. Therefore, the following only pre-sents the evaluation of the simulated precipitation.
Figure 7a, b show the spatial distributions of the biases (versus CMA station observations) in the seasonal mean precipitation of the BBW-average and JD12-average. At the same time, the cross-station statistical metrics (mean bias, RMSE, and R) of the seasonal mean precipitation of both the BBW-average and the JD12-average were also calculated. On average, the BBW-average alleviates
the mean bias from 1.34 to 1.12 mm day−1, though overestimations still exist in both BBW-average and the JD12-average at some of the interior TP stations and stations along Himalaya Mountains. Averaged over all the stations, the RMSE in precipitation is reduced from 2.90 mm day−1 in the JD12-average to 2.38 mm day−1 in the BBW-average, and the R is improved from 0.36 in the JD12-average to 0.47 in the BBW-average.
The temporal statistical metrics (R and RMSE) derived from daily precipitation of the BBW-average and the JD12-average versus CMA station data were calcu-lated for the individual stations and shown in Fig. 8a, b. The BBW-average shows larger mean R value (0.32 ver-sus 0.27) and yields a smaller mean RMSE (4.95 versus 5.28 mm day−1), than the JD12-average, indicating a bet-ter performance in simulating precipitation after intro-ducing the BBW scheme.
Fig. 4 Comparison of temporal statistical metrics [R and RMSE (m s−1)] of the daily mean u10 (a, b), v10 (c, d) and U10 (e, f) derived from both BBW average and JD12 average versus the sta-tion observations; each symbol denotes the statistical value at each station for the simulation period
−0.2 0.2 0.6 1
−0.2
0.2
0.6
1
JD12
mean:BBW:JD12:
0.280.29
a R in u10
0 1 2 3 4
1
2
3
4
mean:BBW:JD12:
0.891.10
b RMSE in u10
−0.2 0.2 0.6 1
−0.2
0.2
0.6
1JD
12
mean:BBW:JD12:
0.240.24
c R in v10
0 1 2 3 4
1
2
3
4
mean:BBW:JD12:
0.851.05
d RMSE in v10
−0.2 0.2 0.6 1
−0.2
0.2
0.6
1
JD12
BBW
mean:BBW:JD12:
0.360.30
e R in U10
0 1 2 3 4
1
2
3
4
BBW
mean:BBW:JD12:
0.660.82
f RMSE in U10

X. Zhou et al.
1 3
5 Discussion
The BBW-average generally performs better than JD12 scheme when using spatial statistic metrics for the evalu-ation. One reason is that the JD12 scheme increases the spatial variability of the near surface wind speed, it is very sensitive to the selected point used for evaluations. Worse performances in wind speed exist in both BBW-average and JD12-average. On the one hand, these could be asso-ciated with the inability of the climate models to capture small-scale (both temporally and spatially) processes. In
particular, other parameterizations for physical processes in the TP may need to be further investigated. On the other hand, the station data represents observations at the point-scale; thus, their spatial representativeness may be ques-tionable when used to evaluate the modeling results espe-cially for wind fields.
In order to understand why the precipitation simula-tion is improved when applying the BBW scheme, the associated wind speed and water vapor transport at south boundary of TP were analyzed. Under the monsoon cli-mate, the main air water vapor over TP is from the south
Fig. 5 Vertical structure [from surface (sf) to 100 hPa] of the biases and RMSEs of the monthly mean wind compo-nents [u (a, b) and v (c, d) respectively] derived from BBW and JD12 averages versus radio sounding data
−1 −0.5 0 0.5 1
100
200
300
400
500
sf
pres
sure
leve
ls (
hPa)
u Bias (ms−1)
BBWJD12
0.5 1 1.5 u RMSE (ms−1)
1 2 3
100
200
300
400
500
sf
pres
sure
leve
ls (
hPa)
v Bias (ms−1)1 2 3 4
v RMSE (ms−1)
a b
c d
Implementation of a turbulent orographic form drag scheme in WRF and its application to the Tibetan…
1 3
boundary. Thus, the differences (BBW-average minus JD12-average) in the vertical profiles of meridional wind speed in July (the precipitation most improved month by
BBW scheme, see Fig. 6b) are given in Fig. 9a, b at the south slope of TP. Obvious decreasing meridional wind speed averaged from 26°N to 28°N in BBW-average has
Fig. 6 Monthly mean of sta-tion mean T2 and precipitation (Prec) derived from the BBW average, JD12 average and sta-tion observations (OBS) for the simulation period
MAY JUN JUL AUG SEP OCT0
2
4
6
8
10
12
14
T2
(o C)
OBSBBWJD12
MAY JUN JUL AUG SEP OCT
1
2
3
4
5
6
Pre
c (m
m d
ay−
1 )
month
a
b
Fig. 7 Spatial distribution of the seasonal mean precipita-tion (Prec) biases derived from the BBW average (a) and JD12 average (b) versus the station observations (OBS)
>2.01.5~2.01.0~1.50.5~1.00.0~0.5−0.5~0.0−1.0~−0.5
−1.5~−1.0−2.0~−1.5<−2.0
a Prec: BBW−OBS(mm day−1)
b Prec: JD12−OBS(mm day−1)

X. Zhou et al.
1 3
Fig. 8 Comparison of temporal statistical metrics [R (a) and RMSE (b; mm day−1)] of the daily mean Precipitation (Prec) derived from both BBW average and JD12 average versus the sta-tion observations; each symbol denotes the statistical value at each station for the simulation period
−0.2 0.2 0.6 1
−0.2
0.2
0.6
1
JD12
BBW
mean:
BBW:
JD12:
0.32
0.27
R in Prec
0 2 4 6 8
2
4
6
8
JD12
BBW
mean:
BBW:
JD12:
4.95
5.28
RMSE in Prec (mm day−1)
a b
Fig. 9 Differences (BBW average minus JD12 average in July) of wind (m s−1) a along a zonal cross-section averaged over 27°N–30°N, and b along a meridional cross-section aver-aged over 88°E–94°E
a
b

Implementation of a turbulent orographic form drag scheme in WRF and its application to the Tibetan…
1 3
been detected over the south TP (Fig. 9a) at low-level atmosphere, particularly along the slope of Himalayan Mountains. This phenomenon is also seen in the meridi-onal wind speed averaged from 88°E to 94°E (Fig. 9b). The weakening of low-level meridional wind results in weaker meridional water vapor transport from the South Asia (Fig. 10a, b). As the water vapor from the South Asia is a major water vapor source for the precipitation in the Tibetan Plateau, the significant weakening in the southerly water vapor transport at lower atmosphere may result in less precipitation, as indicated in Fig. 6b.
6 Concluding remarks
In this study, the BBW scheme was used to replace the orig-inal JD12 scheme in WRF3.7, as an independent dynami-cal process to reflect the turbulence-scale orographic form drag. The major difference between the two schemes is that the former exerts the form drag on each atmospheric layer, while JD12 exerts the form drag only on the surface layer. To test the effect of the BBW scheme implementation, two sets of WRF simulations (BBW-average and the JD12-aver-age) were conducted for the summer climate in the Tibetan Plateau, where terrain variability is significant.
The results show that the implementation of the BBW scheme leads to considerable changes in wind com-ponents and total wind speed at both lower-level and
Fig. 10 Differences (BBW average minus JD12 average in July) of meridional air water vapor transport (kg m kg−1 s−1; meridional wind multiples specific humidity) a along a zonal cross-section averaged over 27°N–30°N, and b along a meridional cross-section aver-aged over 88°E–94°E
a
b

X. Zhou et al.
1 3
upper-level atmospheres. Compared to the JD12 scheme, the BBW scheme significantly decreases the wind speed at low-level atmosphere. The evaluation against the sta-tion observations shows that the BBW scheme yields smaller biases, smaller RMSE values and higher R values in the 10-m wind components and total wind speed than the JD12 scheme does. This improvement is more evident for the 10-m meridional wind, as the terrain variability is more significant along the meridional direction of this region. Moreover, the BBW-average generally shows bet-ter performance in the wind profile except at 500 hPa, as characterized by smaller biases and RMSEs than the JD12-average.
The simulated T2 and precipitation were also evaluated, which indicates implementing the BBW scheme yields lit-tle improvement in T2 but clear improvement in precipita-tion. This improvement in precipitation of the BBW-aver-age can be attributed to weaker wind speed at low-level atmosphere and thus weaker water vapor transport from the humid South Asia into the Tibetan Plateau.
These results demonstrate the importance of improving the parameterization for turbulence-scale orographic form drag over the TP. The BBW scheme seems more effective in reflecting the impact of this complex terrain region on wind fields and precipitation. Nevertheless, there are still limitations in this scheme. For instance, the surface wind speed is under estimated. It is needed to test the sensitiv-ity of parameters in this scheme, which was originally designed for global simulation in the ECMWF model and may need a local readjustment when applied to the TP region.
Acknowledgements The authors are grateful to Dr Anton Bel-jaars for offering the filtered orography SD and the great help dur-ing code processing. This work was funded by the National Natural Science Foundation of China (Grant Nos. 91537210, 41325019), by the International Partnership Program of Chinese Academy of Sci-ences (Grant No. 131C11KYSB20160061) and by the Strategic Pri-ority Research Program (B) of Chinese Academy of Sciences (Grant No. XDB03030300). The authors are grateful to the two anonymous reviewers whose comments helped a lot to improve the manuscript.
References
Beljaars ACM, Brown AR, Wood N (2004) A new parametrization of turbulent orographic form drag. Q J Roy Meteor Soc 130:1327–1347. doi:10.1256/qj.03.73
Boer GJ, Mcfarlane NA, Laprise R et al (1984) The Canadian Climate Centre spectral atmospheric general circulation model. Atmos Ocean 22:397–429. doi:10.1080/07055900.1984.9649208
Chen F, Dudhia J (2001) Coupling an advanced land surface-hydrol-ogy model with the Penn state-NCAR MM5 modeling system. Part I: Model implementation and sensitivity. Mon Weather Rev 129:569–585. doi:10.1175/1520-0493(2001)129<0569:CAALSH>2.0.CO;2
Choi H, Hong S (2015) An updated subgrid orographic parameteriza-tion for global atmospheric forecast models. J Geophys Res 120. doi:10.1002/2015JD024230
Feng L, Zhou T (2012) Water vapor transport for summer precipita-tion over the Tibetan Plateau: multi-dataset analysis. J Geophys Res 117:D20114. doi:10.1029/2011JD017012
Flato G, Marotzke J, Abiodun B et al (2013) Contribution of working group I to the fifth assessment report of the intergovernmental panel on climate change. Clim Change 5:741–866
Gao Y, Xue Y, Peng W et al (2011) Assessment of dynamic down-scaling of the extreme rainfall over East Asia using a regional climate model. Adv Atmos Sci 28:1077–1098. doi:10.1007/s00376-010-0039-7
Gao Y, Xu J, Chen D (2015) Evaluation of WRF mesoscale climate simulations over the Tibetan plateau during 1979–2011. J Clim 28:2823–2840. doi:10.1175/JCLI-D-14-00300.1
Grant ALM, Mason PJ (1990) Observations of boundary-layer structure over complex terrain. Q J Roy Meteor Soc 116 (491):159–186
Gregory D, Shutts GJ, Mitchell JR (1998) A new gravity-wave-drag scheme incorporating anisotropic orography and low-lev el wave breaking: impact upon the climate of the UK Meteoro-logical Office Unified Model. Q J Roy Meteor Soc 124:463–493. doi:10.1002/qj.49712454606
Grell GA (1993) Prognostic evaluation of assumptions used by cumulus parameterizations. Mon Weather Rev 121:764–787. doi:10.1175/1520-0493(1993)121<0764:PEOAUB>2.0.CO;2
Hong S-Y, Noh Y, Dudhia J (2006) A new vertical diffusion pack-age with an explicit treatment of entrainment processes. Mon Weather Rev 134(9):2318–2341
Hong SY, Choi J, Chang EC et al (2008) Lower-tropospheric enhance-ment of gravity wave drag in a global spectral atmospheric fore-cast model. Weather Forecast 23:523–531. doi:10.1175/2007WAF2007030.1
Ji Z, Kang S (2013) Double-nested dynamical downscaling experi-ments over the Tibetan Plateau and their projection of climate change under two RCP scenarios. J Atmos Sci 70:1278–1290. doi:10.1175/JAS-D-12-0155.1
Jimenez PA, Dudhia J (2012) Improving the representation of resolved and unresolved topographic effects on surface wind in the WRF model. J Appl Meteorol 51:300–316
Kain, JS, Fritsch JM (1990) A one-dimensional entraining/detraining plume model and its application in convec-tive parameterization. J Atmos Sci 47(23):2784–2802. doi:10.1175/1520-0469(1990)047<2784:AODEPM>2.0.CO;2
Kanamitsu M (1989) Description of the NMC global data assimilation and forecast system. Weather Forecast 4:335–342. doi:10.1175/JAMC-D-11-084.1
Kim YJ (1996) Representation of subgrid-scale orographic effects in a general circulation model: part I: Impacts on the dynam-ics of a simulated January climate. J Clim 9:2698–2717. doi:10.1175/1520-0442(1996)009<2698:ROSSOE>2.0.CO;2
Kim YJ, Arakawa A (1995) Improvement of orographic gravity wave parameterization using a mesoscale gravity wave model. J Atmos Sci 52:1875–1902. doi:10.1175/1520-0469(1995)052<1875:IOOGWP>2.0.CO;2
Kim YJ, Doyle JD (2005) Extension of an orographic-drag parame-terization scheme to incorporate orographic anisotropy and flow blocking. Q J Roy Meteor Soc 131:1893–1921. doi:10.1256/qj.04.160
Lin YL, Farley RD, Orville HD (1983) Bulk parameterization of the snow field in a cloud model. J Clim Appl Meteorol 22:1065–1092. doi:10.1175/1520-0450(1983)022<1065:BPOTSF>2.0.CO;2
Lorente-Plazas R, Jiménez RP, Dudhia J et al (2016) Evaluating and improving the impact of the atmospheric stability and orography

Implementation of a turbulent orographic form drag scheme in WRF and its application to the Tibetan…
1 3
on surface winds in the WRF model. Mon Wea Rev. doi:10.1175/MWR-D-15-0449.1
Lotto F, Miller MJ (1997) A new subgrid-scale orographic drag parameterization: its formulation and testing. Q J Roy Meteor Soc 123:101–127. doi:10.1002/qj.49712353704
Ma J, Wang H, Fan K (2015) Dynamic downscaling of sum-mer precipitation prediction over China in 1998 using WRF and CCSM4. Adv Atmos Sci 32(5):577–584. doi:10.1007/s00376-014-4143-y
Macfarlane NA (1987) The effect of orographically excited grav-ity wave drag on the general circulation of the low strato-sphere and troposphere. J Atmos Sci 44:1775–1800. doi:10.1175/1520-0469(1987)044<1775:TEOOEG>2.0.CO;2
Mass C, Ovens D (2011) Fixing WRF’s high speed wind bias: a new subgrid scale drag parameterization and the role of detailed veri-fication. In: 24th Conference on Weather and Forecasting and 20th Conference on Numerical Weather Prediction, Preprints, 91st American Meteorological Society Annual Meeting (vol 23727). http://ams.confex.com/ams/91Annual/webprogram/Paper180011.html
Mlawer EJ, Taubman SJ, Brown PD et al (1997) Radiative transfer for inhomogeneous atmospheres: RRTM, a validated correlated-k model for the longwave. J Geophys Res 102:16663–16682. doi:10.1029/97JD00237
Mueller B, Seneviratne SI (2014) Systermatic land climate and evapo-transpiration biases in CMIP5 simulations. Geophys Res Lett 41:128–134. doi:10.1002/2013GL058055
Orr A (2007) Evaluation of revised parameterizations of sub-grid oro-graphic drag. ECMWF Technical Memorandum
Rontu L (2006) A study on parametrization of orography-related momentum fluxes in a synoptic-scale NWP model. Tellus 58A:69–81. doi:10.1111/j.1600-0870.2006.00162.x
Scinocca JF, Macfarlane NA (2000) The parameterization of drag induced by stratified flow over anisotropic topography. Q J Roy Meteor Soc 126:2353–2393. doi:10.1002/qj.49712656802
Shimada S, Ohsawa T, Chikaoka S et al (2011) Accuracy of the wind speed profile in the lower PBL as simulated by the WRF model. Sola 7:109–112. doi:10.2151/sola.2011-028
Su F, Duan X, Chen D et al (2013) Evaluation of the global climate models in the CMIP5 over the Tibetan Plateau. J Clim 26:3187–3208. doi:10.1175/JCLI-D-12-00321.1
Tewari M, Chen F, Wang W et al (2004) Implementation and verifica-tion of the unified NOAH land surface model in the WRF model. 20th conference on weather analysis and forecasting/16th confer-ence on numerical weather prediction, pp 11–15
Tiedtke M (1989) A comprehensive mass flux scheme for cumu-lus parameterization in large-scale models. Mon Weather Rev 117(8):1779. doi:10.1175/1520-0493(1989)117<1779:ACMFSF>2.0.CO;2
Wang A, Zeng X (2012) Evaluation of multi-reanalysis products with in-situ observations over the Tibetan Plateau. J Geophys Res 117:D05102. doi:10.1029/2011JD016553
Webster S, Brown AR, Cameron DR et al (2003) Improvements to the representation of orography in the Met Office Unified Model. Q J Roy Meteor Soc 129:1989–2010. doi:10.1256/qj.02.133
Wood N, Mason P (1993) The pressure force induced by neutral, tur-bulent flow over hills. Q J Roy Meteor Soc 119(514):1233–1267. doi:10.1002/qj.49711951402
Wood N, Brown AR, Hewer FE (2001) Parametrizing the effects of orography on the boundary layer: an alternative to effec-tive roughness lengths. Q J Roy Meteor Soc 127:759–777. doi:10.1002/qj.49712757303
Wooding RA, Bradley EF, Marshall JK (1973) Drag due to regular arrays of roughness elements of varying geometry. Bound-Lay Meteorol 5(3):285–308. doi:10.1007/BF00155238
Wu G, Chen S (1985) The effect of mechanical forcing on the forma-tion of a mesoscale vortex. Q J Roy Meteor Soc 111(470):1049–1070. doi:10.1002/qj.49711147009


![[R1] Shark Skin Surfaces for Fluid Drag Reduction in Turbulent Flow](https://img.pdfslide.us/doc/110x75/577cc18e1a28aba71193594f/r1-shark-skin-surfaces-for-fluid-drag-reduction-in-turbulent-flow.jpg)