Embed Size (px)
Citation preview
Implementation of a Computerized Perioperative Data Integration and
Display System
Mark A. Meyer
a MD MPH, Wilton C. Levine
b MD, Marie Egan
c RN MS, Jeffrey
Robbinsd, Gabriel Spitz, ScD
e, & Warren S. Sandberg
b MD PhD
aLaboratory of Computer Science, Massachusetts General Hospital, Boston, MA
bDepartment of Anesthesia and Critical Care, Massachusetts General Hospital, Boston, MA
cDepartment of Nursing, Massachusetts General Hospital, Boston, MA
dLiveData Inc., Cambridge, MA
eAptima, Inc., Woburn, MA
Implementation of a Computerized Perioperative Data Integration and Display System – Sandberg – Page 1
ABSTRACT
Operative and perioperative information systems rarely interact with other healthcare information systems.
Creating information islands in various unrelated systems, the data streams are isolated from use, limiting
their utility. Ultimately, much of this information goes unnoticed, unrecorded, and unutilized. The need to
optimize perioperative throughput creates a demand for integration of the datastreams and for timely data
presentation. Through a collaborative effort, we have developed a system that integrates perioperative data
from anesthesia and surgical devices and operating room (OR) / hospital information systems and projects
the real-time integrated data as a single, unified, easy to visualize display. The system provides improved
context-sensitive information display, improved real-time monitoring of physiological data, real-time
access to readiness information, and improved workflow management.
INTRODUCTION
Surgery is a complicated event where just-in-time access to vital information is instrumental for optimal
team functioning. The operating room itself is uniquely risky in that not only is an invasive procedure
taking place, but also the patient is unconscious and therefore unable to represent themselves. The smooth
and safe functioning of an operating room depends on the coordinated action of a large team of caregivers
including physicians, nurses, technicians, transport personnel, and housekeeping personnel, all of whom
need ready access to patient and system information that must be integrated from many disparate data
sources. The additional emergence of high throughput operating rooms1-3
requires a solid culture of
teamwork to facilitate the increased throughput. The need for comprehensive and continuous OR team
synchronization underscores the importance of complete and total patient data, integrated and presented to
all team members at the point of care when clinical decisions are being made.
In a typical operating room, most patient information passes through unrelated systems, going unrecorded
and underutilized.4 Benefits of integration are numerous and would yield tremendous advantages, yet
many information systems remain far from this goal.5 The various monitoring and treatment delivery
systems do not communicate with each other, so fragmentation of data with redundancy is unavoidable.
Information systems require independent log-ins and information display is limited to small screens meant
for individual data consumption. Furthermore, many team members must divide their attention between
displays. For example, the anesthesiologist interacts with many separate displays, each attached to its own
individual computer, for needs such as physiologic monitoring, automated anesthesia record keeping,
hospital information system access, order entry and drug/supply chain management.6 These varied systems
divert caregivers from patient care and lead to duplicative effort by staff who are striving to create a
Implementation of a Computerized Perioperative Data Integration and Display System – Sandberg – Page 2
comprehensive clinical picture of the patient. This effort could potentially be directed toward other
endeavors to increase safety, efficiency, and clinical excellence in the perioperative period.
Issues of communication create a significant barrier to operative and perioperative efficiency and
situational awareness. Coordinating equipment and patient preparedness, staffing, room assignments, and
scheduling make up the bulk of communication needs.7 Over a third of communication failures in the
operative environment result in visible effects on system processes including inefficiency, team tension,
wasted resources, delays, patient inconvenience and errors.8 Many communication failures occur because
of suboptimal timing of information exchange, when information is requested or provided too late to be
optimally useful. To diminish the possibility of adverse events, improved information displays should
assist in matters of patient preparedness and equipment management, and provide information as it
becomes relevant, decreasing interruptions to the operative team’s work.7
We have undertaken a project to address these issues and develop a system to record all data passing
through an operating room, provide unified displays of that data in real time, and create real-time tools to
provide augmented vigilance and decision support in the operative setting. The project is a collaborative
effort by Massachusetts General Hospital, LiveData, Inc. (Cambridge, MA), and Aptima, Inc. (Woburn,
MA) with support from the Telemedicine and Advanced Technology Research Center, U.S. Army Medical
Research and Materiel Command. The goal of the project was to develop a prototype system to perform
integration and display of information from a variety of disparate systems, ultimately to provide
information needed by the healthcare provider at any time, from any location, and in any format necessary.
It aims to improve situational awareness and to facilitate the capture and consumption of medical data in
the Operating Room of the Future (ORF), a high throughput operating room at Massachusetts General
Hospital (Figure 1).
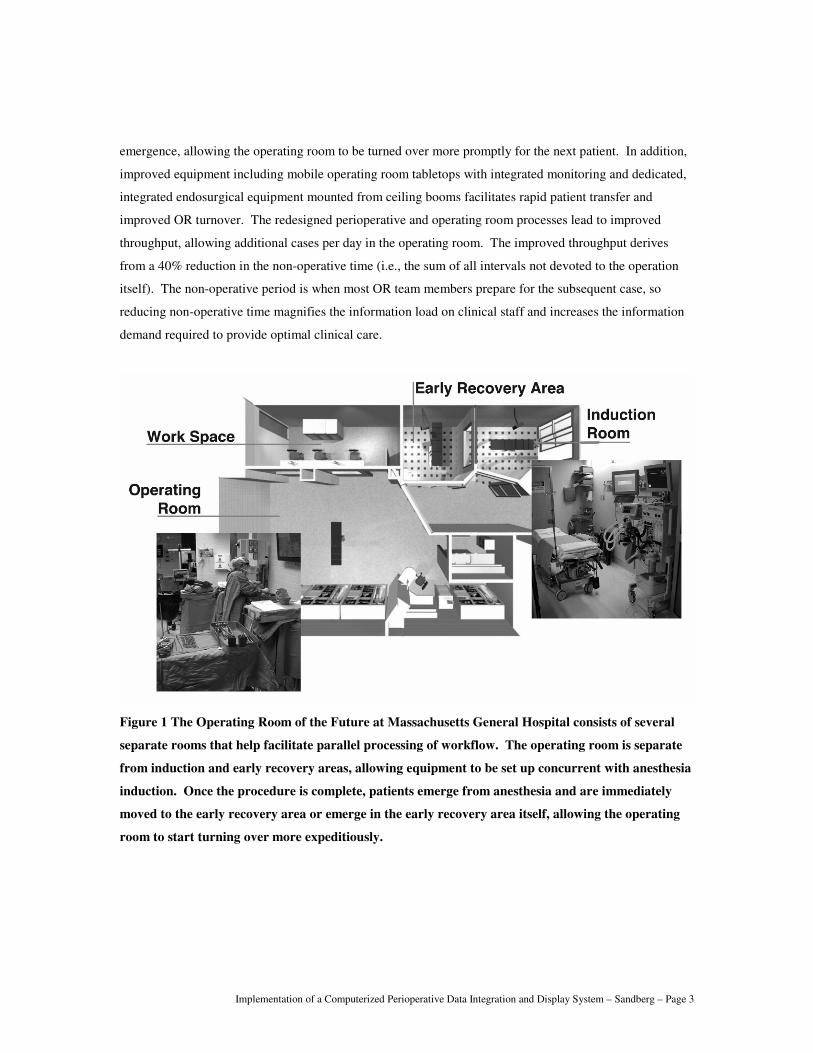
The ORF is a 1,315 sq ft space designed specifically to support advanced minimally invasive surgery; it
provides a test environment to explore new and innovative perioperative patient / personnel movement and
workflow processes and to develop and evaluate new technologies in a live, patient care environment.2 The
ORF accomplishes parallel processing of workflow facilitated by a redesigned operative suite floor plan
that includes separate induction, operating, and recovery areas. This allows for preoperative preparation
and induction of anesthesia concomitantly with instrument setup in the operating room. Anesthetized
patients are then transferred to the operating room as OR setup is completed. At the end of surgery,
patients are taken to the early recovery area for emergence from anesthesia or immediately following
Implementation of a Computerized Perioperative Data Integration and Display System – Sandberg – Page 3
emergence, allowing the operating room to be turned over more promptly for the next patient. In addition,
improved equipment including mobile operating room tabletops with integrated monitoring and dedicated,
integrated endosurgical equipment mounted from ceiling booms facilitates rapid patient transfer and
improved OR turnover. The redesigned perioperative and operating room processes lead to improved
throughput, allowing additional cases per day in the operating room. The improved throughput derives
from a 40% reduction in the non-operative time (i.e., the sum of all intervals not devoted to the operation
itself). The non-operative period is when most OR team members prepare for the subsequent case, so
reducing non-operative time magnifies the information load on clinical staff and increases the information
demand required to provide optimal clinical care.
Figure 1 The Operating Room of the Future at Massachusetts General Hospital consists of several
separate rooms that help facilitate parallel processing of workflow. The operating room is separate
from induction and early recovery areas, allowing equipment to be set up concurrent with anesthesia
induction. Once the procedure is complete, patients emerge from anesthesia and are immediately
moved to the early recovery area or emerge in the early recovery area itself, allowing the operating
room to start turning over more expeditiously.
Implementation of a Computerized Perioperative Data Integration and Display System – Sandberg – Page 4
There is considerable variation in situational awareness by members of the operative team leading to a
limited number of individuals in the room holding critical but only partially overlapping information about
the case.9 Having detailed patient and case data prominently displayed in the operating room by a dynamic
and collaborative system can help improve coordination, communication, efficiency, and safety, and
enhance the quality of information present in information systems.10
Thus, the case for an integrated, real-
time, collaborative display of perioperative and operative data is compelling. In this paper, we describe the
initial prototype of such a system, starting with the initial specifications and concluding by describing the
functionality of the working prototype installed and in daily use at the OR of the Future Project.
METHODS
The proposed system was required to have three major capabilities: (1) complete data capture and
recording, (2) integrated data display and (3) augmented vigilance with decision and workflow support.
Methods of system specification development, prototyping, implementation, and evaluation are detailed
below. Additionally, the system was intended to run on readily available desk-top personal computers and
to be implemented using relatively minor modifications of commercially available software.
The Operating Room of the Future at Massachusetts General Hospital is typical of new operating rooms
that are constructed to support minimally invasive surgery and of other ORF initiatives seeking to address
the information needs of the perioperative team.11
We began with a search for input data sources in this
technologically advanced operating room. All equipment in the operating room was catalogued and each
device’s communication capabilities were determined and recorded. Operating room administrative,
patient care and hospital information systems were also catalogued and their interface opportunities
determined.
Since device data sources under investigation mostly did not implement the IEEE 1073 Medical
Information Bus, each device’s communication protocol and data definition were analyzed to ascertain that
it could be read by a commercially available data integration system. Using the physiologic monitor as an
example, we determined that the chosen integration software (LiveData OR RTI Server, LiveData, Inc.,
Cambridge, MA) could capture all device data, including detailed physiological waveform data and all
critical data elements, without data loss and in real time. Similar analyses were performed for data coming
from the other OR equipment, as well as administrative, patient care, and hospital information systems.
Implementation of a Computerized Perioperative Data Integration and Display System – Sandberg – Page 5
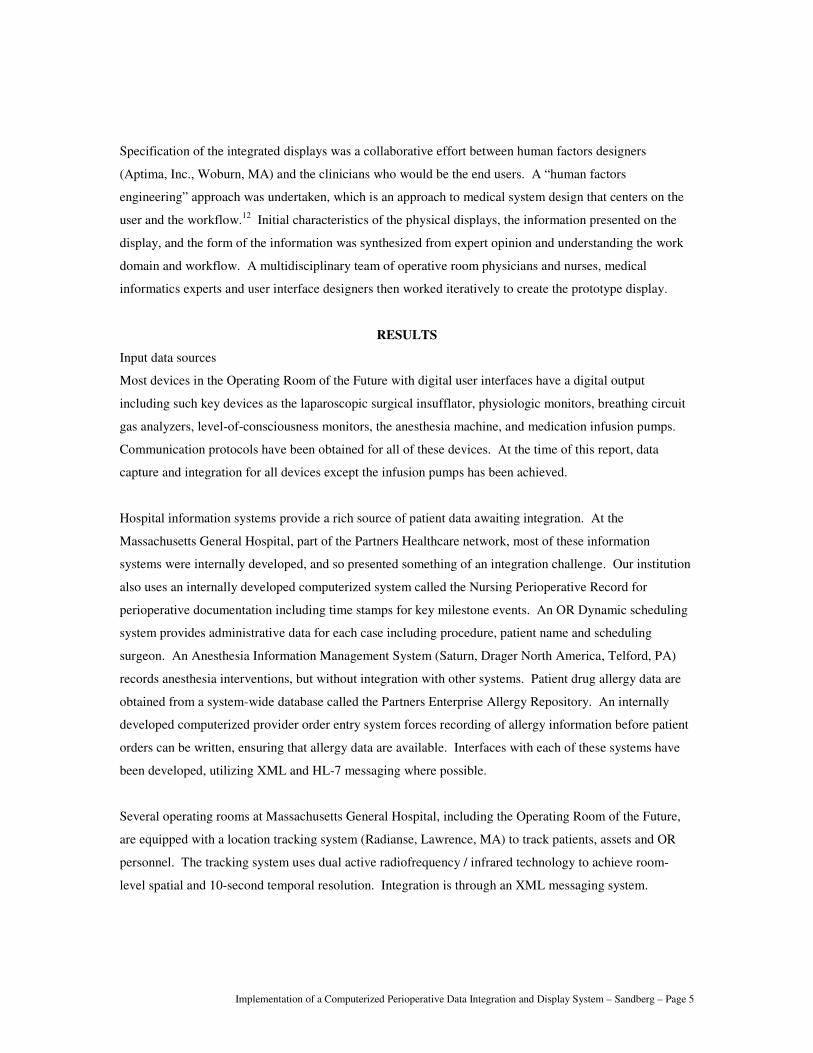
Specification of the integrated displays was a collaborative effort between human factors designers
(Aptima, Inc., Woburn, MA) and the clinicians who would be the end users. A “human factors
engineering” approach was undertaken, which is an approach to medical system design that centers on the
user and the workflow.12
Initial characteristics of the physical displays, the information presented on the
display, and the form of the information was synthesized from expert opinion and understanding the work
domain and workflow. A multidisciplinary team of operative room physicians and nurses, medical
informatics experts and user interface designers then worked iteratively to create the prototype display.
RESULTS
Input data sources
Most devices in the Operating Room of the Future with digital user interfaces have a digital output
including such key devices as the laparoscopic surgical insufflator, physiologic monitors, breathing circuit
gas analyzers, level-of-consciousness monitors, the anesthesia machine, and medication infusion pumps.
Communication protocols have been obtained for all of these devices. At the time of this report, data
capture and integration for all devices except the infusion pumps has been achieved.
Hospital information systems provide a rich source of patient data awaiting integration. At the
Massachusetts General Hospital, part of the Partners Healthcare network, most of these information
systems were internally developed, and so presented something of an integration challenge. Our institution
also uses an internally developed computerized system called the Nursing Perioperative Record for
perioperative documentation including time stamps for key milestone events. An OR Dynamic scheduling
system provides administrative data for each case including procedure, patient name and scheduling
surgeon. An Anesthesia Information Management System (Saturn, Drager North America, Telford, PA)
records anesthesia interventions, but without integration with other systems. Patient drug allergy data are
obtained from a system-wide database called the Partners Enterprise Allergy Repository. An internally
developed computerized provider order entry system forces recording of allergy information before patient
orders can be written, ensuring that allergy data are available. Interfaces with each of these systems have
been developed, utilizing XML and HL-7 messaging where possible.
Several operating rooms at Massachusetts General Hospital, including the Operating Room of the Future,
are equipped with a location tracking system (Radianse, Lawrence, MA) to track patients, assets and OR
personnel. The tracking system uses dual active radiofrequency / infrared technology to achieve room-
level spatial and 10-second temporal resolution. Integration is through an XML messaging system.
Implementation of a Computerized Perioperative Data Integration and Display System – Sandberg – Page 6
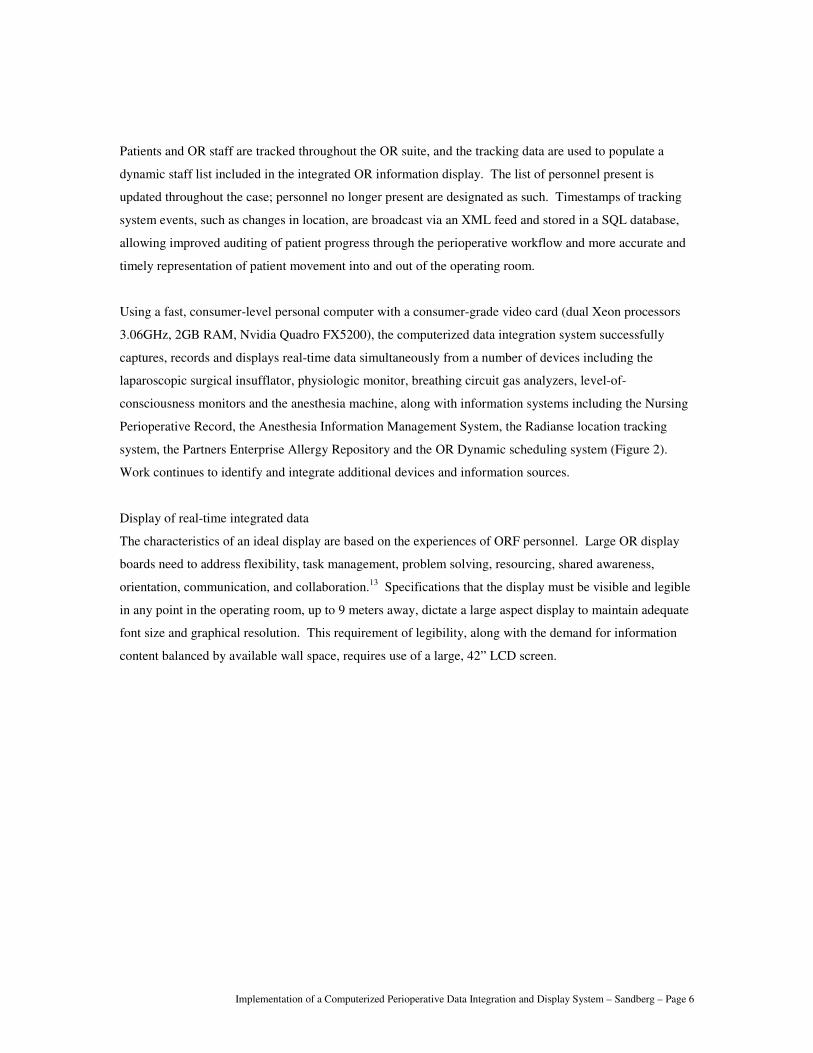
Patients and OR staff are tracked throughout the OR suite, and the tracking data are used to populate a
dynamic staff list included in the integrated OR information display. The list of personnel present is
updated throughout the case; personnel no longer present are designated as such. Timestamps of tracking
system events, such as changes in location, are broadcast via an XML feed and stored in a SQL database,
allowing improved auditing of patient progress through the perioperative workflow and more accurate and
timely representation of patient movement into and out of the operating room.
Using a fast, consumer-level personal computer with a consumer-grade video card (dual Xeon processors
3.06GHz, 2GB RAM, Nvidia Quadro FX5200), the computerized data integration system successfully
captures, records and displays real-time data simultaneously from a number of devices including the
laparoscopic surgical insufflator, physiologic monitor, breathing circuit gas analyzers, level-of-
consciousness monitors and the anesthesia machine, along with information systems including the Nursing
Perioperative Record, the Anesthesia Information Management System, the Radianse location tracking
system, the Partners Enterprise Allergy Repository and the OR Dynamic scheduling system (Figure 2).
Work continues to identify and integrate additional devices and information sources.
Display of real-time integrated data
The characteristics of an ideal display are based on the experiences of ORF personnel. Large OR display
boards need to address flexibility, task management, problem solving, resourcing, shared awareness,
orientation, communication, and collaboration.13
Specifications that the display must be visible and legible
in any point in the operating room, up to 9 meters away, dictate a large aspect display to maintain adequate
font size and graphical resolution. This requirement of legibility, along with the demand for information
content balanced by available wall space, requires use of a large, 42” LCD screen.
Implementation of a Computerized Perioperative Data Integration and Display System – Sandberg – Page 7
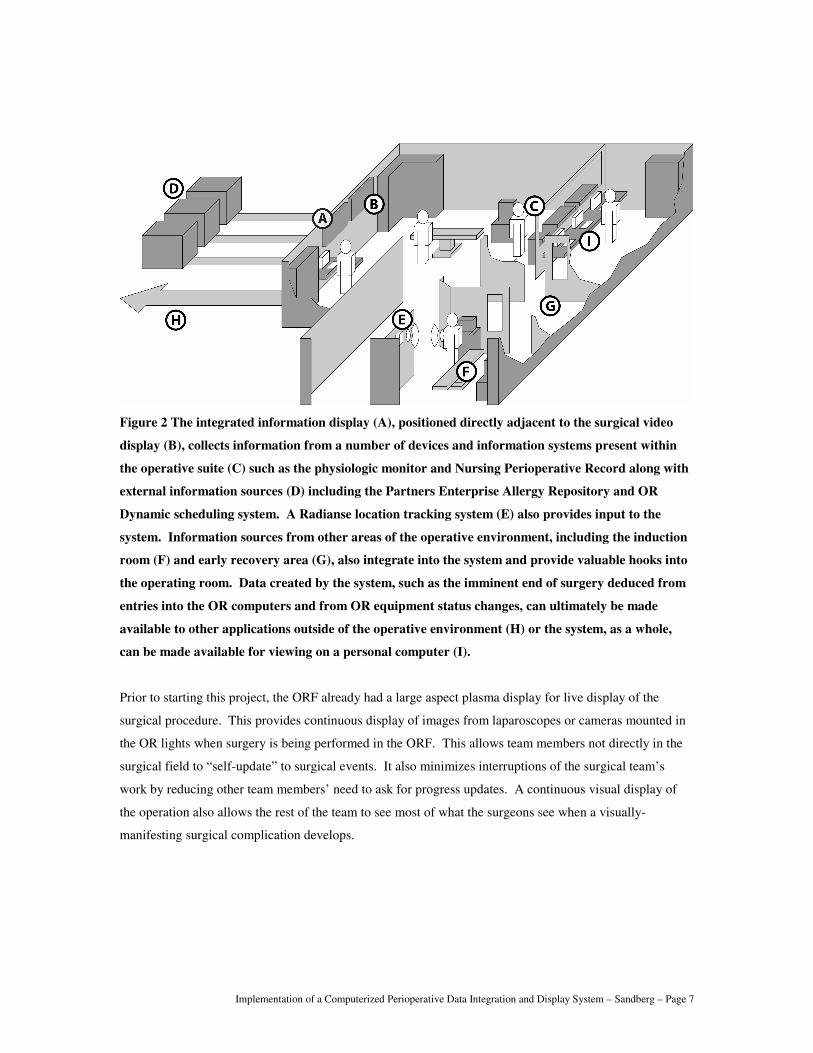
Figure 2 The integrated information display (A), positioned directly adjacent to the surgical video
display (B), collects information from a number of devices and information systems present within
the operative suite (C) such as the physiologic monitor and Nursing Perioperative Record along with
external information sources (D) including the Partners Enterprise Allergy Repository and OR
Dynamic scheduling system. A Radianse location tracking system (E) also provides input to the
system. Information sources from other areas of the operative environment, including the induction
room (F) and early recovery area (G), also integrate into the system and provide valuable hooks into
the operating room. Data created by the system, such as the imminent end of surgery deduced from
entries into the OR computers and from OR equipment status changes, can ultimately be made
available to other applications outside of the operative environment (H) or the system, as a whole,
can be made available for viewing on a personal computer (I).
Prior to starting this project, the ORF already had a large aspect plasma display for live display of the
surgical procedure. This provides continuous display of images from laparoscopes or cameras mounted in
the OR lights when surgery is being performed in the ORF. This allows team members not directly in the
surgical field to “self-update” to surgical events. It also minimizes interruptions of the surgical team’s
work by reducing other team members’ need to ask for progress updates. A continuous visual display of
the operation also allows the rest of the team to see most of what the surgeons see when a visually-
manifesting surgical complication develops.
Implementation of a Computerized Perioperative Data Integration and Display System – Sandberg – Page 8
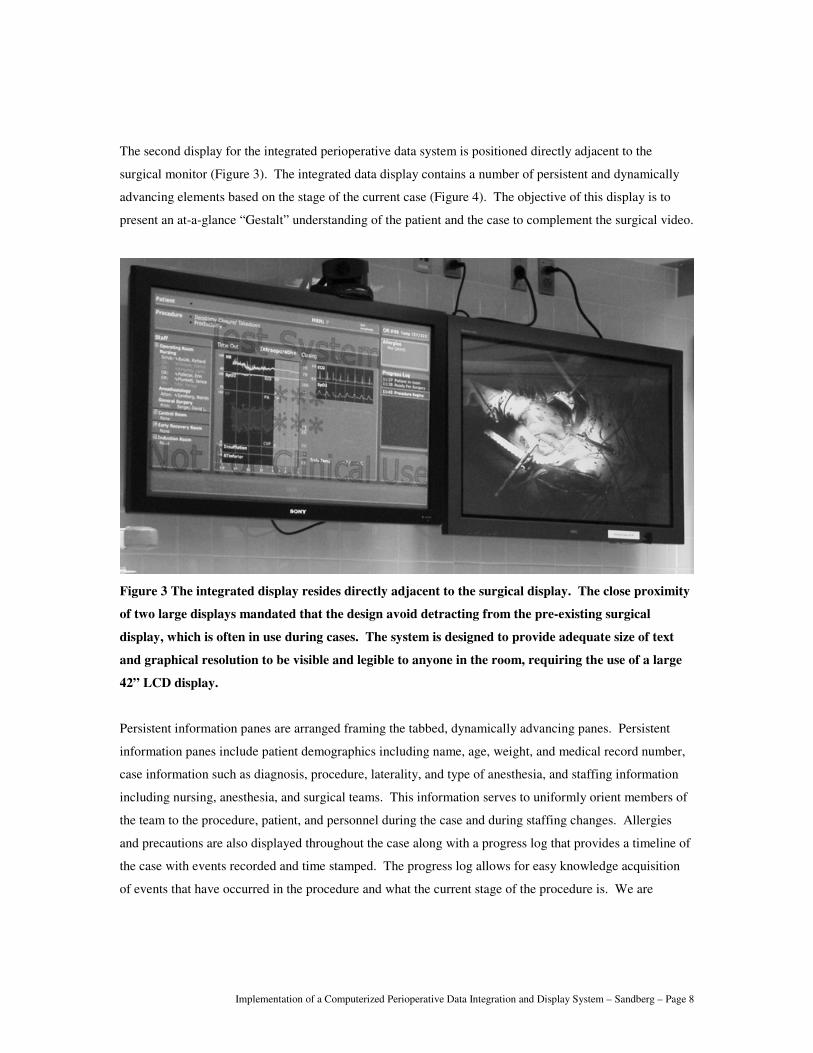
The second display for the integrated perioperative data system is positioned directly adjacent to the
surgical monitor (Figure 3). The integrated data display contains a number of persistent and dynamically
advancing elements based on the stage of the current case (Figure 4). The objective of this display is to
present an at-a-glance “Gestalt” understanding of the patient and the case to complement the surgical video.
Figure 3 The integrated display resides directly adjacent to the surgical display. The close proximity
of two large displays mandated that the design avoid detracting from the pre-existing surgical
display, which is often in use during cases. The system is designed to provide adequate size of text
and graphical resolution to be visible and legible to anyone in the room, requiring the use of a large
42” LCD display.
Persistent information panes are arranged framing the tabbed, dynamically advancing panes. Persistent
information panes include patient demographics including name, age, weight, and medical record number,
case information such as diagnosis, procedure, laterality, and type of anesthesia, and staffing information
including nursing, anesthesia, and surgical teams. This information serves to uniformly orient members of
the team to the procedure, patient, and personnel during the case and during staffing changes. Allergies
and precautions are also displayed throughout the case along with a progress log that provides a timeline of
the case with events recorded and time stamped. The progress log allows for easy knowledge acquisition
of events that have occurred in the procedure and what the current stage of the procedure is. We are
Implementation of a Computerized Perioperative Data Integration and Display System – Sandberg – Page 9
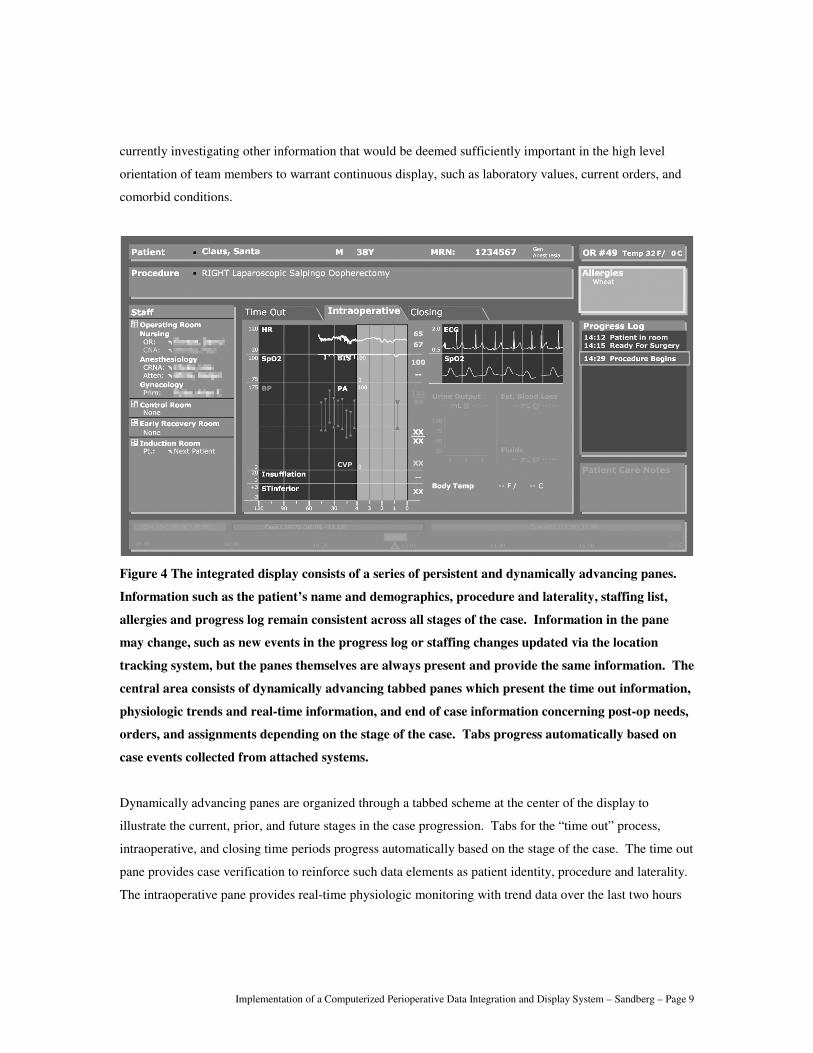
currently investigating other information that would be deemed sufficiently important in the high level
orientation of team members to warrant continuous display, such as laboratory values, current orders, and
comorbid conditions.
Figure 4 The integrated display consists of a series of persistent and dynamically advancing panes.
Information such as the patient’s name and demographics, procedure and laterality, staffing list,
allergies and progress log remain consistent across all stages of the case. Information in the pane
may change, such as new events in the progress log or staffing changes updated via the location
tracking system, but the panes themselves are always present and provide the same information. The
central area consists of dynamically advancing tabbed panes which present the time out information,
physiologic trends and real-time information, and end of case information concerning post-op needs,
orders, and assignments depending on the stage of the case. Tabs progress automatically based on
case events collected from attached systems.
Dynamically advancing panes are organized through a tabbed scheme at the center of the display to
illustrate the current, prior, and future stages in the case progression. Tabs for the “time out” process,
intraoperative, and closing time periods progress automatically based on the stage of the case. The time out
pane provides case verification to reinforce such data elements as patient identity, procedure and laterality.
The intraoperative pane provides real-time physiologic monitoring with trend data over the last two hours
Implementation of a Computerized Perioperative Data Integration and Display System – Sandberg – Page 10
and detailed data over the last five minutes. Additional information such as estimated blood loss and urine
output can be presented graphically and numerically along with time stamps to provide an estimate of data
staleness. The closing pane provides information on the post-anesthesia care unit (PACU) assignment and
post-op notifications, needs, and orders.
Flexibility of the entire system is a design mantra that informs the display. The display itself is created
using scalable vector graphics (SVG) and as a result, is able to also be displayed in a web browser that has
the Adobe SVG viewer installed. SVG is an XML markup language for creating vector graphics and is an
open standard created by the World Wide Web Consortium. This allows for very rapid changes to the
system display, especially crucial when prototyping from user feedback, and a practically infinite degree of
customizability. With an arbitrary granularity possible, from having unique displays for each surgical team
to having a single display standard for the entire institution, we provide a small subset of screen display
options to cover the basic types of procedures that would have significantly different subsets of data
available. For example, a laparoscopic case would require display of the surgical insufflator while a case
not using the insufflator need not display that blank screen real estate for a device that will not be used.
DISCUSSION
We have successfully created a system that displays all critical perioperative data pertaining to the OR
patient, as well as key elements of upstream and downstream workloads, on a single large format display.
These data include: surgical field video, output from surgical devices, physiologic and level of
consciousness monitors, anesthesia delivery systems, infusion pumps and hospital information systems. We
also incorporate data from an active RFID patient and personnel tracking system, thus populating the OR
personnel roster with instantaneous data.
Presenting the vast amount of information from hospital information systems, anesthesia and surgical
systems, surgical equipment, and workflow support systems in a usable and cohesive way on a single wall-
mounted display is a challenge. The information must be rich, complete, accurate, and useful for team
situational awareness and also visible and legible anywhere in the operating room, up to nine meters away.
We have accomplished this cross platform and cross disciplinary integration of digital information sources
in the operative and perioperative environment. This allows for improved context-sensitive information
display and decision support where a concise subset of critical data is projected, improved access to
information through real-time equipment, material and personnel readiness information, and sophisticated
Implementation of a Computerized Perioperative Data Integration and Display System – Sandberg – Page 11
utilization of information to improve workflow, safety and visualization of information that was previously
unattainable.
The immediate next step in this project is to assess users’ perceptions of the system’s success at achieving
the goal of creating a unified picture of critical perioperative patient data. We are doing this through pre-
and post-installation surveys. Pre-installation surveys administered prior to the prototype installation
introduced members of the clinical team, including physicians and nursing staff, to the system through
educational material and then questioned them on their perceived utility of such a system. Personnel also
completed the Safety Attitudes Questionnaire (SAQ), a derivative of the Flight Management Attitudes
Questionnaire (FMAQ) used in commercial aviation, to assess attitudes about safety. The SAQ was
generated by focus groups of healthcare providers, review of literature and discussions with experts to
generate a tool designed to assess six scales: teamwork climate, job satisfaction, perceptions of
management, safety climate, working conditions, and stress recognition. Thus we used it to obtain baseline
data about ORF team members’ perceptions about the safety climate prior to system prototype installation.
Post-installation questionnaires will again assess utility of the system and its component elements after
clinical teams have used the system for ten weeks. We will also conduct a second administration of the
Safety Attitudes Questionnaire. Also included is a modified version of the Questionnaire for User
Interaction Satisfaction (QUIS). This tool was designed to assess users’ subjective satisfaction with
specific elements of the human-computer interface. The QUIS measures overall system satisfaction along
six scales along with eleven specific interface factors including screen factors, terminology and system
feedback, learning factors, system capabilities, technical manuals, on-line tutorials, multimedia, voice
recognition, virtual environments, internet access, and software installation. As designed, the questionnaire
has been configured according to the needs of our interface analysis, only including sections of interest to
us.
Future Direction
Looking farther ahead, we believe that part of the overall benefit of the system will be the creation of new
information and data streams through the integration and processing of information. By integrating with
the hospital patient record, OR scheduling information, and patient location information obtained through
the indoor positioning system, completely automatic process monitoring and exception detection functions
will be enabled in the perioperative environment. As a proof-of-concept, we have demonstrated fully
automatic detection and notification of wrong patient / wrong location errors.14
More fundamental
Implementation of a Computerized Perioperative Data Integration and Display System – Sandberg – Page 12
applications of this concept include sending automatic alerts to provide necessary surgical equipment to
ORs about to start cases for which the needed devices are missing.
These forms of decision support need not be purely geographically based. For example, Xiao, et al, have
demonstrated the use of vital signs data flowing from networked monitors to help establish the patient in-
and out-time for real-time operating room management.15
With additional complementary information
including real-time location tracking and events from an anesthesia information system, sophisticated and
intelligent PACU scheduling may occur for better utilization of available bed space and improved bed
management with patient turnover. Through the use of physiologic information and automatically
generated events through several clinical sources, the system could evaluate parameters indicating
readiness for patient transport to the PACU. As a result, PACU bed management could be informed
through the system of when a patient is actually likely to be ready and adjust accordingly for procedures
taking an undue length of time. Other opportunities to utilize the integrated data to provide new
information are being investigated.
Decision support presents fertile ground for utilizing the summation of operative and perioperative data to
provide additional information concerning the patient. Utilizing physiologic information, it has been
shown that decision support applications can be augmented through expert systems that help create and
validate alarms based on physiologic parameters; the integration of information from several sources
improves reliability of alarms, decreases false alarms, has fewer missed alarms, and creates alarms that are
more clinically acceptable.16-18
This provides a basis for utilizing integrated medical data to provide
clinically relevant “smart” alarms during the perioperative process for decision support and augmented
vigilance in the operative environment. Algorithms to extract relevant information from patient, procedure,
and OR data to help guide intraoperative processes are required and future work will focus on this area.5
We are developing augmented vigilance and decision support components by cataloguing input sources,
including devices and information system interfaces, and systematically seeking opportunities for data
integration and synthesis of available information. The goal is to identify instances in which clinicians and
staff in the operating room manually perform this integration during patient care, and also to investigate
new opportunities for data integration and synthesis. A near miss catalogue is being created based on
expert experience from anesthesiologists, surgeons and nurses; near misses are events or situations that
could have negatively impacted patient outcome if not detected and corrected. The data source and
integration catalogue is being cross-referenced with the near miss catalogue to identify instances where
Implementation of a Computerized Perioperative Data Integration and Display System – Sandberg – Page 13
near-miss detection and correction could be improved through more comprehensive recording and
integration of operating room data.
The cataloguing and cross referencing of data sources against typical near miss events is revealing potential
targets for near miss reduction. Clinical scenarios are being developed to be used in proof of concept
demonstration and testing under a simulated operative setting based on feasibility of decision support
algorithm, frequency of near miss event, and impact of timely intervention.
Additional interfaces and data sources are being investigated to extend the system beyond the operating
room and ultimately, be able to provide a complete picture of the patient throughout the entirety of the
perioperative process. Opportunities for data integration and processing are being investigated to increase
the value provided by the system as a whole to provide decision support, augmented vigilance, and
workflow support, increasing both efficiency and safety in the perioperative environment by sophisticated
utilization of information that was previously unattainable.
ACKNOWLEDGEMENTS
This work is supported by the Telemedicine and Advanced Technology Research Center, U.S. Army
Medical Research and Materiel Command under Contract No. DAMD17-W81XWH-04-C-0015. The
views, opinions and/or findings contained in this report are those of the authors and should not be construed
as an official Department of the Army position, policy or decision unless so designated by other
documentation.
REFERENCES
1. Hanss, R., et al., Overlapping induction of anesthesia: an analysis of benefits and costs. Anesthesiology, 2005. 103(2): p. 391-400.
2. Sandberg, W.S., et al., Deliberate perioperative systems design improves operating room throughput. Anesthesiology, 2005. 103(2): p. 406-18.
3. Torkki, P.M., et al., Use of anesthesia induction rooms can increase the number of urgent orthopedic cases completed within 7 hours. Anesthesiology, 2005. 103(2): p. 401-5.
4. Merrell, R.C., et al., Telemedicine for the operating room of the future. Semin Laparosc Surg, 2003. 10(2): p. 91-4.
5. Rattner, D.W. and A. Park, Advanced devices for the operating room of the future. Seminars in Laparoscopic Surgery, 2003. 10(2): p. 85-9.
6. Sandberg, W.S., T.J. Ganous, and C. Steiner, Setting a research agenda for perioperative systems design. Seminars in Laparoscopic Surgery, 2003. 10(2): p. 57-70.
7. Moss, J. and Y. Xiao, Improving operating room coordination: communication pattern assessment. Journal of Nursing Administration, 2004. 34(2): p. 93-100.
Implementation of a Computerized Perioperative Data Integration and Display System – Sandberg – Page 14
8. Lingard, L., et al., Communication failures in the operating room: an observational classification of recurrent types and effects.[see comment]. Quality & Safety in Health Care, 2004. 13(5): p. 330-4.
9. Guerlain, S., et al., Assessing team performance in the operating room: development and use of a "black-box" recorder and other tools for the intraoperative environment. Journal of the American College of Surgeons, 2005. 200(1): p. 29-37.
10. Plasters, C.L., F.J. Seagull, and Y. Xiao, Coordination challenges in operating-room management: an in-depth field study. AMIA ... Annual Symposium Proceedings/AMIA Symposium, 2003: p. 524-8.
11. Marvik, R., T. Lango, and Y. Yavuz, An experimental operating room project for advanced laparoscopic surgery. Seminars in Laparoscopic Surgery, 2004. 11(3): p. 211-6.
12. Dain, S., Normal accidents: human error and medical equipment design. Heart Surg Forum, 2002. 5(3): p. 254-7.
13. Lasome, C.E. and Y. Xiao, Large public display boards: a case study of an OR board and design implications. Proceedings / AMIA ... Annual Symposium, 2001: p. 349-53.
14. Sandberg, W.S., et al., Automatic detection and notification of "wrong patient-wrong location'' errors in the operating room. Surgical Innovation, 2005. 12: p. 253-60.
15. Xiao, Y., et al., An algorithm for processing vital sign monitoring data to remotely identify operating room occupancy in real-time. Anesthesia & Analgesia, 2005. 101(3): p. 823-9.
16. Oberli, C., et al., An expert system for monitor alarm integration. Journal of Clinical Monitoring & Computing, 1999. 15(1): p. 29-35.
17. Krol, M. and D.L. Reich, Development of a decision support system to assist anesthesiologists in operating room. Journal of Medical Systems, 2000. 24(3): p. 141-6.
18. Navabi, M.J., et al., Integrated monitoring can detect critical events and improve alarm accuracy. Journal of Clinical Engineering, 1991. 16(4): p. 295-306.