Embed Size (px)
Citation preview
Proceedings of ISER 77th International Conference, Toronto, Canada, 28th-29th September 2017
29
IMPLEMENTATION AND EFFECTS OF TOTAL PRODUCTIVE MAINTENANCE (TPM)
GURVINDER SINGH BAJWA
E-mail: [email protected]
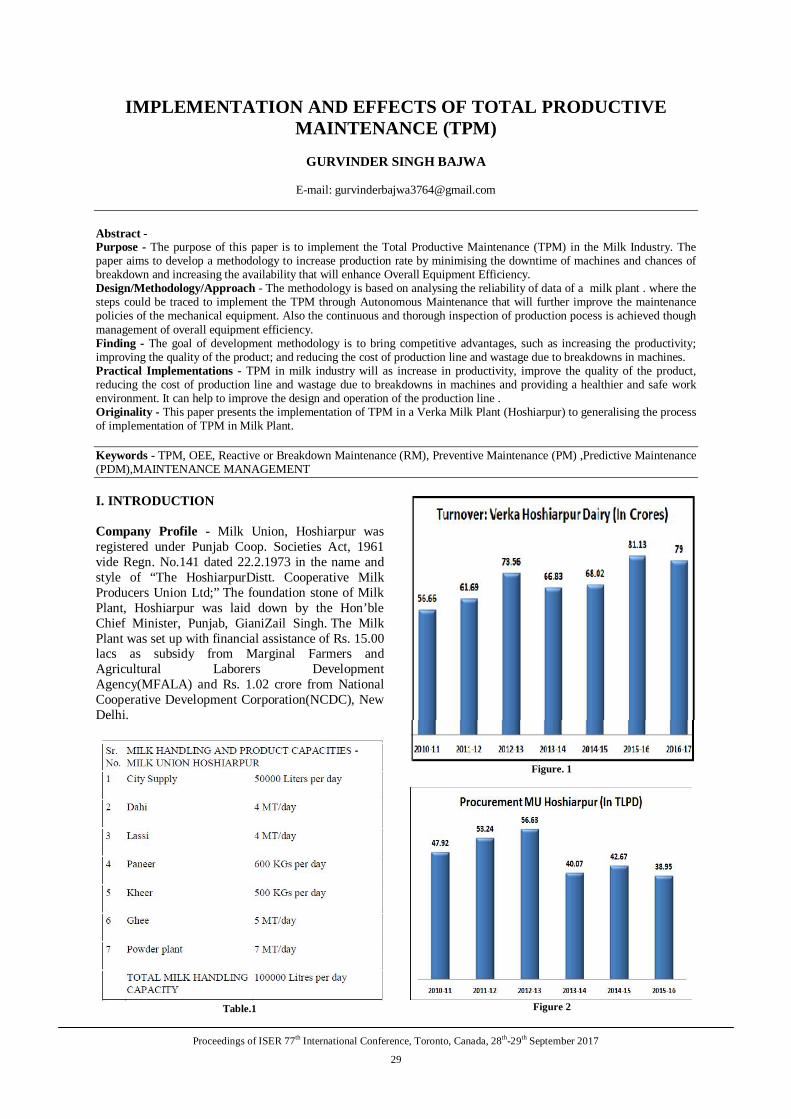
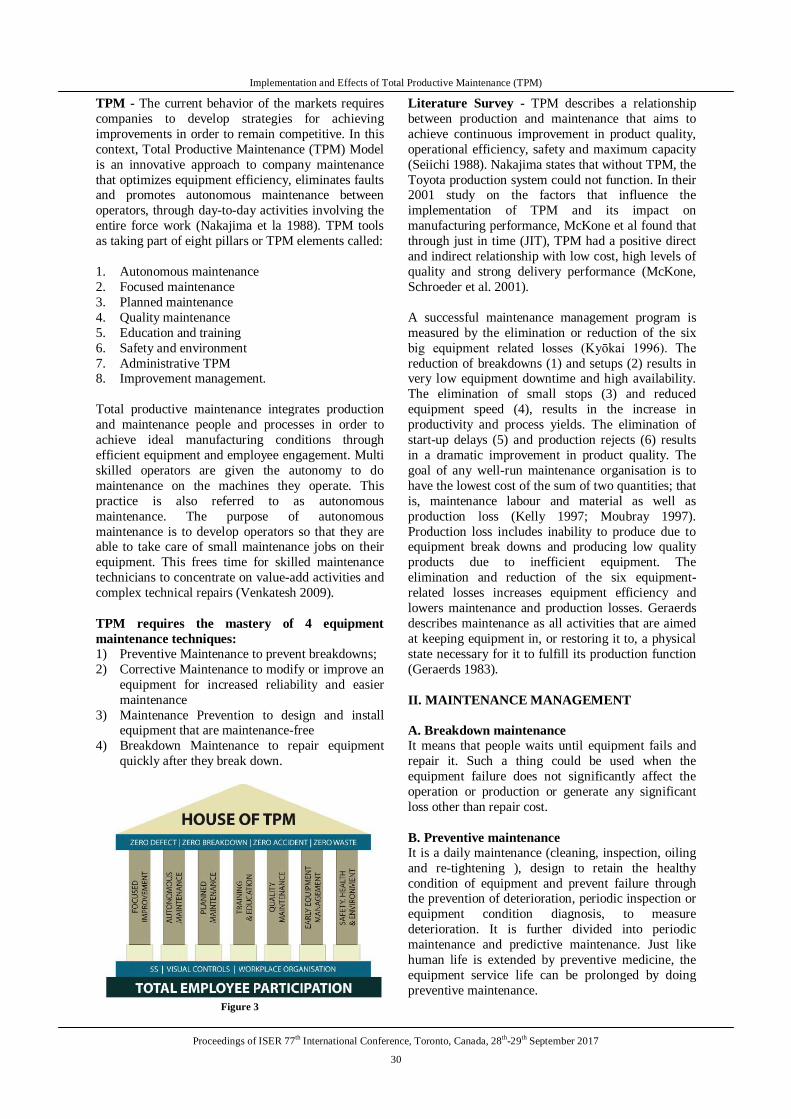
Abstract - Purpose - The purpose of this paper is to implement the Total Productive Maintenance (TPM) in the Milk Industry. The paper aims to develop a methodology to increase production rate by minimising the downtime of machines and chances of breakdown and increasing the availability that will enhance Overall Equipment Efficiency. Design/Methodology/Approach - The methodology is based on analysing the reliability of data of a milk plant . where the steps could be traced to implement the TPM through Autonomous Maintenance that will further improve the maintenance policies of the mechanical equipment. Also the continuous and thorough inspection of production pocess is achieved though management of overall equipment efficiency. Finding - The goal of development methodology is to bring competitive advantages, such as increasing the productivity; improving the quality of the product; and reducing the cost of production line and wastage due to breakdowns in machines. Practical Implementations - TPM in milk industry will as increase in productivity, improve the quality of the product, reducing the cost of production line and wastage due to breakdowns in machines and providing a healthier and safe work environment. It can help to improve the design and operation of the production line . Originality - This paper presents the implementation of TPM in a Verka Milk Plant (Hoshiarpur) to generalising the process of implementation of TPM in Milk Plant. Keywords - TPM, OEE, Reactive or Breakdown Maintenance (RM), Preventive Maintenance (PM) ,Predictive Maintenance (PDM),MAINTENANCE MANAGEMENT I. INTRODUCTION Company Profile - Milk Union, Hoshiarpur was registered under Punjab Coop. Societies Act, 1961 vide Regn. No.141 dated 22.2.1973 in the name and style of “The HoshiarpurDistt. Cooperative Milk Producers Union Ltd;” The foundation stone of Milk Plant, Hoshiarpur was laid down by the Hon’ble Chief Minister, Punjab, GianiZail Singh. The Milk Plant was set up with financial assistance of Rs. 15.00 lacs as subsidy from Marginal Farmers and Agricultural Laborers Development Agency(MFALA) and Rs. 1.02 crore from National Cooperative Development Corporation(NCDC), New Delhi.
Table.1
Figure. 1
Figure 2
Implementation and Effects of Total Productive Maintenance (TPM)
Proceedings of ISER 77th International Conference, Toronto, Canada, 28th-29th September 2017
30
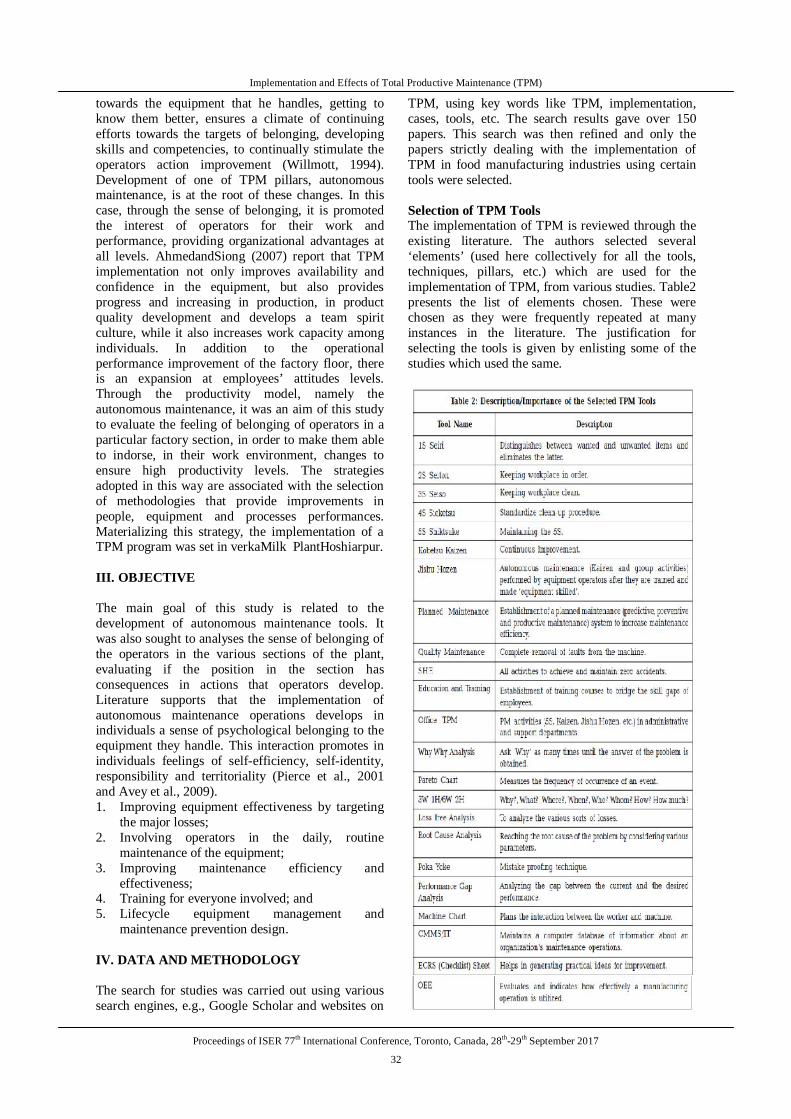
TPM - The current behavior of the markets requires companies to develop strategies for achieving improvements in order to remain competitive. In this context, Total Productive Maintenance (TPM) Model is an innovative approach to company maintenance that optimizes equipment efficiency, eliminates faults and promotes autonomous maintenance between operators, through day-to-day activities involving the entire force work (Nakajima et la 1988). TPM tools as taking part of eight pillars or TPM elements called: 1. Autonomous maintenance 2. Focused maintenance 3. Planned maintenance 4. Quality maintenance 5. Education and training 6. Safety and environment 7. Administrative TPM 8. Improvement management. Total productive maintenance integrates production and maintenance people and processes in order to achieve ideal manufacturing conditions through efficient equipment and employee engagement. Multi skilled operators are given the autonomy to do maintenance on the machines they operate. This practice is also referred to as autonomous maintenance. The purpose of autonomous maintenance is to develop operators so that they are able to take care of small maintenance jobs on their equipment. This frees time for skilled maintenance technicians to concentrate on value-add activities and complex technical repairs (Venkatesh 2009). TPM requires the mastery of 4 equipment maintenance techniques: 1) Preventive Maintenance to prevent breakdowns; 2) Corrective Maintenance to modify or improve an
equipment for increased reliability and easier maintenance
3) Maintenance Prevention to design and install equipment that are maintenance-free
4) Breakdown Maintenance to repair equipment quickly after they break down.
Figure 3
Literature Survey - TPM describes a relationship between production and maintenance that aims to achieve continuous improvement in product quality, operational efficiency, safety and maximum capacity (Seiichi 1988). Nakajima states that without TPM, the Toyota production system could not function. In their 2001 study on the factors that influence the implementation of TPM and its impact on manufacturing performance, McKone et al found that through just in time (JIT), TPM had a positive direct and indirect relationship with low cost, high levels of quality and strong delivery performance (McKone, Schroeder et al. 2001). A successful maintenance management program is measured by the elimination or reduction of the six big equipment related losses (Kyōkai 1996). The reduction of breakdowns (1) and setups (2) results in very low equipment downtime and high availability. The elimination of small stops (3) and reduced equipment speed (4), results in the increase in productivity and process yields. The elimination of start-up delays (5) and production rejects (6) results in a dramatic improvement in product quality. The goal of any well-run maintenance organisation is to have the lowest cost of the sum of two quantities; that is, maintenance labour and material as well as production loss (Kelly 1997; Moubray 1997). Production loss includes inability to produce due to equipment break downs and producing low quality products due to inefficient equipment. The elimination and reduction of the six equipment-related losses increases equipment efficiency and lowers maintenance and production losses. Geraerds describes maintenance as all activities that are aimed at keeping equipment in, or restoring it to, a physical state necessary for it to fulfill its production function (Geraerds 1983). II. MAINTENANCE MANAGEMENT A. Breakdown maintenance It means that people waits until equipment fails and repair it. Such a thing could be used when the equipment failure does not significantly affect the operation or production or generate any significant loss other than repair cost. B. Preventive maintenance It is a daily maintenance (cleaning, inspection, oiling and re-tightening ), design to retain the healthy condition of equipment and prevent failure through the prevention of deterioration, periodic inspection or equipment condition diagnosis, to measure deterioration. It is further divided into periodic maintenance and predictive maintenance. Just like human life is extended by preventive medicine, the equipment service life can be prolonged by doing preventive maintenance.

Implementation and Effects of Total Productive Maintenance (TPM)
Proceedings of ISER 77th International Conference, Toronto, Canada, 28th-29th September 2017
31
C. Periodic maintenance (Time based maintenance - TBM) Time based maintenance consists of periodically inspecting, servicing and cleaning equipment and replacing parts to prevent sudden failure and process problems. D. Predictive maintenance This is a method in which the service life of important part is predicted based on inspection or diagnosis, in order to use the parts to the limit of their service life. Compared to periodic maintenance, predictive maintenance is condition based maintenance. It manages trend values, by measuring and analyzing data about deterioration and employs a surveillance system, designed to monitor conditions through an on-line system. E. Corrective maintenance It improves equipment and its components so that preventive maintenance can be carried out reliably. Equipment with design weakness must be redesigned to improve reliability or improving maintainability. F. Maintenance prevention It indicates the design of a new equipment. Weakness of current machines are sufficiently studied ( on site information leading to failure prevention, easier maintenance and prevents of defects, safety and ease of manufacturing ) and are incorporated before commissioning a new equipment. Preventive Maintenance (PM) Preventive maintenance started to emerge in the early 1950s as a new and improved development from reactive maintenance. Rather than run equipment to failure, preventive maintenance aims to increase equipment availability and reliability by preventing breakdowns and prolonging equipment life. In the execution of this strategy, maintenance activities are undertaken after a specified period of time or amount of machine usage (Gits 1992). Planning maintenance activities to avoid production disruptions and maintaining equipment before it completely breaks down reduces maintenance costs like labour, parts, downtime and quality. Some of the activities associated with preventive maintenance are planning, inspections, cleaning, adjustments, lubrication and parts replacement. As more preventive maintenance is carried out, the costs of PM rises, but the cost of reactive maintenance falls. The total maintenance costs also goes down until it reaches an optimum level, were increasing PM activities starts to have a negative effect on the overall maintenance cost. Figure 4 shows maintenance cost versus increase in PM and decrease in RM activities. The cost-effective point of balance between preventive and reactive maintenance activities is within range L. (Levitt 2003). Studies indicate that these savings can amount to as much as 12% to 18% on the average over a
reactive maintenance strategy (Gregory, Aldo et al. 2004). As much as preventive maintenance is a better strategy than reactive maintenance, it has its own short comings like; it requires more resources to carryout regular PM activities. The strategy cannot eliminate unexpected equipment failures. The carrying out of some PM activities maybe unnecessary and could result in service errors that lower equipment life.
Figure 5 - Total Maintenance costs due to lowering RM and
increasing PM. Courtesy of Complete guide to PM and predictive maintenance – J. Levitt.
Predictive Maintenance (PDM) Predictive maintenance, also known as condition based maintenance (CBM), is a maintenance strategy, whose activities are initiated based on the condition of the equipment rather than on a time schedule or amount of machine usage as in preventive maintenance (Beebe 2004). This improves the use of maintenance resources in that only necessary maintenance activities are executed. Equipment will be scheduled for maintenance only when its condition starts to deteriorate. There is less production disruption as equipment can be planned to be taken out of service on evidence of deterioration. Different diagnostic techniques are used to measure the physical condition of the equipment such as temperature, noise, vibration, lubrication and corrosion (Chary 2004). These are depended on the condition that needs to be monitored. Temperature is used to detect loose electrical connections, damaged insulation or lack of ventilation. Vibration analysis is used to detect misalignment, rotation imbalance, bent shafts or damaged bearings. Problem Statement To improve the operational status of a company, there are required strategies that aim to eliminate waste, ensure quality and reduce costs. The approach to Total Productive Maintenance (TPM) leads to the development of methods and management tools that promote organizational change, especially at human resources level. TPM philosophy supports a culture in which the operator develops a sense of belonging
Implementation and Effects of Total Productive Maintenance (TPM)
Proceedings of ISER 77th International Conference, Toronto, Canada, 28th-29th September 2017
32
towards the equipment that he handles, getting to know them better, ensures a climate of continuing efforts towards the targets of belonging, developing skills and competencies, to continually stimulate the operators action improvement (Willmott, 1994). Development of one of TPM pillars, autonomous maintenance, is at the root of these changes. In this case, through the sense of belonging, it is promoted the interest of operators for their work and performance, providing organizational advantages at all levels. AhmedandSiong (2007) report that TPM implementation not only improves availability and confidence in the equipment, but also provides progress and increasing in production, in product quality development and develops a team spirit culture, while it also increases work capacity among individuals. In addition to the operational performance improvement of the factory floor, there is an expansion at employees’ attitudes levels. Through the productivity model, namely the autonomous maintenance, it was an aim of this study to evaluate the feeling of belonging of operators in a particular factory section, in order to make them able to indorse, in their work environment, changes to ensure high productivity levels. The strategies adopted in this way are associated with the selection of methodologies that provide improvements in people, equipment and processes performances. Materializing this strategy, the implementation of a TPM program was set in verkaMilk PlantHoshiarpur. III. OBJECTIVE The main goal of this study is related to the development of autonomous maintenance tools. It was also sought to analyses the sense of belonging of the operators in the various sections of the plant, evaluating if the position in the section has consequences in actions that operators develop. Literature supports that the implementation of autonomous maintenance operations develops in individuals a sense of psychological belonging to the equipment they handle. This interaction promotes in individuals feelings of self-efficiency, self-identity, responsibility and territoriality (Pierce et al., 2001 and Avey et al., 2009). 1. Improving equipment effectiveness by targeting
the major losses; 2. Involving operators in the daily, routine
maintenance of the equipment; 3. Improving maintenance efficiency and
effectiveness; 4. Training for everyone involved; and 5. Lifecycle equipment management and
maintenance prevention design. IV. DATA AND METHODOLOGY The search for studies was carried out using various search engines, e.g., Google Scholar and websites on
TPM, using key words like TPM, implementation, cases, tools, etc. The search results gave over 150 papers. This search was then refined and only the papers strictly dealing with the implementation of TPM in food manufacturing industries using certain tools were selected. Selection of TPM Tools The implementation of TPM is reviewed through the existing literature. The authors selected several ‘elements’ (used here collectively for all the tools, techniques, pillars, etc.) which are used for the implementation of TPM, from various studies. Table2 presents the list of elements chosen. These were chosen as they were frequently repeated at many instances in the literature. The justification for selecting the tools is given by enlisting some of the studies which used the same.
Implementation and Effects of Total Productive Maintenance (TPM)
Proceedings of ISER 77th International Conference, Toronto, Canada, 28th-29th September 2017
33
The companies were segregated on the basis of their industry types, viz., product, process and food manufacturing industries, and metadata analysis was carried out on each one of them individually to further analyze and categorize the various cases in depth.
Table 3
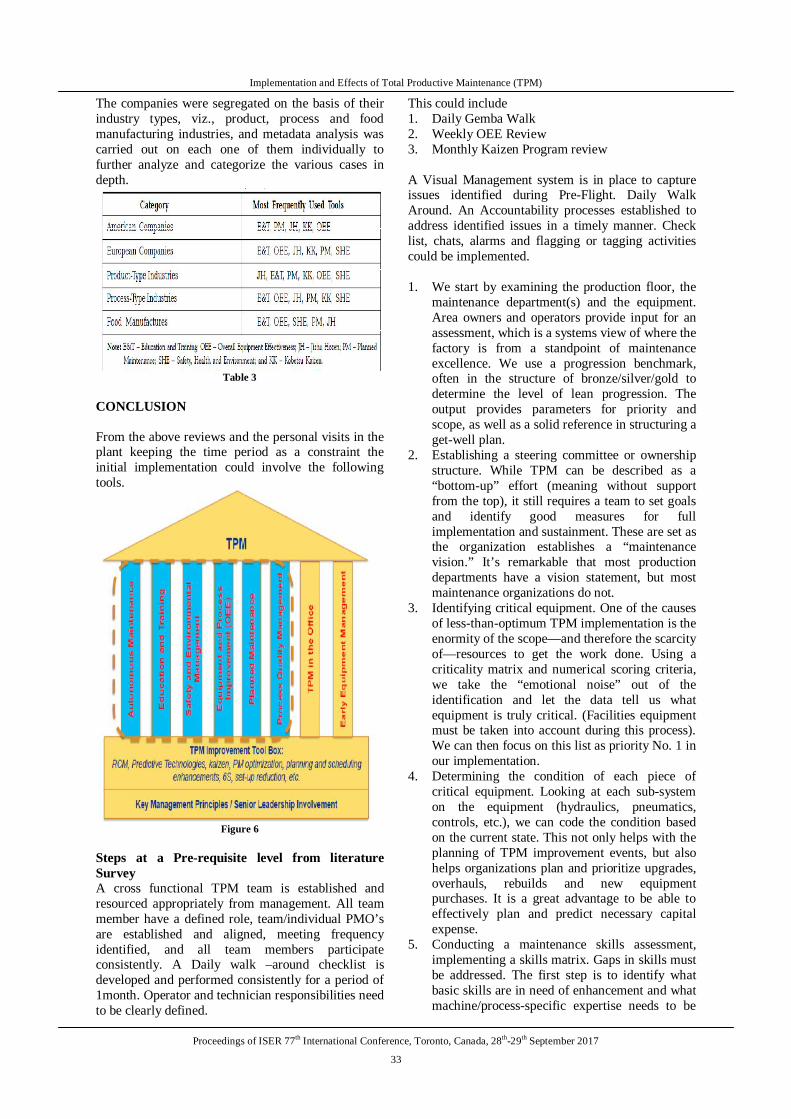
CONCLUSION From the above reviews and the personal visits in the plant keeping the time period as a constraint the initial implementation could involve the following tools.
Figure 6
Steps at a Pre-requisite level from literature Survey A cross functional TPM team is established and resourced appropriately from management. All team member have a defined role, team/individual PMO’s are established and aligned, meeting frequency identified, and all team members participate consistently. A Daily walk –around checklist is developed and performed consistently for a period of 1month. Operator and technician responsibilities need to be clearly defined.
This could include 1. Daily Gemba Walk 2. Weekly OEE Review 3. Monthly Kaizen Program review A Visual Management system is in place to capture issues identified during Pre-Flight. Daily Walk Around. An Accountability processes established to address identified issues in a timely manner. Check list, chats, alarms and flagging or tagging activities could be implemented. 1. We start by examining the production floor, the
maintenance department(s) and the equipment. Area owners and operators provide input for an assessment, which is a systems view of where the factory is from a standpoint of maintenance excellence. We use a progression benchmark, often in the structure of bronze/silver/gold to determine the level of lean progression. The output provides parameters for priority and scope, as well as a solid reference in structuring a get-well plan.
2. Establishing a steering committee or ownership structure. While TPM can be described as a “bottom-up” effort (meaning without support from the top), it still requires a team to set goals and identify good measures for full implementation and sustainment. These are set as the organization establishes a “maintenance vision.” It’s remarkable that most production departments have a vision statement, but most maintenance organizations do not.
3. Identifying critical equipment. One of the causes of less-than-optimum TPM implementation is the enormity of the scope—and therefore the scarcity of—resources to get the work done. Using a criticality matrix and numerical scoring criteria, we take the “emotional noise” out of the identification and let the data tell us what equipment is truly critical. (Facilities equipment must be taken into account during this process). We can then focus on this list as priority No. 1 in our implementation.
4. Determining the condition of each piece of critical equipment. Looking at each sub-system on the equipment (hydraulics, pneumatics, controls, etc.), we can code the condition based on the current state. This not only helps with the planning of TPM improvement events, but also helps organizations plan and prioritize upgrades, overhauls, rebuilds and new equipment purchases. It is a great advantage to be able to effectively plan and predict necessary capital expense.
5. Conducting a maintenance skills assessment, implementing a skills matrix. Gaps in skills must be addressed. The first step is to identify what basic skills are in need of enhancement and what machine/process-specific expertise needs to be

Implementation and Effects of Total Productive Maintenance (TPM)
Proceedings of ISER 77th International Conference, Toronto, Canada, 28th-29th September 2017
34
upgraded. This is also a good time to look at the structure of the department. Does your operation require PM/PdM teams and planners?
6. Creating a communications plan and determining initial metrics/measures. It is necessary that both maintenance and production organizations know the why/ how/when, and that changes are in store for everyone.
7. Prioritizing and planning workshops/ events/training. 8. Implementing, assessing and improving.
V. RECOMMENDATIONS TO INTRODUCE TPM AT INITIAL LEVEL Convincing the Top Management and get
approval for implementation of TPM Culture. Gemba Walk in the manufacturing area to get
details of various activities processes and instrumentation involved in it which is also a part of focus Kaizen.
Segregated the operation area in different zones with the help of production and engineering team applying 5S Principles.
Divided the work force each Zone wise per Shift. Prepare the plan maintenance chat and SOPs and
daily checksheets of various machines (which is missing in the organization till date).
Numbering of machines and instruments (missing till date) to prepare the machine history.
Introducing Autonomous Maintenance at operator level and recording it.
Various training programs will be schedule to train and motivate the work force for operator level maintenance, filling of checklist, prioritizing the maintenance requirements through different colors flags and increase the sense of belongingness with the machines.
To monitor the effectiveness of TPM the OEE will be taken in consideration.
Factors to measure the TPM Implementation 1. Machine Availability through machine history 2. Breakdown Time 3. Maintenance Cost 4. OEE ratings 5. Overall Profitability 5.1. Case Study of Verka Milk Plant Hoshiarpur TPM implementation is a big task and involves many decisions and factors which cannot be possible without the involvement of upper Management. Verka has organized the TPM training for all the upper level employees last year therefore the management was willing to implement TPM in their organization. To apply TPM concepts successfully to plant-maintenance activities, the entire workforce must first be convinced that the top-level management is committed to the program. The senior
management team has to set company-wide PM policies; that is placing goal-setting central to the TPM program promotional structure and committees. The middle management oversees the departmental polices, goal-setting and departmental PM promotional committees. The shop-floor management sets the PM goals according to team groups’ activities. In all, this will involve design, operation, maintenance, engineering and sales activities At the first stage we had a meeting in the office of the Managing Director hoshiarpur Milk Plant an convinced him about the fact that TPM is not any expense, rather this will be an investment in maintenance and it will returns in the improved quality, Safety, sense of belongingness, flexibility and lead time. After getting the consent from his office we discuss the scope of maintenance with the Manages of engineering and production departments. With their help we pursue further. After getting the approval of the top Management in the month of September 2016, we start with the Gemba Walk in the production area. Although the production line was very well structured but thee wee many lacks found during our visit. There were many valves that were leaking and problem of cleanliness was found in some areas. The main problem that was found was related to accountability. No one among the employees was ready to take ownership of his work area. Some of the equipment was found corroded. The equipment and other material was found scattered in the production area and was not stored or placed at proper place. From this Gemba walk, it was found that we have to start from very beginning and we plan to start with the 5S principles. The maintenance staff and the shift incharges were asked to attend a training session on 5S principles. After the training session we again had a Gemba Walk along with the maintenance staff and the Shift incharges and implement the 5S principles. The wokes were even trained on the 5S principles by their respective team incharges. After implementation of 5S principles, we have divided the whole production area in the 13 different Zones. Similarly we distribute the entire labor in these sections each shift wise. A thorough study of each zone was done involving the labor working in that zone, maintenance department, and a report of all instruments, factors and the levels of various variables was prepared. From that report daily check sheet for each zone was pepared to moniter the autonomous maintenance. The brainstorming session was organized involving the maintenance department and production department so that the effectiveness of the checklists can be increased. After getting those checklists approved from the various departments plan was made to implement those checklists. Various Training programs were organized to implement the
Implementation and Effects of Total Productive Maintenance (TPM)
Proceedings of ISER 77th International Conference, Toronto, Canada, 28th-29th September 2017
35
checklists. The maintenance department was trained in the first session and was motivated for implementation of the check sheets effectively. The labor involved in the different production zone was trained separately for autonomous maintenance and were asked to fill the check sheet before start of each Shift. To make this maintenance practice visual the concerned check sheets are placed on a wall of every production zone. The duties were assigned to particular workers to fill the check sheet, which further lead to Autonomous Maintenance. The maintenance department was given a duty to check all the check sheets and note down the maintenance required and submit the same to the office of production manager and the Engineering and maintenance department every day.With this practice the data of themaintenance starts maintained at various levels. Tagging of flags was also introduced in each production zone the two colors of ribbons were used to tag the area were the maintenance is required. Yellow ribbon is used were the maintenance is required as the equipment is at the edge of getting failure due to physical condition or time period of planned maintenance is about to finish and red tag is used to represent the already failure in a part or time period of planned maintenance is already over. To enhance the visibility of the plant the process flow chart along with various specifications and the required values of variablesis placed in each production zone. 5.2. Data Analysis The data analysis for the verka milk plant hoshiarpur could be done upon a data available from their monthly reports attached in Annexure-4 at the back of this thesis. The data of the procurement of milk for last two years is given below.
Table 5.1
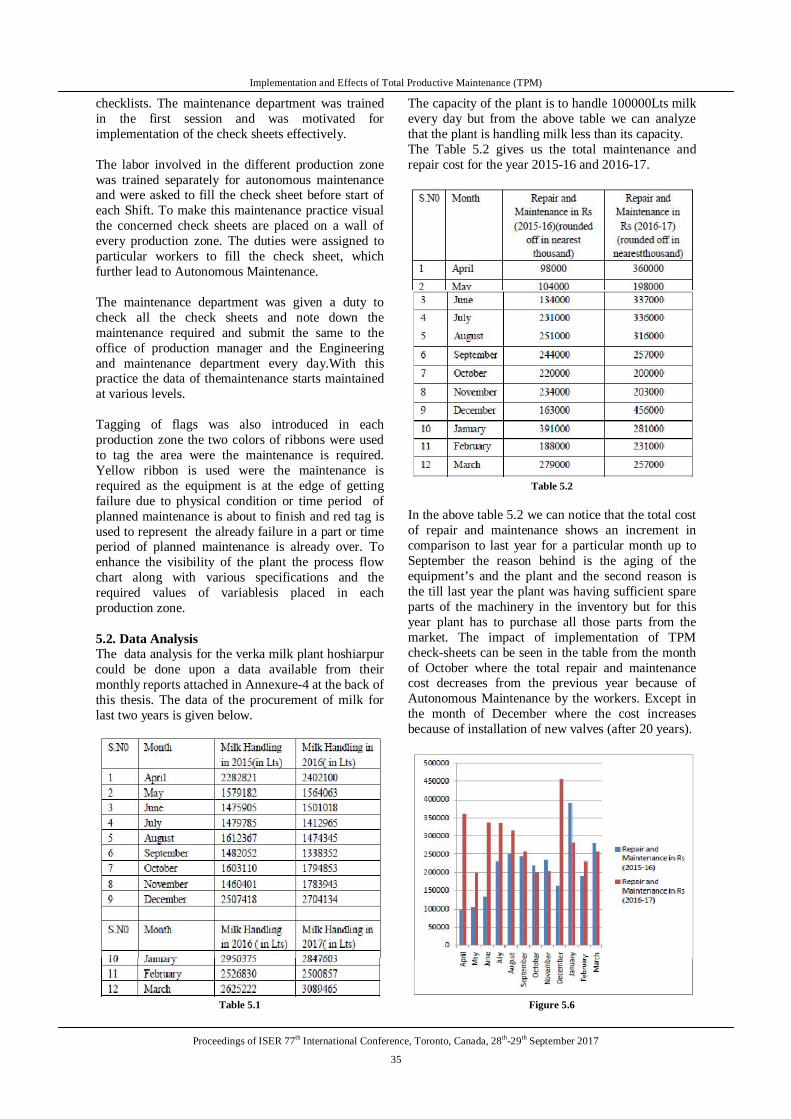
The capacity of the plant is to handle 100000Lts milk every day but from the above table we can analyze that the plant is handling milk less than its capacity. The Table 5.2 gives us the total maintenance and repair cost for the year 2015-16 and 2016-17.
Table 5.2
In the above table 5.2 we can notice that the total cost of repair and maintenance shows an increment in comparison to last year for a particular month up to September the reason behind is the aging of the equipment’s and the plant and the second reason is the till last year the plant was having sufficient spare parts of the machinery in the inventory but for this year plant has to purchase all those parts from the market. The impact of implementation of TPM check-sheets can be seen in the table from the month of October where the total repair and maintenance cost decreases from the previous year because of Autonomous Maintenance by the workers. Except in the month of December where the cost increases because of installation of new valves (after 20 years).
Figure 5.6
Implementation and Effects of Total Productive Maintenance (TPM)
Proceedings of ISER 77th International Conference, Toronto, Canada, 28th-29th September 2017
36
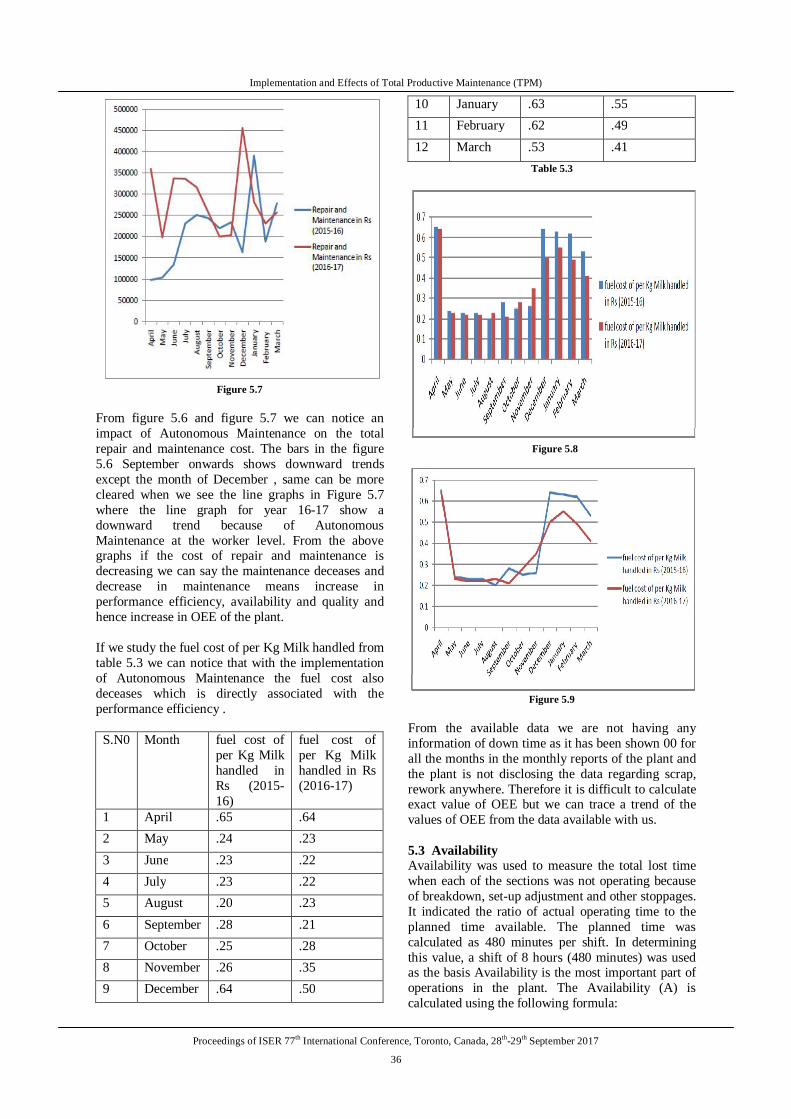
Figure 5.7
From figure 5.6 and figure 5.7 we can notice an impact of Autonomous Maintenance on the total repair and maintenance cost. The bars in the figure 5.6 September onwards shows downward trends except the month of December , same can be more cleared when we see the line graphs in Figure 5.7 where the line graph for year 16-17 show a downward trend because of Autonomous Maintenance at the worker level. From the above graphs if the cost of repair and maintenance is decreasing we can say the maintenance deceases and decrease in maintenance means increase in performance efficiency, availability and quality and hence increase in OEE of the plant. If we study the fuel cost of per Kg Milk handled from table 5.3 we can notice that with the implementation of Autonomous Maintenance the fuel cost also deceases which is directly associated with the performance efficiency .
S.N0 Month fuel cost of per Kg Milk handled in Rs (2015-16)
fuel cost of per Kg Milk handled in Rs (2016-17)
1 April .65 .64 2 May .24 .23 3 June .23 .22 4 July .23 .22 5 August .20 .23 6 September .28 .21 7 October .25 .28 8 November .26 .35 9 December .64 .50
10 January .63 .55 11 February .62 .49 12 March .53 .41
Table 5.3
Figure 5.8
Figure 5.9
From the available data we are not having any information of down time as it has been shown 00 for all the months in the monthly reports of the plant and the plant is not disclosing the data regarding scrap, rework anywhere. Therefore it is difficult to calculate exact value of OEE but we can trace a trend of the values of OEE from the data available with us. 5.3 Availability Availability was used to measure the total lost time when each of the sections was not operating because of breakdown, set-up adjustment and other stoppages. It indicated the ratio of actual operating time to the planned time available. The planned time was calculated as 480 minutes per shift. In determining this value, a shift of 8 hours (480 minutes) was used as the basis Availability is the most important part of operations in the plant. The Availability (A) is calculated using the following formula:

Implementation and Effects of Total Productive Maintenance (TPM)
Proceedings of ISER 77th International Conference, Toronto, Canada, 28th-29th September 2017
37
A = ( Possible Operating Time ) − (Downtime ) Possible Operating Time There is a break of 30 minutes in each shift therefore in a shift actual opeating hours can be taken as 480-30= 450 A = 450 = 93.75% 480 The availability is 93.75%
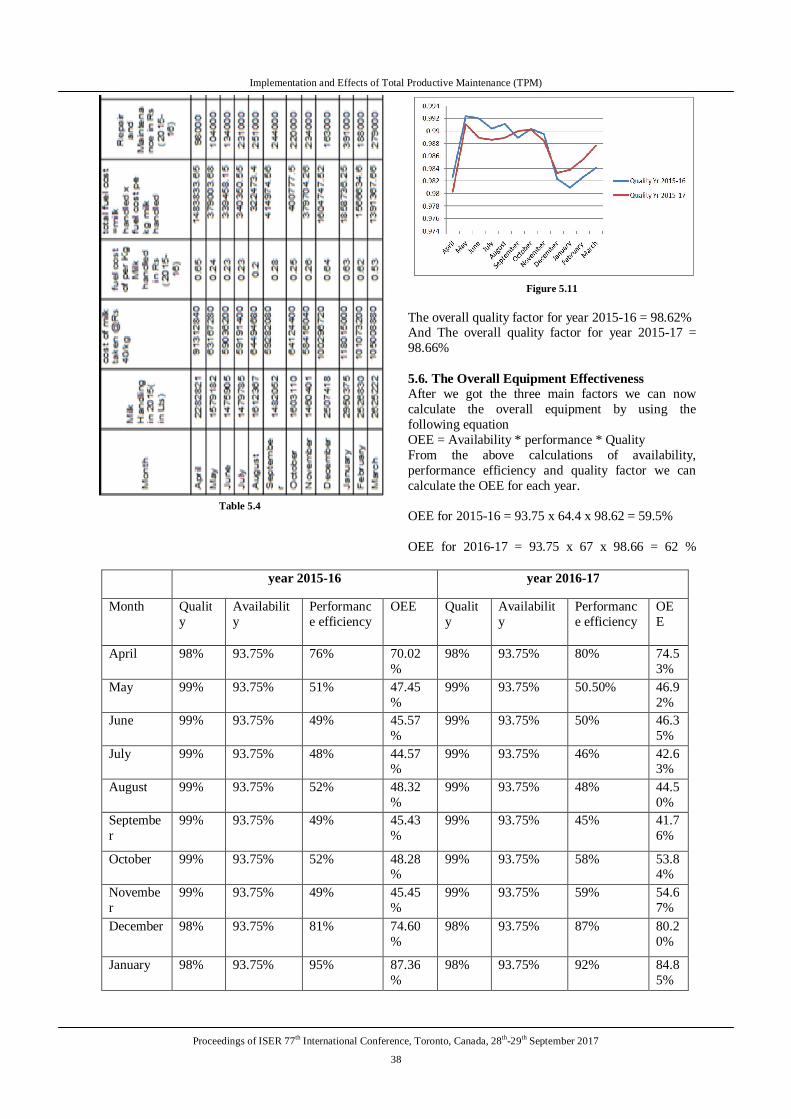
5.4 Performance efficiency Performance efficiency was calculated as a function of bothoperating speed rate and net operating rate. The operatingspeed rate of equipment referred to the discrepancy betweenthe ideal (theoretical) speed and its actual operating speed. The net operating rate measured the maintenance of a givenoperating speed over a period of time. We will calculate it in term of milk handling against the capacity of the plant to handle 100000 Lt milk per day.
Table 5.4
If we calculate the performance efficiency of the year 2015-16 = total milk handledin the year / 366x100000 PE for 2015-16 = 23585468= 64.4% 36600000 Similarly PE for 2016-17 = 24413698= 67% 36500000 From the above calculations we can say that the performance efficiency of the plant increases for the year 2016-17 and from the table 5.4 we can notice that the growth starts from the month of October. The same growth can be seen in the line graph given in the Figure 5.10.
Figure 5.10
5.5 Quality To calculate the quality factor we need the total amount of defect and scrap and the quality factor is Quality rate = ((production input – quality defects)/ Production input) But in verka plant case we are not having any data of defect and scrap therefore we will take the production input as cost of total milk handled and quality defects as cost of fuel and cost of repair and maintenance. The calculations are given in the table 5.4. where we can notice that even the value of quality factor improves from the month of September 2016 that shows with the implementation of Autonomous Maintenance the quality factor improves that can be visualize more effectively though Figure 5.11
Implementation and Effects of Total Productive Maintenance (TPM)
Proceedings of ISER 77th International Conference, Toronto, Canada, 28th-29th September 2017
38
Table 5.4
Figure 5.11
The overall quality factor for year 2015-16 = 98.62% And The overall quality factor for year 2015-17 = 98.66% 5.6. The Overall Equipment Effectiveness After we got the three main factors we can now calculate the overall equipment by using the following equation OEE = Availability * performance * Quality From the above calculations of availability, performance efficiency and quality factor we can calculate the OEE for each year. OEE for 2015-16 = 93.75 x 64.4 x 98.62 = 59.5% OEE for 2016-17 = 93.75 x 67 x 98.66 = 62 %
year 2015-16 year 2016-17
Month Quality
Availability
Performance efficiency
OEE Quality
Availability
Performance efficiency
OEE
April 98% 93.75% 76% 70.02%
98% 93.75% 80% 74.53%
May 99% 93.75% 51% 47.45%
99% 93.75% 50.50% 46.92%
June 99% 93.75% 49% 45.57%
99% 93.75% 50% 46.35%
July 99% 93.75% 48% 44.57%
99% 93.75% 46% 42.63%
August 99% 93.75% 52% 48.32%
99% 93.75% 48% 44.50%
September
99% 93.75% 49% 45.43%
99% 93.75% 45% 41.76%
October 99% 93.75% 52% 48.28%
99% 93.75% 58% 53.84%
November
99% 93.75% 49% 45.45%
99% 93.75% 59% 54.67%
December 98% 93.75% 81% 74.60%
98% 93.75% 87% 80.20%
January 98% 93.75% 95% 87.36%
98% 93.75% 92% 84.85%

Implementation and Effects of Total Productive Maintenance (TPM)
Proceedings of ISER 77th International Conference, Toronto, Canada, 28th-29th September 2017
39
February 98% 93.75% 87% 80.15%
99% 93.75% 89% 82.22%
March 98% 93.75% 85% 78.42%
99% 93.75% 99.50% 92.13%
Table 5.5
Figure 5.12
From table 5.5 and figure 5.12 we can notice that OEE improves in the year 2016-17 than the previous year also we can notice that with the implementation the OEE improves. It has been observed that the OEE is more than 80% for four months in the year 2016-17 and more than 74% for five months. For rest of the year (seven months) the value of OEE is very poor. The major reason of poor OEE rating is the performance as the quantity of Milk handled during this period is very less than its ratting. The plant can increase the OEE for these seven months by increasing the intake of the milk. REFERENCES
[1] HugoPintoa, Carina Pimentela&Madalena Cunha.
Implications of Total Productive Maintenance in Psychological Sense of Ownership.ScienceDirectProcedia - Social and Behavioral Sciences 217 ( 2016 ) 1076 – 1082
[2] Abhijeet K Digalwar* and Padma V Nayagam. Implementation of Total Productive Maintenance in Manufacturing Industries: A Literature-Based Metadata Analysis. The IUP Journal of Operations Management, Vol. XIII, No. 1, 2014
[3] Doug Kiss .8 Steps to Better Equipment Reliability,More Capacity and Sustained Improvement. © 2012 TBM Consulting Group, Inc
[4] Ahmed, S., &Siong, S. S. (2007). TPM Implementation Can Promote Development of TQM Culture: Experience from a Case Study in a Malaysian Manufacturing Plant.
[5] Ahuja, I. P. S., &Khamba, J. S. (2008). Total productive maintenance: Literature review and directions. International Journal of Quality & Reliability
Management, 25(7), 709-756.doi: 10.1108/02656710810890890
[6] Avey, J. B., Avolio, B. J., Crossley, C. D., &Luthans, F. (2009). Psychological ownership: Theoretical extensions, measurement and relation to work outcomes. Journal of Organizational Behavior, 30(2), 173-191. doi: 10.1002/job.583
[7] , I. (2008). Enabling Intrapreneurship and Psychological Ownership Inside Firms - A case study of a train maintenance company. Erasmus University Rotterdam, Erasmus School of Economics.
[8] Jeswani, S., & Dave, D. S. (2012). A study on the impact of predictors of psychological ownership on turnover intention among faculty members.IJEMR, 2(2). 1-22. Acedidoem http://www.ijemr.in/A%20Study%20on%20the%20Impact%20of%20Predictors%20of%20Psychological%20Ownership%20on%20Turnover %20Intention%20among%20Faculty%20Members.pdf
[9] Gupta, S., Tewari, P. C., & Sharma, A. K. (2007). TPM concept and implementation approach. Patiala, Punjab (Índia): University College of Engineering.
[10] Field, A. (2011). Discovering statistics using SPSS (and sex drugs and rock 'n' roll). London: SAGE Publications Ltd.
[11] Nakajima, S. (1988). Introduction to TPM: total productive maintenance. Portland: Productivity Press.
[12] Sharma, A. K., Shudhanshu, &Bhardwaj, A. (2012). Manufacturing performance and evolution of TPM. Journal of Engineering Science and Technology, 4(03), 854-866. Acedidoem http://www.ijest.info/docs/IJEST12-04-03-012.pdf
[13] Venkatesh, J. (2007). An introduction to Total Productive Maintenance (TPM).Acedidoem http://www.plantmaintenance. com/articles/tpm_intro.shtml
[14] Wrzesniewski, A., LoBuglio, N., Dutton, J. E., & Berg, J. M. (2013). Job crafting and cultivating positive meaning and identity in work. Advances in Positive Organizational Psychology, 1, 281-302. Acedidoem http://justinmberg.com/wrzesniewski-lobuglio-dutto.pdf
[15] Pierce, J. L., Kostova, T., & Dirks, K. T. (2001). Toward a theory of psychological ownership in organizations. Academy of Management Review, 26(2), 298-310.
[16] Pierce, J. L., Kostova, T., & Dirks, K. T. (2003). The state of psychological ownership: Integration and extending a century of research. Reviewof General Psychology, 7(1), 84-107. doi: 10.1037/1089-2680.7.1.84
[17] Willmott, P. (1994). Total quality with teeth. The TQM Magazine, 6(4), 48-50. doi: http://dx.doi.org/10.1108/09544789410062795
[18] Ambrose T Mpofu .The quality of milk powder and its dependency on equipment maintenance Management.BEngTech, University of Southern Queensland, TOP New Zealand.