Embed Size (px)
Citation preview
Implementation and clinical effectiveness of a community-based NCD treatment program in rural Mexico: A difference-in-differences analysis
Kevin Duan, MDEconomic Evaluation Collaborator, Compañeros En SaludVolunteer Assistant Clinical Professor of Medicine, UCSF
Francisco Rodríguez Garza, MDRight to Health Program Coordinator, Compañeros En Salud

Objective• To describe the implementation of
a novel community-based NCD treatment program
• To evaluate the clinicaleffectiveness of the program

Background
Mexico Country Profile - Institute for Health Metrics and Evaluation (IHME) [Internet]. [cited 2017 Mar 23]. Available from: http://www.healthdata.org/mexico
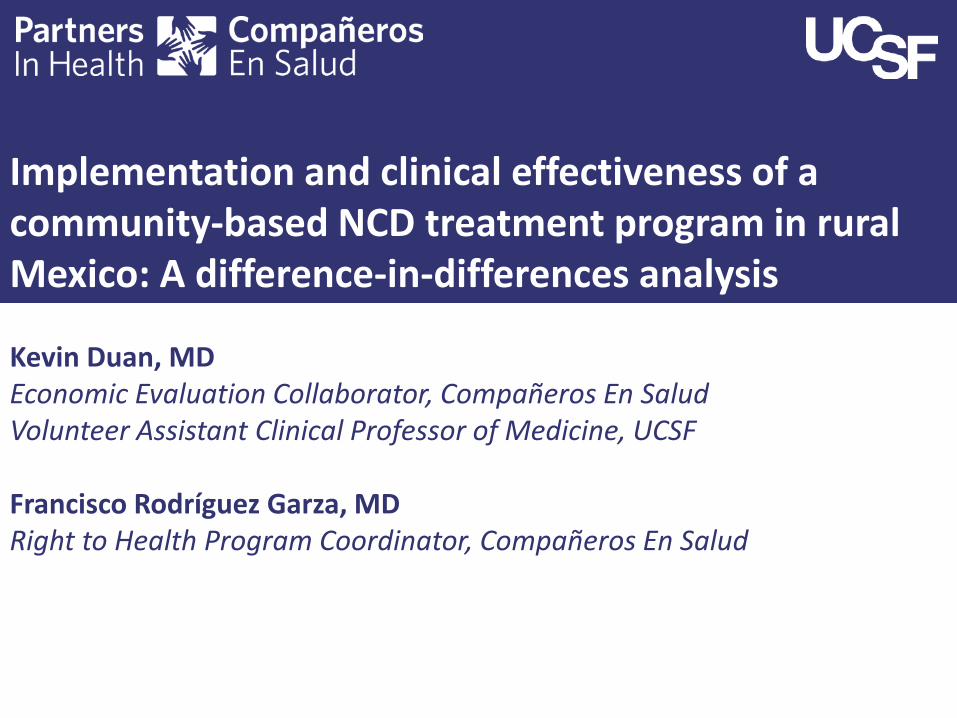
Background
González-Pier E, Barraza-Lloréns M, Beyeler N, Jamison D, Knaul F, Lozano R, et al. Mexico’s path towards the Sustainable Development Goal for health: an assessment of the feasibility of reducing premature mortality by 40% by 2030. Lancet Glob Health. 2016 Oct;4(10):e714–25.

Background

Where we work

Context
Measuring Well-being in Mexican States [Internet]. OECD Publishing; 2015 [cited 2017 Feb 5]. Available from: http://www.oecd-ilibrary.org/urban-rural-and-regional-development/measuring-well-being-in-mexican-states_9789264246072-en

NCD Model of Care
Implementation• Piloted components of CESPEC
from 2012-2014• Rolled out the full CESPEC model
to clinics in 2014

Methods• Retrospective, population-based analysis• Data source: CES EHR and government
database• Intervention group: CES clinics with
CESPEC (n=9)• Control group: non-CES government
clinics (n=806)

Methods• Outcome: rates of disease control (based on
government definitions)– Diabetes:
• Hgb A1c <7%, • Fasting glucose <7.16 mmol/L (130mg/dL)
– Hypertension:• BP <140/90 mmHg
• Study period: 2014 vs 2016• Difference-in-differences regression approach• Adjustment for facility-level differences

Results: hypertensionPopulation 2014 2016
Hypertension CES(N=92)
Non-CES(N=14,272) p-value CES
(N=196)Non-CES
(N=8,089) p-value
Female 59.8% 74.0% P = 0.002 60.1% 77.2% P < 0.001
Age 60+ 52.3% 48.7% P = 0.50 49.7% 52.0% P = 0.49
Under Control 56.2% 45.2% P = 0.03 72.4% 66.7% P = 0.09

Results: diabetesPopulation 2014 2016
Diabetes CES(N=43)
Non-CES(N=13,010) p-value CES
(N=134)Non-CES
(N=8,250) p-value
Female 64.5% 72.0% P = 0.32 68.3% 77.9% P = 0.006
Age 60+ 22.0% 32.7% P = 0.10 32.0% 34.5% P = 0.55
Under Control 41.3% 36.9% P = 0.50 52.6% 27.7% P < 0.001
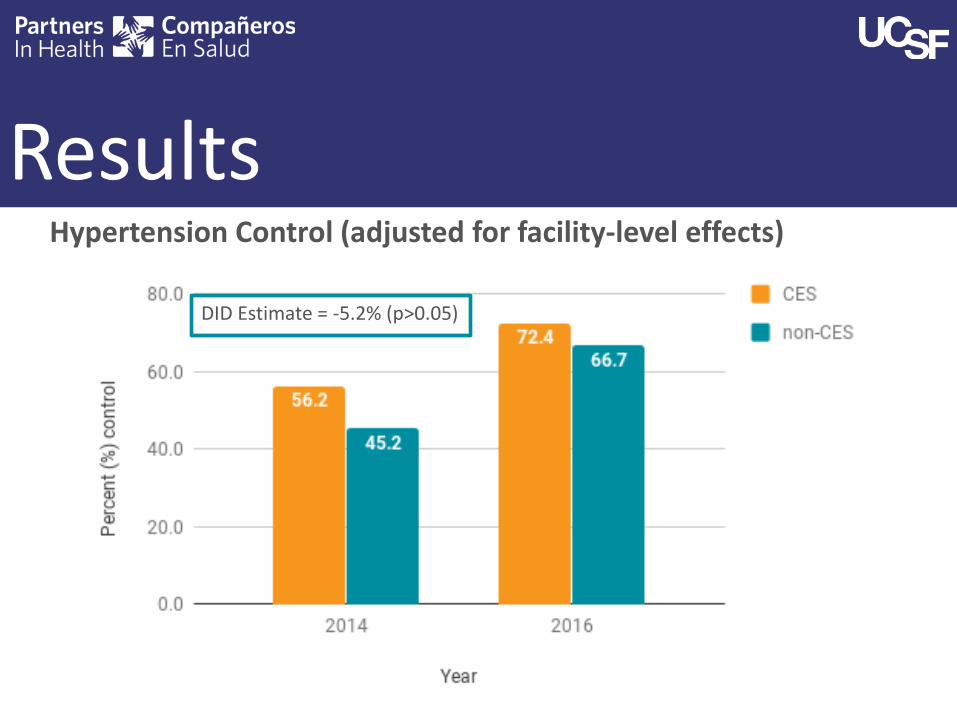
ResultsHypertension Control (adjusted for facility-level effects)
DID Estimate = -5.2% (p>0.05)

ResultsDiabetes Control (adjusted for facility-level effects)
DID Estimate = 20.6% (p<0.001)

Limitations• Retrospective, quasi-experimental
design• Limited study period• Clinic-level data only, no patient-
level data available• Large reduction in cases from 2014-
2016 in non-CES clinics

Conclusions• CESPEC was associated with significantly
improved diabetes control compared to care-as-usual, not in hypertension
• A program providing longitudinal, NCD care can be successfully implemented in rural Mexico
• Components of program could be a model for other rural parts of Mexico

Acknowledgements
• Co-authors: Ryan McBain, Hugo Flores, Gustavo Nigenda, Lindsay Palazuelos, Daniel Palazuelos, Elena Moreno Lázaro, Natán Enríquez Ríos, Patrick Elliott

Thank you
Questions?