Embed Size (px)
Citation preview

The International Journal of Oral & Maxillofacial Implants e1
The size and relatively central anteroposterior posi-tions of the first molars make them essential for
maintaining proper arch form and occlusal schemes.1,2
As the first permanent teeth to erupt in the human arches, however, they also have the ironic distinction of being among the first permanent teeth to be lost as a result of disease or decay.2–5 Restoration of missing first molars is essential but presents a variety of clinical chal-lenges. Conventional fixed partial dentures can offer improved stability and function, but the ethics of pre-paring healthy adjacent teeth to support prostheses and uncertainty about the long-term prognosis of preparing previously restored teeth have raised concerns.6–8
Dental implant restorations can help preserve adjacent teeth6 but have traditionally exhibited slightly reduced survival rates in posterior arches, which are subject to high occlusal forces and typically exhibit low bone density.9–12 The proximity of the maxillary sinus and mandibular canal to the first molar regions can necessitate placement of short implants (10 mm or less), which historically tend to be less predictable than longer implants.9–12 Restoring the wide interdental space can also present biomechanical challenges.
1 Lecturer, Department of Oral Rehabilitation, The Maurice and Gabriela Goldschleger School of Dental Medicine, Tel Aviv University, Tel Aviv, Israel.
2 Clinical Professor, Department of Periodontology and Implantology, Dental School, New York University, New York, New York.
3 Private Practice, Ankara, Turkey.4 Private Practice, Paris, France.5 Senior Lecturer, Department of Oral Rehabilitation, The Maurice and Gabriela Goldschleger School of Dental Medicine, Tel Aviv University, Tel Aviv, Israel.
6 Clinical Professor, Department of Restorative Dentistry, University of Washington, Seattle, Washington.
Correspondence to: Dr Zeev Ormianer, Department of Oral Rehabilitation, School of Dental Medicine, Tel Aviv University, Ramat Aviv, Tel Aviv 69978 Israel. Fax: +972-03-6124226. Email: [email protected]
Implant-Supported First Molar Restorations: Correlation of Finite Element Analysis with
Clinical OutcomesZeev Ormianer, DMD1/Ady Palti, DMD2/Burak Demiralp, DDS, PhD3/
Guillaume Heller, DDS4/Israel Lewinstein, DMD5/Philippe G. Khayat, DCD, MScD6
Purpose: This study aimed to evaluate the effect of the placement of wide-diameter implants on bone stress
concentrations and marginal bone loss in the first molar region. Study hypotheses held that increasing implant
diameter would decrease peri-implant bone stress levels, but that statistically significant reductions in clinical
bone loss would either (1) not be observed for any implant diameter or (2) be observed only for the widest
implant diameter. Materials and Methods: Three-dimensional finite element analysis (3D FEA) was used to
analyze the relationship between implant diameter and peri-implant bone thickness, cortical bone thickness,
occlusal load direction, and percentage of bone-to-implant contact on bone stress levels in the first molar
region. A retrospective review of patient records was also conducted in three private practices to assess clinical
outcomes and bone level changes around one implant design in three diameters (3.7, 4.7, and 6.0 mm) placed
in first molar locations. Categorical variable summaries and comparisons of 3D FEA and clinical findings were
made using the FREQ procedure, t test procedures (Student t tests, folded F tests, Satterthwaite t tests), and
the NONPAR1WAY procedure (Wilcoxon nonparametric test). Results: Cumulative implant success was 98.4%
and survival was 98% after a mean of 49.2 months. Although increasing implant diameter always reduced peri-
implant stress concentrations in 3D FEA experiments, clinically, only 6.0-mm implants exhibited a statistically
significant reduction in bone loss (0 mm) as compared to 3.7-mm and 4.7-mm implants. Conclusion: Only
6.0-mm implants were effective in reducing marginal bone loss in the first molar region. 3D FEA results
supported previous clinical findings that maintaining approximately 1.8 mm of buccal plate thickness can help
reduce bone stress concentrations and preserve buccal bone height. A history of periodontitis may adversely
affect long-term marginal bone stability. Int J Oral Maxillofac Implants 2012;27:e1–e12
Key words: bone, dental implant, implant diameter, molar, stress
© 2012 BY QUINTESSENCE PUBLISHING CO, INC. PRINTING OF THIS DOCUMENT IS RESTRICTED TO PERSONAL USE ONLY. NO PART OF MAY BE REPRODUCED OR TRANSMITTED IN ANY FORM WITHOUT WRITTEN PERMISSION FROM THE PUBLISHER.

Ormianer et al
e2 Volume 27, Number 1, 2012
Overcontouring a prosthesis to restore a large occlu-sal surface may result in increased nonaxial forces on standard-diameter implants (3.7 mm diameter) and more intense peri-implant stress concentrations in bone during occlusal loading.13,14 These forces may lead to peri-implant bone loss, component metal fatigue, and secondary fracture of the prosthetic screw, abutment, and/or implant body.13,14
To improve load distribution in bone, some clini-cians15 have advocated the placement of two narrow- diameter (3.7 mm or less) or standard-diameter implants to support single molar restorations. The ability to do this, however, is limited by numerous variables, such as arch morphology,12 proximity of adjacent teeth,16 vertical access, and skill of the sur-geon. The use of wide-diameter (> 3.7-mm) implants to support a single molar prosthesis has been advo-cated as an alternative to placing single or multiple standard-diameter implants,12 but few data have been published to adequately support evidence-based treatment planning. Conversely, some clinicians have reported that wide-diameter implants placed in pos-terior areas may be more susceptible to failure than standard-diameter implants.17
Three-dimensional finite element analysis (3D FEA) can theoretically measure stresses generated by implants in bone during occlusal loading. Although there is currently no clinical consensus on the relation-ship between occlusal overloading and peri-implant marginal bone level changes, several researchers18–20 have hypothesized that stress below a threshold of approximately 50 MPa will preserve marginal bone levels in a balanced steady state, but that stresses of 50 MPa or higher will trigger pathologic overload that may result in bone resorption. However, such 3D FEA findings have not been adequately correlated to an actual clinical context.
The aim of the present report is to convey the findings of a two-part study that used 3D FEA and retrospective clinical data to analyze the relation-ship between implant diameter and the crestal bone response around implant-supported, single-tooth restorations in first molar regions. The study hypoth-esis was that an increase in implant diameter would result in a corresponding decrease in peri-implant bone stress in the 3D FEA portion of the study, but that differences in implant diameter would not be significant in the clinical portion of the study. An al-ternate hypothesis was that an increase in implant diameter would result in a corresponding decrease in peri-implant bone stress in the 3D FEA portion of the study, but a statistically significant decrease in bone loss would manifest only around the widest-diameter implants in the clinical portion of the study.
MATERIALS AND METHODS
3D FEA Experiments Four 3D FEA experiments were performed to evalu-ate the influences of implant diameter (3.7, 4.7, and 6.0 mm) on bone stress levels relative to one or more secondary experimental variables (Table 1). Design software (SolidWorks Professional 2006, SolidWorks) and 3D FEA software (ANSYS Workbench 11.0, ANSYS) were used on a personal computer to create digital study models that simulated an implant embedded in a cylindric bone block and restored with an abutment and coping (Fig 1).
To approximate a variety of clinical conditions in these experiments, cylindric bone blocks were mod-eled with different mechanical properties (Table 2)21 and peri-implant bone thicknesses (Tables 3a to 3c). The implant, abutment, and coping assembly models
Table 1 3D FEA Experimental Variables
Variable Examined factors/assumptions
Primary variable Influence of implant diameter on peri-implant bone stress
Secondary variables
Experiment 1 Influence of peri-implant bone width (radial bone volume): Bone model A,* 100% BIC,† and 30-degree impact angle
Experiment 2 Influence of cortical bone height (vertical bone volume): bone models B and C,* 100% BIC, and 30-degree impact angle
Experiment 3 Influence of applied load direction: Bone model B,* 100% BIC, 30-degree and 0-degree impact angles
Experiment 4 Influence of mean %BIC: Bone model B,* < 100% BIC,§ 30-degree impact angle
*See Table 2.†Percentage of bone-to-implant contact assumed for test purposes. ‡Angle = 222 N of load applied load at (1) a 30-degree angle (θ = 30 degrees) angle with 1.5-mm buccolingual offset from vertical axis of the implant or (2) a 0-degree angle (θ = 0 degrees) from the long axis of the implant model.§Modeled as 100% BIC in the cervical and apical regions and 8% to 100% BIC in the remaining thread regions.
© 2012 BY QUINTESSENCE PUBLISHING CO, INC. PRINTING OF THIS DOCUMENT IS RESTRICTED TO PERSONAL USE ONLY. NO PART OF MAY BE REPRODUCED OR TRANSMITTED IN ANY FORM WITHOUT WRITTEN PERMISSION FROM THE PUBLISHER.

Ormianer et al
The International Journal of Oral & Maxillofacial Implants e3
(Figs 1a and 1b) corresponded in design and mate-rial characteristics (elastic modulus = 110 GPa, Poisson ratio = 0.34 GPa22) to those of the titanium alloy im-plants used in the clinical portion of the study. Bone-to-implant contact (BIC) was assumed to be an interfacial bond between the modeled bone blocks and implants, but the overall percentage of BIC varied according to the experiment. A standard occlusal force of 222 N was applied to each implant model. The selected force rep-resented a slightly higher-than-median value within a range of 1.74 to 356.98 N23,24 of mean maximum bite force values reported for the first molar region. In most experiments, loading was applied at a 30-degree angle with a 1.5-mm offset in an attempt to approximate normal mastication.
Experiment 1 investigated the influence of implant diameter and radial peri-implant bone volume on stress levels generated by the implant in bone (Table 1). Results were compared to the findings of a previous clinical study that measured buccal plate thickness of newly prepared implant osteotomies and correlated the findings with future buccal plate bone loss and implant failure.25 The earlier study found that, as buc-cal plate thickness decreased below a critical threshold of 2 mm, buccal plate resorption and implant failure rates increased.25 When buccal plate thickness was ≥ 2 mm, however, implant survival rates increased and some evidence of marginal bone gain was noted.25
In the present 3D FEA analysis, to eliminate differ-ences in the moduli of elasticity, cortical and cancellous bone were merged into a single, hypothetical bone model with a homogenous modulus of elasticity (cor-tical + cancellous bone combined) (Table 2) (Fig 1b). In creating this hypothetical bone model, the authors acknowledged that the extrapolation of 3D FEA data to clinical findings would be highly limited in general, especially with this theoretical bone model. However, 3D FEA is the most accurate and reproducible theoreti-cal method of evaluating load and stress distribution in the region of BIC and can provide more accurate data than bench testing or other experimental methods. While patient variables are extremely important in any clinical context, they cannot all be simulated in a theo-retical or experimental analysis. For this reason, 3D FEA was used to obtain and evaluate stresses in bone that could not be accurately measured in a clinical context. To facilitate model convergence for the evaluation of a 1-mm peri-implant radial bone dimension, the bone materials were merged to form a homogenous mod-ulus of elasticity that ranged between types 2 and 3 bone.21 This model was specifically selected based on more than 1,900 clinical evaluations that found that types 2 and 3 bone21 predominated in both mandibles and maxillae.26 Despite its limitations, 3D FEA was best able to provide important information pertaining to
the influence of implant diameter, occlusal load direc-tion, bone volume, bone density, and other variables on stress levels, which could be used as general guide-lines for case planning.
Experiment 2 examined the influence of implant diameter and the vertical volume of cortical bone on stress levels generated by the implant in two bone models that differed in cortical bone thickness (Tables 1 and 2) (Fig 1a). In both segments, osseointegration was assumed to be complete (BIC = 100%). To evalu-ate the effect of variations in cortical bone thickness, all the other variables were held constant. The decision to assume 100% BIC was based on the common use of this assumption in other FEA studies.27–29
Experiment 3 evaluated the influence of implant diameter and occlusal load direction on peri-implant stresses in bone (Tables 1). Bone model B (Table 2) was used, and osseointegration was assumed to be complete (BIC = 100%). Vertical compressive loading at a 0-degree angle (θ = 0 degrees) from the long axis of the implant model was also applied as part of the stress distribution analysis. For this experiment, it was hypothesized that the linearly elastic model used in this study would cause a linear increase in the maxi-mum stress in the bone.
Experiment 4 used bone model B to evaluate the in-fluence of implant diameter and the percentage of BIC (% BIC) on bone stress levels (Tables 1 and 2). BIC was 100% in the cervical and apical regions of the implant models but ranged from 8% to 100% in the thread regions to approximate a total of 30% BIC to represent the less-than-100% osseointegration that occurs in actual clinical practice, regardless of implant design.26
Fig 1 Typical FEA model and meshes simulating a two-piece implant embed-ded in bone with (a) defined cortical and cancellous layers or (b) a homogenous structure.
a b
© 2012 BY QUINTESSENCE PUBLISHING CO, INC. PRINTING OF THIS DOCUMENT IS RESTRICTED TO PERSONAL USE ONLY. NO PART OF MAY BE REPRODUCED OR TRANSMITTED IN ANY FORM WITHOUT WRITTEN PERMISSION FROM THE PUBLISHER.

Ormianer et al
e4 Volume 27, Number 1, 2012
Table 2 3D FEA Bone Models
Model*
Peri-implant bone dimensions†
Bone type
Cortical Trabecular Homogenous
Vertical Radial†Vertical
dimensionElastic
modulusVertical
dimensionElastic
modulusVertical
dimensionElastic
modulus
A‡ 20 mm Various N/A N/A N/A N/A 20 mm 3.5 GPa
B§ 20 mm 2 mm 3 mm 15 GPa 17 mm 1.5 GPa N/A N/A
C§ 20 mm 2 mm 1 mm 15 GPa 19 mm 1.5 GPa N/A N/A
*Theoretical bone model designed for test purposes only; structure is not analogous to actual bone. The isotropic, homogenous elastic modulus was based on moduli of 15 GPa for cortical bone (E1) and 1.5 GPa for trabecular bone (E2). Calculations of average elastic modulus utilized volume fractions of cortical bone (ν1 = 15%) and trabecular cancellous bone (ν2 = 85%) where ν1, ν2, E1, and E2 are volume fractions and elastic moduli of cortical and cancellous bone, respectively; equation 1: E = ν1 E1 + ν2 E2. A two-time decay model was used to describe the FEA analysis data presented in equation 2 where C1 and C2 (MPa) are constants dependent on the implant assembly size and platform, t (mm) is the bone volume surrounding the implant in mm, and τ1 and τ2 (mm) are decay constants; equation 2: σ(t) = C1 exp (–t/τ1) + C2 exp (–t/τ2). †Uniform peri-implant bone volume. ‡Generally representative of type 1 or type 2 bone.21
§Generally representative of type 2 or type 3 bone.21
Peri-implant radial bone volume was gradually decreased in 0.5-mm increments from 5 mm (max) to 1 mm (min) to during the study.
Table 3a Results of 3D FEA Experiment No. 1: Influence of Peri-implant Bone Width and Implant Diameter on Peri-implant Stresses*
Bone model† Peri-implant radial bone dimension (mm)
Stresses (MPa) generated by implant diameter (mm)
Classification % BIC 3.7 mm 4.7 mm 6.0 mm
A 100 1.0 37 24 17
A 100 1.5 31 20 14
A 100 2.0 28 18 13
A 100 2.5 26 16 12
A 100 3.0 25 16 11
A 100 3.5 25 15 11
A 100 4.1 24 15 11
A 100 4.5 24 15 11
A 100 5.0 24 15 11
*Applied load = 222 N at a 30-degree angle and a 1.5-mm offset from the vertical axis of the implant.†See Table 2.% BIC = percentage of bone-to-implant contact.
Table 3b Results of Experiment No. 2: Influence of Cortical Bone Height and Implant Diameter on Peri-implant Stresses*
Bone model† Cortical bone vertical dimension (mm)
Stresses (MPa) generated by implant diameter (mm)
Classification % BIC 3.7 mm 4.7 mm 6.0 mm
B 100 3.0 24 16 13
C 100 1.0 55 41 36
*Applied load = 222 N at a 30-dergee angle and a 1.5-mm offset from the vertical axis of the implant.†See Table 2.% BIC = percentage of bone-to-implant contact.
Table 3c Results of Experiment No. 3: Influence of Applied Load Direction and Implant Diameter on Peri-implant Stresses
Bone model*
Direction of applied load
Stresses (MPa) generated by implant diameter (mm)
Classification % BIC 3.7 mm 4.7 mm 6.0 mm
B 100 30 deg† 41 24 22
B 100 0 deg‡ 24 16 13
*See Table 2.†Applied load = 222 N at a 0-degree angle and a 0.0-mm offset from the vertical axis of the implant.% BIC = percentage of bone-to-implant contact.
© 2012 BY QUINTESSENCE PUBLISHING CO, INC. PRINTING OF THIS DOCUMENT IS RESTRICTED TO PERSONAL USE ONLY. NO PART OF MAY BE REPRODUCED OR TRANSMITTED IN ANY FORM WITHOUT WRITTEN PERMISSION FROM THE PUBLISHER.

Ormianer et al
The International Journal of Oral & Maxillofacial Implants e5
Clinical AnalysisThe second phase of the study consisted of a non-randomized, uncontrolled, retrospective review and evaluation of patient treatment records to deter-mine whether implant diameter influenced clini-cal outcomes and marginal bone stability. To avoid bias resulting from additional variables of implant design, study inclusion was limited to a tapered, multi-threaded implant design with a microtextured surface from one manufacturer (Tapered Screw-Vent MTX, Zimmer Dental). Study inclusion criteria also included all patients who had been treated for one or more missing first molar teeth located between two clini-cally healthy teeth and restored with a nonsplinted, cement-retained, porcelain-fused-to-metal crown on a straight titanium abutment. Data from patient charts and treatment databases from three private dental practices were collected in digital spreadsheets (Excel, Microsoft) in a personal computer. Peri-implant bone change data calculated by each clinician from non-standardized periapical radiographs taken at implant placement (baseline) and at the last annual follow-up appointment were also recorded. In all cases, measure-ments were made from the crest of the ridge to the first implant thread.
Subjects were treated with implants in diameters of 3.7, 4.7, and 6.0 mm; these supported one- or two-implant first molar restorations. To analyze the rela-tionship between implant diameter and crestal bone response, study subjects were assigned to three dif-ferent database groups based on the diameters of implants used for their respective restorations. This enabled data to be analyzed both at the subject level and at the implant level. For implant-level analyses, subjects treated with two-implant restorations were assigned to two different groups if their implants dif-fered in diameter, or they were listed twice in the same group if both implants matched in diameter.
Implants were considered to be survivors if they were immobile when tested manually, did not exhibit peri-implant radiolucency, had no irresolvable clinical symptoms or mechanical problems, and fully met their prosthodontic purpose. All clinically failed implants were recorded as failures in the database. Implants were considered successful if they met the implant sur-vival criteria, had no irresolvable non–failure- related adverse events, did not have peri-implant bone loss that exceeded 1.5 mm, and met the patient’s clinical and esthetic needs and expectations, as determined by the patient records.
Statistical Analysis Spreadsheet data were divided into five study groups based on implant diameter. The data were analyzed with software (SAS 8.02, SAS) on a personal computer.
Categorical variable summaries and comparisons were made using the FREQ procedure; Student t tests, (folded) F tests, Satterthwaite t tests were performed using the TTEST procedure; and the Wilcoxon nonpara-metric test was performed using the NONPAR1WAY procedure. Statistical significance was inferred at the nominal level of type 1 (alpha).
RESULTS
3D FEA Experiments Experiment 1. Stresses increased significantly as peri-implant bone thickness decreased to approxi-mately 1 mm around the implant (Table 3a). This dif-ference diminished as the peri-implant bone thickness increased to approximately 2 mm or greater (Fig 2, Table 3a). Based on a two-time decay model (Table 3a), the variable of implant diameter influenced the degree, but not the rate, of change in the level of peri-implant bone stresses that occurred simultane-ously with changes in peri- implant bone thickness. All observed stresses under the prescribed boundary and loading conditions were below 50 MPa, the theoretical threshold for bone loss.18–20
Experiment 2. Maximum stresses were concen-trated in the crestal bone region and gradually dimin-ished in intensity along the implant surface deeper within the bone, regardless of the bone model used. In bone model B, all stresses observed under the prescribed boundary and loading conditions were below 50 MPa (Table 3b) (Fig 3). In bone model C, stress concentrations observed under the prescribed boundary and load conditions were above the 50-MPa threshold for implants with diameters of 3.7 and 4.1 mm, but they dropped below 50 MPa for im-plant diameters of 4.7 and 6.0 mm (Table 3b).
Experiment 3. Maximum stress concentrations observed under the boundary and loading conditions were below the 50-MPa threshold in bone model B, regardless of implant diameter or angle of applied load (Table 3c). These results do not account for the nonlinear response of bone. Increasing the implant diameter reduced the maximum stress concentrations, regardless of loading angle (0 versus 30 degrees).
Experiment 4. Maximum bone stress levels did not change as the overall percentage of BIC diminished from 100% to 50%; however, maximum bone stress levels gradually increased in localized stress patterns around individual implant threads as % BIC dropped below 50%. Figure 4 represents the effect of BIC on the maximum stress within the bone at the threads only when there was an assumed 100% bonded con-tact (osseointegration) in the cervical collar, apex, and the apical vent regions of the implant body. Figure 5
© 2012 BY QUINTESSENCE PUBLISHING CO, INC. PRINTING OF THIS DOCUMENT IS RESTRICTED TO PERSONAL USE ONLY. NO PART OF MAY BE REPRODUCED OR TRANSMITTED IN ANY FORM WITHOUT WRITTEN PERMISSION FROM THE PUBLISHER.

Ormianer et al
e6 Volume 27, Number 1, 2012
0
10
30
40
60
70
0 2 3 5 6 8
Bone thickness (mm)
Max
imum
str
ess
(MPa
)
20
50
1 4 7
3.74.1
4.76.0
Implant diameter (mm)
Fig 2 Effects of peri-implant bone thickness and implant diameter on maximum stresses in bone subjected to 222 N of applied load at a 30-degree angle.
illustrates the distribution of stresses within the peri-implant bone for 30% BIC. The highest stress contour bands were located at the bone crest, and stress lev-els decreased progressively within the trabeculae. For most cases, stress levels within trabecular bone were less than 5 MPa under the prescribed boundary condi-tions based on stress contours (refer to Fig 2 as typical von Mises stress contours).
Clinical Analysis. The database consisted of 120 subjects with a mean age of 52.6 years (Table 4a). Sub-jects were treated with 128 implants in diameters of 3.7 mm (27%), 4.7 mm (23%), and 6.0 mm (50%); these were distributed as either one- (93%) or two- (7%) implant–supported restorations per patient (Table 4a). In the eight patients who received two restorations, three subjects were treated with a combination of 3.7 mm- and 4.7 mm-diameter implants, one subject was treated entirely with 3.7-mm-diameter implants, and four subjects received only 6.0-mm-diameter implants.
At the patient level (n = 120), the average length of follow-up was 49.2 months. At the implant level, average follow-up time did not differ significantly be-tween the 3.7-mm and 4.7-mm implant groups (P = .82), but both groups differed significantly (P = .001 and P = .03, respectively) from the 6.0-mm group (Table 4c). In addition, average follow-up for the combined 4.7-/ 6.0-mm group differed significantly from follow-up for the 3.7-mm group (P = .02). The distribution of implant lengths and diameters is summarized in Table 4a.
Bone grafting was used only in immediate implant cases and only when the void between the implant collar and the crestal bone exceeded 1.0 mm in width (n = 9/128, 7%) (Table 4a). Concomitant health risks
were not common at the patient level, with 82% reporting the absence of a comorbidity. At the implant level, freedom from concomitant health risks was reported for 71% of subjects in the 3.7-mm group, 83% of subjects in the 4.7-mm group, and 88% of subjects in the 6.0-mm group. Pairwise comparisons of con-comitant health risk (any versus none) at the implant level did not achieve statistical significance (P > .05) for three of the four comparisons (3.7-mm versus 4.7-mm, 4.7-mm versus 6.0-mm, and 3.7-mm versus 4.7- and 6.0-mm combined); however, the 3.7-mm group dif-fered statistically significantly from the 6.0-mm group (P = .049). Inspection of the frequency distributions across types of comorbidities indicated that the sta-tistical difference was caused by a greater prevalence of perio-dontitis in the 3.7-mm group (24%) as com-pared to the 6.0-mm group (2%) in combination with a smaller prevalence of smoking in the 3.7-mm group (0%) as compared to the 6.0-mm (9%) group.
Most of the 128 study implants were placed in the mandible (n = 94, 73%) as compared to the max-illa (n = 34, 27%). In the mandible, the frequency of 3.7-mm implants (60%) did not significantly differ from the frequency of 4.7-mm implants (59%) (P > .99), but there were significant differences in the frequencies of both the 3.7-mm (P = .002) and 4.7-mm (P = .003) implants as compared to the 6.0-mm implants (88%). In the combined 4.7- and 6.0-mm group, the distribu-tion of mandibular implants also differed significantly from that of the 3.7-mm group (P = .04). In the maxilla, only 24% (n = 8) of the implants were 6.0 mm wide as comparedto 4.7 mm (35%, n = 12) and 3.7 mm (41%, n = 14).
Fig 3 Von Mises stress distributions for 3.7 mm-diameter implants in bone. Note that the highest stress concentrations are located in the crestal bone region and decrease deeper within the bone.
0 0.003 0.006 (m)
0.0015 0.0045
7.000e7
6.000e7
5.000e7
4.119e7 Max
3.000e7
1.500e7
1.000e7
5.000a5
1.265e4a7Min
© 2012 BY QUINTESSENCE PUBLISHING CO, INC. PRINTING OF THIS DOCUMENT IS RESTRICTED TO PERSONAL USE ONLY. NO PART OF MAY BE REPRODUCED OR TRANSMITTED IN ANY FORM WITHOUT WRITTEN PERMISSION FROM THE PUBLISHER.

Ormianer et al
The International Journal of Oral & Maxillofacial Implants e7
Fig 4 Maximum stress levels with 100% BIC.
Bone
Implant
Bone
Implant
2e7
1e7
5e6
1e6
5e5
111610 0.00045 0.0009 (m)
0.00023 0.00068
0 0.00045 0.0009 (m)
0.00023 0.00068
Fig 5 Maximum stress levels with 30% BIC.
Bone
Implant
Bone
Implant
0 0.00045 0.0009 (m)
0.00023 0.00068
0 0.00045 0.0009 (m)
0.00023 0.00068
2e7
1e7
5e6
1e6
5e5
11161
Table 4a Summary of Patient and Implant Data by Implant Diameter*
Variable3.7 mm (n = 35)
4.7 mm (n = 29)
6.0 mm (n = 64)
4.7 + 6.0 mm (n = 93)
All implants (n = 128) Group comparisons
Sex 3.7 vs 4.7, P = .6134.7 vs 6.0, P = 1.003.7 vs. 6.0, P = .6673.7 vs (4.7 + 6.0), P = .678
Male 20 (58.8%) 19 (65.5%) 38 (64.0%) 57 (64.0%) 75 (62.5%)
Female 14 (41.2%) 10 (34.5%) 33 (36.0%) 32 (36.0%) 45 (37.5%)
Age (y) 3.7 vs 4.7, P = .4194.7 vs 6.0, P = .0013.7 vs 6.0, P = .0003.7 vs (4.7 + 6.0), P = .000
18–29 4 (11.8%) 1 (3.4%) 0 (0.0%) 1 (1.1%) 5 (4.2%)
30–39 12 (35.3%) 8 (27.6%) 3 (5.0%) 11 (12.4%) 23 (19.2%)
40–49 6 (17.6%) 9 (31.0%) 8 (13.3%) 17 (19.1%) 22 (18.3%)
50–59 9 (26.5%) 5 (17.2%) 11 (18.3%) 16 (18.0%) 23 (19.2%)
60–69 2 (5.9%) 4 (13.8%) 27 (45.0%) 31 (34.8%) 33 (27.5%)
70+ 1 (2.9%) 2 (6.9%) 11 (18.3%) 13 (14.6%) 14 (11.7%)
© 2012 BY QUINTESSENCE PUBLISHING CO, INC. PRINTING OF THIS DOCUMENT IS RESTRICTED TO PERSONAL USE ONLY. NO PART OF MAY BE REPRODUCED OR TRANSMITTED IN ANY FORM WITHOUT WRITTEN PERMISSION FROM THE PUBLISHER.

Ormianer et al
e8 Volume 27, Number 1, 2012
Table 4a Summary of Patient and Implant Data by Implant Diameter* cont
Variable3.7 mm (n = 35)
4.7 mm (n = 29)
6.0 mm (n = 64)
4.7 + 6.0 mm (n = 93)
All implants (n = 128) Group comparisons
Bone graft used 3.7 vs 4.7, P = 1.004.7 vs 6.0, P = .0083.7 vs 6.0, P = .0053.7 vs (4.7 + 6.0), P = .062
Yes 5 (14.3%) 4 (13.8%) 0 (0.0%) 4 (4.3%) 9 (7.0%)
No 30 (86.0%) 25 (86.2%) 64 (100%) 89 (96.0%) 119 (93.0%)
Implant length 3.7 vs 4.7, P = .7564.7 vs 6.0, P = .0023.7 vs 6.0, P = .0093.7 vs (4.7 + 6.0), P = .348
8 mm 0 (0.0%) 1 (3.4%) 1 (1.6%) 2 (2.2%) 2 (1.6%)
10 mm 8 (22.9%) 6 (20.7%) 30 (46.9%) 36 (38.7%) 44 (34.4%)
11.5 mm 5 (14.3%) 6 (20.7%) 1 (1.6%) 7 (7.5%) 12 (9.4%)
13 mm 20 (57.1%) 14 (48.3%) 31 (48.4%) 45 (48.4%) 65 (50.8%)
16 mm 2 (5.7%) 2 (6.9%) 1 (1.6%) 3 (3.2%) 5 (3.9%)
Implant diameter 3.7 vs 4.7, P = .0004.7 vs 6.0, P = .0003.7 vs 6.0, P = .0003.7 vs (4.7 + 6.0), P = .000
3.7 mm 35 (100%) 0 (0.0%) 0 (0.0%) 0 (0.0%) 35 (27.3%)
4.7 mm 0 (0.0%) 29 (100%) 0 (0.0%) 29 (31.2%) 29 (22.7%)
6.0 mm 0 (0.0%) 0 (0.0%) 64 (100%) 64 (68.8%) 64 (50.0%)
Concomitant health risks (any/none)
3.7 vs 4.7, P = .3754.7 vs 6.0, P = .5163.7 vs 6.0, P = .0493.7 vs (4.7 + 6.0), P = .063
None 24 (70.6%) 24 (82.8%) 53 (88.3%) 77 (86.5%) 98 (81.7%)
Health risk(s) 10 (29.4%) 5 (17.2%) 7 (11.7%) 12 (13.5%) 22 (18.3%)
Concomitant health risks (type)
3.7 vs 4.7, P = .3584.7 vs 6.0, P = .0203.7 vs 6.0 P = .0013.7 vs (4.7 + 6.0), P = .006
None 24 (70.6%) 24 (82.0%) 53 (89.8%) 77 (87.5%) 98 (82.4%)
Diabetes 1 (2.9%) 0 (0.0%) 0 (0.0%) 0 (0.0%) 1 (0.8%)
Hypertension 1 (2.9%) 2 (6.9%) 0 (0.0%) 2 (2.3%) 3 (2.5%)
Periodontitis 8 (23.5%) 3 (10.3%) 1 (1.7%) 4 (4.5%) 12 (10.1%)
Smoking 0 (0.0%) 0 (0.0 %) 5 (8.5 %) 5 (5.7%) 5 (4.2%)
No. of treatment sites per patient
3.7 vs 4.7, P = 1.0004.7 vs 6.0, P = .6783.7 vs 6.0 P = .4543.7 vs (4.7 + 6.0), P = .494
1 30 (88.2%) 26 (89.7%) 56 (51.6%) 43 (46.2%) 59 (46.1%)
2 4 (11.8%) 3 (10.3%) 4 (48.4%) 50 (53.8%) 69 (53.9%)
NFR† adverse event (any/none)
3.7 vs 4.7, P = 1.0004.7 vs 6.0, P = .5333.7 vs 6.0 P = .2803.7 vs (4.7 + 6.0), P = .294
None 32 (94.1%) 28 (96.6%) 62 (98.4%) 90 (97.8%) 122 (96.8%)
Adverse event(s) 2 (5.9%) 1 (3.4%) 1 (1.6%) 2 (23.2%) 4 (3.2%)
NFR† adverse event (type)
3.7 vs 4.7, P = .2364.7 vs 6.0, P = .5703.7 vs 6.0, P = .1173.7 vs (4.7 + 6.0), P = .045
None 32 (94.1%) 28 (96.6%) 62 (98.4%) 90 (97.8%) 122 (96.8%)
Cement failure 2 (5.9%) 0 (100%) 0 (0.0%) 0 (0.0%) 2 (1.6%)
Loose screw 0 (0.0%) 1 (3.4%) 1 (1.6%) 2 (2.2%) 2 (1.6%)
*Fisher exact (2 × 2), likelihood ratio chi-square. Used significance levels from Satterthwaite t test and Wilcoxon nonparametric test when sample variances were unequal (significant, folded F test ≤ .05).†NFR = Non–failure-related.
© 2012 BY QUINTESSENCE PUBLISHING CO, INC. PRINTING OF THIS DOCUMENT IS RESTRICTED TO PERSONAL USE ONLY. NO PART OF MAY BE REPRODUCED OR TRANSMITTED IN ANY FORM WITHOUT WRITTEN PERMISSION FROM THE PUBLISHER.
Ormianer et al
The International Journal of Oral & Maxillofacial Implants e9
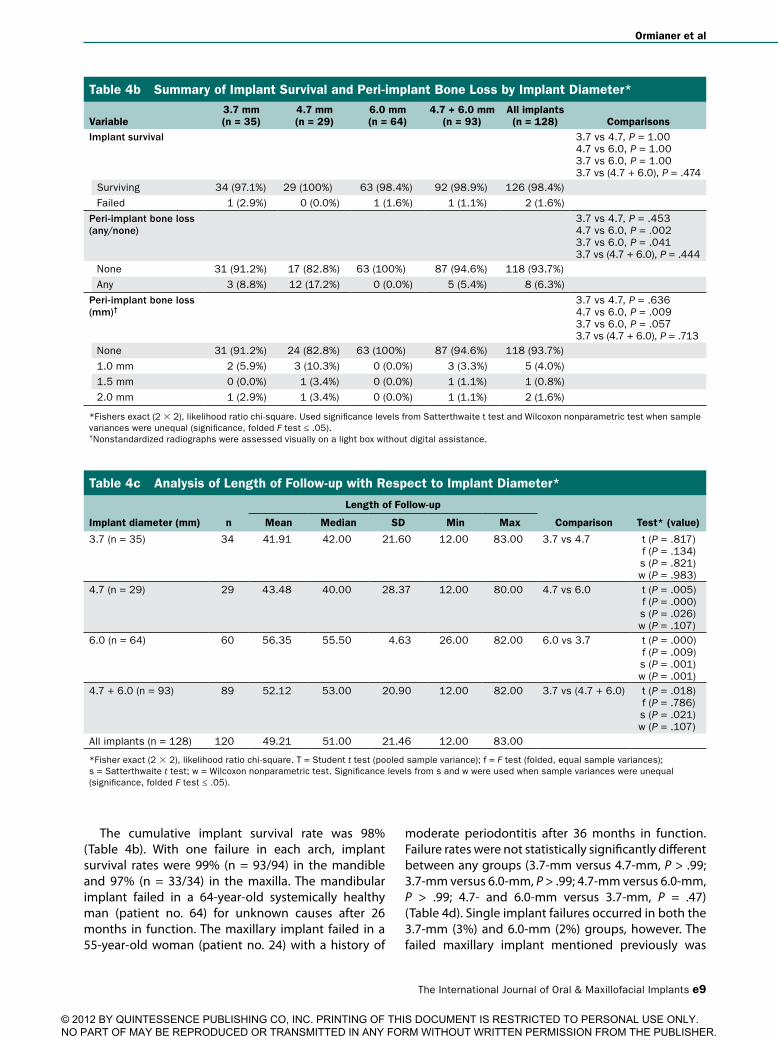
The cumulative implant survival rate was 98% (Table 4b). With one failure in each arch, implant survival rates were 99% (n = 93/94) in the mandible and 97% (n = 33/34) in the maxilla. The mandibular implant failed in a 64-year-old systemically healthy man (patient no. 64) for unknown causes after 26 months in function. The maxillary implant failed in a 55-year-old woman (patient no. 24) with a history of
moderate periodontitis after 36 months in function. Failure rates were not statistically significantly different between any groups (3.7-mm versus 4.7-mm, P > .99; 3.7-mm versus 6.0-mm, P > .99; 4.7-mm versus 6.0-mm, P > .99; 4.7- and 6.0-mm versus 3.7-mm, P = .47) (Table 4d). Single implant failures occurred in both the 3.7-mm (3%) and 6.0-mm (2%) groups, however. The failed maxillary implant mentioned previously was
Table 4b Summary of Implant Survival and Peri-implant Bone Loss by Implant Diameter*
Variable3.7 mm (n = 35)
4.7 mm (n = 29)
6.0 mm (n = 64)
4.7 + 6.0 mm (n = 93)
All implants (n = 128) Comparisons
Implant survival 3.7 vs 4.7, P = 1.004.7 vs 6.0, P = 1.003.7 vs 6.0, P = 1.003.7 vs (4.7 + 6.0), P = .474
Surviving 34 (97.1%) 29 (100%) 63 (98.4%) 92 (98.9%) 126 (98.4%)
Failed 1 (2.9%) 0 (0.0%) 1 (1.6%) 1 (1.1%) 2 (1.6%)
Peri-implant bone loss (any/none)
3.7 vs 4.7, P = .4534.7 vs 6.0, P = .0023.7 vs 6.0, P = .0413.7 vs (4.7 + 6.0), P = .444
None 31 (91.2%) 17 (82.8%) 63 (100%) 87 (94.6%) 118 (93.7%)
Any 3 (8.8%) 12 (17.2%) 0 (0.0%) 5 (5.4%) 8 (6.3%)
Peri-implant bone loss (mm)†
3.7 vs 4.7, P = .6364.7 vs 6.0, P = .0093.7 vs 6.0, P = .0573.7 vs (4.7 + 6.0), P = .713
None 31 (91.2%) 24 (82.8%) 63 (100%) 87 (94.6%) 118 (93.7%)
1.0 mm 2 (5.9%) 3 (10.3%) 0 (0.0%) 3 (3.3%) 5 (4.0%)
1.5 mm 0 (0.0%) 1 (3.4%) 0 (0.0%) 1 (1.1%) 1 (0.8%)
2.0 mm 1 (2.9%) 1 (3.4%) 0 (0.0%) 1 (1.1%) 2 (1.6%)
*Fishers exact (2 × 2), likelihood ratio chi-square. Used significance levels from Satterthwaite t test and Wilcoxon nonparametric test when sample variances were unequal (significance, folded F test ≤ .05).†Nonstandardized radiographs were assessed visually on a light box without digital assistance.
Table 4c Analysis of Length of Follow-up with Respect to Implant Diameter*
Length of Follow-up
Implant diameter (mm) n Mean Median SD Min Max Comparison Test* (value)
3.7 (n = 35) 34 41.91 42.00 21.60 12.00 83.00 3.7 vs 4.7 t (P = .817)f (P = .134)s (P = .821)w (P = .983)
4.7 (n = 29) 29 43.48 40.00 28.37 12.00 80.00 4.7 vs 6.0 t (P = .005)f (P = .000) s (P = .026)w (P = .107)
6.0 (n = 64) 60 56.35 55.50 4.63 26.00 82.00 6.0 vs 3.7 t (P = .000)f (P = .009) s (P = .001)w (P = .001)
4.7 + 6.0 (n = 93) 89 52.12 53.00 20.90 12.00 82.00 3.7 vs (4.7 + 6.0) t (P = .018)f (P = .786) s (P = .021)w (P = .107)
All implants (n = 128) 120 49.21 51.00 21.46 12.00 83.00
*Fisher exact (2 × 2), likelihood ratio chi-square. T = Student t test (pooled sample variance); f = F test (folded, equal sample variances); s = Satterthwaite t test; w = Wilcoxon nonparametric test. Significance levels from s and w were used when sample variances were unequal (significance, folded F test ≤ .05).
© 2012 BY QUINTESSENCE PUBLISHING CO, INC. PRINTING OF THIS DOCUMENT IS RESTRICTED TO PERSONAL USE ONLY. NO PART OF MAY BE REPRODUCED OR TRANSMITTED IN ANY FORM WITHOUT WRITTEN PERMISSION FROM THE PUBLISHER.

Ormianer et al
e10 Volume 27, Number 1, 2012
3.7 mm in diameter, and the failed mandibular implant was 6.0 mm in diameter. The causes of both implant failures could not be determined from the archived data; however, both patients were subsequently treat-ed outside of the present data analysis.
The majority of surviving implants (94%) had no documented bone loss (Table 4b). Of the eight implants (6%) with recorded bone loss, half were placed in patients with a history of mild (n = 2) or moderate (n = 2) periodontitis. A total of 12 patients (9%, 12/128) had a history of mild (n = 3) to moderate (n = 4) periodontitis (five maxillary and seven man-dibular implant patients). Within this periodontitis subgroup, one patient lost 2 mm of bone, one patient lost 1.5 mm of bone, and two patients each lost 1 mm of bone. In the nonperiodontitis subgroup, three implants exhibited 1 mm of bone loss and one implant sustained 2.0 mm of bone loss. At the implant level, no bone loss was reported around 6.0-mm implants (0%), while bone loss was reported for both 3.7-mm (9%) and 4.7-mm (17%) implants. Comparisons of bone loss (any/none) between groups did not achieve statistical significance for the 3.7-mm versus 4.7-mm implants (P = .45) or for the combined wide-diameter group (4.7-/6.0-mm) versus the 3.7-mm group (P = .44). Bone loss differed significantly between the 3.7-mm and 6.0-mm groups (P = .04) and between the 4.7-mm and 6.0-mm groups (P = .002). This finding affirmed the al-ternate study hypothesis.
Non–failure-related adverse events among surviving implants were rare (3%) and restricted to cement failures and screw loosening, each of which exhib-ited a prevalence rate of 1.6% (Table 4a). Comparisons of adverse event rates (any/none) did not reach
statistical significance for any between-group com-parisons (3.7 mm [6%] versus 4.7 mm [3%], P > .999; 3.7 mm versus 6.0 mm [2%], P = .280; 4.7 mm versus 6.0 mm, P = .533; combined 4.7/6.0 mm versus 3.7 mm, P = .294). Cement failure was unique to the 3.7-mm group (6%), while a single case of screw loosening was reported in both the 4.7-mm (3.4%) and 6.0-mm (1.6%) groups. The two cases of cement failure were observed for 3.7-mm-wide implants that were 10 mm and 11.5 mm long. Conversely, the two cases of screw loosening were limited to wide-diameter implants (4.7-mm and 6.0-mm) that were 10 mm and 13 mm in length. The cumulative success rate for all surviving im-plants was 98.4%, because two implants showed more than 1.5 mm of bone loss.
DISCUSSION
Marginal bone loss around dental implants is a complex phenomenon that has been linked to numerous etiolo-gies in the dental literature.27–30 One such variable is the influence of the hardness of the occlusal material on peri-implant bone strains. In the present study, the material characteristics of the prosthetic restorations used in the FEA models were not identical to those in the clinical database, since the latter were fabricated with a variety of porcelains and base metals that may have differed slightly from each other in mechanical characteristics. In the FEA models, the decision to use the same titanium alloy characteristics as the implant itself was based on the findings of previous FEA31,32 and in vivo32 studies that found no significant stress differences when single implants were restored with
Table 4d Analysis of Patient Age with Respect to Implant Diameter*
Implant diameter (mm) n Mean Median SD Min Max Comparison Test* (value)
3.7 (n = 35) 34 42.91 55.50 12.46 19.00 70.00 3.7 vs 4.7 t (P = .241)f (P = .966)s (P = .241)w (P = .278)
4.7 (n = 29) 29 46.62 47.00 12.34 19.00 70.00 4.7 vs 6.0 t (P = .000)f (P = .623) s (P = .000)w (P = .000)
6.0 (n = 64) 60 60.95 63.50 11.47 35.00 83.00 6.0 vs 3.7 t (P = .000)f (P = .568) s (P = .000)w (P = .000)
4.7 + 6.0 (n = 93) 89 56.28 58.00 13.50 19.00 83.00 3.7 vs (4.7 + 6.0) t (P = .000)f (P = .616) s (P = .000)w (P = .000)
All implants (n = 128) 120 52.62 53.50 14.63 19.00 83.00 N/A
*Fisher exact (2 × 2), likelihood ratio chi-square. t = Student t test (pooled sample variance); f = F test (folded, equal sample variances); s = Satterthwaite t test; w = Wilcoxon nonparametric test. Significance levels from s and w were used when sample variances were unequal (significance, folded F test ≤ .05).
© 2012 BY QUINTESSENCE PUBLISHING CO, INC. PRINTING OF THIS DOCUMENT IS RESTRICTED TO PERSONAL USE ONLY. NO PART OF MAY BE REPRODUCED OR TRANSMITTED IN ANY FORM WITHOUT WRITTEN PERMISSION FROM THE PUBLISHER.

Ormianer et al
The International Journal of Oral & Maxillofacial Implants e11
acrylic resin, gold alloy, or porcelain crowns, despite differences in their respective Vickers hardness (VHN) values and moduli of elasticity. The reported VHN value for titanium alloy was 32033 as compared to 775 for alumina-reinforced porcelain,34 250 VHN for gold alloy (type IV),35 and 158 VHN for composite resin.36
In creating a hypothetical bone model, the authors acknowledged that the extrapolation of 3D FEA data to clinical findings would be highly limited in general, especially using the present theoretical bone model. However, 3D FEA is the most accurate and reproduc-ible theoretical method of evaluating load and stress distribution in the region of bone-implant contact and can provide more accurate data than bench testing or other experimental methods. While patient vari-ables are extremely important in any clinical context, they cannot all be simulated in a theoretical or experi-mental analysis. For this reason, 3D FEA was used to obtain and evaluate stresses in bone that could not be accurately measured in a clinical context. To facilitate model convergence for the evaluation of 1 mm of peri-implant radial bone, the bone materials were merged to form a homogenous modulus of elasticity that ranged between types 2 and 3 bone.21 This model was specifically selected based on over 1,900 clinical evalu-ations that found that types 2 and 3 bone21 predomi-nated in the human mandible and maxilla.37 Despite its limitations, 3D FEA was best able to provide impor-tant information pertaining to the influence of implant diameter, occlusal load direction, bone volume, bone density, and other variables on stress levels, which could be used as general guidelines for case planning.
To evaluate the effect of variations in cortical bone thickness, all other variables were kept constant. The decision to assume 100% BIC was based on the com-mon use of this assumption in other FEA studies.38–40
The finding that all observed stresses were below the theoretical threshold for bone loss (50 MPa) regardless of buccal plate thickness (Experiment 1) suggested that other clinical factors may have exacerbated the effects of thin (< 2 mm) buccal plate observed in a prospective clinical study reported by Spray et al.25 Alternatively, the homogenous structure of the experimental bone model may not have accu-rately reflected the stress concentrations that would be encountered in an actual clinical environment. Since facial plate thickness was not measured in the present clinical analysis, additional experimentation will be necessary to resolve this question.
In sites with thin cortical plates, wide-diameter implants may be preferable to narrower implants (Experiment 2), provided that the residual buccal plate is more than 1 mm thick (Experiment 1). Other FEA research41 has reported that off-axis loading may significantly increase compressive stresses within the
crestal cortical bone, but the present study found that the use of wide-diameter implants in the first molar area may help to greatly reduce bone stress concen-trations in this region of high occlusal forces (Experi-ment 3). In the clinical portion of the study, one patient (no. 1) was restored with mutually occluding maxillary and mandibular right first molars. Both of the patient’s 13-mm-long implants exhibited peri-implant bone loss, but the amount of bone loss differed accord-ing to implant diameter; the observed losses were 1 mm around a 4.7-mm-diameter maxillary implant and 2 mm around an occluding 3.7-mm-diameter mandibular implant. The patient had no comorbidi-ties at the time of surgery, but the patient records indicated that occlusal overload may have caused or contributed to the observed bone loss. There was no peri-implant bone loss around the widest diameter (6.0-mm) implants, which also represented the great-est number (n = 63) of implants placed per diameter. Although twice as many 4.7-mm implants lost bone (17%, 5/29) compared to 3.7-mm (9%, 3/34) implants, the difference was not statistically significant (P = .45).
The % BIC that an implant develops has a direct bear-ing on bone stress levels (Experiment 4), indicating that implant design and surface properties are extremely important. While all dental implants are designed to become fully incorporated into the biologic system of the recipient, the ability to achieve 100% BIC has not yet been documented in the dental literature. This is a result, in part, of the nature of bone itself, which is not fully mineralized but contains many marrow spaces and voids within its trabecular structure.
A limitation of the present study was that, except for implant diameter, the many variables examined in the 3D FEA portion of the study could not be directly evaluated in the clinical portion of the study. The finding that patient risk factors, rather than implant diameter, had the greatest influence on crestal bone loss validated the alternate study hypothesis. Despite this shortcoming, however, the 3D FEA data were able to provide some general guidelines for implant selec-tion and treatment planning in the first molar region.
CONCLUSIONS
Implants that were 6.0 mm in diameter were not more susceptible to failure than standard-diameter implants and helped to preserve peri-implant bone levels. The present three-dimensional finite element analyses support previous clinical findings that maintaining approximately 2 mm of residual facial plate can reduce concentrations of bone stresses and help preserve buccal bone height. A history of periodontitis may adversely affect long-term marginal bone stability.
© 2012 BY QUINTESSENCE PUBLISHING CO, INC. PRINTING OF THIS DOCUMENT IS RESTRICTED TO PERSONAL USE ONLY. NO PART OF MAY BE REPRODUCED OR TRANSMITTED IN ANY FORM WITHOUT WRITTEN PERMISSION FROM THE PUBLISHER.

Ormianer et al
e12 Volume 27, Number 1, 2012
ACKNOWLEDGMENTS
The authors gratefully acknowledge the contributions of Hai Bo Wen, PhD, Suneel Battula, PhD, and Michael Warner, MA, of Zimmer Dental, for scientific consultation and bibliographic assistance.
REFERENCES
1. Woelfel JB (ed). Permer’s Outline for Dental Anatomy, ed 2. London: Henry Kimpton, 1975:87–120.
2. Misch CE. Endosteal implants for posterior single tooth replace-ment: Alternatives, indications, contraindications, and limitations. J Oral Implantol 1999;25:80–94.
3. Marcus SE, Drury TF, Brown LJ, Zion GR. Tooth retention and tooth loss in the permanent dentition of adults: United States, 1988–1991. J Dent Res 1996;75(special issue):684–695.
4. Brown TT, Goryakin Y. The oral health status of adults 65 and older in California: 1995–2006. J Calif Dent Assoc 2009;37:571–578.
5. Müller F, Naharro M, Carlsson GE. What are the prevalence and inci-dence of tooth loss in the adult and elderly population in Europe? Clin Oral Implants Res 2007;18(suppl 3):2–14.
6. Priest G. Single-tooth implants and their role in preserving remaining teeth: A 10-year survival study. Int J Oral Maxillofac Implants 1999; 14:181–188.
7. Salinas TJ, Eckert SE. In patients requiring single-tooth replacement, what are the outcomes of implant- as compared to tooth-support-ed restorations? Int J Oral Maxillofac Implants 2007;22(suppl):71–95.
8. Salinas TJ, Block MS, Sadan A. Fixed partial denture of single-tooth implant restoration? Statistical considerations for sequencing and treatment. J Periodontol 2004;62(suppl 2):2–16.
9. Moy PK, Medina D, Shetty V, Aghaloo TL. Dental implant failure rates and associated risk factors. Int J Oral Maxillofac Implants 2005;20:569–577.
10. Herrmann I, Lekholm U, Holm S, Kultje C. Evaluation of patient and implant characteristics as potential prognostic factors for oral implant failures. Int J Oral Maxillofac Implants 2005;20:220–230.
11. Chung DM, Oh TJ, Lee J, Misch CE, Wang HL. Factors affecting late implant bone loss: A retrospective analysis. Int J Oral Maxillofac Implants 2007;22:117–126.
12. Carvalho W, Casado PL, Caúla AL, Barboza EP. Implants for single first molar replacement: Important treatment concerns. Implant Dent 2004;13:328–335.
13. Piattelli A, Scarano A, Paolantonio M. Clinical and histologic features of a nonaxial load on the osseointegration of a posterior mandibular implant: Report of a case. Int J Oral Maxillofac Implants 1998;13:273–275.
14. Huang HM, Tsai CM, Chang CC, Lin CT, Lee SY. Evaluation of loading conditions on fatigue-failed implants by fracture surface analysis. Int J Oral Maxillofac Implants 2005;20:854–859.
15. Levin L, Laviv A, Schwartz-Arad D. Long-term success of implants replacing a single molar. J Periodontol 2006;77:1528–1532.
16. Gastaldo JF, Cury PR, Sendyk WR. Effect of the vertical and horizon-tal distances between adjacent implants and between a tooth and an implant on the incidence of interproximal papilla. J Periodontol 2004;75:1242–1246.
17. Shin SW, Bryant SR, Zarb GA. A retrospective study on the treatment outcome of wide-bodied implants. Int J Prosthodont 2004;17:52–58.
18. Frost HM. Bone’s mechanostat: A 2003 update. Anat Rec 2003; 275A:1081–1101.
19. Roberts WE. Fundamental principles of bone physiology. Metabo-lism and loading. In Naert I, van Steenberghe D, Worthington P (eds). Osseointegration in Oral Rehabilitation: An Introductory Textbook. Chicago: Quintessence,1993:157–170.
20. Sugiura T, Horiuchi K, Sugimura M, Tsutsumi S. Evaluation of threshold stress for bone resorption around screws based on in vivo strain mea-surement of miniplate. J Musculoskel Neuron Interact 2000;1:165–170.
21. Lekholm U, Zarb GA. Patient selection and preparation. In: Brånemark PI, Zarb GA, Albrektsson T (eds). Tissue-Integrated Prostheses: Osseoin-tegration in Clinical Dentistry. Chicago: Quintessence, 1985:199–209.
22. Chun HJ, Shin HS, Han CH, Lee SH. Influence of implant abutment type on stress distribution in bone under various loading condi-tions using finite element analysis. Int J Oral Maxillofac Implants 2006;21:195–202.
23. Johnsen SE, Svensson KG, Trulsson M. Forces applied by anterior and posterior teeth and roles of periodontal afferents during hold-and-split tasks in human subjects. Exp Brain Res 2007;178:126–134.
24. Pereira LJ, Pastore MG, Bonjardim LF, Castelo PM, Cavião MBD. Molar bite force and its correlation with signs of temporomandibu-lar dysfunction in mixed and permanent dentition. J Oral Rehabil 2007;34:759–766.
25. Spray JR, Black CG, Morris HF, Ochi S. The influence of bone thick-ness on facial marginal bone response: Stage 1 placement through stage 2 uncovering. Ann Periodontol 2000;5:119–128.
26. Todisco M, Trisi P. Histomorphometric evaluation of six dental implant surfaces after early loading in augmented human sinuses. J Oral Implantol 2006;32:153–166.
27. Oh TJ, Yoon J, Misch CE, Wang HL. The causes of early implant bone loss: Myth or science. J Periodontol 2002;73:322–333.
28. Galindo-Moreno P, Fauri M, Avila-Ortiz G, Fernandez-Barbero JE, Sanchez-Fernandez ACLE. Influence of alcohol and tobacco habits on peri-implant marginal bone loss: A prospective study. Clin Oral Implants Res 2005;16:579–586.
29. Nosaka Y, Tachi Y, Shimpuku H, Kawamura T, Ohura K. Association of calcitonin receptor gene polymorphism with early marginal bone loss around endosseous implants. Int J Oral Maxillofac Implants 2002;17:38–43.
30. Ricci G, Aimetti M, Stablum W, Guasti A. Crestal bone resorption 5 years after implant loading: Clinical and radiologic results with a 2-stage implant system. Int J Oral Maxillofac Implants 2004;19:597–602.
31. Stegaroiu R, Khraisat A, Nomura S, Miyakawa O. Influence of super-structure materials on strain around an implant under 2 loading conditions: A technical investigation. Int J Oral Maxillofac Implants 2004;19:735–742.
32. Bassit R, Lindström H, Rangert B. In vivo registration of force develop-ment with ceramic and acrylic resin occlusal materials on implant-supported prostheses. Int J Oral Maxillofac Implants 2002;17:17–23.
33. Ida K, Togaya T, Tsutsumi S, Takeuchi M. Effect of magnesia invest-ments in the dental casting of pure titanium or titanium alloys. Dent Mater J 1982;1:8–22.
34. Seghi RR, Denry I, Brajevic F. Effects of ion exchange on hardness and fracture toughness of dental ceramics. Int J Prosthodont 1992; 5:309–314.
35. Espevik S. Correlation between strength and hardness of dental casting gold alloys. Eur J Oral Sci 1997;85:496–499.
36. Willems G, Lambrechts P, Braem M, Celis JP, Vanherle G. A classifica-tion of dental composites according to their morphological and mechanical characteristics. Dent Mater 1992;8:310–319.
37. Orenstein IH, Synan WJ, Truhlar RS, et al. Bone quality in patients receiving endosseous dental implants: DICRG interim report no. 1. Implant Dent 1994;3:90–94.
38. Koca OL, Eskitascioglu G, Usumez A. Three dimensional finite element analysis of functional stresses in different bone locations produced by implants placed in maxillary posterior region of the sinus floor. J Prosthet Dent 2005;93:38–44.
39. Lenz RQ, Schweizerhof K, Schindler HJ, et al. Simulation of bone modeling around a screw implant in the mandible. Proc Appl Math Mech 2003;2:254–255.
40. de Almeida EO, Rocha EP, Assunção WG, Júnior AC, Anchieta RB. Cortical bone stress distribution in mandibles with different configu-rations restored with prefabricated bar prosthesis protocol: A three dimensional finite element analysis. J Prosthodont 2011;20:29–34.
41. O’Mahony A, Bowles Q, Woolsey G, Robinson SJ, Spencer P. Stress distribution in the single-unit osseointegrated dental implant; Finite element analyses of axial and off-axial loading. Implant Dent 2000;9:207–218.
© 2012 BY QUINTESSENCE PUBLISHING CO, INC. PRINTING OF THIS DOCUMENT IS RESTRICTED TO PERSONAL USE ONLY. NO PART OF MAY BE REPRODUCED OR TRANSMITTED IN ANY FORM WITHOUT WRITTEN PERMISSION FROM THE PUBLISHER.