Embed Size (px)
Citation preview
1
Impartiality Review: BBC Reporting of Statistics Report on qualitative research with the BBC audience July 2016
Prepared For:
The BBC Trust 180 Great Portland Street, London, W1W 5QZ
Prepared by:
Oxygen Brand Consulting 1 Bisham Gardens London N6 6DJ t: 07802 806 651 e: [email protected]
2
Contents
Page 1.Executive summary 3 2.Introduction 6
1. Background and research objectives 6
2. Summary of method 7
3. Sample rationale 8
4. Sample 9
5. Stimulus and discussion guide 10 3.Findings 12
1. Differences in ‘numeracy’ within the sample 12
2. Definitions of impartiality and accuracy in news reporting 14
3. Expectations of the use of statistics and numbers by media platform, occasion and broadcaster
15
4. Perceived differences in types of news story, and the role of statistics in each
16
5. The ‘tension’ between being guided what to think and ‘making up your own mind’ in stories involving numbers
19
6. Sources 20
7. Do the audience perceive contributors’ statistics or interpretations are challenged by the BBC?
21
8. The use of averages 22
9. Issues related to using large numbers for ‘headline impact’ 23
10. Case histories 25
a. Spending Review 25
b. Tax Credits 27
c. Migration 30
d. Processed Meat 35
11. Learning from the case history clips 38
12. The ideal use of graphics to communicate statistics 39
13. The preferred expression of numbers and statistics 42
14. The meaning of ‘context’ 43
15. The views of those with a disability 44
16. Overall verdict of the audience on how the BBC performs versus other sources
45
4.Appendix 46 1. Detailed questions addressed by the research 46
2. Detailed methodology 47
3. Discussion guide and diary summary 49
4. Full discussion guides for the engaged and less engaged audiences 54
3
1. Executive Summary Below we summarise the audience research component of the BBC Trust’s review on BBC reporting of statistics, which was designed to assess whether the audience perceive that BBC use of statistics supports impartial reporting, and, as far as the audience can judge, whether the use of numbers in news reports is accurate. There is an assumption by the audience that figures quoted by the BBC will be accurate, factual and well verified and that the BBC sets out to be impartial in its use of statistics.
The study produced a consensus that the BBC is perceived to be accurate in its use of statistics. The majority of people in the sample also agreed that the BBC refers to statistics in an unbiased way, successfully supporting impartial reporting. Judging from the respondents in this study, there is huge divergence in the audience’s facility with numbers, from those who quickly find patterns in them and can mentally estimate proportion and meaning, to those who ‘blank out’ figures or find them very confusing. For this reason we observed very different interpretations and misinterpretations of statistics and numbers based on exactly the same news reports. Audience ‘mishearing’ and misinterpretation of data was common in the study, and although the BBC’s presentation of data is generally perceived to be good or very good, audiences feel there is still room to improve and simplify to help people interpret and ‘hear’ it better. The BBC is felt to pitch its numerical content by platform and to demographic. On the whole, the radio we researched was praised for spacing statistics well, only picking salient statistics and presenting with good emphasis and pace. Online is seen as a source of definitive numerical explanations and graphics. It allows examination and review of facts at an individual pace. BBC online is particularly valued by the educational community. The verdict on the presentation of data in TV news and current affairs was less conclusive. Some found the clips from the main News at Six on BBC One too ‘number heavy’, and our analysis indicated some TV packages were perhaps too challenging for some viewers, both in the volume of numerical information contained, and the multiple separate strands of thought and argument they attempted to include within an individual story. Some feel TV news reports don’t contain enough graphical representation of data and are too reliant on written and spoken numbers. In particular, viewers say they struggle to ‘keep up’ and eventually ‘tune out’ when large volumes of numbers are read out and shown on screen at a fast pace and in succession.
However, it is claimed that more spacing of statistics and the use of graphics, comparisons and analogies which explain scale or proportion do have the potential and ability to re-engage the audience and stop this happening. Accurate numbers and information were expected from the BBC and were felt to be delivered. However, a successful graphic presentation of numbers was felt to give extra audience value by enlightening the audience, clarifying or helping them think again. Even simple graphics had the potential to communicate both quickly and very easily. When this was achieved it was particularly appreciated. Audiences judged graphics like pie, line and bar charts simplest, finding they explain trends and proportions or the ‘bigger picture’ at a glance. More complex graphs were not clear to all, and benefited from additional explanation such as voiceovers or a slow build on screen.
4
Audiences found certain figures easier to relate to than others. Most found it particularly hard to visualise ‘billions’ and very large distances. A reminder of what a billion was or a graphic visualising distance helped. The audience also found some ways of expressing proportions more easy to grasp. For example, ratios such as numbers out of ten or out of a hundred were easier for some to visualise than percentages. Occasionally using colloquialisms such as ‘a third’, ‘almost half’ or ‘doubled’ in place of percentages was also helpful. Mishearing or misremembering the numbers in reports, for example, ‘teens’ for ‘tens’, was common. ‘Tell and show’ techniques, where a figure was both spoken and written on screen were judged by respondents to reinforce communication. This technique could, however, become less effective for them if it went on too long (became ‘repetitive’), wasn’t interestingly presented or a large volume of numbers came too fast. The best use of this technique was felt to be on a Newsbeat video we researched, in which numbers were slowly revealed and the statistics chosen were felt to be appropriately selective and particularly relevant to the narrative.
A fairly high proportion of the audience were aware of the relevance of using unbiased sources. The audience reported that BBC material was always clearly sourced. However, sources were not always fully explained or referenced in full rather than as acronyms. Not all of the audience had a sophisticated ‘societal picture’ enabling them to understand the perspective of a source (for example, what a ‘think tank’ is). The least aware could sometimes assume all figures and arguments in reports came from the BBC. This could lead to mistaken inferences that the BBC was not being impartial (if for example, it was reporting a pro or anti-government position). Respondents found it helpful when journalists explained the identity, perspective and credentials of a source.
The audience sometimes needed clearer context to maintain concentration on a story containing data. This firstly meant more context on the importance of the story (‘why I should care’), and secondly on the validity of the numbers (‘should I be worried?’). Better story context included explaining the situation, why it is potentially important to the listener, who the players are, credentials of the sources, who will be affected and timeframe. Radio 1 News was felt to be good at contextualising in an unpatronising way and respondents felt other channels could learn something from its approach, which was perceived to make fewer assumptions about existing audience knowledge. The second area in which respondents felt the media in general sometimes failed to give context was the numbers themselves. Statistical context was needed for them to judge how important or serious a phenomenon was. For example, participants found it essential to know the base risk on which an uplift in risk was being calculated (medical reports), the sample size for a survey, the universe to which a statistic related, or whether an event was more frequent or intense than in previous years. The BBC was felt to be generally better than many other broadcasters at giving this kind of context. There was a seeming tension between what some respondents said they wanted, which was ‘stating the facts’ and giving audience members ‘the freedom to make up one’s own mind’ and what some other respondents asked for, which was a clearer steer on ‘what to think’ or ‘what it all means’ from the BBC. Two definitions of ‘impartiality’ in news were volunteered by the audience: firstly, that ‘all the facts’ had to be presented clearly so they could take a view on them, and, secondly, that the ‘points of view’ of all concerned parties should be exposed in debate. However, this was a general definition of impartiality. We followed it up by looking into what this meant specifically in relation to the presentation of numbers.
5
On consideration, many of the audience felt that in news stories that were essentially about numbers (for example health risk, or whether spending is going down or up) getting a variety of viewpoints or ‘opinions’ was sometimes not so relevant. Numbers themselves can be the important ‘facts’ which the audience need to understand in order to make a decision. However, due to differing levels of audience understanding and knowledge of maths, not all types of statistics are understandable for the audience. Sometimes the audience believed they would benefit from more explanation of what the figures mean. The audience judged that this analysis can come either from a statistical expert or a journalist. If it is a statistical expert they need to have a skill in making meaning accessible. If it is a journalist they need to have (or be able to access) the requisite analytical expertise to interpret the significance and meaning of the figures. If the factual data isn’t already fully understood by the audience then opinions arising from the data, particularly if argumentatively expressed, or using alternative sets of figures or diverging into side or additional issues, can be distracting. This is particularly the case if the arguers come from sources with a clear bias. The audience call this type of media debate ‘spinning numbers’. They say it is confusing and can cause them to drop out of trying to understand what is being said. The reporting of ‘controversial subjects’ such as migration was examined. Where subjects are ‘controversial’ it usually means that the audience already have strong fears or views related to them. Therefore the reporting does not fall into a vacuum and words or statistics can have an unexpectedly emotive effect on the audience. The audience suggested that the language and tone around the numbers needed to be particularly neutral (for example avoiding words like ‘foreigners’). If fears or prejudices were raised, then it was suggested that statistics were used to shed light on them and resolve debate. The audience already know there is fear and prejudice. However, they do not necessarily know the facts, and some saw factual education and information as an important function of news and current affairs. Quoting data does give an impression of extra accuracy. Respondents gave a view that large numbers,1 when quoted, are in themselves powerful and dramatic and that people draw inferences from them and can be frightened by them. Where large numbers are used in headlines ‘to draw attention’ then many felt their effect needs to be carefully considered. Not everyone scrolls right down to the bottom of an online news report or takes in more than the headline numbers, therefore any additional context needs to come early in the report. BBC journalists were not observed to spontaneously challenge errors in the presentation of data by interviewees ‘on the hoof’.2 However, there were several examples of carefully pre-planned challenges of data by BBC journalists in the test packages (for example on government spending) and the audience also noted examples of this in their follow-up diaries.
1 Such as hundreds of thousands 2 That is, the audience did not observe spontaneous challenges by journalists during live interviews
on points of maths such as whether an average was a mean or a median, or on sample size, or on what percentage a number was of the total.

6
2. Introduction 2.1 Background and research objectives The audience research report is one component of the workstreams of the review, which included:
Engagement with key stakeholders: interviews with organisations and individuals, including institutions and BBC stakeholders.
Audience research in the four nations.
Content analysis.
The review covered:
News, current affairs and factual programming on radio, TV, and online on the UK public services, including selections of National, Network and Regional content.
Output that refers to statistics, particularly where matters of public policy and political controversy are covered.
The definition ‘output that refers to statistics’ relates both to reports in which statistics are quoted and the reporting of statistical studies themselves.
To establish whether the BBC provides ‘duly accurate and impartial content’ the review sought to answer the following questions, set out in the terms of reference:
To assess whether BBC UK public services news and current affairs achieves due impartiality and accuracy on controversial subjects when it includes statistical analysis.
To establish more generally whether the BBC provides duly accurate and impartial reporting of statistics in its UK public services news and current affairs output.
To assess whether BBC output provides accessible, critical analysis when reporting statistics to enable audiences to understand the issues.
To assess whether BBC content demonstrates due impartiality and accuracy through appropriate challenge and scrutiny of context in its reporting of statistics cited by third parties.
The role of audience research specifically within the review To focus audience debate helpfully within the research sessions the BBC Trust took a decision to ask the audience to look at some examples of BBC output from within the topic areas below:
Health
Migration3
3 The BBC uses the term Migrant to refer to all people on the move who have yet to complete the
legal process of claiming asylum. This group includes people fleeing war-torn countries such as Syria,
who are likely to be granted refugee status, as well as people who are seeking jobs and better lives, who governments are likely to rule are economic migrants.
7
Welfare/benefits
Economics
The topics were chosen because:
Some (migration and welfare) were deemed controversial and the interpretation of statistics about them, whether negative or positive, can lead to attitudinal shifts in the audience’s view of public policy and on significant political questions. Therefore coverage of them and the use of statistics within them are particularly sensitive.
The interpretation of statistics about health is significant not only in terms of influencing public attitudes on health policy but also in terms of helping the audience assess personal risk. How statistics are interpreted by the public has an important role in their potential actions.
The reporting of economics almost inevitably involves numerical data and although not all audiences engage with economic reporting, it is important that it is accessible to the audience.
The audience research explored how licence fee payers perceived the accuracy and impartiality of the BBC’s reporting of statistics from an audience perspective, particularly:
The accuracy of the coverage (as far as they were able to judge)
The extent to which the coverage was perceived to be partial or impartial
The differences that might exist across different news and current affairs formats: television, radio and online
In addition, there were 16 detailed additional question areas for the audience. These are covered in the first section of the appendix.
2.2 Summary of method We split the sample into members of the public who were ‘engaged’ with statistics and educated in them and a general public sample that were ‘less engaged’, that is, not specially educated in maths and averagely interested or entirely uninterested in statistics.
We designed the research to contain a large number of quite small focus groups, so ensuring respondents were mixed with other people similar to them in education, numeracy, gender and age. The intention was to reduce self-consciousness in their responses and get a clear and honest view of how they interpreted the numbers and figures in the test reports.
For the less engaged we concealed the topic of the groups, just telling them that the study was on news and current affairs. This was to minimise unrealistic preparation, declining to attend, or setting up of barriers in response. The ‘engaged' sample were told the subject of the research. As is customary, to ensure impartial comparison of media sources no one was told initially that the research focused on evaluating the BBC. We used a mix of three-hour ‘extended groups’ of eight to nine people for the engaged sample, two-hour ‘mini groups’ of four to six people for the less engaged sample and one-hour depth interviews for additional ‘special interest’ groups. These included healthcare professionals with a specific expertise in risk, men and women with visual and verbal impairments and some who might have a strong perspective on impartial reporting of the topics examined (we chose migrants to Britain and people qualifying for welfare benefits).
8
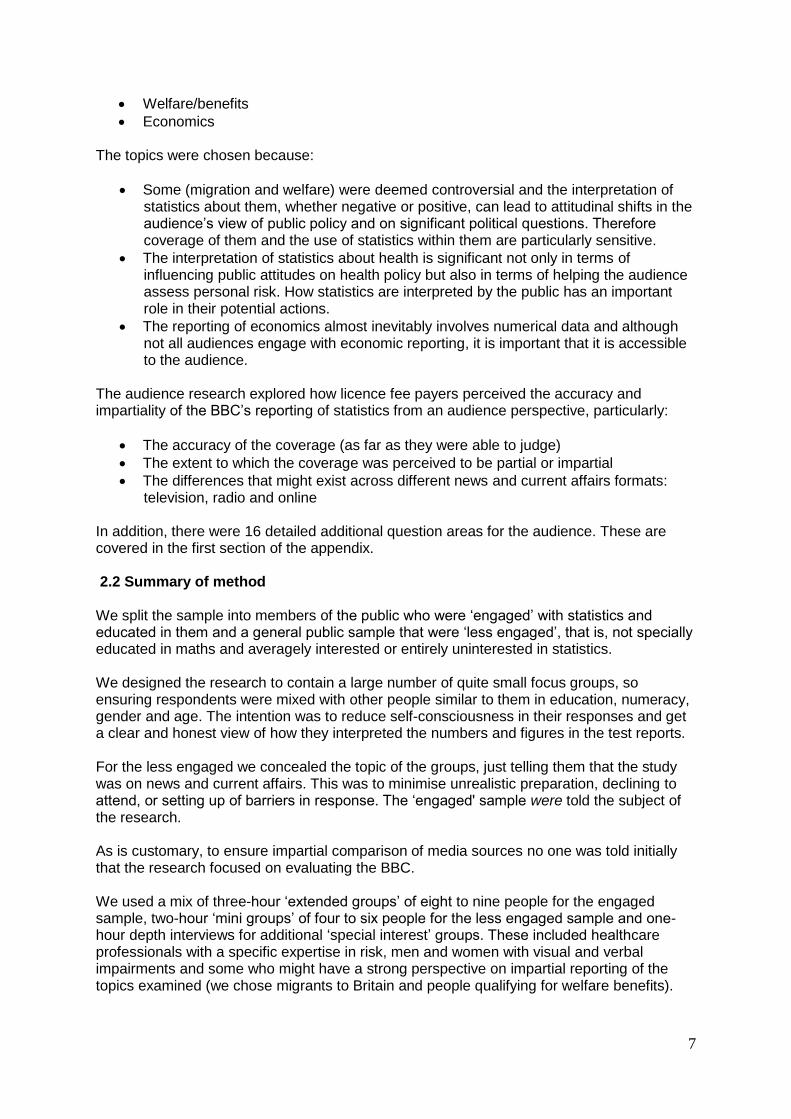
All respondents attended a focus group in which they were shown a reel of prepared stimulus. In addition all completed a detailed diary exploring their perception of how statistics were used in general news reporting in TV, radio and online. The engaged audience were asked to do this before they attended the group, the less engaged as a follow-up exercise.
Engaged general public: 3hr groups
This target was engaged and therefore able to interact for a longer period.
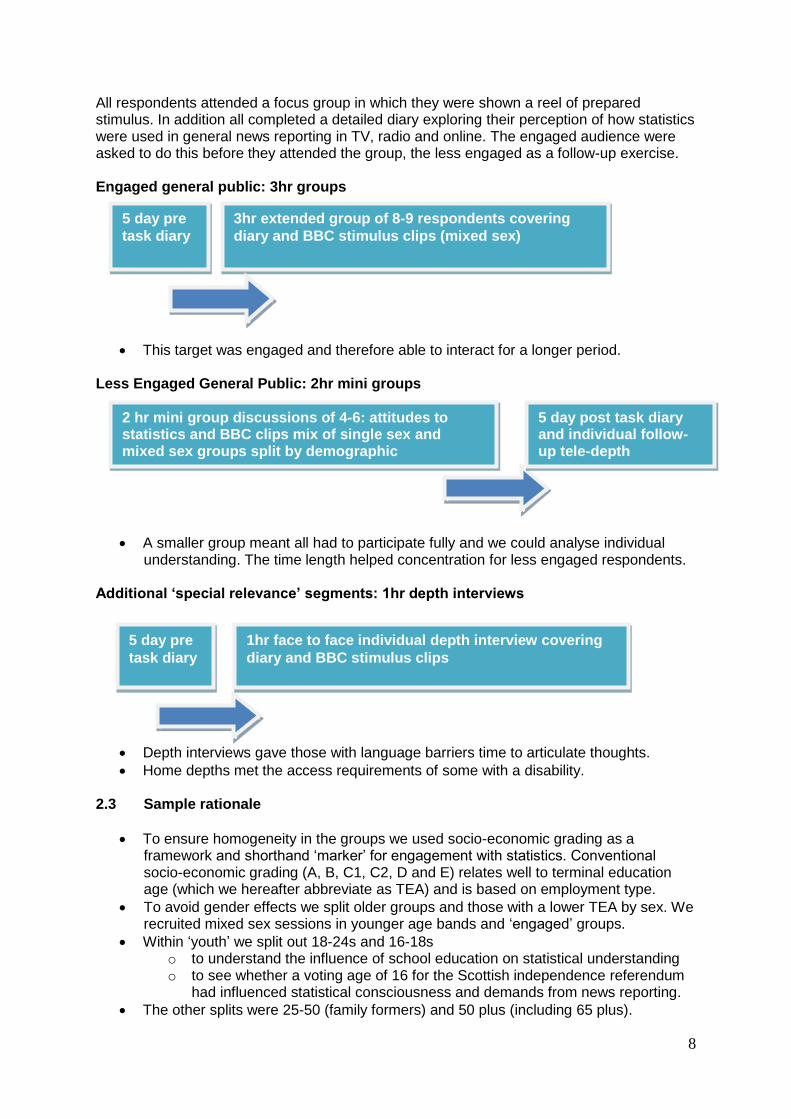
Less Engaged General Public: 2hr mini groups
A smaller group meant all had to participate fully and we could analyse individual understanding. The time length helped concentration for less engaged respondents.
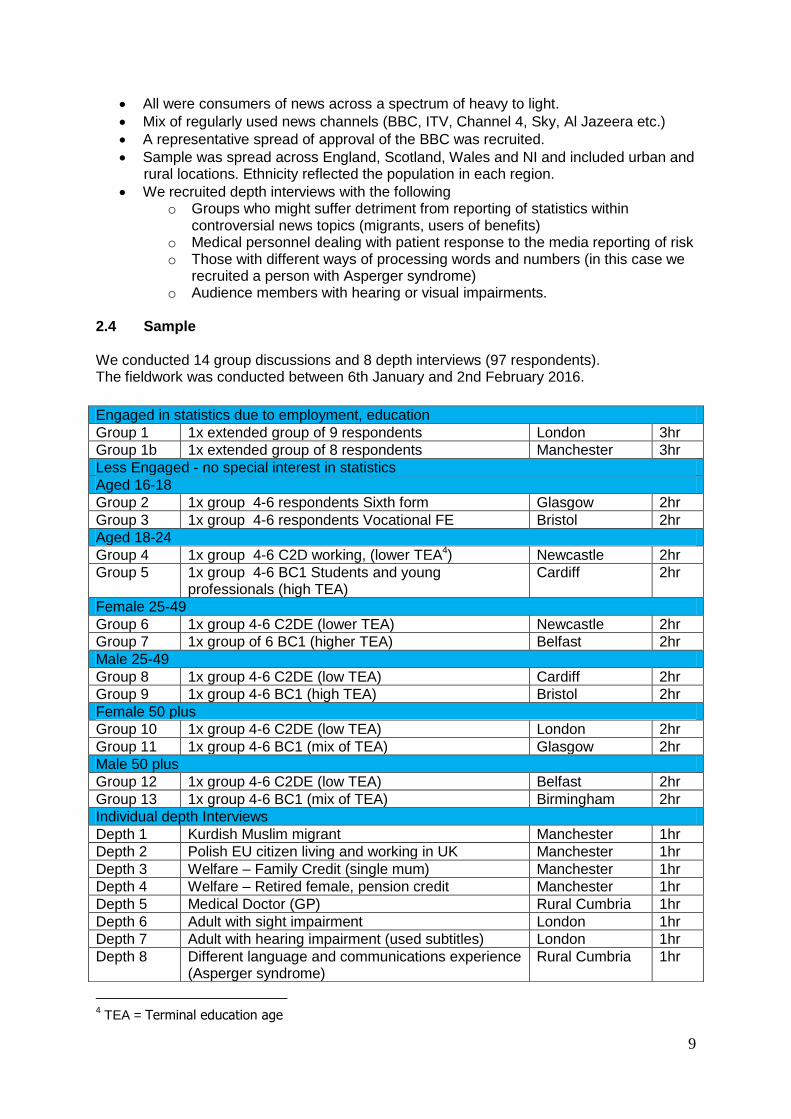
Additional ‘special relevance’ segments: 1hr depth interviews
Depth interviews gave those with language barriers time to articulate thoughts.
Home depths met the access requirements of some with a disability. 2.3 Sample rationale
To ensure homogeneity in the groups we used socio-economic grading as a framework and shorthand ‘marker’ for engagement with statistics. Conventional socio-economic grading (A, B, C1, C2, D and E) relates well to terminal education age (which we hereafter abbreviate as TEA) and is based on employment type.
To avoid gender effects we split older groups and those with a lower TEA by sex. We recruited mixed sex sessions in younger age bands and ‘engaged’ groups.
Within ‘youth’ we split out 18-24s and 16-18s o to understand the influence of school education on statistical understanding o to see whether a voting age of 16 for the Scottish independence referendum
had influenced statistical consciousness and demands from news reporting.
The other splits were 25-50 (family formers) and 50 plus (including 65 plus).
5 day pre
task diary
3hr extended group of 8-9 respondents covering
diary and BBC stimulus clips (mixed sex)
5 day post task diary and individual follow-up tele-depth
2 hr mini group discussions of 4-6: attitudes to statistics and BBC clips mix of single sex and mixed sex groups split by demographic
5 day pre
task diary
1hr face to face individual depth interview covering
diary and BBC stimulus clips
9
All were consumers of news across a spectrum of heavy to light.
Mix of regularly used news channels (BBC, ITV, Channel 4, Sky, Al Jazeera etc.)
A representative spread of approval of the BBC was recruited.
Sample was spread across England, Scotland, Wales and NI and included urban and rural locations. Ethnicity reflected the population in each region.
We recruited depth interviews with the following o Groups who might suffer detriment from reporting of statistics within
controversial news topics (migrants, users of benefits) o Medical personnel dealing with patient response to the media reporting of risk o Those with different ways of processing words and numbers (in this case we
recruited a person with Asperger syndrome) o Audience members with hearing or visual impairments.
2.4 Sample
We conducted 14 group discussions and 8 depth interviews (97 respondents). The fieldwork was conducted between 6th January and 2nd February 2016.
4 TEA = Terminal education age
Engaged in statistics due to employment, education Group 1 1x extended group of 9 respondents London 3hr Group 1b 1x extended group of 8 respondents Manchester 3hr Less Engaged - no special interest in statistics Aged 16-18 Group 2 1x group 4-6 respondents Sixth form Glasgow 2hr Group 3 1x group 4-6 respondents Vocational FE Bristol 2hr Aged 18-24 Group 4 1x group 4-6 C2D working, (lower TEA4) Newcastle 2hr Group 5 1x group 4-6 BC1 Students and young
professionals (high TEA) Cardiff 2hr
Female 25-49 Group 6 1x group 4-6 C2DE (lower TEA) Newcastle 2hr Group 7 1x group of 6 BC1 (higher TEA) Belfast 2hr Male 25-49 Group 8 1x group 4-6 C2DE (low TEA) Cardiff 2hr Group 9 1x group 4-6 BC1 (high TEA) Bristol 2hr Female 50 plus Group 10 1x group 4-6 C2DE (low TEA) London 2hr Group 11 1x group 4-6 BC1 (mix of TEA) Glasgow 2hr Male 50 plus Group 12 1x group 4-6 C2DE (low TEA) Belfast 2hr Group 13 1x group 4-6 BC1 (mix of TEA) Birmingham 2hr Individual depth Interviews Depth 1 Kurdish Muslim migrant Manchester 1hr Depth 2 Polish EU citizen living and working in UK Manchester 1hr Depth 3 Welfare – Family Credit (single mum) Manchester 1hr Depth 4 Welfare – Retired female, pension credit Manchester 1hr Depth 5 Medical Doctor (GP) Rural Cumbria 1hr Depth 6 Adult with sight impairment London 1hr Depth 7 Adult with hearing impairment (used subtitles) London 1hr Depth 8 Different language and communications experience
(Asperger syndrome) Rural Cumbria 1hr
10
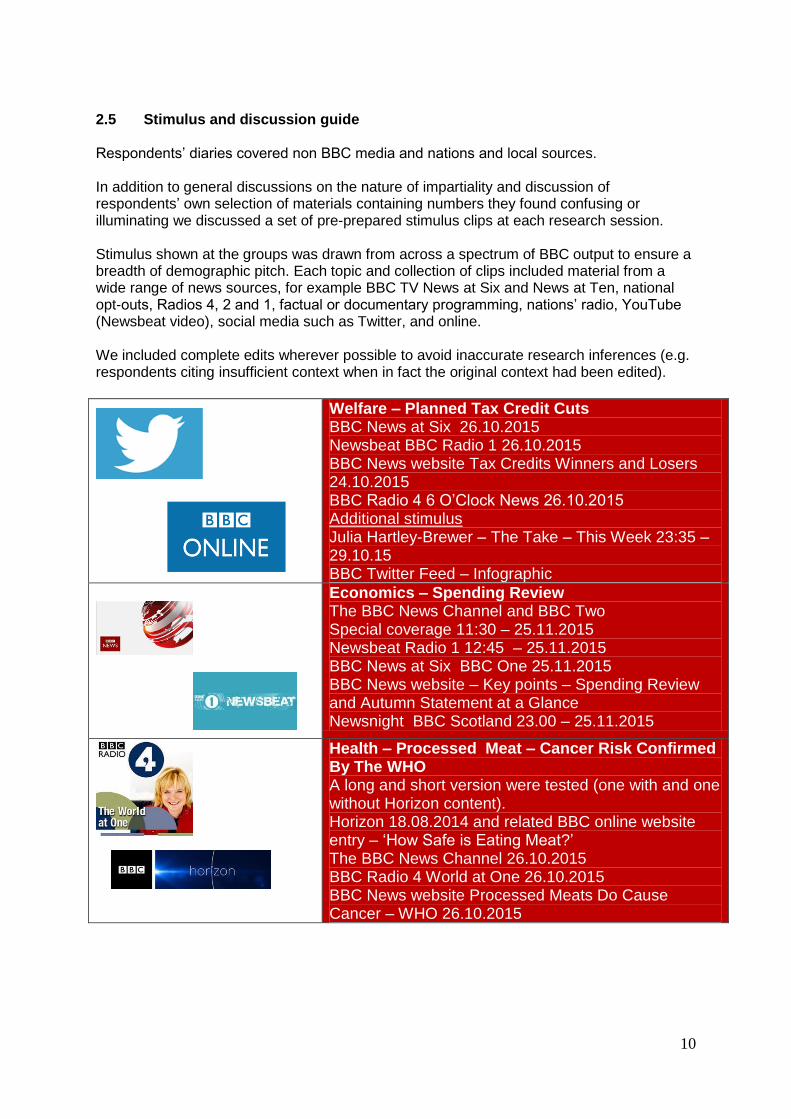
2.5 Stimulus and discussion guide Respondents’ diaries covered non BBC media and nations and local sources. In addition to general discussions on the nature of impartiality and discussion of respondents’ own selection of materials containing numbers they found confusing or illuminating we discussed a set of pre-prepared stimulus clips at each research session. Stimulus shown at the groups was drawn from across a spectrum of BBC output to ensure a breadth of demographic pitch. Each topic and collection of clips included material from a wide range of news sources, for example BBC TV News at Six and News at Ten, national opt-outs, Radios 4, 2 and 1, factual or documentary programming, nations’ radio, YouTube (Newsbeat video), social media such as Twitter, and online. We included complete edits wherever possible to avoid inaccurate research inferences (e.g. respondents citing insufficient context when in fact the original context had been edited).
Welfare – Planned Tax Credit Cuts BBC News at Six 26.10.2015 Newsbeat BBC Radio 1 26.10.2015 BBC News website Tax Credits Winners and Losers 24.10.2015 BBC Radio 4 6 O’Clock News 26.10.2015 Additional stimulus Julia Hartley-Brewer – The Take – This Week 23:35 –29.10.15 BBC Twitter Feed – Infographic
Economics – Spending Review The BBC News Channel and BBC Two Special coverage 11:30 – 25.11.2015 Newsbeat Radio 1 12:45 – 25.11.2015 BBC News at Six BBC One 25.11.2015 BBC News website – Key points – Spending Review and Autumn Statement at a Glance Newsnight BBC Scotland 23.00 – 25.11.2015
Health – Processed Meat – Cancer Risk Confirmed By The WHO A long and short version were tested (one with and one without Horizon content). Horizon 18.08.2014 and related BBC online website entry – ‘How Safe is Eating Meat?’ The BBC News Channel 26.10.2015 BBC Radio 4 World at One 26.10.2015 BBC News website Processed Meats Do Cause Cancer – WHO 26.10.2015
11
Migration – Net Migration Rises To 330,000 BBC News at Six BBC One 27.8.2015 BBC News Website ‘Migrant Crisis – Migration to Europe explained in Graphics’ 4.3.2016 Good Evening Wales 16:00 – 27.8.2015 Newsnight 22:30 – 27.8.2015 Newsbeat: online video on demand, “Why migrants cross the channel”
Flood Defence Expenditure A specific example of journalistic challenge on statistics Radio 4 Today programme 26.12.2015
We suspected some topics (like economic reporting) might be demanding; we know some people have issues with ‘maths’ and, furthermore, some stimulus clips were from channels or programmes not all respondents might consume in ‘real life’. We wanted a realistic response, so we were sensitive to how much each segment could tolerate in terms of the amount of stimulus material exposed. On average we exposed two to three topics per session, allowing respondents to take some lead on the topics they were most interested in. We allowed as much individual time as was needed to explore understanding and response. Topics were rotated. Details of the discussion guides are in the appendix at 4.3 and 4.4.

12
3. Findings
3.1 Differences in ‘numeracy’ within the sample
There were, as we expected, different levels of facility with numbers within the sample. In our sample, comfort with numbers, and particularly claimed ability to process numbers attached to a complex narrative or argument, correlated broadly with socio-economic group, employment and education level5. There were a few respondents who described themselves as almost completely ‘number blind’. In a couple of cases we actually observed this when they watched media. Often these individuals did not even notice the numbers in everyday news reports but just followed a ‘story’ in terms of the ethical or emotional issues in it. They tended to be unable to comment on stories beyond these impressions, which for them overpowered numerical content completely. These people were in a minority in the sample, however. At the other extreme, there were respondents who ‘thought in numbers’. Again we observed that numbers communicated clearly to them and told a clear narrative quickly, in some cases almost at a glance. This sort of respondent could often also do instant calculations (for example, they could tell quickly if a certain number was a tiny percentage of the base). And finally there was a middle ground (probably the majority of the sample) who had reasonable or average facility but could get overwhelmed if they felt they were seeing too much information, too quickly. These ‘middle grounders’ also had a cut-off point in their understanding of numbers. For example they might be perfectly happy with the use of percentages and know that a bigger sample base was a good idea. However, they mostly did not understand more advanced challenges: for example, how to calculate medical risk, difference between types of interest rate, what modelling or a net figure is. In particular they were unlikely to know what pitfalls to avoid and what questions they should routinely ask about statistical ‘tricks’ or the validity of data. The presence of large numbers of figures or statistics within a news or current affairs piece therefore had a polarising effect.
For a few of the audience it actively engaged them with the story.
For others large amounts of numbers, or numbers presented at speed without graphics, lively verbalisation or visual reinforcement disengaged them from the communication.
The ‘averagely’ numerate had several different responses:
If numbers were present at a low level in a news report and were slowly and sparingly presented (for example the number of train cancellations on a line, or how much ticket prices had gone up) people would pick them up if they were carefully chosen to support the narrative and not too numerous, but claimed they would probably not remember them for long.
5 Of course there were exceptions within this.
13
Where there were many numbers, following each other in quick succession in a news report people described themselves as ‘starting to drown’. This meant they began to lose concentration or switch off. Often this correlated to losing the overall thread or logic of what they were being told in the news story.
As a result of asking people to write down what the test news reports had said within the group discussion it became clear that respondents frequently totally misheard numbers when they were reported very quickly or without visual reinforcement, for example, ratios for percentages, ‘teens’ for ‘tens’. This led to confusion.
The nature of TV and radio news is that one story quickly supersedes another, so people told us they could get stuck ‘considering’ a number and then lose the next one and hence the thread of the argument or the next few statistics.
When this happened they claimed they either gave up and just waited for the next news story or switched channel to see what news was being covered there.
“They’ve hit you with one set of figures, and then they hit you with another set of figures. Before you’ve digested that second set of figures they hit you with a third set of figures, to the point where your brain just can’t cope with it.” BC1 Men, 50 plus, Birmingham
Subject matter and demographic pitch of news channel or station had a further influence on engagement with the statistics in the story
Interest in a topic also had a demonstrable effect on ability to engage. For example, people interested in football statistics showed more sophisticated ability to engage with that type of number than with, say, the numbers in a financial news story.
Some reports experienced as too ‘number heavy’ by respondents often also carried other information that they saw as ‘boring’ or assumed a knowledge of contextual concepts they were just not familiar with. An example of a news topic which respondents felt made following the numbers hard was “steel manufacturing in China…as this is the kind of subject I feel men are more interested in than women.” Examples of unfamiliar and unexplained context were the structure of the British civil service or local government, what a ‘think tank’ or ‘economic unit’ is, or “The difference between a bull or a bear market or a stock and a share.”
Respondents noticed a difference in the way numbers were presented on the different BBC radio stations. Radio 4 News was felt to be more ambitious in the complexity of its overall explanations, in the assumptions it made about audience knowledge and the volume of numbers used. BBC Radios 1 and 2 were found to use numbers more sparingly and gave a lot of context.
Some respondents, both older and younger, claimed they already opted for the written word (either in newspapers or online) if following a story with a lot of statistics. The reason given was that the speed with which numbers were typically delivered in other media did not mean they could follow, reprise or analyse them clearly.
The impact of formal education
From what we witnessed in the sample, formal education covers concepts such as sample size or averages not only in maths and science, but in the humanities (geography, history). The relevance of source also appears to be taught in the humanities. Therefore, a majority of respondents still in education and those who had recent formal education (that is, under 45) appeared to have awareness of these issues. The same applied to the most educated in the older age bracket. These measures provided some clear tools or rules of thumb with which to assess statistics and the reporting of numbers and surveys.
14
3.2 Definitions of impartiality and accuracy in news reporting
We explained to respondents that we were looking at the concepts of accuracy and impartiality in the particular context of statistical reporting, whether the way numbers are used ‘supported impartial reporting’ and whether the presence of figures made news reports appear more accurate, as far as they could judge. However, we felt it was important to define what respondents understood by these two concepts of ‘impartiality’ and ‘accuracy’. All respondents were able to give us a clear articulation of what they felt the words meant in a broad sense within news. Impartial meant to them: balanced (both sides of the story at least), ‘more than one side’, ‘no vested interests’, ‘just the information’, ‘not taking sides’, ‘no personal opinion’, ‘right down the middle’, ‘not biased’, ‘questioning’. In tone of voice it meant ‘not loaded’, ‘neutral’, ‘sitting on the fence’ about the interpretation. “Not having an agenda when telling a story. Finding out the facts and sharing them without bias. Covering all angles, aspects and sides to a story to try to tell the whole truth rather than just one version of the truth. Having the conviction, and ability to report on absolutely anything and everything regardless of the content.” Engaged group, Manchester (pre-diary) “Somebody telling you something factual but allowing you to make your own mind up/come to your own conclusions.” Less Engaged, Pension Credit Recipient, Social Group E, Manchester Accurate meant ‘based on the facts’, ‘factual’, ‘true/truthful’, ‘consistently yielding the same results’ (this from a scientist), ‘the correct story’, ‘trustworthy’, ‘reliable’, ‘gives you a good idea about what is happening’, ‘to the point’. In the context of numbers quoted, respondents told us that ‘accuracy’ implied that numbers had been checked or that news channels had waited before they reported the numbers in order to verify them (for example in an earthquake story). Spontaneous indicators of accuracy were felt to be, for example:
Non-rounded numbers (for example, ‘201,014 people’)
Having other related numbers (e.g. the previous year’s figures) to compare with
However, large unexplained error margins (‘between this and this...’) could be interpreted as a guess if they were not explained:
“There is a sentence that states ‘it is said between 5,000 & 10,000.’ That does not give me a clear understanding of the impact as this is a massive variation of figures … I don’t feel it gives a clear or precise amount.”
Report on Syrian refugees, diary entry. C2DE Women 25-49 Newcastle
15
The concept of balance and giving a voice to both sides of an argument is so firmly embedded into people’s definitions of general impartiality in news reporting that it was quite hard to get respondents to comment on what impartiality meant just in the context of statistics. Respondents often wanted to talk more broadly about the other indicators in a report and slipped into evaluating ‘impartiality’ more broadly. However, our question was specifically how the use of statistics supports the overall impartiality of news reporting and we did successfully get answers on this. Audience definitions of impartiality in the use of statistics did not always involve quoting a range of opinion. 3.3 Expectations of the use of statistics and numbers by media platform, occasion
and broadcaster
The main TV news channels – which for this audience were the BBC, ITV, Sky and Channel 4, are expected to be broadly similar in using statistics impartially in their main TV news reports. They are believed to use similar sources6. Most people expected basic standards such as quoting the sources and sample sizes for polls from the mainstream TV news broadcasters, but the diary exercise indicated that sometimes this didn’t happen consistently on all of them. The level of coverage is expected to be tailored to the length of the news report. Short reports are expected to carry less data. Radio is not expected to present and use as many numbers as TV. It is expected to be quite selective and is in fact felt to be quite successful at presenting what numbers it does contain in a managed and digestible manner. In the case of both TV and radio the demographic pitch of the station did make a difference to comprehension. Those listening outside ‘their’ station or channel or to a complex current affairs programme agreed they sometimes got a bit ‘phased’ by the pitch of the data or argument and found it hard to follow. Most newspapers except the Independent7 are perceived by audiences to have some political allegiance. Broadsheet newspapers such as the Times, however, are expected by most to use numbers in an unbiased manner whatever their political allegiance or ownership. Stated expectations of the tabloids were quite low both in terms of the impartial use of data and the amount and source of data used. Only a few people were recruited as readers of magazines like the Economist but people who did read these and what they perceived as less politically affiliated broadsheet papers believed the ability to read at their own pace allowed them to understand stories and statistics fully. Online and digital sources carry different expectations. Some sources are seen as fairly trivial in the type of news they carry or are seen to be brands which the audience don’t have developed expectations of in terms of journalistic standards (Yahoo news was quoted as an example of the latter). A number of people seemed unaware of which provider the news on their mobile phone was coming from (“it just came with the phone, I don’t know what it is”.).
6 Most people still felt this to be the case during their follow-up diary work but there were a few
instances within the study where people claimed to pick up differences between news broadcasters. 7 Now available online only but at the time of the study still in print.
16
Therefore it was difficult for them to comment on impartiality, accuracy or use of statistics by brand. In theory, however, online and print allow more depth, time and scrutiny. The main ‘occasion’ on which statistics and numbers come into their own is perceived to be elections. People expected an exciting presentation of numbers done in a way to deliberately engage a wider audience (the ‘Swingometer’ is an example). Expectations of the BBC (and of some of the broadsheets) are high in terms of how correct the audience expect data to be. Respondents also expect definitive coverage of elections. BBC Online was believed to be a very reliable and factually correct source overall. Students aged 16-18 said they were regularly directed to it as a learning resource. People would expect any fact found on BBC Online to be correct. People found scientific explanation on the BBC website in particular to be very accessible and accurate. Only professional scientists were aware of better specialist sources. We recruited respondents with a typical range of favourability towards the BBC based on the ‘approval ratings’ for this and other broadcasters which are measured and published annually. Therefore, as we might have expected, we had some respondents who came to the groups stating a belief that the BBC as a brand had either a UK government perspective (a view stated by a few young people in Wales and across the age range in Scotland) or an anti-UK government perspective, i.e. specifically an anti-Conservative one (Birmingham BC1 males). These preconceptions of partiality were in almost all cases contradicted by the experience of doing the diary and viewing exercises and looking at BBC content. Even in these cases the audience expectation was still always that BBC figures would be very accurate. Respondents who had an existing point of view about bias were not expecting inaccuracy of information but selectivity of information. That is, they were more likely to expect that the BBC would either inadvertently omit points of view or not be fully aligned with
the emergent feeling in certain population segments in their nation. 3.4 Perceived differences in types of news story, and the role of statistics within each
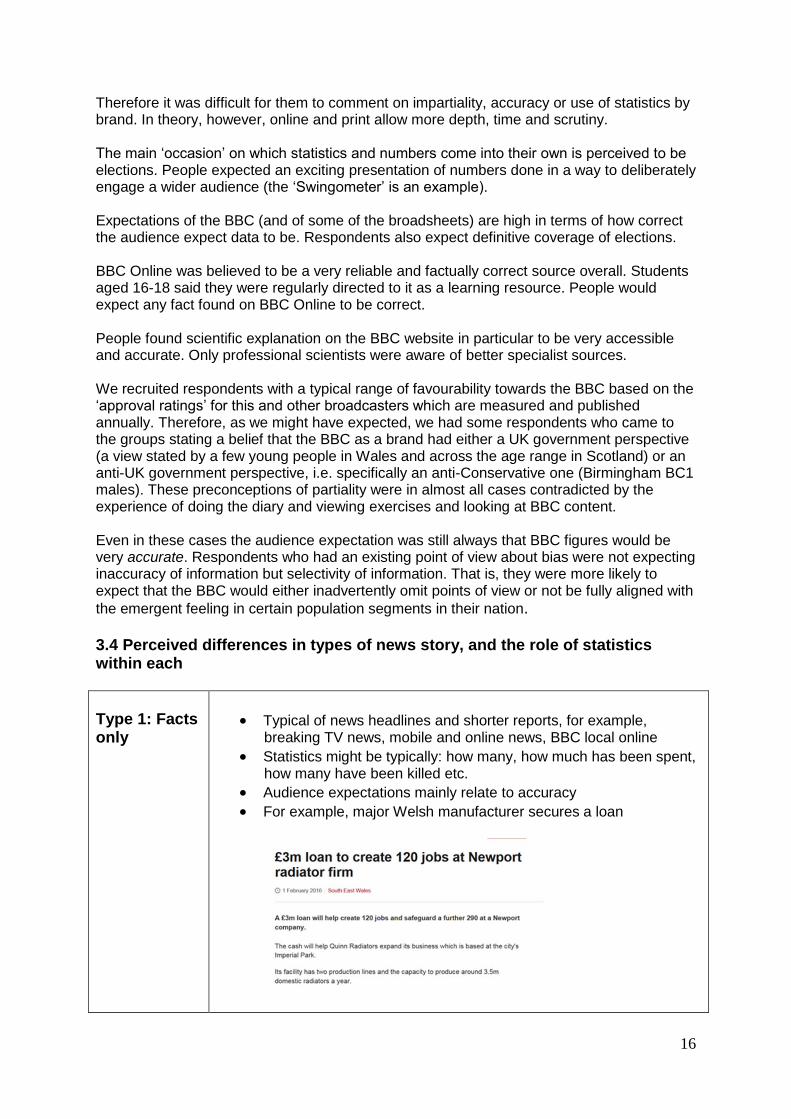
Type 1: Facts only
Typical of news headlines and shorter reports, for example, breaking TV news, mobile and online news, BBC local online
Statistics might be typically: how many, how much has been spent, how many have been killed etc.
Audience expectations mainly relate to accuracy
For example, major Welsh manufacturer secures a loan
17
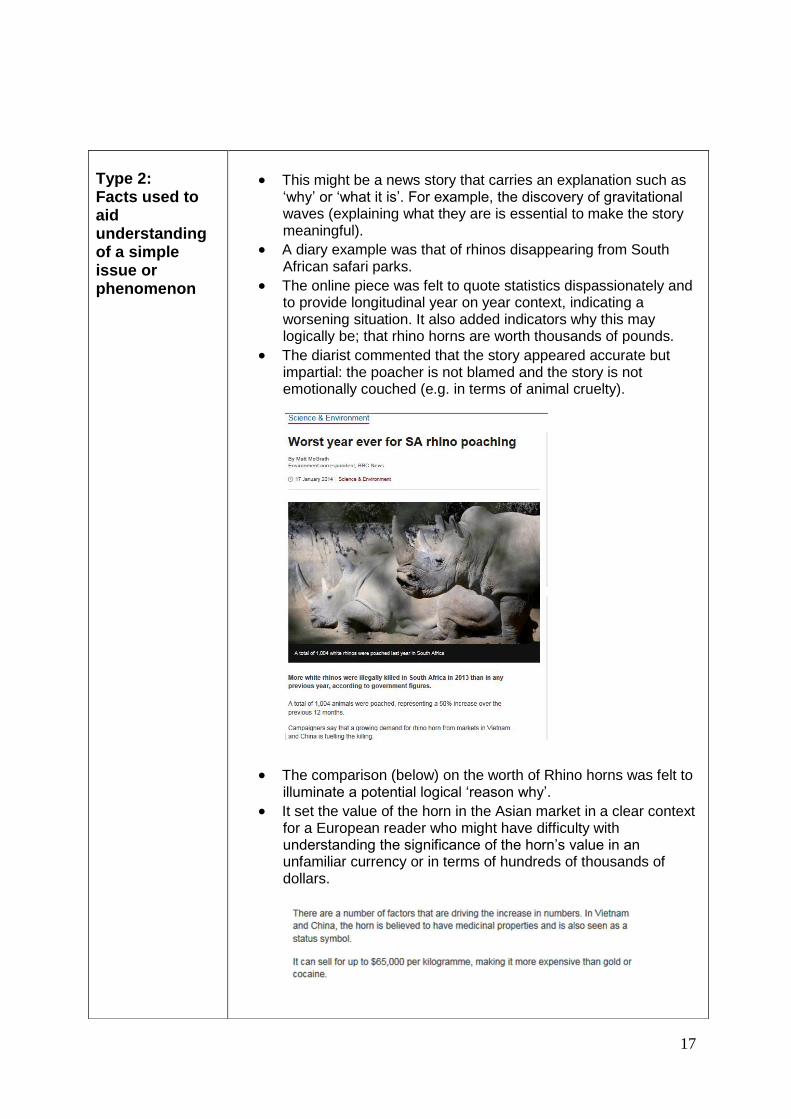
Type 2: Facts used to aid understanding of a simple issue or phenomenon
This might be a news story that carries an explanation such as ‘why’ or ‘what it is’. For example, the discovery of gravitational waves (explaining what they are is essential to make the story meaningful).
A diary example was that of rhinos disappearing from South African safari parks.
The online piece was felt to quote statistics dispassionately and to provide longitudinal year on year context, indicating a worsening situation. It also added indicators why this may logically be; that rhino horns are worth thousands of pounds.
The diarist commented that the story appeared accurate but impartial: the poacher is not blamed and the story is not emotionally couched (e.g. in terms of animal cruelty).
The comparison (below) on the worth of Rhino horns was felt to illuminate a potential logical ‘reason why’.
It set the value of the horn in the Asian market in a clear context for a European reader who might have difficulty with understanding the significance of the horn’s value in an unfamiliar currency or in terms of hundreds of thousands of dollars.
18
Large numbers in particular were felt to have some inherent effects on the audience which respondents felt should be understood and compensated for by journalists and broadcasters. Large numbers killed in a natural disaster fitted clearly into story type 1: straightforward reporting of facts. But when a news story containing a statistic related to a controversial area such as migration or arguably had an influence on a party’s likely political success then some people wanted stories to go further than just the headline announcement and to be amplified.
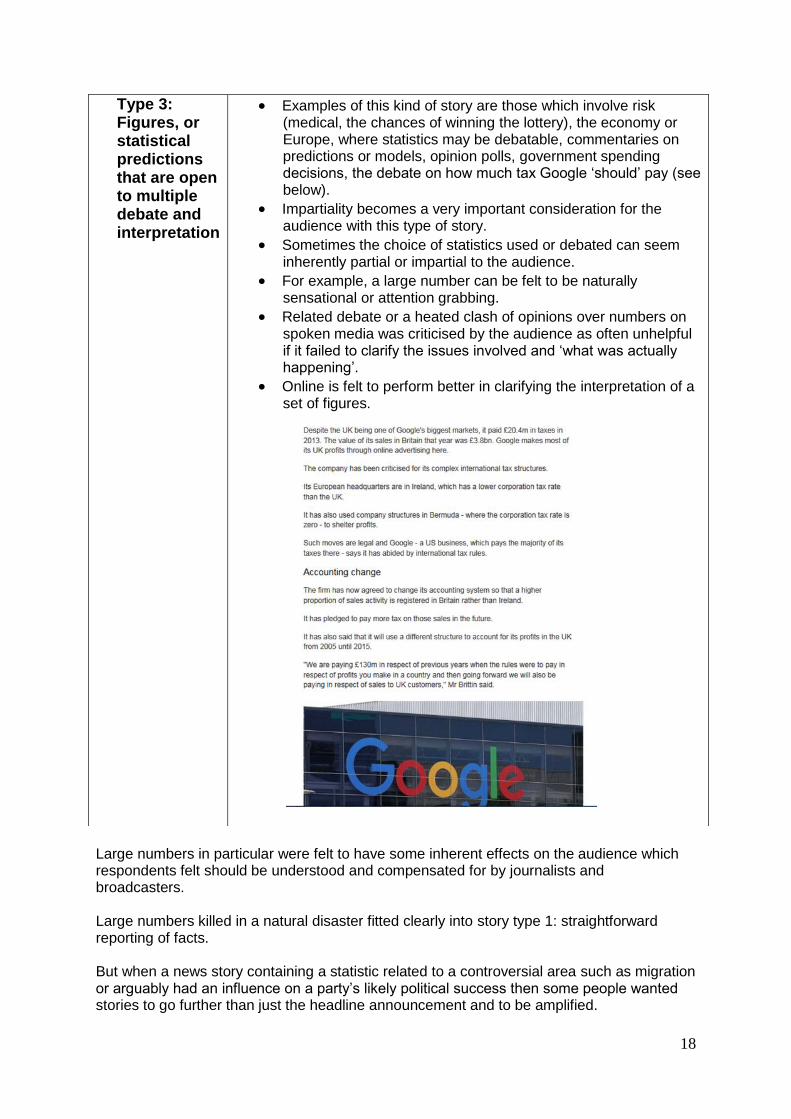
Type 3: Figures, or statistical predictions that are open to multiple debate and interpretation
Examples of this kind of story are those which involve risk (medical, the chances of winning the lottery), the economy or Europe, where statistics may be debatable, commentaries on predictions or models, opinion polls, government spending decisions, the debate on how much tax Google ‘should’ pay (see below).
Impartiality becomes a very important consideration for the audience with this type of story.
Sometimes the choice of statistics used or debated can seem inherently partial or impartial to the audience.
For example, a large number can be felt to be naturally sensational or attention grabbing.
Related debate or a heated clash of opinions over numbers on spoken media was criticised by the audience as often unhelpful if it failed to clarify the issues involved and ‘what was actually happening’.
Online is felt to perform better in clarifying the interpretation of a set of figures.
19
3.5 The ‘tension’ between being guided as to what to think and ‘making up your own
mind’ in stories involving numbers
As explored above, there is a strong belief, particularly among those with the highest terminal age of education, that people should be allowed to ‘make up their own minds’ about issues by being given the correct information to come to a judgement on the news. This is spoken about as ‘having all the information to make up your mind’, or ‘hearing all the points of view’. However, in practice, during this study we had a spectrum of responses to stories of the more complex type above (story type no 3) which involved numbers. Those with the highest terminal education age said they wanted to get multiple points of view and would like to see different sets of statistics challenged. However, media debate and the way debate is handled on complex issues was sometimes not very illuminating for the audience. Audiences value data (or ‘facts’), factual information and the significance of data being explained, but find data being argued about quite difficult and un-enlightening. Multiple opinions expressed as arguments over data on news and current affairs programmes can leave audiences confused or unable to reach conclusions. There was therefore a plea from some for the broadcaster (BBC) to bring some clarity, and considerable frustration from some of the less engaged audience saying that they appreciated it when the BBC used facts, but also helped them more towards what conclusion to draw. “I think sometimes you’re left with more questions than have been actually answered.” “You just want the clear facts. A lot of this to me with all these figures, it just does your brain in. Well it does for me, I just want to listen to somebody and understand it.” C2DE Women, 50 plus, London The issue seemed particularly pronounced when:
The audience are more used to taking facts at face value than they are trained in questioning them.
The audience have limited ability to take an independent judgment on figures because they don’t understand the significance of the statistics being quoted.
The data is not contextualised for them in terms of background or importance.
The debate about it is heated.
The debaters are perceived to have clear biases and ‘agendas’ (e.g. politicians).
The issue is complex or sophisticated.
There is not one set of statistics under common debate but a lot of different facts and figures being ‘spun’.
The audience don’t fully understand what sources the facts and arguments are from. For example, they might not know the sources, the standpoint the sources are ‘coming from’ or their role in the debate. In such a case they might even think the points of view are all coming from the BBC.
20
In these instances the audience could easily become frustrated by multiple points of view, and some said it was the role of the broadcaster to make some sense of the debate or information for them. This desire for clarity is further exacerbated if the subject matter is not particularly interesting to them. The needs of this audience were often met by the journalistic style of BBC Radio 1 or 2, ‘Vanessa’8, or BBC Breakfast TV. The responses to the test clips indicated that they could sometimes be met by having one good interpreter or clearly spoken expert9 rather than several, or by one good journalistic interpreter of the data or arguments, “On the BBC I also like their breakfast programme, I like the presenters on there … and I think they seem to be impartial. The girl on there who does all the finance stuff, she’s very good at explaining it I think.” C2DE Women, London 50 plus The audience in fact gave us two definitions of impartiality. The first related to clearly giving the audience the facts, the second to giving all points of view a fair hearing. Quite often in stories involving numbers the facts which the audience need to understand are the numbers. Sometimes a debate on these, what they mean, or what the interested parties would like them to mean (called ‘spinning numbers’ by the audience), takes place before the audience fully understands the numbers and has had them explained. This can be very confusing and can make the audience tune out. A desire for ‘less heat and more light’ from debaters quoting statistics In short, when the debate includes statistics which are slightly beyond the audience’s ability to interpret, and particularly if these are linked to a heated debate or controversy in which there are clearly biased agendas, the audience appear to be asking not for more opinions on the data but for a more definitive and truly illuminating analysis of the data to help them reach a conclusion. 3.6 Sources
The importance of source as a concept was quite widely understood by the audience, particularly young people and those with tertiary education. People voiced the opinion that sources should be ideally unbiased, for example, not funded by interested parties. The least knowledgeable had a tendency to assume all data came either from the BBC or from ‘government’. BBC data was observed to be clearly sourced online and on news reports but respondents felt they would often have benefited from having the nature and credentials of the source more overtly explained.
8 Vanessa Feltz on Radio 2 or LBC 9 The most valued type of expert was one who could actually resolve a question of fact: for example,
because they understood what the statistics meant or what the risk involved was. The expert should be unpolitical, unbiased and qualified.

21
Many sources of statistics quoted by the BBC during the course of the project were completely unknown to the audience. They knew still less whether they are impartial or partial, government or corporate funded or independent. The OBR, the ONS and the IFS10 were frequently footnoted only as acronyms on the BBC website and on television, and people usually did not know who they were in longhand or, more importantly, what their significance or impartiality status was. A respondent noted in her diary about an article on the BBC website on migration: “There appeared to be a recurring theme of argument from ‘the ONS’: this company was never expanded on or named in full which prevented the readers from comprehending the reliability of the source” C1 Woman, 16-18, Glasgow Again, BBC Radio 1 assumed less about the audience’s knowledge and referred to the IFS ‘longhand’ as an independent body. In BBC TV reports people did not always notice the organisation people were speaking from. For example, in a report on processed meat the farmer at the end of the report was clearly set up as from a source ‘with an interest’ – but few people noticed that a speaker in the middle of the report was from Cancer Research as her affiliation was in a brief ‘super’.11
3.7 Do the audience perceive contributors’ statistics or interpretations are challenged
by the BBC?
The audience were asked to look out for spontaneous challenge on these grounds in their pre and post diaries. Their observation was that they had not found any spontaneous or ‘on the hoof’ challenges by journalists to interviewees on such issues as sample size, sources, error margins, methodology and so on. On the other hand, they did observe many challenges on non-statistical matters. The more engaged audiences found some examples of what they perceived were ‘planned challenges’ by journalists in relation to the interpretation of data:
The BBC stimulus clips featured journalists interpreting government claims and figures in detail and challenging them. For example the BBC used IFS data giving a different interpretation to the Government’s in the Family Credit news report, and a journalist pointed out that the Family Credit ‘reprieve’ would be cancelled out longer term by cuts in Universal Credit. (These examples are from a stimulus clip from News at Six presented by the journalist Andy Verity).
10
The Office for Budget Responsibility, The Office for National Statistics, the Institute for Fiscal
Studies 11
Superimposed title on a TV screen
22
A series of interviews probed the financial claims of the ‘out’ and ‘remain’ campaigns for the European referendum on Radio 4’s Today programme (26th January 2016). A figure of £350bn was agreed on as the amount Britain might retain if it left the EU and each side put an interpretation on what that meant on different days and were interrogated by a Radio 4 journalist.12
When this happened it was perceived that perhaps “the groundwork was done by researchers” but “the journalist being interviewed always had a very good grasp”. We also prompted with an example of planned challenge on flood defence funding from Radio 4’s Today programme involving Sarah Montague and Rory Stewart.13 In this, Sarah Montague challenged Rory Stewart on whether flood defence funding had fallen under the Conservative government. This challenge was not successful because Rory Stewart and Sarah Montague used aggregated spending figures in £millions spread over different ‘blocks’ of three or more years. The spending ‘blocks’ the Minister and Today journalist were comparing covered different time periods, for example 2005-2010 versus 2007-2011, and 2010-2015 versus 2011-2015. As the time blocks didn’t coincide, year by year spending could not be clearly compared and a conclusion could not be reached on air. It was necessary to explain the context and the political affiliations and role of the MP before some people felt able to comment on the challenge and whether it was appropriate and justified. The challenge was seen as well attempted and persistent but the journalist was not felt to have had the right tools to challenge the Minister in the figures she had been equipped with for the interview. The clip referred to the BBC figures having been validated by the ‘Head of the UK Statistics Authority’ but none of the respondents commented that this made the challenge automatically more believable. The challenge was seen as inconclusive or unsuccessful. It was hard to follow the thread of the statistical argument and therefore some found it frustrating and could not understand. However, on the whole the idea of this type of challenge was approved of: “Because that’s what stops the government from making up figures…without that…” “I think she pushed it like three times. That was probably as much as you can politely do.” C1C2, Mixed Sex, 16-18 Bristol 3.8 The use of averages Averages were not an issue people usually commented on. Mostly, only respondents with a specialist education (scientists, economists, mathematicians) were aware that averages could be misleading and how one should be alert to their use: “My statistics professor said to me that on average both me and my dog have three legs, I have always remembered that.” Polish respondent (MSC in Computing)
12
The diarist said this series was good because Today used the same set of data for each interview
and made the interviewees ‘stick to’ interpreting that. He felt this was clear. The interviewer clearly
separated explanations of the data from general political points and ideas on what to do with the
‘extra’ money. 13 Conservative MP for Penrith and The Border and ‘Minister for Floods’
23
The most criticised ‘average’ in the research (dealt with in the case studies below) was “every 50 seconds a foreigner crosses the UK border,” a phrase used in the migration stimulus clips. This average used alongside the word ‘foreigner’, was felt to give an inflammatory impression of constant onslaught. The use both of averages and large numbers in relation to migration or refugees was occasionally criticised for ‘dehumanising’ the story and drawing attention away from human suffering. A few felt that presenting the human and ethical story, not the statistical one was the moral responsibility of the broadcaster but this view was in the minority. Another average commented on was in an ‘engaged’ group (Manchester) in relation to a BBC article on ‘bed-blocking’. This used an average cost per bed. This was felt by one respondent to make no allowance for patient and care differences: “Numbers become meaningless if they are averaged too much - there must be an 80:20 rule here surely?14” But difference in the individual cost of beds was seen by this respondent as potentially interesting rather than germane to the story. ‘Fun’ statistics or surveys sometimes captured the imagination of the audience, and in these cases respondents occasionally wanted more detail and less editing. For example, a study on claimed happiness by age group was reported by BBC online. Only certain points of interest and demographics were picked out and reported, but in this particular case respondents wanted to see a fuller set of data: particularly how ‘happy’ their own age group were, and also more detail on proportions, for example how much happier older people were than younger people: “If they were fifty percent more happy than the next group down then that was something to look into – or if more people in that age group were happy – but it was sporadic, there were lots of facts going on like ‘Indians are happy’ but I would have liked a table or something.” BC1, Man, 18-24, Wales
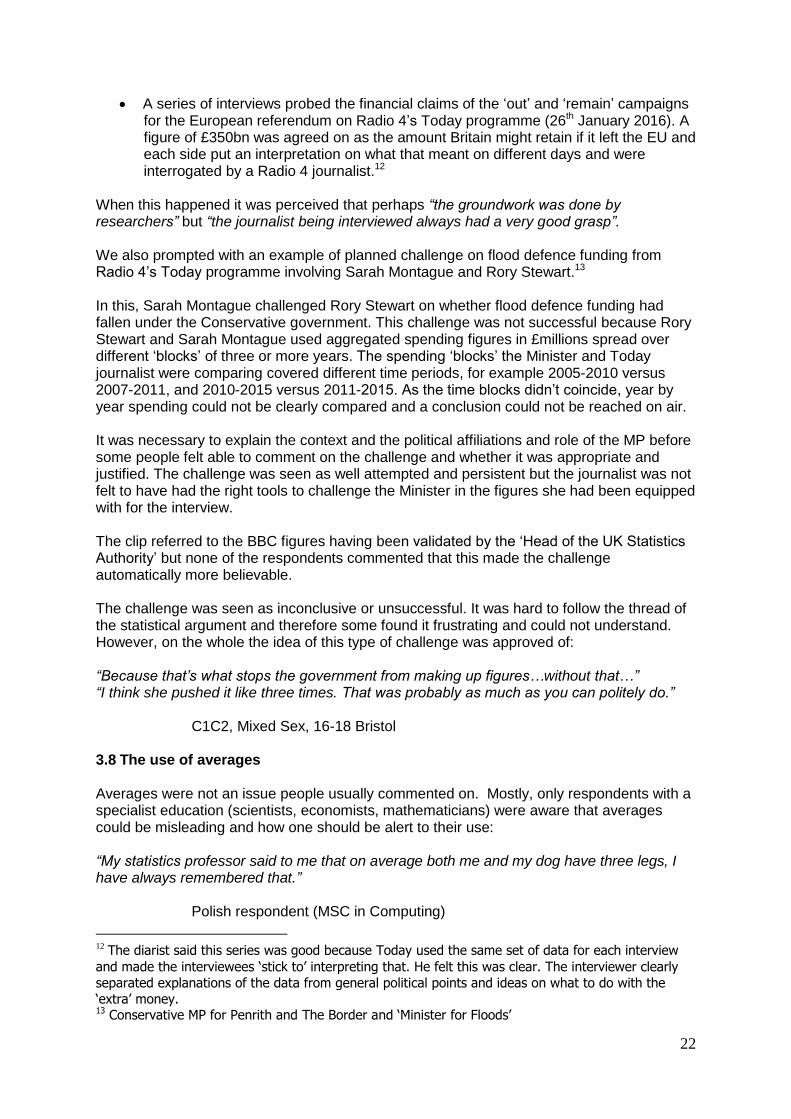
3.9 Issues related to using large numbers for ‘headline impact’ The audience felt that some numbers could undermine an impression of impartial reporting simply because they are so large and potentially ‘shocking’. One respondent called this ‘inherent bias’. The perception of several of the audience was that large figures were used in headlines across all news media to ‘grab attention’. An example of this was the migration report in the case histories with its headline figure of 330,000 net migrants. They saw a need to command attention as a fact of journalistic life but they pointed out that online they often didn’t read very far below headline level, so they felt that any mitigation or context needed to come further up in the report. An example of a strong and, in a respondent’s view, ‘shocking’ statistic in a headline was a report on Movilla High School. This headline (see overleaf) quoted a figure of 440 pupil suspensions in one year.
14
The respondent believed that some beds in the NHS might account for more cost than others and used a comparison with the Pareto Principle to shorthand this idea.
24
The ‘high’ suspension figure in the headline was originally challenged by a reader as potentially damaging to the school. It was believed by that reader that there was no further context given. However, further down in the online article the BBC online piece did, in fact, explain the context which was that this was 12% of all school suspensions in Northern Ireland on a base of 396, but the total included multiple suspensions of individual pupils. The reporting of government grants and funding arose several times in the study. An example was a grant given in Northern Ireland for nursing home care. The grant sounded large but the respondent wanted its meaning probed further both for reasons of impartiality and to add some context to whether this was in fact going to make a big difference to services. Similarly, within the diary period the Government announced they intended to invest almost a billion pounds in mental health in England. A respondent said that giving such a large figure ‘sounded good’. However, the spend could benefit government image and she wanted to be able to estimate the effect on services, so she wanted that figure better contextualised in the news. “I thought the way the numbers were used was just large amounts which did not mean anything, I would have liked a breakdown of the amounts and how these amounts are going to come up to the amount given for physical patients.” C2DE Woman 50 plus, London (Diary) The reporting of the Junior Doctors’ strike was commented on several times. Respondents gave examples of reports from a number of news sources including the BBC, the Daily Mail and Sky News. All the reports received similar criticisms. The typical reporting of the strike on TV and radio was felt to be that 3,000 operations had been cancelled on the day of the strike. Most news organisations were criticised for not setting this figure in context (over 30,000 went ahead). The claimed lack of contextualisation was usually noted alongside remarks that doctors had not been interviewed for a number of news reports so the general impartiality of the reporting was called into doubt.
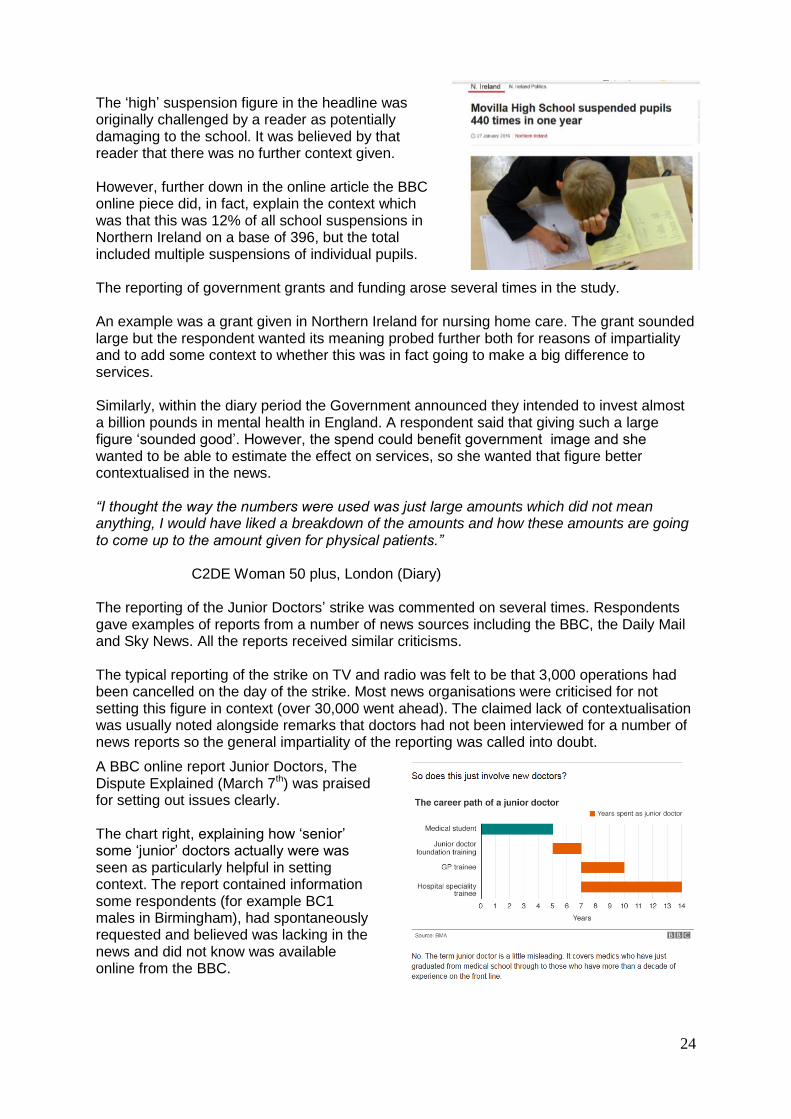
A BBC online report Junior Doctors, The Dispute Explained (March 7th) was praised for setting out issues clearly. The chart right, explaining how ‘senior’ some ‘junior’ doctors actually were was seen as particularly helpful in setting context. The report contained information some respondents (for example BC1 males in Birmingham), had spontaneously requested and believed was lacking in the news and did not know was available online from the BBC.
25
3.10 Case histories The case histories yielded useful findings about the use of graphics and visual representation, the types of statistic the public find it easiest to understand, the use of context and general ground rules on the presentation of statistics on TV, radio and online. 3.10.a Case History – Spending Review
Overview This story was chosen as an example of an ‘Economic’ topic. It was challenging for some respondents as it was not a story all would naturally have engaged with. The world of Whitehall, government departments and so on is unfamiliar and hard to understand. Most do not expect departmental cuts to directly impact upon their lives. Equally, the majority do not know much about ‘modelling’ or the positioning of a body like the OBR.
BBC 2 and BBC News Channel: Special coverage of the Spending Review 25.11.2015 Helpful ‘pie-chart’ graphic with engaging visual touches and clear verbal presentation.
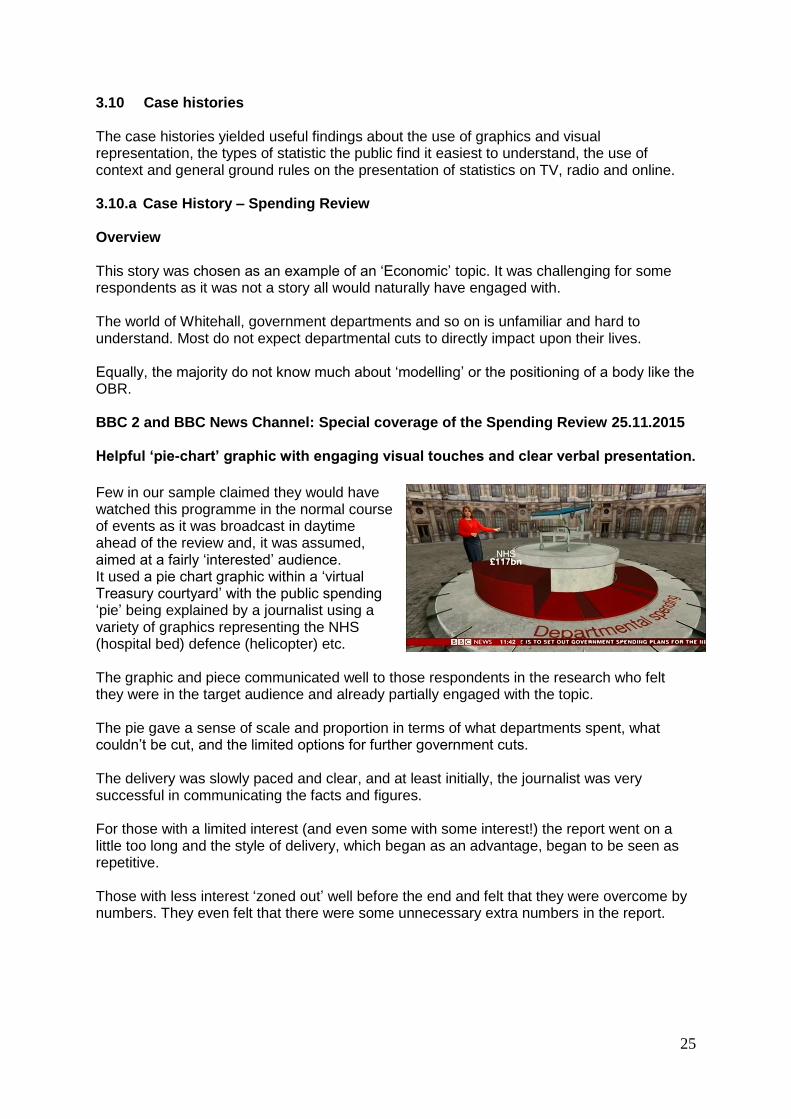
Few in our sample claimed they would have watched this programme in the normal course of events as it was broadcast in daytime ahead of the review and, it was assumed, aimed at a fairly ‘interested’ audience. It used a pie chart graphic within a ‘virtual Treasury courtyard’ with the public spending ‘pie’ being explained by a journalist using a variety of graphics representing the NHS (hospital bed) defence (helicopter) etc. The graphic and piece communicated well to those respondents in the research who felt they were in the target audience and already partially engaged with the topic. The pie gave a sense of scale and proportion in terms of what departments spent, what couldn’t be cut, and the limited options for further government cuts. The delivery was slowly paced and clear, and at least initially, the journalist was very successful in communicating the facts and figures. For those with a limited interest (and even some with some interest!) the report went on a little too long and the style of delivery, which began as an advantage, began to be seen as repetitive. Those with less interest ‘zoned out’ well before the end and felt that they were overcome by numbers. They even felt that there were some unnecessary extra numbers in the report.
26
Newsbeat 25.11.2015, 12:45 The piece had a lively delivery, plenty of relevant contextualisation, sparing use of figures and attempted to draw out personal consequences to listeners.
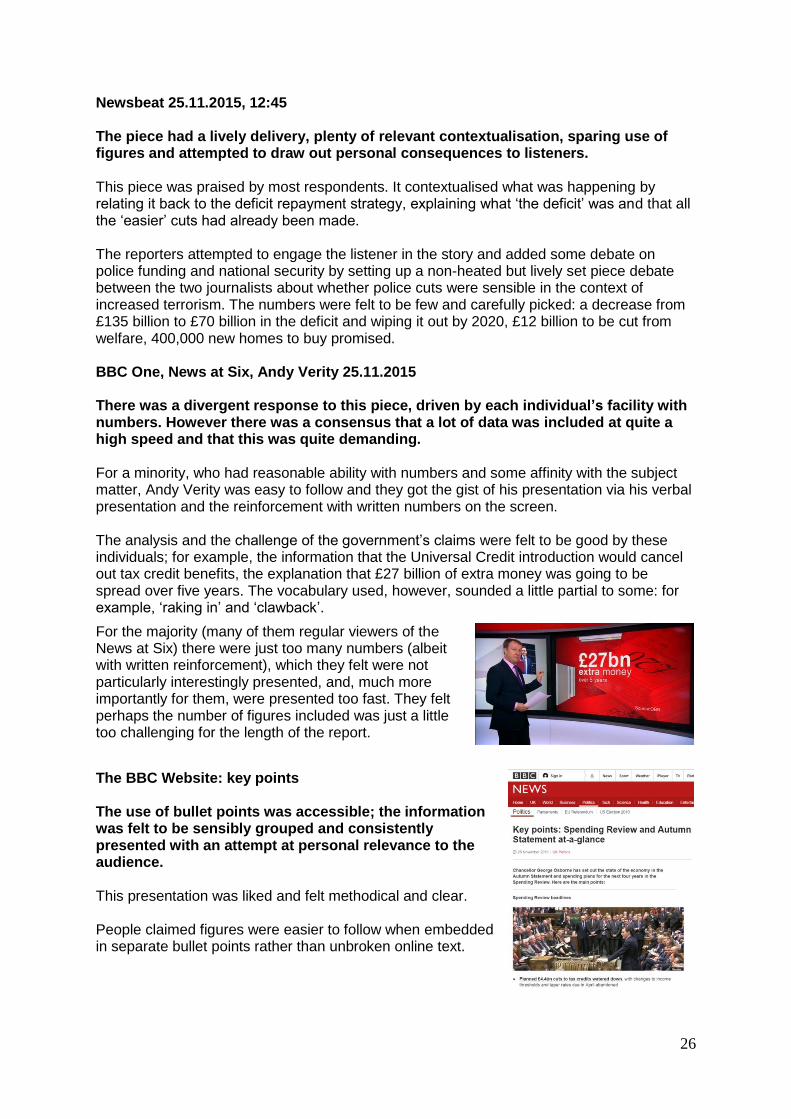
This piece was praised by most respondents. It contextualised what was happening by relating it back to the deficit repayment strategy, explaining what ‘the deficit’ was and that all the ‘easier’ cuts had already been made. The reporters attempted to engage the listener in the story and added some debate on police funding and national security by setting up a non-heated but lively set piece debate between the two journalists about whether police cuts were sensible in the context of increased terrorism. The numbers were felt to be few and carefully picked: a decrease from £135 billion to £70 billion in the deficit and wiping it out by 2020, £12 billion to be cut from welfare, 400,000 new homes to buy promised. BBC One, News at Six, Andy Verity 25.11.2015 There was a divergent response to this piece, driven by each individual’s facility with numbers. However there was a consensus that a lot of data was included at quite a high speed and that this was quite demanding. For a minority, who had reasonable ability with numbers and some affinity with the subject matter, Andy Verity was easy to follow and they got the gist of his presentation via his verbal presentation and the reinforcement with written numbers on the screen. The analysis and the challenge of the government’s claims were felt to be good by these individuals; for example, the information that the Universal Credit introduction would cancel out tax credit benefits, the explanation that £27 billion of extra money was going to be spread over five years. The vocabulary used, however, sounded a little partial to some: for example, ‘raking in’ and ‘clawback’.
For the majority (many of them regular viewers of the News at Six) there were just too many numbers (albeit with written reinforcement), which they felt were not particularly interestingly presented, and, much more importantly for them, were presented too fast. They felt perhaps the number of figures included was just a little too challenging for the length of the report.
The BBC Website: key points The use of bullet points was accessible; the information was felt to be sensibly grouped and consistently presented with an attempt at personal relevance to the audience. This presentation was liked and felt methodical and clear. People claimed figures were easier to follow when embedded in separate bullet points rather than unbroken online text.
27
The way the spending figures were presented, in billions and percentages was consistent throughout, which people felt made it easier to follow. The report showed exactly where the cuts and spending would fall and whether the reader might be personally affected. Newsnight, BBC Scotland 25.11.2015 Relaxed and engaging pace, a good use of colloquial contextualisation and helpful additional presentation of complex graphics. The Newsnight report contextualised this story in both a ‘highbrow’ and a common sense way for the audience, successfully speaking to a spectrum of respondents. It did this by giving both a longhand and shorthand explanation of the relationship of government with the independent OBR, the nature of modelling and the fact that modelling can throw up unexpected results if the criteria it uses change. A common sense colloquialism: that the money had been “found down the back of the sofa” communicated an unexpected but real windfall to government for some who didn’t find the accompanying longhand explanation of sources and processes as accessible.
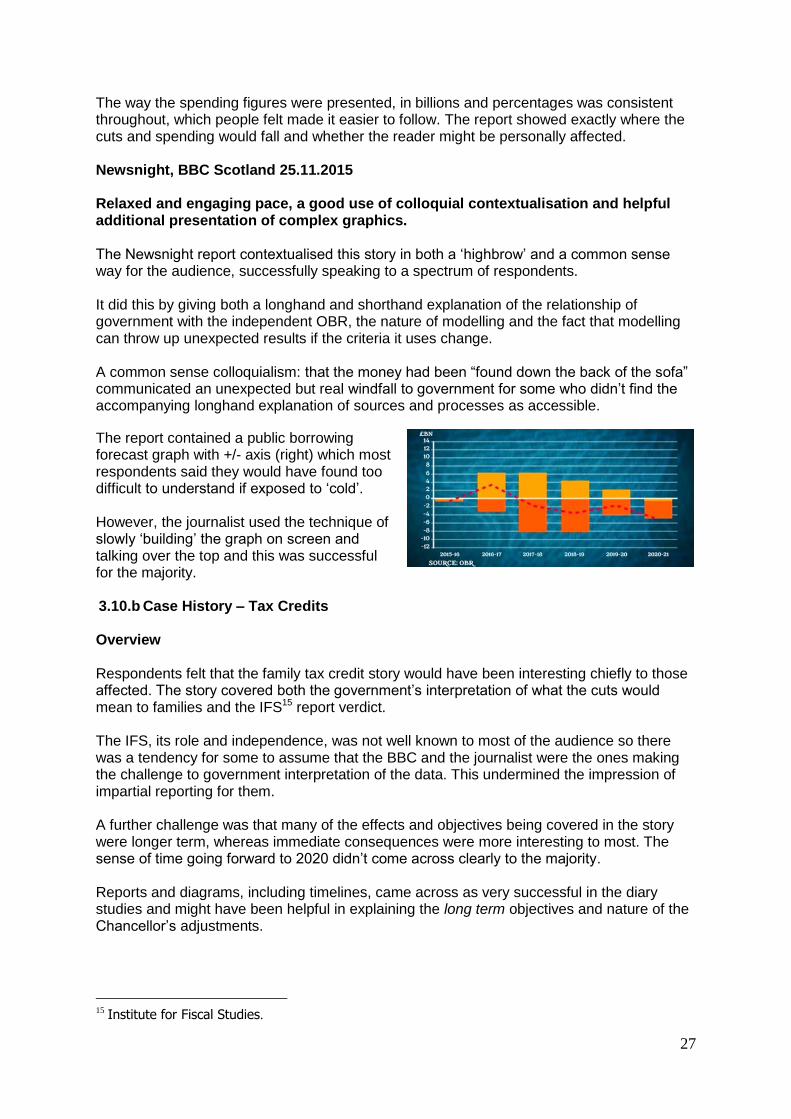
The report contained a public borrowing forecast graph with +/- axis (right) which most respondents said they would have found too difficult to understand if exposed to ‘cold’. However, the journalist used the technique of slowly ‘building’ the graph on screen and talking over the top and this was successful for the majority. 3.10.b Case History – Tax Credits Overview Respondents felt that the family tax credit story would have been interesting chiefly to those affected. The story covered both the government’s interpretation of what the cuts would mean to families and the IFS15 report verdict. The IFS, its role and independence, was not well known to most of the audience so there was a tendency for some to assume that the BBC and the journalist were the ones making the challenge to government interpretation of the data. This undermined the impression of impartial reporting for them. A further challenge was that many of the effects and objectives being covered in the story were longer term, whereas immediate consequences were more interesting to most. The sense of time going forward to 2020 didn’t come across clearly to the majority. Reports and diagrams, including timelines, came across as very successful in the diary studies and might have been helpful in explaining the long term objectives and nature of the Chancellor’s adjustments.
15
Institute for Fiscal Studies.
28
BBC One, News at Six 26.10.2015 Misunderstanding of sources, good graphics but a problem with visualising billions and with the timeline of the reporting.
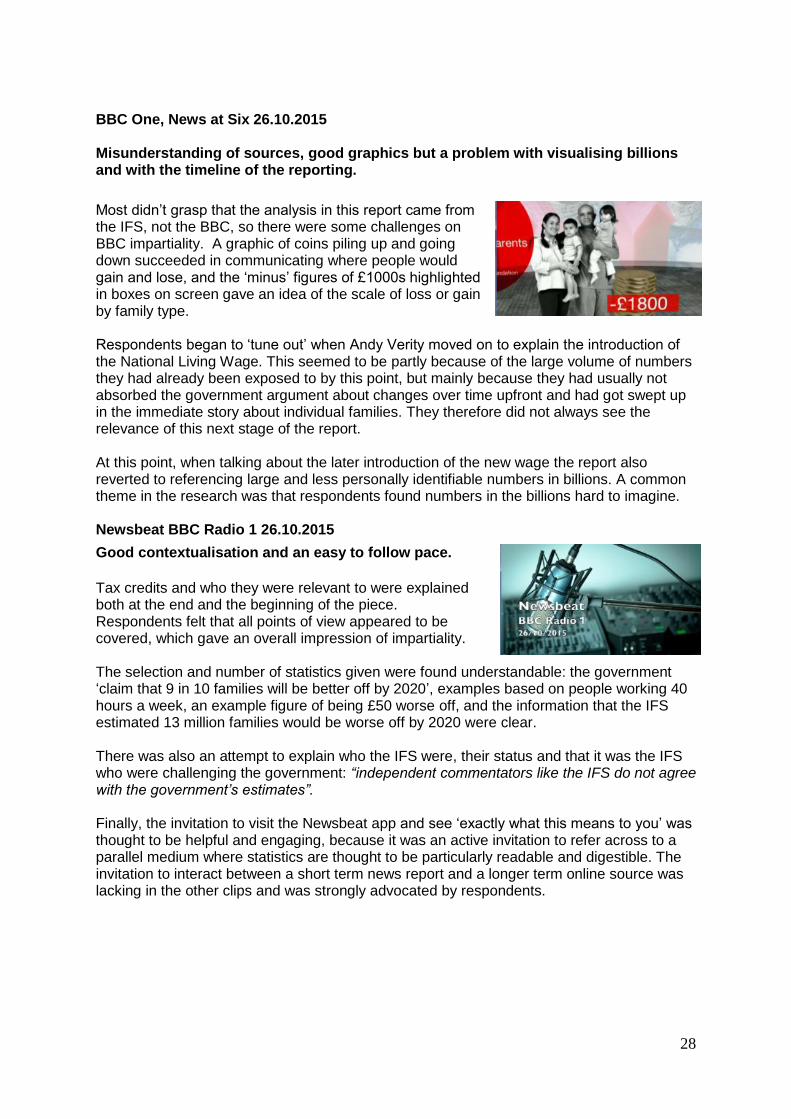
Most didn’t grasp that the analysis in this report came from the IFS, not the BBC, so there were some challenges on BBC impartiality. A graphic of coins piling up and going down succeeded in communicating where people would gain and lose, and the ‘minus’ figures of £1000s highlighted in boxes on screen gave an idea of the scale of loss or gain by family type. Respondents began to ‘tune out’ when Andy Verity moved on to explain the introduction of the National Living Wage. This seemed to be partly because of the large volume of numbers they had already been exposed to by this point, but mainly because they had usually not absorbed the government argument about changes over time upfront and had got swept up in the immediate story about individual families. They therefore did not always see the relevance of this next stage of the report. At this point, when talking about the later introduction of the new wage the report also reverted to referencing large and less personally identifiable numbers in billions. A common theme in the research was that respondents found numbers in the billions hard to imagine. Newsbeat BBC Radio 1 26.10.2015
Good contextualisation and an easy to follow pace.
Tax credits and who they were relevant to were explained both at the end and the beginning of the piece. Respondents felt that all points of view appeared to be covered, which gave an overall impression of impartiality. The selection and number of statistics given were found understandable: the government ‘claim that 9 in 10 families will be better off by 2020’, examples based on people working 40 hours a week, an example figure of being £50 worse off, and the information that the IFS estimated 13 million families would be worse off by 2020 were clear. There was also an attempt to explain who the IFS were, their status and that it was the IFS who were challenging the government: “independent commentators like the IFS do not agree with the government’s estimates”. Finally, the invitation to visit the Newsbeat app and see ‘exactly what this means to you’ was thought to be helpful and engaging, because it was an active invitation to refer across to a parallel medium where statistics are thought to be particularly readable and digestible. The invitation to interact between a short term news report and a longer term online source was lacking in the other clips and was strongly advocated by respondents.

29
BBC News website Tax Credits Winners and Losers 24.10.2015
The use of graphics here was not felt ideal. A tailored infographic (right) was attractive but not particularly successful at explaining the timeline of the report. A second graph (below right), which potentially said something of importance to the respondents was too difficult for most of the audience to understand The online report used both infographics and graphs. The specially tailored infographic for the story was also tweeted via the BBC Twitter feed. It was thought to be eye-catching, the ‘modern’ cartoon style was liked and had the additional benefit that it was felt to avoid visually stereotyping ‘poorer’ families. However, despite the fact that the infographic contained several measures - hourly wages, hours a week worked - it communicated mainly one piece of information to respondents – the increase or decrease in income for three example population groups. As with the TV news report, the fact that the story (and diagram) were based on an income projection up to 2020 was often missed.
A second graph was included from the IFS which was not felt to have been sufficiently re-tailored to the audience. This graph aimed to make what most felt was a potentially important point (that the poorest would be worse off) but this did not communicate clearly. The titles: ‘pre announced changes’, ‘change in annual net income’, ‘budget measures’ etc., were not understood and the graph format wasn’t a familiar one for most. Some respondents who knew who the IFS were felt this graph had been produced for the more specialist audience consuming their data and was not so suitable for the more general reader of the BBC website. BBC Radio 4 6 O’Clock News 26.10.2015 Again, in this radio piece choice of numbers was felt to be accessible and the incidence of numbers well-spaced, for example, £6 billion a year by 2020, the minimum wage to rise to £9 an hour.
30
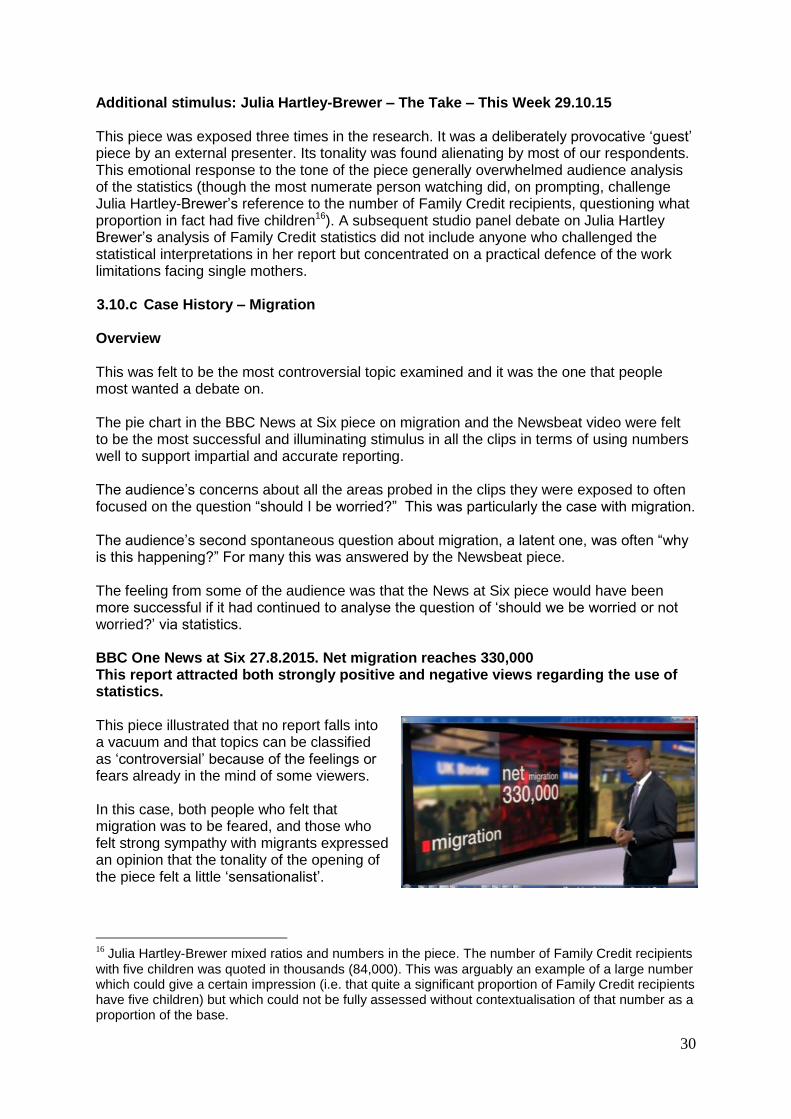
Additional stimulus: Julia Hartley-Brewer – The Take – This Week 29.10.15 This piece was exposed three times in the research. It was a deliberately provocative ‘guest’ piece by an external presenter. Its tonality was found alienating by most of our respondents. This emotional response to the tone of the piece generally overwhelmed audience analysis of the statistics (though the most numerate person watching did, on prompting, challenge Julia Hartley-Brewer’s reference to the number of Family Credit recipients, questioning what proportion in fact had five children16). A subsequent studio panel debate on Julia Hartley Brewer’s analysis of Family Credit statistics did not include anyone who challenged the statistical interpretations in her report but concentrated on a practical defence of the work limitations facing single mothers. 3.10.c Case History – Migration Overview This was felt to be the most controversial topic examined and it was the one that people most wanted a debate on. The pie chart in the BBC News at Six piece on migration and the Newsbeat video were felt to be the most successful and illuminating stimulus in all the clips in terms of using numbers well to support impartial and accurate reporting. The audience’s concerns about all the areas probed in the clips they were exposed to often focused on the question “should I be worried?” This was particularly the case with migration. The audience’s second spontaneous question about migration, a latent one, was often “why is this happening?” For many this was answered by the Newsbeat piece. The feeling from some of the audience was that the News at Six piece would have been more successful if it had continued to analyse the question of ‘should we be worried or not worried?’ via statistics. BBC One News at Six 27.8.2015. Net migration reaches 330,000 This report attracted both strongly positive and negative views regarding the use of statistics.
This piece illustrated that no report falls into a vacuum and that topics can be classified as ‘controversial’ because of the feelings or fears already in the mind of some viewers. In this case, both people who felt that migration was to be feared, and those who felt strong sympathy with migrants expressed an opinion that the tonality of the opening of the piece felt a little ‘sensationalist’.
16
Julia Hartley-Brewer mixed ratios and numbers in the piece. The number of Family Credit recipients
with five children was quoted in thousands (84,000). This was arguably an example of a large number which could give a certain impression (i.e. that quite a significant proportion of Family Credit recipients have five children) but which could not be fully assessed without contextualisation of that number as a proportion of the base.
31
The opening part of the report involved the reporter explaining how many migrants were entering the UK. This was done at an airport against a background of aircraft taking off and landing. As a consequence of the noise the reporter (Mark Easton, the Home Editor) had to project his voice. A few felt this resulted in an ‘urgent’ tone: “shouting, felt like he was annoyed.” The report contained the ‘average’ statistic that “every 50 seconds a foreigner crosses the UK border to settle in Britain, that is the fastest rate in history.” Much of the audience response appeared to be attributable to some nervousness or disquiet about migration already in the heads of the viewers. Large numbers of respondents were already either apprehensive about migration personally or sensitive about potential social unrest in regard to it: “I thought it was kind of a bit sensationalist. I mean one of the things they said was ‘every 50 seconds a foreigner crosses the border’ you know imagine one sitting there going ‘ooh’…so yes, was that 8 million that were born abroad in the UK? …That, to me feels like, you know, okay that’s the face of our country changing, because our culture is going to change. That’s the sort of thing that is going through my mind.” “Obviously (you think that because of) what has been going on in the news and that for years, but obviously, yes…because you know that already in your head…you already have information there that you are thinking about.”
C2DE Women, 50 plus, London
“I live in a part of Glasgow that has a lot of social problems and I am aware that there are nasty people who will capitalise on anything that they see about migrants. And it is worse if the statistics come from a really respected source like the BBC or the Guardian because then they can go round saying … It isn’t me, it’s true, it’s from The Guardian!” BC1 Women, 50 plus, Glasgow The average of “every 50 seconds” attracted the most criticism in the report because it was felt to give the impression of an unremitting onslaught and was therefore alarming. The depersonalisation of migrants as ‘foreigners’ (which was seen as weighted language by some) did not necessarily encompass the full range of potential visitors and the harms or benefits they might bring: “There could be a few millionaires in there.” C2DE Men, Belfast, 50 plus An increase in foreign-born inhabitants of Hull of 195%, a figure introducing the second half of the report, was felt to continue a provocative tone by some. Others saw the statistic as just a bit unclear “why not just say nearly doubled?” A second criticism was that the report on Hull which formed the second part of the package did not lead anywhere conclusive and was mainly opinion: “too many people talking and the general public very negative.”
32
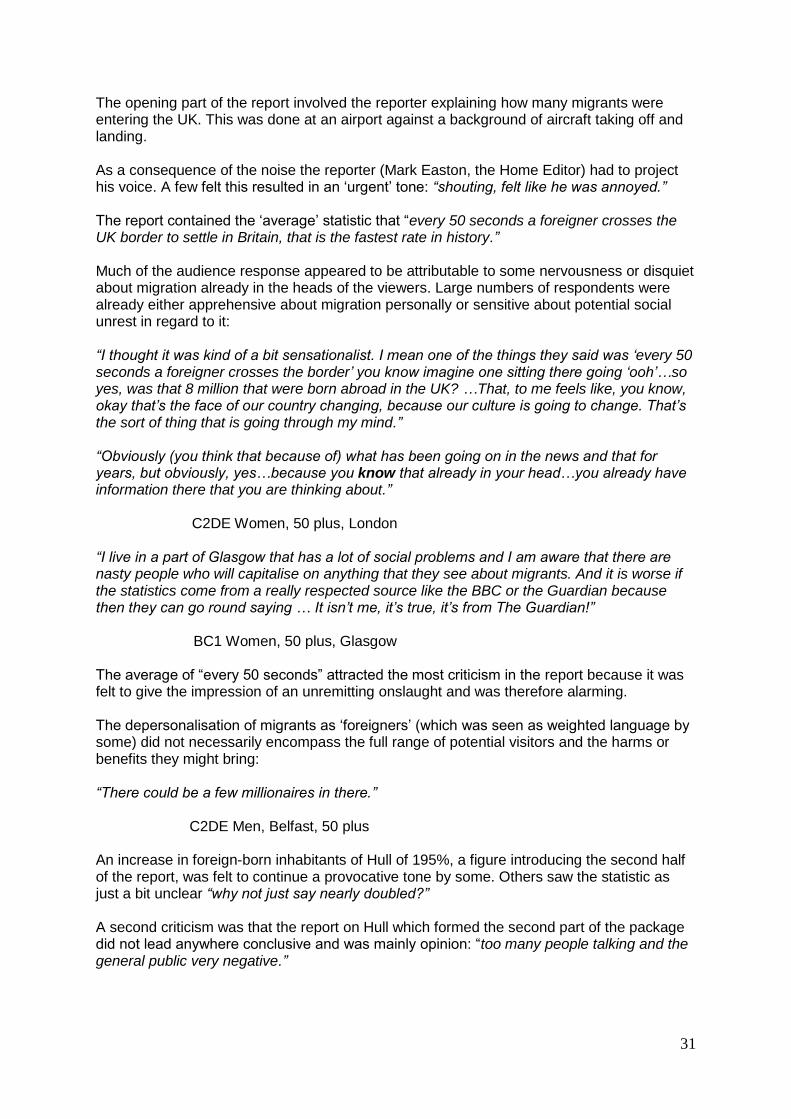
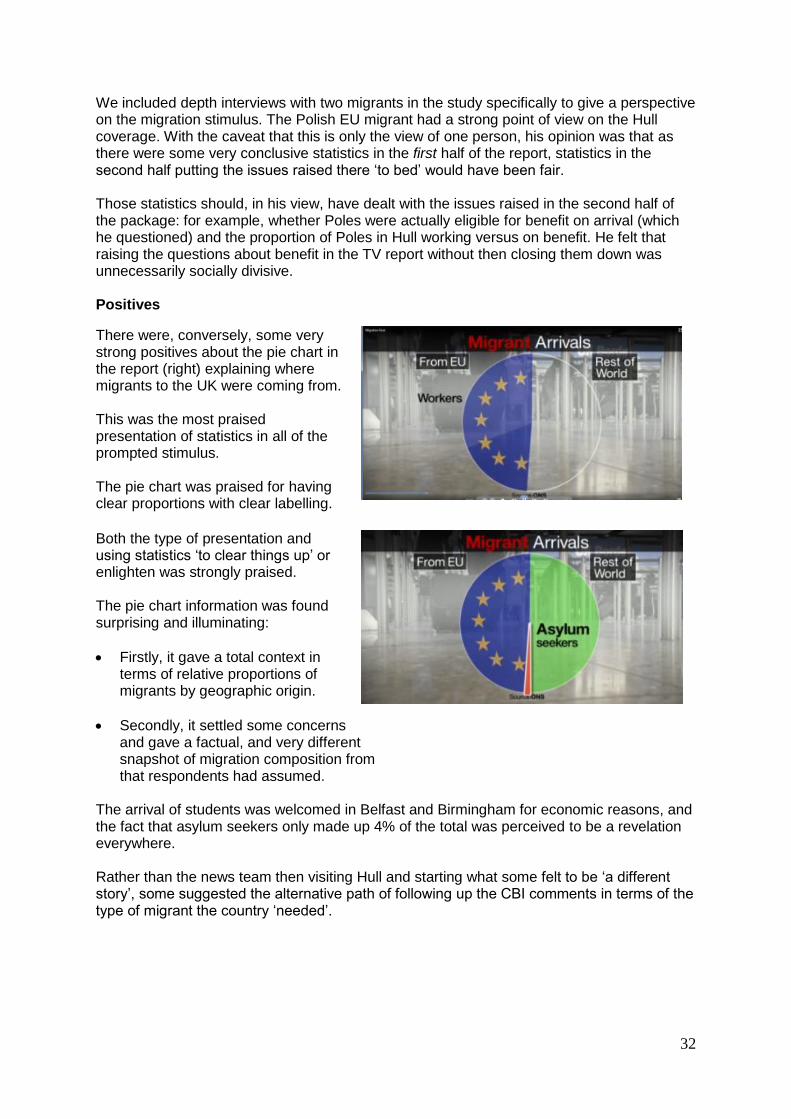
We included depth interviews with two migrants in the study specifically to give a perspective on the migration stimulus. The Polish EU migrant had a strong point of view on the Hull coverage. With the caveat that this is only the view of one person, his opinion was that as there were some very conclusive statistics in the first half of the report, statistics in the second half putting the issues raised there ‘to bed’ would have been fair. Those statistics should, in his view, have dealt with the issues raised in the second half of the package: for example, whether Poles were actually eligible for benefit on arrival (which he questioned) and the proportion of Poles in Hull working versus on benefit. He felt that raising the questions about benefit in the TV report without then closing them down was unnecessarily socially divisive. Positives
There were, conversely, some very strong positives about the pie chart in the report (right) explaining where migrants to the UK were coming from. This was the most praised presentation of statistics in all of the prompted stimulus. The pie chart was praised for having clear proportions with clear labelling.
Both the type of presentation and using statistics ‘to clear things up’ or enlighten was strongly praised. The pie chart information was found surprising and illuminating:
Firstly, it gave a total context in terms of relative proportions of migrants by geographic origin.
Secondly, it settled some concerns and gave a factual, and very different snapshot of migration composition from that respondents had assumed.
The arrival of students was welcomed in Belfast and Birmingham for economic reasons, and the fact that asylum seekers only made up 4% of the total was perceived to be a revelation everywhere. Rather than the news team then visiting Hull and starting what some felt to be ‘a different story’, some suggested the alternative path of following up the CBI comments in terms of the type of migrant the country ‘needed’.
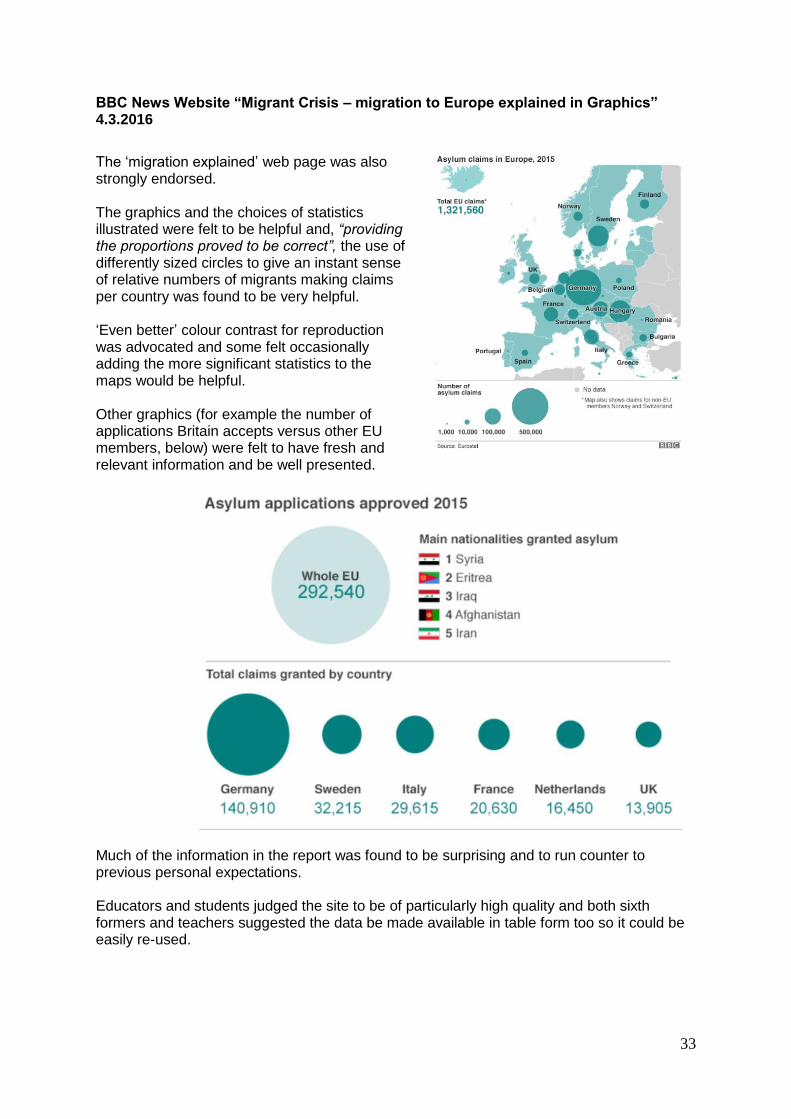
33
BBC News Website “Migrant Crisis – migration to Europe explained in Graphics” 4.3.2016
The ‘migration explained’ web page was also strongly endorsed. The graphics and the choices of statistics illustrated were felt to be helpful and, “providing the proportions proved to be correct”, the use of differently sized circles to give an instant sense of relative numbers of migrants making claims per country was found to be very helpful. ‘Even better’ colour contrast for reproduction was advocated and some felt occasionally adding the more significant statistics to the maps would be helpful. Other graphics (for example the number of applications Britain accepts versus other EU members, below) were felt to have fresh and relevant information and be well presented.
Much of the information in the report was found to be surprising and to run counter to previous personal expectations. Educators and students judged the site to be of particularly high quality and both sixth formers and teachers suggested the data be made available in table form too so it could be easily re-used.
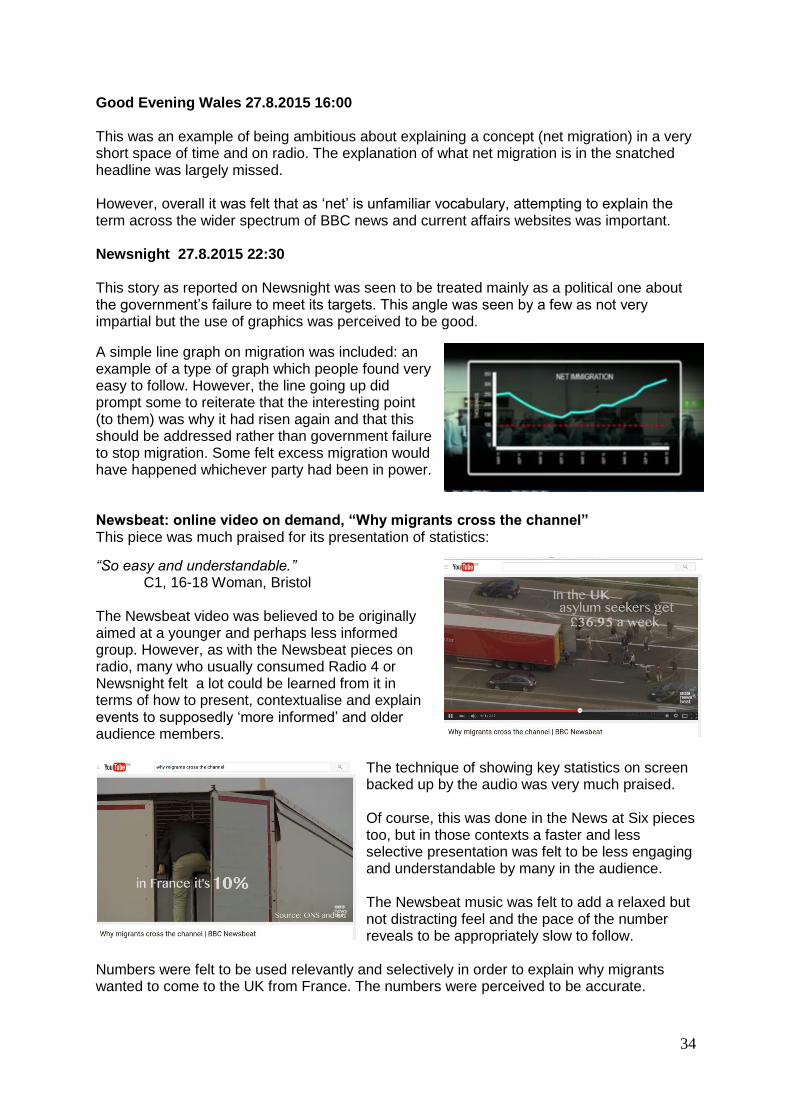
34
Good Evening Wales 27.8.2015 16:00
This was an example of being ambitious about explaining a concept (net migration) in a very short space of time and on radio. The explanation of what net migration is in the snatched headline was largely missed. However, overall it was felt that as ‘net’ is unfamiliar vocabulary, attempting to explain the term across the wider spectrum of BBC news and current affairs websites was important. Newsnight 27.8.2015 22:30 This story as reported on Newsnight was seen to be treated mainly as a political one about the government’s failure to meet its targets. This angle was seen by a few as not very impartial but the use of graphics was perceived to be good.
A simple line graph on migration was included: an example of a type of graph which people found very easy to follow. However, the line going up did prompt some to reiterate that the interesting point (to them) was why it had risen again and that this should be addressed rather than government failure to stop migration. Some felt excess migration would have happened whichever party had been in power. Newsbeat: online video on demand, “Why migrants cross the channel” This piece was much praised for its presentation of statistics:
“So easy and understandable.” C1, 16-18 Woman, Bristol The Newsbeat video was believed to be originally aimed at a younger and perhaps less informed group. However, as with the Newsbeat pieces on radio, many who usually consumed Radio 4 or Newsnight felt a lot could be learned from it in terms of how to present, contextualise and explain events to supposedly ‘more informed’ and older audience members.
The technique of showing key statistics on screen backed up by the audio was very much praised. Of course, this was done in the News at Six pieces too, but in those contexts a faster and less selective presentation was felt to be less engaging and understandable by many in the audience. The Newsbeat music was felt to add a relaxed but not distracting feel and the pace of the number reveals to be appropriately slow to follow.
Numbers were felt to be used relevantly and selectively in order to explain why migrants wanted to come to the UK from France. The numbers were perceived to be accurate.
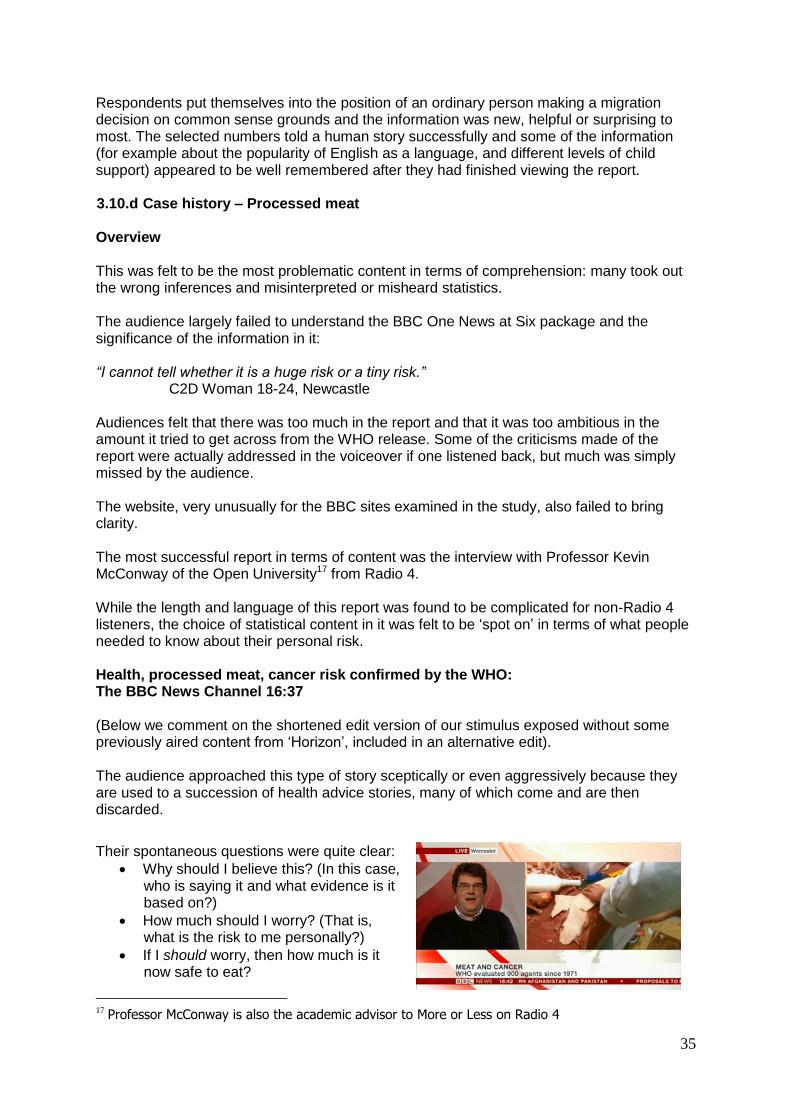
35
Respondents put themselves into the position of an ordinary person making a migration decision on common sense grounds and the information was new, helpful or surprising to most. The selected numbers told a human story successfully and some of the information (for example about the popularity of English as a language, and different levels of child support) appeared to be well remembered after they had finished viewing the report. 3.10.d Case history – Processed meat Overview This was felt to be the most problematic content in terms of comprehension: many took out the wrong inferences and misinterpreted or misheard statistics. The audience largely failed to understand the BBC One News at Six package and the significance of the information in it: “I cannot tell whether it is a huge risk or a tiny risk.” C2D Woman 18-24, Newcastle Audiences felt that there was too much in the report and that it was too ambitious in the amount it tried to get across from the WHO release. Some of the criticisms made of the report were actually addressed in the voiceover if one listened back, but much was simply missed by the audience. The website, very unusually for the BBC sites examined in the study, also failed to bring clarity. The most successful report in terms of content was the interview with Professor Kevin McConway of the Open University17 from Radio 4. While the length and language of this report was found to be complicated for non-Radio 4 listeners, the choice of statistical content in it was felt to be ‘spot on’ in terms of what people needed to know about their personal risk.
Health, processed meat, cancer risk confirmed by the WHO: The BBC News Channel 16:37 (Below we comment on the shortened edit version of our stimulus exposed without some previously aired content from ‘Horizon’, included in an alternative edit). The audience approached this type of story sceptically or even aggressively because they are used to a succession of health advice stories, many of which come and are then discarded.
Their spontaneous questions were quite clear:
Why should I believe this? (In this case, who is saying it and what evidence is it based on?)
How much should I worry? (That is, what is the risk to me personally?)
If I should worry, then how much is it now safe to eat?
17
Professor McConway is also the academic advisor to More or Less on Radio 4
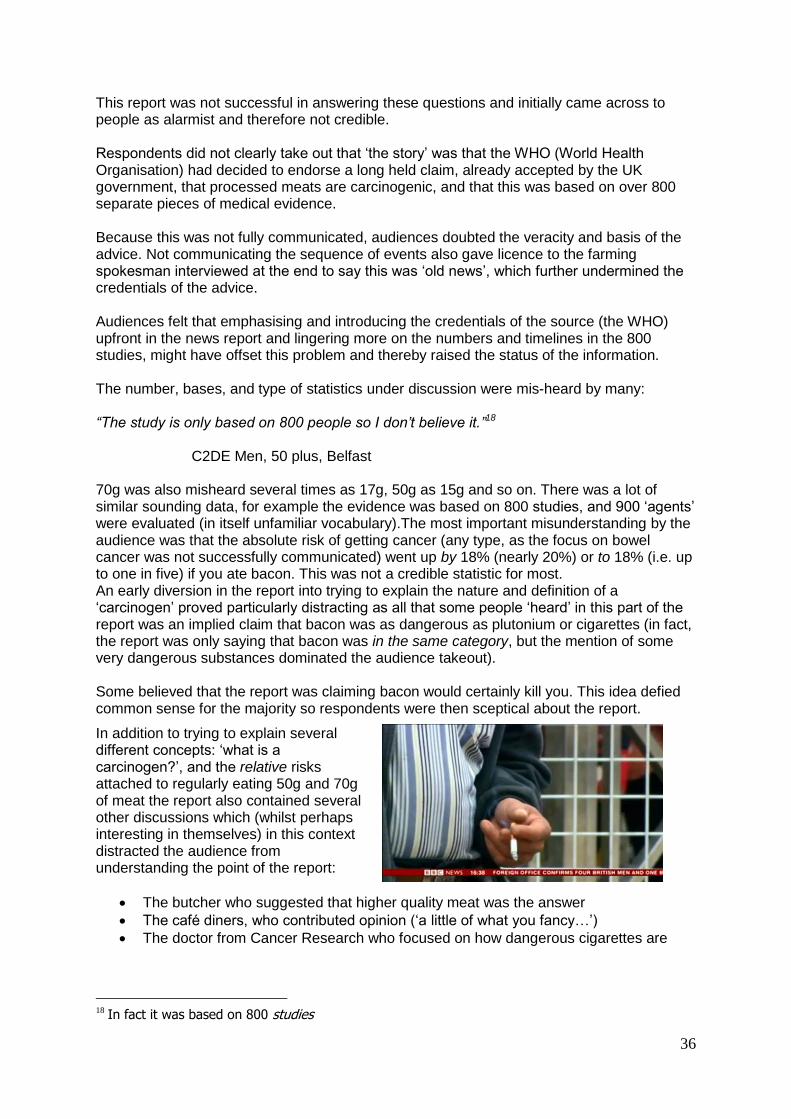
36
This report was not successful in answering these questions and initially came across to people as alarmist and therefore not credible. Respondents did not clearly take out that ‘the story’ was that the WHO (World Health Organisation) had decided to endorse a long held claim, already accepted by the UK government, that processed meats are carcinogenic, and that this was based on over 800 separate pieces of medical evidence. Because this was not fully communicated, audiences doubted the veracity and basis of the advice. Not communicating the sequence of events also gave licence to the farming spokesman interviewed at the end to say this was ‘old news’, which further undermined the credentials of the advice. Audiences felt that emphasising and introducing the credentials of the source (the WHO) upfront in the news report and lingering more on the numbers and timelines in the 800 studies, might have offset this problem and thereby raised the status of the information. The number, bases, and type of statistics under discussion were mis-heard by many: “The study is only based on 800 people so I don’t believe it.”18
C2DE Men, 50 plus, Belfast
70g was also misheard several times as 17g, 50g as 15g and so on. There was a lot of similar sounding data, for example the evidence was based on 800 studies, and 900 ‘agents’ were evaluated (in itself unfamiliar vocabulary).The most important misunderstanding by the audience was that the absolute risk of getting cancer (any type, as the focus on bowel cancer was not successfully communicated) went up by 18% (nearly 20%) or to 18% (i.e. up to one in five) if you ate bacon. This was not a credible statistic for most. An early diversion in the report into trying to explain the nature and definition of a ‘carcinogen’ proved particularly distracting as all that some people ‘heard’ in this part of the report was an implied claim that bacon was as dangerous as plutonium or cigarettes (in fact, the report was only saying that bacon was in the same category, but the mention of some very dangerous substances dominated the audience takeout). Some believed that the report was claiming bacon would certainly kill you. This idea defied common sense for the majority so respondents were then sceptical about the report.
In addition to trying to explain several different concepts: ‘what is a carcinogen?’, and the relative risks attached to regularly eating 50g and 70g of meat the report also contained several other discussions which (whilst perhaps interesting in themselves) in this context distracted the audience from understanding the point of the report:
The butcher who suggested that higher quality meat was the answer
The café diners, who contributed opinion (‘a little of what you fancy…’)
The doctor from Cancer Research who focused on how dangerous cigarettes are
18
In fact it was based on 800 studies
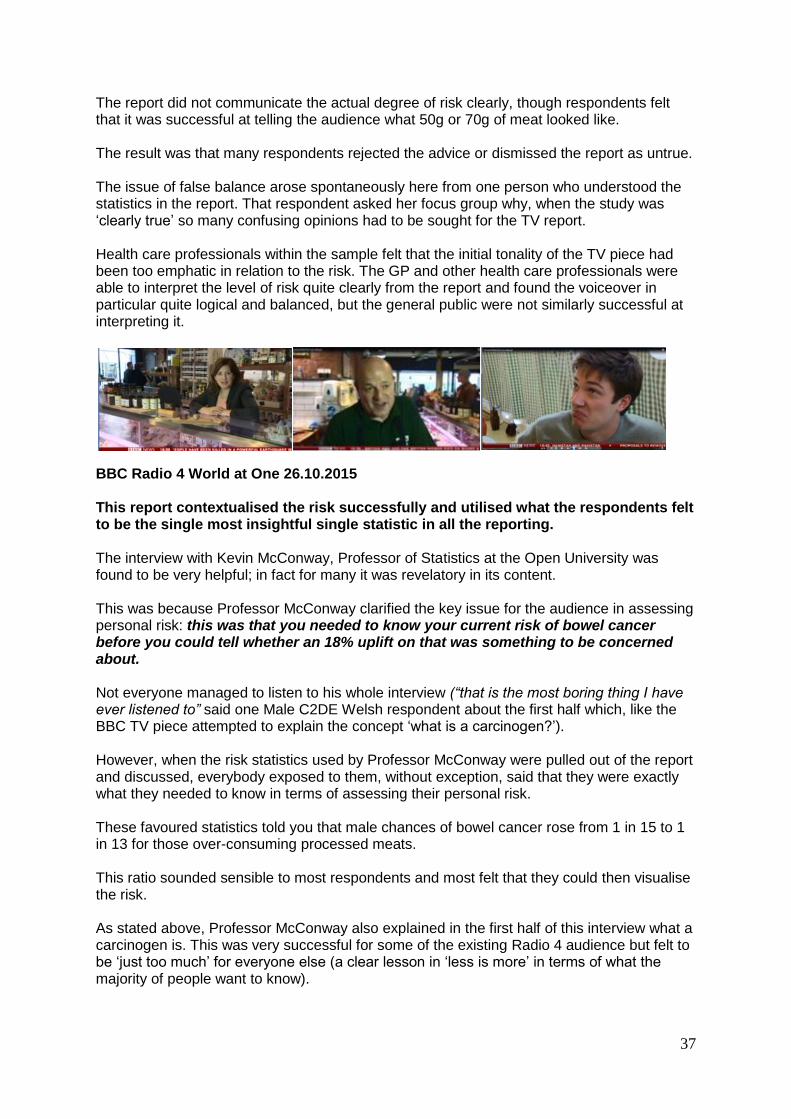
37
The report did not communicate the actual degree of risk clearly, though respondents felt that it was successful at telling the audience what 50g or 70g of meat looked like. The result was that many respondents rejected the advice or dismissed the report as untrue. The issue of false balance arose spontaneously here from one person who understood the statistics in the report. That respondent asked her focus group why, when the study was ‘clearly true’ so many confusing opinions had to be sought for the TV report. Health care professionals within the sample felt that the initial tonality of the TV piece had been too emphatic in relation to the risk. The GP and other health care professionals were able to interpret the level of risk quite clearly from the report and found the voiceover in particular quite logical and balanced, but the general public were not similarly successful at interpreting it.
BBC Radio 4 World at One 26.10.2015 This report contextualised the risk successfully and utilised what the respondents felt to be the single most insightful single statistic in all the reporting. The interview with Kevin McConway, Professor of Statistics at the Open University was found to be very helpful; in fact for many it was revelatory in its content. This was because Professor McConway clarified the key issue for the audience in assessing personal risk: this was that you needed to know your current risk of bowel cancer before you could tell whether an 18% uplift on that was something to be concerned about. Not everyone managed to listen to his whole interview (“that is the most boring thing I have ever listened to” said one Male C2DE Welsh respondent about the first half which, like the BBC TV piece attempted to explain the concept ‘what is a carcinogen?’). However, when the risk statistics used by Professor McConway were pulled out of the report and discussed, everybody exposed to them, without exception, said that they were exactly what they needed to know in terms of assessing their personal risk. These favoured statistics told you that male chances of bowel cancer rose from 1 in 15 to 1 in 13 for those over-consuming processed meats. This ratio sounded sensible to most respondents and most felt that they could then visualise the risk. As stated above, Professor McConway also explained in the first half of this interview what a carcinogen is. This was very successful for some of the existing Radio 4 audience but felt to be ‘just too much’ for everyone else (a clear lesson in ‘less is more’ in terms of what the majority of people want to know).
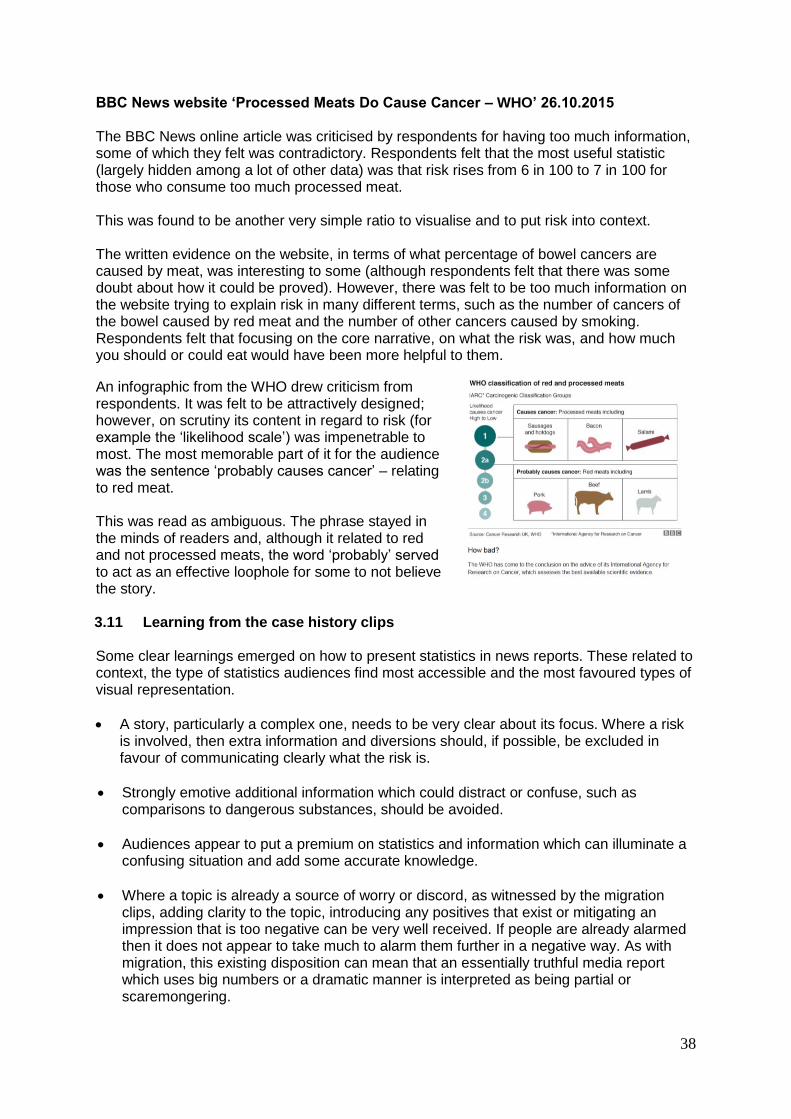
38
BBC News website ‘Processed Meats Do Cause Cancer – WHO’ 26.10.2015 The BBC News online article was criticised by respondents for having too much information, some of which they felt was contradictory. Respondents felt that the most useful statistic (largely hidden among a lot of other data) was that risk rises from 6 in 100 to 7 in 100 for those who consume too much processed meat.
This was found to be another very simple ratio to visualise and to put risk into context. The written evidence on the website, in terms of what percentage of bowel cancers are caused by meat, was interesting to some (although respondents felt that there was some doubt about how it could be proved). However, there was felt to be too much information on the website trying to explain risk in many different terms, such as the number of cancers of the bowel caused by red meat and the number of other cancers caused by smoking. Respondents felt that focusing on the core narrative, on what the risk was, and how much you should or could eat would have been more helpful to them.
An infographic from the WHO drew criticism from respondents. It was felt to be attractively designed; however, on scrutiny its content in regard to risk (for example the ‘likelihood scale’) was impenetrable to most. The most memorable part of it for the audience was the sentence ‘probably causes cancer’ – relating to red meat. This was read as ambiguous. The phrase stayed in the minds of readers and, although it related to red and not processed meats, the word ‘probably’ served to act as an effective loophole for some to not believe the story. 3.11 Learning from the case history clips Some clear learnings emerged on how to present statistics in news reports. These related to context, the type of statistics audiences find most accessible and the most favoured types of visual representation.
A story, particularly a complex one, needs to be very clear about its focus. Where a risk is involved, then extra information and diversions should, if possible, be excluded in favour of communicating clearly what the risk is.
Strongly emotive additional information which could distract or confuse, such as comparisons to dangerous substances, should be avoided.
Audiences appear to put a premium on statistics and information which can illuminate a confusing situation and add some accurate knowledge.
Where a topic is already a source of worry or discord, as witnessed by the migration clips, adding clarity to the topic, introducing any positives that exist or mitigating an impression that is too negative can be very well received. If people are already alarmed then it does not appear to take much to alarm them further in a negative way. As with migration, this existing disposition can mean that an essentially truthful media report which uses big numbers or a dramatic manner is interpreted as being partial or scaremongering.

39
Adding statistics does increase the impression of accuracy, but audiences felt if statistics are used on one side of the argument, they should also be used on the other, especially if fears or worries are raised which could be damaging to minority groups.
In communicating data, audiences felt that reports can sometimes be too ambitious in the amount of numerical detail that they use, particularly on television. The perceived successful approach of Newsbeat and of some of the other radio programmes examined by the audience19 indicated that a slower pace, spacing statistics across a programme, stopping to examine them fully then moving on and using fewer statistics overall would be helpful to the audience.
There was also felt to be a tendency by the BBC to sometimes put in all the data, whereas isolating the trends in the data with a more sparing choice of statistics illustrating the key trends and story lines might be clearer: “The fact there's statistics on Brent oil and American oil and, I imagine, Saudi Arabian oil, that's, kind of, just a bit, throws in another lot of figures, basically. …and it just makes you wonder why (They have done it), all these different prices. Oil is oil at the end of the day, whether it comes from the Far East or the far West, whatever….The price of oil, steel, blah, blah and then about the inflation rate in the UK only being 0.2% last month and then they started going on and even when I was trying to look at my notes I just couldn’t… I’d made notes to say that service prices were going up 2.9%, goods prices were going down 2.1% and… well, that lost me completely.”
BC1, Male, 50 plus, Cumbria, degree specialism in statistics. Diary and interview feedback
3.12 The ideal use of graphics to communicate statistics
Overall, BBC TV news reports were criticised in the diaries and elsewhere for using too few visual graphics or illustrations. The BBC’s default method was felt to be to either read out statistics and numbers or ‘super’ them and also read them out. This approach was seen as not very engaging if a lot of numbers were delivered at speed. “I read figures online as I am a visual learner and I find BBC TV don’t always make figures that visual.” BC1 Female, Trainee Teacher 18-24 Cardiff.
Simple line graphs demonstrating trends over time were found accessible and easy to understand at a glance.
Less simple graphs, particularly those with negative and positive values above and below a line or a combination of lines and bars could be too complicated for the majority of people to follow unless guided through verbally.
Pie charts were liked: audiences found they gave a clear sense of context in terms of proportion versus the ‘universe’ at a glance.
Bar charts were also found to work well for contextualisation. An example on problem drinkers was referenced from The Guardian which was felt to tell a clear story in pictures.
19
You and Yours Radio 4 was praised for its pace.
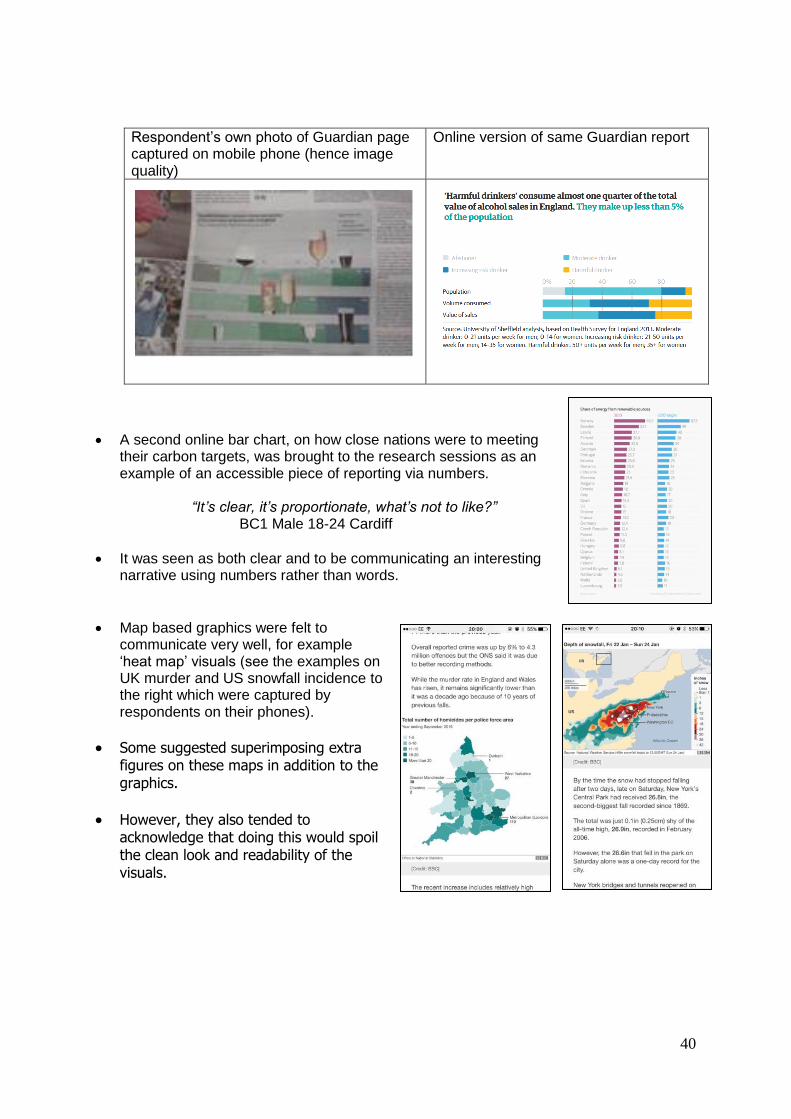
40
Respondent’s own photo of Guardian page captured on mobile phone (hence image quality)
Online version of same Guardian report
A second online bar chart, on how close nations were to meeting their carbon targets, was brought to the research sessions as an example of an accessible piece of reporting via numbers.
“It’s clear, it’s proportionate, what’s not to like?” BC1 Male 18-24 Cardiff
It was seen as both clear and to be communicating an interesting narrative using numbers rather than words.
Map based graphics were felt to communicate very well, for example ‘heat map’ visuals (see the examples on UK murder and US snowfall incidence to the right which were captured by respondents on their phones).
Some suggested superimposing extra figures on these maps in addition to the graphics.
However, they also tended to acknowledge that doing this would spoil the clean look and readability of the visuals.
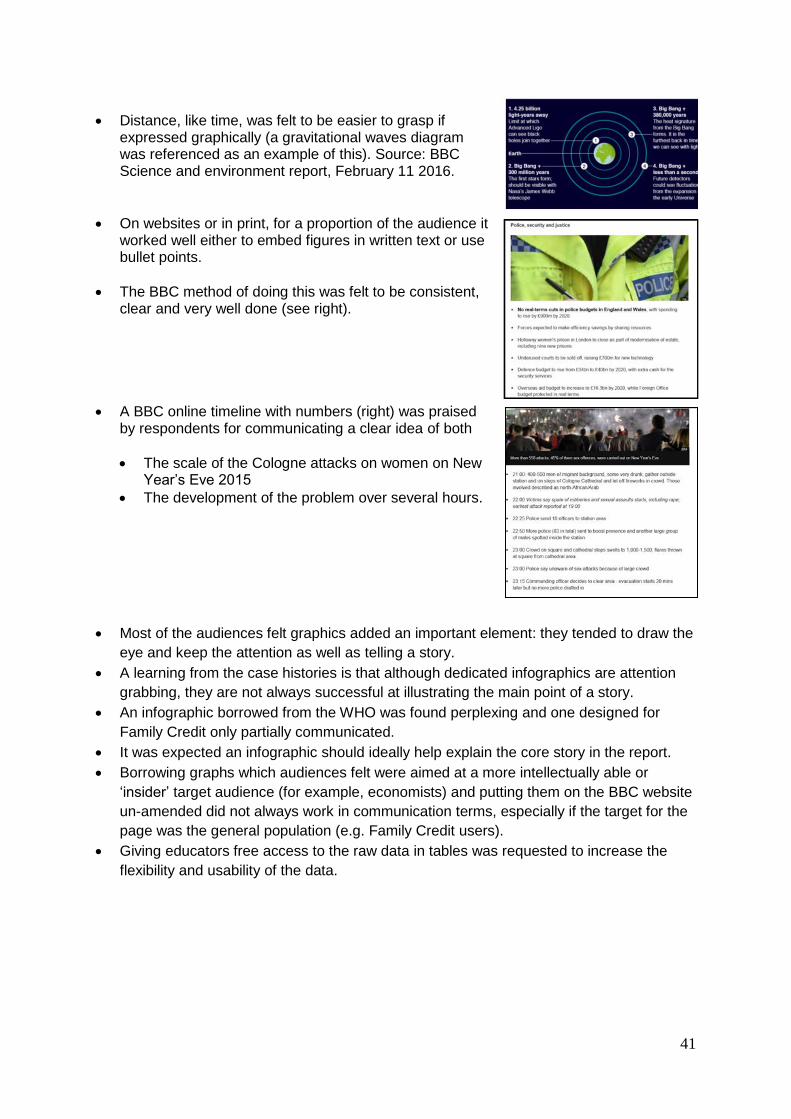
41
Distance, like time, was felt to be easier to grasp if expressed graphically (a gravitational waves diagram was referenced as an example of this). Source: BBC Science and environment report, February 11 2016.
On websites or in print, for a proportion of the audience it worked well either to embed figures in written text or use bullet points.
The BBC method of doing this was felt to be consistent, clear and very well done (see right).
A BBC online timeline with numbers (right) was praised by respondents for communicating a clear idea of both
The scale of the Cologne attacks on women on New Year’s Eve 2015
The development of the problem over several hours.
Most of the audiences felt graphics added an important element: they tended to draw the
eye and keep the attention as well as telling a story.
A learning from the case histories is that although dedicated infographics are attention
grabbing, they are not always successful at illustrating the main point of a story.
An infographic borrowed from the WHO was found perplexing and one designed for
Family Credit only partially communicated.
It was expected an infographic should ideally help explain the core story in the report.
Borrowing graphs which audiences felt were aimed at a more intellectually able or
‘insider’ target audience (for example, economists) and putting them on the BBC website
un-amended did not always work in communication terms, especially if the target for the
page was the general population (e.g. Family Credit users).
Giving educators free access to the raw data in tables was requested to increase the
flexibility and usability of the data.

42
3.13 The preferred expression of numbers and statistics Respondents had many suggestions on how numbers and statistics could be most accessibly expressed, many of which the BBC was already conforming to.
Imaginable or ‘human’ numbers Could be very helpful
Some numbers were harder to visualise
Number out of 100 or 10 e.g. 6 in 10 or 1 in 4. The audience can clearly visualise the number of people involved and hence their personal risk
The floods are ‘a one in a hundred year event’ may be less easy to engage with than ‘hasn’t flooded like this since 1896’
Sometimes ‘third’ ‘half’, ‘doubled’ can be simpler than an index or a percentage
‘Dozens’ is a useful word when the number is somewhere under 100 but you are not sure where (e.g. following accident – dozens unaccounted for)
Translating figures into the accepted unit of measurement for that particular product e.g. oz. for steak vs g for meat in the processed meat report was found helpful
Using or expressing a sum in all measures can be valued, for example, translating $ into £, both imperial and metric referenced, km and mph per hour winds for a storm
Talking about Google’s tax as an effective tax rate of 3% (i.e. comparing it to the tax rate paid by individuals) rather than expressing it as a proportion of profit in billions vs millions
The way figures are expressed is kept consistent within reports by BBC Online: words or figures and scale (e.g. millions) - this is praised as easy to follow once ‘in the flow’ of the report.
Billions, especially large numbers of billions were seen as very hard to imagine: “To be honest, and I am embarrassed to admit this, I find it hard to envisage the difference in scale between £1million and £1billion. If this was for a different audience (i.e. Radio 1 not Radio 4) it would be helpful to remind people what these numbers mean. I think then the importance of the paltry tax settlement (Google) would become apparent.” (University Lecturer)
A sixth former, who had read an article about Apple explaining how sales had fallen, suggested that the article might point out a $5bn difference rather than talk about $53bn and $58bn
% are not simple for everyone: hence the use of real numbers out of 10 or 100 could be helpful
Indexes were also said to be hard to visualise and were for most an unfamiliar measure
Measures such as kilowatt hours (electricity price hikes) are impenetrable to many – referencing the effect on the electricity bill price (e.g. £32) can bring an impact to life and give it relevance.
Where a size is large or hard to imagine then comparing a known area – “the size of Yorkshire” (or the more conventional “football pitch” analogy) was found helpful by some.
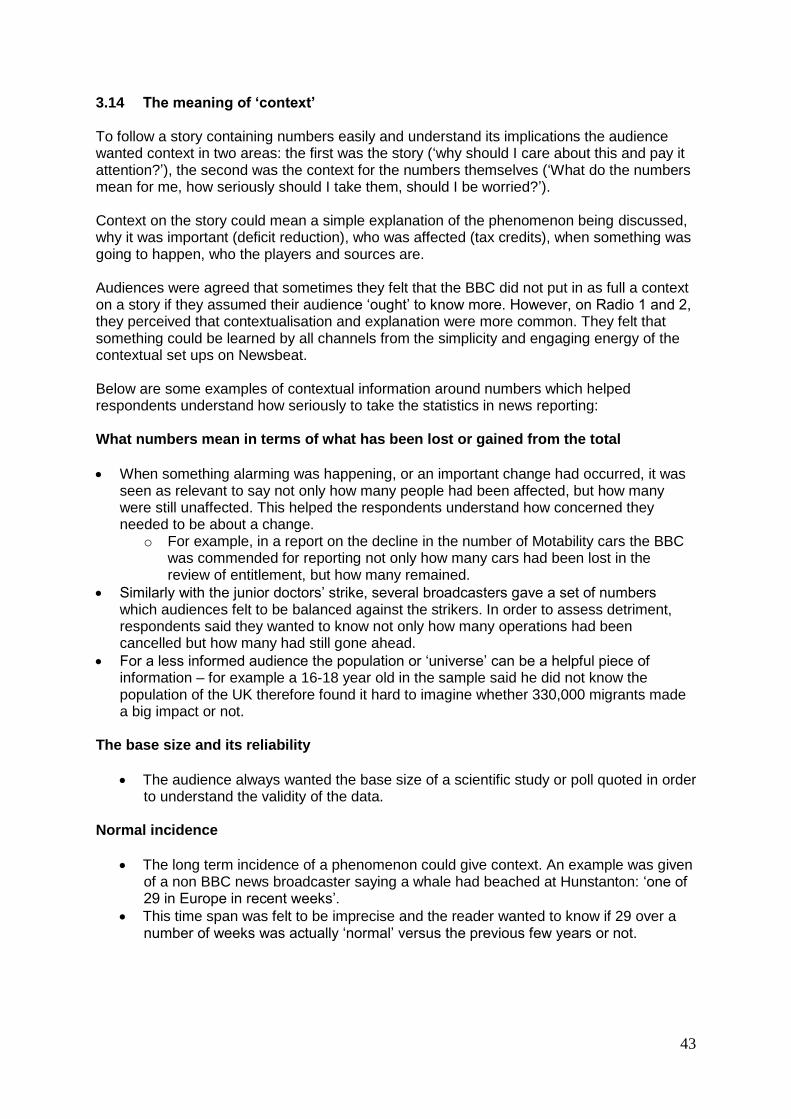
43
3.14 The meaning of ‘context’ To follow a story containing numbers easily and understand its implications the audience wanted context in two areas: the first was the story (‘why should I care about this and pay it attention?’), the second was the context for the numbers themselves (‘What do the numbers mean for me, how seriously should I take them, should I be worried?’). Context on the story could mean a simple explanation of the phenomenon being discussed, why it was important (deficit reduction), who was affected (tax credits), when something was going to happen, who the players and sources are. Audiences were agreed that sometimes they felt that the BBC did not put in as full a context on a story if they assumed their audience ‘ought’ to know more. However, on Radio 1 and 2, they perceived that contextualisation and explanation were more common. They felt that something could be learned by all channels from the simplicity and engaging energy of the contextual set ups on Newsbeat. Below are some examples of contextual information around numbers which helped respondents understand how seriously to take the statistics in news reporting: What numbers mean in terms of what has been lost or gained from the total
When something alarming was happening, or an important change had occurred, it was seen as relevant to say not only how many people had been affected, but how many were still unaffected. This helped the respondents understand how concerned they needed to be about a change.
o For example, in a report on the decline in the number of Motability cars the BBC was commended for reporting not only how many cars had been lost in the review of entitlement, but how many remained.
Similarly with the junior doctors’ strike, several broadcasters gave a set of numbers which audiences felt to be balanced against the strikers. In order to assess detriment, respondents said they wanted to know not only how many operations had been cancelled but how many had still gone ahead.
For a less informed audience the population or ‘universe’ can be a helpful piece of information – for example a 16-18 year old in the sample said he did not know the population of the UK therefore found it hard to imagine whether 330,000 migrants made a big impact or not.
The base size and its reliability
The audience always wanted the base size of a scientific study or poll quoted in order to understand the validity of the data.
Normal incidence
The long term incidence of a phenomenon could give context. An example was given of a non BBC news broadcaster saying a whale had beached at Hunstanton: ‘one of 29 in Europe in recent weeks’.
This time span was felt to be imprecise and the reader wanted to know if 29 over a number of weeks was actually ‘normal’ versus the previous few years or not.
44
What a number or sum equates to ‘in real terms’
For example, if a donation or a spending boost has been received what does that actually equate to in services, staff, or in what is spent in other sectors?
What does an electricity price rise equate to in the average final bill?
Adding normative context
The BBC reporting of Google’s UK tax payment was felt to be done well. The public ‘feeling’ that the tax paid was low in proportion to turnover was conveyed, but the piece was balanced by interviewing a tax lawyer who said the settlement was completely legal. The difficulty of grasping the huge sums of Google turnover (and understanding billions vs millions) was offset by calculating what the tax paid was as a percentage of the total (3%), comparing this to normal tax rates.
Risk
And of course, as referenced above, increases in risk needed to be contextualised within the base risk level.
Ratios were very helpful in expressing this and, indeed, in expressing other ‘chances’ such as in a BBC online report that explained what the increase in the number of balls in the draw meant to one’s chances of winning the lottery.
3.15 The views of those with a disability
For the hard of hearing who use subtitles, making sense of statistics written as numbers on TV can be challenging. There is, for a start, a considerable time lag on all subtitles which has to be dealt with by the reader. On the news, respondents can sometimes be seeing three sets of written data: a subtitle, an update ribbon at the base of the screen (the BBC News channel) and figures written on the screen to reinforce the voiceovers in news reports. Not subtitling visual graphics like pie charts and leaving a relatively ‘clean screen’ for the reader to absorb the graphic proved effective, but we assume it might be challenging to allow for this when adding subtitles in a live context. The BBC News app was praised for its clarity. For those with hearing impairments who amplify sound and for those with visual impairments, radio is found to be a relatively effective medium for communicating statistics. This is because it does not appear to overwhelm with statistics and allows ‘rest’ or appropriate pauses for full exposition. For those with sight difficulties using describing services, the absence of reference to charts and graphs was not felt to be a major issue but there was some criticism of TV reporting where a journalist refers to a graphic being present and then does not explain that graphic. Our respondent with Aspergers found the style of the BBC in reporting news – particularly including the use of numbers – factual, unambiguous and engaging both on TV and online.
45
3.16 Overall verdict of the audience on how the BBC performs versus other sources Most respondents had very high expectations of BBC accuracy and impartiality in the use of data and they felt that these expectations were borne out by the stimulus they examined in the research exercises. A small minority who came to initial research groups assuming the BBC had a pro or anti-government position acknowledged that they could find little or no support for any bias in the use of figures when doing the follow-up diary study. There was an initial perception that the major TV channels perform similarly to the BBC in terms of how they present statistics on TV news. However, some other broadcasters fared worse after scrutiny in the respondent diaries. Most gave the BBC ‘the edge’ in always quoting source and poll size. For example, one TV news broadcaster was felt to not always quote base sizes (substantiated by a claimed instance of omitting the base number of people in a You Gov poll). And other respondents, post completion of the diary, felt that other TV news channels sometimes concentrated much more on the emotional than the factual sides of the story and gave fewer statistics in their reports. No one is felt to do in-depth online information for a general audience better than the BBC, though some additional sources like Channel 4’s ‘Fact Check’ were also praised. It was claimed, however, that for specialist audiences (for example in science) there were sources that reported with more specialist relevance and depth. Audiences felt that the BBC was not over-dependent on any particular sources of statistics. Criticisms of the way that the BBC presents data were at an extremely low level – for example there was one instance where a y axis was felt to have been exaggerated and the respondent questioned whether the percentage movements it illustrated were actually significant. The data used on the BBC was found to be clearly sourced, whether online or on TV, though not all respondents are alert to the presence of sources or interrogate them. However, interested respondents are sometimes unsure who the source is and the source is quite frequently expressed as an acronym. It is felt that sometimes fuller explanations of the independence, perspective or status of sources would be helpful. The broadsheets are also respected for their sourcing and use of numbers despite a perceived political slant in their overall editorial. People feel they have to be more alert to potential political bias in newspapers than they do with TV broadcasters. Periodicals such as The Economist and New Scientist are perceived to be unbiased and accurate.
46
4. Appendix 4.1 Detailed questions addressed by the research
1) What are audience expectations of the BBC’s coverage of this topic20? 2) Is BBC output felt to provide adequate context for audiences so they can evaluate
how much weight to place on a particular set of statistics, by, for example:
identifying the source, and if necessary, funding of the research
reflecting trends
avoiding giving figures more weight than can support scrutiny
addressing the methodology
giving the margin of error or other quality measures if appropriate
explaining what geopolitical area/population sub group research applies to? 3) Does BBC coverage reflect the significant findings appropriately? 4) Is a breadth and diversity of opinion reflected regarding the significance of statistics
across output and across time (as far as the audience are able to tell)? 5) When statistics are included are they perceived to be well-sourced, based on sound
evidence, thoroughly tested and presented in clear, precise language? 6) Are there significant statistics which are felt not to be covered by the BBC but
covered by other media? 7) Is there any audience perception that the BBC prefers to cover certain types of
statistics issued by certain bodies? 8) Do audience expectations vary according to the type of event, format, programme,
presenter and reporter? 9) What indicators do audiences look for in the output to make judgments about
accuracy and impartiality? 10) Do audiences perceive that coverage is unbiased to all parties involved? 11) Are audiences able to make the appropriate judgements in relation to accuracy and
impartiality, for example:
Whether the BBC explained key statistics clearly?
Was enough contexts provided in reports?
Were the background to and causes of the reports adequately explored, even if not definitively explained?
What overall messages have audiences taken out from the BBC’s coverage – about statistics, about the topics covered?
12) How well do audiences feel non-BBC broadcasters and other media (for example print and online the Guardian, the Economist, Mail Online etc.) use statistics?
13) How do the audience feel about ‘balance’ in stories which contain statistics? The review examined a phenomenon called ‘false balance’ in which the statistics point in one clear direction and are perhaps scientifically conclusive but a variety of additional majority or minority opinion (which may occasionally even be contradictory to the evidence) is still sought for news broadcasts.
14) Does the use of graphics aid audience understanding, if so how, what is helpful? 15) Do the audience perceive that ‘incorrect’ statistics, or contributors’ interpretation of
statistics or ‘spin’ are challenged by the BBC and their journalists? 16) Do the audience feel the use of averages is ideal, for example, do they wish the BBC
to go into how different sections of the sample will be affected by something as well as looking at an all population average? Assuming this is wanted, is it done sufficiently in their view?
20 Both topics covered and the use of statistics within this and the presentation of statistical studies themselves.
47
Other areas looked at in the review are below. Most were answered by the content research but the audience researchers were informed in case an audience view was illuminating:
Story order – where do stories containing statistics run in bulletins?
Focus of stories
How do radio, TV and online compare in their use of statistics?
Who are the key actors, in terms of personalities or institutions?
What are their roles?
Is there any geographical imbalance in stories?
What is the source of stories?
Does the network compare and contrast statistics across the different Nations of the UK?
Do stories about statistics get covered in Nations stories and in local content but not on Network (or vice versa)?
What stories including statistics are covered in newspapers but not the BBC?
4.2 Detailed Methodology The BBC audience is very broad. This posed methodological challenges:
As with any BBC Trust project it was essential to sample across the audience of UK licence fee payers, which includes people of very different levels of education, confidence, and ability in regard to ‘maths and arithmetic’.
Maths is seen as a ‘hard’ academic subject by some, and some adults also readily volunteer that it is of low personal interest to them. There was theoretically an ‘inertia’ barrier to overcome in order to get a representative sample to participate. We took measures to recruit not just ‘maths enthusiasts’ but the broader audience of those exposed to numbers in the news and media.
It was obviously important to be realistic about different amounts and levels of feedback, to include all points of view and facilitate people to comment at the level they were comfortable with.
Some have a ‘psychological block’ when dealing with figures. Those with low confidence sometimes switch off and make little effort to understand. They become panic stricken or ‘number blind’ when asked to comment on numbers.
Any lack of engagement (or will to engage) can be worsened if people are in a room with more ‘numerate’ people who they feel they can ‘leave the maths to’.
We know there are gender differences, with some seeing maths (and science) as more of a male preserve and we considered it possible that this could lead to under-contribution by women or girls if we always used mixed sex sessions.
As with any education issues, shame can be felt about a lack of facility with maths. We wanted to ensure that we avoided any bias from this, for example, people claiming they had understood things when they had not, false agreement with other respondents or fear of giving an interpretation. It was crucial for respondents to give us their interpretations of the numbers used, particularly wrong interpretations, so we could see what ways of representing numbers were clearer or easier for people to understand.
Avoiding pre-sensitisation
We did not want to pre-sensitise people who did not see themselves as ‘numerate’ to the fact that they were coming along to discuss numbers. This might have led to people researching the topic in advance, posturing or giving invalidly ‘informed’ feedback at the sessions.
We wanted respondents not only to comment on the BBC stimulus we had selected for them but also to look widely across other broadcasters and platforms (online, print, social media) at how numbers were used.
48
Many Trust impartiality reviews have used a method which takes respondents on a personal journey in terms of reflecting on what they feel impartiality is. Because of the joint complexity here, both in terms of what impartiality means to the audience, and what it means in terms of the use of numerical data we recommended a preliminary face to face group session to fully engage them with what to look for, followed by an individual week-long follow-up exercise examining the presentation of numbers privately and reflectively. We therefore used the following principles to design the study. Sample: an ‘engaged with statistics’ and a ‘less engaged with statistics’ split
We wanted to ensure in advance both a representative response from the public and enough in-depth comments from the statistically engaged to ensure the review catered to the most exacting standards.
We therefore designed the sample to deliver this.
We split the sample broadly into members of the general public that were ‘engaged’ with statistics and educated in them and a general public sample that were ‘less engaged,’ that is, not specially educated in maths and averagely or entirely uninterested in statistics.
Engaged
A small proportion of the sample had a more ‘expert’ perspective. These people claimed to notice and engage with the meaning and presentation of numbers in news reports. We used profession and degree subject as markers for interest. We included NHS medical personnel, scientists, people working in local politics, those with economics or maths degrees and, particularly, educators (teachers and lecturers). This group were usually in the social classes BC1 and had a high terminal education age.
Within this we recruited a spread of readers of the broadsheets and specialist journals such as the New Scientist, The Economist and so on.
Less engaged
The majority of our sample were the less statistically interested and engaged general public. This sample deliberately covered a broad sex and age spectrum nationally and ranged from the higher (BC1) to lower (C2DE) socio-economic groups, including a spectrum of terminal education age. They were not recruited as having any special need for maths in their working life21.
Additional special interest segments
Because of the ‘controversial’ topics being considered, and because of its access commitments the Trust also asked us to encompass in the study:
o Groups who might suffer detriment from negative reporting of statistics within controversial news topics (migrants, users of welfare and benefits).
o Medical personnel who regularly deal with patients’ interpretation of the media reporting of risk (GPs).
o Those with different ways of processing words and numbers (in this case we recruited a person with Asperger syndrome).22
o Audience members with hearing or visual impairments.
21
We didn’t exclude sophisticated users of maths here; they did occur in this sample too. 22 http://www.autism.org.uk/about/what-is/asperger.aspx
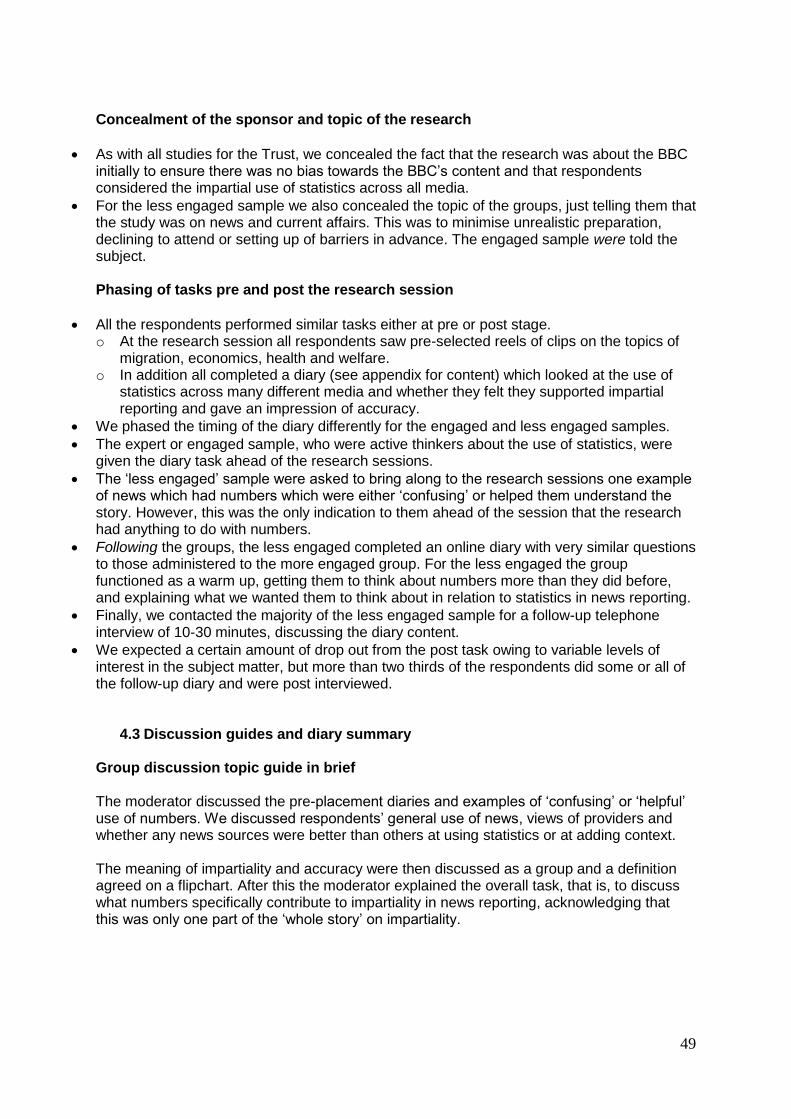
49
Concealment of the sponsor and topic of the research
As with all studies for the Trust, we concealed the fact that the research was about the BBC initially to ensure there was no bias towards the BBC’s content and that respondents considered the impartial use of statistics across all media.
For the less engaged sample we also concealed the topic of the groups, just telling them that the study was on news and current affairs. This was to minimise unrealistic preparation, declining to attend or setting up of barriers in advance. The engaged sample were told the subject. Phasing of tasks pre and post the research session
All the respondents performed similar tasks either at pre or post stage. o At the research session all respondents saw pre-selected reels of clips on the topics of
migration, economics, health and welfare. o In addition all completed a diary (see appendix for content) which looked at the use of
statistics across many different media and whether they felt they supported impartial reporting and gave an impression of accuracy.
We phased the timing of the diary differently for the engaged and less engaged samples.
The expert or engaged sample, who were active thinkers about the use of statistics, were given the diary task ahead of the research sessions.
The ‘less engaged’ sample were asked to bring along to the research sessions one example of news which had numbers which were either ‘confusing’ or helped them understand the story. However, this was the only indication to them ahead of the session that the research had anything to do with numbers.
Following the groups, the less engaged completed an online diary with very similar questions to those administered to the more engaged group. For the less engaged the group functioned as a warm up, getting them to think about numbers more than they did before, and explaining what we wanted them to think about in relation to statistics in news reporting.
Finally, we contacted the majority of the less engaged sample for a follow-up telephone interview of 10-30 minutes, discussing the diary content.
We expected a certain amount of drop out from the post task owing to variable levels of interest in the subject matter, but more than two thirds of the respondents did some or all of the follow-up diary and were post interviewed.
4.3 Discussion guides and diary summary Group discussion topic guide in brief The moderator discussed the pre-placement diaries and examples of ‘confusing’ or ‘helpful’ use of numbers. We discussed respondents’ general use of news, views of providers and whether any news sources were better than others at using statistics or at adding context. The meaning of impartiality and accuracy were then discussed as a group and a definition agreed on a flipchart. After this the moderator explained the overall task, that is, to discuss what numbers specifically contribute to impartiality in news reporting, acknowledging that this was only one part of the ‘whole story’ on impartiality.
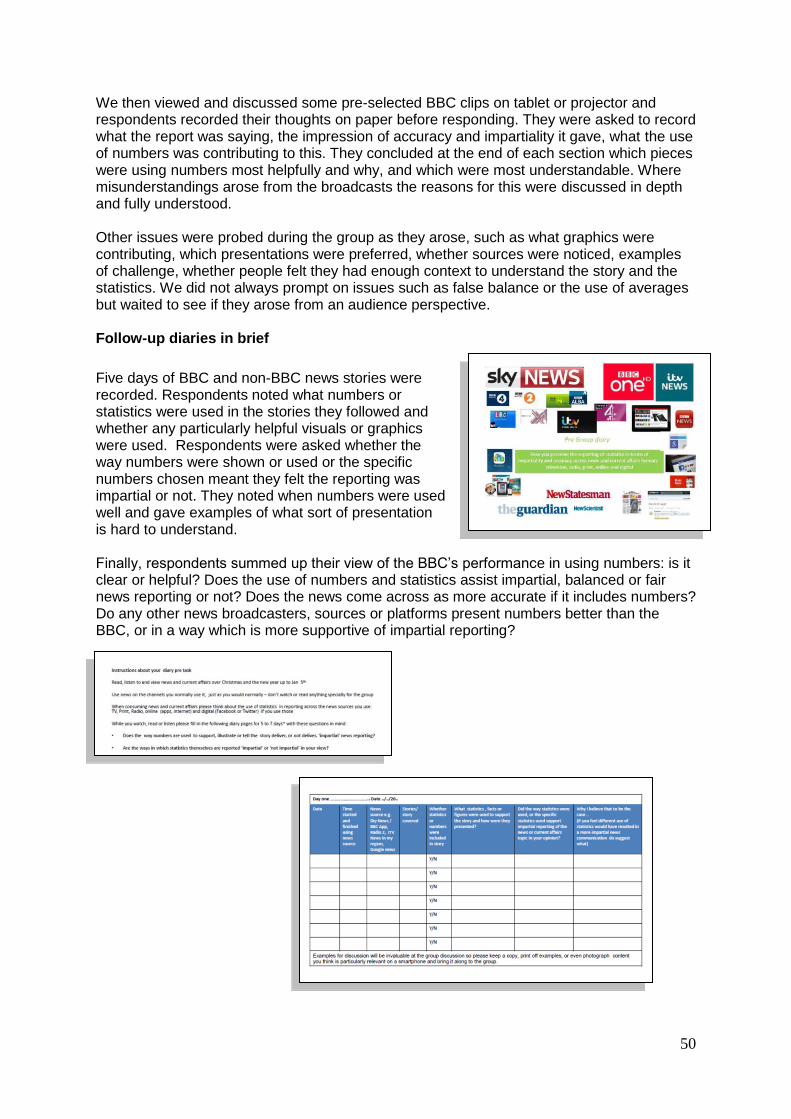
50
We then viewed and discussed some pre-selected BBC clips on tablet or projector and respondents recorded their thoughts on paper before responding. They were asked to record what the report was saying, the impression of accuracy and impartiality it gave, what the use of numbers was contributing to this. They concluded at the end of each section which pieces were using numbers most helpfully and why, and which were most understandable. Where misunderstandings arose from the broadcasts the reasons for this were discussed in depth and fully understood. Other issues were probed during the group as they arose, such as what graphics were contributing, which presentations were preferred, whether sources were noticed, examples of challenge, whether people felt they had enough context to understand the story and the statistics. We did not always prompt on issues such as false balance or the use of averages but waited to see if they arose from an audience perspective. Follow-up diaries in brief
Five days of BBC and non-BBC news stories were recorded. Respondents noted what numbers or statistics were used in the stories they followed and whether any particularly helpful visuals or graphics were used. Respondents were asked whether the way numbers were shown or used or the specific numbers chosen meant they felt the reporting was impartial or not. They noted when numbers were used well and gave examples of what sort of presentation is hard to understand. Finally, respondents summed up their view of the BBC’s performance in using numbers: is it clear or helpful? Does the use of numbers and statistics assist impartial, balanced or fair news reporting or not? Does the news come across as more accurate if it includes numbers? Do any other news broadcasters, sources or platforms present numbers better than the BBC, or in a way which is more supportive of impartial reporting?
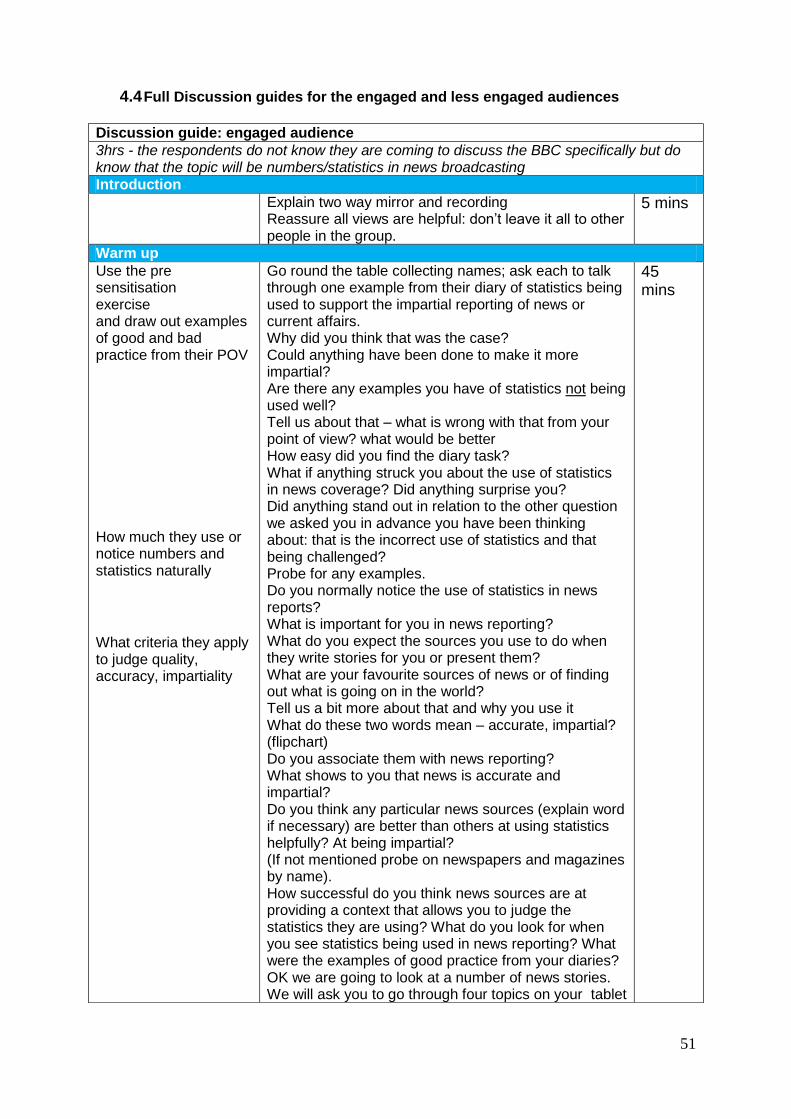
51
4.4 Full Discussion guides for the engaged and less engaged audiences
Discussion guide: engaged audience 3hrs - the respondents do not know they are coming to discuss the BBC specifically but do know that the topic will be numbers/statistics in news broadcasting Introduction
Explain two way mirror and recording Reassure all views are helpful: don’t leave it all to other people in the group.
5 mins
Warm up Use the pre sensitisation exercise and draw out examples of good and bad practice from their POV How much they use or notice numbers and statistics naturally What criteria they apply to judge quality, accuracy, impartiality
Go round the table collecting names; ask each to talk through one example from their diary of statistics being used to support the impartial reporting of news or current affairs. Why did you think that was the case? Could anything have been done to make it more impartial? Are there any examples you have of statistics not being used well? Tell us about that – what is wrong with that from your point of view? what would be better How easy did you find the diary task? What if anything struck you about the use of statistics in news coverage? Did anything surprise you? Did anything stand out in relation to the other question we asked you in advance you have been thinking about: that is the incorrect use of statistics and that being challenged? Probe for any examples. Do you normally notice the use of statistics in news reports? What is important for you in news reporting? What do you expect the sources you use to do when they write stories for you or present them? What are your favourite sources of news or of finding out what is going on in the world? Tell us a bit more about that and why you use it What do these two words mean – accurate, impartial? (flipchart) Do you associate them with news reporting? What shows to you that news is accurate and impartial? Do you think any particular news sources (explain word if necessary) are better than others at using statistics helpfully? At being impartial? (If not mentioned probe on newspapers and magazines by name). How successful do you think news sources are at providing a context that allows you to judge the statistics they are using? What do you look for when you see statistics being used in news reporting? What were the examples of good practice from your diaries? OK we are going to look at a number of news stories. We will ask you to go through four topics on your tablet
45 mins
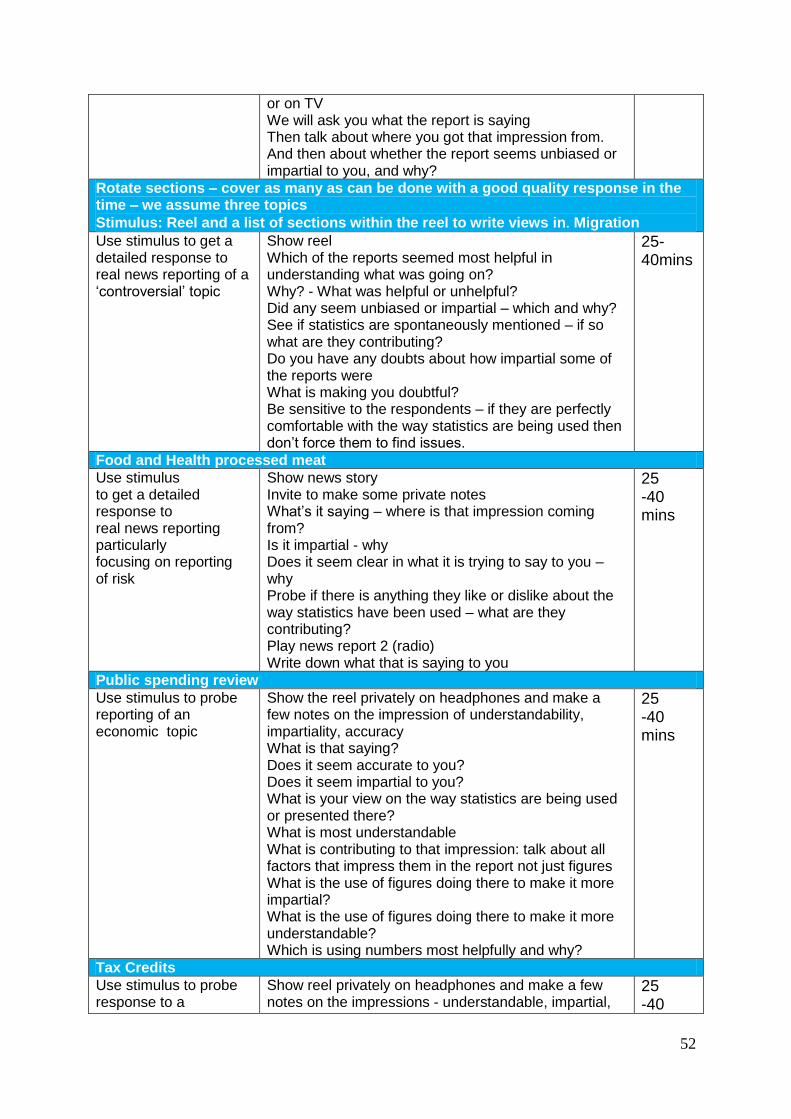
52
or on TV We will ask you what the report is saying Then talk about where you got that impression from. And then about whether the report seems unbiased or impartial to you, and why?
Rotate sections – cover as many as can be done with a good quality response in the time – we assume three topics Stimulus: Reel and a list of sections within the reel to write views in. Migration
Use stimulus to get a detailed response to real news reporting of a ‘controversial’ topic
Show reel Which of the reports seemed most helpful in understanding what was going on? Why? - What was helpful or unhelpful? Did any seem unbiased or impartial – which and why? See if statistics are spontaneously mentioned – if so what are they contributing? Do you have any doubts about how impartial some of the reports were What is making you doubtful? Be sensitive to the respondents – if they are perfectly comfortable with the way statistics are being used then don’t force them to find issues.
25-40mins
Food and Health processed meat Use stimulus to get a detailed response to real news reporting particularly focusing on reporting of risk
Show news story Invite to make some private notes What’s it saying – where is that impression coming from? Is it impartial - why Does it seem clear in what it is trying to say to you – why Probe if there is anything they like or dislike about the way statistics have been used – what are they contributing? Play news report 2 (radio) Write down what that is saying to you
25 -40 mins
Public spending review Use stimulus to probe reporting of an economic topic
Show the reel privately on headphones and make a few notes on the impression of understandability, impartiality, accuracy What is that saying? Does it seem accurate to you? Does it seem impartial to you? What is your view on the way statistics are being used or presented there? What is most understandable What is contributing to that impression: talk about all factors that impress them in the report not just figures What is the use of figures doing there to make it more impartial? What is the use of figures doing there to make it more understandable? Which is using numbers most helpfully and why?
25 -40 mins
Tax Credits Use stimulus to probe response to a
Show reel privately on headphones and make a few notes on the impressions - understandable, impartial,
25 -40
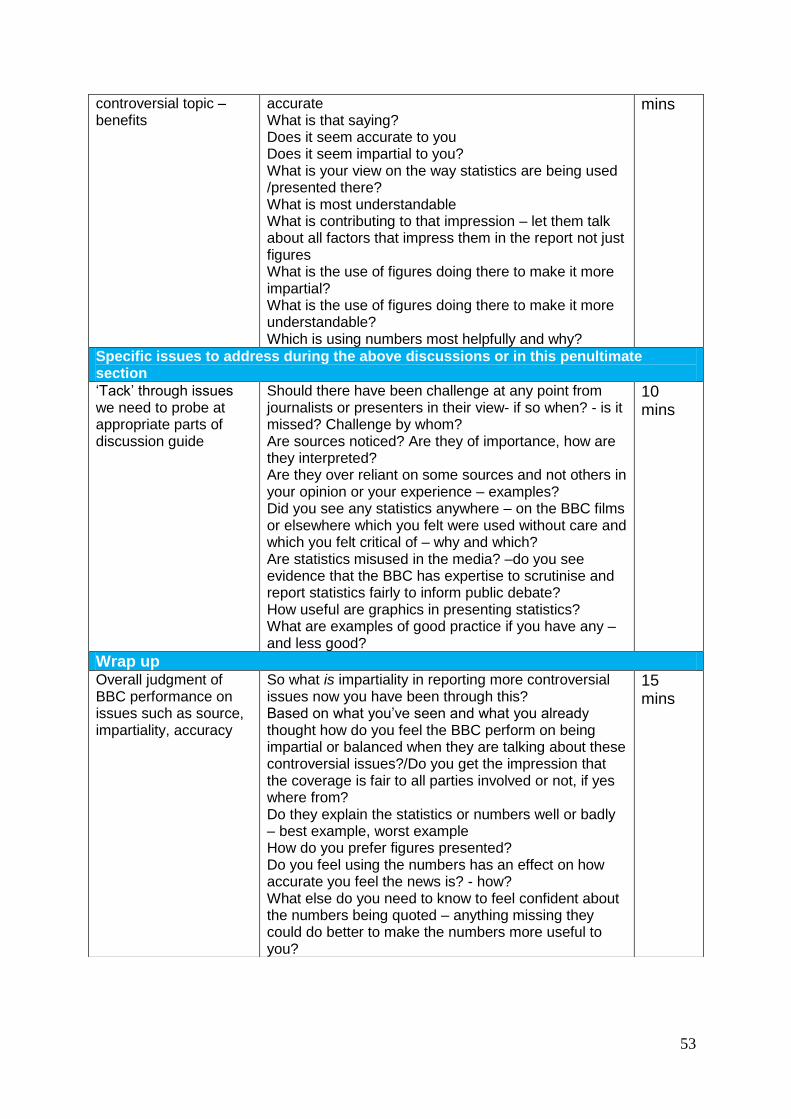
53
controversial topic – benefits
accurate What is that saying? Does it seem accurate to you Does it seem impartial to you? What is your view on the way statistics are being used /presented there? What is most understandable What is contributing to that impression – let them talk about all factors that impress them in the report not just figures What is the use of figures doing there to make it more impartial? What is the use of figures doing there to make it more understandable? Which is using numbers most helpfully and why?
mins
Specific issues to address during the above discussions or in this penultimate section ‘Tack’ through issues we need to probe at appropriate parts of discussion guide
Should there have been challenge at any point from journalists or presenters in their view- if so when? - is it missed? Challenge by whom? Are sources noticed? Are they of importance, how are they interpreted? Are they over reliant on some sources and not others in your opinion or your experience – examples? Did you see any statistics anywhere – on the BBC films or elsewhere which you felt were used without care and which you felt critical of – why and which? Are statistics misused in the media? –do you see evidence that the BBC has expertise to scrutinise and report statistics fairly to inform public debate? How useful are graphics in presenting statistics? What are examples of good practice if you have any – and less good?
10 mins
Wrap up Overall judgment of BBC performance on issues such as source, impartiality, accuracy
So what is impartiality in reporting more controversial issues now you have been through this? Based on what you’ve seen and what you already thought how do you feel the BBC perform on being impartial or balanced when they are talking about these controversial issues?/Do you get the impression that the coverage is fair to all parties involved or not, if yes where from? Do they explain the statistics or numbers well or badly – best example, worst example How do you prefer figures presented? Do you feel using the numbers has an effect on how accurate you feel the news is? - how? What else do you need to know to feel confident about the numbers being quoted – anything missing they could do better to make the numbers more useful to you?
15 mins

54
Discussion guide: less engaged audience The respondents do not know they are coming to discuss the BBC specifically and do not know that the topic will be numbers/ statistics – 2h Introduction Set up Explain two way mirror and recording
Reassure that all views are helpful and we are just as interested if things don’t seem understandable as if they do – don’t leave it all to the other people in the group and be as honest as you can
5 Mins
Warm up How they use news Whether they think in terms of impartiality Set up criteria for judgment for project How much they use or notice numbers and statistics naturally
What are your favourite sources of news or of finding out what is going on in the world? What do you think is important for you in news reporting? What do you expect the sources you use to do when they write stories for you or present them? What do these two words mean – accurate, impartial? (flipchart response) Which of these words seem more natural to you – what would you use (repeat this to them as the research progresses if ‘impartial’ is not their own language) Do you associate them with news reporting? What shows you that news is accurate or impartial? – How do you judge that? Do you think any particular news sources (explain word if necessary) are better than others at being accurate? At being impartial? Right let’s look at the examples you brought along – We asked you to bring along one example of a news story on benefits, ‘the budget or government spending’, ‘risks to your health’ which has a fact or figure in it that helps or doesn’t help you understand what’s going on – how did you get on with that was it easy or hard? Would you call these topics controversial or not controversial? Go through each story and fact and figure. What sort of fact and figure or number presentation helped you understand ‘what is going on’ - What didn’t – why? Discuss any similarities/differences between what people find helpful in terms of the presentation of numbers – ask what they call them – do they call them ‘numbers’ or ‘figures’ or ‘statistics’ Do you ever notice this kind of fact and figure in real life? OK we will to look at a number of news stories. We will ask you to go through three topics on the tablet or on TV We will ask you what the report is saying Then talk about where you got that impression from Does the report seem unbiased or impartial to you –
25 mins
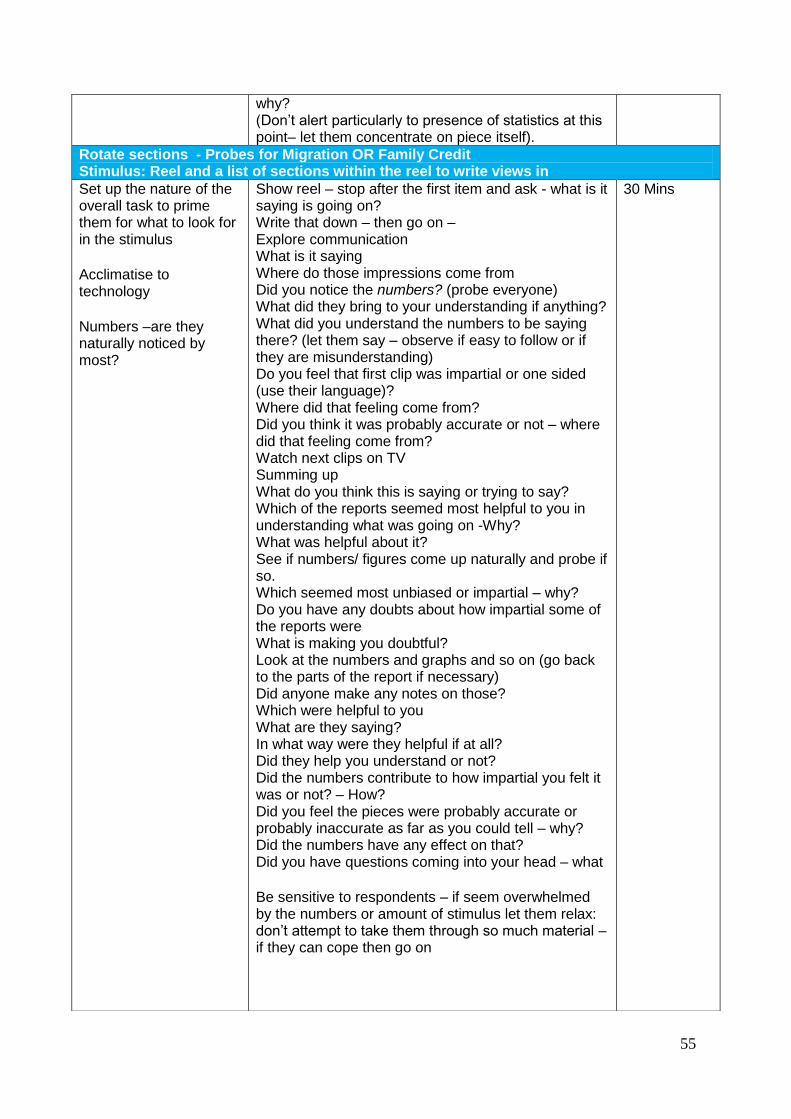
55
why? (Don’t alert particularly to presence of statistics at this point– let them concentrate on piece itself).
Rotate sections - Probes for Migration OR Family Credit Stimulus: Reel and a list of sections within the reel to write views in Set up the nature of the overall task to prime them for what to look for in the stimulus Acclimatise to technology Numbers –are they naturally noticed by most?
Show reel – stop after the first item and ask - what is it saying is going on? Write that down – then go on – Explore communication What is it saying Where do those impressions come from Did you notice the numbers? (probe everyone) What did they bring to your understanding if anything? What did you understand the numbers to be saying there? (let them say – observe if easy to follow or if they are misunderstanding) Do you feel that first clip was impartial or one sided (use their language)? Where did that feeling come from? Did you think it was probably accurate or not – where did that feeling come from? Watch next clips on TV Summing up What do you think this is saying or trying to say? Which of the reports seemed most helpful to you in understanding what was going on -Why? What was helpful about it? See if numbers/ figures come up naturally and probe if so. Which seemed most unbiased or impartial – why? Do you have any doubts about how impartial some of the reports were What is making you doubtful? Look at the numbers and graphs and so on (go back to the parts of the report if necessary) Did anyone make any notes on those? Which were helpful to you What are they saying? In what way were they helpful if at all? Did they help you understand or not? Did the numbers contribute to how impartial you felt it was or not? – How? Did you feel the pieces were probably accurate or probably inaccurate as far as you could tell – why? Did the numbers have any effect on that? Did you have questions coming into your head – what
Be sensitive to respondents – if seem overwhelmed by the numbers or amount of stimulus let them relax: don’t attempt to take them through so much material – if they can cope then go on
30 Mins
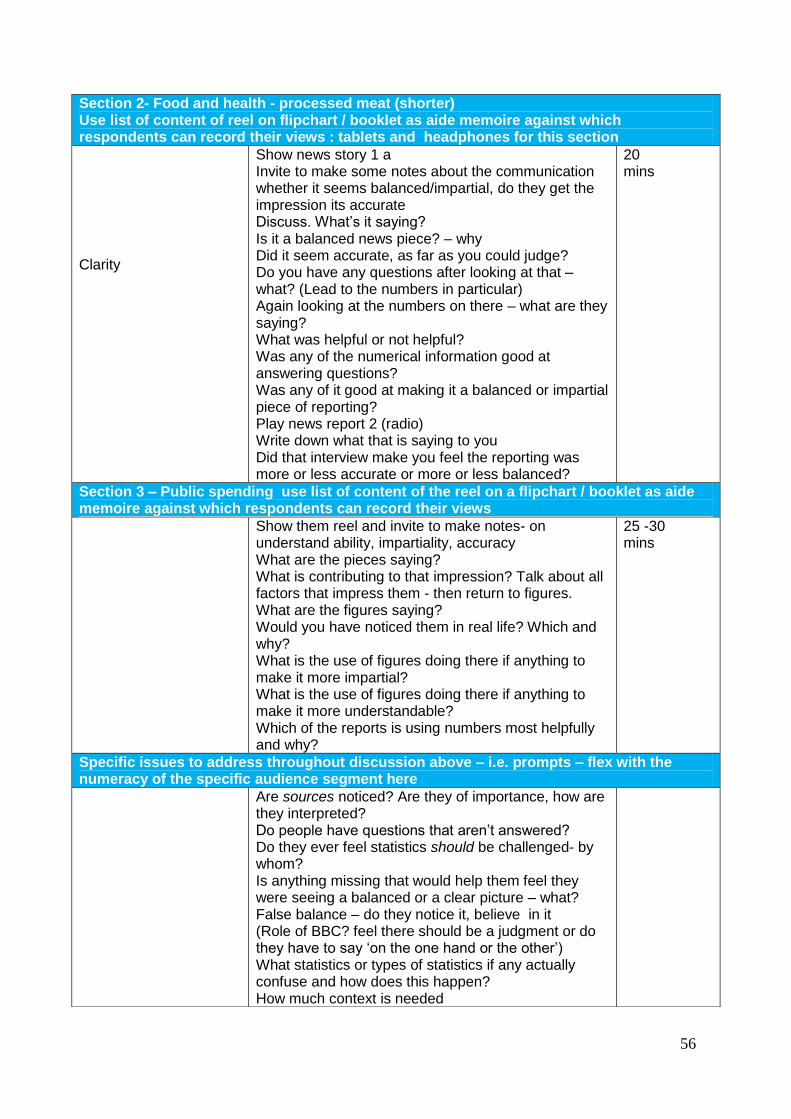
56
Section 2- Food and health - processed meat (shorter) Use list of content of reel on flipchart / booklet as aide memoire against which respondents can record their views : tablets and headphones for this section
Clarity
Show news story 1 a Invite to make some notes about the communication whether it seems balanced/impartial, do they get the impression its accurate Discuss. What’s it saying? Is it a balanced news piece? – why Did it seem accurate, as far as you could judge? Do you have any questions after looking at that – what? (Lead to the numbers in particular) Again looking at the numbers on there – what are they saying? What was helpful or not helpful? Was any of the numerical information good at answering questions? Was any of it good at making it a balanced or impartial piece of reporting? Play news report 2 (radio) Write down what that is saying to you Did that interview make you feel the reporting was more or less accurate or more or less balanced?
20 mins
Section 3 – Public spending use list of content of the reel on a flipchart / booklet as aide memoire against which respondents can record their views
Show them reel and invite to make notes- on understand ability, impartiality, accuracy What are the pieces saying? What is contributing to that impression? Talk about all factors that impress them - then return to figures. What are the figures saying? Would you have noticed them in real life? Which and why? What is the use of figures doing there if anything to make it more impartial? What is the use of figures doing there if anything to make it more understandable? Which of the reports is using numbers most helpfully and why?
25 -30 mins
Specific issues to address throughout discussion above – i.e. prompts – flex with the numeracy of the specific audience segment here
Are sources noticed? Are they of importance, how are they interpreted? Do people have questions that aren’t answered? Do they ever feel statistics should be challenged- by whom? Is anything missing that would help them feel they were seeing a balanced or a clear picture – what? False balance – do they notice it, believe in it (Role of BBC? feel there should be a judgment or do they have to say ‘on the one hand or the other’) What statistics or types of statistics if any actually confuse and how does this happen? How much context is needed
57
The reporting of research reports/polls themselves – is it done well, impartially? Are statistics misused or seen to be misused? – has BBC got the evident expertise to scrutinise and report statistics fairly to inform public debate? What types of graphics help?
Summing up Impartiality in reporting controversial topics – definition Verdict on BBC’s use of sources, accuracy, whether its use of statistics supports impartial reporting Improvements Post task explanation
So what is impartiality in reporting more controversial issues now you’ve been through this? Based on what you’ve seen and what you already thought how do you feel the BBC perform on being impartial or balanced when they are talking about these controversial issues and using numbers? Do you get the impression that the coverage is fair to all parties involved – where from? Do they explain the statistics or numbers well or badly – best example, worst – How you prefer figures presented - why? Does using the numbers have an effect on how accurate you feel the news is? – How? What else if anything does you need to know to understand the numbers being quoted: anything missing they could do better to help you understand the numbers? Explain the post task – encourage to complete and to upload photos/videos
10 mins