Embed Size (px)
Citation preview
Impacts on Residential Property V l N Wi d T biValues Near Wind Turbines:
An Overview of Research Findings and Where to Go From Here
Ben HoenL B k l N ti l L b tLawrence Berkeley National Laboratory
NEWEEP WebinarMay 5 2010May 5, 2010
This presentation was made possible in part by funding by the U.S. Department of Energy, Office of Energy Efficiency and Renewable Energy, Wind & Hydropower Technologies Program
1 Energy Markets and Policy Group • Energy Analysis Department
Impacts on Residential Property Values Near Wind Turbines
• Wind Energy and Property Values
– Overview of Subject
– Previous Literature
– Berkeley Lab Research
Other Disamenity Research– Other Disamenity Research
• Where To Go From Here
2 Energy Markets and Policy Group • Energy Analysis Department
Where To Go From Here

Proximity to and Views of Environmental (Dis)Amenities Can Impact Property Values( ) p p y
Average Home
Highway Transmission Lines
Green Space
Ocean Front
↑$↓$HomeLines Space Front
↑$↓ $
• This linkage is well studied generally, but not for wind facilities• The home/land is often the largest asset in resident’s portfolio• Prior to wind facility construction, impacts (e.g., visual and
auditory) to individual properties are difficult to quantify
3 Energy Markets and Policy Group • Energy Analysis Department
Aesthetics and Property Values Rank as Key Concerns for Wind Stakeholdersy
“Aesthetic perceptions, both positive and negative, are the strongest single influence on individuals’ attitudes towards wind power projects ”single influence on individuals attitudes towards wind power projects.
(Warren, 2005, p. 853)
US developers rank aesthetics & property values as the #1 and #3US developers rank aesthetics & property values as the #1 and #3 concerns of those in opposition to wind development (Paul, 2006)
100% and 85% of those opposed to offshore wind development believe100% and 85% of those opposed to offshore wind development believe aesthetics and property values, respectively, will be adversely impacted
(Firestone et. al., 2007 )
Having structures on the Vermont hilltops was considered a “big disadvantage” by the majority of those surveyed before the Searsburg,
4 Energy Markets and Policy Group • Energy Analysis Department
VT wind facility was erected (Palmer, 1997)

Property Value Concerns for Wind Energy Fall Into Three Potential Categoriesg
1. Area Stigma: Concern that rural No one will move here!g
areas will appear more developed
2. Scenic Vista Stigma: Concern
move here!
It will ruin mygover decrease in quality of scenic vistas from homes
It will ruin my view!
3. Nuisance Stigma: Concern that factors that occur in close
i it ill h i i t
I won’t be able to live in my home!
proximity will have unique impacts
Each of these effects could impact property values;
5 Energy Markets and Policy Group • Energy Analysis Department
p p p y ;none are mutually exclusive

Impacts on Residential Property Values Near Wind Turbines
• Wind Energy and Property Values
– Overview of Subject
– Previous Literature
– Berkeley Lab Research
Other Disamenity Research– Other Disamenity Research
• Where To Go From Here
6 Energy Markets and Policy Group • Energy Analysis Department
Where To Go From Here
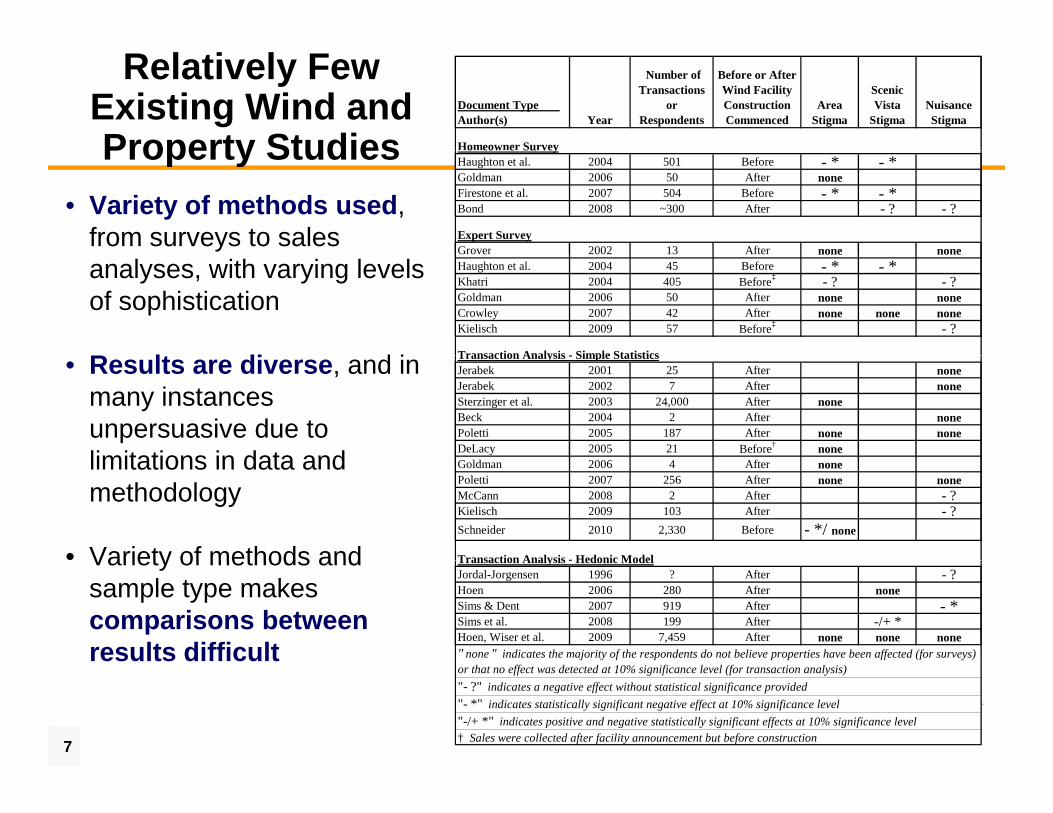
Relatively Few Existing Wind and Property Studies
Document Type Author(s) Year
Number of Transactions
or Respondents
Before or After Wind Facility Construction Commenced
Area Stigma
Scenic Vista
StigmaNuisance Stigma
Homeowner SurveyProperty Studies• Variety of methods used,
from surveys to sales
Haughton et al. 2004 501 Before - * - *Goldman 2006 50 After noneFirestone et al. 2007 504 Before - * - *Bond 2008 ~300 After - ? - ?
Grover 2002 13 After none none
o eow e Su vey
Expert Survey
analyses, with varying levels of sophistication
R lt di d i
Grover 2002 13 After none noneHaughton et al. 2004 45 Before - * - *Khatri 2004 405 Before‡ - ? - ?Goldman 2006 50 After none noneCrowley 2007 42 After none none noneKielisch 2009 57 Before‡ - ?
Transaction Analysis Simple Statistics• Results are diverse, and in many instances unpersuasive due to limitations in data and
Jerabek 2001 25 After noneJerabek 2002 7 After noneSterzinger et al. 2003 24,000 After noneBeck 2004 2 After nonePoletti 2005 187 After none noneDeLacy 2005 21 Before† none
Transaction Analysis - Simple Statistics
limitations in data and methodology
• Variety of methods and
Goldman 2006 4 After nonePoletti 2007 256 After none noneMcCann 2008 2 After - ?Kielisch 2009 103 After - ?Schneider 2010 2,330 Before - */ none
Transaction Analysis - Hedonic ModelVariety of methods and sample type makes comparisons between results difficult
Jordal-Jorgensen 1996 ? After - ?Hoen 2006 280 After noneSims & Dent 2007 919 After - *Sims et al. 2008 199 After -/+ *Hoen, Wiser et al. 2009 7,459 After none none none
Transaction Analysis - Hedonic Model
" none " indicates the majority of the respondents do not believe properties have been affected (for surveys)
7 Energy Markets and Policy Group • Energy Analysis Department
"- *" indicates statistically significant negative effect at 10% significance level"-/+ *" indicates positive and negative statistically significant effects at 10% significance level† Sales were collected after facility announcement but before construction
or that no effect was detected at 10% significance level (for transaction analysis)"- ?" indicates a negative effect without statistical significance provided

Conclusions Drawn From Previous Literature on Wind Energy and Property Values
• Wind facilities have been predicted to negatively impact property values by some (e.g., Haughton; Firestone et al.), sometimes by as much as 24-43% (Kielisch)
• Many experts (e.g., appraisers, assessors, realtors) have not experienced notable reductions in value after construction (Grover;experienced notable reductions in value after construction (Grover; Goldman; Crowley)
• Large impacts (e.g., >10%) have failed to materialize when actual sales are investigated after construction (Poletti; Hoen; Sims & Dent; Sims et al.) except for one study of land sales (Kielisch)
• Impacts to the degree that they exist are most likely very near• Impacts, to the degree that they exist, are most likely very near turbines (e.g., within ½ mile where they can be heard and seen) (McCann) and occur after announcement but prior to construction (Schnieder)
8 Energy Markets and Policy Group • Energy Analysis Department
construction (Schnieder)
Limitations of Existing Research
• Many studies have relied on surveys of homeowners or real estate professionals, rather than quantifying real impacts based on market data
• Most studies have relied on simple statistical techniques that have limitations and that can be dramatically influenced by small numbers of sales transactions or survey respondents
• Most studies have used small datasets that are concentrated in only one wind project study area, making it difficult to extrapolate findings
• Many studies have not reported the statistical significance of their• Many studies have not reported the statistical significance of their results, making it difficult to determine if those results are meaningful
• Many studies have concentrated on Area Stigma, and have ignored Scenic Vista and/or Nuisance Stigma
• Only a few studies have included field visits to homes to determine wind turbine visibility and collect other important information
9 Energy Markets and Policy Group • Energy Analysis Department
y p
• Only two studies have been published in peer-reviewed journals

Impacts on Residential Property Values Near Wind Turbines
• Wind Energy and Property Values– Overview of Subject– Previous LiteraturePrevious Literature– Berkeley Lab Research
• Overview
• Results and Conclusions
Oth Di it R h– Other Disamenity Research
• Where To Go From Here
10 Energy Markets and Policy Group • Energy Analysis Department
Berkeley Lab Research Approach Responds to Limitations of Previous Workp• Conduct literature review of previous wind / property value studies and
wind facility public acceptance surveys, as well as potentially analogous t di th di iti ( d li l t )studies on other disamenities (e.g. roads, power lines, power plants)
• Collect large amount of data on residential sales transactions occurring both pre- and post-construction surrounding a representative sample of wind facilities at multiple locations in the U.S.
• Visit each home to determine wind turbine visibility and to collect other important information about the home (e g the quality of the scenic vista)important information about the home (e.g., the quality of the scenic vista)
• Use multiple statistical models to explore magnitude and statistical significance of potential effects, relying primarily on hedonic model
• Test for the presence of all three stigmas – Area Stigma, Scenic Vista Stigma, and Nuisance Stigma
• Rigorously analyze the data culminating in an LBNL report and at least
11 Energy Markets and Policy Group • Energy Analysis Department
Rigorously analyze the data, culminating in an LBNL report and at least one journal paper

Berkeley Lab Project Involves Most Data-Rich and Comprehensive Analysis To Datep yResearch Questions1) Is there evidence that views of turbines measurably affect sales prices?2) I th id th t i it t t bi bl ff t l i ?2) Is there evidence that proximity to turbines measurably affect sales prices?3) Do the results change over time, and are there other observable impacts?RelevanceProvides stakeholders in siting/permitting processes greater confidence in the likely effects of proposed wind energy facilities, allowing greater consensus on often-contentious setback requirements, viewshed valuations and non-participating landowner arrangements.TeamB. Hoen (Subcontractor to LBNL), R. Wiser (LBNL), P. Cappers (LBNL),B. Hoen (Subcontractor to LBNL), R. Wiser (LBNL), P. Cappers (LBNL), M. Thayer (San Diego State University), G. Sethi (Bard College)FunderU S Department of Energy Office of Energy Efficiency and Renewable
12 Energy Markets and Policy Group • Energy Analysis Department
U.S. Department of Energy, Office of Energy Efficiency and RenewableEnergy, Wind & Hydropower Technologies Program

Collected Sales Data from 10 Study AreasSurrounding 24 Wind Facilities in 9 Statesg
7,459 Residential Sales Transactions1,754 Pre-Announcement, 4,937 Post-Construction, and
768 Post-Announcement-Pre-Construction
3 Adjoining CountiesWashington & Oregon7 Facilities: 582 WTG,
790 Sales
Kewaunee Cnty, WI2 Facilities: 31 WTG,
810 Sales
Madison Cnty, NYArea 1: Madison
7 WTG, 463 Sales
Madison Cnty, NYArea 2: Fenner
20 WTG, 693 Sales790 Sales
Lee Cnty, IL103 WTG,412 Sales
Buena Vista Cnty, IA5 Facilities: 381 WTG,
822 Sales
Wayne Cnty, PA43 WTG,551 Sales
Somerset Cnty, PA
Custer Cnty, OK2 Facilities: 98 WTG,
1,113 Sales
y3 Facilities: 34 WTG,
494 Sales
Howard Cnty, TX46 WTG,
1,311 Sales
13 Energy Markets and Policy Group • Energy Analysis Department

Research Relies on Hedonic Pricing Model in Addition to Other Models
What Is a Hedonic Pricing Model?• Well respected model used by economists and real
t t titi f 40
Coef. SE p Value nIntercept 7.62 0.18 0.00Nbr LN SalePrice96 hat 0.29 0.02 0.00 4,937AgeatSale -0.006 0.0004 0.00 4,937AgeatSale Sqrd 0.00002 0.000003 0.00 4,937Sqft 1000 0.28 0.01 0.00 4,937Acres 0.02 0.00 0.00 4,937
estate practitioners for over 40 years• Heterogeneous residential sales data are used• Measures marginal price differences between homes
that vary by the variables of interest after controlling for
Baths 0.09 0.01 0.00 4,937ExtWalls Stone 0.21 0.02 0.00 1,486CentralAC 0.09 0.01 0.00 2,575Fireplace 0.11 0.01 0.00 1,834FinBsmt 0.08 0.02 0.00 673Cul De Sac 0.10 0.01 0.00 992Water Front 0.33 0.04 0.00 87Cnd Low -0.45 0.05 0.00 69Cnd BAvg -0.24 0.02 0.00 350Cnd Avg Omitted Omitted Omitted 2,727Cnd AAvg 0.14 0.01 0.00 1,445Cnd High 0 23 0 02 0 00 337 that vary by the variables of interest, after controlling for
other characteristics• Controlling characteristics include square feet, acres,
bathrooms fireplaces age condition and scenic vista of
Cnd High 0.23 0.02 0.00 337Vista Poor -0.21 0.02 0.00 310Vista BAvg -0.08 0.01 0.00 2,857Vista Avg Omitted Omitted Omitted 1,247Vista AAvg 0.10 0.02 0.00 448Vista Prem 0.13 0.04 0.00 75WAOR Omitted Omitted Omitted 519TXHC -0.75 0.03 0.00 1,071OKCC -0.44 0.02 0.00 476IABV -0.24 0.02 0.00 605ILLC -0.09 0.03 0.00 213WIKCDC -0 14 0 02 0 00 725 bathrooms, fireplaces, age, condition and scenic vista of
the home, location, etc.• Variables of interest include view of turbines, distance
from turbines, and development period (e.g. before or
WIKCDC -0.14 0.02 0.00 725PASC -0.31 0.03 0.00 291PAWC -0.07 0.03 0.01 222NYMCOC -0.20 0.03 0.00 346NYMC -0.15 0.02 0.00 469Post Con NoView Omitted Omitted Omitted 4,207View Minor -0.01 0.01 0.40 561View Mod 0.02 0.03 0.58 106View Sub -0.01 0.07 0.94 35View Extrm 0.02 0.09 0.80 28Mile Less 0 57 -0.05 0.06 0.40 67Mile 0 57to1 -0.05 0.05 0.30 58
after construction began)• Estimates and significance levels are important
Other Models Used in Analysis
Mile 1to3 0.00 0.02 0.80 2,019Mile 3to5 0.02 0.01 0.23 1,923Mile Gtr5 Omitted Omitted Omitted 870
Model Information Model Equation Number 1Dependent VariableNumber of Cases 4937Number of Predictors (k) 37
LN_SalePrice96
"Omitted" = reference category for fixed effects variables "n" indicates number of cases in category when category = "1"
14 Energy Markets and Policy Group • Energy Analysis Department
Other Models Used in AnalysisRepeat Sales and Sales Volume Models
Number of Predictors (k) 37F Statistic 442.8Adjusted R Squared 0.77
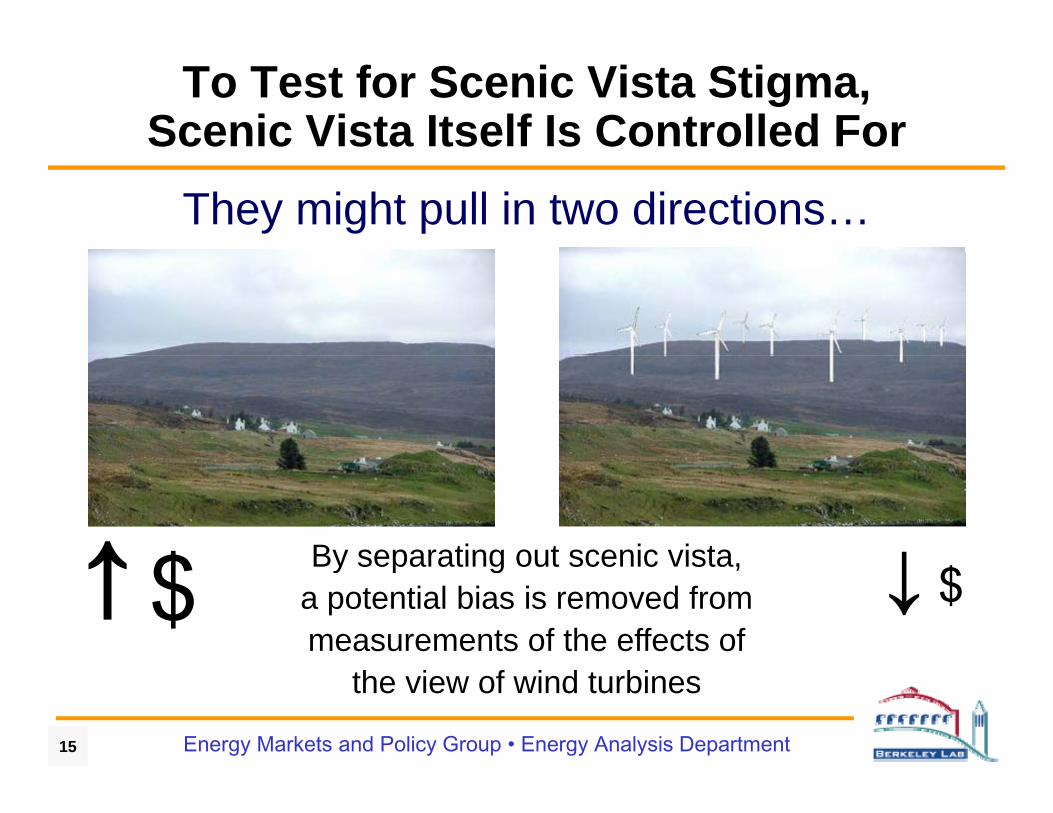
To Test for Scenic Vista Stigma, Scenic Vista Itself Is Controlled For
They might pull in two directions…
$ ↓By separating out scenic vista$ ↓$By separating out scenic vista,
a potential bias is removed frommeasurements of the effects of
15 Energy Markets and Policy Group • Energy Analysis Department
the view of wind turbines
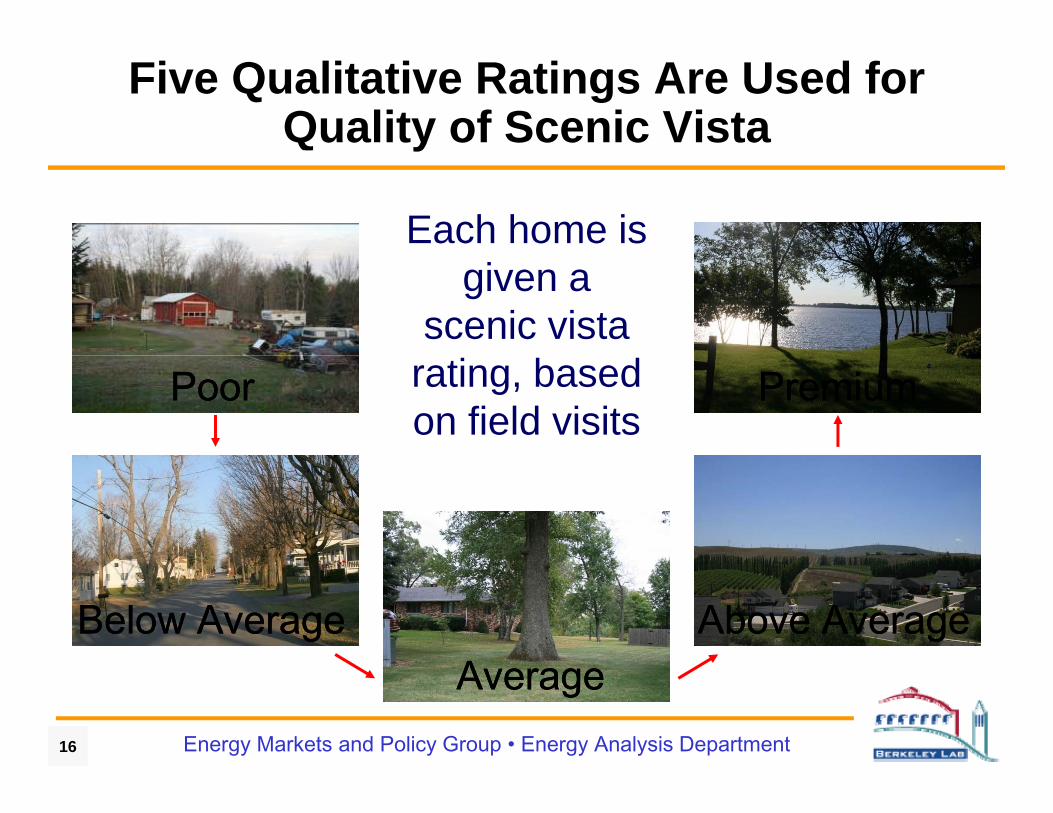
Five Qualitative Ratings Are Used for Quality of Scenic Vistay
Each home is given a
scenic vista rating, based on field visits
PoorPoor PremiumPremium
AABelow AverageBelow Average Above AverageAbove Average
16 Energy Markets and Policy Group • Energy Analysis Department
AverageAverage

Four Qualitative Ratings Are Used for Dominance of View of Wind Turbines
Each home is given a view ofgiven a view of
turbines dominance rating, g,
based on field visits
MinorMinor ExtremeExtreme
ModerateModerate SubstantialSubstantial
17 Energy Markets and Policy Group • Energy Analysis Department
ModerateModerate SubstantialSubstantial

To Test for Area and Nuisance Stigmas, Distance to Nearest Turbine at Time of Sale Is Determined
Five Distance Bands Are CreatedNuisance Stigma• Inside of 3000 Feet• Between 3000 Feet
and 1 MileArea StigmaArea Stigma• Between 1 and 3
Miles• Between 3 and 5
Miles• Outside of 5 Miles
18 Energy Markets and Policy Group • Energy Analysis Department
• Outside of 5 Miles“Sold Homes” include all homes sold both before and after construction of the wind facility
Impacts on Residential Property Values Near Wind Turbines
• Wind Energy and Property Values– Overview of Subject– Previous LiteraturePrevious Literature– Berkeley Lab Research
• Overview
• Results and Conclusions
Oth Di it R h– Other Disamenity Research
• Where To Go From Here
19 Energy Markets and Policy Group • Energy Analysis Department

Base Hedonic Model Results: There Is Strong Statistical Evidence that the
Quality of the Scenic Vista Affects Sales PricesQuality of the Scenic Vista Affects Sales Prices
20%
25%
ces Average Percentage Differences In Sales Prices
As Compared To Reference Category
5%
10%
15%
ge D
iffer
enc As Compared To Reference Category
All differences are statistically significant at the 1% level
-21% -8%
10% 13%
-5%
0%
5%
Perc
enta
g
ReferenceCategory
-20%
-15%
-10%
Aver
age
-25%Poor Vista (n=310)
Below Average Vista (n=2857)
Average Vista (n=1247)
Above Average Vista (n=448)
Premium Vista (n=75)
The reference category consists of transactions for homes with an Average Vista and that occured
20 Energy Markets and Policy Group • Energy Analysis Department
The reference category consists of transactions for homes with an Average Vista, and that occured after construction began on the wind facility
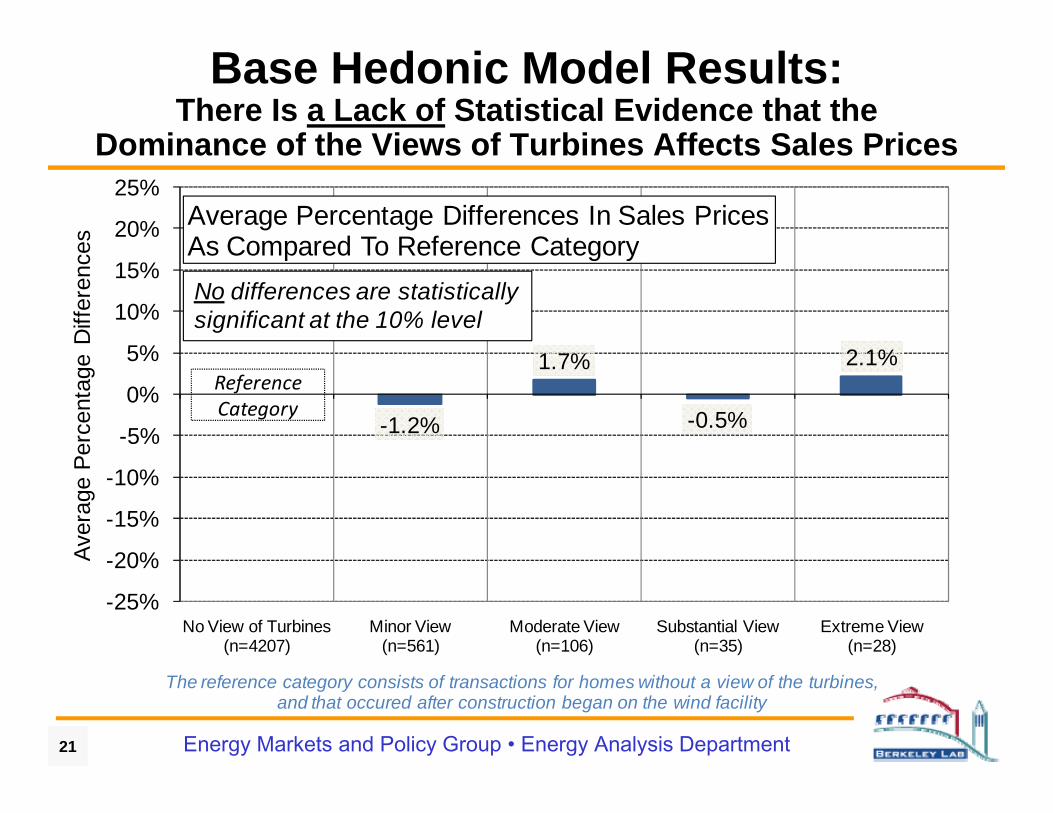
Base Hedonic Model Results: There Is a Lack of Statistical Evidence that the
Dominance of the Views of Turbines Affects Sales PricesDominance of the Views of Turbines Affects Sales Prices
20%
25%
es
Average Percentage Differences In Sales PricesAs Compared To Reference Category
1 7% 2 1%5%
10%
15%
e D
iffer
ence As Compared To Reference Category
No differences are statistically significant at the 10% level
-1.2%
1.7%
-0.5%
2.1%
-5%
0%
5%
Perc
enta
ge ReferenceCategory
20%
-15%
-10%
Aver
age
P
-25%
-20%
No View of Turbines (n=4207)
Minor View (n=561)
Moderate View (n=106)
Substantial View (n=35)
Extreme View (n=28)
A
21 Energy Markets and Policy Group • Energy Analysis Department
The reference category consists of transactions for homes without a view of the turbines, and that occured after construction began on the wind facility

Base Hedonic Model Results:There Is a Lack of Statistical Evidence that the
Distance to the Nearest Turbine Affects Sales PricesDistance to the Nearest Turbine Affects Sales Prices
20%
25%
es
Average Percentage Differences In Sales PricesAs Compared To Reference Category
5%
10%
15%
e D
iffer
ence
p g y
No differences are statistically significant at the 10% level
5 3% 5 5%
-0.4%
1.6%
-5%
0%
5%
e Pe
rcen
tage
ReferenceCategory
-5.3% -5.5%
-20%
-15%
-10%
Aver
age
-25%
20%
Within 3000 Feet (n=67)
Between 3000 Feet and 1 Mile (n=58)
Between 1 and 3 Miles (n=2019)
Between 3 and 5 Miles (n=1923)
Outside 5 Miles (n=870)
22 Energy Markets and Policy Group • Energy Analysis Department
The reference category consists of transactions for homes situated more than five miles from the nearest turbine, and that occured after construction began on the wind facility

Temporal Aspects Model Results: Homes Nearest the Turbines Were Depressed in Value Before Construction and Appreciated the Most After Construction While Homes Further Away Were Largely Unchanged Over Timethe Most After Construction While Homes Further Away Were Largely Unchanged Over Time
20%
25%
Price Changes Over TimeAverage percentage difference in sales prices as compared to reference category
5%
10%
15%
Differen
ces
Reference CategoryOutside of 5 MilesMore Than 2 Years
-5%
0%
ge Percentage Before Announcement
-20%
-15%
-10%
Averag
Less Than 1 Mile Between 1 and 3 Miles
Between 3 and 5 Miles Outside 5 Miles
-25%More Than
2 Years Before
Announcement
Less Than 2 Years Before
Announcement
After Announcement
Before Construction
Less Than 2 Years
After Construction
Between 2 and 4 Years
After Construction
More Than 4 Years
After Construction
23 Energy Markets and Policy Group • Energy Analysis Department
The reference category consists of transactions of homes situated more than five miles from where the nearest turbine would eventually be located and that occurred more than two years before announcement of the facility
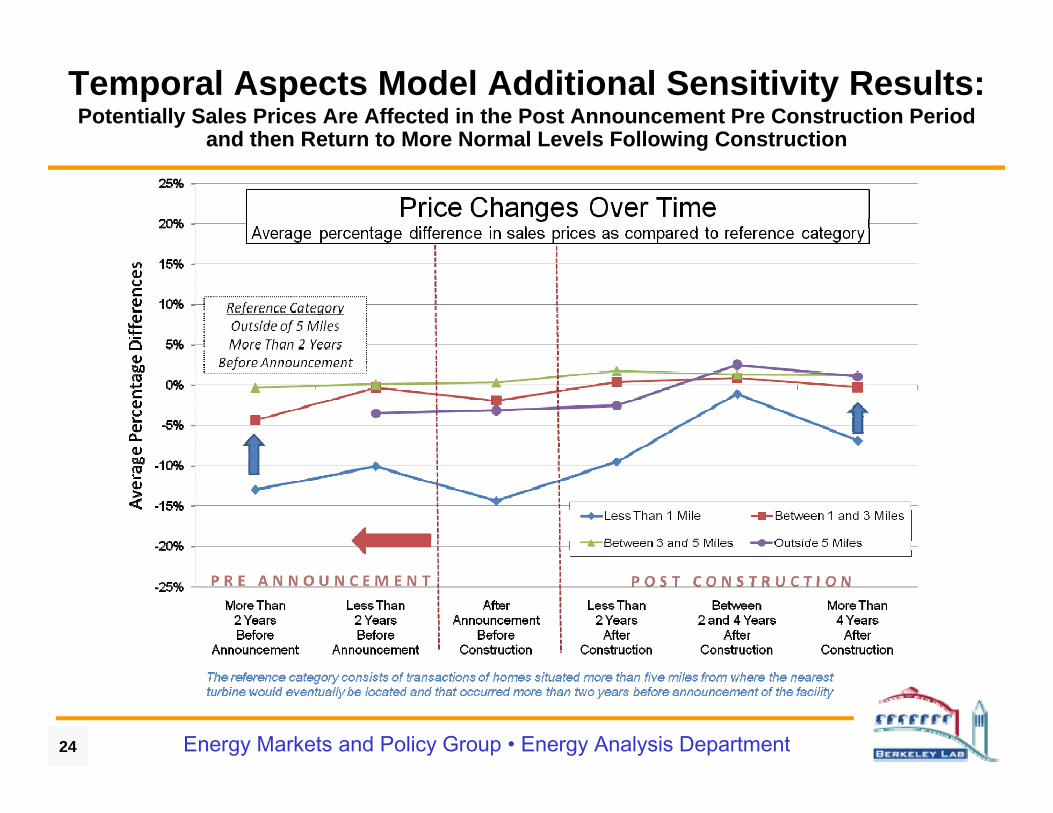
Temporal Aspects Model Additional Sensitivity Results:Potentially Sales Prices Are Affected in the Post Announcement Pre Construction Period
and then Return to More Normal Levels Following Constructiong
24 Energy Markets and Policy Group • Energy Analysis Department
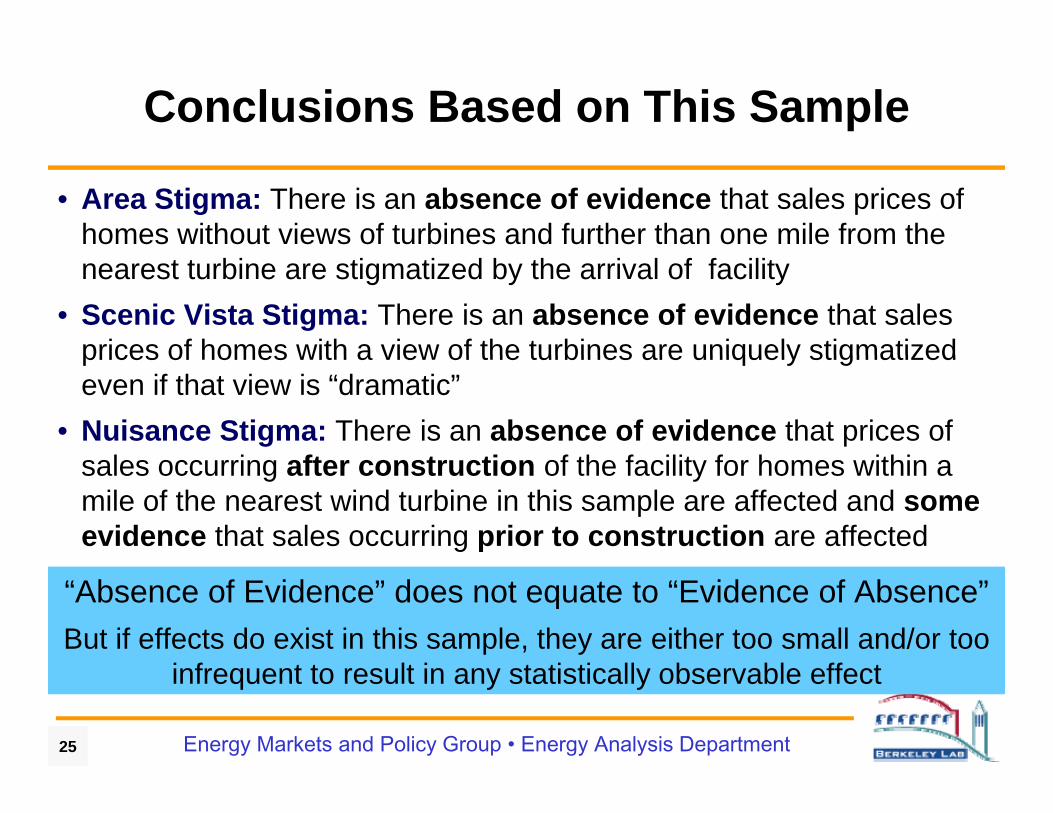
Conclusions Based on This Sample
• Area Stigma: There is an absence of evidence that sales prices of homes without views of turbines and further than one mile from the nearest turbine are stigmatized by the arrival of facility
• Scenic Vista Stigma: There is an absence of evidence that sales prices of homes with a view of the turbines are uniquely stigmatizedprices of homes with a view of the turbines are uniquely stigmatized even if that view is “dramatic”
• Nuisance Stigma: There is an absence of evidence that prices of l i ft t ti f th f ilit f h ithisales occurring after construction of the facility for homes within a
mile of the nearest wind turbine in this sample are affected and some evidence that sales occurring prior to construction are affected
“Absence of Evidence” does not equate to “Evidence of Absence”But if effects do exist in this sample, they are either too small and/or too
i f l i i i ll b bl ff
25 Energy Markets and Policy Group • Energy Analysis Department
infrequent to result in any statistically observable effect

Impacts on Residential Property Values Near Wind Turbines
• Wind Energy and Property Values
– Overview of Subject
– Previous Literature
– Berkeley Lab Research
Other Disamenity Research– Other Disamenity Research
• Where To Go From Here
26 Energy Markets and Policy Group • Energy Analysis Department
Where To Go From Here
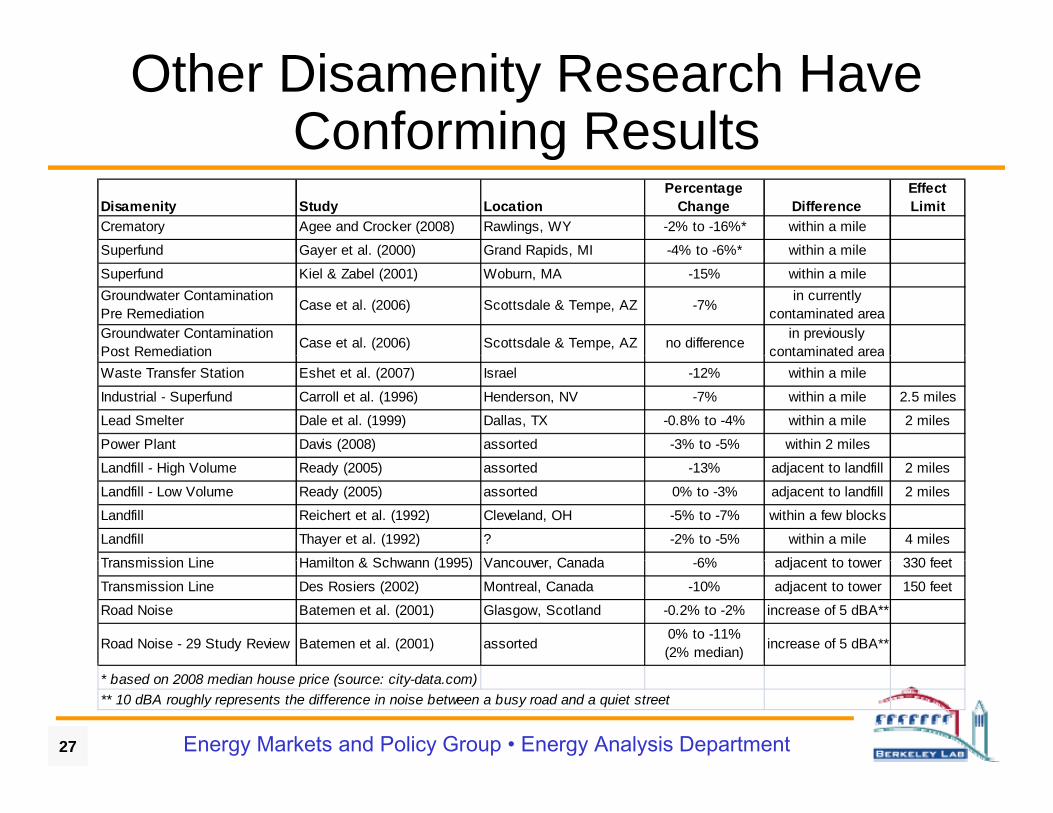
Other Disamenity Research Have Conforming Resultsg
Disamenity Study LocationPercentage
Change DifferenceEffect Limit
Crematory Agee and Crocker (2008) Rawlings, WY -2% to -16%* within a mile
Superfund Gayer et al (2000) Grand Rapids MI -4% to -6%* within a mileSuperfund Gayer et al. (2000) Grand Rapids, MI 4% to 6% within a mile
Superfund Kiel & Zabel (2001) Woburn, MA -15% within a mileGroundwater Contamination Pre Remediation Case et al. (2006) Scottsdale & Tempe, AZ -7%
in currently contaminated area
Groundwater Contamination Post Remediation Case et al. (2006) Scottsdale & Tempe, AZ no difference
in previously contaminated areaPost Remediation contaminated area
Waste Transfer Station Eshet et al. (2007) Israel -12% within a mile
Industrial - Superfund Carroll et al. (1996) Henderson, NV -7% within a mile 2.5 miles
Lead Smelter Dale et al. (1999) Dallas, TX -0.8% to -4% within a mile 2 miles
Power Plant Davis (2008) assorted -3% to -5% within 2 miles
Landfill - High Volume Ready (2005) assorted -13% adjacent to landfill 2 miles
Landfill - Low Volume Ready (2005) assorted 0% to -3% adjacent to landfill 2 miles
Landfill Reichert et al. (1992) Cleveland, OH -5% to -7% within a few blocks
Landfill Thayer et al. (1992) ? -2% to -5% within a mile 4 miles
Transmission Line Hamilton & Schwann (1995) Vancouver Canada 6% adjacent to tower 330 feetTransmission Line Hamilton & Schwann (1995) Vancouver, Canada -6% adjacent to tower 330 feet
Transmission Line Des Rosiers (2002) Montreal, Canada -10% adjacent to tower 150 feet
Road Noise Batemen et al. (2001) Glasgow, Scotland -0.2% to -2% increase of 5 dBA**
Road Noise - 29 Study Review Batemen et al. (2001) assorted0% to -11% (2% median) increase of 5 dBA**
27 Energy Markets and Policy Group • Energy Analysis Department
* based on 2008 median house price (source: city-data.com)** 10 dBA roughly represents the difference in noise between a busy road and a quiet street
Impacts on Residential Property Values Near Wind Turbines
• Wind Energy and Property Values
– Overview of Subject
– Previous Literature
– Berkeley Lab Research
Other Disamenity Research– Other Disamenity Research
• Where To Go From Here
28 Energy Markets and Policy Group • Energy Analysis Department
Where To Go From Here
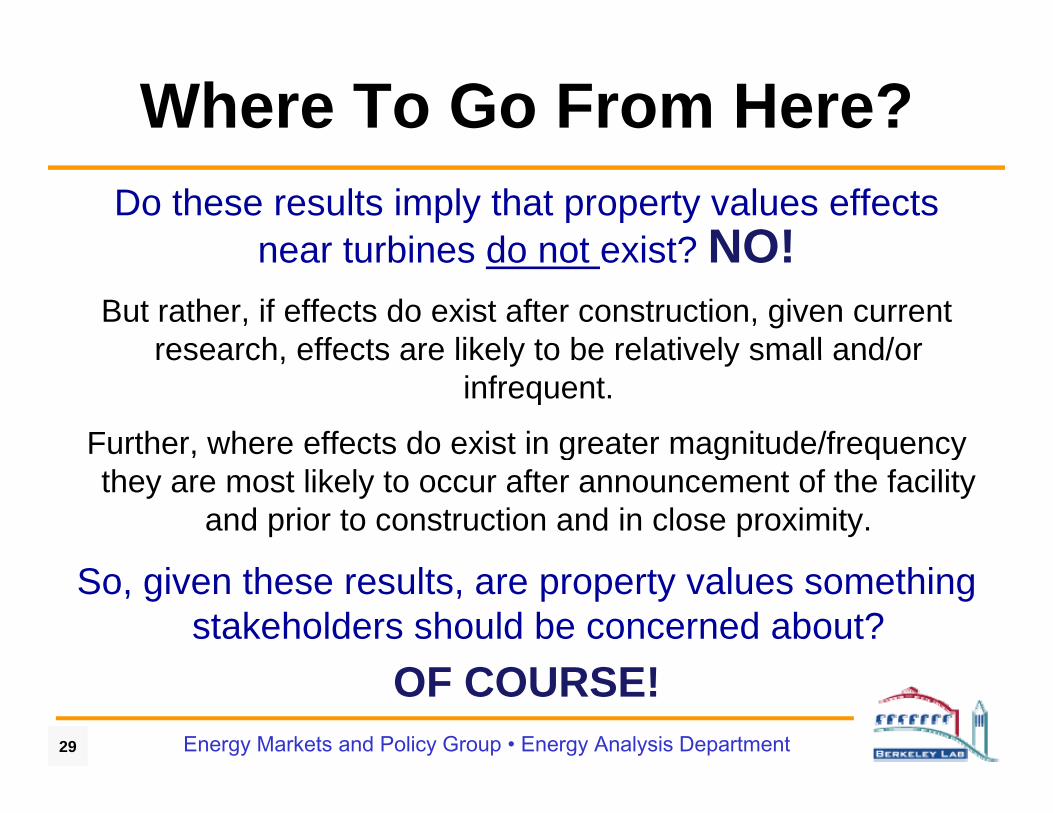
Where To Go From Here?Do these results imply that property values effects
near turbines do not exist? NO!near turbines do not exist? NO!But rather, if effects do exist after construction, given current
research effects are likely to be relatively small and/orresearch, effects are likely to be relatively small and/or infrequent.
Further, where effects do exist in greater magnitude/frequency , g g q ythey are most likely to occur after announcement of the facility
and prior to construction and in close proximity.
So, given these results, are property values something stakeholders should be concerned about?
29 Energy Markets and Policy Group • Energy Analysis Department
OF COURSE!

Property Value Risks Will Persist Unless They Are Measured, Mitigated and Managed, g g
C ti t M t B tt U d t d Eff t
MeasureContinue to Measure to Better Understand Effects,
to test the robustness of previous findings, and explore nuances in effects (e.g., changes over time)p ( g , g )
• Use other techniques (e.g., paired sales, surveys, appraisals)
• Use similar techniques with other data (e.g., new facilities)
• Test for other analogous effects (e.g., time on the market, sales l )volume)
• Publish results in journals
30 Energy Markets and Policy Group • Energy Analysis Department
Modulate as knowledge and methods evolve!
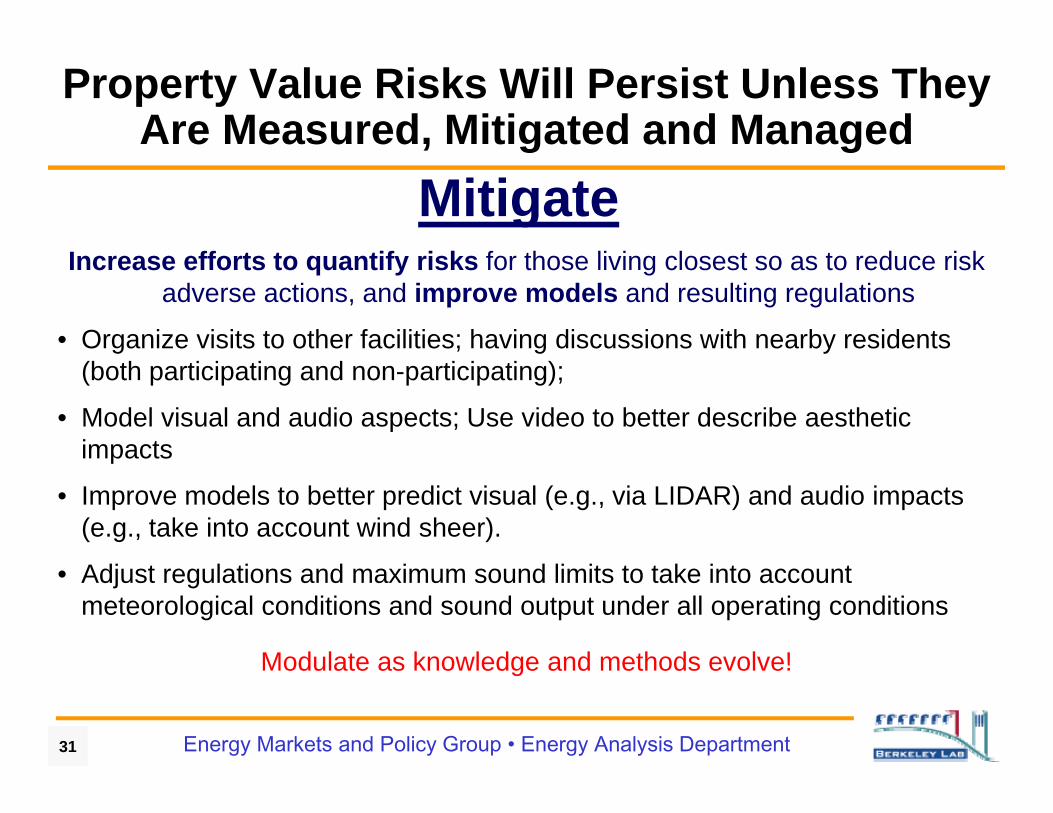
Property Value Risks Will Persist Unless They Are Measured, Mitigated and Managed, g g
I ff t t tif i k f th li i l t t d i k
MitigateIncrease efforts to quantify risks for those living closest so as to reduce risk
adverse actions, and improve models and resulting regulations
• Organize visits to other facilities; having discussions with nearby residents (both participating and non-participating);
• Model visual and audio aspects; Use video to better describe aesthetic impactsimpacts
• Improve models to better predict visual (e.g., via LIDAR) and audio impacts (e.g., take into account wind sheer).
• Adjust regulations and maximum sound limits to take into account meteorological conditions and sound output under all operating conditions
Modulate as knowledge and methods evolve!
31 Energy Markets and Policy Group • Energy Analysis Department
Modulate as knowledge and methods evolve!
Property Value Risks Will Persist Unless They Are Measured, Mitigated and Managed, g g
M i k i th h t t f h th h
ManageManage risks in the short term for homeowners through
tenable/workable measures
• Offer some combination of neighbor agreements/incentives• Offer some combination of neighbor agreements/incentives and/or property value guarantees (e.g., Dekalb County, IL) to nearby homeowners as are economically tenable and legally workable
• Conduct follow up studies (e.g., surveys, appraisals)
• Realize that cumulative impacts may exist
• Realize that real or perceived risks may increase/decrease as
32 Energy Markets and Policy Group • Energy Analysis Department
more/better information become available
For More Information...
See full report LBNL reporthttp://eetd lbl gov/ea/ems/re pubs html• http://eetd.lbl.gov/ea/ems/re-pubs.html
To contact the primary authors of report and me• Ben Hoen, consultant to Lawrence Berkeley National
Laboratory, 845-758-1896, [email protected]
• Ryan Wiser, Lawrence Berkeley National Laboratory, 510-486-5474, [email protected]
This presentation was made possible in part from funding by the Office of Energy Efficiency and Renewable Energy, Wind & Hydropower
Technologies Program of the U.S. DOE under Contract No. DE-AC02-
33 Energy Markets and Policy Group • Energy Analysis Department
g g05CH11231