Embed Size (px)
Citation preview
Copyright © 2015 Technology Futures, Inc.
Copyright © 2015, Technology Futures, Inc. 1
L V t Ph D
Impacts on Cable HFC Networks
Lawrence Vanston, Ph.D.President,Technology Futures, [email protected]
TFI Communications Technology Asset
Copyright © 2015, Technology Futures, Inc. 2
TFI Communications Technology Asset Valuation Conference
Radisson DowntownJanuary 28-29, 2015
13740 Research Blvd., Bldg. C-1 • Austin, Texas 78750 (512) 258-8898 • www.tfi.com
Copyright © 2015 Technology Futures, Inc.
Overview
• Bandwidth requirements
• Alternatives for meeting them
• HFC asset lives and percent goods
Copyright © 2015, Technology Futures, Inc. 3
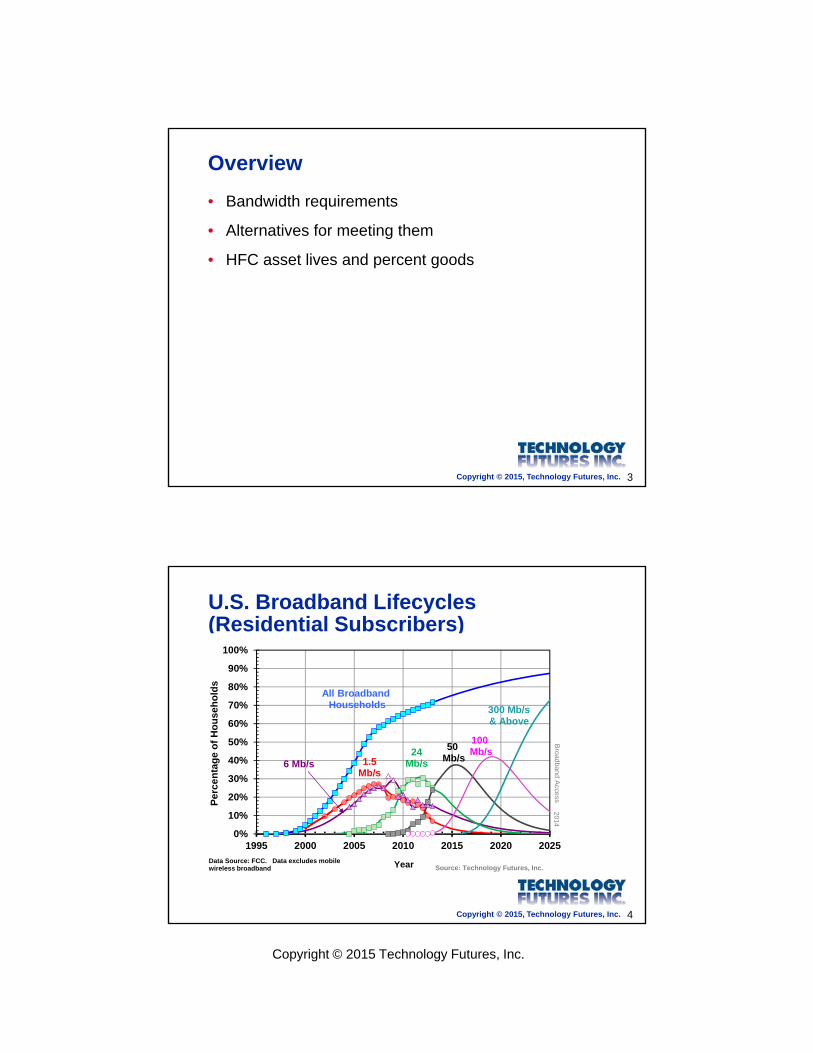
U.S. Broadband Lifecycles (Residential Subscribers)
80%
90%
100%
s
20%
30%
40%
50%
60%
70%
80%
Per
cen
tag
e o
f H
ou
seh
old
s
1.5Mb/s
6 Mb/s24
Mb/s
50 Mb/s
All BroadbandHouseholds
Broadband A
ccess
100Mb/s
300 Mb/s& Above
Copyright © 2015, Technology Futures, Inc. 4
0%
10%
1995 2000 2005 2010 2015 2020 2025
P
Year Source: Technology Futures, Inc.
2014
Data Source: FCC. Data excludes mobile wireless broadband
Copyright © 2015 Technology Futures, Inc.
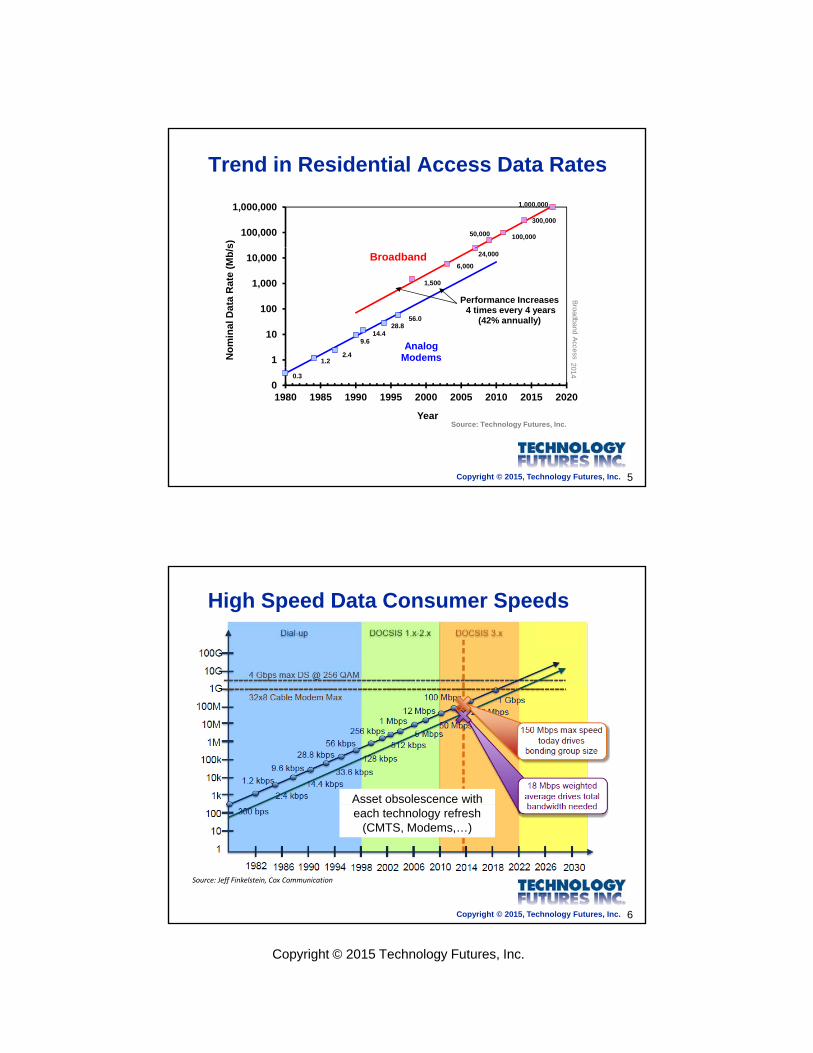
Trend in Residential Access Data Rates
50,000 100,000
300,000
1,000,000
100,000
1,000,000
s)
1.22.4
9.614.4
28.856.0
1,500
6,000
24,000
1
10
100
1,000
10,000
No
min
al D
ata
Ra
te (
Mb
/s
AnalogModems
Broadband
Performance Increases4 times every 4 years
(42% annually)
20B
roadband Access
Copyright © 2015, Technology Futures, Inc. 5
0.3
01980 1985 1990 1995 2000 2005 2010 2015 2020
YearSource: Technology Futures, Inc.
014
High Speed Data Consumer Speeds
Asset obsolescence with
Copyright © 2015, Technology Futures, Inc. 6
Source: Jeff Finkelstein, Cox Communication
each technology refresh (CMTS, Modems,…)
Copyright © 2015 Technology Futures, Inc.
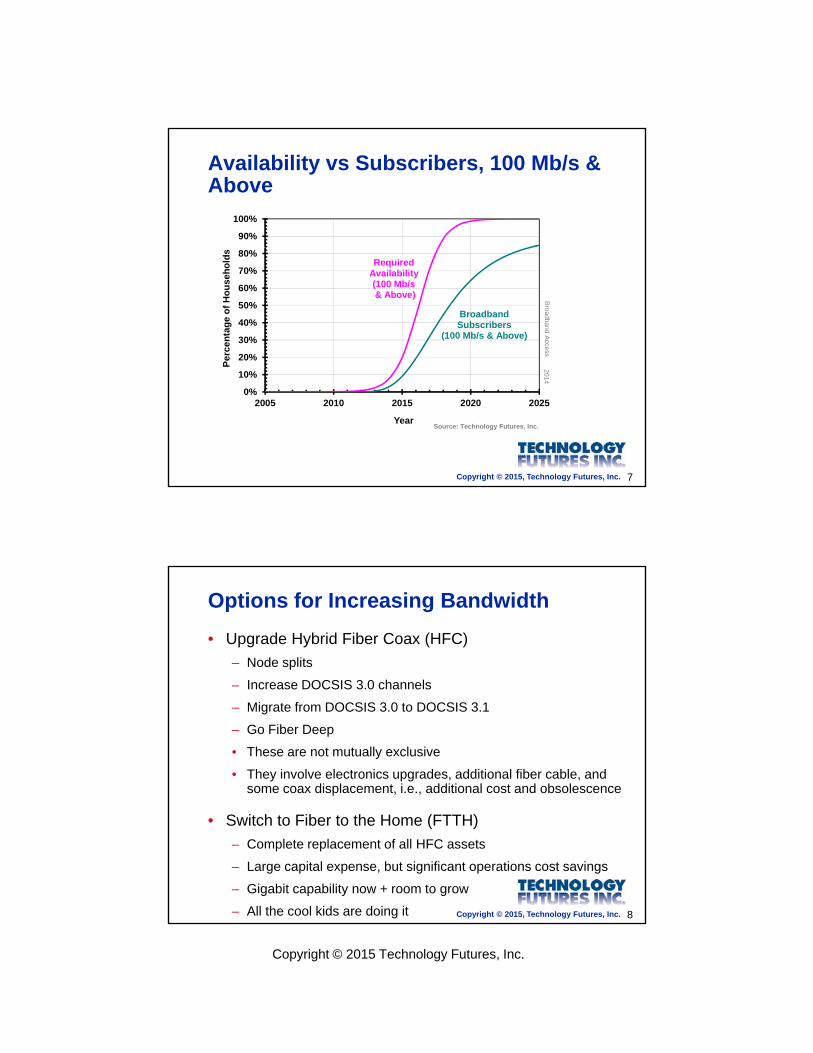
Availability vs Subscribers, 100 Mb/s & Above
90%
100%
20%
30%
40%
50%
60%
70%
80%
Pe
rce
nta
ge
of
Ho
use
ho
lds
RequiredAvailability(100 Mb/s& Above)
BroadbandSubscribers
(100 Mb/s & Above)
Broadband A
ccess
Copyright © 2015, Technology Futures, Inc. 7
0%
10%
2005 2010 2015 2020 2025
YearSource: Technology Futures, Inc.
2014
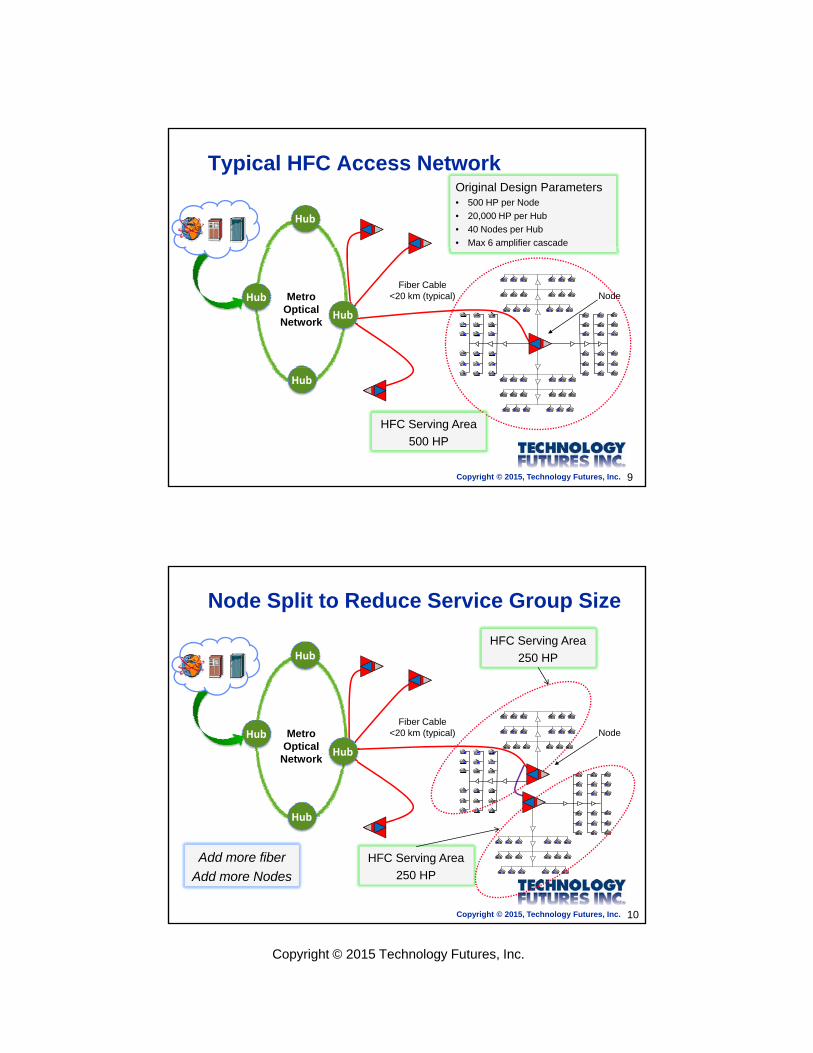
Options for Increasing Bandwidth
• Upgrade Hybrid Fiber Coax (HFC)
– Node splits
Increase DOCSIS 3 0 channels– Increase DOCSIS 3.0 channels
– Migrate from DOCSIS 3.0 to DOCSIS 3.1
– Go Fiber Deep
• These are not mutually exclusive
• They involve electronics upgrades, additional fiber cable, and some coax displacement, i.e., additional cost and obsolescence
Copyright © 2015, Technology Futures, Inc. 8
• Switch to Fiber to the Home (FTTH)
– Complete replacement of all HFC assets
– Large capital expense, but significant operations cost savings
– Gigabit capability now + room to grow
– All the cool kids are doing it
Copyright © 2015 Technology Futures, Inc.
Typical HFC Access NetworkOriginal Design Parameters• 500 HP per Node
• 20,000 HP per Hub
• 40 Nodes per Hub
• Max 6 amplifier cascade
Hub
Fiber Cable<20 km (typical) NodeMetro
Optical Network
Hub
Hub
Copyright © 2015, Technology Futures, Inc. 9
HFC Serving Area
500 HP
Hub
Node Split to Reduce Service Group Size
HFC Serving Area
250 HPHub
Fiber Cable<20 km (typical) NodeMetro
Optical Network
Hub
Hub
Copyright © 2015, Technology Futures, Inc. 10
HFC Serving Area
250 HP
Hub
Add more fiber
Add more Nodes
Copyright © 2015 Technology Futures, Inc.
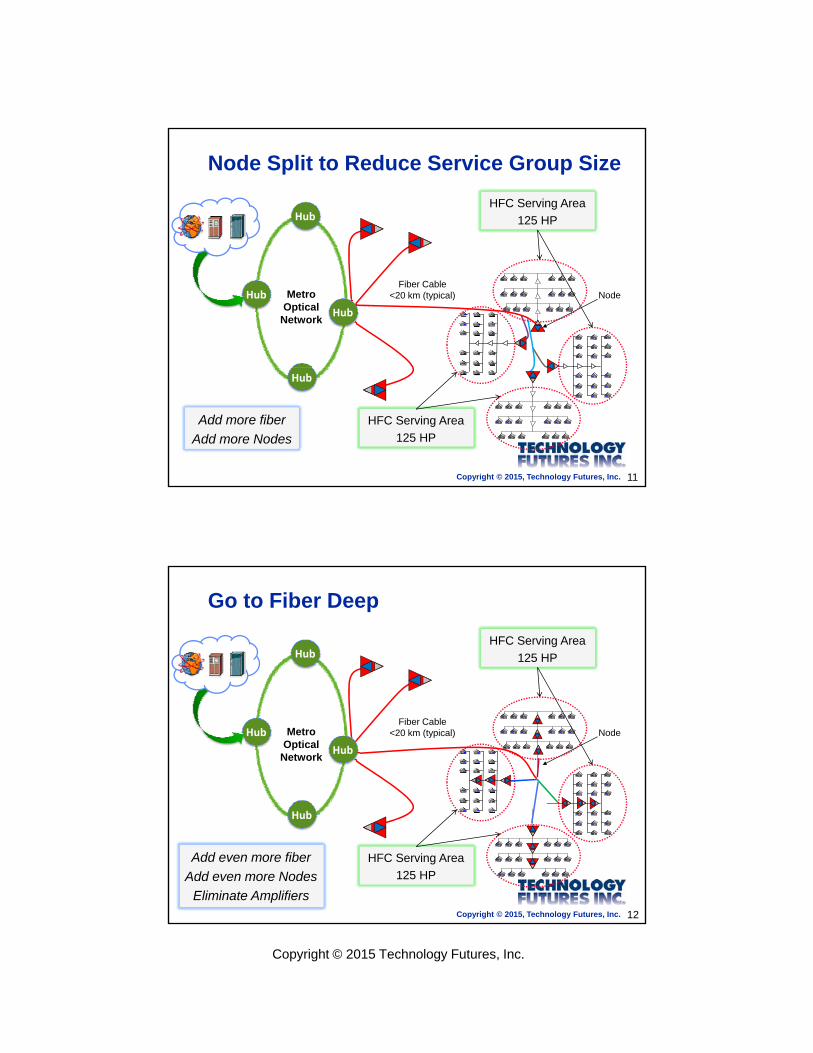
Node Split to Reduce Service Group Size
HFC Serving Area
125 HPHub
Fiber Cable<20 km (typical) NodeMetro
Optical Network
Hub
Hub
Copyright © 2015, Technology Futures, Inc. 11
Hub
HFC Serving Area
125 HP
Add more fiber
Add more Nodes
Go to Fiber Deep
HFC Serving Area
125 HPHub
Fiber Cable<20 km (typical) NodeMetro
Optical Network
Hub
Hub
Copyright © 2015, Technology Futures, Inc. 12
Hub
HFC Serving Area
125 HP
Add even more fiber
Add even more Nodes
Eliminate Amplifiers
Copyright © 2015 Technology Futures, Inc.
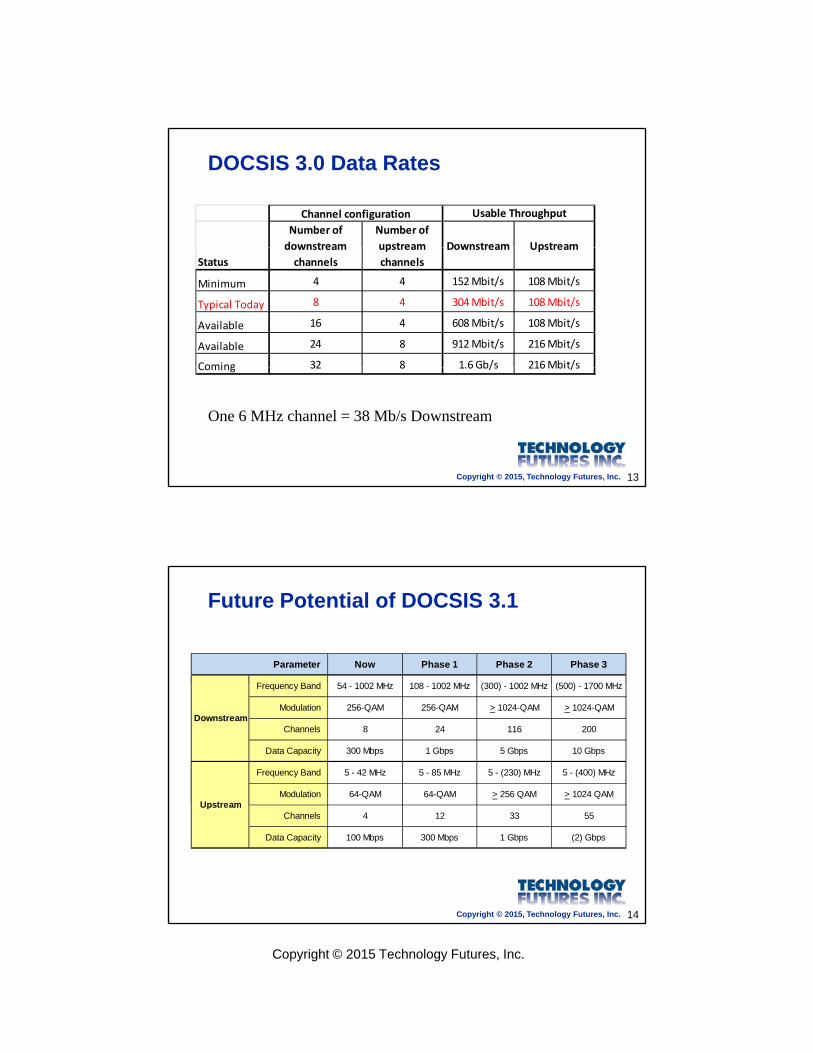
DOCSIS 3.0 Data Rates
Number of
downstream
Number of
upstream Downstream Upstream
Channel configuration Usable Throughput
Status
downstream
channels
upstream
channels
Downstream Upstream
Minimum 4 4 152 Mbit/s 108 Mbit/s
Typical Today 8 4 304 Mbit/s 108 Mbit/s
Available 16 4 608 Mbit/s 108 Mbit/s
Available 24 8 912 Mbit/s 216 Mbit/s
Coming 32 8 1.6Gb/s 216Mbit/s
Copyright © 2015, Technology Futures, Inc. 13
Coming 32 8 1.6 Gb/s 216 Mbit/s
One 6 MHz channel = 38 Mb/s Downstream
Future Potential of DOCSIS 3.1
Now Phase 1 Phase 2 Phase 3
Frequency Band 54 1002 MHz 108 1002 MHz (300) 1002 MHz (500) 1700 MHz
Parameter
Frequency Band 54 - 1002 MHz 108 - 1002 MHz (300) - 1002 MHz (500) - 1700 MHz
Modulation 256-QAM 256-QAM > 1024-QAM > 1024-QAM
Channels 8 24 116 200
Data Capacity 300 Mbps 1 Gbps 5 Gbps 10 Gbps
Frequency Band 5 - 42 MHz 5 - 85 MHz 5 - (230) MHz 5 - (400) MHz
Modulation 64-QAM 64-QAM > 256 QAM > 1024 QAM
Downstream
Upstream
Copyright © 2015, Technology Futures, Inc. 14
Channels 4 12 33 55
Data Capacity 100 Mbps 300 Mbps 1 Gbps (2) Gbps
Upstream
Copyright © 2015 Technology Futures, Inc.
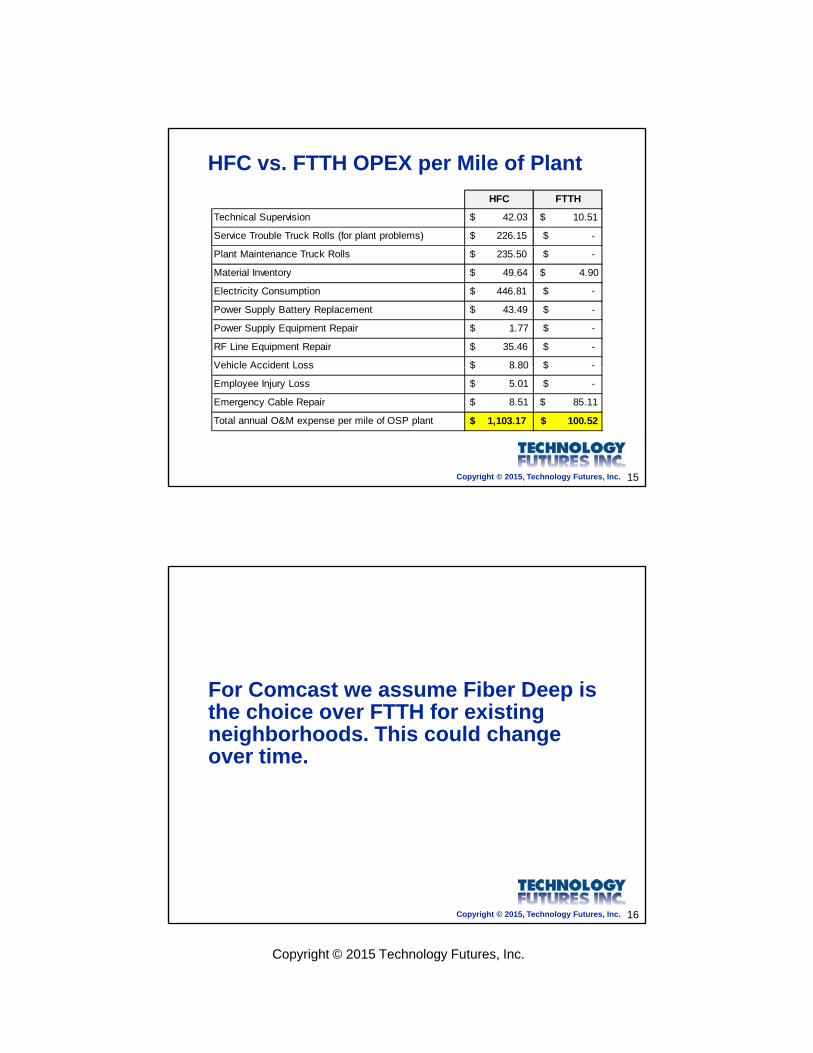
HFC vs. FTTH OPEX per Mile of Plant
HFC FTTH
Technical Supervision $ 42.03 $ 10.51
Service Trouble Truck Rolls (for plant problems) $ 226.15 $ -
Plant Maintenance Truck Rolls $ 235.50 $ -
Material Inventory $ 49.64 $ 4.90
Electricity Consumption $ 446.81 $ -
Power Supply Battery Replacement $ 43.49 $ -
Power Supply Equipment Repair $ 1.77 $ -
RF Line Equipment Repair $ 35.46 $ -
Vehicle Accident Loss $ 8 80 $ -
Copyright © 2015, Technology Futures, Inc. 15
Vehicle Accident Loss $ 8.80 $
Employee Injury Loss $ 5.01 $ -
Emergency Cable Repair $ 8.51 $ 85.11
Total annual O&M expense per mile of OSP plant $ 1,103.17 $ 100.52
F C t Fib D iFor Comcast we assume Fiber Deep is the choice over FTTH for existing neighborhoods. This could change over time.
Copyright © 2015, Technology Futures, Inc. 16
Copyright © 2015 Technology Futures, Inc.
Estimating HFC Asset Livesand Percent Goods• Technology Substitution
• Physical MortalityPhysical Mortality
• Technology Obsolescence
• Cost Index (Trend Factor)
Copyright © 2015, Technology Futures, Inc. 17
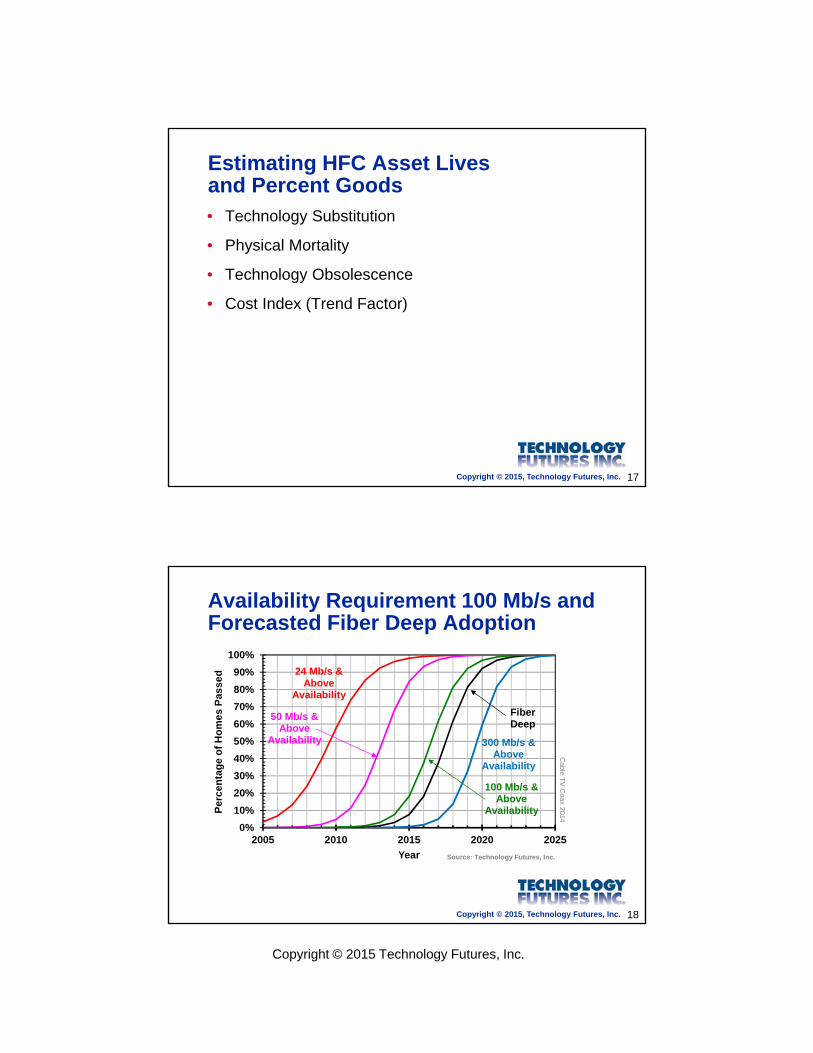
Availability Requirement 100 Mb/s and Forecasted Fiber Deep Adoption
90%
100%
se
d 24 Mb/s & Above
20%
30%
40%
50%
60%
70%
80%
erc
en
tag
e o
f H
om
es
Pas
s
Fiber Deep
Above Availability
Cable T
V C
oax
100 Mb/s & Above
50 Mb/s & Above
Availability 300 Mb/s & Above
Availability
Copyright © 2015, Technology Futures, Inc. 18
0%
10%
2005 2010 2015 2020 2025
Pe
Year Source: Technology Futures, Inc.
2014
Availability
Copyright © 2015 Technology Futures, Inc.
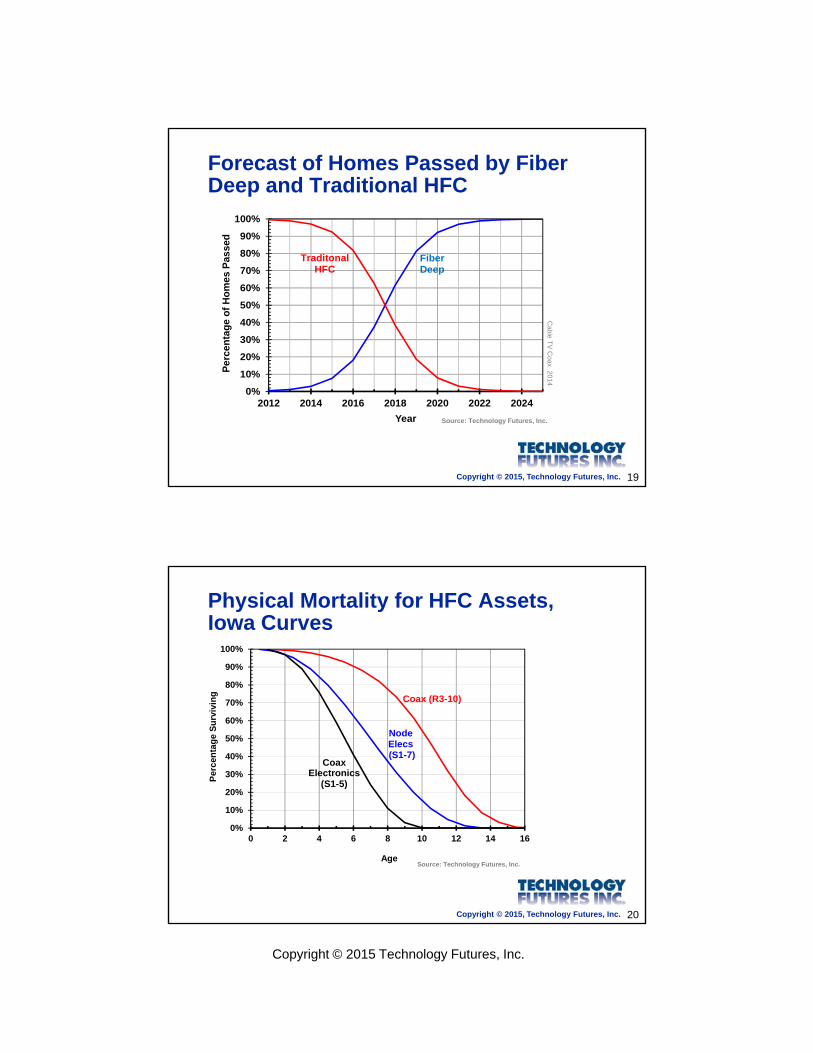
Forecast of Homes Passed by Fiber Deep and Traditional HFC
90%
100%se
d
20%
30%
40%
50%
60%
70%
80%
Per
cen
tag
e o
f H
om
es P
ass
Fiber Deep
TraditonalHFC
Cable T
V C
oax
Copyright © 2015, Technology Futures, Inc. 19
0%
10%
2012 2014 2016 2018 2020 2022 2024
P
Year Source: Technology Futures, Inc.
2014
Physical Mortality for HFC Assets,Iowa Curves
80%
90%
100%
20%
30%
40%
50%
60%
70%
80%
Per
cen
tag
e S
urv
ivin
g Coax (R3-10)
CoaxElectronics
(S1-5)
Node Elecs(S1-7)
Copyright © 2015, Technology Futures, Inc. 20
0%
10%
0 2 4 6 8 10 12 14 16
AgeSource: Technology Futures, Inc.
Copyright © 2015 Technology Futures, Inc.
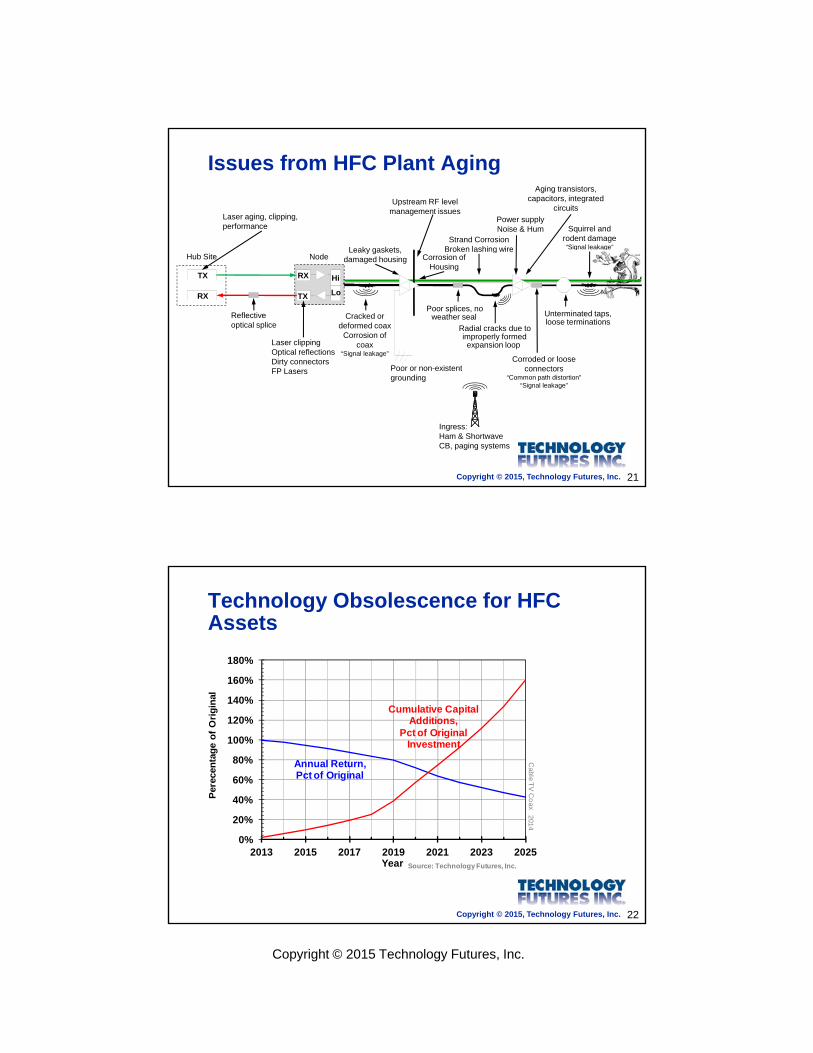
Issues from HFC Plant Aging
L k k t
Upstream RF level management issues
Power supply Noise & Hum
Strand CorrosionBroken lashing ire
Aging transistors, capacitors, integrated
circuits
Squirrel and rodent damage“Signal leakage”
Laser aging, clipping, performance
TX
RX TX
RX Hi
Lo
Hub Site
Cracked or deformed coax
Corrosion of coax
“Signal leakage”
Poor or non existent
Leaky gaskets, damaged housing
Poor splices, noweather seal
Radial cracks due toimproperly formedexpansion loop
Corroded or loose connectors
Unterminated taps,loose terminations
Reflective optical splice
Broken lashing wireCorrosion of
Housing
Laser clippingOptical reflectionsDirty connectors
Signal leakage
Node
Copyright © 2015, Technology Futures, Inc. 21
Poor or non-existentgrounding
connectors“Common path distortion”
“Signal leakage”
Ingress:Ham & ShortwaveCB, paging systems
FP Lasers
Technology Obsolescence for HFC Assets
160%
180%
40%
60%
80%
100%
120%
140%
Per
ecen
tag
e o
f O
rig
inal
Annual Return,Pct of Original
Cumulative Capital Additions,
Pct of Original Investment
Cable T
V C
oa
Copyright © 2015, Technology Futures, Inc. 22
0%
20%
2013 2015 2017 2019 2021 2023 2025Year Source: Technology Futures, Inc.
ax2014
Copyright © 2015 Technology Futures, Inc.
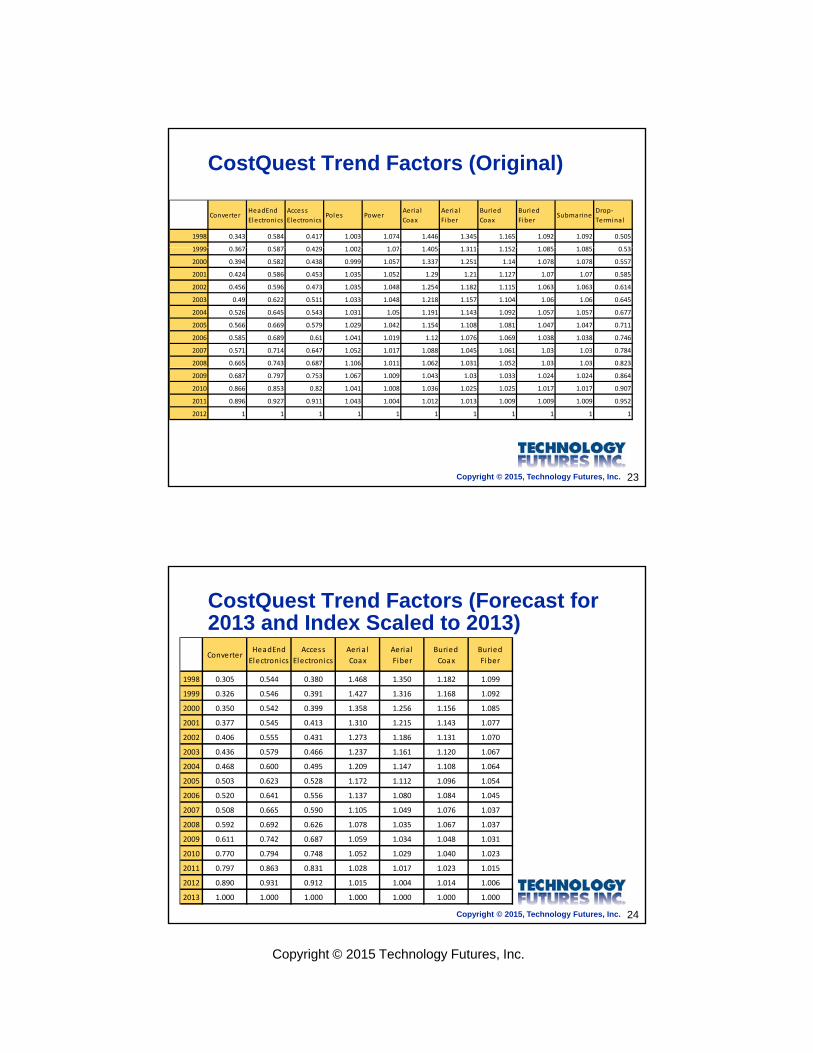
CostQuest Trend Factors (Original)
ConverterHeadEnd
Electronics
Access
ElectronicsPoles Power
Aeria l
Coax
Aeria l
Fiber
Buried
Coax
Buried
FiberSubmarine
Drop‐
Termina l
1998 0.343 0.584 0.417 1.003 1.074 1.446 1.345 1.165 1.092 1.092 0.505
1999 0 367 0 587 0 429 1 002 1 07 1 405 1 311 1 152 1 085 1 085 0 531999 0.367 0.587 0.429 1.002 1.07 1.405 1.311 1.152 1.085 1.085 0.53
2000 0.394 0.582 0.438 0.999 1.057 1.337 1.251 1.14 1.078 1.078 0.557
2001 0.424 0.586 0.453 1.035 1.052 1.29 1.21 1.127 1.07 1.07 0.585
2002 0.456 0.596 0.473 1.035 1.048 1.254 1.182 1.115 1.063 1.063 0.614
2003 0.49 0.622 0.511 1.033 1.048 1.218 1.157 1.104 1.06 1.06 0.645
2004 0.526 0.645 0.543 1.031 1.05 1.191 1.143 1.092 1.057 1.057 0.677
2005 0.566 0.669 0.579 1.029 1.042 1.154 1.108 1.081 1.047 1.047 0.711
2006 0.585 0.689 0.61 1.041 1.019 1.12 1.076 1.069 1.038 1.038 0.746
2007 0.571 0.714 0.647 1.052 1.017 1.088 1.045 1.061 1.03 1.03 0.784
2008 0.665 0.743 0.687 1.106 1.011 1.062 1.031 1.052 1.03 1.03 0.823
Copyright © 2015, Technology Futures, Inc. 23
2009 0.687 0.797 0.753 1.067 1.009 1.043 1.03 1.033 1.024 1.024 0.864
2010 0.866 0.853 0.82 1.041 1.008 1.036 1.025 1.025 1.017 1.017 0.907
2011 0.896 0.927 0.911 1.043 1.004 1.012 1.013 1.009 1.009 1.009 0.952
2012 1 1 1 1 1 1 1 1 1 1 1
CostQuest Trend Factors (Forecast for 2013 and Index Scaled to 2013)Converter
HeadEnd
Electronics
Access
Electronics
Aeria l
Coax
Aeria l
Fiber
Buried
Coax
Buried
Fiber
1998 0.305 0.544 0.380 1.468 1.350 1.182 1.099
1999 0.326 0.546 0.391 1.427 1.316 1.168 1.092
2000 0.350 0.542 0.399 1.358 1.256 1.156 1.085
2001 0.377 0.545 0.413 1.310 1.215 1.143 1.077
2002 0.406 0.555 0.431 1.273 1.186 1.131 1.070
2003 0.436 0.579 0.466 1.237 1.161 1.120 1.067
2004 0.468 0.600 0.495 1.209 1.147 1.108 1.064
2005 0.503 0.623 0.528 1.172 1.112 1.096 1.054
2006 0.520 0.641 0.556 1.137 1.080 1.084 1.045
Copyright © 2015, Technology Futures, Inc. 24
2007 0.508 0.665 0.590 1.105 1.049 1.076 1.037
2008 0.592 0.692 0.626 1.078 1.035 1.067 1.037
2009 0.611 0.742 0.687 1.059 1.034 1.048 1.031
2010 0.770 0.794 0.748 1.052 1.029 1.040 1.023
2011 0.797 0.863 0.831 1.028 1.017 1.023 1.015
2012 0.890 0.931 0.912 1.015 1.004 1.014 1.006
2013 1.000 1.000 1.000 1.000 1.000 1.000 1.000
Copyright © 2015 Technology Futures, Inc.
Li d P t G d f HFCLives and Percent Good for HFC Electronics
Copyright © 2015, Technology Futures, Inc. 25
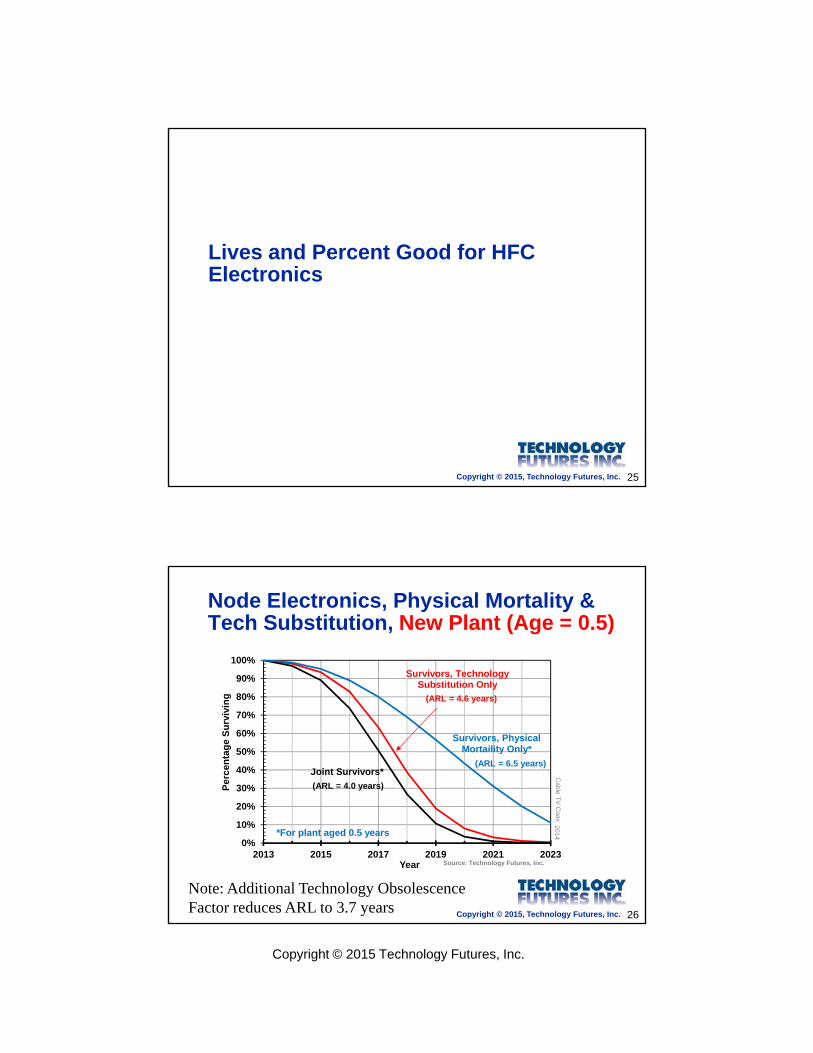
Node Electronics, Physical Mortality &Tech Substitution, New Plant (Age = 0.5)
90%
100%
Survivors, Technology Substitution Only
20%
30%
40%
50%
60%
70%
80%
Per
cen
tag
e S
urv
ivin
g
Joint Survivors*
Substitution Only
Survivors, Physical Mortaility Only*
Cab
le TV
(ARL = 6.5 years)
(ARL = 4.0 years)
(ARL = 4.6 years)
Copyright © 2015, Technology Futures, Inc. 26
0%
10%
20%
2013 2015 2017 2019 2021 2023Year Source: Technology Futures, Inc.
Coax
2014*For plant aged 0.5 years
Note: Additional Technology ObsolescenceFactor reduces ARL to 3.7 years
Copyright © 2015 Technology Futures, Inc.
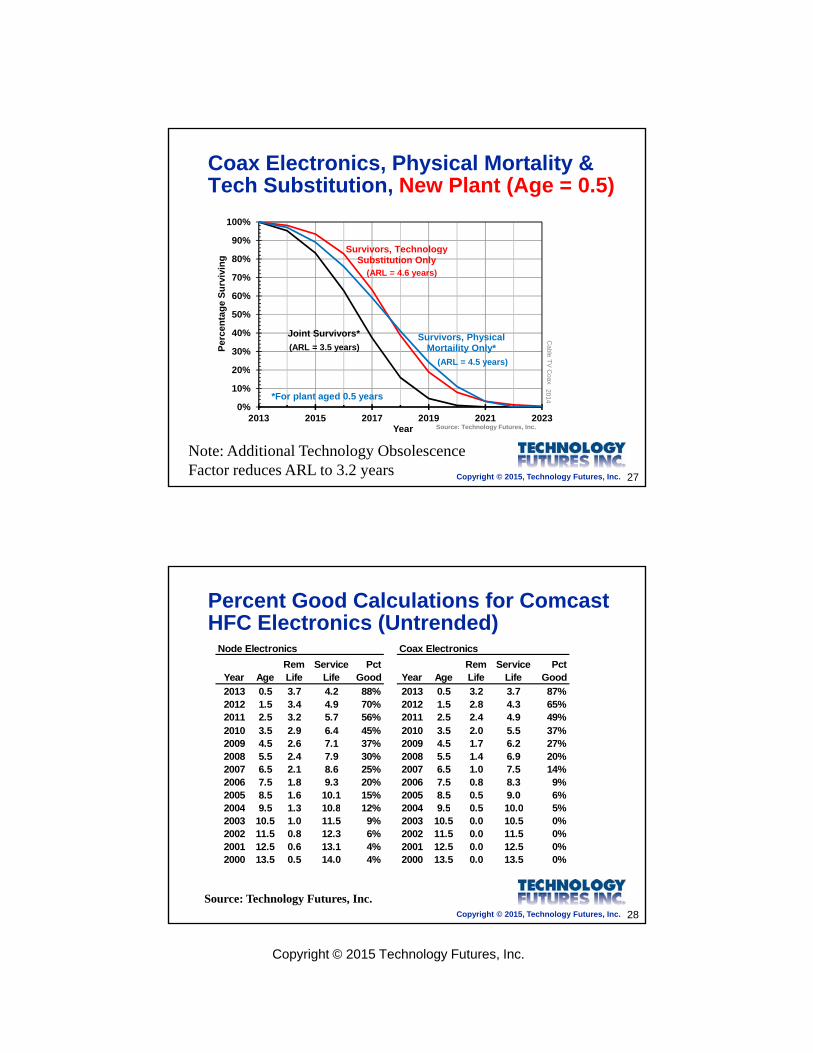
Coax Electronics, Physical Mortality &Tech Substitution, New Plant (Age = 0.5)
90%
100%
Survivors Technology
20%
30%
40%
50%
60%
70%
80%
Per
cen
tag
e S
urv
ivin
g
Joint Survivors*
Survivors, Technology Substitution Only
Survivors, Physical Mortaility Only*
Cable T
V(ARL = 4.5 years)
(ARL = 3.5 years)
(ARL = 4.6 years)
Copyright © 2015, Technology Futures, Inc. 27
0%
10%
20%
2013 2015 2017 2019 2021 2023Year Source: Technology Futures, Inc.
V C
oax2014*For plant aged 0.5 years
Note: Additional Technology ObsolescenceFactor reduces ARL to 3.2 years
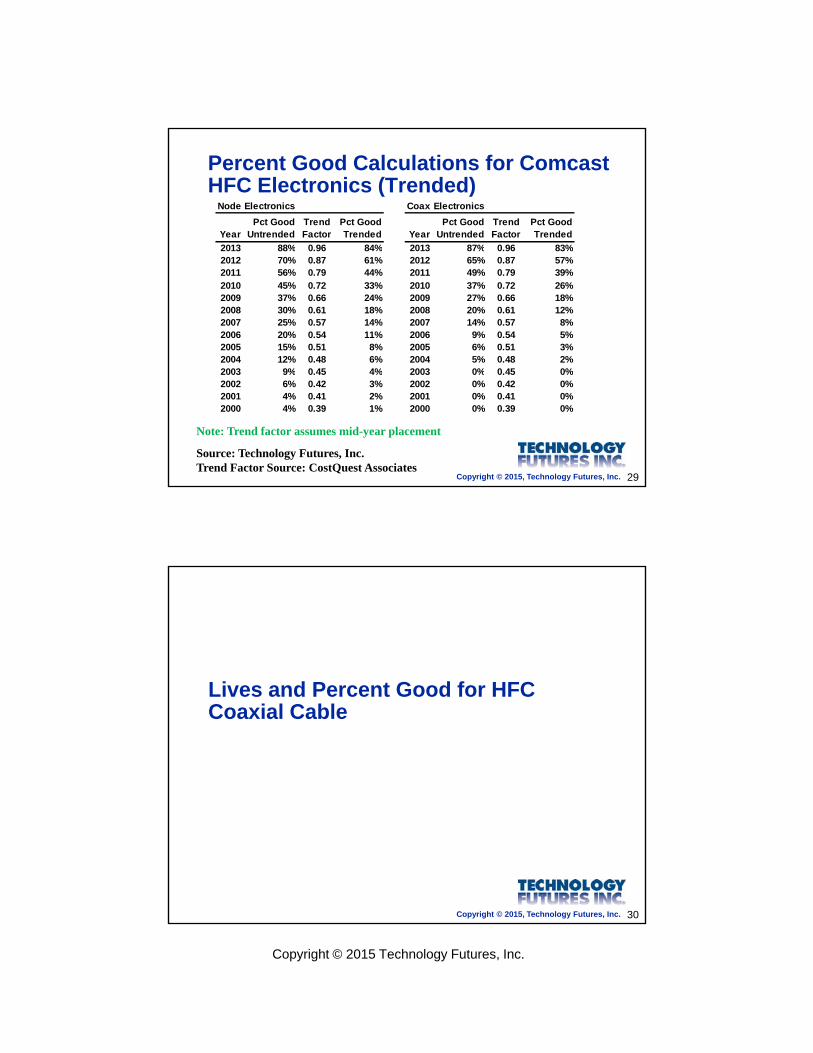
Percent Good Calculations for Comcast HFC Electronics (Untrended) Node Electronics Coax Electronics
Year AgeRem Life
Service Life
Pct Good Year Age
Rem Life
Service Life
Pct Good
2013 0.5 3.7 4.2 88% 2013 0.5 3.2 3.7 87%2012 1.5 3.4 4.9 70% 2012 1.5 2.8 4.3 65%2011 2.5 3.2 5.7 56% 2011 2.5 2.4 4.9 49%2010 3.5 2.9 6.4 45% 2010 3.5 2.0 5.5 37%2009 4.5 2.6 7.1 37% 2009 4.5 1.7 6.2 27%2008 5.5 2.4 7.9 30% 2008 5.5 1.4 6.9 20%2007 6.5 2.1 8.6 25% 2007 6.5 1.0 7.5 14%2006 7.5 1.8 9.3 20% 2006 7.5 0.8 8.3 9%2005 8.5 1.6 10.1 15% 2005 8.5 0.5 9.0 6%2004 9 5 1 3 10 8 12% 2004 9 5 0 5 10 0 5%
Copyright © 2015, Technology Futures, Inc. 28
2004 9.5 1.3 10.8 12% 2004 9.5 0.5 10.0 5%2003 10.5 1.0 11.5 9% 2003 10.5 0.0 10.5 0%2002 11.5 0.8 12.3 6% 2002 11.5 0.0 11.5 0%2001 12.5 0.6 13.1 4% 2001 12.5 0.0 12.5 0%2000 13.5 0.5 14.0 4% 2000 13.5 0.0 13.5 0%
Source: Technology Futures, Inc.
Copyright © 2015 Technology Futures, Inc.
Percent Good Calculations for Comcast HFC Electronics (Trended)
Node Electronics Coax Electronics
YearPct Good
UntrendedTrend Factor
Pct Good Trended Year
Pct Good Untrended
Trend Factor
Pct Good Trended
2013 88% 0 96 84% 2013 87% 0 96 83%2013 88% 0.96 84% 2013 87% 0.96 83%2012 70% 0.87 61% 2012 65% 0.87 57%2011 56% 0.79 44% 2011 49% 0.79 39%2010 45% 0.72 33% 2010 37% 0.72 26%2009 37% 0.66 24% 2009 27% 0.66 18%2008 30% 0.61 18% 2008 20% 0.61 12%2007 25% 0.57 14% 2007 14% 0.57 8%2006 20% 0.54 11% 2006 9% 0.54 5%2005 15% 0.51 8% 2005 6% 0.51 3%2004 12% 0.48 6% 2004 5% 0.48 2%
Copyright © 2015, Technology Futures, Inc. 29
Source: Technology Futures, Inc.Trend Factor Source: CostQuest Associates
2003 9% 0.45 4% 2003 0% 0.45 0%2002 6% 0.42 3% 2002 0% 0.42 0%2001 4% 0.41 2% 2001 0% 0.41 0%2000 4% 0.39 1% 2000 0% 0.39 0%
Note: Trend factor assumes mid-year placement
Li d P t G d f HFCLives and Percent Good for HFC Coaxial Cable
Copyright © 2015, Technology Futures, Inc. 30
Copyright © 2015 Technology Futures, Inc.
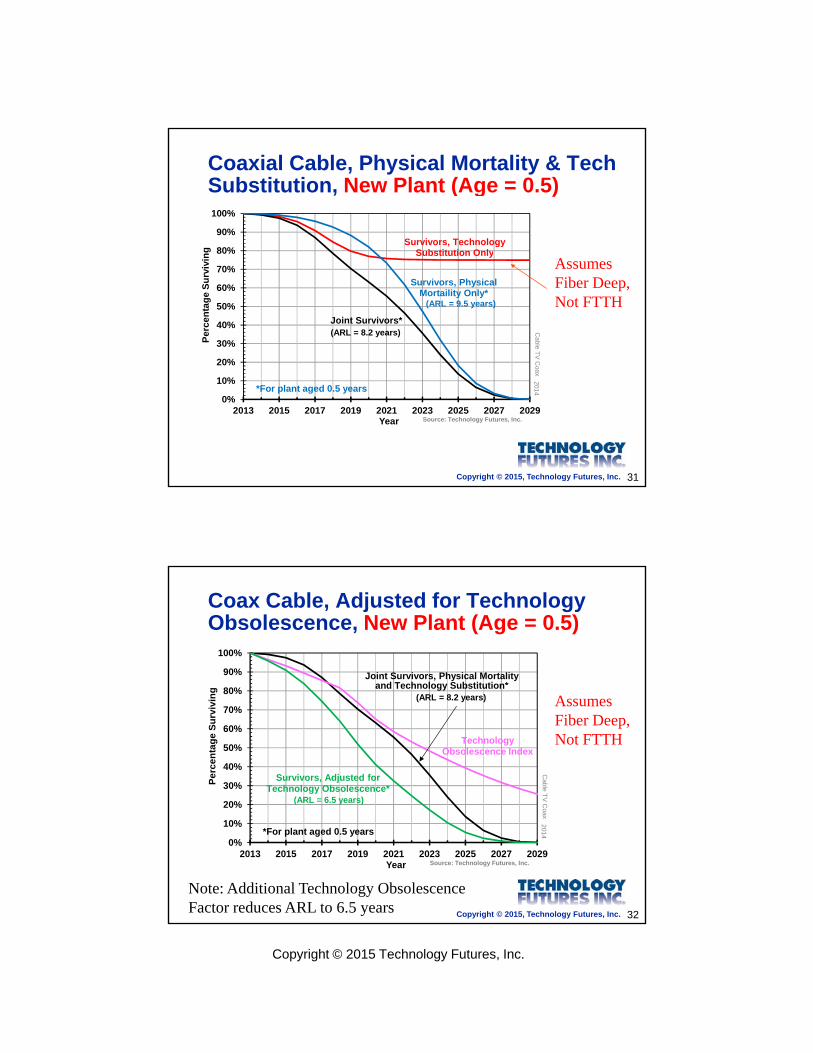
Coaxial Cable, Physical Mortality & Tech Substitution, New Plant (Age = 0.5)
80%
90%
100%
Survivors, Technology
20%
30%
40%
50%
60%
70%
80%
Per
ce
nta
ge
Su
rviv
ing
Joint Survivors*
Substitution Only
Survivors, Physical Mortaility Only*
Cable T
V C
o
(ARL = 9.5 years)
(ARL = 8.2 years)
AssumesFiber Deep,Not FTTH
Copyright © 2015, Technology Futures, Inc. 31
0%
10%
2013 2015 2017 2019 2021 2023 2025 2027 2029Year Source: Technology Futures, Inc.
oax2014*For plant aged 0.5 years
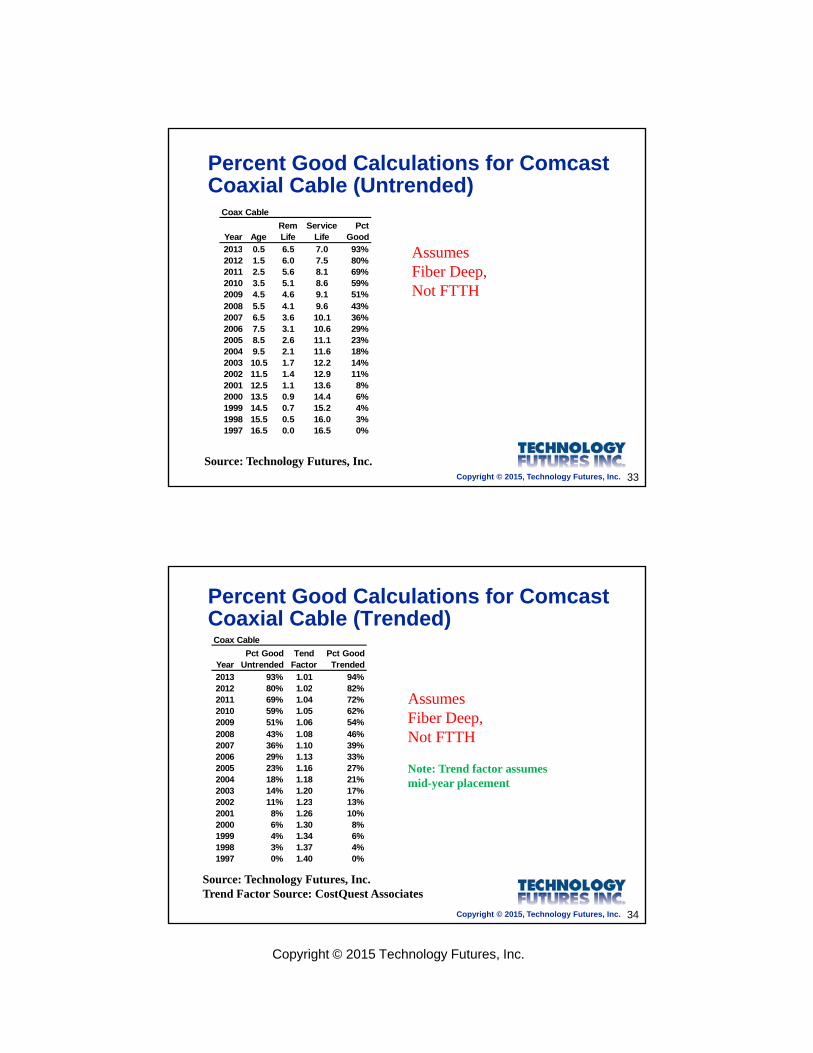
Coax Cable, Adjusted for Technology Obsolescence, New Plant (Age = 0.5)
90%
100%
Joint Survivors, Physical Mortality and Technology Substitution*
AssumesFiber Deep,Not FTTH
20%
30%
40%
50%
60%
70%
80%
Pe
rce
nta
ge
Su
rviv
ing and Technology Substitution
Technology Obsolescence Index
Survivors, Adjusted forTechnology Obsolescence*
Cab
le TV
C(ARL = 6.5 years)
(ARL = 8.2 years)
Copyright © 2015, Technology Futures, Inc. 32
Note: Additional Technology ObsolescenceFactor reduces ARL to 6.5 years
0%
10%
20%
2013 2015 2017 2019 2021 2023 2025 2027 2029Year Source: Technology Futures, Inc.
Co
ax2
014*For plant aged 0.5 years
Copyright © 2015 Technology Futures, Inc.
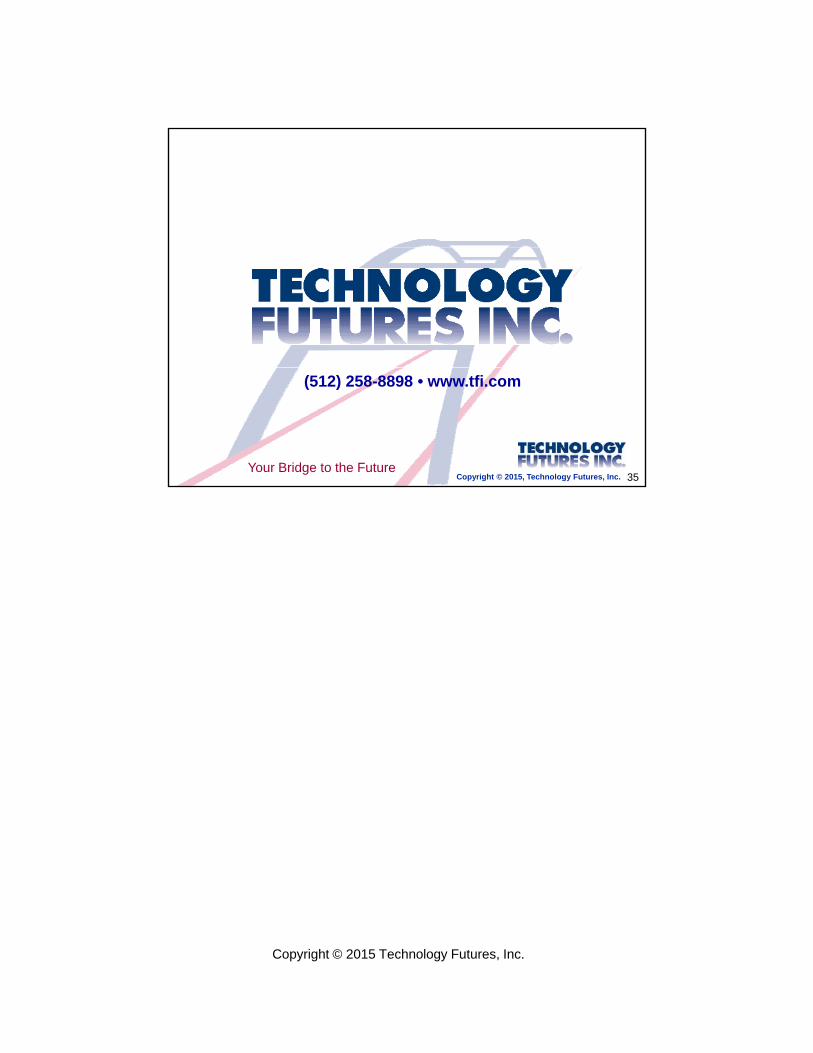
Percent Good Calculations for Comcast Coaxial Cable (Untrended)
Coax Cable
Year AgeRem Life
Service Life
Pct Good
2013 0 5 6 5 7 0 93% A2013 0.5 6.5 7.0 93%2012 1.5 6.0 7.5 80%2011 2.5 5.6 8.1 69%2010 3.5 5.1 8.6 59%2009 4.5 4.6 9.1 51%2008 5.5 4.1 9.6 43%2007 6.5 3.6 10.1 36%2006 7.5 3.1 10.6 29%2005 8.5 2.6 11.1 23%2004 9.5 2.1 11.6 18%2003 10.5 1.7 12.2 14%
AssumesFiber Deep,Not FTTH
Copyright © 2015, Technology Futures, Inc. 33
Source: Technology Futures, Inc.
2002 11.5 1.4 12.9 11%2001 12.5 1.1 13.6 8%2000 13.5 0.9 14.4 6%1999 14.5 0.7 15.2 4%1998 15.5 0.5 16.0 3%1997 16.5 0.0 16.5 0%
Percent Good Calculations for Comcast Coaxial Cable (Trended) Coax Cable
YearPct Good
UntrendedTend
FactorPct Good Trended
2013 93% 1.01 94%2012 80% 1 02 82%2012 80% 1.02 82%2011 69% 1.04 72%2010 59% 1.05 62%2009 51% 1.06 54%2008 43% 1.08 46%2007 36% 1.10 39%2006 29% 1.13 33%2005 23% 1.16 27%2004 18% 1.18 21%2003 14% 1.20 17%2002 11% 1.23 13%
AssumesFiber Deep,Not FTTH
Note: Trend factor assumes mid-year placement
Copyright © 2015, Technology Futures, Inc. 34
Source: Technology Futures, Inc.Trend Factor Source: CostQuest Associates
2002 11% 1.23 13%2001 8% 1.26 10%2000 6% 1.30 8%1999 4% 1.34 6%1998 3% 1.37 4%1997 0% 1.40 0%
Copyright © 2015 Technology Futures, Inc.
Copyright © 2015, Technology Futures, Inc. 35Your Bridge to the Future
(512) 258-8898 • www.tfi.com


![[hfc] [intern package]](https://img.pdfslide.us/doc/110x75/568c56a41a28ab4916c76493/hfc-intern-package.jpg)