Embed Size (px)
Citation preview
IMPACTS OF URBAN DESIGN AND PLANNING ON GLOBAL WARMING
08.05.2010, Air and Waste Management Southern Region 1Candace J. Watson, LEED AP
08.05.2010, Air and Waste Management Southern Region Candace J. Watson, LEED AP 2
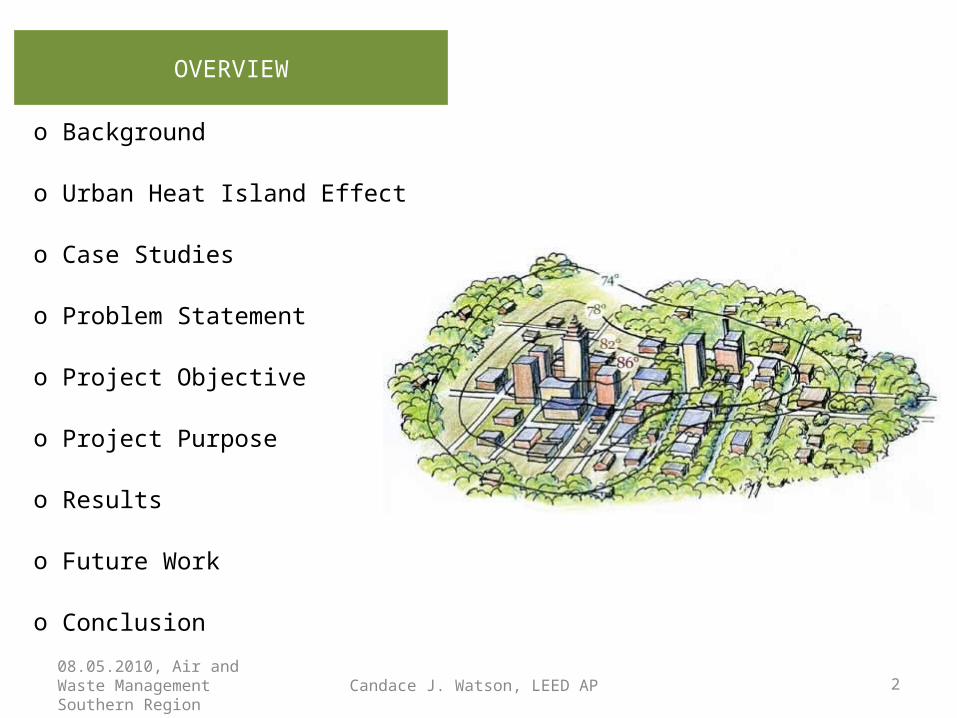
o Background
o Urban Heat Island Effect
o Case Studies
o Problem Statement
o Project Objective
o Project Purpose
o Results
o Future Work
o Conclusion
OVERVIEW
08.05.2010, Air and Waste Management Southern Region Candace J. Watson, LEED AP 3
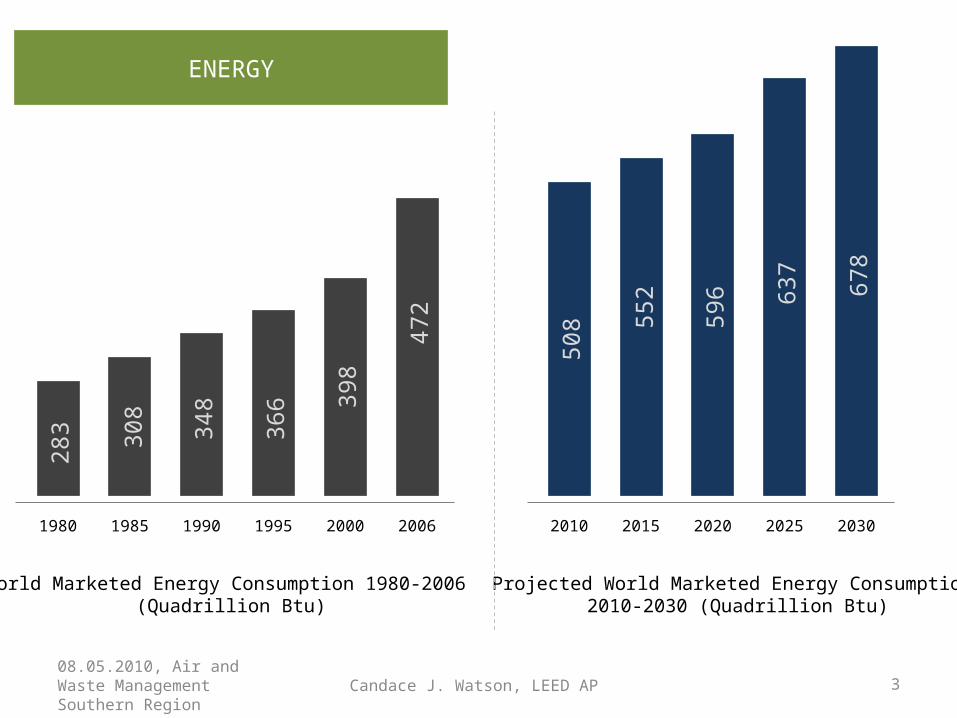
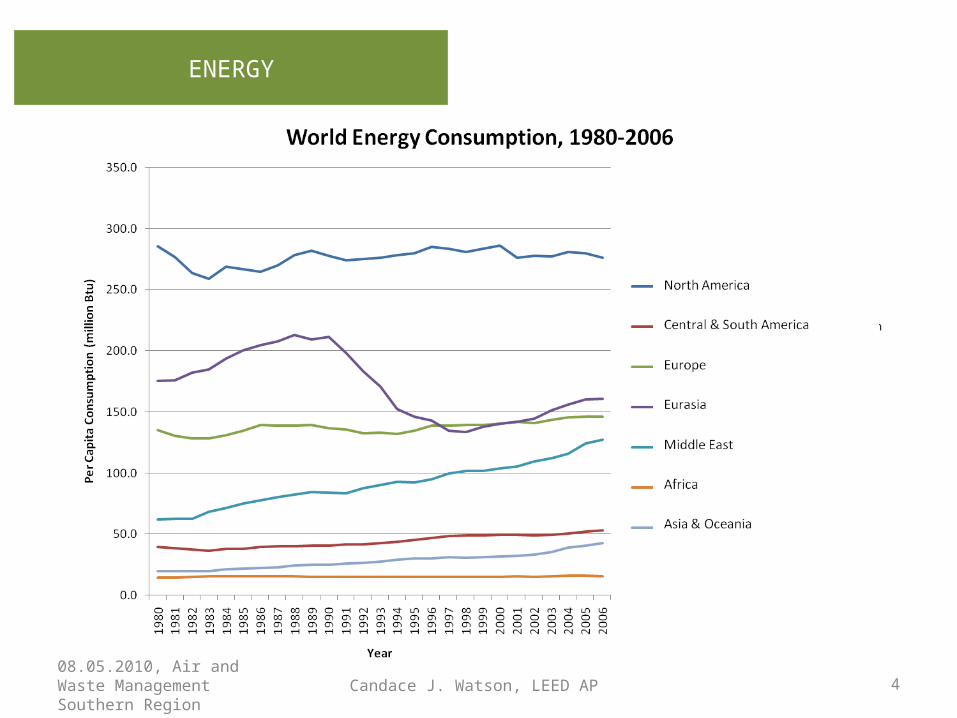
ENERGY
World Marketed Energy Consumption 1980-2006 (Quadrillion Btu)
1980 1985 1990 1995 2000 2006
283 30
8
348
366 39
8
472
Projected World Marketed Energy Consumption 2010-2030 (Quadrillion Btu)
2010 2015 2020 2025 2030
508 55
2
596 63
7
678
4
ENERGY
08.05.2010, Air and Waste Management Southern Region Candace J. Watson, LEED AP
5
ENERGY
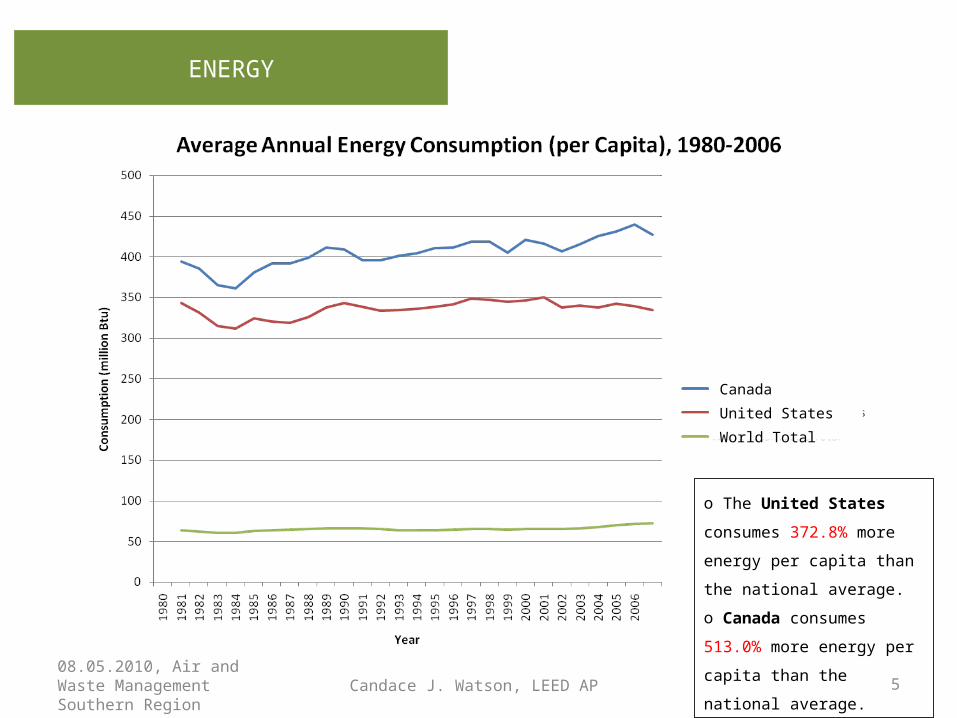
o The United States consumes
372.8% more energy per capita
than the national average.
o Canada consumes 513.0%
more energy per capita than the
national average.
Canada
United States
World Total
08.05.2010, Air and Waste Management Southern Region Candace J. Watson, LEED AP
6
ENERGY
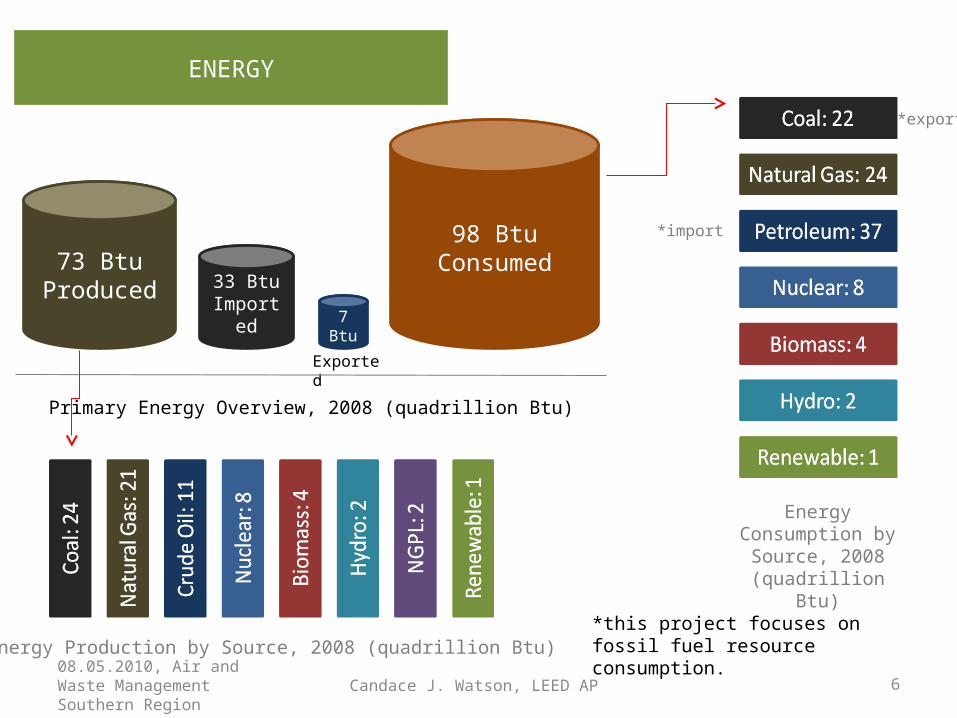
73 BtuProduced 33 Btu
Imported 7 Btu
98 Btu Consumed
Exported
Primary Energy Overview, 2008 (quadrillion Btu)
Energy Production by Source, 2008 (quadrillion Btu)
Energy Consumption by Source, 2008
(quadrillion Btu)
*this project focuses on fossil fuel resource consumption.
*export
*import
08.05.2010, Air and Waste Management Southern Region Candace J. Watson, LEED AP
ENERGY
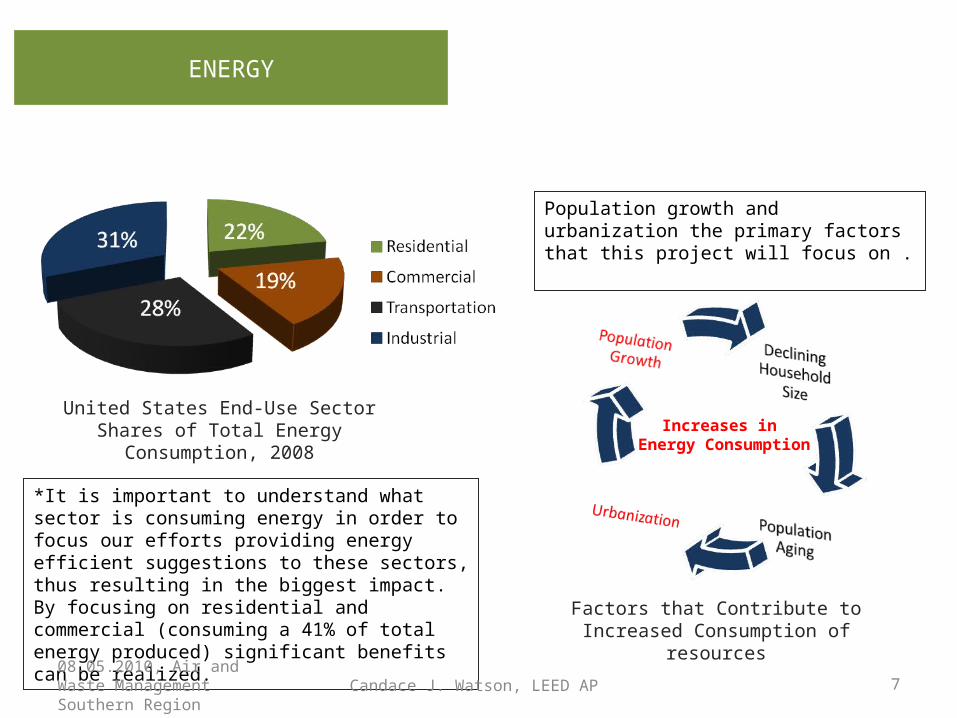
Increases in Energy Consumption
Factors that Contribute to Increased Consumption of resources
United States End-Use Sector Shares of Total Energy Consumption, 2008
*It is important to understand what sector is consuming energy in order to focus our efforts providing energy efficient suggestions to these sectors, thus resulting in the biggest impact. By focusing on residential and commercial (consuming a 41% of total energy produced) significant benefits can be realized.
Population growth and urbanization the primary factors that this project will focus on .
08.05.2010, Air and Waste Management Southern Region 7Candace J. Watson, LEED AP

8
POPULATION GROWTH
2009 2050
Country Rank Population (millions) Rank Population
(millions)
China 1 1,331 2 1,437
India 2 1,717 1 1,748
United States 3 307 3 439
Indonesia 4 243 4 343
Brazil 5 191 8 215
Pakistan 6 181 5 335
Bangladesh 7 162 7 222
Nigeria 8 153 6 285
Russia 9 142 - -
Japan 10 128 - -
Congo, Dominican Republic
- - 9 189
Philippines - - 10 150
o According to the Population
Reference Bureau, 90% of the
world’s population growth was
recorded in under-developed
countries during the 20th
century.
o It is estimated that between
2009 and 2050 under-developed
countries will see increases in
population from 5.6 billion to
8.1 billion.
o Developed countries (U.S. and
Canada) will see population
growth from 1.2 billion to 1.3
billion. 08.05.2010, Air and Waste Management Southern Region Candace J. Watson, LEED AP
9
POPULATION GROWTH
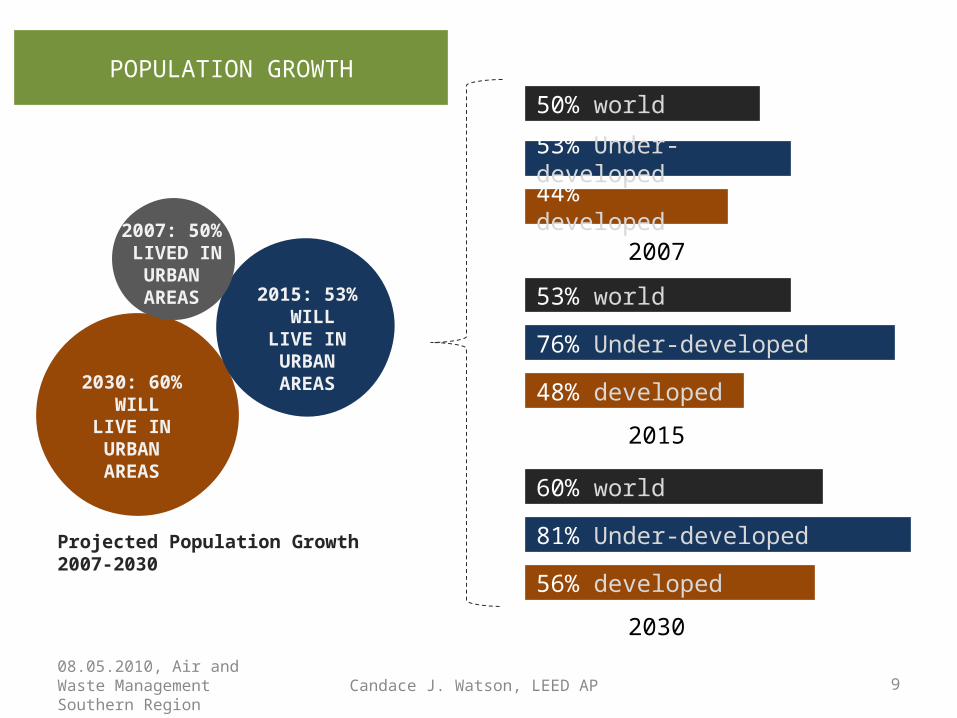
2007: 50% LIVED IN URBAN AREAS 2015: 53%
WILL LIVE IN URBAN AREAS
2030: 60% WILL LIVE IN
URBAN AREAS
Projected Population Growth 2007-2030
50% world
53% Under-developed
44% developed
76% Under-developed
53% world
48% developed
60% world
81% Under-developed
56% developed
2007
2015
2030
08.05.2010, Air and Waste Management Southern Region Candace J. Watson, LEED AP
10
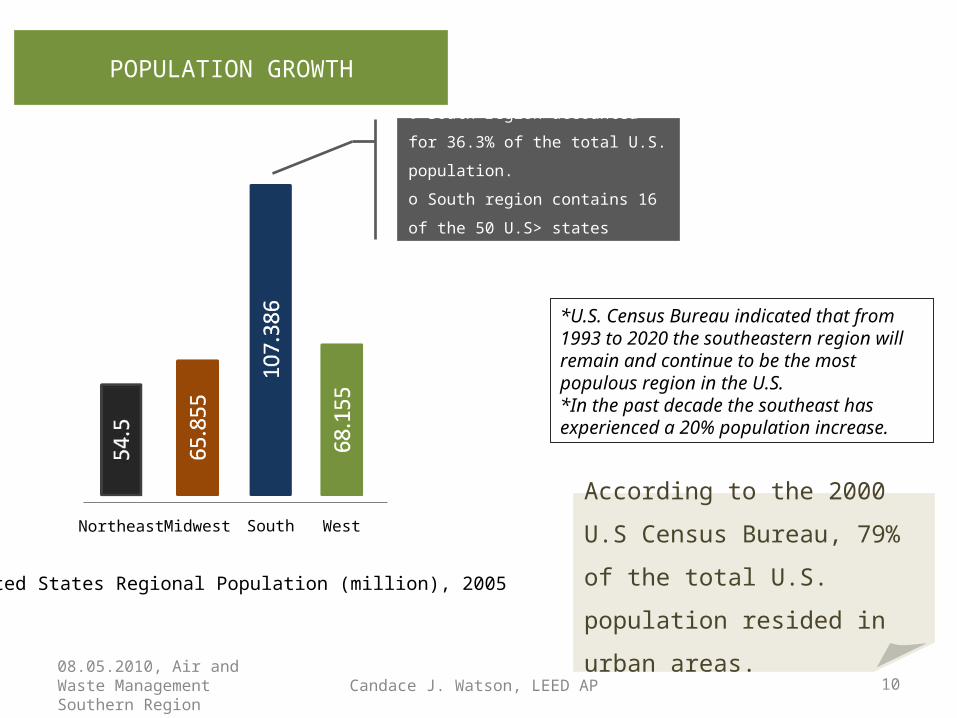
POPULATION GROWTH
United States Regional Population (million), 2005
Northeast Midwest South West
o South region accounted for 36.3% of
the total U.S. population.
o South region contains 16 of the 50
U.S> states (32% ).
According to the 2000 U.S Census
Bureau, 79% of the total U.S.
population resided in urban areas.
*U.S. Census Bureau indicated that from 1993 to 2020 the southeastern region will remain and continue to be the most populous region in the U.S. *In the past decade the southeast has experienced a 20% population increase.
08.05.2010, Air and Waste Management Southern Region Candace J. Watson, LEED AP
08.05.2010, Air and Waste Management Southern Region Candace J. Watson, LEED AP 11
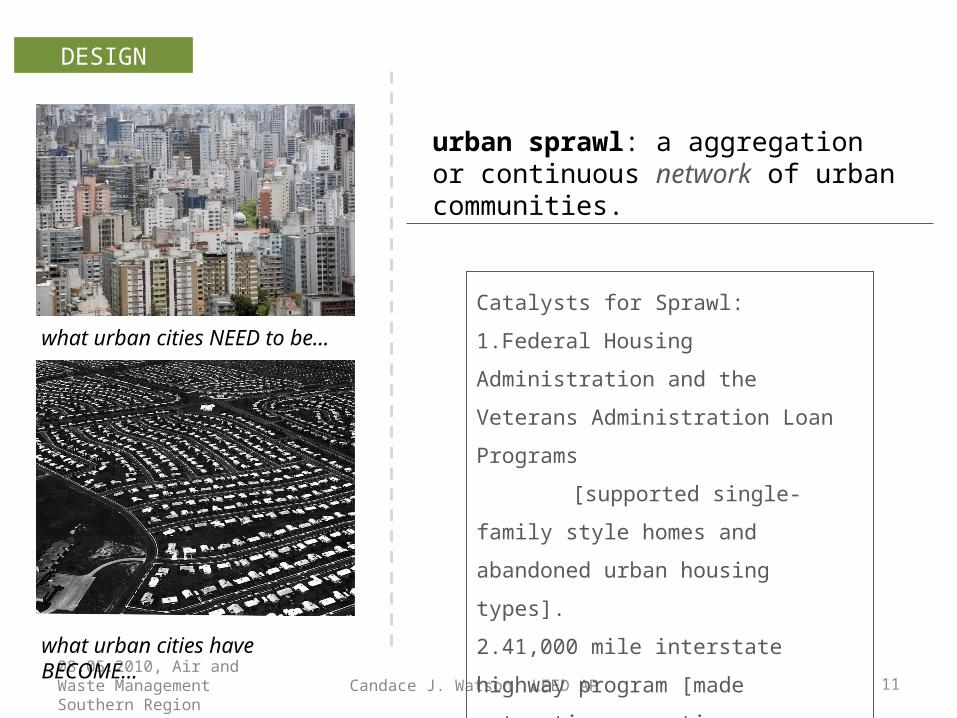
what urban cities NEED to be…
what urban cities have BECOME…
urban sprawl: a aggregation or continuous network of urban communities.
DESIGN
Catalysts for Sprawl:
1.Federal Housing Administration and the
Veterans Administration Loan Programs
[supported single-family style
homes and abandoned urban housing
types].
2.41,000 mile interstate highway program
[made automotive commuting convenient
and affordable].

08.05.2010, Air and Waste Management Southern Region Candace J. Watson, LEED AP 12
“The cities will be part of the country; I shall drive 30 miles from my office in one direction, under a pine tree; my secretary will live 30 miles away from it too, in the other direction, under another pine tree. We shall both have our own car. We shall use up tires, wear out road surfaces and gears, consume oil and gasoline. All of which will necessitate a great deal of work…enough for all.” - LeCorbusier (Architect)
DESIGN
13
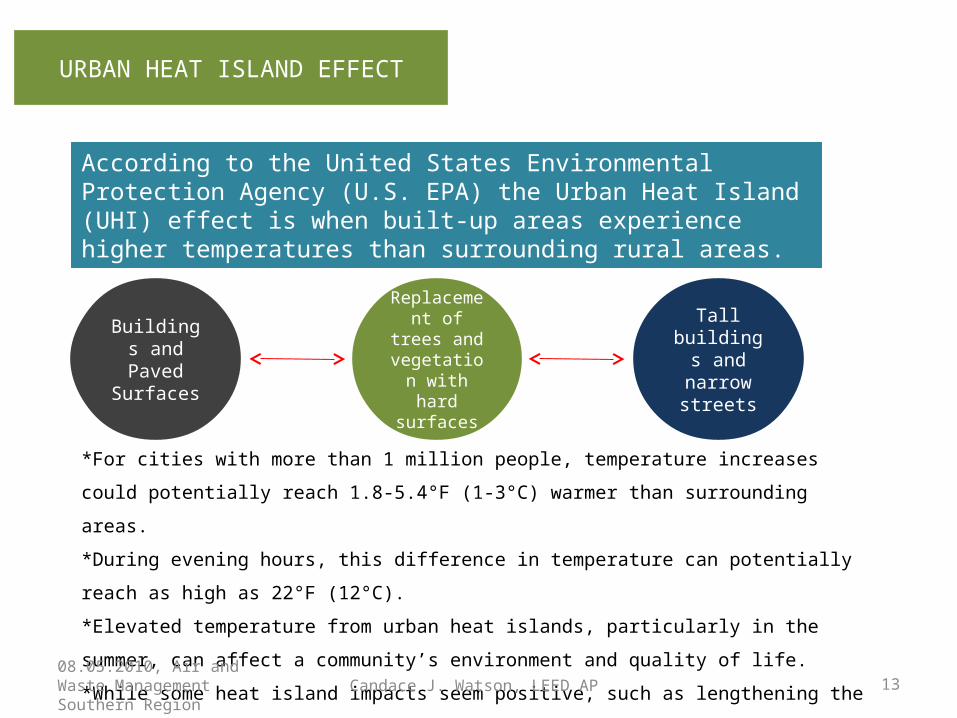
URBAN HEAT ISLAND EFFECT
According to the United States Environmental Protection Agency (U.S. EPA) the Urban Heat Island (UHI) effect is when built-up areas experience higher temperatures than surrounding rural areas.
Buildings and Paved Surfaces
Replacement of trees and vegetation with hard surfaces
Tall buildings and narrow
streets
*For cities with more than 1 million people, temperature increases could potentially reach 1.8-5.4°F (1-
3°C) warmer than surrounding areas.
*During evening hours, this difference in temperature can potentially reach as high as 22°F (12°C).
*Elevated temperature from urban heat islands, particularly in the summer, can affect a community’s
environment and quality of life.
*While some heat island impacts seem positive, such as lengthening the plant-growing season, most
impacts are negative. 08.05.2010, Air and Waste Management Southern Region Candace J. Watson, LEED AP
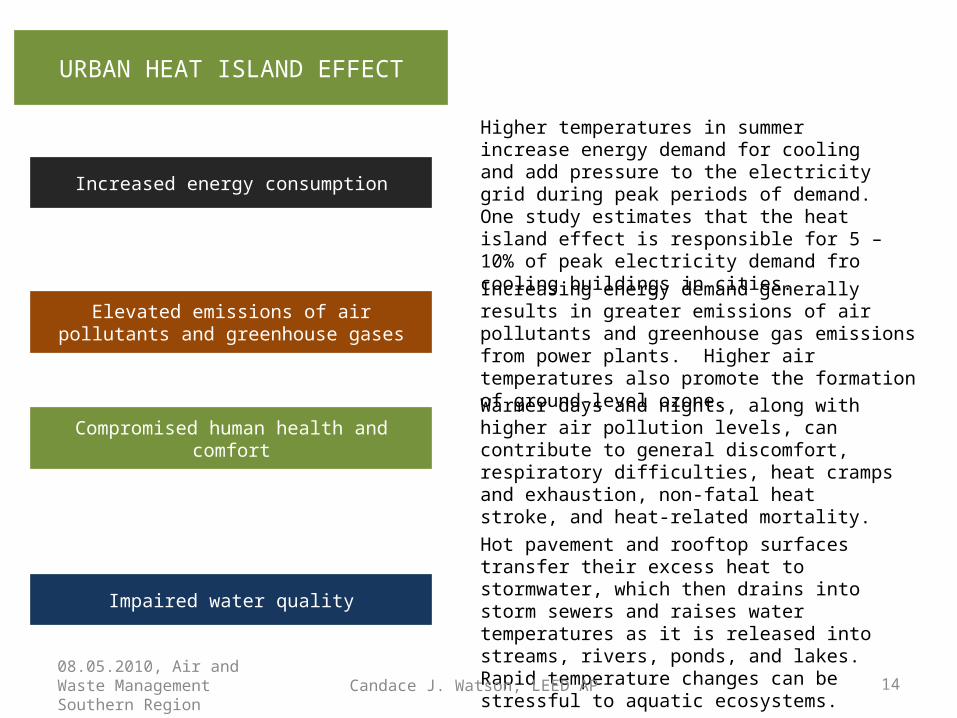
URBAN HEAT ISLAND EFFECT
Increased energy consumption
Higher temperatures in summer increase energy demand for cooling and add pressure to the electricity grid during peak periods of demand. One study estimates that the heat island effect is responsible for 5 – 10% of peak electricity demand fro cooling buildings in cities.
Elevated emissions of air pollutants and greenhouse gases
Increasing energy demand generally results in greater emissions of air pollutants and greenhouse gas emissions from power plants. Higher air temperatures also promote the formation of ground-level ozone.
Compromised human health and comfort
Warmer days and nights, along with higher air pollution levels, can contribute to general discomfort, respiratory difficulties, heat cramps and exhaustion, non-fatal heat stroke, and heat-related mortality.
Impaired water quality
Hot pavement and rooftop surfaces transfer their excess heat to stormwater, which then drains into storm sewers and raises water temperatures as it is released into streams, rivers, ponds, and lakes. Rapid temperature changes can be stressful to aquatic ecosystems.
08.05.2010, Air and Waste Management Southern Region Candace J. Watson, LEED AP 14
08.05.2010, Air and Waste Management Southern Region Candace J. Watson, LEED AP 15
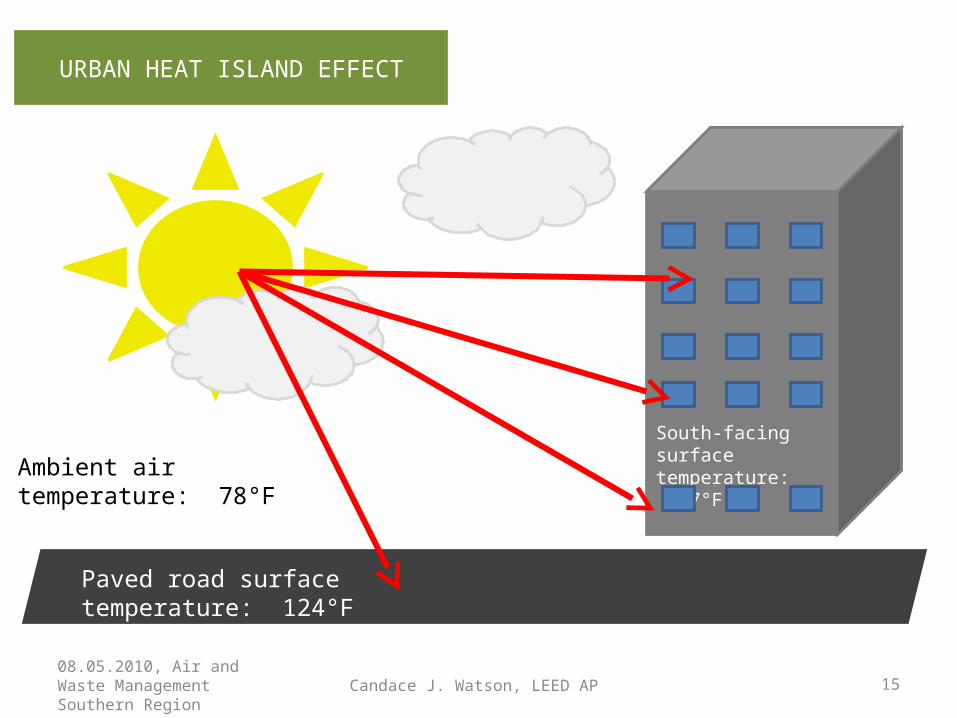
URBAN HEAT ISLAND EFFECT
Ambient air temperature: 78°FSouth-facing surface temperature: 117°F
Paved road surface temperature: 124°F
08.05.2010, Air and Waste Management Southern Region Candace J. Watson, LEED AP 16
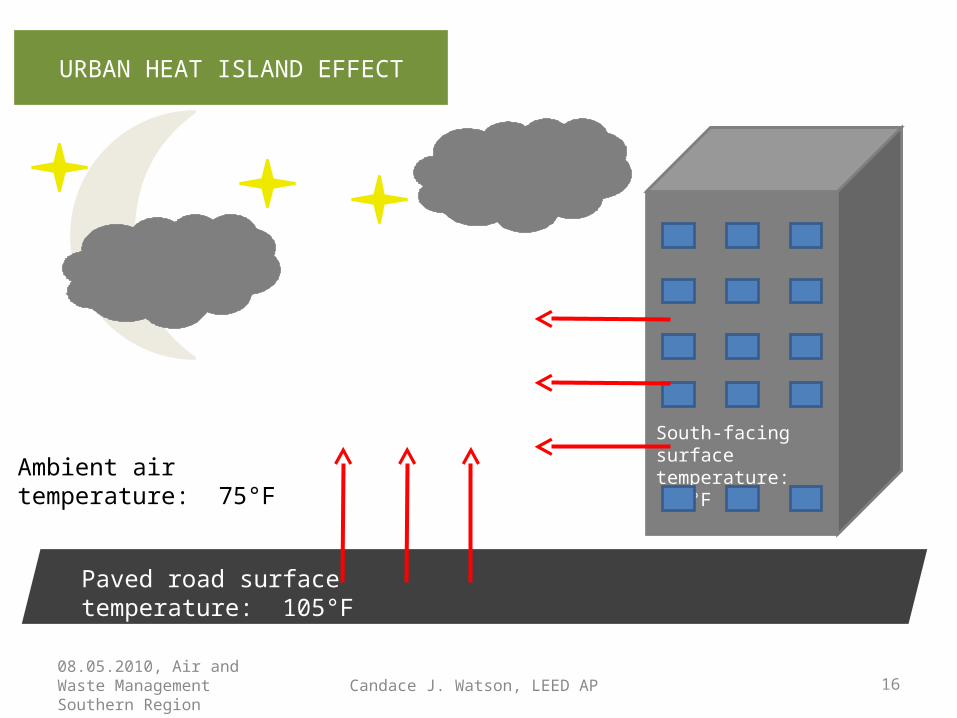
URBAN HEAT ISLAND EFFECT
Ambient air temperature: 75°FSouth-facing surface temperature: 98°F
Paved road surface temperature: 105°F
URBAN HEAT ISLAND EFFECT
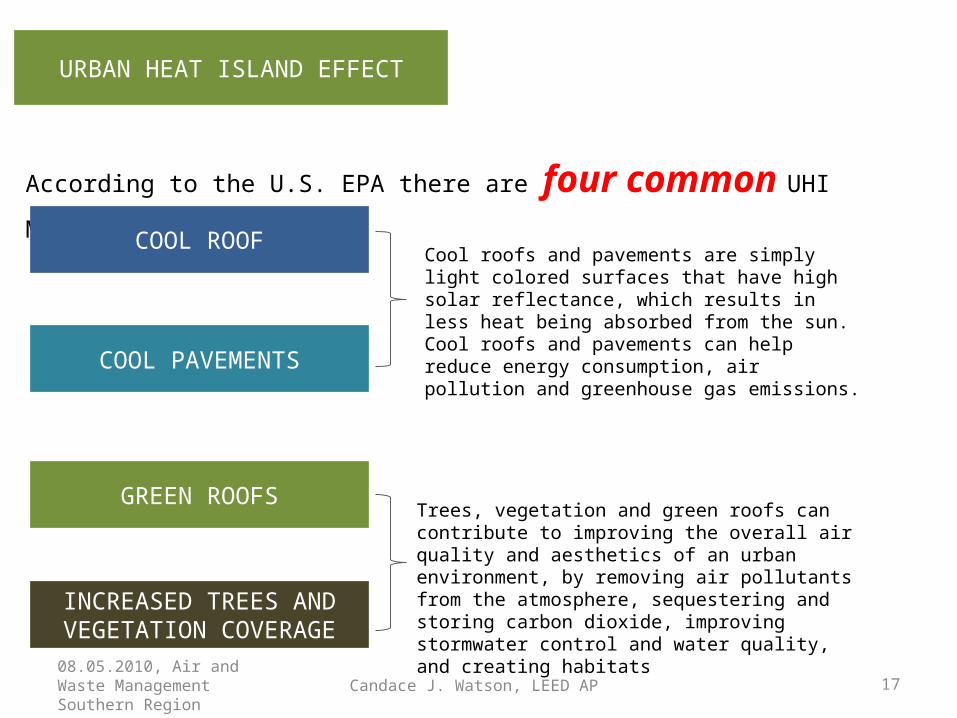
According to the U.S. EPA there are four common UHI Mitigation strategies:
GREEN ROOFS
INCREASED TREES AND VEGETATION COVERAGE
Trees, vegetation and green roofs can contribute to improving the overall air quality and aesthetics of an urban environment, by removing air pollutants from the atmosphere, sequestering and storing carbon dioxide, improving stormwater control and water quality, and creating habitats
COOL ROOF
COOL PAVEMENTS
Cool roofs and pavements are simply light colored surfaces that have high solar reflectance, which results in less heat being absorbed from the sun. Cool roofs and pavements can help reduce energy consumption, air pollution and greenhouse gas emissions.
08.05.2010, Air and Waste Management Southern Region 17Candace J. Watson, LEED AP
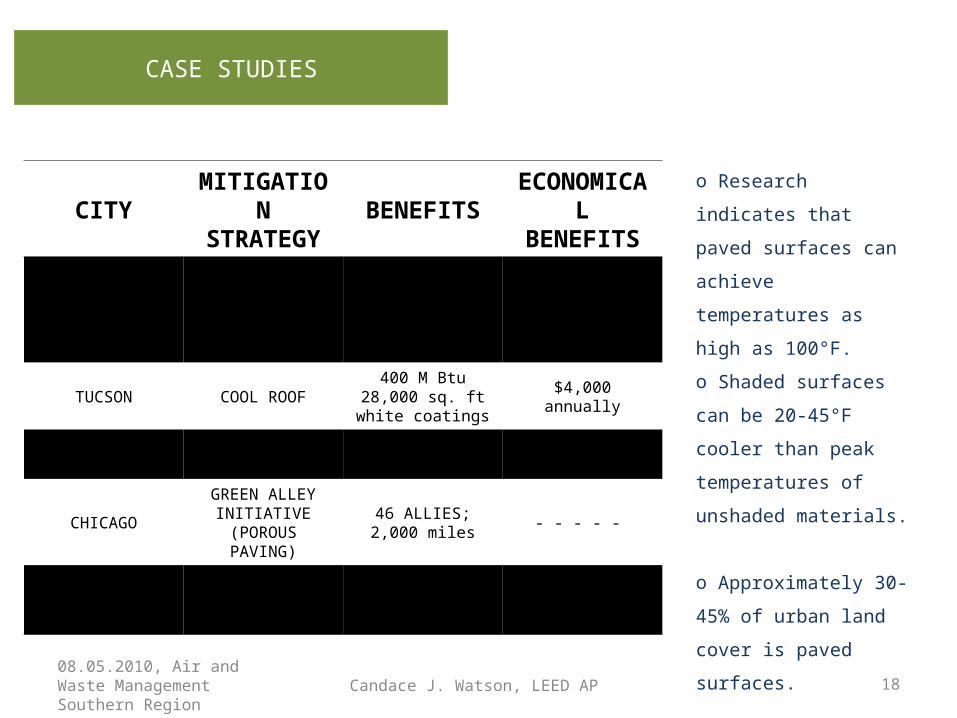
CASE STUDIES
CITY MITIGATION STRATEGY BENEFITS ECONOMICAL
BENEFITS
CHICAGO GREEN ROOF
Saved: 9,270 kW-hours electricity and 740 M Btu of natural
gas
$3,600 annually
TUCSON COOL ROOF 400 M Btu 28,000 sq. ft white coatings $4,000 annually
SACRAMENTO TREES AND VEGETATION
350,000 SHADE TREES - - - - -
CHICAGOGREEN ALLEY
INITIATIVE (POROUS PAVING)
46 ALLIES; 2,000 miles - - - - -
CHICAGOROOF (25% OR HIGHER SOLAR REFLECTANCE)
- - - - - - - - - -
o Research indicates that
paved surfaces can achieve
temperatures as high as
100°F.
o Shaded surfaces can be
20-45°F cooler than peak
temperatures of unshaded
materials.
o Approximately 30-45% of
urban land cover is paved
surfaces.
08.05.2010, Air and Waste Management Southern Region 18Candace J. Watson, LEED AP
08.05.2010, Air and Waste Management Southern Region Candace J. Watson, LEED AP 19
PROBLEM STATEMENT
o The global community is already struggling to
meet current energy demands.
o Increases in world population will place a larger
burden on the already limited resources used for
energy production.
o Under-developed countries are looking at
developed countries for suggestions on how to
manage predicted population growth.
o An existing imbalance of global energy
consumption could potentially be problematic if
under-developed nations rise up and demand their
fair share.
20
PROJECT OBJECTIVE
PRIMARY OBJECTIVEDevelop a best practices guide for holistic sustainable cities, thereby improving energy and resource consumption through design methods and material selection of built infrastructure.
PURPOSE OF THE STUDY
The purpose of the study is to provide existing cities and new cities with a set of suggestions and recommendations on how to design or improve the design of their city with proven best practices that achieve the goal of reducing energy consumption and creating sustainable environments. Provided recommendations can be applied to an entire city, not for single-building use.
QUESTIONS
1. What are the correlations between LEED certified buildings and their impact on UHI effects, compared to non-LEED certified buildings?
2. Is there a correlation between neighboring buildings material selection, height and orientation (with respect to other buildings) on energy consumption?
3. Is it counterintuitive to apply UHI mitigation strategies to one city block, one building, or one zone, while the rest of the city is still performing at less than sustainable standards?
08.05.2010, Air and Waste Management Southern Region Candace J. Watson, LEED AP
08.05.2010, Air and Waste Management Southern Region Candace J. Watson, LEED AP 21
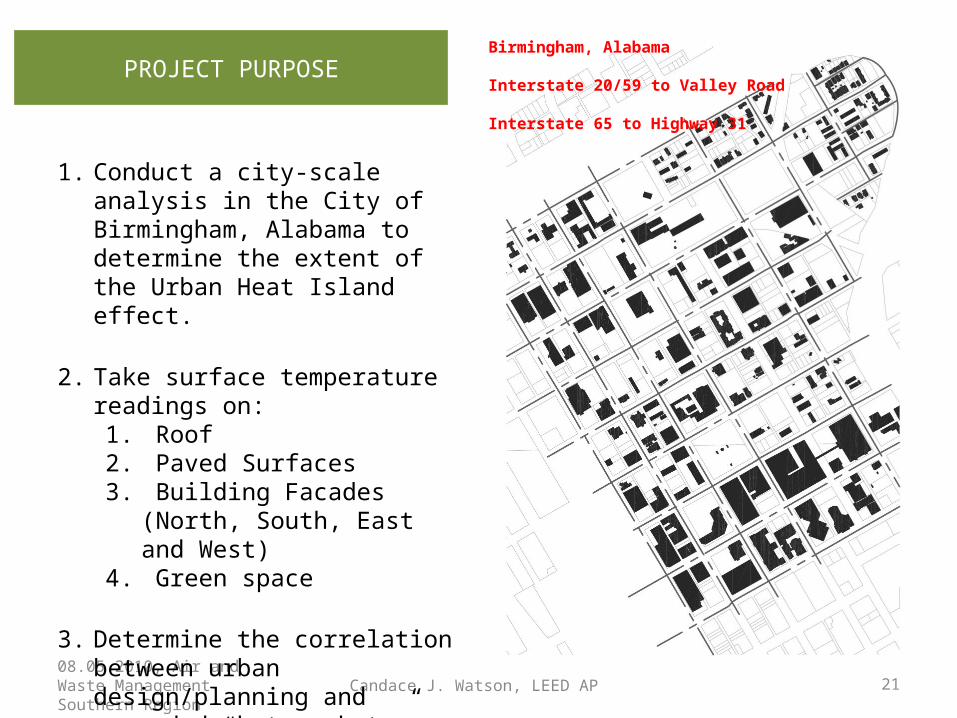
PROJECT PURPOSE
1. Conduct a city-scale analysis in the City of Birmingham, Alabama to determine the extent of the Urban Heat Island effect.
2. Take surface temperature readings on:
1. Roof2. Paved Surfaces3. Building Facades (North, South,
East and West)4. Green space
3. Determine the correlation between urban design/planning and recorded “hot pockets” within the city.
Birmingham, Alabama
Interstate 20/59 to Valley Road
Interstate 65 to Highway 31
08.05.2010, Air and Waste Management Southern Region Candace J. Watson, LEED AP 22
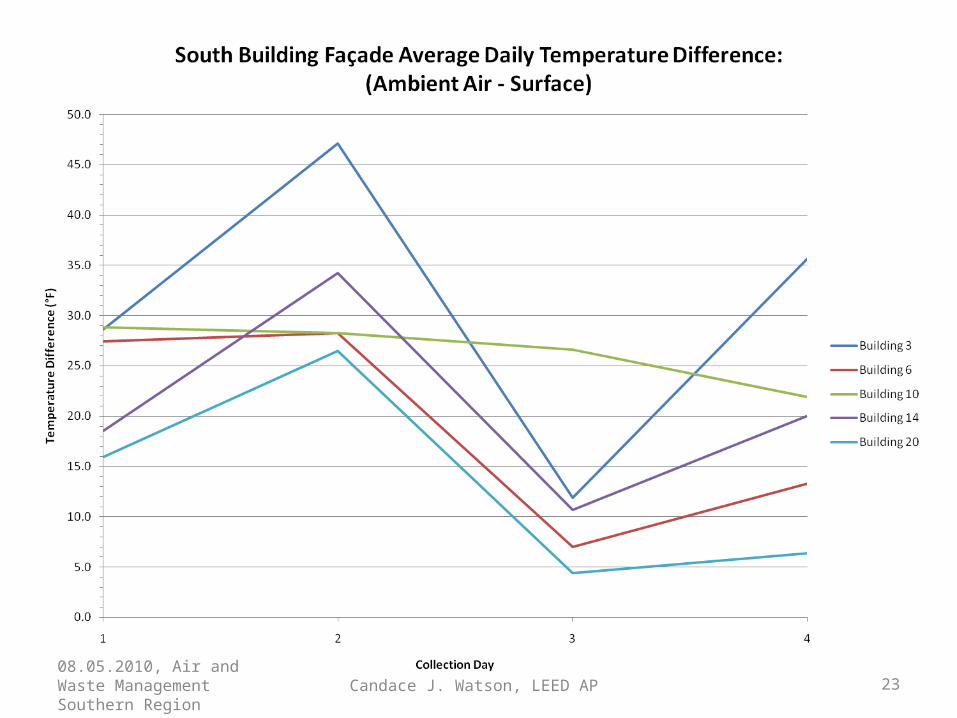
08.05.2010, Air and Waste Management Southern Region Candace J. Watson, LEED AP 23
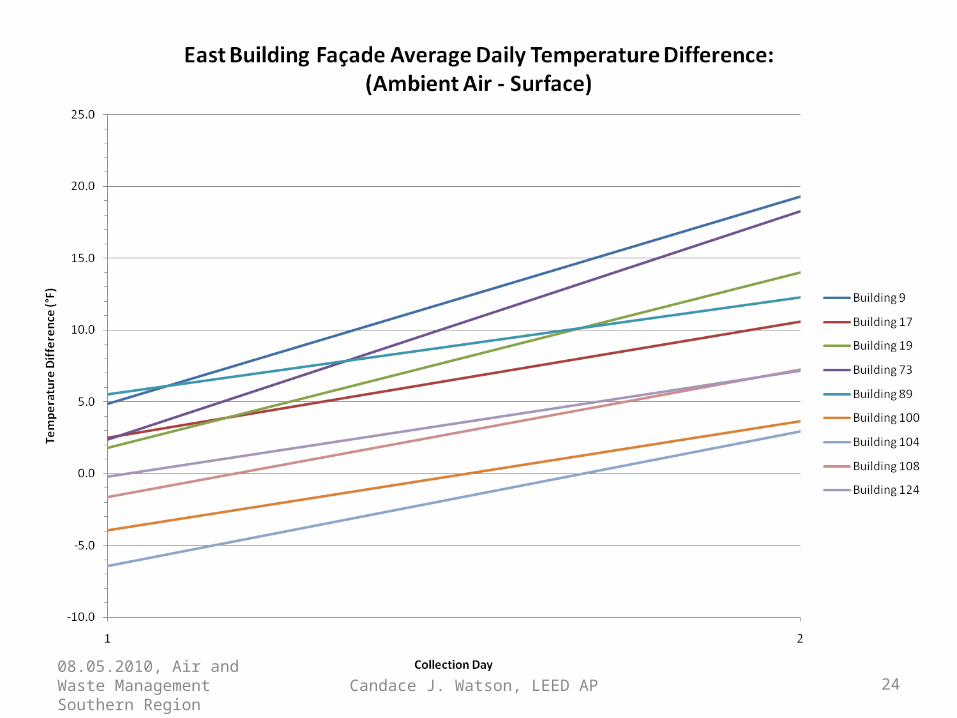
08.05.2010, Air and Waste Management Southern Region Candace J. Watson, LEED AP 24
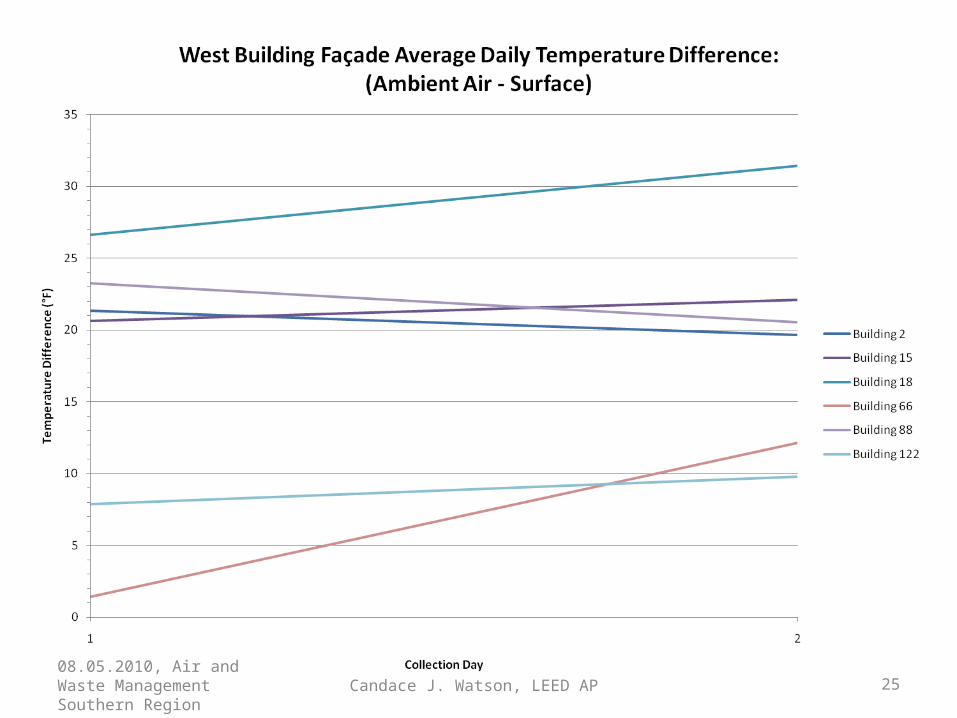
08.05.2010, Air and Waste Management Southern Region Candace J. Watson, LEED AP 25
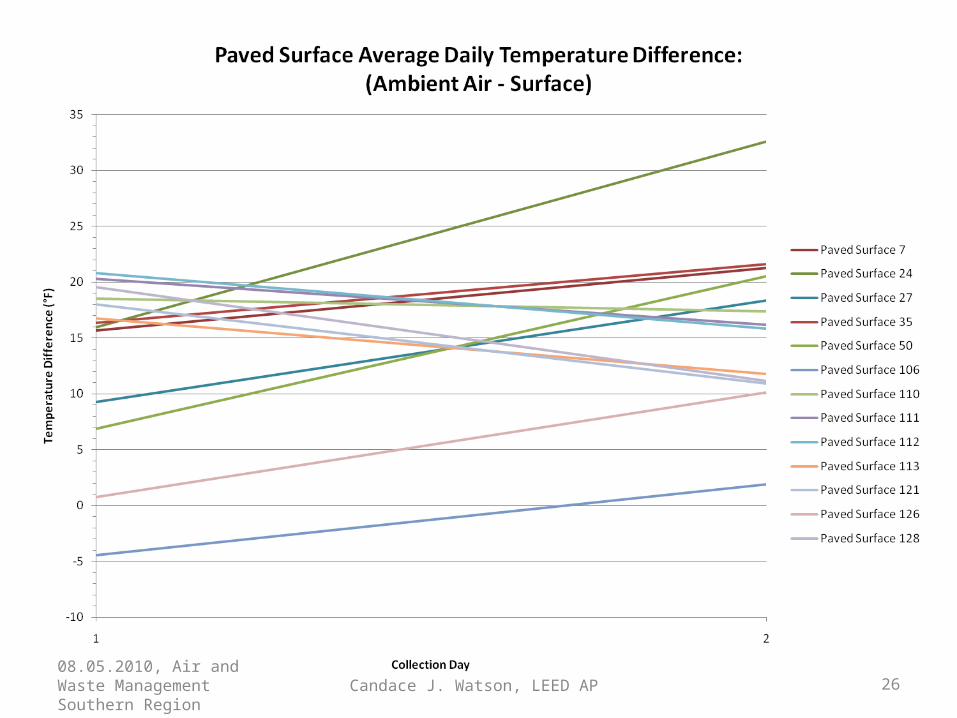
08.05.2010, Air and Waste Management Southern Region Candace J. Watson, LEED AP 26
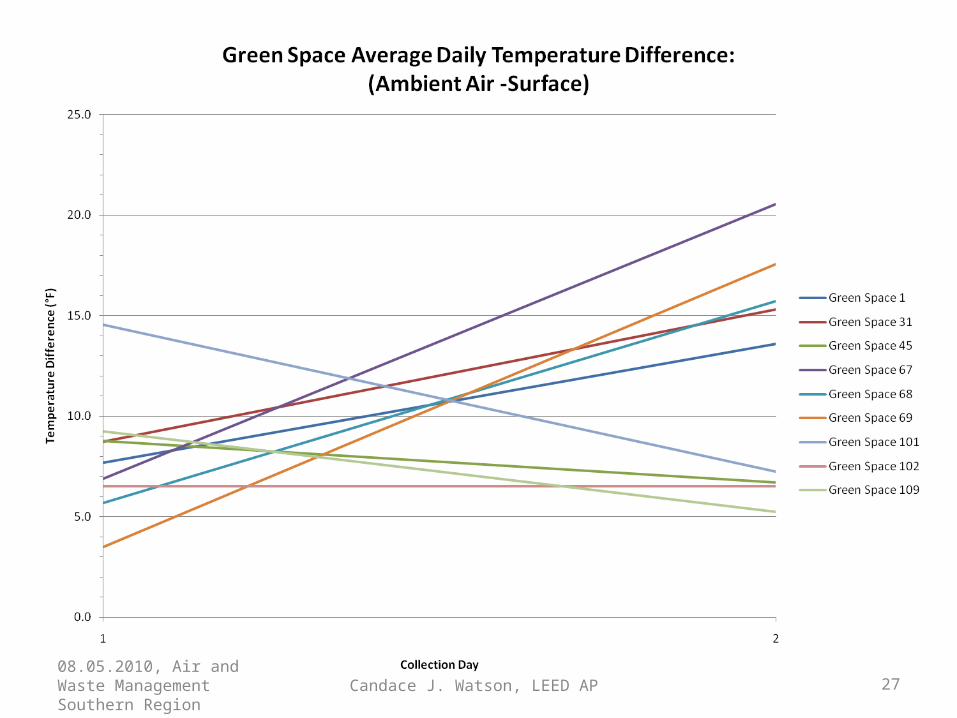
08.05.2010, Air and Waste Management Southern Region Candace J. Watson, LEED AP 27

08.05.2010, Air and Waste Management Southern Region Candace J. Watson, LEED AP 28
FUTURE WORK
Take data to determine anomalies in the data.
Conduct a detailed site analysis on a city block to identify interrelationships between buildings and their surroundings.
Compare results to city blocks that are performing reasonably well.
Perform heat transfer calculations on individual buildings to provide a baseline for UHI impact and compare those results to energy use and consumption.
29
CONCLUSION
ANTICIPATED RESULTS:
Increasing energy efficiency through
improvement of holistic urban
design methods.
PROBLEM STATEMENT:
Under-developed countries are expected to
experience a population growth of 44.6% over
the next 40 years. Limited resource availability
and poor design methods will make managing
this increase in population difficult.
08.05.2010, Air and Waste Management Southern Region Candace J. Watson, LEED AP

08.05.2010, Air and Waste Management Southern Region Candace J. Watson, LEED AP 30
Contact Information:
Candace J. WatsonEmail: [email protected]
31
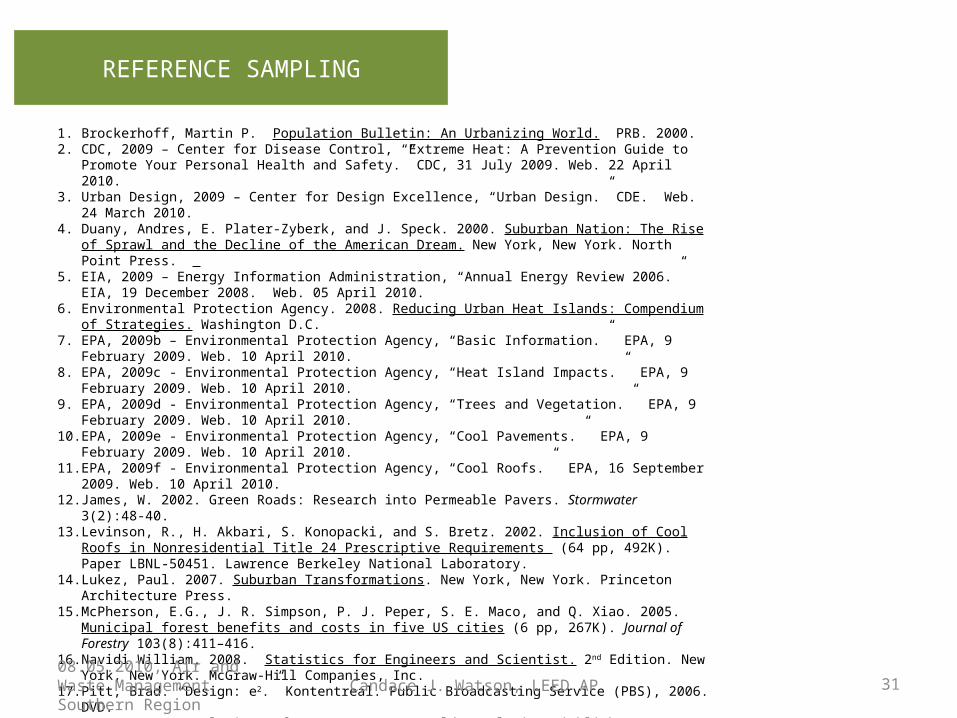
REFERENCE SAMPLING
1. Brockerhoff, Martin P. Population Bulletin: An Urbanizing World. PRB. 2000. 2. CDC, 2009 – Center for Disease Control, “Extreme Heat: A Prevention Guide to Promote Your Personal Health and
Safety.” CDC, 31 July 2009. Web. 22 April 2010.3. Urban Design, 2009 – Center for Design Excellence, “Urban Design.” CDE. Web. 24 March 2010. 4. Duany, Andres, E. Plater-Zyberk, and J. Speck. 2000. Suburban Nation: The Rise of Sprawl and the Decline of the
American Dream. New York, New York. North Point Press. 5. EIA, 2009 – Energy Information Administration, “Annual Energy Review 2006.” EIA, 19 December 2008. Web. 05
April 2010. 6. Environmental Protection Agency. 2008. Reducing Urban Heat Islands: Compendium of Strategies. Washington D.C. 7. EPA, 2009b – Environmental Protection Agency, “Basic Information.” EPA, 9 February 2009. Web. 10 April 2010. 8. EPA, 2009c - Environmental Protection Agency, “Heat Island Impacts.” EPA, 9 February 2009. Web. 10 April 2010. 9. EPA, 2009d - Environmental Protection Agency, “Trees and Vegetation.” EPA, 9 February 2009. Web. 10 April 2010.10. EPA, 2009e - Environmental Protection Agency, “Cool Pavements.” EPA, 9 February 2009. Web. 10 April 2010.11. EPA, 2009f - Environmental Protection Agency, “Cool Roofs.” EPA, 16 September 2009. Web. 10 April 2010.12. James, W. 2002. Green Roads: Research into Permeable Pavers. Stormwater 3(2):48-40. 13. Levinson, R., H. Akbari, S. Konopacki, and S. Bretz. 2002. Inclusion of Cool Roofs in Nonresidential Title 24
Prescriptive Requirements (64 pp, 492K). Paper LBNL-50451. Lawrence Berkeley National Laboratory.14. Lukez, Paul. 2007. Suburban Transformations. New York, New York. Princeton Architecture Press. 15. McPherson, E.G., J. R. Simpson, P. J. Peper, S. E. Maco, and Q. Xiao. 2005. Municipal forest benefits and costs in five
US cities (6 pp, 267K). Journal of Forestry 103(8):411–416.16. Navidi William. 2008. Statistics for Engineers and Scientist. 2nd Edition. New York, New York. McGraw-Hill
Companies, Inc. 17. Pitt, Brad. “Design: e2.” Kontentreal. Public Broadcasting Service (PBS), 2006. DVD. 18. PRB, 2009 – Population Reference Bureau, “World Population Highlights: Key Findings from PRB’s 2009 World
Population Data Sheet.” PRB, August 2009. Web. March 25, 2010. 19. True Random Number Service. What’s the Fuss about True Randomness. October, 1998. Web. January 7, 2010. 20. Wood, John H., G. R. Long, and D.F. Morehouse. 2004. Long-Term World Oil Supply Scenarios: The Future is Neither
as Bleak or Rosy as Some Assert. Energy Information Administration with Department of Energy. 21. United States Department of Energy. Energy Efficiency and Renewable Energy State Activities and Partnerships. U.S.
DOE 8 April 2010. Web. April 18, 2010. 22. Zhang, Chunlong. 2007. Fundamentals of Environmental Sampling and Analysis. Hoboken, New Jersey. John Wiley
& Sons, Inc.
08.05.2010, Air and Waste Management Southern Region Candace J. Watson, LEED AP


![SUSTAINABLE BUILDING DE and HVAC SIGN LEED · LEED Accredited Professionals (APs) has topped 131,000. USGBC’s LEED version 3 (v3)—includes LEED 2009[1], a new LEED ac-creditation](https://img.pdfslide.us/doc/110x75/5f0aaf2e7e708231d42cd46c/sustainable-building-de-and-hvac-sign-leed-leed-accredited-professionals-aps-has.jpg)