Embed Size (px)
Citation preview
1
Center for Urban Transportation Research | University of South Florida
Impacts of Transportation Network Company
(TNC) and Autonomous Vehicles
CUTR Webinar, Thursday, October 1, 2015
Steven E. Polzin, PhD.
2
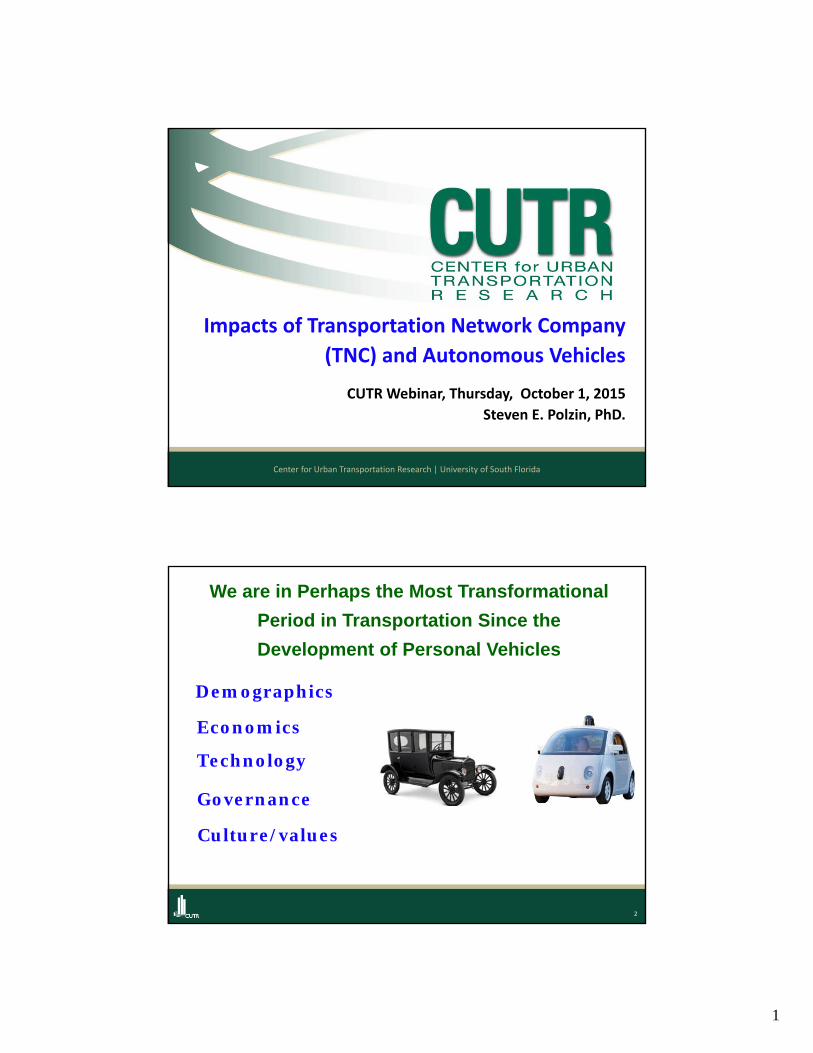
We are in Perhaps the Most Transformational
Period in Transportation Since the
Development of Personal Vehicles
Demographics
Technology
Economics
Governance
Culture/values
2
3
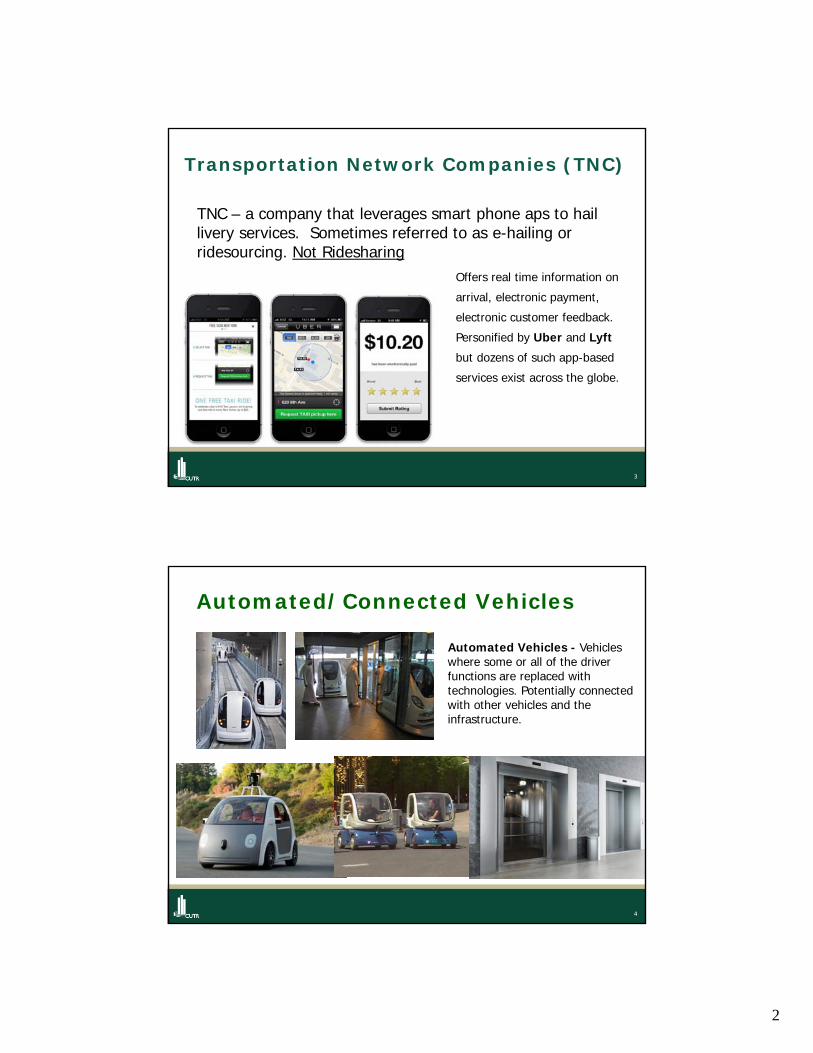
Transportation Network Companies (TNC)
TNC – a company that leverages smart phone aps to hail livery services. Sometimes referred to as e-hailing or ridesourcing. Not Ridesharing
Offers real time information on
arrival, electronic payment,
electronic customer feedback.
Personified by Uber and Lyft
but dozens of such app-based
services exist across the globe.
4
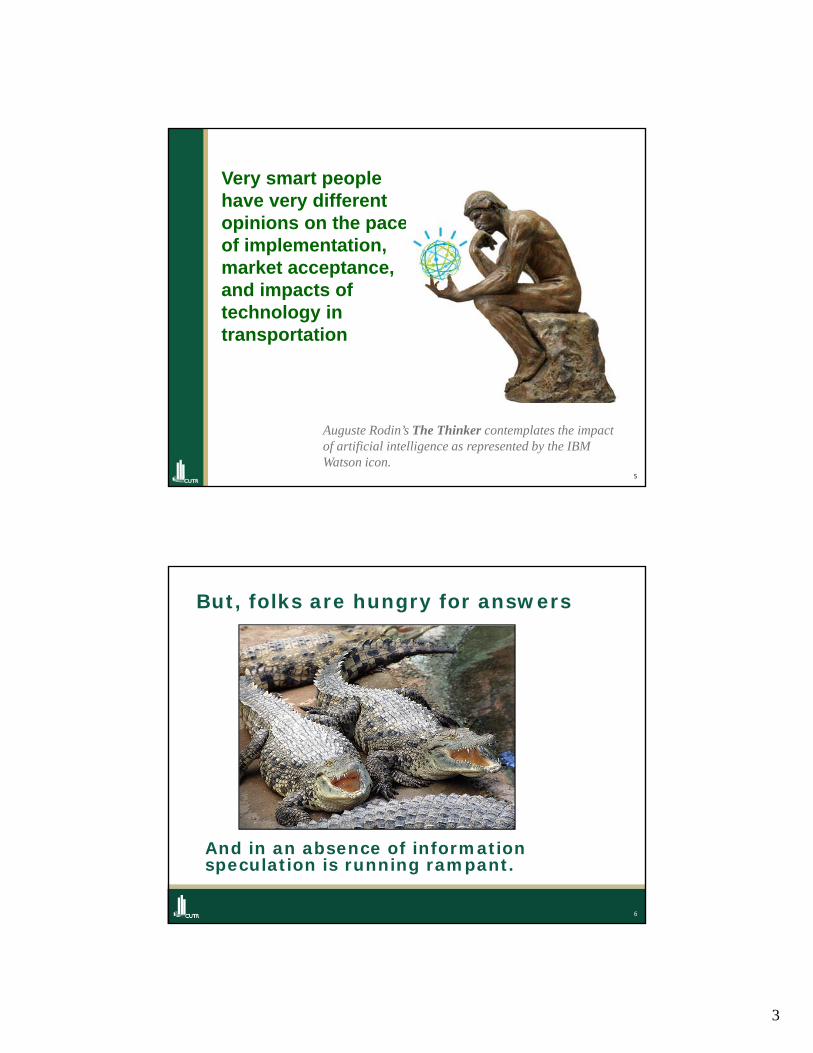
Automated/Connected Vehicles
Automated Vehicles - Vehicles where some or all of the driver functions are replaced with technologies. Potentially connected with other vehicles and the infrastructure.
3
5
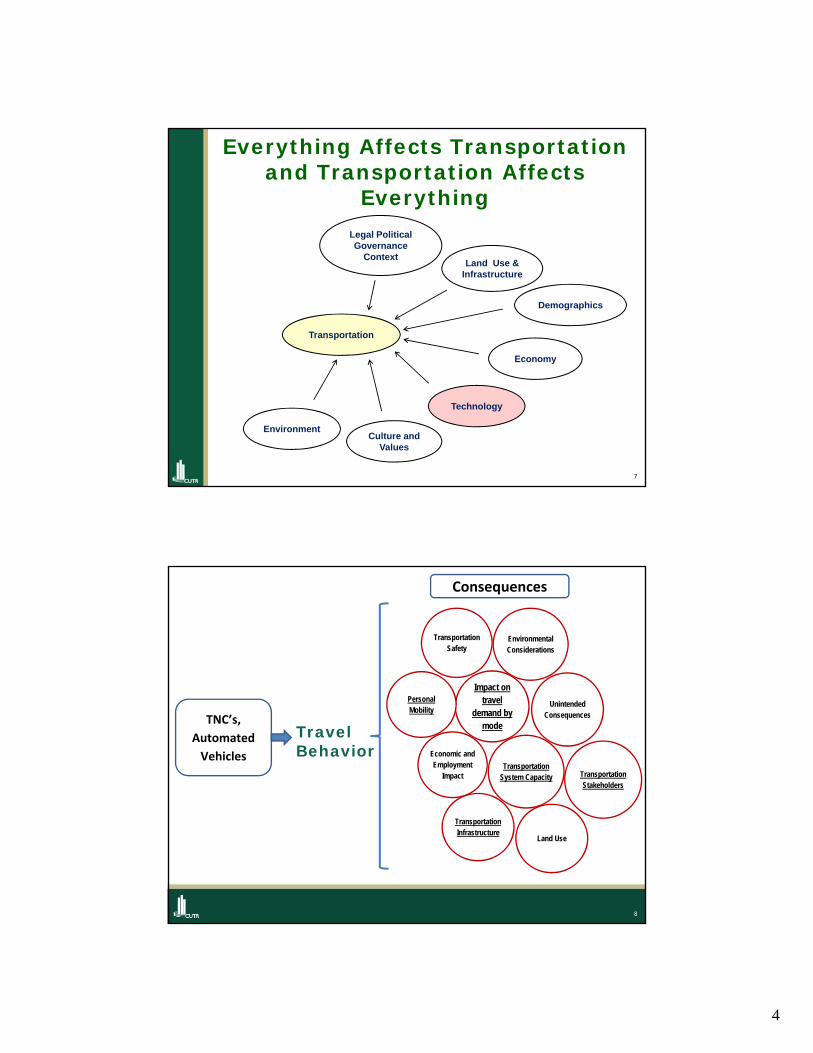
Very smart people have very different opinions on the pace of implementation, market acceptance, and impacts of technology in transportation
Auguste Rodin’s The Thinker contemplates the impact of artificial intelligence as represented by the IBM Watson icon.
6
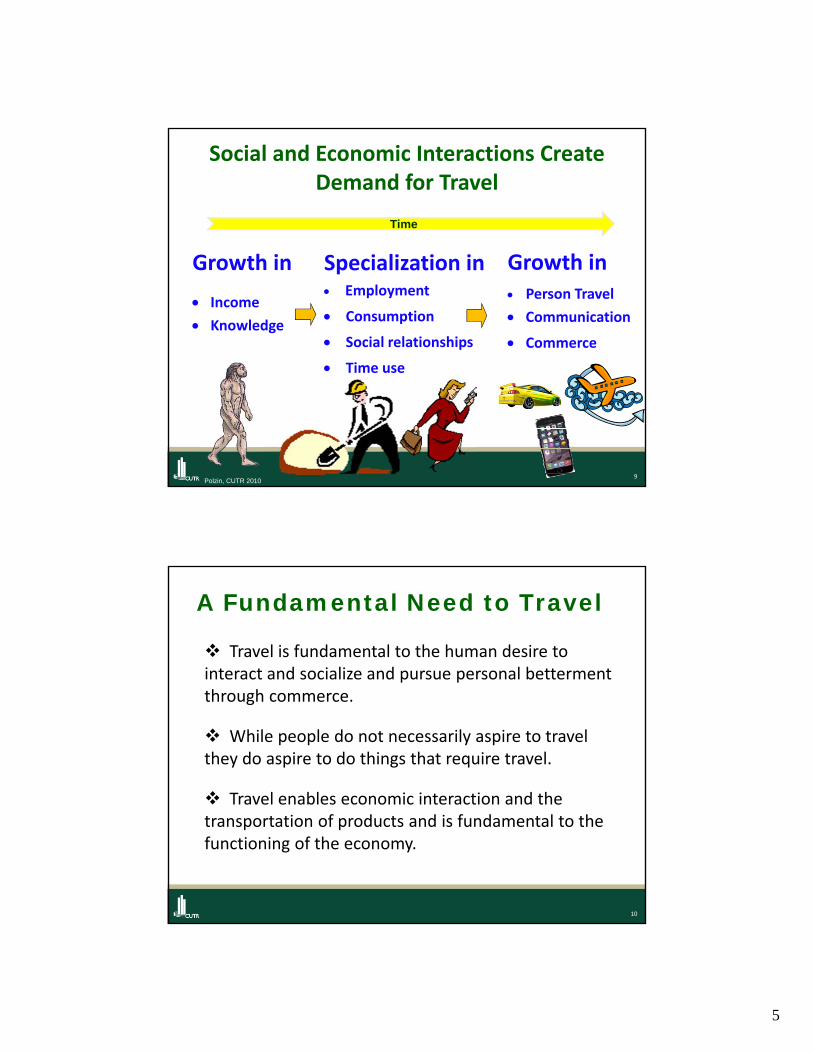
But, folks are hungry for answers
And in an absence of information speculation is running rampant.
4
7
Everything Affects Transportation and Transportation Affects
Everything
Technology
Culture and Values
Transportation
Economy
Demographics
Legal Political Governance
ContextLand Use &
Infrastructure
Environment
8
Environmental Considerations
Transportation Safety
Transportation System Capacity
Economic and Employment
Impact
TNC’s,
Automated
Vehicles
Unintended Consequences
Impact on travel
demand by mode
Consequences
Travel Behavior
Personal Mobility
Transportation Infrastructure
Land Use
Transportation Stakeholders
5
9Polzin, CUTR 2010
Growth in
Income
Knowledge
Social and Economic Interactions Create Demand for Travel
Specialization in Employment
Consumption
Social relationships
Time use
Growth in Person Travel
Communication
Commerce
Time
10
A Fundamental Need to Travel
Travel is fundamental to the human desire to interact and socialize and pursue personal betterment through commerce.
While people do not necessarily aspire to travel they do aspire to do things that require travel.
Travel enables economic interaction and the transportation of products and is fundamental to the functioning of the economy.
6
11
Travel and Economic Theory are Clear
• Better/lower cost mobility means more travel
• More travel means better quality of life for travelers – greater employment access, access to more and better education, services, products, etc.
• And society benefits if externalities of more travel (congestion, air quality, energy use, safety, etc.) do not offset the benefits of greater mobility
12
Technology is Already Impacting Travel Behavior
• Navigation systems minimize circuity
• Cell phones enable productive use of travel time
• Electronic toll payment reduces travel delays
• Information systems (in vehicle and road signage) minimize travel delays
• Etc.
7
13
Communication Substitution for Travel
• E‐commerce
• Distance learning
• E‐banking
• Social media in lieu of visits
• Electronic retrieval of music, video, books, etc.
• Webinars and online meetings
14
Will TNC’s and Autonomous Vehicles Turn Transportation on its Head?
8
15
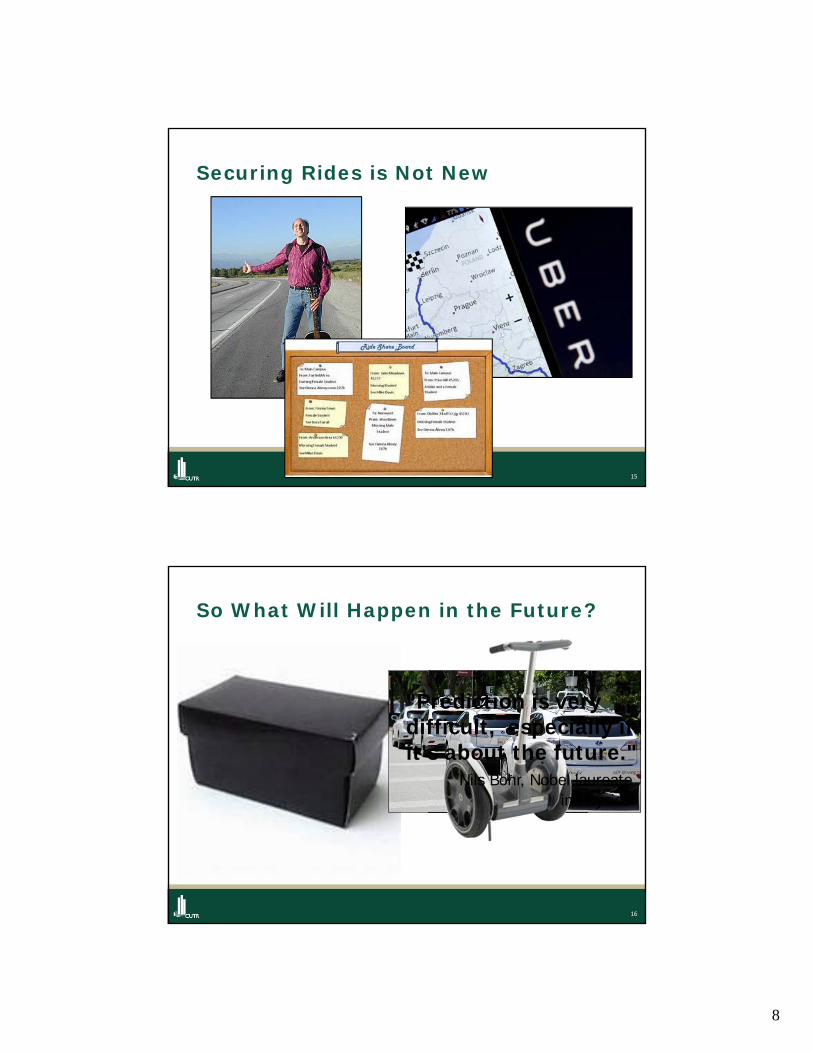
Securing Rides is Not New
16
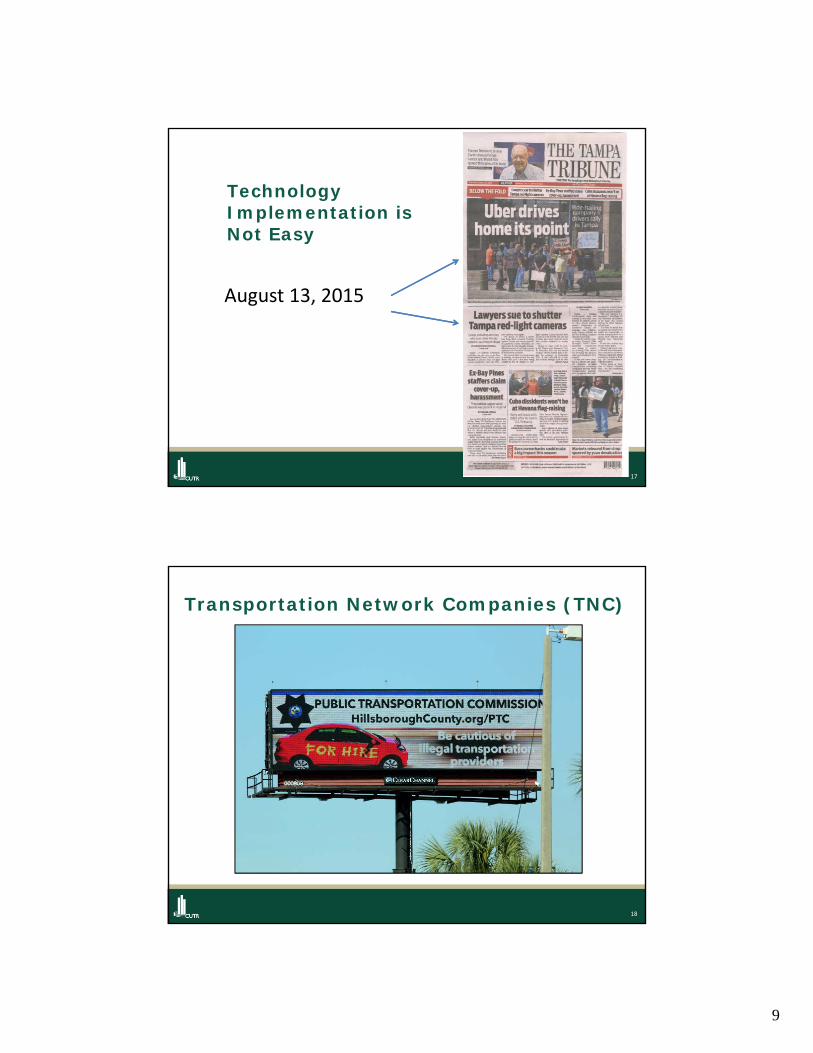
So What Will Happen in the Future?
"Prediction is very difficult, especially if it's about the future."
Nils Bohr, Nobel laureate in Physics
9
17
August 13, 2015
Technology Implementation is Not Easy
18
Transportation Network Companies (TNC)
10
19
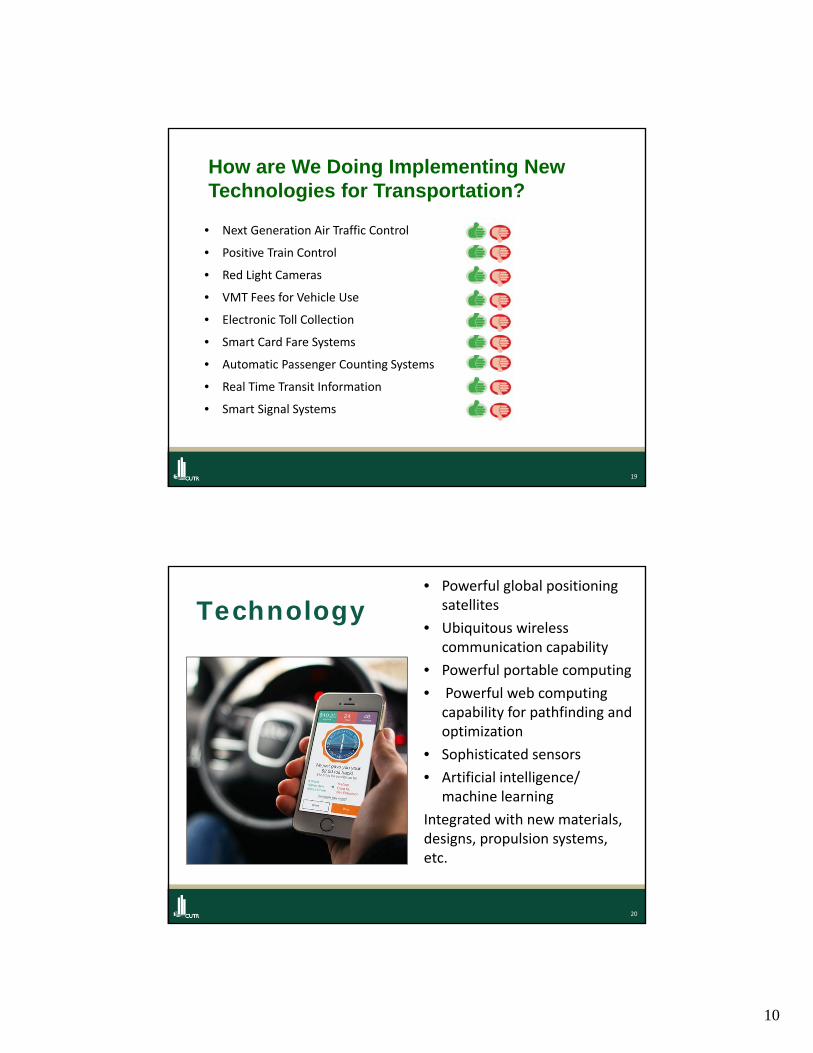
• Next Generation Air Traffic Control
• Positive Train Control
• Red Light Cameras
• VMT Fees for Vehicle Use
• Electronic Toll Collection
• Smart Card Fare Systems
• Automatic Passenger Counting Systems
• Real Time Transit Information
• Smart Signal Systems
How are We Doing Implementing New Technologies for Transportation?
20
Technology• Powerful global positioning
satellites
• Ubiquitous wireless communication capability
• Powerful portable computing
• Powerful web computing capability for pathfinding and optimization
• Sophisticated sensors
• Artificial intelligence/ machine learning
Integrated with new materials, designs, propulsion systems, etc.
11
21
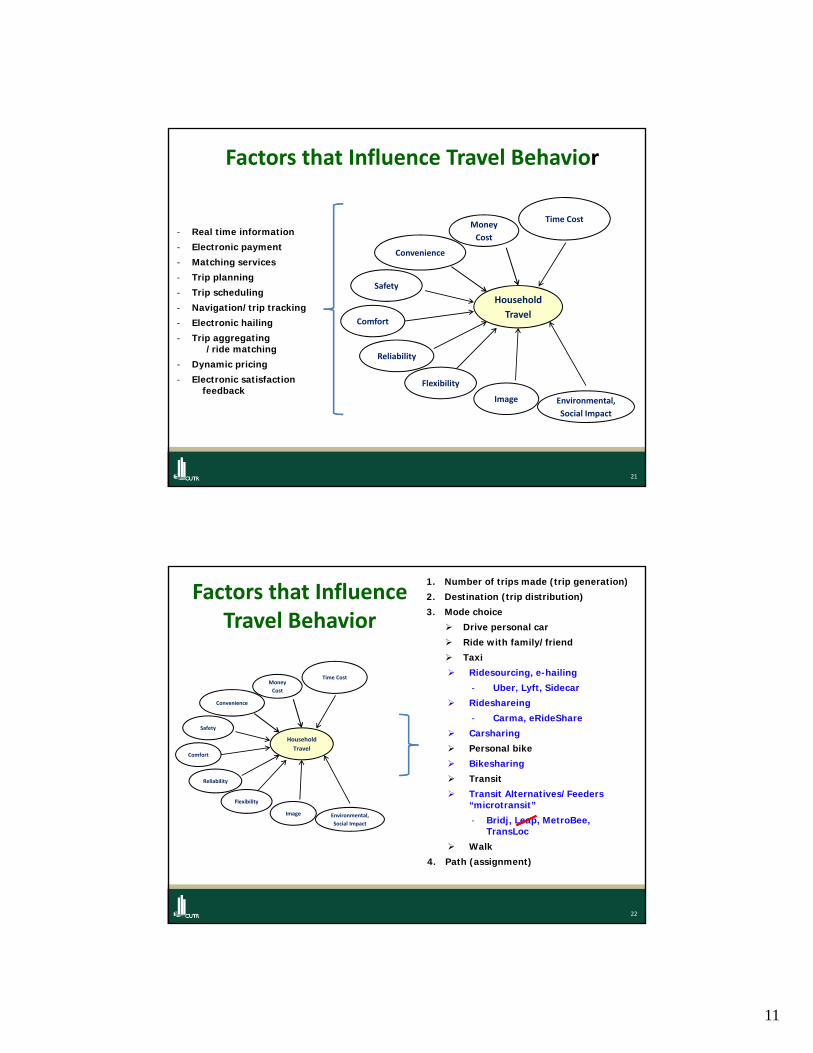
Factors that Influence Travel Behavior
Money
Cost
Reliability
Household
TravelComfort
Safety
Time Cost
Convenience
Flexibility
Image Environmental,
Social Impact
- Real time information
- Electronic payment
- Matching services
- Trip planning
- Trip scheduling
- Navigation/trip tracking
- Electronic hailing
- Trip aggregating -----/ride matching
- Dynamic pricing
- Electronic satisfaction ----feedback
22
Factors that Influence Travel Behavior
Money
Cost
Reliability
Household
TravelComfort
Safety
Time Cost
Convenience
Flexibility
Image Environmental,
Social Impact
1. Number of trips made (trip generation)
2. Destination (trip distribution)
3. Mode choice
Drive personal car
Ride with family/friend
Taxi
Ridesourcing, e-hailing
- Uber, Lyft, Sidecar
Rideshareing
- Carma, eRideShare
Carsharing
Personal bike
Bikesharing
Transit
Transit Alternatives/Feeders “microtransit”
- Bridj, Leap, MetroBee, TransLoc
Walk
4. Path (assignment)
12
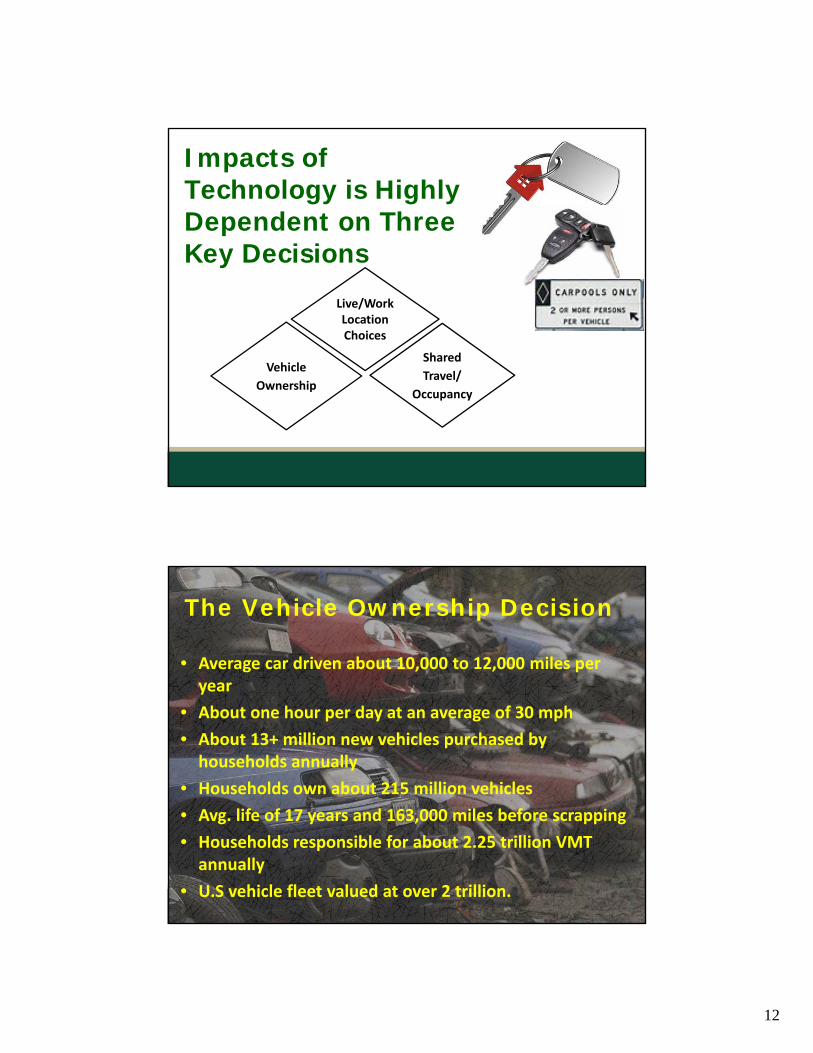
Vehicle
Ownership
Impacts of Technology is Highly Dependent on Three Key Decisions
Live/Work Location Choices
Shared
Travel/
Occupancy
24
• Average car driven about 10,000 to 12,000 miles per year
• About one hour per day at an average of 30 mph
• About 13+ million new vehicles purchased by households annually
• Households own about 215 million vehicles
• Avg. life of 17 years and 163,000 miles before scrapping
• Households responsible for about 2.25 trillion VMT annually
• U.S vehicle fleet valued at over 2 trillion.
The Vehicle Ownership Decision
13
25
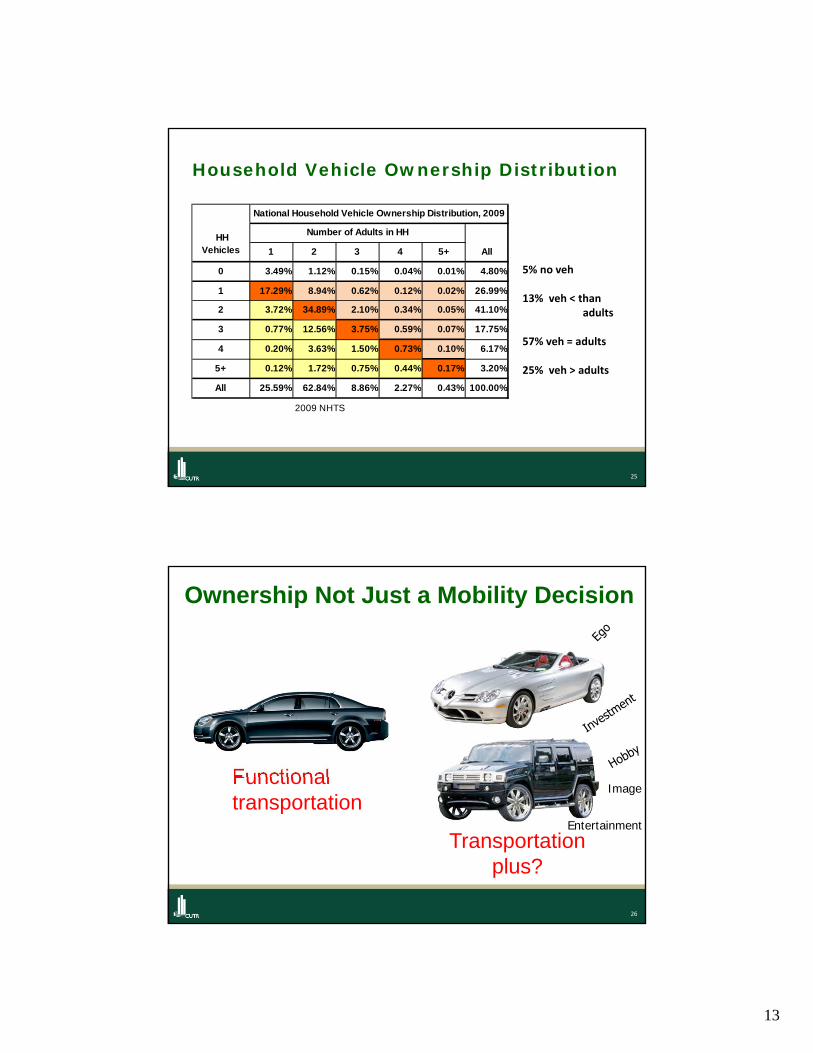
Household Vehicle Ownership Distribution
1 2 3 4 5+
0 3.49% 1.12% 0.15% 0.04% 0.01% 4.80%
1 17.29% 8.94% 0.62% 0.12% 0.02% 26.99%
2 3.72% 34.89% 2.10% 0.34% 0.05% 41.10%
3 0.77% 12.56% 3.75% 0.59% 0.07% 17.75%
4 0.20% 3.63% 1.50% 0.73% 0.10% 6.17%
5+ 0.12% 1.72% 0.75% 0.44% 0.17% 3.20%
All 25.59% 62.84% 8.86% 2.27% 0.43% 100.00%
2009 NHTS
HH Vehicles
National Household Vehicle Ownership Distribution, 2009
Number of Adults in HH
All
5% no veh
13% veh < thanadults
57% veh = adults
25% veh > adults
26
Functional transportation
Transportation plus?
Ownership Not Just a Mobility Decision
Image
Entertainment
14
27
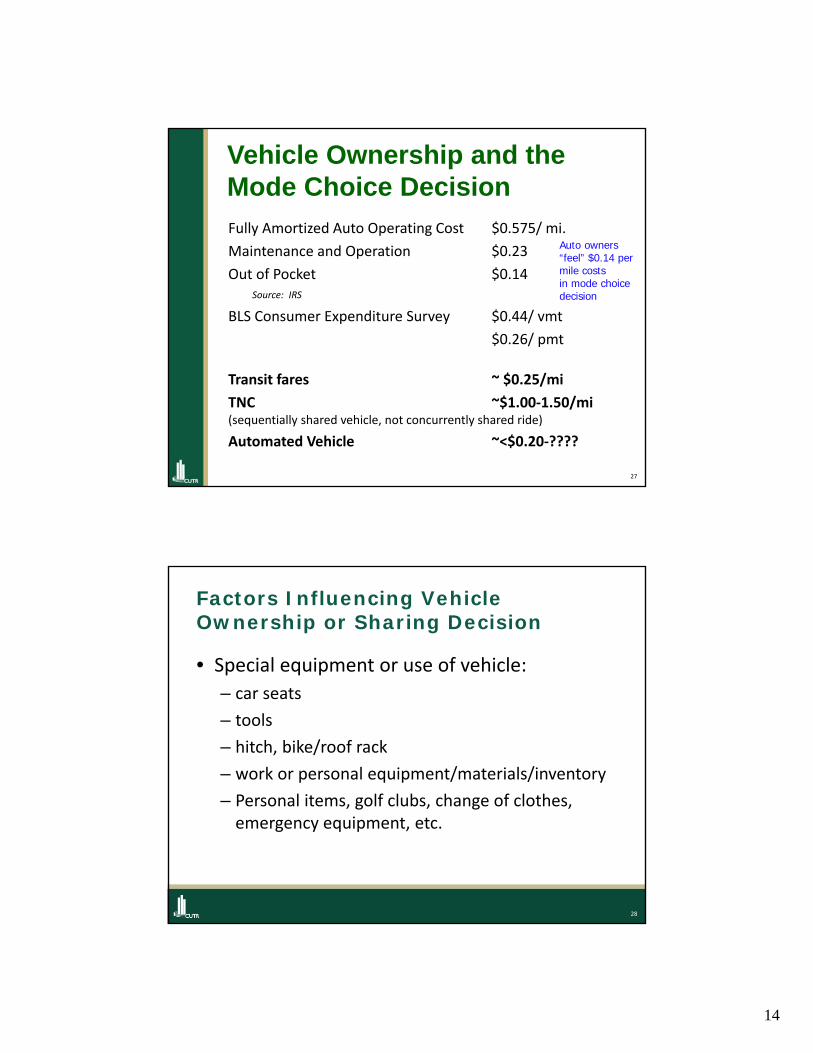
Vehicle Ownership and the Mode Choice Decision
Fully Amortized Auto Operating Cost $0.575/ mi.
Maintenance and Operation $0.23
Out of Pocket $0.14Source: IRS
BLS Consumer Expenditure Survey $0.44/ vmt
$0.26/ pmt
Transit fares ~ $0.25/mi
TNC ~$1.00‐1.50/mi (sequentially shared vehicle, not concurrently shared ride)
Automated Vehicle ~<$0.20‐????
Auto owners “feel” $0.14 per mile costs in mode choice decision
28
Factors Influencing Vehicle Ownership or Sharing Decision
• Special equipment or use of vehicle:
– car seats
– tools
– hitch, bike/roof rack
– work or personal equipment/materials/inventory
– Personal items, golf clubs, change of clothes, emergency equipment, etc.
15
29
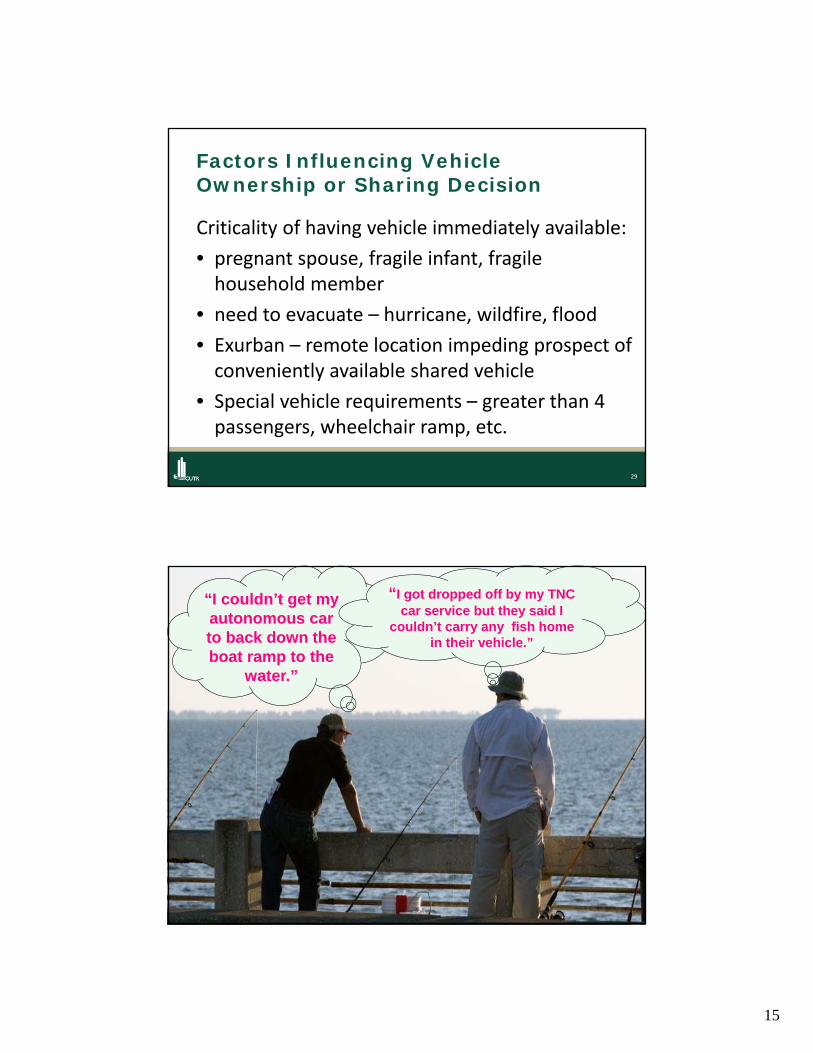
Factors Influencing Vehicle Ownership or Sharing Decision
Criticality of having vehicle immediately available:
• pregnant spouse, fragile infant, fragile household member
• need to evacuate – hurricane, wildfire, flood
• Exurban – remote location impeding prospect of conveniently available shared vehicle
• Special vehicle requirements – greater than 4 passengers, wheelchair ramp, etc.
30
30
“I couldn’t get my autonomous car to back down the boat ramp to the
water.”
“I got dropped off by my TNC car service but they said I
couldn’t carry any fish home in their vehicle.”
16
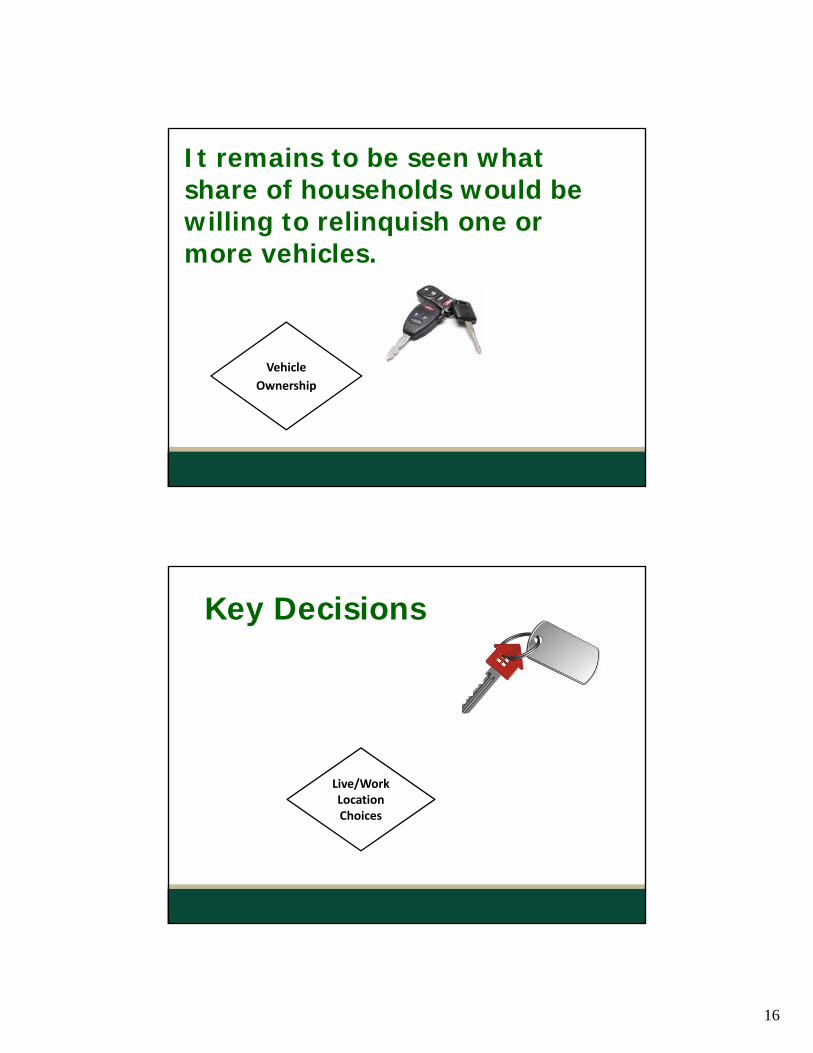
Vehicle
Ownership
It remains to be seen what share of households would be willing to relinquish one or more vehicles.
Key Decisions
Live/Work Location Choices
17
33
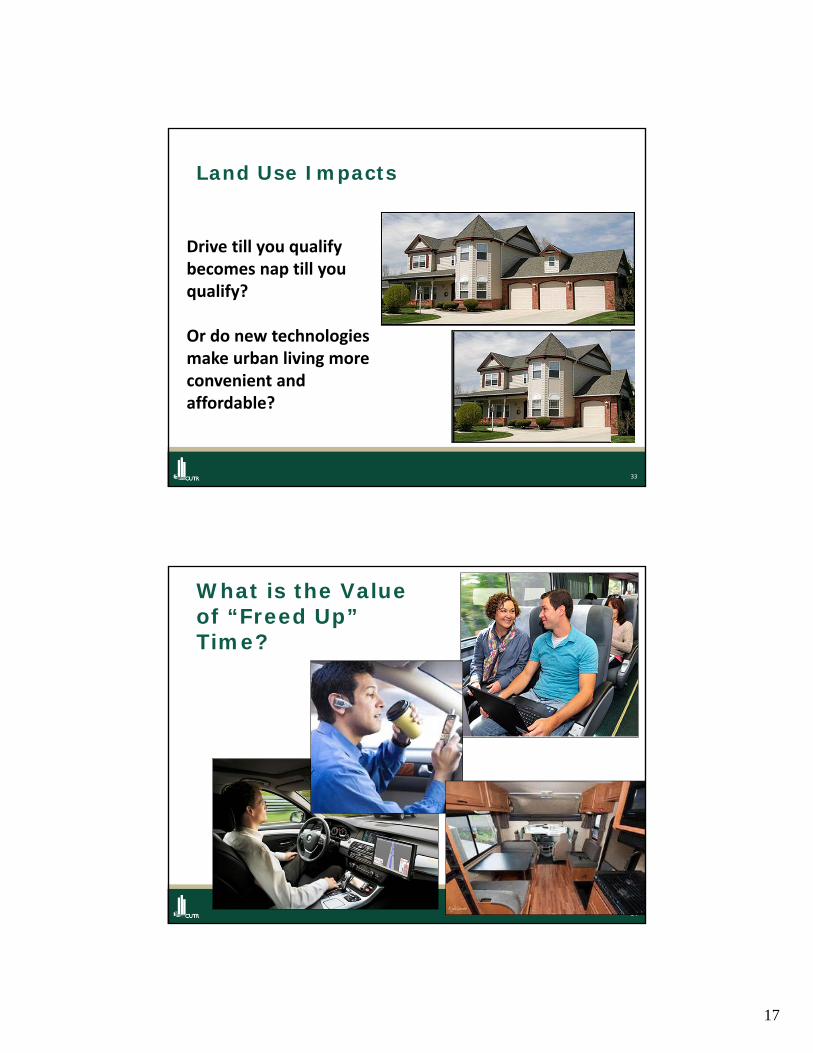
Land Use Impacts
Drive till you qualify becomes nap till you qualify?
Or do new technologies make urban living more convenient and affordable?
34
What is the Value of “Freed Up” Time?
18
35
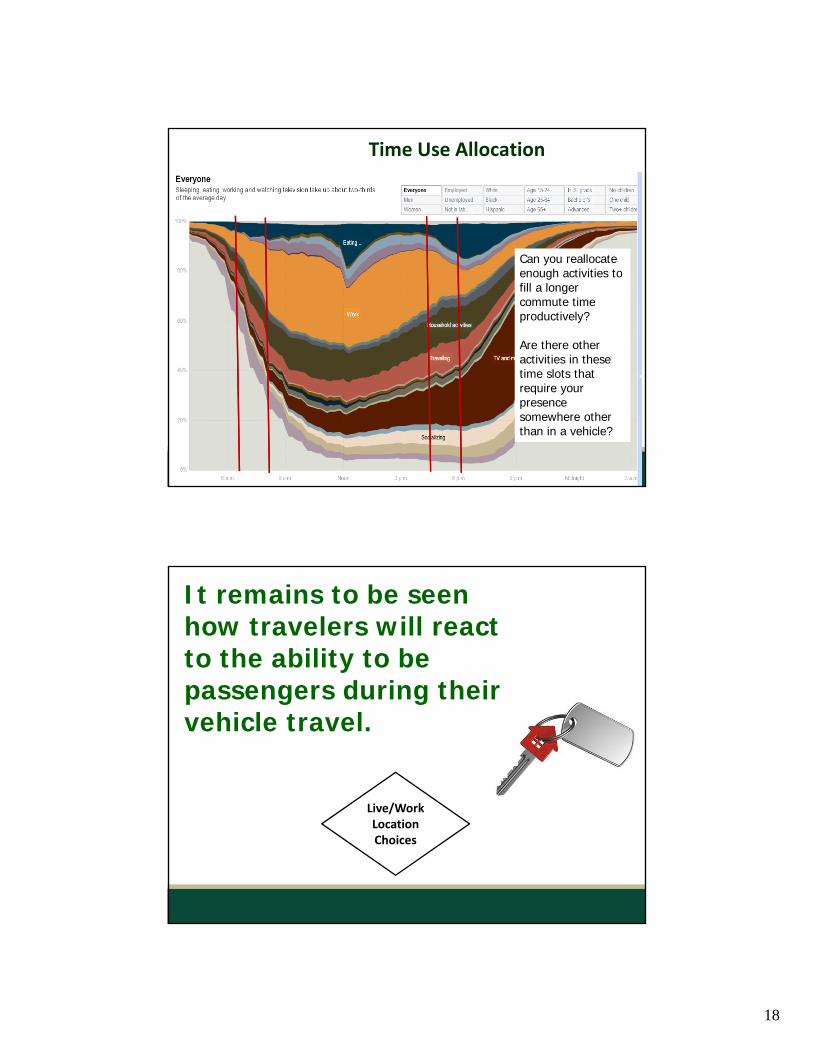
Time Use Allocation
Can you reallocate enough activities to fill a longer commute time productively?
Are there other activities in these time slots that require your presence somewhere other than in a vehicle?
It remains to be seen how travelers will react to the ability to be passengers during their vehicle travel.
Live/Work Location Choices
19
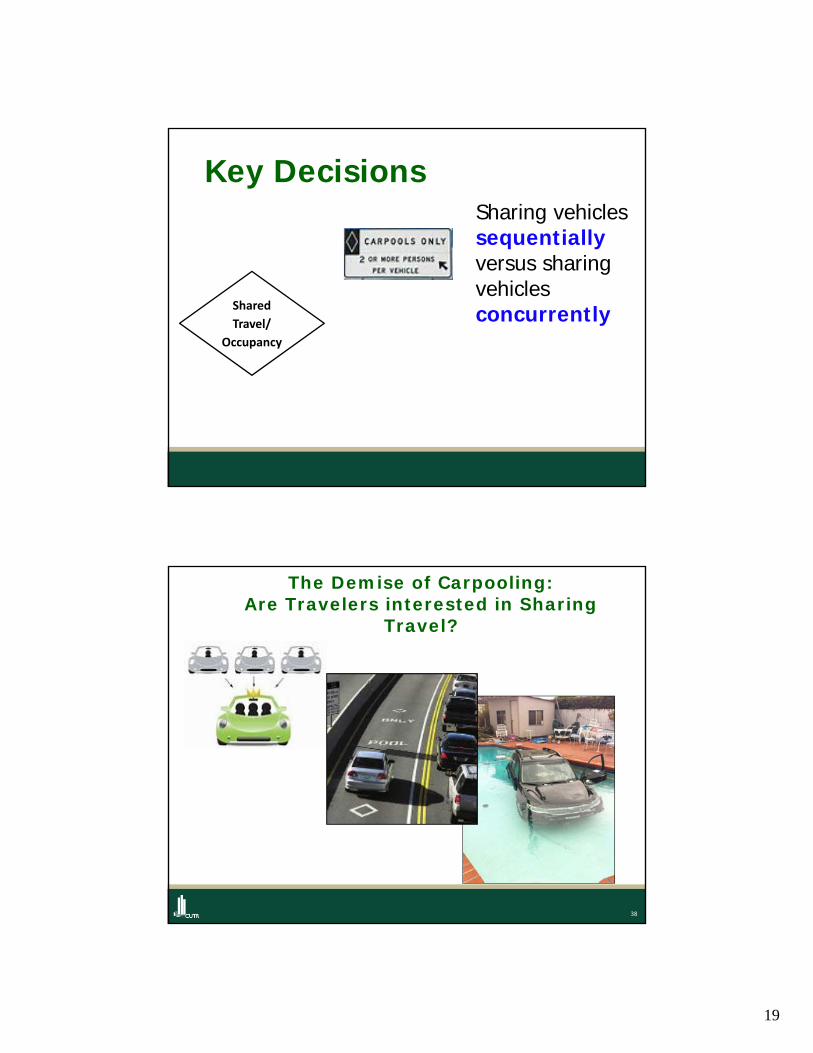
Key Decisions
Shared
Travel/
Occupancy
Sharing vehicles sequentially versus sharing vehicles concurrently
38
The Demise of Carpooling: Are Travelers interested in Sharing
Travel?
20
39
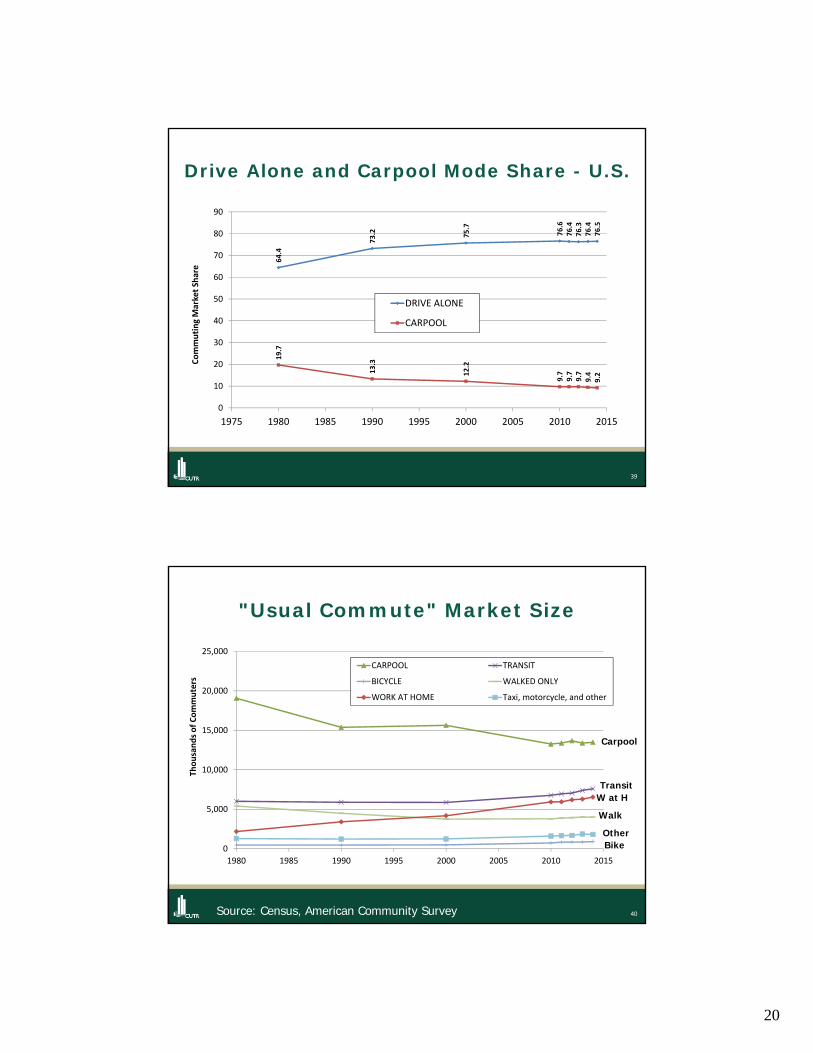
Drive Alone and Carpool Mode Share - U.S.
64.4
73.2 75.7
76.6
76.4
76.3
76.4
76.5
19.7
13.3
12.2
9.7
9.7
9.7
9.4
9.2
0
10
20
30
40
50
60
70
80
90
1975 1980 1985 1990 1995 2000 2005 2010 2015
Commuting Market Share
DRIVE ALONE
CARPOOL
40
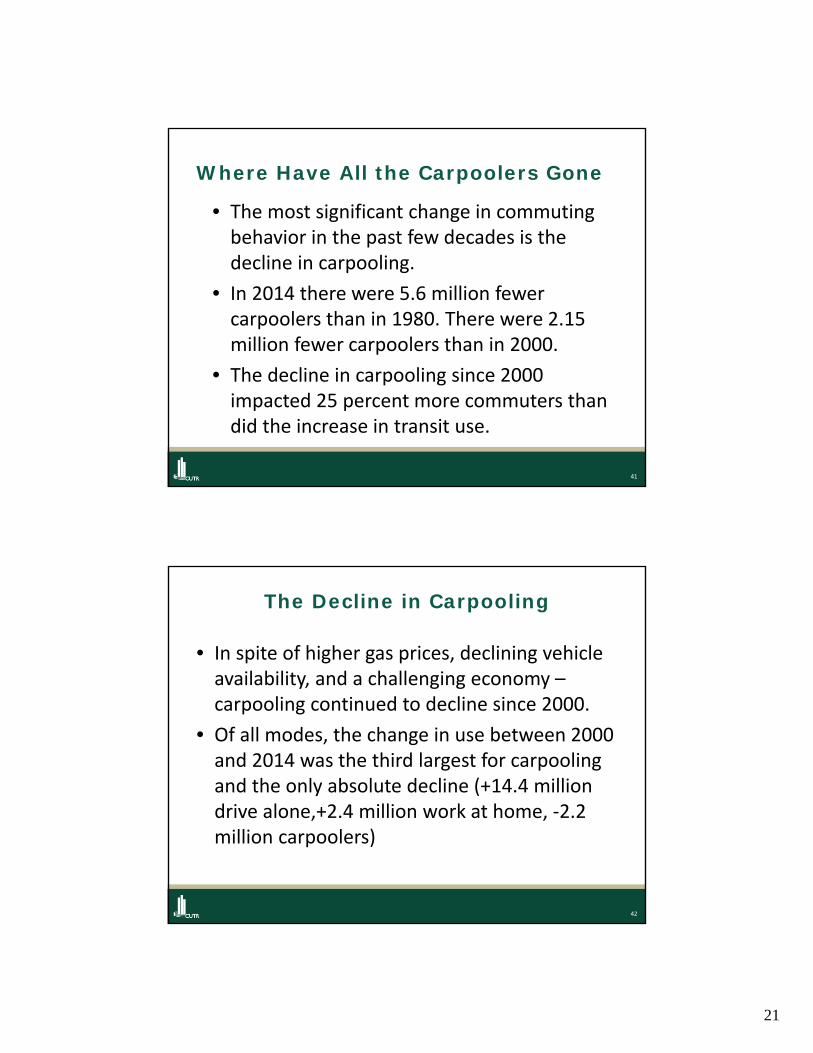
"Usual Commute" Market Size
Source: Census, American Community Survey
Carpool
W at HTransit
Walk
OtherBike0
5,000
10,000
15,000
20,000
25,000
1980 1985 1990 1995 2000 2005 2010 2015
Thousands of Commuters
CARPOOL TRANSIT
BICYCLE WALKED ONLY
WORK AT HOME Taxi, motorcycle, and other
21
41
Where Have All the Carpoolers Gone
• The most significant change in commuting behavior in the past few decades is the decline in carpooling.
• In 2014 there were 5.6 million fewer carpoolers than in 1980. There were 2.15 million fewer carpoolers than in 2000.
• The decline in carpooling since 2000 impacted 25 percent more commuters than did the increase in transit use.
42
The Decline in Carpooling
• In spite of higher gas prices, declining vehicle availability, and a challenging economy –carpooling continued to decline since 2000.
• Of all modes, the change in use between 2000 and 2014 was the third largest for carpooling and the only absolute decline (+14.4 million drive alone,+2.4 million work at home, ‐2.2 million carpoolers)
22
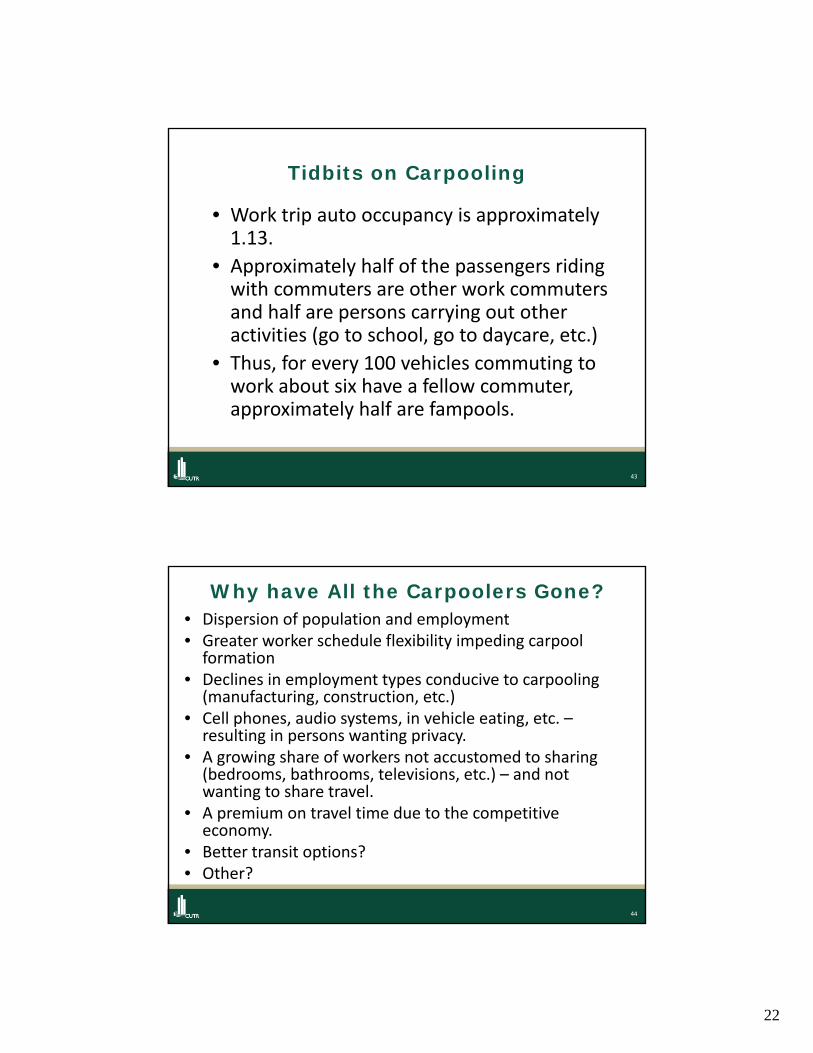
43
Tidbits on Carpooling
• Work trip auto occupancy is approximately 1.13.
• Approximately half of the passengers riding with commuters are other work commuters and half are persons carrying out other activities (go to school, go to daycare, etc.)
• Thus, for every 100 vehicles commuting to work about six have a fellow commuter, approximately half are fampools.
44
Why have All the Carpoolers Gone?• Dispersion of population and employment• Greater worker schedule flexibility impeding carpool formation
• Declines in employment types conducive to carpooling (manufacturing, construction, etc.)
• Cell phones, audio systems, in vehicle eating, etc. –resulting in persons wanting privacy.
• A growing share of workers not accustomed to sharing (bedrooms, bathrooms, televisions, etc.) – and not wanting to share travel.
• A premium on travel time due to the competitive economy.
• Better transit options?• Other?
23
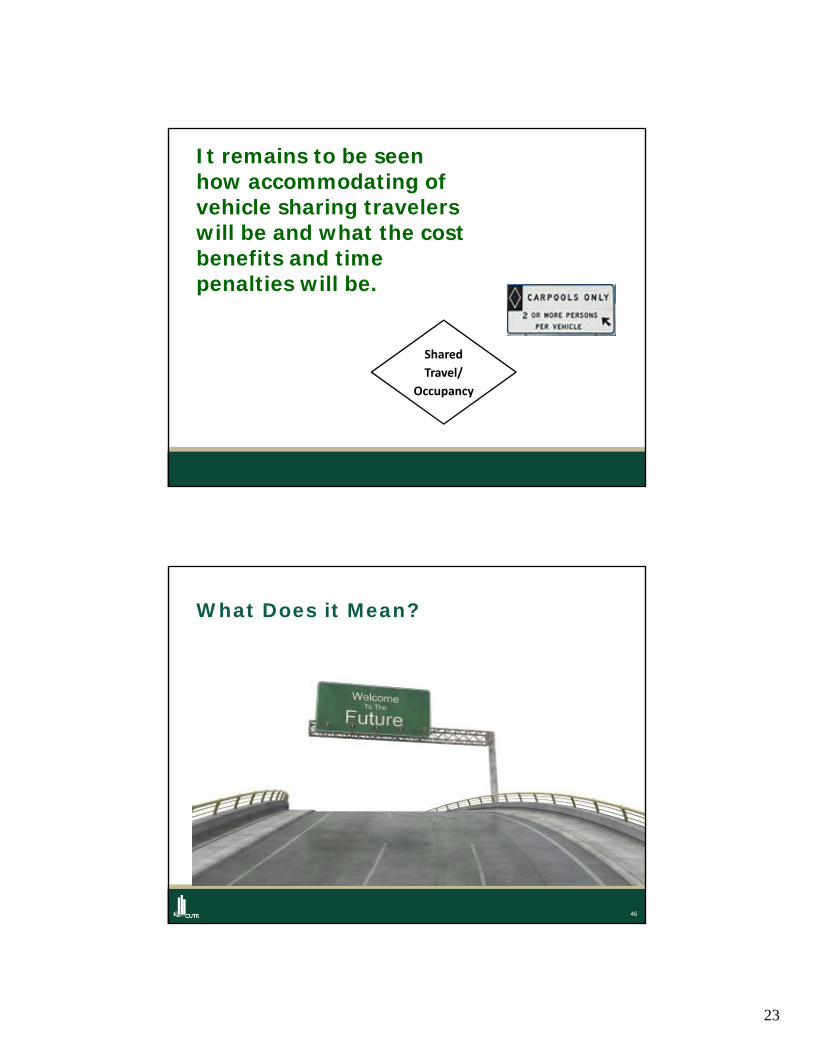
Shared
Travel/
Occupancy
It remains to be seen how accommodating of vehicle sharing travelers will be and what the cost benefits and time penalties will be.
46
What Does it Mean?
24
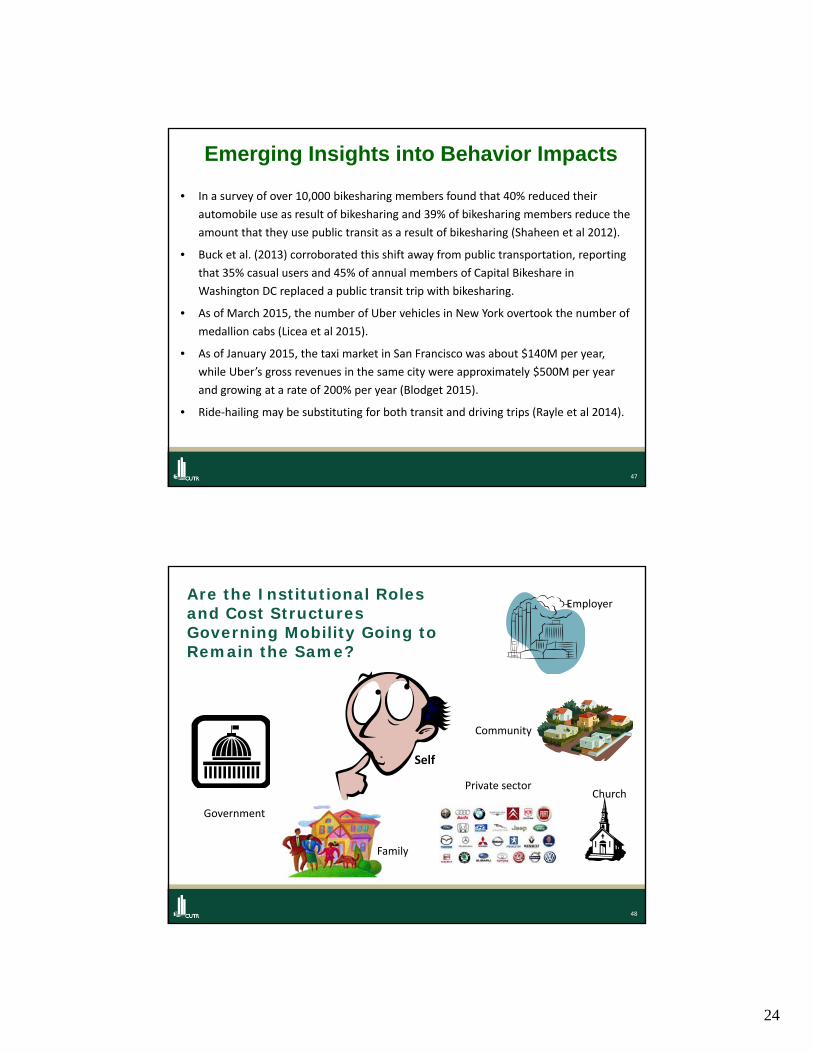
47
• In a survey of over 10,000 bikesharing members found that 40% reduced their
automobile use as result of bikesharing and 39% of bikesharing members reduce the
amount that they use public transit as a result of bikesharing (Shaheen et al 2012).
• Buck et al. (2013) corroborated this shift away from public transportation, reporting
that 35% casual users and 45% of annual members of Capital Bikeshare in
Washington DC replaced a public transit trip with bikesharing.
• As of March 2015, the number of Uber vehicles in New York overtook the number of
medallion cabs (Licea et al 2015).
• As of January 2015, the taxi market in San Francisco was about $140M per year,
while Uber’s gross revenues in the same city were approximately $500M per year
and growing at a rate of 200% per year (Blodget 2015).
• Ride‐hailing may be substituting for both transit and driving trips (Rayle et al 2014).
Emerging Insights into Behavior Impacts
48
Are the Institutional Roles and Cost Structures Governing Mobility Going to Remain the Same?
Family
Government
Church
Employer
Community
Self
Private sector
25
49
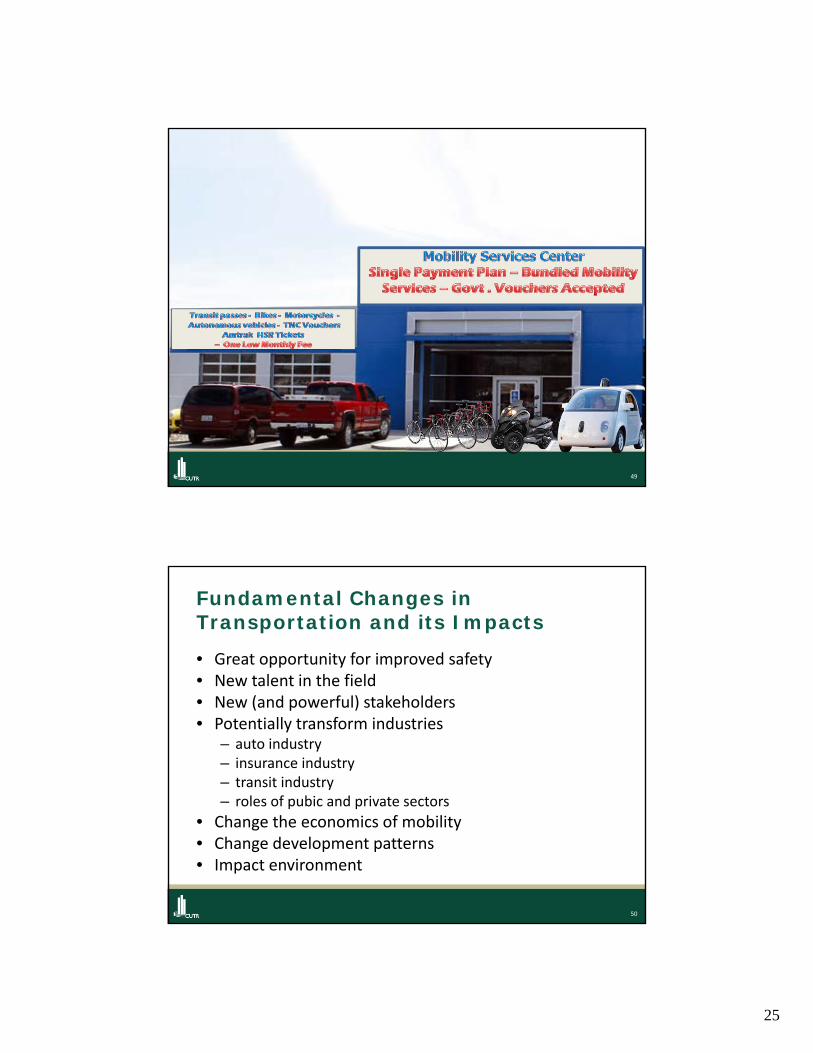
50
Fundamental Changes in Transportation and its Impacts
• Great opportunity for improved safety• New talent in the field• New (and powerful) stakeholders• Potentially transform industries
– auto industry– insurance industry– transit industry– roles of pubic and private sectors
• Change the economics of mobility• Change development patterns• Impact environment
26
51
A Different Planning World
• Time frames for investment implementation and amortization exceed our window of confident predictions
5‐10 years to plan,
5‐10 years to construct,
25‐50 years to amortize investments
• This multiplies risk and uncertainty in a world of rapid change. Planning has to adopt.
52
Contact Information