Embed Size (px)
Citation preview

Impacts of Signal System Timings on Rain Related Congestion
By
Andrew J. Sullivan, PE; Virginia P. Sisiopiku, PhD; and Suman Reddy Surhabi Department of Civil, Construction, and Environmental Engineering
The University of Alabama at Birmingham
Prepared By
UTCA University Transportation Center for Alabama The University of Alabama, The University of Alabama at Birmingham,
and The University of Alabama in Huntsville
UTCA Report Number 07211 June 2010

ii
Technical Report Documentation Page 1. Report No.
FHWA/CA/OR 2. Government Accession No.
3. Recipient Catalog No.
4 Title and Subtitle
Impacts of Signal System Timings on Rain Related Congestion 5 Report Date
June 2010
6 Performing Organization Code
7. Author(s)
Andrew J. Sullivan, Virginia P. Sisiopiku, Suman Reddy-Surhabi 8 Performing Organization Report
No. UTCA Report 07211
9 Performing Organization Name and Address
University of Alabama at Birmingham 1075 13th Street South Birmingham, AL 35294-4554
10 Work Unit No. (TRAIS)
11 Contract or Grant No.
12 Sponsoring Agency Name and Address University Transportation Center for Alabama Department of Civil and Environmental Engineering University of Alabama Box 870205, Tuscaloosa, AL 35487-0205
13 Type of Report and Period
Covered
14 Sponsoring Agency Code
15 Supplementary Notes
16 Abstract
It is known that inclement weather can affect traffic volumes, vehicle speeds, speed variance, saturation flow rates, and sometimes discharge rates from traffic signals. These parameters in turn can have a significant impact on the efficiency of traffic signal timing plans. Timing plans developed for dry conditions with good visibility may not be as effective under wet conditions with poor visibility, even for the same traffic volumes. Previous studies have looked at the effects of poor weather on traffic signal efficiency but they have focused primarily on winter weather conditions involving snow and ice, which have much more dramatic impacts on traffic flow. In regions like the South, rain is the primary adverse weather event and even though its effects on traffic flow may be smaller than snow or ice, its impacts can still be seen. This study sought to assess the impact of rain on traffic flow and determine whether there can be a meaningful benefit to developing and implementing signal timing plans specifically for rain events. Using simulations for two study corridors in Birmingham, Alabama, it was found that moderate and heavy rain events do impact traffic flow, increasing stops and average delays up to 6% compared to dry conditions. Signal timing plans optimized for wet conditions were found to reduce these delays, though in absolute terms the benefits were modest. It was found, however, that the effectiveness of rain-specific timing plans depended to a large extent on prevailing traffic volumes. An evaluation of potential costs and benefits resulting from rain-optimized signal timing plans found that the net benefits, at least in the two study corridors, are questionable. The analysis found that projected costs over a five-year life cycle would significantly exceed potential benefits. Rain-specific timing plans may have useful applications in certain corridors but the potential benefits and costs should be carefully evaluated beforehand.
17 Key Words
traffic signals, closed-loop signal systems, weather-related congestion
18 Distribution Statement
No restrictions.
19 Security Classification
(of this report) Unclassified
20 Security Classification
(of this page) Unclassified
21 No. of pages
37
22 Price
Form DOT F1700.7 (8-72)
iii
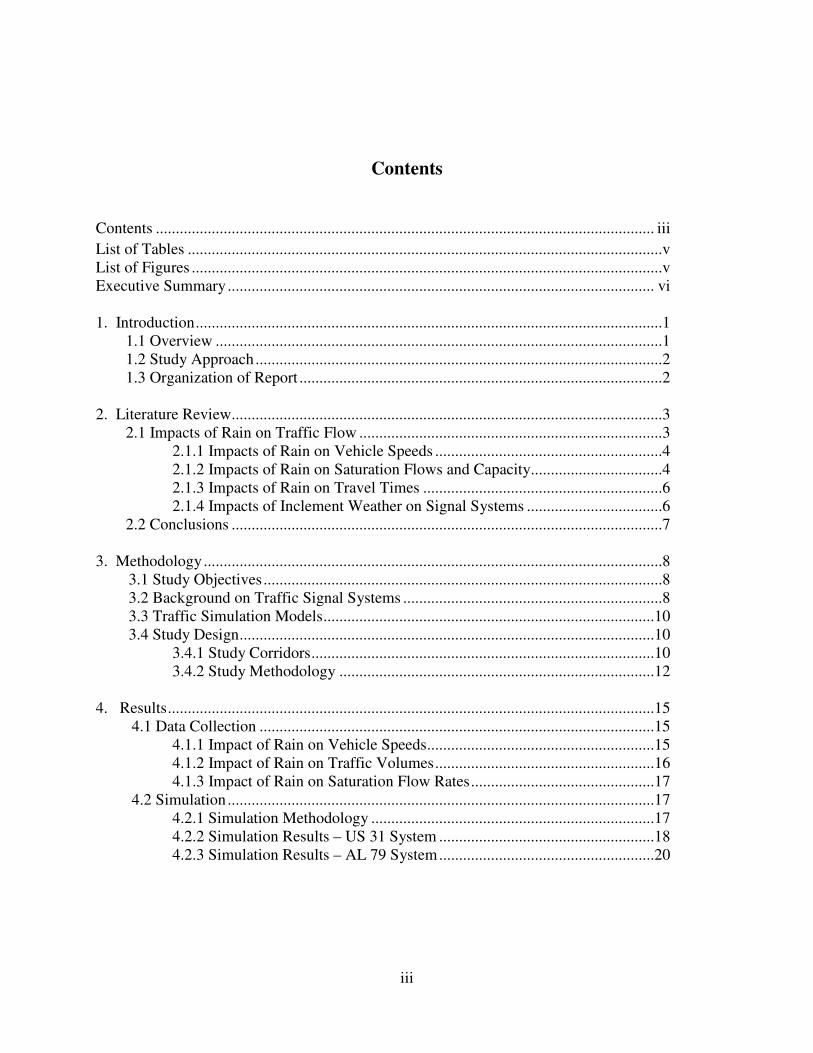
Contents
Contents ............................................................................................................................. iii
List of Tables .......................................................................................................................v List of Figures ......................................................................................................................v Executive Summary ........................................................................................................... vi 1. Introduction .....................................................................................................................1
1.1 Overview ................................................................................................................1 1.2 Study Approach ......................................................................................................2 1.3 Organization of Report ...........................................................................................2
2. Literature Review............................................................................................................3 2.1 Impacts of Rain on Traffic Flow ............................................................................3
2.1.1 Impacts of Rain on Vehicle Speeds .........................................................4 2.1.2 Impacts of Rain on Saturation Flows and Capacity .................................4 2.1.3 Impacts of Rain on Travel Times ............................................................6 2.1.4 Impacts of Inclement Weather on Signal Systems ..................................6
2.2 Conclusions ............................................................................................................7
3. Methodology ...................................................................................................................8 3.1 Study Objectives ....................................................................................................8 3.2 Background on Traffic Signal Systems .................................................................8 3.3 Traffic Simulation Models ...................................................................................10 3.4 Study Design ........................................................................................................10
3.4.1 Study Corridors ......................................................................................10 3.4.2 Study Methodology ...............................................................................12
4. Results ..........................................................................................................................15 4.1 Data Collection ...................................................................................................15
4.1.1 Impact of Rain on Vehicle Speeds .........................................................15 4.1.2 Impact of Rain on Traffic Volumes .......................................................16 4.1.3 Impact of Rain on Saturation Flow Rates ..............................................17
4.2 Simulation ...........................................................................................................17 4.2.1 Simulation Methodology .......................................................................17 4.2.2 Simulation Results – US 31 System ......................................................18 4.2.3 Simulation Results – AL 79 System ......................................................20
iv
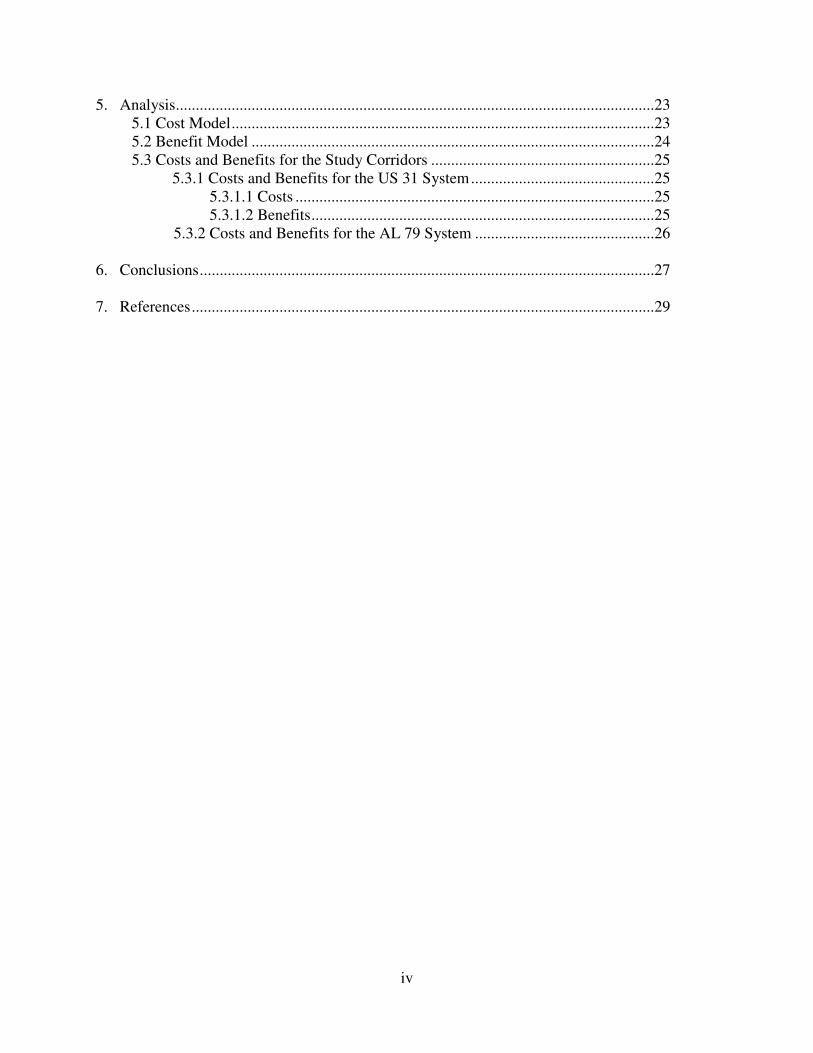
5. Analysis........................................................................................................................23 5.1 Cost Model ..........................................................................................................23 5.2 Benefit Model .....................................................................................................24 5.3 Costs and Benefits for the Study Corridors ........................................................25
5.3.1 Costs and Benefits for the US 31 System ..............................................25 5.3.1.1 Costs ..........................................................................................25 5.3.1.2 Benefits ......................................................................................25
5.3.2 Costs and Benefits for the AL 79 System .............................................26
6. Conclusions ..................................................................................................................27 7. References ....................................................................................................................29

v
List of Tables
Number Page 2-1 Impacts of weather events on traffic flow.............................................................3 2-2 Free flow speed and saturation flow reductions during adverse weather .............5 2-3 Reductions in capacity and operating speeds due to rain .....................................5 3-1 Study corridor characteristics .............................................................................12 4-1 Default simulation parameters ............................................................................17 4-2 Summary of simulation results ...........................................................................22 5-1 Estimated costs for developing and implementing timing plans ........................24 5-2 Variables used to estimate benefits .....................................................................25 5-3 Average hourly weekday traffic volumes ...........................................................26
List of Figures
Number Page 3-1 System A – Alabama Highway 79, Pinson, AL..................................................11 3-2 System B – US Highway 31, Homewood, AL ...................................................11 3-3 Simulation process ..............................................................................................14 4-1 Typical speed profile for AL Highway 79 southbound (dry conditions)............16 4-2 Typical speed profile for AL Highway 79 southbound (wet conditions) ...........16 4-3 Percent change in total stops during rain (US 31) ..............................................19 4-4 Percent change in average delay during rain (US 31) .........................................19 4-5 Percent change in total stops during rain (AL 79) ..............................................20 4-6 Percent change in average delay during rain (AL 79) ........................................21

vi
Executive Summary
Closed loop signal systems are widely used to enhance traffic flow within major transportation corridors. Like traditional time-of-day coordination systems, they can implement a series of pre-programmed signal timing plans to maintain optimal traffic flow throughout the day. Unlike traditional time-of-day systems, closed-loop systems can also be used to adjust signal system timings when traffic conditions deviate from typical patterns, such as during an incident, special event, or road construction. A typical closed-loop system will have a variety of cycle, offset, and split plan combinations available and will implement the most appropriate either according to a preset time-of-day plan or based on prevailing traffic conditions and selection criteria set by the traffic manager (traffic responsive). Each timing plan must be developed, programmed, and fine tuned beforehand, which can be an expensive process. For this reason, many agencies limit the number of available plans to a set that covers the most commonly encountered traffic conditions. In practice, most timing plans are developed using data gathered during typical operating conditions, i.e. daylight conditions with good visibility and a dry road. Weather events such as rain, snow, and fog can alter the traffic flow characteristics on a roadway. It is known that inclement weather can affect traffic volumes, vehicle speeds, speed variance, saturation flow rates, and sometimes discharge rates from traffic signals. These parameters in turn can have a significant impact on the efficiency of traffic signal timing plans. Timing plans developed for dry conditions with good visibility may not be as effective under wet conditions with poor visibility, even for the same traffic volumes. Previous studies have looked at the effects of poor weather on traffic signal efficiency but they have focused primarily on winter weather conditions involving snow and ice, which have much more dramatic impacts on traffic flow. In regions like the South, rain is the primary adverse weather event, and even though its effects on traffic flow may be smaller than snow or ice, its impacts can still be seen. This study sought to assess the impact of rain on traffic flow and determine whether there can be a meaningful benefit to developing and implementing signal timing plans specifically for rain events. It also sought to determine under what traffic conditions those benefits might be realized and whether the potential benefits would justify the associated costs. Using simulations for two study corridors in Birmingham, Alabama, it was found that moderate and heavy rain events do impact traffic flow, increasing stops and average delays up to 6% compared to dry conditions. Signal timing plans optimized for wet conditions were found to reduce these rain delays, though in absolute terms the benefits were modest. It was found, however, that the effectiveness of rain-specific timing plans depended to a large extent on prevailing traffic volumes. There was a range of traffic volumes between 40% and 80% of

vii
capacity for which rain-specific timings appeared to have the greatest effect. At very low or very high traffic volumes the rain-specific plans were found to provide smaller or even no benefits over timing plans optimized for dry conditions. An evaluation of potential costs and benefits resulting from rain-optimized signal timing plans found that the net benefits, at least in the two study corridors, are questionable. The analysis found that projected costs for a five-year life cycle significantly outweighed benefits for the two signal systems studied. Rain-specific timing plans may have useful applications in certain corridors but the potential benefits and costs should be carefully evaluated beforehand.

1
Section 1
Introduction
This report examines the impacts of rain on traffic flow and traffic signal system operation and assesses whether there can be significant benefits to developing and implementing signal timing plans specifically for rain conditions.
1.1 Overview
Closed loop signal systems are widely used to enhance traffic flow within major transportation corridors. Like traditional time-of-day coordination systems, they can implement a series of pre-programmed signal timing plans to maintain optimal traffic flow throughout the day. Unlike traditional time-of-day systems, closed-loop systems can also be used to adjust signal system timings when traffic conditions deviate from typical patterns, such as during an incident, special event, or road construction. A typical closed-loop system will have a variety of cycle, offset, and split plan combinations available and will implement the most appropriate either according to a preset time-of-day plan or based on prevailing traffic conditions and selection criteria set by the traffic manager (traffic responsive). Each timing plan must be developed, programmed, and fine tuned beforehand, which can be an expensive process. For this reason, many agencies limit the number of available plans to a set that covers the most commonly encountered traffic conditions. In practice, most timing plans are developed using data gathered during typical operating conditions, i.e. daylight conditions with good visibility and a dry road. Weather events such as rain, snow, and fog can alter the traffic flow characteristics on a roadway. It is known that inclement weather can affect traffic volumes, vehicle speeds, speed variance, saturation flow rates, and sometimes discharge rates from traffic signals. These parameters in turn can have a significant impact on the efficiency of traffic signal timing plans. Timing plans developed for dry conditions with good visibility may not be as effective under wet conditions with poor visibility, even for the same traffic volumes. Previous studies have looked at the effects of poor weather on traffic signal efficiency but they have focused primarily on winter weather conditions involving snow and ice, which have much more dramatic impacts on traffic flow. In regions like the South, rain is the primary adverse weather event and even though its effects on traffic flow may be smaller than snow or ice, its impacts can still be seen. This study seeks to assess the impact of rain on traffic signal operations and determine whether there can be meaningful benefits to developing and implementing signal timing plans specifically for rain events. It also seeks to determine under what conditions those benefits might be realized and whether the potential benefits justify the associated costs.

2
1.2 Study Approach
The study began with a review of literature related to weather and its impacts on traffic flow and traffic signal operations. Of particular interest were studies that attempted to quantify the impacts of weather on key traffic flow parameters such as volume, speed, saturation flow rates, and discharge rates. The study team then collected dry and ‘wet’ traffic data in the Birmingham region and compared the findings with results from similar studies. Two study corridors were selected to model the impacts of rain on signal system performance. The first study corridor was Highway 79 near Pinson, Alabama, which is a four-lane divided highway with high speeds, large signal spacings, and very low side friction. The second corridor was US 31 in Homewood, Alabama, which is a four-lane suburban facility with lower speeds, short signal spacings, and high side friction. Micro-simulation models were developed for each corridor and various combinations of dry and wet conditions were tested in an attempt to quantify the impacts of rain on signal system performance and to estimate any benefits that might result from implementing rain-specific timing plans. A cost-benefit analysis was also performed to determine whether the benefits of rain-specific timing plans would justify the additional costs entailed. The results are summarized along with recommendations for application to real-world signal systems.
1.3 Organization of the Report
The remainder of the report consists of a summary of the literature review, a brief overview of traffic signal systems, a discussion of the study methodology and model development, a presentation of the simulation results, and a cost benefit analysis.

3
Section 2
Literature Review
Relevant literature was reviewed to determine the impacts of rain on traffic flow and signal system performance. The goal was to identify:
• What traffic flow parameters are most affected by rain and reduced visibility
• On which parameters does rain have minimal effects
• How rain affects the performance of traffic signal systems
• How rain events can be analyzed using micro-simulation models
2.1 Impacts of Rain on Traffic Flow
A review of previous studies indicates that weather events such as rain, snow, fog, high winds, and extreme temperatures can reduce roadway capacity and affect driver behavior (Pisano and Goodwin 2005). Table 2-1 summarizes the impacts of weather events on roads and traffic. In general, snow and ice have been found to have more significant impacts on traffic flow than rain, and therefore much of the previous research has focused on those conditions. The literature search for this study was primarily concerned with the impacts of rain on traffic flow, since rain is the most common inclement weather condition in warmer regions like the South.
Table 2-1. Impacts of weather events on traffic flow (Goodwin and Pisano 2004) Weather Events
Roadway Environment Impacts Transportation System Impacts
Rain, Snow, Sleet, Hail, & Flooding
• Reduced visibility • Reduced pavement friction • Lane obstruction & submersion • Reduced vehicle stability & maneuverability • Increased chemical and abrasive use • Infrastructure damage
• Reduced roadway capacity • Reduced speeds & increased delay • Increased speed variability • Increased accident risk • Road/bridge restrictions & closures • Loss of communications/power services • Increased maintenance & operations costs
High Winds
• Reduced visibility due to blowing snow or dust • Lane obstruction due to windblown debris & drifting snow • Reduced vehicle stability & maneuverability
• Increased delay • Reduced traffic speeds • Road/bridge restrictions & closures
Fog, Smog, Smoke, & Glare
• Reduced visibility
• Reduced speeds & increased delay • Increased speed variability • Increased accident risk • Road/bridge restrictions & closures
Extreme Temperatures & Lightning
• Increased wild fire risk • Infrastructure damage
•Traffic control device failure •Loss of communications & power services •Increased maintenance & operations costs

4
Several sources did identify specific impacts of rain on traffic flow. Of particular interest were impacts on vehicle speeds, startup delay, saturation flow rates, and traffic volumes because these parameters are considered when developing signal system timing plans. A summary of rain impacts on these parameters follows.
2.1.1 Impacts of Rain on Vehicle Speeds
Vehicle speeds are an important consideration when developing traffic signal timings. Progression speed can affect offset and cycle length selection, and any significant changes in travel speeds can affect system performance. The concern for this study was whether rain can affect progression speeds enough to impact overall signal system efficiency. The impact of rain on vehicle speeds was therefore reviewed. The Federal Highway Administration, in a 1977 study of the economic impacts of adverse weather on highways, found that rain and wet road surfaces had little impact on freeway speeds (FHWA 1977). Later studies, however, have found that rain does in fact impact vehicle speeds on both highways and surface streets. The impact of rain may in fact be more pronounced on signalized arterials where frequent stopping and starting combined with reduced acceleration and deceleration rates can produce lower speeds. The literature suggests that speed reductions can generally be expected to be proportional to rain intensity. Lamm, et al. (1990) suggest that speed reductions are minimal during light rain events. May (1998), however, found speed reductions of up to 8% during light rain events and 17% during heavy rains. The Highway Capacity Manual (HCM) 2000, Chapter 22, provides information regarding speed and capacity reductions due to rain and snow of light and heavy intensities. The manual documents reductions in capacities between 0% and 15% and reductions in speeds due to light and heavy rains of 2 to 14% and 5 to 17%, respectively (National Academies 2000). Perrin, et al. (2002) found speed reductions during rain events of up to 10%, though intensity was not specified. Tantillo and Demetsky (2006) similarly observed speed reductions of 9.4% during heavy rain events, but speed reductions were observed to be less than 1.2 mph during light rain events. The Federal Highway Administration (FHWA 2008b) considered different studies and stated that the weather events can reduce arterial mobility and reduce the effectiveness of traffic signal timing plans. It was found that reductions in travel speeds ranged from 10 to 25% on wet pavement and 30 to 40% for snow and slushy pavement.
2.1.2 Impacts of Rain on Saturation Flow Rates and Capacity
It has been suggested that reduced visibility and reduced traction could increase startup headways at traffic signals and thereby reduce capacity. The literature was reviewed for previous research on this topic.

5
In a study by Perrin, et al. (2002) in Salt Lake City, Utah, over 30 hours of data were collected on 14 different inclement weather days. Table 2-2 shows free-flow speed and saturation flow reductions in adverse road weather conditions based on this analysis. The study reported an increase of 5% in start-up delay times on wet pavements along with an 8% increase in pedestrian crossing times. The Federal Highway Administration (FHWA 2008b) also found that travel time delay and start-up delay increased from 5 to 50% depending upon the severity of the weather event.
Table 2-2. Free-flow speed and saturation flow reductions during adverse road weather conditions (Perrin 2002)
Road Weather Conditions
Percentage Reduction in Speed
Percentage Reduction in Saturation Flow Rates
Dry 0 0 Rain 10 6 Wet and Snowing 13 11 Wet and Slushy 25 18 Wheel Path Slush 30 18 Snowy and Sticky NA 20
Martin and Perrin (2000) noted a 6% reduction in saturation flow rates during wet conditions and even greater reductions (11 to 21%) during snow and ice conditions. They also found that start-up lost time increased from 2.0 to 2.1 seconds during inclement weather events. Pisano and Goodwin (2004) noted that 3% reductions in saturation flow rates were found in a study of inclement weather in Burlington, VT. Tantillo and Demetsky (2006) found saturation flow reductions of 4.7% during wet weather at an isolated intersection in Virginia. A study by Agarwahl, et al. (2005) assessed changes in capacity and operating speeds during different weather conditions. In their study, researchers related the weather’s relative intensity (inches of rain or snow fall per hour) to traffic flows. Long-term traffic data (volumes and occupancies) were collected for four years, from January 2000 to April 2004. For analysis, the traffic data and weather data were combined using constraints of similar date, hour, and time intervals. Capacity and average operating speeds of freeways were determined according to rain intensity – for example, 0, less than 0.01, 0.01-0.25, and greater than 0.25 inches of rainfall/hour – and compared to the values provided in the HCM 2000. Results from this comparison are shown in Table 2-3.
Table 2-3. Reductions in capacity and operating speeds due to rain (Agarwahl 2005)
Variable Range Assumed corresponding categories from
HCM 2000
Capacities (% Reductions)
Average Operating Speeds (% reductions)
HCM 2000 Agarwahl
Study HCM 2000
Agarwahl Study
Rain (in/hr)
0 – 0.01 Light 0 1– 3 2 –14 1 – 2.5
0.01 – 0.25 Moderate 0 5 – 10 2 – 14 2 – 5
>0.25 Heavy 14-15 10 – 17 5 – 17 4 – 7

6
2.1.3 Impacts of Rain on Travel Times
Travel time in an arterial corridor can be an indirect yet useful indicator of signal system performance. Many motorists experience increased delays and travel times during weather events, and this has been confirmed by several studies.
One research study by Stern, et al. (2002) examined weather impacts on 33 bi-directional road segments in the Washington, D.C. metropolitan area from December 1999 to May 2001. Of these 33 segments, 18 were freeways totaling 472 miles and 15 segments were major arterials covering 239 miles. Reported travel time data and weather observation data were combined and used in a two-step regression analysis to predict travel time impacts under adverse road weather conditions. Initially, travel times were regressed against the weather variables of precipitation intensity (none, light rain/snow, heavy rain, or heavy snow/sleet), pavement condition (dry, wet, snowy, or icy), wind speed (<30 mph or ≥30 mph), and visibility (≥0.25 miles or <0.25 miles). In the second step, linear regression models for each road segment were reduced and used to predict normal travel time as well as increased travel time due to weather. Results showed that the average impact of precipitation in peak period was at least an 11% increase in travel times.
In major cities in the UK, traffic is monitored and controlled from Urban Traffic Control (UTC) centers, with the help of color closed circuit television (CCTV) and with a traffic operation system known as Split Cycle Offset Optimization Technique (SCOOT). A study performed by Gillam and Withill (1992) collected traffic data for 149 links from the Leicestershire UTC computers (from March 1991 to November 1991). The analysis revealed that for wet road conditions journey times tend to be 10 to 13% greater than that for dry roads. Moreover, a 6% reduction was observed in saturation flow rates during wet days compared to dry days.
2.1.4 Impacts of Inclement Weather on Signal Systems
Several studies have been undertaken to assess the impacts of inclement weather on signal systems, although most have been focused on winter weather events, where the impact on traffic flow is much greater than for rain.
A study performed by Maki (1999) for the Minnesota Department of Transportation developed a special signal-timing plan for snow and ice conditions in five coordinated, actuated traffic signals along a three-mile section of expressway in the Minneapolis/St. Paul metropolitan area. Simulation results indicated that weather-related signal timing plans were beneficial compared to normal signal timing plans as they led to vehicle delay time reductions of 8% per vehicle and a decrease in average stops of 6% per vehicle. In a study by Sadek and Agbolosu-Amison (2004), a simulation model was developed to evaluate the potential impact of implementing new signal timing plans for inclement weather conditions using the TRANSYT-7F software. The study found that while vehicle delays increased under wet conditions when signal timings remained unchanged, the increases in delay were smaller when signal timings were altered to account for wet conditions.
7
2.2 Conclusions
Based on the literature review, it was found that traffic volumes, speeds, and saturation flows can decrease while headways and travel times can increase during rainy conditions (compared to dry conditions). Vehicle speeds can be expected to decrease up to 10% under moderate to heavy rains. Saturation flow rates can be expected to decrease from 3 to 6% under rainy conditions. Traffic volumes can decrease anywhere from 0 to 10% based on rain intensity. Also the literature review has demonstrated that signal timing plans developed for inclement weather conditions can be beneficial in reducing travel time, reducing the number of stops, reducing delays, and increasing fuel efficiency. However, most of these studies focused on winter weather conditions (snow and ice), where event durations are typically longer and the benefits of signal timing changes are likely to be more dramatic. The primary inclement weather event in the southern United States is rain, which tends to have a smaller impact on traffic flow and therefore smaller potential benefit from modified signal timings. Furthermore, rain events in the South can be intense but of short duration, in some cases too short to be addressed effectively by signal timing adjustments. This study will attempt to address whether rain-specific timing plans can provide sufficient benefits to justify implementation costs.

8
Section 3
Methodology
This section presents the methodology used to evaluate the impacts of rain on signal system operation and determine whether rain-specific signal timing plans would provide benefits sufficient to justify the costs of implementation. It also provides background information on closed-loop signal systems and how they can be used to implement special signal timing plans.
3.1 Study Objectives
This study sought to answer four basic questions:
1. To what degree do rain events impact the efficiency of traffic signal systems? 2. To what extent can rain-specific timing plans improve traffic signal system
performance? 3. How do traffic conditions affect the benefits of rain-specific timing plans (traffic
volumes, signal density)? 4. Can the benefits provided by rain-specific signal timing plans justify the
implementation costs, and if so, under what types of operating conditions? Ultimately, this goal of this project was to determine whether it is worthwhile for public agencies to develop and implement rain-specific signal timing plans and under what conditions they should be considered. Using data gathered for two signal systems in the Birmingham region, signal optimization and micro-simulation tools were employed to assess the impacts of rain on signal system performance and the benefits of rain-specific timing plans.
3.2 Background on Traffic Signal Systems
Traffic signal systems are used to coordinate the operation of signals at multiple intersections to improve traffic flow and reduce stops and delays through a corridor. The efficiency of a signal system depends on prevailing traffic conditions and how well the pre-programmed timing plans match those conditions. Each timing plan consists of a system cycle length, intersection phase splits, and intersection offsets. Typically each system will have multiple timing plans developed to meet the range of traffic conditions expected throughout an average day. These timing plans can then be implemented based on time of day or in some cases based on prevailing traffic conditions.

9
Developing an optimum coordination plan depends on several factors, the most important of which are typically:
• Traffic volumes
• Vehicle speeds
• Lane capacities
• Signal spacing and density The literature review revealed that rain events can affect traffic volumes, vehicle speeds, and lane capacities, and the question therefore becomes whether they affect these factors enough to warrant special coordination plans for these periods. The majority of coordinated signal systems in Alabama are run on fixed timing plans, where preset coordination patterns are implemented according to the time of day and day of the week. These types of systems can function quite well when traffic volumes are predictable and congestion, if present, is of the recurring type. But because these systems are programmed based on typical conditions, they cannot effectively manage unexpected traffic patterns caused by weather, crashes, or roadway maintenance. Adverse weather conditions, for example, can reduce vehicle speeds and traffic flow to the point that timing plans developed for dry conditions may not efficiently serve traffic demand. This congestion can then be exacerbated if a signal system reverts to an off-peak timing pattern while there is still considerable traffic demand remaining. Closed-loop and traffic responsive signal systems are one way to address these types of unpredictable traffic conditions. Closed-loop systems allow communication between a central operator and each signal controller in a system. The operator can modify signal timings or change the timing plan the system is running from a remote location, allowing him to respond to unexpected (and usually major) traffic events such as crashes, construction, or special events. Traffic-responsive systems take this a step further and allow the signal system to automatically adapt to changing traffic conditions without operator intervention. Using sensors (typically embedded in the pavement) a master controller continuously monitors traffic conditions and implements preset timing plans based on actual traffic demand in an effort to optimize flow and minimize delays. What is perhaps most attractive about these signal systems is that the hardware required to operate them is already in place in most coordinated signal systems in Alabama. Almost all new coordinated systems installed by ALDOT include the master controller and communications hardware required for traffic-responsive operation. It has been suggested that closed-loop and traffic responsive signal systems could be used to address weather related congestion. If the benefits of rain-specific timing plans were to be demonstrated, these types of systems could be easily used to implement them, whether manually or automatically.

10
3.3 Traffic Simulation Models
It was decided to use traffic simulation models to evaluate the impacts of rain on traffic signal systems. Simulation models allow the analyst to replicate real-world conditions and perform experiments in a controlled environment without disrupting traffic operations. Once a model is developed and calibrated, a traffic engineer can perform different experiments by controlling selected variables and can determine their variations and impacts on system performance. Extensive work has been done by Zhang, et al. (2004) in assessing the suitability of the CORSIM model for use in weather-related traffic analysis. The authors performed detailed sensitivity analysis and presented guidelines for using the CORSIM model for weather-related traffic simulations. Zhang, et al. recommend that as a minimum the following parameters should be modified to accurately reflect inclement weather conditions:
• mean free flow speeds
• mean discharge headway (saturation flow)
• mean startup delay
• traffic demand For this study, the Synchro/SimTraffic model was selected for analysis because it incorporates a signal timing optimization tool as well as micro-simulation. This combination allowed the rapid testing of multiple scenarios and optimization strategies. The same factors recommended for adjustment by Zhang were adjusted in the SimTraffic model for this study. One potential weakness of this decision is that the SimTraffic model has not been tested as extensively for inclement weather scenarios as the CORSIM model has.
3.4 Study Design
The study evaluated the performance of two signal systems in the Birmingham region under both dry and rainy conditions. The efficiency of the systems was tested for a range of operating conditions that included varying traffic volumes, speeds, lost time, and capacities to simulate dry and rainy conditions. These scenarios were tested using both dry-optimum and rain-optimum timing plans and the differences were compared.
3.4.1 Study Corridors
Two study corridors were selected to provide different operating characteristics for analysis. Signal system A operates on Alabama Highway 79 in Pinson, Alabama. It is a system of nine signalized intersections in a corridor approximately five miles in length. It is a four-lane divided highway with a posted speed limit of 60 mph that serves primarily an industrial area. There are few access points between the signals, which means side friction is generally low and speeds between signals are typically high. This system was selected for its large signal spacings, relatively high speeds, and high truck volumes. System A is shown in Figure 3-1.

11
= Traffic Signal
Figure 3-1. System A - AL Highway 79, Pinson, AL
System B is located on US Highway 31 in Homewood, Alabama. It is a system of seven signalized intersections in a corridor approximately 0.85 miles in length. US 31 is a four-lane divided roadway in a densely developed suburban/commercial area with a posted speed limit of 40 mph. There are numerous driveways between the signalized intersections, which means that side friction between signals can be high. This system was chosen for its short signal spacings and lower speeds. The characteristics of the two study corridors are summarized in Table 3-1.
= Traffic Signal
Figure 3-2. System B – US Highway 31, Homewood, AL

12
Table 3-1. Study corridor characteristics
Signal System
Characteristic AL Highway 79 US 31
Speed Limit 60 mph 40 mph
Corridor length 5 miles 0.85 miles
Number of signals 9 7
Average signal spacing 2950 ft. 650 ft.
Side friction Low High
% Daily truck volumes 7% 3%
3.4.2 Study Methodology
The following work plan was developed to evaluate the impacts of rain on signal system efficiency:
Task 1: Literature review – presented in Section 2. Task 2: Corridor selection – discussed in Section 3.4.1. Task 3: Data Collection – an inventory was made of each system corridor. The inventory included intersection geometry, signal phasing, timing, travel speeds, travel times, and traffic volumes. Task 4: Model Development and Calibration – each study corridor was modelled in the Synchro software package. The Synchro package performs signal system optimization and also allows the creation of an input file for the SimTraffic simulation model. The SimTraffic models for each network were calibrated and validated using data gathered in Task 3. Task 5: Collection of Rain-Related Data – Data were collected during normal dry conditions and rain events to confirm weather impacts on key traffic flow parameters found in the literature. Electronic data collectors (Jamar Trax Flex HS) recorded speed and volume data for approximately six weeks. Periods of rain during that time were monitored and noted, primarily using publicly available weather radar data. Measurements were also taken of saturation flow rates during wet and dry conditions using handheld electronic data recorders (Jamar TDC-10). Task 6: Simulation. The Synchro and SimTraffic models were used to evaluate system performance during three scenarios:
1. Normal operations under “dry optimum” signal timing plans 2. Rain operations under “dry optimum” signal timing plans 3. Rain operations under “wet optimum” signal timing plans

13
Scenario 1 (dry conditions – dry optimum timings) modelled normal operations under signal timing plans developed for dry conditions. Scenario 2 (wet conditions – dry optimum timings) modelled operations under rainy conditions using the standard timing plans developed for dry conditions. This is in fact what typically occurs during rain events. Scenario 3 (wet conditions – wet optimum timings) modelled operations under rainy conditions using signal timing plans developed specifically for wet conditions. The simulation process is illustrated in Figure 3-3. Because past research has suggested that the effectiveness of weather-specific timing plans may depend on traffic flow levels, each scenario was run for a range traffic conditions corresponding roughly to 40, 60, 80, 100, and 110% of capacity for the progressed through movement. This v/c ratio applied to the through movements at the “critical” intersections in each system (i.e. the intersections with the highest intersection v/c ratio). While the critical intersections may have been operating at the assigned v/c ratios, other minor intersections within the system may have been operating at lower v/c ratios. Each “wet” scenario (2 and 3) was run for moderate rain intensity. Each run simulated one hour of operations and multiple runs were performed for each scenario using different seed numbers to develop average output values. Multiple runs were made until the average values converged. More runs were typically required for the higher volume (higher v/c ratio) scenarios because outputs tend to vary considerably as v/c ratios approach 1.0. Task 7: Analysis. The key measures of effectiveness (MOEs) analyzed for each scenario were system-wide delay (veh-hrs), average delay per vehicle (sec/veh), and total number of stops. Comparisons were made among these MOEs to quantify the impacts of rain on signal system performance. Task 8: Cost-benefit analysis. Benefit and cost models were used to determine whether the potential benefits of rain-specific timing plans would justify the costs of implementation.

14
“Dry” Input Parameters
• Volumes (low → capacity)
• FF Speeds
• Default headways
• Start-up delay
Develop Optimized System
Timings for “Dry”
Conditions (Synchro)
Simulate “Dry” System
Performance (SimTraffic)
Simulate “Wet” System
Performance using “Dry”
timings (SimTRaffic)
“Wet” Input Parameters
• Reduced Volumes
• Reduced FF Speeds
• Increased headways
• Increased Start-up delay
Output MOE’s
• System Delay
• Avg. Delay
• Stops
Develop Optimized System
Timings for “Wet”
Conditions (Synchro)
Simulate “Wet” System
Performance using “Wet”
timings (SimTraffic)
Figure 3-3. Simulation process
15
Section 4
Results
Results of the data collection and analysis are presented in the following sections.
4.1 Data Collection
It was decided to collect field data to measure the impacts of rain on key traffic flow parameters, namely traffic volumes, vehicle speeds, and saturation flow rates. These data were then compared to the values found in the literature. It was not the intention of this study to conduct a comprehensive investigation into these parameters; rather, it was intended simply to confirm that the data found in the literature were indeed applicable to the study corridors.
4.1.1 Impact of Rain on Vehicle Speeds
Electronic data recorders/classifiers were set out on Highway 79 for a six-week period. The recorders (Jamar Trax Flex HS) gathered speed and volume data continuously. Rain events during this time period were noted (time, duration, and estimated intensity) primarily using publicly available weather radar data. The 85th percentile speeds during rain events were then compared with 85th percentile speeds during adjacent time periods as well as corresponding time period on similar days. Three separate rain events of >1 hour duration occurred during the data collection period. Based on radar observations, rain intensity was light to moderate in all three cases. The data indicated that 85th percentile vehicle speeds decreased from 4% to 7% during rain events. These findings are consistent with the literature, and for the purposes of this study a 6% decrease in vehicle speeds was assumed for rain conditions. Sample speed profiles for dry and wet conditions are provided in Figures 4-1 and 4-2.
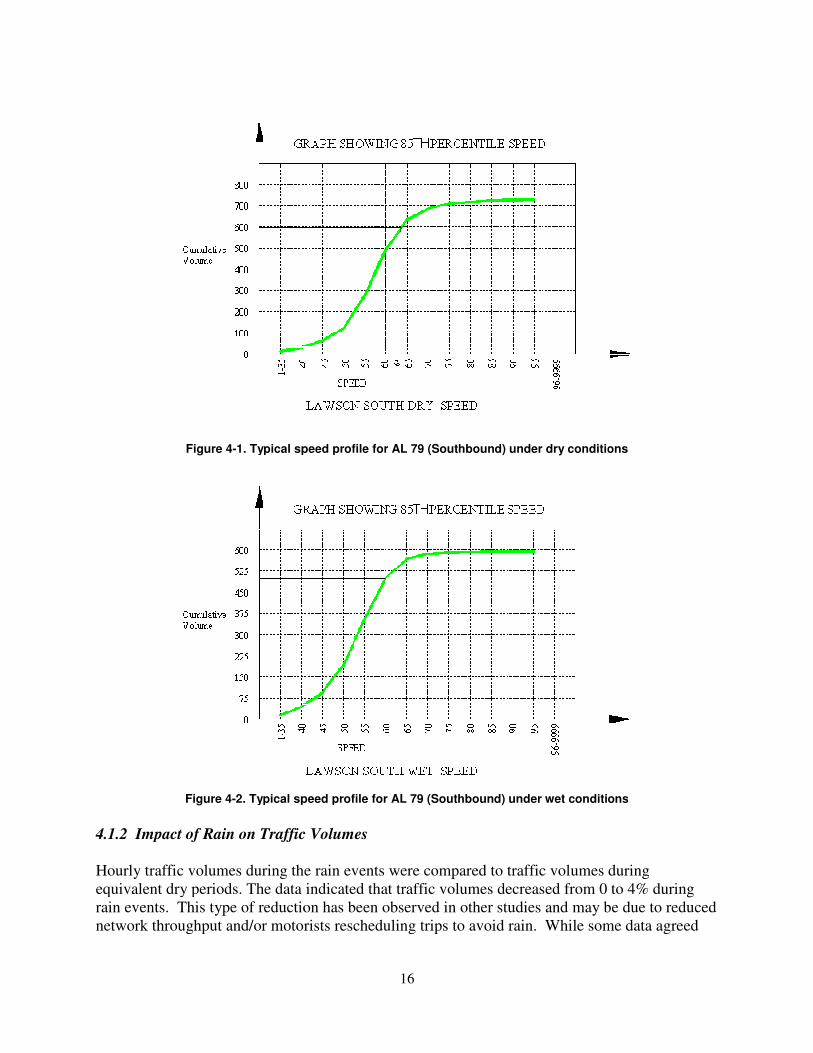
Figure 4-1. Typical speed profile
Figure 4-2. Typical speed profile
4.1.2 Impact of Rain on Traffic Volumes
Hourly traffic volumes during the rain events were compared to traffic volumes during equivalent dry periods. The data indicated that train events. This type of reduction has been observed in other studies and may be due to network throughput and/or motorists rescheduling trips to avoid rain.
16
1. Typical speed profile for AL 79 (Southbound) under dry conditions
2. Typical speed profile for AL 79 (Southbound) under wet conditions
Impact of Rain on Traffic Volumes
Hourly traffic volumes during the rain events were compared to traffic volumes during equivalent dry periods. The data indicated that traffic volumes decreased from 0 to rain events. This type of reduction has been observed in other studies and may be due to
motorists rescheduling trips to avoid rain. While some data
onditions
onditions
Hourly traffic volumes during the rain events were compared to traffic volumes during raffic volumes decreased from 0 to 4% during
rain events. This type of reduction has been observed in other studies and may be due to reduced some data agreed

17
with previous studies, the sample size was small and the volume reductions were inconsistent, so it was not possible to draw definitive conclusions.
4.1.3 Impact of Rain on Saturation Flow Rates
Observers recorded saturation flow rates at multiple study intersections during both dry and rainy conditions. The intensity of the rain events was noted and ranged from light to heavy, although the heavy rain intensities typically lasted only a few minutes. The durations of the light and moderate rain events varied from 20 to 60 minutes. Jamar TDC-10 data collectors were used to measure saturation flow rates for through and left-turn movements. A minimum of three signal cycles were required to obtain average saturation flow rates for rainy conditions. If the rain intensity was not sustained for at least three signal cycles the data were not used. Saturation flow rate reductions during rain events ranged from 0 to 4% for light rain and 3% to 9% for moderate rain intensities. The sample size was too small to draw conclusions for heavy rain intensities, since they often did not sustain that intensity for three signal cycles or more. The findings generally agree with those in the literature. Saturation flow rate reductions noted in other studies for light and moderate rain conditions have ranged from 3% to 10%. For the purposes of this study we assumed an average saturation flow rate reduction under moderate rain conditions to be 6-7%.
4.2 Simulation
Simulation of the two study corridors was performed as outlined in Section 3. It was decided to first model the networks under moderate rain conditions, since it would also provide an upper limit for assessing the impacts of lighter rain events. The following default values were used for the simulation:
Table 4-1. Default simulation parameters (moderate rain intensity) Parameter Dry Conditions Rain Conditions
Saturation flow rate 1900 1780 Mean free flow speed 85th percentile 85th percentile * 0.93 Mean startup delay 2.0 s 2.1 s Traffic volumes observed no change
It should be noted again that although some previous studies have found volume reductions associated with rain events (1-5%), our own data did not show a consistent correlation. No volume reductions associated with rain were assumed for the simulation analysis.
4.2.1 Simulation Methodology
Once each study corridor had been modeled and calibrated using field data, dry and wet simulations were performed for a range of traffic volumes. The purpose of varying the input traffic volumes was to determine if the impacts of rain are volume-dependent. It was decided to adjust volumes in the corridor so that the through-volumes at the critical intersections were progressively 40%, 60%, 80%, 100%, and 110% of capacity. Critical intersections within a signal system are those which operate at the highest overall v/c ratios. They typically limit the

18
volume of traffic that can be progressed through a system and tend to drive overall signal timings. The primary measures of effectiveness (MOEs) used to evaluate system performance were:
• total system delay (veh-hrs)
• total stop delay (veh-hrs)
• average delay (sec/veh)
• total stops (system)
4.2.2 Simulation Results – US 31 System
The simulation results for total system stops during rain events (scenarios 2 and 3) are shown in Figure 4-3. Average delay per vehicle is plotted in Figure 4-4. In each case, normal “dry” conditions serve as the baseline to which the rain/dry timing and rain/wet timing scenarios are compared. Figure 4-3 indicates that during moderate rain events, total stops in the US 31 system can be 3- 6% higher than during equivalent dry periods. However, the use of rain-specific timing plans could reduce those increases 1-5% depending on traffic conditions. The greatest benefits of rain-specific timing plans occur at traffic volumes between 40% and 80% of capacity. As the system exceeds 80% capacity, the differences in performance between dry signal timings and rain-specific signal timings become smaller. As the v/c ratio approaches 1.0 the benefits of rain-specific signal timings disappear. This is not surprising, given that as signal systems approach capacity coordinated system timings tend to lose their effectiveness, whether they are designed for wet or dry conditions. Conversely, at very low traffic volumes, signal systems tend to be less sensitive to minor changes in operating conditions and the benefits of rain-specific timings would also be expected to be smaller.

19
Figure 4-3. Percent increase in system stops during rain events (US 31 system)
Figure 4-4. Percent increase in average delay during rain events (US 31 system)
0.0%
1.0%
2.0%
3.0%
4.0%
5.0%
6.0%
7.0%
0.4 0.6 0.7 0.8 1
% I
ncr
ea
se i
n t
ota
l st
op
s v
s. d
ry c
on
dit
ion
s
v/c ratio (through volume)
dry timings
wet timings
0.0%
1.0%
2.0%
3.0%
4.0%
5.0%
6.0%
7.0%
0.4 0.6 0.7 0.8 1
% i
ncr
ea
se i
n a
vg
. d
ela
y p
er
ve
hic
le
vs.
dry
co
nd
itio
ns
v/c ratio (through volume)
dry timings
wet timings

20
A similar pattern can be seen in Figure 4-4. Under moderate rain conditions, average delay per vehicle was found to increase 4-5%. Rain-specific timing plans reduced this increase in delay to as little as 0.5% within certain traffic volume ranges. However, as was the case with system stops, the effectiveness of rain-specific timing plans appears to be volume-dependent. When traffic volumes are between 40% and 80% of capacity, rain-specific timing plans can provide improvements in traffic flow compared to optimum dry timing plans. Below 40% of capacity or above 80% of capacity, rain-specific timing plans do not appear to offer any significant reductions in vehicle delay.
4.2.3 Simulation Results – Highway 79 System
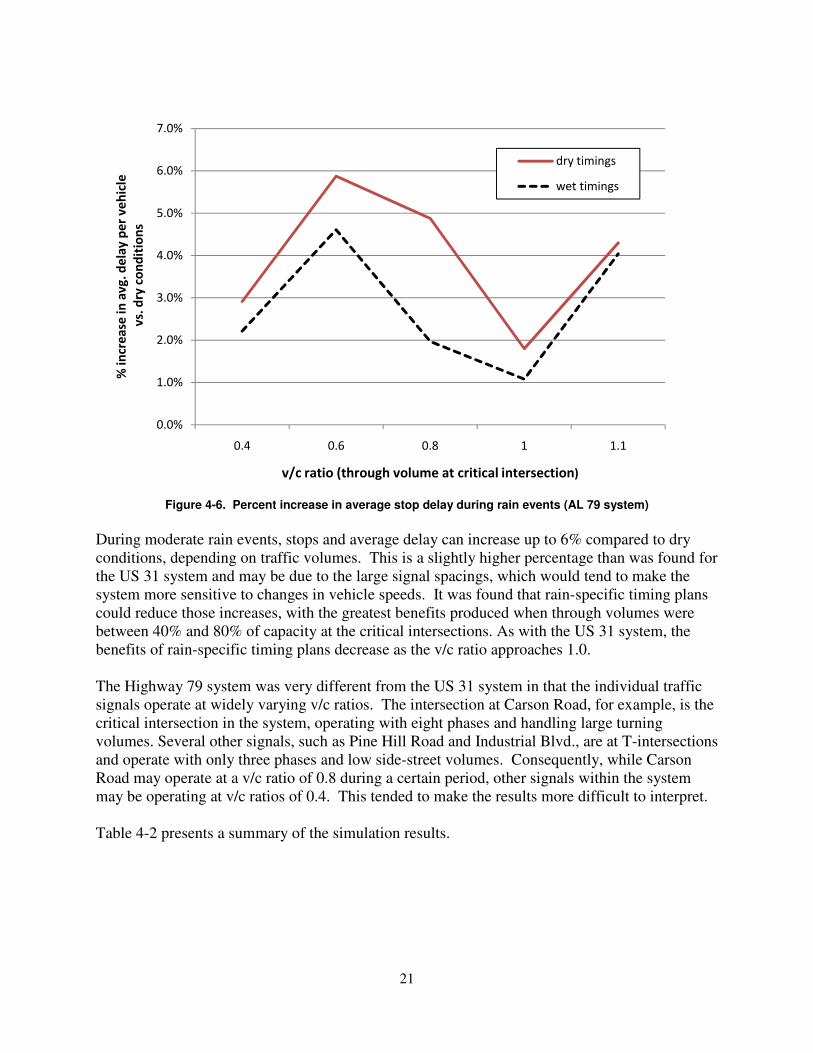
The simulation results for total stops during rain events (scenarios 2 and 3) are shown in Figure 4-5. Average stopped delay per vehicle is plotted in Figure 4-6. In each case, normal “dry” conditions serve as the baseline to which the rain/dry timing and rain/wet timing scenarios are compared.
Figure 4-5. Percent increase in system stops during rain events (AL 79 system)
-1.0%
0.0%
1.0%
2.0%
3.0%
4.0%
5.0%
6.0%
7.0%
0.4 0.6 0.8 1 1.1
% i
ncr
ea
se i
n t
ota
l st
op
s v
s. d
ry c
on
dit
ion
s
v/c ratio (through volume at critical intersection)
dry timings
wet timings
21
Figure 4-6. Percent increase in average stop delay during rain events (AL 79 system)
During moderate rain events, stops and average delay can increase up to 6% compared to dry conditions, depending on traffic volumes. This is a slightly higher percentage than was found for the US 31 system and may be due to the large signal spacings, which would tend to make the system more sensitive to changes in vehicle speeds. It was found that rain-specific timing plans could reduce those increases, with the greatest benefits produced when through volumes were between 40% and 80% of capacity at the critical intersections. As with the US 31 system, the benefits of rain-specific timing plans decrease as the v/c ratio approaches 1.0. The Highway 79 system was very different from the US 31 system in that the individual traffic signals operate at widely varying v/c ratios. The intersection at Carson Road, for example, is the critical intersection in the system, operating with eight phases and handling large turning volumes. Several other signals, such as Pine Hill Road and Industrial Blvd., are at T-intersections and operate with only three phases and low side-street volumes. Consequently, while Carson Road may operate at a v/c ratio of 0.8 during a certain period, other signals within the system may be operating at v/c ratios of 0.4. This tended to make the results more difficult to interpret. Table 4-2 presents a summary of the simulation results.
0.0%
1.0%
2.0%
3.0%
4.0%
5.0%
6.0%
7.0%
0.4 0.6 0.8 1 1.1
% i
ncr
ea
se i
n a
vg
. d
ela
y p
er
ve
hic
le
vs.
dry
co
nd
itio
ns
v/c ratio (through volume at critical intersection)
dry timings
wet timings

22
Table 4-2. Summary of simulation results
US Highway 31 System
v/c ratio of through volumes
Measure of Effectiveness (MOE) 0.4 0.6 0.7 0.8 1.0
Total Delay (veh-hrs)
Dry Conditions 40.1 91.6 - 114.8 148.6
Wet Conditions – Dry Timings 40.9 93.3 - 117.9 149.1
Wet Conditions – Wet Timings 41.2 91.7 - 118.4 148.7
Average Delay (sec/veh)
Dry Conditions 29.0 37.0 37.7 43.2 52.4
Wet Conditions – Dry Timings 30.3 38.5 39.2 45.5 53.5
Wet Conditions – Wet Timings 30.4 37.1 38.4 45.8 53.6
Total Stops
Dry Conditions 4483 8881 8290 9237 10506
Wet Conditions – Dry Timings 4685 9333 8721 9792 10851
Wet Conditions – Wet Timings 4579 8952 8572 9699 10852
AL Highway 79 System
v/c ratio of through volumes
Measure of Effectiveness (MOE) 0.4 0.6 0.8 1.0 1.1
Total Delay (veh-hrs)
Dry Conditions 65.3 77.9 113.9 165.2 179.6
Wet Conditions – Dry Timings 68.4 82.6 118.8 168.6 186.3
Wet Conditions – Wet Timings 67.4 79.5 115.3 165.9 186.8
Average Delay (sec/veh)
Dry Conditions 28.6 28.9 39.0 46.3 51.9
Wet Conditions – Dry Timings 29.5 30.6 40.9 47.2 54.2
Wet Conditions – Wet Timings 29.3 30.3 39.7 46.8 54.0
Total Stops
Dry Conditions 5033 5678 7326 8639 8719
Wet Conditions – Dry Timings 5357 6045 7715 8995 8820
Wet Conditions – Wet Timings 5298 5904 7522 8950 8708

23
Section 5
Analysis
Several conclusions were drawn from the simulation results:
1. Moderate rain increased stops and average delays in both signal systems 1-6%, depending on traffic volumes. Average stopped delay increased 2-6% depending on traffic volumes.
2. Rain-specific timing plans were found to reduce the increases in stops and delay associated with rain events – in some cases by half – but their effectiveness appears to be dependent on traffic volumes.
3. The greatest benefits from rain-specific timing plans occurred when the through volumes were between 40% and 80% of capacity at the critical intersections. Below 40% of capacity, rain-specific timing plans offered only small improvements over dry timing plans. Above 80% of capacity, rain-specific timing plains did not significantly improve traffic operations.
The question becomes whether these reductions in stops and delay are significant enough to justify the costs of implementing rain-specific timing plans. Several assumptions were made when computing the costs and benefits of rain-specific timing plans, namely:
• Rain-specific signal timings can be implemented without the purchase of new hardware or equipment. This is a reasonable assumption given that most new signal systems include the communications equipment necessary for special timing plan implementation.
• The values of time and vehicle occupancy were unknown for Alabama. For the purposes of this study, the values of time and vehicle occupancy from a signal timing study in New Jersey were used (Chien, et al. 2006).
• Gas prices will vary; at the time of this study the unit price of gas was $2.50 per gallon, which was used for calculating potential benefits.
5.1 Cost Model
Chien, et al. (2006) developed a methodology to compute the costs and benefits for signal timing optimization projects. The cost model comprises three primary components: equipment, engineering, and administrative costs. The assumption was made that rain-specific timing plans could be implemented without additional hardware costs. Engineering costs include data collection, generation of timing plans, and field-adjustment of the timing plans. Administrative costs for implementing the timing plans include the nominal cost for an employee or technician (assumed to be already employed) to implement the correct timing plans during significant rain events. Estimates of assumed costs for each component are shown in Table 5-1.

24
Table 5-1. Estimated costs for developing and implementing timing plans Component Cost
Equipment $0 Engineering $5000/ intersection
Administration $2500 / year
Engineering costs will be dependent on the size of a system (number of signals) while administration costs per system were assumed to be constant regardless of system size. For both the cost and benefit models a life-cycle of five years was assumed. This is based on a recommended re-timing interval of three years for signal systems (Srinivasa 2004) but recognizing that in reality most agencies do not re-time signals that frequently.
5.2 Benefit Model
The benefit model used was an abbreviated version of the Chien, et al. (2006) model and consisted of two components, namely road user’s time and fuel consumption. These components are determined based on vehicle composition, speed, travel time, value of time, and vehicle occupancy. More specifically, the reduced road user’s time cost can be derived from the saved travel time multiplied by the value of the user’s time. Travel time savings are based on the difference in delays experienced under optimal signal timing plans for dry and rain-specific signal timing plans. The delay estimated from SimTraffic is vehicle based. Therefore, by introducing vehicle occupancy, the user cost can be converted into traveler-based cost savings. According to the Highway Economic Requirements Systems, the vehicle occupancy-weighting factor can be obtained using the following equation (Chien, et al. 2006):
VWF = (VOC * (Vs /100)) auto + (VOC * (Vs /100)) truck
where: VWF = vehicle occupancy weighting factor (persons per vehicle) VOC = average vehicle occupancy (persons per vehicle) Vs = vehicle split ratio (percentage).
Therefore, the road user’s cost saving is calculated as:
TSRU = VT * VWF * DS
where: TSRU = road user’s cost saving ($) VT = value of time ($ per person-hour) DS = travel time saving (vehicle-hours obtained from Sim Traffic)
Fuel savings are based on reduced fuel consumption resulting from the implementation of rain-specific signal timing plans multiplied by unit price of gasoline (Chien, et al. 2006).
FS = ∆FC * Pf

25
where: FS = reduced fuel consumption cost ($)
∆FC = reduced fuel consumption (gallons) X Pf = Unit price of gasoline ($ per gallon)
The values used to compute benefits are summarized in Table 5-2.
Table 5-2. Variables used to estimate timing benefits
Variable Value
Cars Trucks Value of time VT (NJDOT 2001) $12.75 $21.25 Vehicle occupancy VOC (NPTS 1995) 1.59 1 Gas unit price $2.50
5.3 Costs and Benefits for the Study Corridors
The costs and benefits of rain-specific timing plans were computed for each study corridor using the models described previously and the SimTraffic simulation results. It has been demonstrated that the benefits yielded by rain-specific timing plans will likely vary according to traffic volumes, so the initial calculations were based on the maximum benefit condition and then adjusted to reflect typical traffic conditions.
5.3.1 Costs and Benefits for the US 31 System
5.3.1.1 Costs. The costs to implement rain specific system timings for the US 31 system were estimated as (7 * $5000/intersection) = $35,000 per intersection for engineering and (5 * $2500/year) = $12,500 a year for administration. The total cost for a five-year life cycle is estimated at $47,500. 5.3.1.2 Benefits. The timing benefits were estimated as follows:
TSRU auto = VT * DS = (1.6*$12.75*0.97) = $19.79 for autos TSRU truck = VT * DS =(1.6*$21.25*0.03) = $1.02 for trucks FS = 6.2 gallons * $2.50 = $15.50
Total benefits per hour would equal $36.31/hour. This figure represents a maximum savings under optimum volume conditions. Under very low or high traffic volume conditions, rain-specific timings will likely generate little or no benefit. To estimate the potential annual benefits to be gained from implementing rain-specific timing plans it was necessary to characterize the conditions under which they would most likely generate benefits.
• Volumes – benefits will most likely be accrued when through volumes range between 40% to 80% of capacity. Volume conditions outside this range may result in small or no benefits.
• Rain duration – signal systems typically require two to three cycles to fully transition from one timing pattern to another. Depending on the cycle length, this can translate to six to eight minutes or more. Traffic may then require an

26
additional cycle or two to reach stable flow. During this eight to ten minute transition period delays and stops may increase, negating some of the benefits of the rain-specific timing plan. Given the relatively small benefits generated by rain-specific timing plans, it is likely that a minimum event duration of one hour would be required before benefits begin to accrue.
National Weather Service (NWS) historical data indicate that there were 122 days between April 2008 and March 2009 with some type of rain in Birmingham. Of these, only 43 days had occurrences of what the NWS classified as “moderate” or “heavy rain.” Durations of these rain events are not known, but for analysis purposes it was assumed that the heavy rains averaged two hours per day. It was also assumed that the rain events were distributed fairly evenly throughout the days in question. In a typical 24-hour period, it was assumed that traffic volumes in the system will vary between light and heavy, depending on time of day. Based on traffic counts, it was estimated that traffic volumes would fall into the following broad categories based on when rain-specific timing plans are most effective:
Table 5-3. Average hourly weekday traffic volumes
v/c ratio (through volumes)
Hours per day
% of total Impact of timing
plans
< 0.4 8 33 Low 0.4 – 0.8 10 42 Mod - High
> 0.8 6 25 Low
Assuming a best-case scenario in which every heavy rain was of at least 2 hours duration, and 42% of these occurred during times of the day when rain-specific timing plans would have maximum benefits, the estimated annual benefits would be: Annual Benefit = (43 * 0.42 * 2 * $36.31) = $1312 Over five years, this would accrue to a total benefit of approximately $6560. There are of course many assumptions and variables in this calculation, but as an order of magnitude estimate it demonstrates that the anticipated costs ($47,500) would likely outweigh the benefits of implementing rain-specific timing plans. In the case of the US 31 system, the net benefits of implementing these timings would equal less than 15% of the total cost.
5.3.2 Costs and Benefits for the AL 79 System
Similar cost and benefit calculations were performed for the AL 79 system. The five-year cost of implementation for a nine-signal system was estimated to be $57,500. The total benefits were estimated to be $15,700. Again, there are assumptions that could be varied either to the net benefit or cost, but as an order-of-magnitude estimate it demonstrates that estimated costs would outweigh benefits by nearly 3 to 1. The net benefits of implementing rain-specific timing plans in this system are unlikely to justify the costs.

27
Section 6
Conclusions
Based on the simulation results and analysis the following conclusions are drawn:
• Moderate to heavy rain events impact signal system performance. Simulation results that rain can increase stops and average delays by up to 6% under certain conditions.
• Rain-specific timing plans can reduce stops and delays during rain events, though in absolute terms the benefits were modest.
• The effectiveness of rain-specific timing plans appears to be dependent on traffic volumes. In both study corridors, the maximum reductions in average delay occurred when the progressed through volumes were between 40% and 80% of capacity. Below 40% capacity and above 80% capacity, rain-specific timing plans provided much smaller or no benefits.
• The net benefit of implementing rain-specific timing plans is questionable. A cost-benefit analysis for the two study corridors found the potential costs would significantly outweigh the potential benefits, with the majority of the cost associated with the development of the timing plans themselves. Even assuming a 10-year retiming cycle, the implementation costs in our two study systems would still outweigh the potential benefits over that time span.
• The relatively small gains resulting from rain-specific timing plans suggest that their effectiveness would also be limited to moderate and heavy rain events of longer durations (i.e. >1 hour). Implementation would likely be limited to certain corridors where conditions favor their effectiveness (e.g. frequent rain events of long duration and traffic volumes within ranges that enhance the effectiveness of rain-specific timing plans). Each candidate corridor would have to be analyzed individually to determine whether there was justification for rain-specific timing plans.
• The above conclusions relate to the implementation of rain-specific timing plans in closed loop signal systems. Closed loop systems would require the development and field-tuning of multiple timing plans as part of any such implementation, and this can be costly. However, the simulations indicate that adaptive signal control systems, which can optimize timings automatically, could provide very real benefits during rain events.
• The use of automatic rain detection equipment along with closed loop signal systems would not significantly alter the overall cost-benefit relationship. The majority of the

28
costs associated with implementing rain-specific timing plans lies in the cost of developing and fine-tuning the plans, not day-to-day administration. Even assuming a 10-year retiming cycle, the timing plan development costs in the two study systems would outweigh the potential benefits over that time span.

29
Section 7
References
Agarwal, Manish, Thomas H. Maze, and Reginald Souleyrtte. “Impact of weather on urban freeway traffic flow characteristics and facility Ccapacity.” Center for Transportation Research and Education, Iowa State University, Final Technical Report, August 2005.
Agbolosu-Amison, S.J., A.W. Sadek, and B. Henry. “Factors affecting the benefits of implementing special timing plans for inclement weather conditions.” Transportation Research Board (TRB) 2005 Annual Meeting.
AlabamaGasPrices.com. Online at http://www.alabamagasprices.com/. Accessed on September 25, 2008.
California Center for Innovative Transportation. “ITS decision: A guide to understanding and applying intelligent transportation systems.” University of California at Berkeley. Online at http://www.calccit.org/itsdecision/serv_and_tech/Traffic_signal_control/trafficsig_report.html, Accessed February 13, 2008.
Chien, S.I., K. Kim, and J. Daniel. “Cost and benefit analysis for optimized signal timing – case study: New Jersey Route 23.” ITE Journal. October 2006.
City of Mission Viejo, California. Online at http://cityofmissionviejo.org/depts/pworks/trafficsignal.pdf. Accessed on March 26, 2008.
City of Pasadena, California. Online at http://www.ci.pasadena.ca.us/trans/trafficoperations/pdf/Traffic_Signal.pdf. Accessed on March 26, 2008.
Federal Highway Administration, Institute of Transportation Engineers, American Public Works Association, American Association of State Highway and Transportation Officials International Municipal Signal Association, and Intelligent Transportation Society of America. National Traffic Signal Report Card: Technical Report 2007. Online at http://www.ite.org/reportcard/technical_report%20final.pdf. Accessed on March 26, 2008.
FHWA (Federal Highway Administration). US Department of Transportation. 2008a. Online at http://ops.fhwa.dot.gov/wz/resources/final_rule/wzi_guide/appb.htm. Accessed on April 22, 2008.
FHWA (Federal Highway Administration). “Road weather management program.” US Department of Transportation. 2008b. Online at http://www.ops.fhwa.dot.gov/weather/q1_roadimpact.htm. Accessed on April 5, 2008.
Gillam, W.J. and R.A. Withill. “UTC and inclement weather conditions.” 1992. Online at http://ieeexplore.ieee.org/iel3/2949/8340/00363747.pdf. Accessed on April 1, 2008.
Goodwin, L.C. “Weather impacts on arterial traffic flow.” Mitretek Systems, Inc., December 2004. Online at http://ops.fhwa.dot.gov/weather/best_practices/ArterialImpactPaper.pdf. Accessed on March 31, 2008.
Greater Birmingham Convention & Visitors Bureau. Online at http://www.birminghamal.org/about-weather.asp. Accessed on September 18, 2008.
Husch, D. and J. Albeck. Traffic Signal Software – User

30
Guide. Synchro Trafficware Ltd, 2006. Online at http://www.trafficware.com/assets/pdfs/00029.pdf. Accessed on May 15, 2008.
HVCEO (Housatonic Valley Council of Elected Officials). Traffic Signal Coordination Hand Book. Online at http://www.hvceo.org/transport/signal_coordination.php. Accessed on July 22, 2008.
ITE (Institute of Transportation Engineers). “A report on the use of traffic simulation models in the San Diego region.” California Border Section, Highway Capacity Task Force. Online at http://www.westernite.org/Sections/CalBorder/simulation.pdf. Accessed on April 6, 2008.
Lamm, R., E.M. Choueiri, and T. Mailaender. “Comparison of operating speeds on dry and wet pavements of two-lane rural highways.” Transportation Research Record 1280, Transportation Research Board, National Research Council, Washington, DC, 1990.
Liang, W.L., M. Kyte, F. Kitchener, and P. Shannon. “Effect of environmental factors on driver speed.” Transportation Research Board (TRB) 1998 Annual Meeting.
Maki, P.J. “Adverse weather traffic signal timing.” Short Elliott Hendrickson, Inc., 1999. Online at http://www.trafficware.com/assets/pdfs/00005.pdf. Accessed on April 1, 2008.
May, A.D. Capacity and Level of Service for Freeway Systems. National Cooperative Highway Research Program, Third Interim Report, Phase C, Tasks C1 to C10. Washington, DC, 1998.
National Academies. Highway Capacity Manual 2000. Transportation Research Board. Washington, D.C., 2000.
“National Personal Transportation Survey.” 1995. Online at http://www.allcountries.org/uscensus/1033_national_personal_transportation_survey_npts_summary.html. Accessed on September 25, 2008.
Nicholas, A. and D. Bullock. “Design guidelines for deploying closed loop systems.” Joint Transportation Research Program, Purdue Libraries, 2001.
NJDOT (New Jersey Department of Transportation). Road User Cost Manual. 2001. Papacostas, C.S., and P.D. Prevedouros. Transportation Engineering and Planning. 3rd edition.
University of Hawaii at Manoa, Honolulu, Hawaii, 2001. Perrin, J., P. Martin, and B. Hansen. “Modifying signal timing during inclement weather.” Presented
at the 2002 Institute of Transportation Engineers Annual Meeting, 2002. University of Utah Traffic Lab.
Pisano, P., and L. Goodwin. Research Needs For Weather Responsive Traffic Management. Online at http://ops.fhwa.dot.gov/weather/best_practices/WxRspTfcMgmtTRB2004.pdf. Accessed on April 25, 2008.
Pisano, P., and L. Goodwin. “Another rain delay: Roadway managers are tackling the problem of weather-induced congestion head on.” Public Roads. Vol. 68, no. 3. November-December 2004.
Roess, R.P., E.S. Prassas, and W.R. McShane. Traffic Engineering. 3rd Edition. 2004. Sadek, A. and S.J. Agbolosu-Amison. “Validating traffic simulation models to inclement weather
travel conditions with applications to arterial coordinated signal systems.” 2004. Online at http://docs.trb.org/00983592.pdf. Accessed on April 6, 2008.
“Signal Timing.” Online at http://kiewit.oregonstate.edu/pdf/pw_sigtime.pdf. Accessed on March 3, 2008.
Srinivasa, Sunkari. “The benefits of retiming traffic signals.” ITE Journal. Pp. 26-31. April 2004. Stern, A.D., V. Shah, L. Goodwin, and P. Pisano. “Analysis of weather impacts on traffic flow in
Metropolitan Washington, DC.” Mitretek Systems. Presented at the 2003 American Meteorology Society Annual Meeting, 2002. Online at http://ops.fhwa.dot.gov/weather/best_practices/AMS2003_TrafficFlow.pdf. Accessed on April 1, 2008.

31
Tantillo, M. and M.J. Demetsky. Investigating the Impacts of Rainy Weather at Isolated Signalized Intersections. Center for Transportation Studies at the University of Virginia, Research Report UVACTS-15-13-90, January, 2006. Online at http://cts.virginia.edu/docs/UVACTS-15-13-90.pdf.
Unaru, D. and J. Andrey. “Driver response to rainfall on an urban expressway.” Transportation Research Board (TRB) 2006 Annual Meeting.
Vielkanowitz D. “Types of traffic control systems.” Traffic Engineering Conference, May 13-15, 2003, High Point, NC. Online at http://www.ncdot.org/doh/PRECONSTRUCT/traffic/conference/reports/si2_5.pdf. Accessed on March 26, 2008.
Zhang, L., P. Holm, and J. Coylar. “Identifying and assessing key weather-related parameters and their impacts on traffic operations using simulation.” Federal Highway Administration, FHWA-HRT-04-131, September 2004.