Embed Size (px)
Citation preview

TitleImpacts of moso bamboo (Phyllostachys pubescens) invasionon dry matter and carbon and nitrogen stocks in a broad-leavedsecondary forest located in Kyoto, western Japan
Author(s) Fukushima, Keitaro; Usui, Nobuaki; Ogawa, Ryo; Tokuchi,Naoko
Citation Plant Species Biology (2014), 30(2): 81-95
Issue Date 2014-10-21
URL http://hdl.handle.net/2433/200692
Right
This is the peer reviewed version of the following article:Fukushima, K., Usui, N., Ogawa, R. and Tokuchi, N. (2015),Impacts of moso bamboo (Phyllostachys pubescens) invasionon dry matter and carbon and nitrogen stocks in a broad-leavedsecondary forest located in Kyoto, western Japan. Plant SpeciesBiology, 30: 81‒95., which has been published in final form athttp://dx.doi.org/10.1111/1442-1984.12066. This article maybe used for non-commercial purposes in accordance with WileyTerms and Conditions for Self-Archiving.; This is not thepublished version. Please cite only the published version. この論文は出版社版でありません。引用の際には出版社版をご確認ご利用ください。
Type Journal Article
Textversion author
Kyoto University
1
Title: 1
Impacts of moso bamboo (Phyllostachys pubescens) invasion on dry matter, and carbon and 2
nitrogen stocks in a broad-leaved secondary forest located in Kyoto, western Japan 3
4
5
Authors: 6
Keitaro Fukushima 1, *, Nobuaki Usui 2, Ryo Ogawa 2, Naoko Tokuchi 1 7
8
Affiliation: 9
1: Field Science Education and Research Center, Kyoto University, Kyoto 606-8502, Japan 10
2: Graduate School of Agriculture, Kyoto University, Kyoto 606-8522, Japan 11
12
* Corresponding author; Keitaro Fukushima 13
(Present affiliation and address) Faculty of Urban Environmental Sciences, Tokyo Metropolitan 14
University, 1-1 Minami-osawa, Hachioji city, Tokyo 192-0397, Japan 15
Tel; +81-42-677-1111 16
Email; [email protected] 17
18

2
Abstract 19
In western and central Japan, the expansion of exotic moso bamboo (Phyllostachys pubescens Mazel 20
ex J. Houz.) populations into neighboring vegetation has become a serious problem. Although the 21
effects of bamboo invasion on biodiversity have been well studied, shifts in nutrient stocks and 22
cycling, which are fundamental for ecosystem functioning, are not fully understood. To explore the 23
effects of P. pubescens invasion on ecosystem functions, we examined above- and belowground dry 24
matter, and carbon (C) and nitrogen (N) stocks, in a pure broad-leaved tree stand, a pure bamboo 25
stand, and two tree–bamboo mixed stands with different vegetation mix ratios in the secondary 26
forest of Kyoto, western Japan. In the process of invasion, bamboo shoots offset broad-leaved tree 27
deaths; thus, no clear trend was apparent in total above- or belowground biomass or in plant C and N 28
stocks during invasion. However, the ratio of aboveground to belowground biomass (T/R ratio at the 29
stand level) decreased with increasing bamboo dominance, especially in the early stages of invasion. 30
This shift indicates that rapid bamboo rhizomatous growth is a main driver of substantial changes in 31
stand structure. We also detected rises in the C/N ratio of forest-floor organic matter during bamboo 32
invasion. Thus major impacts of P. pubescens invasion into broad-leaved forests include not only 33
early shifts in biomass allocation, but also changes in the distribution pattern of C and N stored in 34
plants and soil. 35
36
Keywords: allocation pattern, bamboo invasion, carbon and nitrogen stocks, Phyllostachys 37
pubescens, stand structure. 38

3
Introduction 39
40
Moso bamboo (Phyllostachys pubescens Mazel ex J. Houz.), one of the largest bamboo species in 41
the world, was introduced from China into western Japan about 300 years ago for use as human food 42
(young sprouts) and other products (adult culms) (Suzuki 1978; Shibata 2003). The species has been 43
transplanted across a wide range of areas in western and central Japan, where well-managed 44
plantation forests were established. Since the 1980s, most of these forests have been abandoned due 45
to rapid declines in domestic bamboo industries. 46
Like other bamboo species, P. pubescens has active rhizomatous clonal growth. The 47
belowground rhizome system is leptomorphic; it grows laterally, allowing rapid, widespread 48
expansion of ramets (Makita 1998). Furthermore, young shoots quickly reach full heights of 10–20 49
m matching those of well-developed canopy trees. These growth capabilities probably facilitate 50
invasions of neighboring secondary broad-leaved forests and/or coniferous plantations, whereby the 51
bamboos rapidly become dominant components of the vegetation and often form pure stands in 52
previously deciduous or coniferous vegetation (Isagi & Torii 1998; Suzuki & Nakagoshi 2011; 53
Suzuki 2014). A clear risk of losing biodiversity and ecosystem functioning exists when exotic giant 54
bamboos establish near-monospecific stands in previously diverse woodlands. Studies are urgently 55
required to identify the relationships between growth characteristics of P. pubescens, its 56
overwhelming invasion impacts, and ecosystem functioning. 57
Many studies have reported losses of plant diversity following P. pubescens invasion (Nakai & 58

4
Kisanuki 2006; Zhang et al. 2010; Akutsu et al. 2012; Bai et al. 2013). However, few studies have 59
reported on the effects of invasion on the sizes of carbon (C) and nitrogen (N) stocks or their cycling. 60
Information on these parameters is crucial for better understanding of ecosystem functioning before 61
and after invasion. However, data on the biogeochemical characteristics of pure bamboo forests are 62
available. For example, Isagi et al. (1997) showed that values of gross production and belowground 63
C allocation in P. pubescens stands are higher than those in temperate broad-leaved and/or 64
coniferous forest stands. The canopy of P. pubescens forest has higher N contents (Li et al. 1998) 65
and elevated transpiration rates (Komatsu et al. 2010) in comparison with broad-leaved and/or 66
coniferous forest, suggesting that the canopy photosynthetic rate may be higher in P. pubescens 67
stands than in native forest vegetation (Yen & Lee 2011). These characteristics are likely common to 68
other bamboo species under various climatic conditions (Isagi 1994; Tripathi & Singh 1996; Tu et al. 69
2013). 70
Previous research on the impacts of bamboo invasions and/or range expansions on C and N 71
biogeochemistry in Japan have focused on the understory dwarf species Sasa kurilensis (Rupr.) 72
Makino & Shibata, which has growth traits similar to those of P. pubescens with the exception of 73
culm height (Tripathi et al. 2005; Watanabe et al. 2013; Fukuzawa et al. 2014). These works have 74
shown that S. kurilensis contributes greatly to C and N retention and their cycling in broad-leaved 75
forest biomass and soils, but bamboo invasion and replacement of vegetation in native forests were 76
not included in the scope of these studies. 77
Thus, our objective in this study was to describe the effects of invasion of giant bamboo, P. 78

5
pubescens, into secondary broad-leaved forest on (i) dry matter mass, (ii) C stocks, and (iii) N stocks 79
in both plants and soils. We measured these parameters in above- and belowground plant parts, and 80
in soil horizons of a secondary forest, in a pure P. pubescens stand, and in two mixed forest stands 81
that differed in the degree of bamboo invasion. 82
83
84
Materials and methods 85
86
Study site 87
88
Fieldwork was conducted on Mt. Tennozan located on the boundary between Kyoto and Osaka 89
prefectures in western Japan (34°54′N, 135°46′E; Fig. 1). Mean annual temperature and precipitation 90
at the nearest weather station (AMeDAS) were 15.3°C (2001–2010, AMeDAS Kyotanabe, 34°50′N, 91
135°46′E) and 1459 mm (2001–2010, AMeDAS Nagaokakyo, 34°56′N, 135°41′E), respectively. The 92
bedrock geology of our study area comprised Mesozoic sedimentary sandstone, shale, and chert 93
belonging to Tamba terrane. 94
The native forest we studied was dominated by broad-leaved trees, including Quercus serrata 95
Thunb. and Quercus variabilis Blume, which are typical of Japanese temperate secondary 96
woodlands. P. pubescens was introduced a few hundred years ago in a patchy distribution pattern 97
through the region. The stands were well managed for the production of young bamboo sprouts as 98

6
human food. Broad-leaved secondary forests were established and cut for fuel. Broad-leaved trees 99
were harvested in our study area until the 1950s, but no anthropogenic disturbance has occurred for 100
at least 60 years (Tokuchi et al. 2010). P. pubescens plantations in this region have been abandoned 101
since the 1970s, and invading bamboo shoots were still expanding into neighboring broad-leaved 102
forests at the time of our study (Torii & Isagi 1997; Torii 1998). According to a vegetation census by 103
aerial photography in 2003, 46% of the areas around Mt. Tennozan (238.5 ha) are covered by 104
secondary broad-leaved forests, 41% by P. pubescens stands, and 7% by mixed 105
broad-leaved/bamboo stands (Tokuchi et al. 2010). 106
We selected vegetation stands dominated by (i) broad-leaved trees, (ii) P. pubescens, and (iii) 107
mixed stands of trees and bamboo along a ridge located on Mt. Tennozan. We established one square 108
plot (20 × 20 m) in broad-leaved tree forest stand (SF), one in a moso bamboo stand (BF), and two 109
plots containing mixed forest stands (MF1, MF2). According to the earlier aerial photographs (1961, 110
1974, and 2003), BF had been dominated by P. pubescens prior to 1974. The bamboo has been 111
invading MF1 since 1974 and MF2 since 1961. In plots MF1, MF2, and BF, expanding and 112
overcrowding bamboo shoots have not been cut or managed during recent decades. Thus, plots SF, 113
MF1, MF2, and BF represent a stage with no P. pubescens invasion, an early stage of invasion, a 114
mid-stage of invasion, and a last stage of invasion, respectively. 115
116
Vegetation censuses and biomass estimation 117
118

7
We measured diameters at breast height (DBHs; cm) and identified all trees and bamboo shoots 119
exceeding 1 cm in DBH. 120
Above- and belowground biomasses of broad-leaved trees in all plots were estimated using 121
allometric equations relating DBH and height developed by different author earlier (Nishioka et al. 122
1982; Goto et al. 2006; Ogawa & Kira 1977; Nagano & Kira 1978; Ogino 1977). Broad-leaved tree 123
biomasses allocated to stems (main trunks, Ws; kg), branches (Wb; kg), and leaves (Wl; kg) were 124
calculated thus: 125
Ws = 0.02644 × (DBH0.12 × H) 0.9688 (1) 126
Wb = 0.01262 × DBH0.1 2.364
(2) 127
Wl = 0.005921×DBH0.1 2.288, (3) 128
where H is tree height (m), which we estimated using the following relationship: 129
1/H = 1/(a × DBHb) + 1/Hmax, (4) 130
where a and b are constants, and Hmax is the asymptotic maximum height (m; Ogawa & Kira 1977). 131
DBH0.1 is stem diameter (cm) for a position located one-tenth of the way along the maximum trunk 132
length; DBH0.1 was estimated from the measured DBH using the following empirical equation, 133
which was developed for a warm–temperate secondary oak forest by Nagano and Kira (1978): 134
DBH0.1 = 0.941 × DBH + 0.734. (5) 135
We calculated the biomass of broad-leaved tree coarse roots (≧2 mm in diameter) (Wbelow; kg) 136
using the following extended allometric equation: 137
Wbelow = 0.082 × DBH2. (6) 138

8
Eq. 6 was developed for a cool–temperate beech forest by Ogino (1977). We estimated the biomass 139
of broad-leaved tree fine roots (<2 mm in diameter) by soil block sampling (see below). 140
To estimate the aboveground biomass of P. pubescens shoots, we applied the allometric equation 141
developed for a site close to one of our study plots (BF) by Abe and Shibata (2009) in June 2006: 142
W = a × DBHb, (7) 143
where parameters a and b were estimated individually for culms, branches, and leaves. The 144
allometric relationship between the dry weight of each component and culm DBH was calculated 145
separately for current-year shoots and shoots older than 1 year (Abe & Shibata 2009). The 146
parameters are summarized in Table 1. 147
We used two methods of soil-block sampling to estimate the belowground biomass of P. 148
pubescens shoots. One method estimated the “stump,” which we define here as the culm between the 149
soil surface and rhizome (stump-block); the second method was used for root estimation (root-block). 150
In the first procedure, we carefully excavated three soil blocks (each 50 × 50 cm to 50 cm depth) 151
centered around bamboo shoots by using a shovel and saw within the pure P. pubescens stand 152
located outside plot BF in August 2006. We cut free the aboveground part, dug into the soil, and 153
carefully excavated the subterranean parts of the shoot. The stump-blocks were washed with tap 154
water to remove mineral soils. The remaining root systems were separated into the stump and other 155
components. The stumps were dried at 40°C for 1 week and then weighed. We constructed an 156
allometric equation from the relationship between the dry weight of stump per shoot and culm DBH 157
(see Eq. 7), and subsequently estimated the total bamboo stump biomass within our plots as a portion 158

9
of the belowground biomass components. 159
In the second procedure, we collected two soil blocks (50 × 50 cm to 30 cm depth) inside each 160
plot in the period from February to April 2006 for our calculations of root biomass per unit area and 161
the extent of bamboo rhizome lateral extension. These root-block samples were divided into vertical 162
portions 0–5, 5–10, 10–20, and 20–30 cm downward from the soil surface. 163
Within plots MF1, MF2, and BF, we found several centimeter-thick layers of live fine- and 164
coarse-roots between the mineral and organic layers (see below). We termed this layer the “root mat” 165
(RM) and separated it out from the other layers in the root-blocks. The living roots in the RM and 166
mineral soil layers were divided into those from broad-leaved trees and those from P. pubescens, and 167
sorted by hand into categories of fine roots, coarse roots, and bamboo rhizomes in the laboratory. 168
Each component was carefully separated according to illustrations in Suzuki (1978) and Makita 169
(1998). We distinguished rhizomes from roots by the presence of nodes in the former. The various 170
components were dried at 40°C for 72 h and weighed. The area-based biomasses of these 171
components were determined by calculation for these soil blocks. 172
Finally, we used the predictions of our allometric regressions for stand-level integration of the 173
biomasses of stems, branches, leaves, and coarse roots of broad-leaved trees, and the biomasses of 174
culms, branches, leaves, and stumps of P. pubescens. We used the root-block predictions to integrate 175
area-based biomasses of tree fine roots, and bamboo coarse roots, fine roots, and rhizomes in the RM 176
and mineral soil layers. 177
178

10
Soil sampling 179
180
We estimated the dry masses of organic matter in the organic soil layers of the four plots. Four 181
frames (20 × 20 cm) were deployed haphazardly on the surface soils in the period February–April 182
2006, and from these, we collected all forest-floor organic matter in the litter (Oi) and humus layers 183
(Oe+Oa). Samples of this organic matter were dried at 40°C for 1 week and weighed. 184
We used soils collected in the root-blocks to determine soil bulk density. After removing roots 185
and rhizomes, we divided the dry weight of fine mineral soil that passed through a 2-mm sieve by 186
the total dry weight of bulk soil for each soil layer. Organic matter and mineral soils were also 187
present in the RM layer. Consequently, we used a 4-mm mesh to sieve the RM samples collected 188
from the root-blocks in preparation for soil analysis. 189
190
Chemical analysis 191
192
Bamboo organs (leaves, branches, culms, fine and coarse roots, and rhizomes), forest-floor organic 193
matter, and mineral soils were ground in a mill prior to measurements of C and N contents with a 194
NC analyzer (NC-22A; Sumigraph, Osaka, Japan). We assumed that the C and N contents of 195
bamboo stumps were the same as those in bamboo rhizomes. Reports have indicated that the C and 196
N contents of P. pubescens leaves vary significantly by culm age (Li et al. 1998). Thus, we made 197
separate measurements of aboveground compartments of P. pubescens on current-year shoots and 198
11
those older than 1 year. We obtained C and N contents of most broad-leaved tree organs from 199
previous reports (Tsutsumi et al. 1968; Katagiri & Tsutsumi 1975), but our data on fine and coarse 200
roots were obtained by the analyses described above. By multiplying the dry weights of plant organs 201
or soil organic matter in the soil layers by the respective C and N contents and summing, we were 202
able to estimate the total area-based C and N stocks in each plot. 203
204
Data analysis 205
206
We used paired t-tests to detect significant differences in the C and N contents of P. pubescens leaves, 207
branches, and culms between current-year shoots and those older than 1 year. The Kruskal-Wallis 208
test was used to test the effect of stand characteristics on the mean C and N contents in coarse and 209
fine roots of bamboo and broad-leaved trees, and in bamboo rhizomes and stumps. We also used the 210
Stell-Dwass post hoc test for multiple comparisons to detect differences in the mean C and N 211
contents in these components between pairs of stand types. Significant differences in the mean C and 212
N contents in the soil organic matter within each layer (forest floor, RM, and 0–10-cm and 10–30-cm 213
layers) among stand types were also analyzed by the Kruskal-Wallis test followed by the 214
Steel-Dwass post hoc test. Statistical analyses were performed using R software (R Development 215
Core Team 2010). 216
217
218

12
Results 219
220
Stand structure 221
222
Stem and culm densities, mean DBH, total basal area (BA), proportion of P. pubescens in BA, 223
numbers of species, and dominant broad-leaved tree species in SF, MF1, MF2, and BF are 224
summarized in Table 2. As the proportions of P. pubescens in BA increased, the numbers of plant 225
species in the plots decreased (Table 2). Patterns of DBH frequency distribution differed 226
dramatically among plots (Fig. 2). Thus, DBH distributions of broad-leaved trees were positively 227
skewed in plots SF, MF1, and MF2, while DBH distributions of bamboo shoots showed a normal 228
curve in plots MF1, MF2, and BF. In mixed stands (plots MF1 and MF2), distributions showed a 229
bimodal curve with one smaller mode comprising the DBH distribution of broad-leaved trees and the 230
larger mode comprising that of bamboo shoots. Mean DBH values of bamboo culms were similar 231
among the plots regardless of differences in culm density (Table 2). As bamboo culm densities 232
increased, the frequencies of broad-leaved trees with DBH values <12 cm decreased dramatically 233
(e.g., in plot MF2); we found no trees with DBH values >12 cm in plot BF (Fig. 2). 234
235
Above- and belowground biomasses 236
237
We used an allometric equation (Eq. 7) describing the relationship between culm DBH and stump 238

13
dry weight to predict biomasses of belowground stumps of P. pubescens shoots; the calculated 239
values of parameters a and b were 7.71 × 10⁻² and 1.434 (r2 = 0.954), respectively. 240
Figure 3 depicts the vertical distribution of belowground biomasses of coarse and fine roots, and 241
rhizomes of P. pubescens shoots per unit area in plots MF1, MF2, and BF. Fine roots of P. pubescens 242
occurred most densely in the 0–5-cm mineral soil layer; coarse roots and rhizomes occurred most 243
densely below 5 cm soil depth (Fig. 3). 244
Details of aboveground and belowground biomasses of each compartment, and total biomasses 245
are presented in Fig. 4 and Appendix A. No increasing or decreasing trends were observed in 246
aboveground and total biomasses. However, belowground biomass increases were associated with P. 247
pubescens invasions (Fig. 4). At the stand level, the dry mass ratio of non-photosynthetic organs to 248
photosynthetic organs (culm/foliage ratio, C/F; Iwaki 1958) increased from 22.7 to 35.8 (Fig. 5a), 249
while the dry mass ratio of aboveground organs to belowground organs (top/root ratio, T/R) 250
decreased from 3.41 to 1.39 as the proportion of bamboo increased in BA (Fig. 5b). The C/F ratio of 251
broad-leaved trees remained constant among plots other than BF (Fig. 5a), in which all large canopy 252
trees had disappeared as a result of the bamboo invasion (Fig. 2). No differences were detected in the 253
C/F ratio of P. pubescens shoots across our plots (Fig. 5a). Among plots, the T/R ratio of 254
broad-leaved trees was lowest in BF; the T/R ratio of P. pubescens tended to increase with increasing 255
proportions of bamboo in BA (Fig. 5b). 256
257
Organic matter mass at the forest floor level and the bulk density of mineral soil 258

14
259
Values of forest-floor organic matter mass in the Oi layer were not significantly different among 260
plots (Kruskal-Wallis test, P > 0.05), but those in the Oe+Oa layer were significantly larger in plot 261
SF than in the other plots (Kruskal-Wallis and Steel-Dwass tests, P < 0.05; Table 3). 262
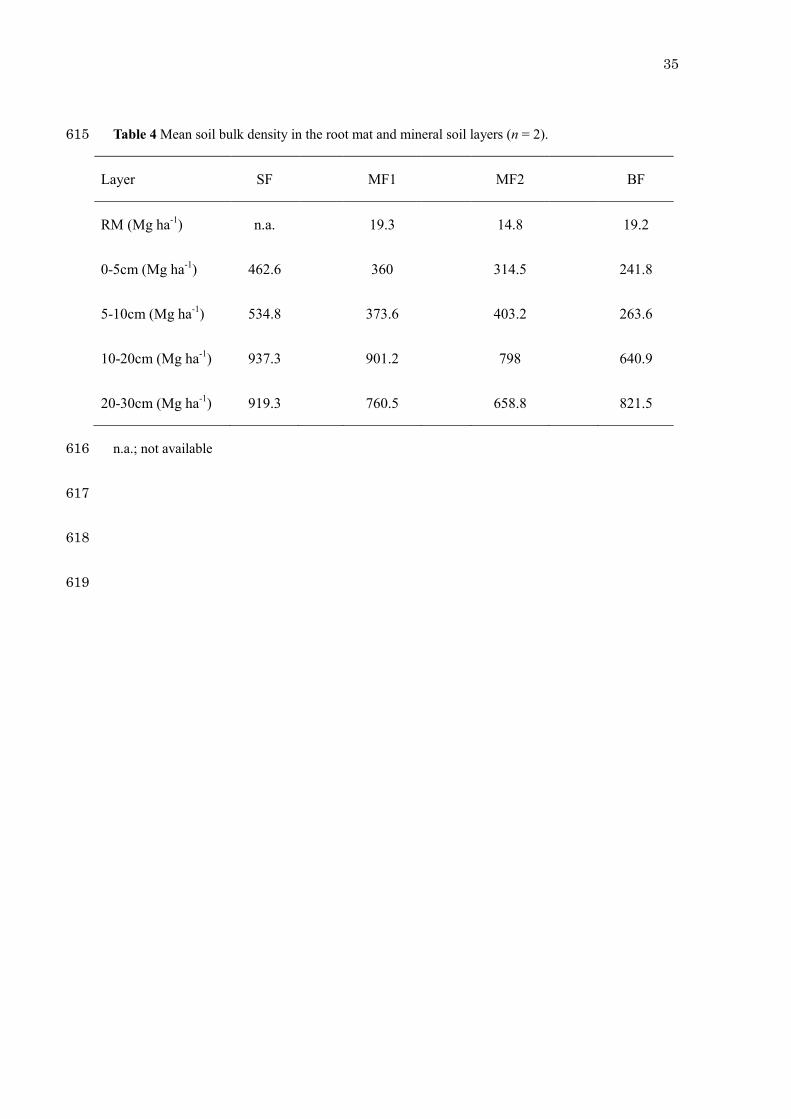
The bulk density of mineral soil that passed through a 2-mm sieve tended to increase with depth 263
and decrease with the proportion of bamboo in BA (Table 4). The RM layer, which appeared to have 264
developed between the organic and the mineral soil layers in the presence of P. pubescens, included 265
a small amount of mineral soil (Table 4). 266
267
C and N contents and stocks in plants and soils 268
269
Details of the mean C and N contents in each compartment of P. pubescens and broad-leaved trees 270
are listed in Table 5. In P. pubescens, the C contents in leaves, branches, and culms were not 271
significantly different between current shoots and shoots older than 1 year (paired t-test, P > 0.05; 272
Table 5), and the N contents in leaves, branches, and culms did not vary between the two age classes 273
of shoots (paired t-test, P > 0.05; Table 5). The leaves and the branches of P. pubescens contained 274
less C and more N than equivalent organs of broad-leaved trees. The culms of P. pubescens 275
contained less C than the stems of broad-leaved trees; the N contents in bamboo culms and tree 276
stems were closely similar (Table 5). The coarse and fine roots of P. pubescens contained less C and 277
N than those of the broad-leaved trees (Table 5). C and N contents in the rhizomes, stumps, and 278

15
coarse roots of P. pubescens were closely similar. 279
C and N contents of each soil layer in the four plots are detailed in Table 6. C and N contents in 280
the Oi layer differed significantly among plots (Kruskal-Wallis and Steel-Dwass tests, P < 0.05). As 281
the proportion of bamboo BA increased in the stands, the C and N contents in this layer decreased 282
(Table 6). 283
Values of C stocks in plants and soils in the stands ranged from 83.4 to 108.2 MgC ha–1 in 284
aboveground parts, from 28.7 to 64.6 MgC ha–1 in belowground parts, and from 45.0 to 54.0 MgC 285
ha–1 in soils (Fig. 6a, Appendix B). The values of N stocks ranged from 0.44 to 0.57 MgN ha–1 in 286
aboveground parts, from 0.38 to 0.60 MgN ha–1 in belowground parts, and from 2.13 to 2.98 MgN 287
ha–1 in soils (Fig. 6b). Forty to sixty percent of C was stored in aboveground parts, but >70% of the 288
stand N stock was stored in the soils (Fig. 7). The proportion of total stand C stored in belowground 289
parts increased with increasing proportions of bamboo BA, but the proportions of N shifted little in 290
response to increasing bamboo BA (Fig. 7). 291
292
293
Discussion 294
295
Stand structure and biomass in vegetation dominated by broad-leaved trees and bamboo 296
297
The dominant tree species in our stands were Q. serrata and/or Q. variabilis, which are typical of the 298

16
secondary forest around Mt. Tennozan (Table 2). The above- and belowground biomasses in a pure 299
stand of broad-leaved trees (SF) were 211.8 and 62.1 Mg ha–1, respectively (Fig. 4, Appendix A); 300
these values exceed those previously reported for forests with similar tree species composition in the 301
other areas (Table 7). The differences between studies is likely attributable the greater stand age (~60 302
years) and a higher density of trees with DBH >5 cm in our data set. Surviving large trees with DBH 303
values exceeding 30 cm on Mt. Tennozan also contributed significantly to the large biomass values 304
we calculated. 305
Culm density (9675 ha–1; Table 2) and aboveground biomass (182.1 Mg ha–1; Fig. 4, Appendix 306
A) in the abandoned pure P. pubescens stand (BF) were within the range of previously reported 307
values for equivalent vegetation, but belowground biomass we measured (127.1 Mg ha–1; Fig. 4, 308
Appendix A) exceeded previously reported values (Table 8). P. pubescens biomass surveys in 309
various regions of Japan have detected an exponential relationship between BA and above- or 310
belowground biomasses (FFPRI 2009). Using this regression relationship, we calculated biomasses 311
in our P. pubescens stand (BA = 88.3 m2 ha–1; Table 2) of 181.2 Mg ha–1 above ground and 91.4 Mg 312
ha–1 below ground, which fit our empirical estimates for aboveground biomass but not those for 313
belowground biomass. The discrepancy between estimates is likely due to the difficulty in accurately 314
defining the belowground compartment of bamboo species, especially for the leptomorph types like 315
P. pubescens. Comprehensive inclusion of all belowground compartments requires estimation of the 316
spatial extent of rhizome and root system biomasses in addition to stump estimates derived from the 317
allometric relationship with DBH. Previous studies may not have implemented this inclusive 318

17
procedure and therefore underestimated belowground biomass. We believe that our comprehensive 319
approach provides reliable values. 320
We calculated T/R values of 3.41 and 1.39 in the secondary broad-leaved (SF) and P. pubescens 321
stands (BF; Fig. 5b), respectively. According to Saito (1989), T/R falls within the range of 3–7 and is 322
close to unity in broad-leaved/coniferous forest stands and grasslands. Thus, our measure of stand 323
structure in P. pubescens vegetation was close to that of grassland meadows, but bamboo biomass 324
was comparable to that of a well-developed secondary forest. 325
326
Changes in stand structure and biomass as bamboo invasion proceeds 327
328
In our study sites, bamboo density and percentage of bamboo in total BA was higher in the plot 329
where the number of years passed after P. pubescens invasion was longer (Table 2), indicating that 330
the dominance of P. pubescens in the plot represents a stage of invasion. 331
As P. pubescens invaded our secondary forest sites, numbers of plant species decreased and total 332
basal area increased. Okutomi et al. (1996) observed similar shifts in the vegetation during a study 333
of plant spatial distributions and canopy structures in a mixed broad-leaved tree/bamboo forest, 334
although they did not determine biomasses. At our study site, the above- and belowground 335
biomasses of broad-leaved trees decreased as those of P. pubescens increased, but no monotonous 336
trends were apparent in the summed biomass data (Table 5c). These relationships might be 337
explainable as follows. In the early stages of invasion, smaller trees are replaced by small numbers 338

18
of bamboo culms, with consequent decreases in whole stand biomass (plot MF1). Only large trees 339
survive as the invasion proceeds. During the mid-stages of the invasion process, bamboo density 340
increases and stand biomass reaches a maximum (as in plot MF2). Finally, whole stand biomass 341
decreases when high densities of bamboo cause the deaths of large broad-leaved trees (perhaps due 342
to competition for light, water, and/or mineral nutrients), as in plot BF. 343
An increase in the C/F ratio as bamboo dominance increased indicates that the proportion of 344
photosynthetic organs in the aboveground biomass increased at the stand level (Fig. 5a). P. 345
pubescens is a highly productive plant that produces more leaves on fewer culms (stems) than 346
woody species (Isagi et al. 1997; Yen & Lee 2011). In addition, the leaf N contents of P. pubescens 347
exceeded those of woody plants (Table 5, Li et al. 1998), suggesting that P. pubescens has a higher 348
photosynthetic capacity (Reich et al. 1997). Isagi et al. (1997) measured high gross production rates 349
in a P. pubescens stand. They also pointed out that a large proportion of the photosynthetic products 350
was allocated to belowground systems and then transported to newly developing bamboo shoots 351
(Isagi et al. 1997). 352
In stands where bamboo had invaded secondary forest (plots MF1 and MF2), the belowground 353
biomass of P. pubescens exceeded aboveground biomass (Fig. 4c, Appendix A), and the stand T/R 354
ratio declined dramatically (Fig. 5b). These trends indicate that the ramet population of P. pubescens 355
initially expands its root system into adjacent forest stands, a process that results in rapid changes in 356
stand biomass distribution. 357
358

19
Changes in C and N stocks in forest stands following bamboo invasion 359
360
Although aboveground compartments of P. pubescens had lower C and higher N contents than those 361
of broad-leaved trees (Table 5), total aboveground C and N stocks did not change monotonically 362
following P. pubescens invasion of secondary forest stands (Fig. 6) due to an aboveground biomass 363
buildup during invasion. The C and N contents in the belowground compartments of broad-leaved 364
trees exceeded those of bamboo (Table 5). C stocks per unit area in belowground compartments and 365
total belowground biomass approximately doubled during P. pubescens invasions (Fig. 6a, Appendix 366
B), but N stocks did not change (Fig. 6b, Appendix B). This indicates that the difference of not only 367
the dry matter mass but also the chemical content of each plant compartment between broad-leaved 368
tree and P. pubescens can largely affect the element stock and distribution in the forest stand. These 369
physiological characteristics of P. pubescens including higher productivity, greater belowground 370
allocation, and lower C and/or higher N contents in leaves rather than those of trees are partly 371
reported in cases of some other bamboo species, such as P. bambusoides Sieb. et Zucc. in western 372
Japan (Isagi et al. 1993), Bambusa spp. in Puerto Lico (O’Connor et al. 2000), and Dendrocalamus 373
strictus (Roxb.) Nees in India (Tripathi & Singh 1996). Because these studies only described the 374
stand structure and/or nutrient dynamics in bamboo forest, further researches are necessary to 375
elucidate their changes by bamboo invasion into the native forest in each area. 376
When total values were calculated by summing the stocks for plants and soil organic matter in 377
each plot, the ratio of belowground C in total C stocks increased during bamboo invasion of 378

20
secondary forest (Fig. 7a). Thus, the development of P. pubescens root systems may greatly change 379
the C distribution in forest stands. 380
More than 70% of N was stored in the soils (Fig. 7b). In general, microbial decomposition of 381
organic matter in forest soils releases C as gaseous CO2 into the atmosphere, but N is largely 382
immobilized and retained underground (e.g., Vitousek et al. 1979; Johnson et al. 2000; Berg & 383
McClaugherty 2014). This results in little effect of invasions by P. pubescens on N stock size or its 384
distribution. 385
The C/N ratio of organic matter in the surface soil layer (on a weight basis) is a useful indicator 386
of the degree of decomposition (Berg & McClaugherty 2014), net nitrification rate (Goodale & Aber 387
2001; Fukushima et al. 2011) and leaching of mineralized N from forest soils (Lovett et al. 2004). 388
When forest-floor organic matter with a relatively high C/N ratio decomposes, organic N is generally 389
mineralized but then rapidly immobilized by heterotrophic soil microbes. When the C/N ratio of soil 390
organic matters decreases as decomposition progresses, microbe demand for mineral N becomes 391
satiated; inorganic N is then nitrified by autotrophic nitrifiers and subsequently leached from the soil. 392
The C/N ratio of the forest-floor organic matter at our study site increased monotonically with 393
bamboo shoot density (Table 9). Previous studies revealed that understorey dwarf bamboo like S. 394
kurilensis in a broad-leaved secondary forest in northern Japan (Tripathi et al. 2005; Watanabe et al. 395
2013) and Chusquea culeou E. Desv. in an old-growth broad-leaved forest in Patagonia (Austin & 396
Marchesini 2012) plays a key role in retaining mineral N in soil through N uptake by bamboo and N 397
immobilization during bamboo litter decomposition. The giant bamboo has greater biomass, litter 398

21
fall, and productivity than dwarf bamboo. Hence, the process of P. pubescens invasion into 399
secondary forest may depress the rate of N cycling and prevent the loss of inorganic N from soils. 400
Moreover, Umemura & Takenaka (2014a) demonstrated that soil pH increases as P. pubescens 401
invades surrounding evergreen coniferous forests, which may greatly affect the net nitrification rates 402
in soil because some groups of ammonia-oxidizing bacteria can deactivate and some groups of 403
ammonia-oxidizing archaea can activate under low pH (Nicol et al. 2008). Overall, P. pubescens 404
invasion into forest stands clearly alters N cycling between plants and soil due to changes in soil 405
organic matter quality (e.g., the C/N ratio) and physicochemical parameters (e.g., pH). The details of 406
these processes should be studied by examining changes in soil N dynamics during invasion. 407
408
409
Conclusion 410
411
In our secondary forest located in western Japan, stand structure and the distribution of plant 412
biomass were affected by P. pubescens dominance, which is almost equal to the degree of P. 413
pubescens invasion. The changes in (i) standing biomass, (ii) C and N stocks in plants and soil, and 414
(iii) their distributions during bamboo invasion were likely triggered by the rapid bamboo 415
rhizomatous clonal growth and the deaths of large(L412-414) broad-leaved trees. Nevertheless, few 416
differences in biomass or C and N stock sizes were observed between a broad-leaved forest stand 417
and a pure P. pubescens stand, suggesting that the capabilities for storing C and N in plants and soil 418

22
are comparable in broad-leaved and bamboo forests. In contrast, the allocation of C into 419
belowground biomass (T/R ratio), the N content of leaves, the C/F ratio in aboveground vegetation, 420
and the C/N ratio in forest-floor organic matter shifted markedly in response to invasion. These 421
shifts are likely driven by the physiological attributes of invading P. pubescens, and may have large 422
effects on the rates of C and N cycling and loss in forest ecosystems during early invasion. To better 423
understand the effects of P. pubescens invasion on ecosystem functions, future studies on soil N 424
dynamics and N retention will be required. 425
426
Acknowledgments 427
428
We thank Ms. Satomi Yoneda, Ms. Momoko Sakai, and Dr. Shuhei Matsuyama (Kyoto University) 429
for their assistance in data collection. We also thank Dr. Yuhei Abe (Kagawa Prefecture) for sharing 430
data and Dr. Takahito Yoshioka (Kyoto University) for helpful comments. Funding was provided by 431
a Sasakawa Scientific Research Grant from The Japan Science Society, ESPEC Foundation for 432
Global Environment Research and Technology (ESPEC Prize for the Encouragement of 433
Environmental Studies), a Grant-in-Aid for Scientific Research from the Ministry of Education, 434
Culture, Sports, Science and Technology, Japan (no. 22780145 and 26660127), to KF, and a grant 435
from Suntory Holdings Limited, Japan, to NT. 436
437
References 438

23
439
Abe Y. & Shibata S. (2009) Stand structure of non-management Phyllostachys pubescens forest and 440
dynamics for 3 years after improvement management in Mt. Tennozan. Journal of the 441
Japanese Society of Revegetation Technology 35: 57-62. (in Japanese with English abstract) 442
Akutsu H., Aizawa M., Matsue K. & Ohkubo T. (2012) Distribution and invasion of Phyllostachys 443
pubescens stands into neighboring forests in Nasukarasuyama, Tochigi Prefecture. Bulletin of 444
Utsunomiya University Forest 48: 139-152. (in Japanese with English abstract) 445
Austin A. T. & Marchesini V. A. (2012) Gregarious flowering and death of understorey bamboo slow 446
litter decomposition and nitrogen turnover in a southern temperate forest in Patagonia, 447
Argentina. Functional Ecology 26: 265-273. 448
Bai S., Zhou G., Wang Y., Liang Q., Chen J., Cheng Y. & Shen R. (2013) Plant species diversity and 449
dynamics in forests invaded by Moso bamboo (Phyllostachys edulis) in Tianmu Mountain 450
Nature Reserve. Biodiversity Science 21: 288-295. 451
Berg B. & McClaugherty C. (2014) Plant litter: Decomposition, humus formation, carbon 452
sequestration. Third Edition. Springer-Verlag, Berlin Heidelberg. 453
Dannoura M., Suzuki M., Kominami Y., Goto Y. & Kanazawa Y. (2006) Estimation of root biomass 454
and root surface area in a broad-leaved secondary forest in the southern part of Kyoto 455
Prefecture. Journal of the Japanese Forest Society 88: 120-125. (in Japanese with English 456
summary) 457
FFPRI. (2009) Development of a method of estimating carbon accumulation and absorption in 458

24
Japanese bamboo forests. Kenkyu Seika Senshu, Forestry and Forest Products Research 459
Institute 2009. pp. 4-5. (in Japanese) 460
Fukushima K., Tateno, R. & Tokuchi N. (2011) Soil nitrogen dynamics during stand development 461
after clear-cutting of Japanese cedar (Cryptomeria japonica) plantations. Journal of Forest 462
Research 16: 394-404. 463
Fukuzawa K., Shibata H., Takagi K., Satoh F., Koike T. & Sasa K. (2014) Role of dominant 464
understory Sasa bamboo in carbon and nitrogen dynamics following selective tree cutting in 465
cool-temperate forest in northern Japan. Plant Species Biology (in press) 466
Goodale C. L. & Aber J. D. (2001) The long-term effects of land-use history on nitrogen cycling in 467
northern hardwood forests. Ecological Applications 11: 253-267. 468
Goto S., Bagana, Kawai H., Zhang F., Jia S., Saijoh Y. & Akiyama T. (2008) Estimation of biomass 469
and carbon storage in abandoned bamboo stands ecosystem. Journal of the Japanese 470
Agriculture Systems Society 24: 243-252. (in Japanese with English abstract) 471
Goto Y., Kominami Y., Miyama T., Tamai K. & Kanazawa Y. (2003) Aboveground biomass and net 472
primary production of a broad-leaved secondary forest in the southern part of Kyoto 473
Prefecture, Central Japan. Bulletin of Forestry and Forest Products Research Institute 2: 474
115-147. (in Japanese with English abstract) 475
Goto Y., Tamai K., Miyama T., Kominami Y. & Hosoda I. (2006) Effects of disturbance on vertical 476
stratification of broad-leaved secondary forests in Tatsunokuchi-yama Experimental Forest. 477
Bulletin of Forestry and Forest Products Research Institute 5: 215-225. (in Japanese with 478

25
English abstract) 479
Hasegawa M. (1989) Productivity of the oak coppice forests.Journal of the Toyama Forestry and 480
Forest Products Research Center 2: 5-12. (in Japanese) 481
Isagi Y. (1994) Carbon stock and cycling in a bamboo Phyllostachys bambusoides stand. Ecological 482
Research 9: 47-55. 483
Isagi Y., Kawahara K. & Ito H. (1997) Net production and carbon cycling in a bamboo Phyllostachys 484
pubescens stand. Plant Ecology 130: 41-52. 485
Isagi Y., Kawahara K. & Kamo K. (1993) Biomass and net production in a bamboo Phyllostachys 486
bambusoides stand. Ecological Research 8: 123-133. 487
Isagi Y. & Torii, A. (1998) Range expansion and its mechanism in a naturalized bamboo species, 488
Phyllostachys pubescens. Journal of Sustainable Forestry 6: 127-142. 489
Iwaki H. (1958) The influence of density on the dry matter production of Fagopyrum esculentum. 490
Japanese Journal of Botany 16: 210-226. 491
Johnson D. W., Cheng W. & Burke I. C. (2000) Biotic and abiotic nitrogen retention in a variety of 492
forest soils. Soil Science Society of America Journal 64: 1503-1514. 493
Kai S. (1984) Studies on characteristics and management of warm-temperate deciduous 494
broad-leaved forest. Bulletin of the Miyazaki University Forests 10: 1-124. (in Japanese with 495
English abstract) 496
Katagiri S. (1988) Position related differences in mineral cycling in a mountain side deciduous 497
broad-leaved secondary forest. Japanese Journal of Ecology 38: 135-145. (in Japanese with 498

26
English summary) 499
Katagiri S. & Tsutsumi T. (1975) The relationship between site condition and circulation of nutrients 500
in forest ecosystem (III): Above ground biomass and nutrient contents of stands. Journal of 501
the Japanese Forest Society 57: 412-419. (in Japanese with English abstract) 502
Katakura M., Yamauchi N. & Koyama Y. (2007) Aboveground and belowground biomass and C 503
stock in Quercus serrata, Pinus densiflora, and Larix kaempferi forests, and their changes 504
after P. densiflora cutting in Nagano. Research Bulletin of the Nagano Prefecture Forestry 505
Research Center 22: 33-55. (in Japanese) 506
Komatsu H., Onozawa, Y., Kume T., Tsuruta K., Kumagai T., Shinohara Y. & Otsuki K. (2010) 507
Stand-scale transpiration estimates in a Moso bamboo forest: II. Comparison with coniferous 508
forests. Forest Ecology and Management 260: 1295-1302. 509
Kumemura A., Teraoka Y. & Takeuchi I. (2009) The above-ground biomass and stand structure of 510
unmanaged Moso bamboo (Phyllostachys pubescens) stands in Kagoshima Prefecture. 511
Research Bulletin of the Kagoshima University Forests 36: 1-8. (in Japanese with English 512
summary) 513
Li R, Werger M. J. A., During H. J. & Zhong Z. C. (1998) Carbon and nutrient dynamics in relation 514
to growth rhythm in the giant bamboo Phyllostachys pubescens. Plant and Soil 201: 113-123. 515
Lovett G. M., Weathers K. C., Arthur M. A. & Schultz J. C. (2004) Nitrogen cycling in a northern 516
hardwood forest: Do species matter? Biogeochemistry 67: 289-308. 517
Makita A. (1998) The significance of the mode of clonal growth in the life history of bamboos. Plant 518

27
Species Biology 13: 85-92. 519
Nagano M. & Kira T. (1978) Aboveground biomass. In Biological production in a warm-temperate 520
evergreen oak forest of Japan. JIBP Synthesis vol. 18. Kira T., Ono Y., Hosokawa T. (eds). 521
University of Tokyo Press, Tokyo, pp.69-82. 522
Nakai A. & Kisanuki H. (2006) Effect of bamboo culm density on the tree species diversity and 523
density of understory at a forest stand on a major bed along Miya River downstream. Bulletin 524
of the Faculty of Bioresources, Mie University 33: 21-28. (in Japanese with English abstract) 525
Nicol G. W., Leininger S., Schleper C. & Prosser J. I. (2008) The influence of soil pH on the 526
diversity, abundance and transcriptional activity of ammonia oxidizing archaea and bacteria. 527
Environmental Microbiology 10: 2966-2978. 528
Nishioka M., Umehara T. & Nagano M. (1982) Aboveground biomass in Minohyama, the habitat of 529
monkey. Bulletin report of monkeys in Minohyama. The Minoh City board of education. 530
pp.117-139. (in Japanese) 531
O’Connor P. J., Covich A. P., Scatena F. & Loope L. L. (2000) Non-indigenous bamboo along 532
headwater streams of the Luquillo Mountains, Puerto Rico: Leaf fall, aquatic leaf decay and 533
patterns of invasion. Journal of Tropical Ecology 16: 499-516. 534
Ogawa H. & Kira T. (1977) Methods of estimating forest biomass. In Primary productivity of 535
Japanese forests. JIBP Synthesis vol. 16. Shidei T., and Kira T. (eds.) University of Tokyo 536
Press, Tokyo, pp.15-25. 537
Ogino K. (1977) A beech forest in Ashiu - biomass, its increment and net production. In Primary 538

28
Productivity of Japanese Forest. JIBP Synthesis vol. 16. Shidei T., Kira T. (eds.) University of 539
Tokyo Press, Tokyo, pp 172-186. 540
Okutomi K., Shinoda S. & Fukuda H. (1996) Causal analysis of invasion of broad-leaved forest by 541
bamboo in Japan. Journal of Vegetation Science 7: 723-728. 542
R Development Core Team. 2010. R: a language and environment for statistical computing. R 543
Foundation for Statistical Computing, Vienna. 544
Reich P. B., Walters M. B. & Ellsworth D. S. (1997) From tropics to tundra: Global convergence in 545
plant functioning. Proceedings of the National Academy of Sciences, USA 94: 13730-13734. 546
Saito H. (1989) Forest Production. In: Forest Ecology. Tsutsumi T. (ed.) Asakurasyoten, Tokyo, pp. 547
43-95. (in Japanese) 548
Segawa Y. & Kato R. (1970) The growth of coppice forest of Quercus serrate Thunb. at the Koma 549
experiment forests. Annual Report of the Tohoku Branch, Forest Experiment Station 11: 550
188-198. (in Japanese) 551
Shibata S. (2003) Phyllostachys pubescens and Japanese. Journal of the Japanese Society of 552
Revegetation and Technology 28: 406-411. (in Japanese) 553
Suzuki S. (1978) Index to Japanese Bambusaceae. Gakken. Tokyo (in Japanese) 554
Suzuki S. (2014) Chronological location analyses of bamboo groves and their expansion in Japanese 555
satoyama landscapes. Plant Species Biology (in press) 556
Suzuki S. & Nakagoshi N. (2011) Sustainable Management of Satoyama Bamboo Landscapes in 557
Japan. In Hong S.-K., Wu J., Kim J.-E. & Nakagoshi N. (eds.), Landscape Ecology in Asian 558

29
Cultures. Springer. pp. 211-220. 559
Tokuchi N., Usui N., Ueda M. & Fukushima K. (2010) Vegetation change and nutrient cycling in 560
satoyama: Case study of bamboo invasion in Tennou-zan. Water Science 54 (1): 90-103. (in 561
Japanese) 562
Torii A. (1998) Estimation of range expansion rate of bamboo stands using aerial photographs: Case 563
study on Mt. Hachiman, Shiga Prefecture, and Mt. Otoko, Kyoto Prefecture, Japan. Japanese 564
Journal of Ecology 48: 37-47. (in Japanese with English abstract) 565
Torii A. & Isagi Y. (1997) Range expansion of bamboo species in southern areas of Kyoto Prefecture, 566
Japan. Japanese Journal of Ecology 47: 31-41. (in Japanese with English abstract) 567
Tripathi S. K. & Singh K. P. (1996) Culm recruitment, dry matter dynamics and carbon flux in 568
recently harvested and mature bamboo savannas in the Indian dry tropics. Ecological 569
Research 11: 149-164. 570
Tripathi S. K., Sumida A., Shibata H., Uemura S., Ono K. & Hara T. (2005) Growth and substrate 571
quality of fine root and soil nitrogen availability in a young Betula ermanii forest of northern 572
Japan: Effects of the removal of understory dwarf bamboo (Sasa kurilensis). Forest Ecology 573
and Management 212: 278-290. 574
Tsutsumi T., Kawahara T. & Shidei T. (1968) The circulation of nutrients in forest ecosystem (I): On 575
the amount of nutrients contained in the above-ground parts of single tree and of stand. 576
Journal of the Japanese Forest Society 50: 66-74. (in Japanese with English abstract) 577
Tu L., Hu T., Zhang J., Huang L., Xiao Y., Chen G., Hu H., Liu L., Zheng J., Xu Z. & Chen L. 578

30
(2013) Nitrogen distribution and cycling through water flows in a subtropical bamboo forest 579
under high level of atmospheric deposition. PLoS ONE 8: e75862. Doi: 580
10.1371/journal.pone.0075862. 581
Umemura M. & Takenaka C. (2014a) Changes in chemical characteristics of surface soils in hinoki 582
cypress (Chamaecyparis obtusa) forests induced by the invasion of exotic Moso bamboo 583
(Phyllostachys pubescens) in central Japan. Plant Species Biology (in press) 584
Umemura M. & Takenaka C. (2014b) Biological cycle of silicon in moso bamboo (Phyllostachys 585
pubescens) forests in central Japan. Ecological Research 29: 501-510. 586
Vitousek P. M., Gosz J. R., Grier C. C., Melillo J. M., Reiners W. A. & Todd R. L. (1979) Nitrate 587
losses from disturbed ecosystems. Science 204: 469-474. 588
Watanabe T., Fukuzawa K. & Shibata H. (2013) Temporal changes in litterfall, litter decomposition 589
and their chemical composition in Sasa dwarf bamboo in a natural forest ecosystem of 590
northern Japan. Journal of Forest Research 18: 129-138. 591
Yen T.-M. & Lee J.-S. (2011) Comparing aboveground carbon sequestration between moso bamboo 592
(Phyllostachys heterocycla) and China fir (Cunninghamia lanceolata) forests based on the 593
allometric model. Forest Ecology and Management 261: 995-1002. 594
Zhang C., Xie G., Fan S. & Zen L. (2010) Variation in vegetation structure and soil properties, and 595
the relation between understory plants and environmental variables under different 596
Phyllostachys pubescens forests in southeastern China. Environmental Management 45: 597
779-792. 598

31
599
600

32
Table 1. The parameters of regression equations predicting biomasses of each P. pubescens organ 601
from diameters at breast height (DBH). Data are from Abe and Shibata (2009). 602
603
a b n r2
Leaf Current year 1.149×10⁻² 1.515 7 0.853
≧1 year 4.774×10⁻³ 1.976 8 0.851
Branch Current year 1.045×10⁻¹ 1.185 7 0.722
≧1 year 4.647×10⁻² 1.483 8 0.74
Culm Current year 6.210×10⁻² 2.261 7 0.951
≧1 year 1.305×10⁻¹ 2.052 8 0.915
604
605

33
Table 2 Densities of broad-leaved tree stems and bamboo shoots, mean diameter at breast height (DBH) of broad-leaved trees and bamboo shoots, total basal 606
area (BA), proportion of bamboo in BA, number of plant species, and dominant tree species in our study plots. 607
608

34
Table 3 Mean dry weights of organic matter in the Oi and Oe+Oa soil layers (n = 4). SD in 609
parentheses. 610
611
Different letters (a, b) indicate significant differences among plots (P < 0.05, Kruskal-Wallis test 612
followed by Steel-Dwass post hoc test). 613
614
Layer SF
MF1
MF2
BF
Oi (Mg ha-1) 4.05 (0.767) 4.08 (0.874) 5.25 (2.32) 3.47 (1.69)
Oe+Oa (Mg ha-1) 20.6 (6.05)a 1.89 (0.598)b 1.4 (0.984)b 1.53 (0.291)b
35
Table 4 Mean soil bulk density in the root mat and mineral soil layers (n = 2). 615
Layer SF MF1 MF2 BF
RM (Mg ha-1) n.a.
19.3
14.8
19.2
0-5cm (Mg ha-1) 462.6
360
314.5
241.8
5-10cm (Mg ha-1) 534.8
373.6
403.2
263.6
10-20cm (Mg ha-1) 937.3
901.2
798
640.9
20-30cm (Mg ha-1) 919.3 760.5 658.8 821.5
n.a.; not available 616
617
618
619

36
Table 5 Mean C and N contents in each organ of P. pubescens and broad-leaved trees. SD in 620
parentheses. Both C and N contents in leaves, branches, and culms of bamboo shoots were not 621
significantly different between current shoots and shoots older than 1 year (paired t-test, P > 0.05). 622
Total C (%) Total N (%) n
Phyllostachys pubescens
Leaf Current 41.9 (1.72)
2.43 (0.30) 3
≧1 year 43.2 (0.46)
2.03 (0.19) 3
Branch Current 46.4 (0.23)
0.55 (0.17) 3
≧1 year 45.8 (1.11)
0.51 (0.25) 3
Culm Current 46.3 (0.69)
0.18 (0.043) 3
≧1 year 46.8 (1.22)
0.19 (0.050) 3
Coarse root
44.2 (0.32)
0.23 (0.015) 9
Fine root
43.2 (0.50)
0.51 (0.044) 9
Rhizome and stump 44.3 (0.15)
0.26 (0.029) 9
Broad-leaved tree
Leaf
52.6 †
1.57 ‡
Branch
51.8 †
0.38 ‡
Stem
50.9 †
0.19 ‡
Coarse root
46.1 (0.48)
0.59 (0.049) 9
Fine root 46.7 (0.54) 0.77 (0.040) 8
†; Data are from Katagiri and Tsutsumi (1975). ‡; Data are from Tsutsumi et al. (1968). 623

37
Table 6 Mean C and N contents in soil organic matter in each soil layer. SD in parentheses (n = 5). 624
Different letters (a, b, c) indicate significant differences among plots (P < 0.05, Kruskal-Wallis test followed by Steel-Dwass post hoc test). 625
RM; root mat layer. n.a.; not available. 626
627

38
Table 7. Above- and belowground biomass in Quercus serrata secondary forest from previous studies and this study. 628
Site Age (year) Aboveground biomass (Mg ha-1) Belowground biomass (Mg ha-1) Reference
Shimane Prefecture 40 96.3 - 218.0 n.a. Katagiri (1988)
Kyoto Prefecture n.a. 102 23.4 Goto et al. (2003); Dannoura et al. (2006)
Okayama Prefecture 58 - 61 79.2 - 161.3 n.a. Goto et al. (2006)
Miyazaki Prefecture 60 - 62 118.5 - 127.4 n.a. Kai (1984)
Iwate Prefecture 36 131.1 n.a. Segawa and Kato (1970)
Nagano Prefecture 16 132.2 24.1 Katakura et al. (2007)
Toyama Prefecture 33 - 35 114.8 - 206.8 n.a. Hasegawa (1989)
Kyoto Prefecture 60 ~ 211.8 62.1 This study (plot SF)
n.a.; not available. 629
630

39
Table 8. Aboveg- and belowground biomass in un-managed Phyllostachys pubescens forest from previous studies and this study. 631
632
Site Culm density (shoots ha-1) Aboveground biomass (Mg ha-1) Belowground biomass (Mg ha-1) Reference
Kagoshima Prefecture 5000 - 6130 82.8 - 146.6 n.a. Kumemura et al. (2009)
Kyoto Prefecture 7700 137.9 44.6 Isagi et al. (1997)
Central Taiwan 6996 - 7188 81.6 - 96.8 n.a. Yen and Lee (2011)
Kyoto Prefecture 7967 - 8300 217 - 224 n.a. Abe and Shibata (2009)
Aichi Prefecture 2400 - 4790 31.4 - 107 36 - 67.5 Umemura and Takenaka (2014b)
Gifu Prefecture 8125 - 16300 42.1 - 83.5 89.1 - 98.5 Goto et al. (2008)
Kyoto Prefecture 9675 182.1 127.1 This study (plot BF)
n.a.; not available633

40
Table 9 C/N ratios of aboveground and belowground compartments and soil layers, their respective 634
subtotals, and total values. 635
SF MF1 MF2 BF
Aboveground Leaf 33.5
32.3
27.6
21.2
Branch 136.3
130.7
111.8
89.4
Stem and Culm 268.6
265.8
256.9
246.8
Subtotal 189.7
187.3
182.3
174.9
Belowground Coarse root 78.4
93.7
121.9
192.7
Fine root 60.9
81.2
84.8
85.4
Rhizome n.a.
169.2
169.2
169.2
Stump n.a.
169.2
169.2
169.2
Subtotal 75.9
97.2
107.0
132.9
Soil Oi layer 45.4
45.9
51.3
62.1
Oe+Oa layer 18.1
22.8
24.4
23.4
Root mat layer n.a.
23.6
19.5
19.0
0-10 cm 17.8
21.9
18.3
15.3
10-30 cm 16.7
17.5
15.9
19.6
Subtotal 17.9
21.2
17.7
18.3
Total 50.2 56.2 53.0 50.4
n.a.; not available.636

41
Figure legends 637
638
Fig. 1 Location of the study site. 639
640
Fig. 2 Diameter at breast height (DBH) frequency distributions of P. pubescens (■) and other plants 641
(□) in the study plots: (a) plot dominated by secondary broad-leaved forest (SF), (b) mixed 642
bamboo/broad-leaved forest plot subjected to bamboo invasion since 1974 (MF1), (c) mixed 643
bamboo/broad-leaved forest plot subjected to bamboo invasion since 1961 (MF2), (d) plot 644
dominated by bamboo (BF). 645
646
Fig. 3 Vertical distributions of biomass in P. pubescens roots (n = 2 for the root mat layer, n = 4 for 647
each mineral soil layer in the 0–30 cm depth range, and n = 2 for rhizomes). Error bars are standard 648
deviation (SDs). 649
* RM; root mat 650
651
Fig. 4 (a) Aboveground and (b) belowground biomasses of broad-leaved trees and P. pubescens 652
organs; (c) total biomass. 653
654
Fig. 5 (a) Ratios of non-photosynthetic organ to photosynthetic organ dry weights (C/F); (b) ratios of 655
aerial organ to root dry weights (T/R) for whole plants, broad-leaved trees, and P. pubescens. 656

42
657
Fig. 6 (a) Carbon and (b) nitrogen stocks in all aboveground and belowground compartments and in 658
each soil layer. 659
660
Fig. 7 The proportion of above- and belowground compartments and soils to total (a) carbon and (b) 661
nitrogen stocks for four plots. 662
663

43
Fig. 1 664
665
666

44
Fig. 2 667
668
669

45
Fig. 3 670
671
672

46
Fig. 4 673
674
675

47
Fig. 5 676
677
678

48
Fig. 6 679
680
681
682

49
Fig. 7 683
684
685

50
Appendix A. Biomass of above- and belowground compartments, their respective totals, and total values. 686
687
688
689

51
Appendix B. Carbon and nitrogen stocks in aboveground and belowground compartments and in 690
each soil layer, their respective subtotals, and total values. 691
n.a.: not available. 692