Embed Size (px)
Citation preview
Impacts of Marijuana Legalization in Colorado
A Report Pursuant to Senate Bill 13‐283
October 2018
Colorado Department of Public Safety
Division of Criminal Justice
Office of Research and Statistics
700 Kipling St., Denver, Colorado 80215
https://www.colorado.gov/dcj‐ors


Impacts of Marijuana Legalization in Colorado
A Report Pursuant to Senate Bill 13‐283
October 2018
Prepared by
Jack K. Reed, Statistical Analyst
Office of Research and Statistics
Stan Hilkey, Executive Director, Department of Public Safety
Joe Thome, Director, Division of Criminal Justice
Kim English, Research Director, Office of Research and Statistics

ii
Table of Contents
Executive Summary ....................................................................................................................................... 1
Section One: Introduction ............................................................................................................................. 8
Background, Limitations and Methods ..................................................................................................... 8
Data limitations ......................................................................................................................................... 9
Data Sources ........................................................................................................................................... 10
Data Collection Methodology ................................................................................................................. 11
Brief History of Marijuana Laws .............................................................................................................. 11
Organization of this report ..................................................................................................................... 16
Summary ................................................................................................................................................. 17
Section Two: Impact on Public Safety ......................................................................................................... 18
Overview ................................................................................................................................................. 18
Offenses and Arrests ............................................................................................................................... 19
Marijuana Court Case Filings .................................................................................................................. 28
Crime Around Marijuana Establishments ............................................................................................... 31
Traffic Safety ........................................................................................................................................... 33
Probationer Drug Test Results ................................................................................................................ 55
Illegal Cultivation on Public Lands........................................................................................................... 57
Diversion Out of State ............................................................................................................................. 60
Transfer Using Parcel Services ................................................................................................................ 62
Section Three: Impact on Public Health and Behavioral Health Services .................................................. 63
Overview ................................................................................................................................................. 63
Adult Usage ............................................................................................................................................. 63
Hospitalizations and Emergency Department Visits ............................................................................... 78
Poison Control ......................................................................................................................................... 80
Treatment Trends ................................................................................................................................... 82
Suicide Rate Trends ................................................................................................................................. 98
Section Four: Impact on Youth ................................................................................................................. 100
Overview ............................................................................................................................................... 100
Youth Use .............................................................................................................................................. 101
Criminal Justice Involvement ................................................................................................................ 123

iii
School Data ........................................................................................................................................... 125
Drug‐Endangered Children ................................................................................................................... 136
Section Five: Additional Information ........................................................................................................ 141
Licensing and Revenue .......................................................................................................................... 141
Medical Marijuana Cardholders............................................................................................................ 156
Overall Crime in Colorado ..................................................................................................................... 160
Appendix A: Ogden Memorandum ........................................................................................................... 162
Appendix B: Cole Memorandum ............................................................................................................... 166
Appendix C: Marijuana Arrests ................................................................................................................. 171
Appendix D: Offenses reported, by location ............................................................................................. 217
Appendix E: Marijuana Drug seizures, by county ..................................................................................... 220
Appendix F: Court Filings .......................................................................................................................... 240
Appendix G: Certified Drug Recognition Experts, by agency .................................................................... 251
Appendix H: Marijuana Business Licensees, by County ............................................................................ 254
Appendix I: Distribution of Marijuana Tax and Fee Revenue, FY 2017‐18 Flowchart .............................. 257

1
EXECUTIVE SUMMARY
In 2013, following the passage of Amendment 64 which allows for the retail sale and possession of
marijuana, the Colorado General Assembly enacted Senate Bill 13‐283. This bill mandated that the
Division of Criminal Justice in the Department of Public Safety conduct a study of the impacts of
Amendment 64, particularly as these relate to law enforcement activities. This report seeks to establish
and present the baseline measures for the metrics specified in S.B. 13‐283 (C.R.S. 24‐33.4‐516.)
The information presented here should be interpreted with caution. The majority of the data should be
considered baseline and preliminary, in large part because data sources vary considerably in terms of
what exists historically. Consequently, it is difficult to draw conclusions about the potential effects of
marijuana legalization and commercialization on public safety, public health, or youth outcomes, and
this may always be the case due to the lack of historical data. Furthermore, the measurement of
available data elements can be affected by very context of marijuana legalization. For example, the
decreasing social stigma regarding marijuana use could lead individuals to be more likely to report use
on surveys and also to health workers in emergency departments and poison control centers, making
marijuana use appear to increase when perhaps it has not. Finally, law enforcement officials and
prosecuting attorneys continue to struggle with enforcement of the complex and sometimes conflicting
marijuana laws that remain. In sum, then, the lack of pre‐commercialization data, the decreasing social
stigma, and challenges to law enforcement combine to make it difficult to translate these preliminary
findings into definitive statements of outcomes.
Recognizing the challenges involved in interpreting the data presented here, the following is a summary
of findings:
Public Safety
Arrests
The total number of marijuana arrests decreased by 52% between 2012 and 2017, from 12,709 to 6,153. Marijuana possession arrests, which make up the majority of all marijuana arrests, were cut in half (‐54%). Marijuana sales arrests decreased by 17%. Arrests for marijuana production increased appreciably (+51%%). Marijuana arrests that were unspecified, meaning the specific reason for the arrest was not noted by law enforcement, went down by 45%.
o The number of marijuana arrests decreased by 56% for Whites, 39% for Hispanics, and 51% for Blacks. The marijuana arrest rate for Blacks (233 per 100,000) was nearly double that of Whites (118 per 100,000) in 2017.
o Nine large Colorado counties (Adams, Arapahoe, Boulder, Douglas, El Paso, Jefferson,
Larimer, Mesa, and Weld) showed a decrease in marijuana arrests, ranging between ‐8% (Boulder) and ‐67% (Adams). The average decline across these nine counties was ‐46%.
2
o Separate data provided by the Denver Police Department’s Data Analysis Unit indicates an 81% decrease in total marijuana arrests, from 1,605 in 2012 to 302 in 2017.
The most common marijuana industry‐related crime in Denver was burglary, accounting for 59% of marijuana crime related to the industry in 2017.
Court filings
The number of marijuana‐related court filings declined 55% between 2012 and 2017, from
11,753 to 5,288.
o The number of cases with a marijuana‐related felony as the top charge declined initially
(986 in 2012 to 418 in 2014) but rebounded to near pre‐legalization levels (907 in 2017).
o This contrasts with the decline in misdemeanors (down 13%) and petty offenses (down
62%) between 2012 and 2017.
o Filings fell by 1% for juveniles 10 to 17 years old, by 28% for young adults 18 to 20 years old, and by 67% for adults ages 21 or older.
In terms of organized crime, the number of court filings charged with the Colorado Organized Crime Control Act (C.R.S.18‐17.104) that were linked to some marijuana charge increased from 31 in 2012 to 119 in 2017.
o The types of charges associated with COCCA filings that increased most were manufacturing of marijuana or marijuana products (25 to 142) and possession of marijuana with intent to sell (32 to 124).
Traffic Safety
The increase in law enforcement officers who are trained in recognizing drug use, from 129 in 2012 to 214 in 2018, can increase drug detection rates apart from any changes in driver behavior.
Traffic safety data were obtained from a number of different sources. Please note that traffic safety data may be incomplete because law enforcement officers may determine that alcohol is impairing the driver, and therefore additional (time consuming and costly) drug testing may not be pursued.
The total number of DUI citations issued by the Colorado State Patrol (CSP) decreased from 5,705 in 2014 to 4,849 in 2017. The prevalence of marijuana or marijuana‐in‐combination identified by Patrol officers as the impairing substance increased from 12% of all DUIs in 2014 to 15% in 2017.

3
In 2016, the most recent data available, 27,244 cases were filed in court that included a charge of driving under the influence; 17,824 of these were matched with either a breath or blood test.1
o Of these, 3,946 had blood samples screened for the presence of marijuana: 2,885 cases
(73.2%) had a positive cannabinoid screen and a follow‐up confirmation for other cannabis metabolites, and 47.5% detected Delta‐9 THC at 5.0 ng/mL or above.
According to CDOT, the number of fatalities in which a driver tested positive for Delta‐9 THC at or above the 5.0 ng/mL level declined from 52 (13% of all fatalities) in 2016 to 35 in 2017 (8% of all fatalities).
The number of fatalities with cannabinoid‐only or cannabinoid‐in‐combination
positive drivers increased 153%, from 55 in 2013 to 139 in 2017.
However, note that the detection of any cannabinoid in blood is not an indicator of impairment but only indicates presence in the system. Detection of Delta‐9 THC, one of the primary psychoactive metabolites of marijuana, may be an indicator of impairment.
o A 2017 survey conducted by the Colorado Department of Public Health and
Environment found that 3.0% of adults reported driving within two‐to‐three hours of using marijuana in the past‐30 days, while 19.7% of recent marijuana users reported this behavior.
Probationers testing positive
The proportion of 18 to 25 year‐old probationers testing positive for THC increased, from 32% in 2012 and 41% in 2017. The proportion of 36 and older probationers testing positive for THC also increased, from 14% in 2012 to 21% in 2017. Illegal cultivation on public land
The number of plants seized on public lands increased. There were 80,926 plants seized in 2017, up 73% from 46,662 in 2012. Diversion to other states
The Colorado Information Analysis Center (CIAC), located in the Department of Public Safety, compiled data from the El Paso Intelligence Center (EPIC), manages a database in which law enforcement agencies can voluntarily report drug seizures. The number of seizures for Colorado‐sourced marijuana reported to EPIC increased from 286 in 2012 to 608 in 2017.
o The types of marijuana products seized has changed over time, with marijuana concentrates accounting for 26% of seizures and edibles accounting for another 16% in
1 Please see http://cdpsdocs.state.co.us/ors/docs/reports/2018‐DUI_HB17‐1315.pdf for more information.
4
2017. In 2012, both of those categories combined accounted for 10% of marijuana seizures reported to EPIC.
Public Health
Adult usage rates
The Colorado Behavioral Risk Factor Surveillance System (BRFSS) is a statewide telephone survey conducted by the Colorado Department of Public Health and Environment (CDPHE). In 2014, the BRFFS was expanded to include questions about marijuana use.
o In 2017, 15.5% of adults reported marijuana use in the past 30 days, compared to 13.6% in 2014, a significant increase. Also, in 2017, 7.6% reported daily or near daily use. This compares to 6.0% in 2014, a significant increase. Males have significantly higher past 30‐day use (19.8%) than females
(11.2%).
Adults ages 18‐25 reported the highest past 30‐day usage rates (29.2%), followed by 26‐34 year olds (26.4%), 35‐64 year olds (12.5%), and those 65 years and older (5.6%).
According to the National Survey on Drug Use and Health, administered by the federal Substance Abuse and Mental Health Services Administration, the prevalence rates for marijuana use in the past 30 days increased for young adults (18‐ to 25‐years old), from 21.2% in 2005/06 (pre‐commercialization) to 31.2% in 2013/14 (post‐commercialization), but stabilized at 32.2% in 2015/16. Reported 30‐day marijuana use by adults ages 26 years and older increased from 5% in 2005/06 to 14% in 2015/16. Hospitalizations and emergency department visits
The Colorado Department of Public Health and Environment (CDPHE) analyzed data from the Colorado Hospital Administration (CHA) with these findings:
Hospitalization rates (per 100,000 hospitalizations) with possible marijuana exposures, diagnoses, or billing codes increased from 803 per 100,000 before commercialization (2001‐2009) to 2,696 per 100,000 after commercialization (January 2014‐September 2015). The period from October 2015‐December 2015 indicated another increase, but due to changes in coding systems, variable structures, and policies at CHA, the numbers for 2016 are considered preliminary by CDPHE.
The period of retail commercialization showed an increase in emergency department visits, from 739 per 100,000 ED visits (2010–2013) to 913 per 100,000 ED visits (January 2014–September 2015). There was no definitive trend during the period October 2015‐December 2015 and, due to changes in coding systems, variable structures, and policies at CHA, these figures for 2016 are considered preliminary by CDPHE.

5
Poison control
The number of calls to poison control mentioning human marijuana exposure increased over the past 10 years. There were 45 calls in 2006 and 222 in 2017. Between 2014 and 2017, the frequency of calls reporting human marijuana exposure stabilized.
Youth Impacts Usage rates
Data on youth marijuana use was available from two sources. The Healthy Kids Colorado Survey (HKCS), with 47,146 high school and 6,704 middle school students responding in 2017, and the National Survey on Drug Use and Health (NSDUH), with about 512 respondents in 2015/16.
o HKCS results indicate no significant change in past 30‐day use of marijuana between 2013 (19.7%) and 2017 (19.4%). Also, in 2017, the use rates were not different from the national 30‐day use rates reported by the Youth Risk Behavior Survey.2 In 2017, 19.4% of Colorado high school students reported using marijuana in the past 30‐days compared to 19.8% of high school students nationally that reported this behavior.
o The 2017 HKCS found that marijuana use increases by grade level, with 11.0% of 9th graders, 17.7% of 10th graders, 23.7% of 11th graders, and 25.7% of 12th reporting use in the past 30‐days.
o The 2015/16 NSDUH, with many fewer respondents compared to HKCS, indicated a gradual increase in youth use from 2006/07 (9.1%) to 2013/14 (12.6%); however, the last two years showed decreased use, with 9.1% reporting use in 2015/16. The NSDUH showed that youth use of marijuana in Colorado (9.1%) was above the national average (6.8%).
Arrests
The number of juvenile marijuana arrests decreased 16%, from 3,168 in 2012 to 2,655 in 2017. The rate of juvenile marijuana arrests per 100,000 decreased from 583 in 2012 to 453 in 2017 (‐22%).
o The number of White juvenile arrests decreased from 2,146 in 2012 to 1,703 in 2017 (‐21%).
o The number of Hispanic juvenile arrests decreased from 767 in 2012 to 733 in 2017 (‐4%).
o The number of Black juvenile arrests decreased from 202 in 2012 to 172 in 2017 (‐15%).
2 The YRBS is the comparable survey overseen nationally by the Centers for Disease Control and Prevention.

6
Probationers testing positive
Data from the state Division of Probation Services indicated that the proportion of 10‐ to 14‐year‐olds testing positive for THC one or two times increased from 19% in 2012 to 23% in 2014, while the proportion testing positive three or more times increased from 18% to 25%. The proportion of 15‐ to 17‐year‐olds testing positive one or two times went down slightly, from 26% in 2012 to 25% in 2014, while those testing positive three or more times increased from 23% to 25%.
School suspension/expulsion rates
Data from the Colorado Department of Education show that that drug suspension rates increased from 391 (per 100,000 registered students) in the 2008‐09 school year to 551 in 2010‐11. The drug suspension rate fluctuated somewhat since then and was 507 in the 2017‐18 school year. The drug expulsion rate was 65 (per 100,000 registered students) in the 2008‐09 school year, increasing to 91 in 2010‐11, and then decreasing to 38 by 2017‐18.
o School discipline data for 2017‐18 indicated that marijuana accounted for 22% of all expulsions and 24% of all law enforcement referrals in Colorado public schools.
o Note that Senate Bill 12‐046 and House Bill 12‐1345 targeted reform of “zero tolerance” policies in schools, and appear to have decreased expulsions, suspensions, and referrals to law enforcement.3
Drug‐endangered children
To assess drug‐endangered children, as required in S.B. 13‐283, data from CDPHE’s Child Health Survey (targeting parents with children ages 1‐14) was obtained.
o Of parents with children ages 1–14 who responded to the survey, 6.9% reported some type of marijuana product around the house. When asked about where it was kept, 92% reported storing it in a location the child cannot access.
Additional Information
In May 2018, 3,101 licensed marijuana businesses were registered in Colorado. Nearly 70% of the licenses for marijuana businesses were concentrated in the counties of Denver (1,226), El Paso (370), Pueblo (303), and Boulder (216).
Total revenue from taxes, licenses, and fees increased from $67,594,325 in 2014 to $247,368,474 in 2017 (+266%). Excise tax revenue dedicated to school capital construction assistance was $40,000,000 in 2017 and an additional $27,752,968 was dedicated to the public school fund.
3 See Rosa, J., Krueger, J., and Severson, A. (May 2015). Moving from Zero Tolerance to Supportive School Discipline Practices. Office of Dropout Prevention and Student Re‐engagement, Colorado Department of Education.
7
In April 2018, there were 88,946 individuals registered as medical marijuana cardholders. The most common conditions reported were severe pain (93%), muscle spasms (31%), and severe nausea (14%).
Summary. Again, please note that fundamental measurement challenges interfere with our ability to
confidently interpret the information presented here. As previously discussed, legalization may result in
reports of increased use, which may be a function of the decreased stigma and legal consequences
associated with use rather than actual changes in use patterns. Likewise, those reporting to poison
control, emergency departments, or hospitals may feel more comfortable discussing their recent use or
abuse of marijuana for purposes of treatment. Finally, complex and sometimes conflicting laws have
caused law enforcement officials and prosecuting attorneys to modify policies and practices that cannot
be disentangled from available data. For these reasons, it is critical to avoid ascribing changes in many
social indicators solely to marijuana legalization.
8
SECTION ONE:
INTRODUCTION
This section provides a brief overview of the statutory mandate behind this report, data limitations, data
sources and analytical approaches. It also describes federal and state marijuana laws, including the
federal responses to Colorado’s Amendment 64 which was passed by voters in 2012.
Background, Limitations and Methods
In 2013, following the passage of Amendment 64 allowing for the retail sale and possession of
marijuana, the Colorado General Assembly enacted Senate Bill 13‐283. This bill mandated that the
Division of Criminal Justice in the Department of Public Safety conduct a study of the impacts of
Amendment 64, particularly as these relate to law enforcement activities. This report seeks to present
the measures for the metrics specified in S.B. 13‐283 (C.R.S. 24‐33.4‐516). These metrics, which guide
the structure of this report and the data elements analyzed, are presented in Table 1.
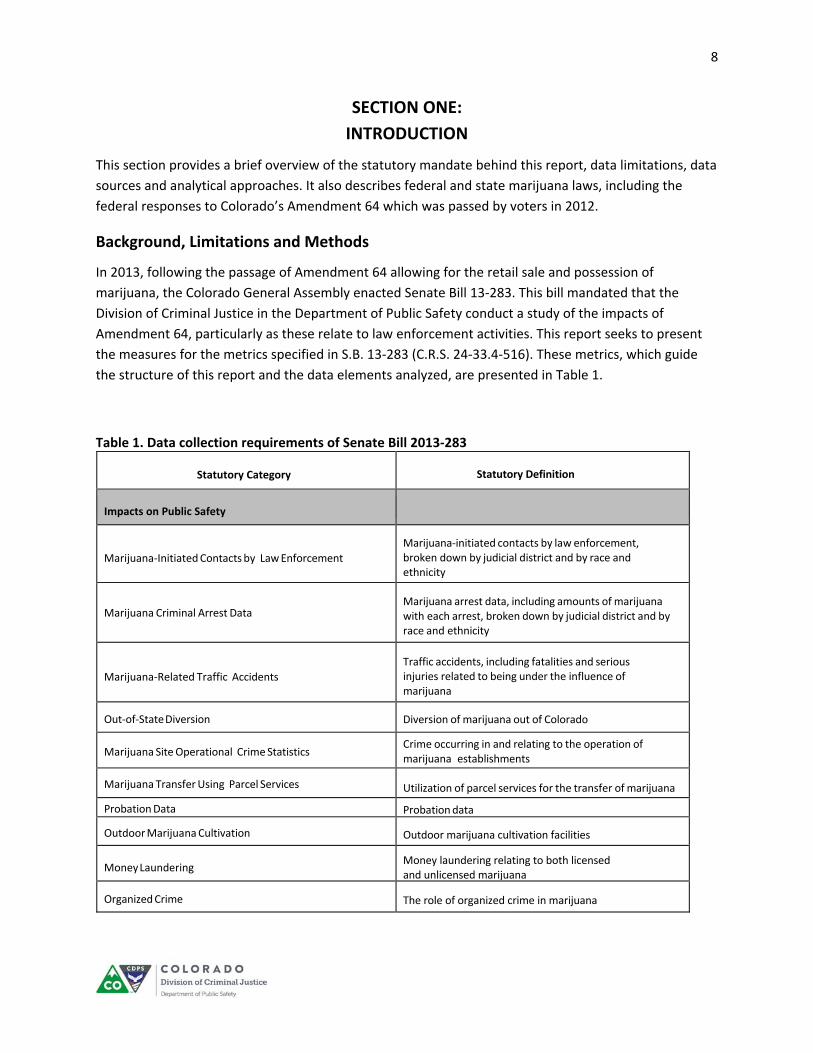
Table 1. Data collection requirements of Senate Bill 2013‐283
Statutory Category Statutory Definition
Impacts on Public Safety
Marijuana‐Initiated Contacts by Law Enforcement
Marijuana‐initiated contacts by law enforcement, broken down by judicial district and by race and ethnicity
Marijuana Criminal Arrest Data Marijuana arrest data, including amounts of marijuana with each arrest, broken down by judicial district and by race and ethnicity
Marijuana‐Related Traffic Accidents
Traffic accidents, including fatalities and serious injuries related to being under the influence of marijuana
Out‐of‐State Diversion Diversion of marijuana out of Colorado
Marijuana Site Operational Crime Statistics Crime occurring in and relating to the operation of marijuana establishments
Marijuana Transfer Using Parcel Services Utilization of parcel services for the transfer of marijuana
Probation Data Probation data
Outdoor Marijuana Cultivation Outdoor marijuana cultivation facilities
Money Laundering Money laundering relating to both licensed and unlicensed marijuana
Organized Crime The role of organized crime in marijuana
9
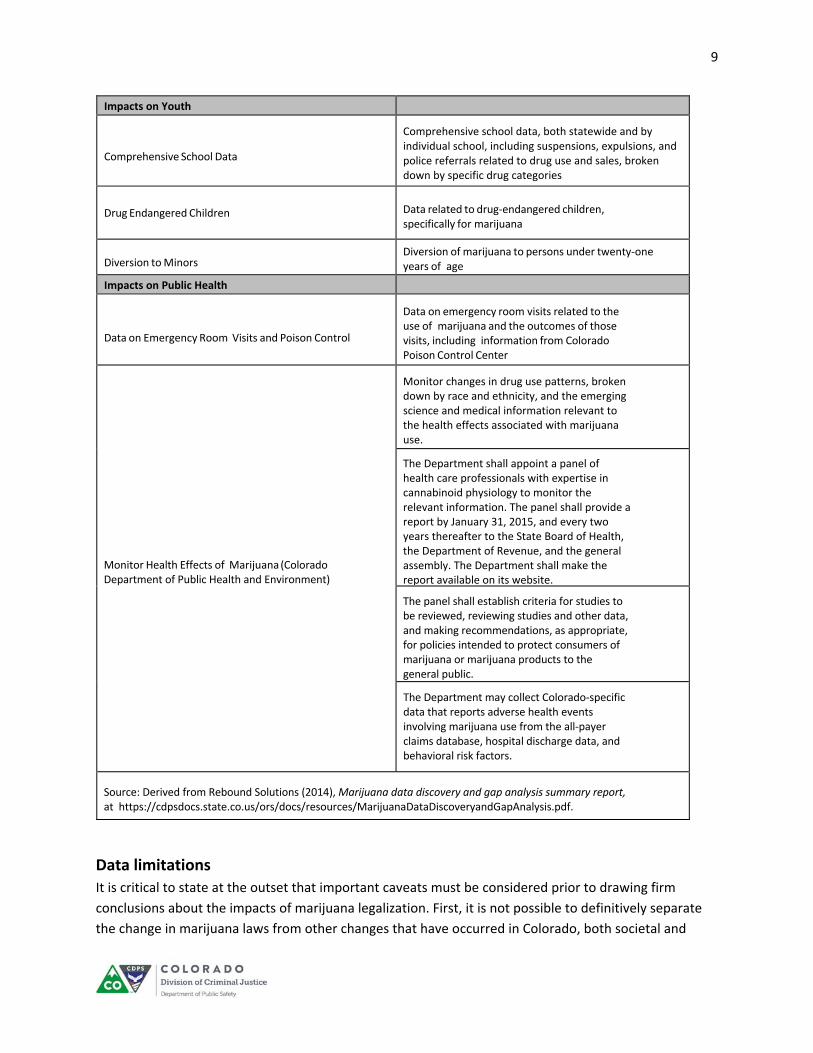
Impacts on Youth
Comprehensive School Data
Comprehensive school data, both statewide and by individual school, including suspensions, expulsions, and police referrals related to drug use and sales, broken down by specific drug categories
Drug Endangered Children Data related to drug‐endangered children, specifically for marijuana
Diversion to Minors Diversion of marijuana to persons under twenty‐one years of age
Impacts on Public Health
Data on Emergency Room Visits and Poison Control
Data on emergency room visits related to the use of marijuana and the outcomes of those visits, including information from Colorado Poison Control Center
Monitor Health Effects of Marijuana (Colorado Department of Public Health and Environment)
Monitor changes in drug use patterns, broken down by race and ethnicity, and the emerging science and medical information relevant to the health effects associated with marijuana use.
The Department shall appoint a panel of health care professionals with expertise in cannabinoid physiology to monitor the relevant information. The panel shall provide a report by January 31, 2015, and every two years thereafter to the State Board of Health, the Department of Revenue, and the general assembly. The Department shall make the report available on its website.
The panel shall establish criteria for studies to be reviewed, reviewing studies and other data, and making recommendations, as appropriate, for policies intended to protect consumers of marijuana or marijuana products to the general public.
The Department may collect Colorado‐specific data that reports adverse health events involving marijuana use from the all‐payer claims database, hospital discharge data, and behavioral risk factors.
Source: Derived from Rebound Solutions (2014), Marijuana data discovery and gap analysis summary report, at https://cdpsdocs.state.co.us/ors/docs/resources/MarijuanaDataDiscoveryandGapAnalysis.pdf.
Data limitations
It is critical to state at the outset that important caveats must be considered prior to drawing firm
conclusions about the impacts of marijuana legalization. First, it is not possible to definitively separate
the change in marijuana laws from other changes that have occurred in Colorado, both societal and
10
legal. Second, changes in reported marijuana use may be the result of decreased social stigma and legal
ramifications. For example, an adult may be more willing to divulge marijuana use upon admission to an
emergency department now that it is legal. Third, legalization has heightened awareness of the need to
gather data on marijuana and, in some cases, has led to improvements in data collection that then make
analyzing historical trends difficult. For example, the Colorado Department of Transportation improved
its data collection systems on fatal crashes, allowing for better analysis of current data but has made
some of the historical data not comparable. For these reasons, we caution readers about gaps in data
that impede our comprehensive understanding of the impact of the legalization of retail marijuana in
Colorado.
Data Sources
The information presented in this report was compiled from data made available from the following
entities:
Colorado State Government
Colorado Attorney General’s Office, Peace Officer Standards and Training
Colorado Department of Education
Colorado Department of Human Services, Office of Behavioral Health
Colorado Department of Local Affairs, Office of Demography
Colorado Department of Public Health and Environment, Center for Health and Environmental
Data
Colorado Department of Public Health and Environment, Disease Control and Environmental
Epidemiology Division
Colorado Department of Public Health and Environment, Laboratory Services Division
Colorado Department of Public Health and Environment, Marijuana Health Monitoring and
Research Program
Colorado Department of Public Health and Environment, Prevention Services Division
Colorado Department of Public Safety, Colorado Bureau of Investigation
Colorado Department of Public Safety, Colorado Information Analysis Center
Colorado Department of Public Safety, Colorado State Patrol
Colorado Department of Public Safety, Division of Criminal Justice
Colorado Department of Revenue, Marijuana Enforcement Division
Colorado Department of Revenue, Taxation Division
Colorado Department of Transportation
Colorado Governor’s Office of State Planning and Budgeting
Colorado Judicial Branch, Court Services Division
Colorado Judicial Branch, Probation Services Division
Municipal and Private
Chematox Laboratory

11
City and County of Denver, Office of Marijuana Policy
Coalition of Colorado Alcohol and Drug Educators
Colorado Hospital Association
Denver County Court
Denver Police Department
Rocky Mountain Poison and Drug Center
Federal
Rocky Mountain High Intensity Drug Trafficking Area
U.S. Bureau of Land Management
U.S. Department of Health and Human Services, Substance Abuse and Mental Health Services
Administration
U.S. Department of Justice, Drug Enforcement Administration
U.S. Forest Service
U.S. National Park Service
Data Collection Methodology
The data were collected and analyzed in several ways. First, many entities provide public information on
agency websites in the form of reports, briefing papers, and downloadable spreadsheets (e.g., the
National Survey on Drug Use and Health). When this was the case, the analysis was conducted by
Division of Criminal Justice (DCJ) researchers, and links to the original source material are provided in
footnotes. Second, summary data were analyzed and provided by several entities; this information was
made available for this report and is not published elsewhere (e.g., CDPHE’s analysis of marijuana users
who report driving after consuming). Third, several entities provided individual‐level, nonpublic data
(e.g., CBI’s arrest data), and these data were analyzed by DCJ researchers. All analyses and graphic
presentations were sent to the original data sources for review to ensure the information is accurately
represented.
Brief History of Marijuana Laws
Federal Law
The Federal Controlled Substances Act (CSA)4 classifies marijuana as a Schedule I drug. Drugs classified
as Schedule I are considered the most dangerous class of drugs with no currently accepted medical use
and a high potential for abuse. Some examples of other Schedule I drugs include heroin, MDMA
(ecstasy, Molly), LSD, mescaline (peyote), and psilocybin (mushrooms).
The Schedule I classification puts state laws legalizing medical or recreational marijuana at odds with the
CSA. As of July 2018, there were nine states plus the District of Columbia allowing for the sale of
recreational marijuana in addition to medical marijuana, 22 states allowing only medical marijuana, 15
4 21 U.S.C. § 811.
12
states allowing cannabidiol5 exclusively, and four states that do not allow any legal cannabis products.6
The widespread growth of medical marijuana legalization over the past 20 years has put an increasing
number of states, including Colorado, in conflict with the CSA. Figures 1‐3 give snapshots of state
marijuana laws at three different points in time to demonstrate the evolution of legalization.
Colorado Laws
The following bullets reflect five distinct eras in both the legal status and commercial availability of
marijuana in Colorado:
Prior to 2000: Illegal to possess or grow.
2000–2009: Amendment 20 approved and medical marijuana is legalized. Colorado Department
of Public Health and Environment (CDPHE) issues registry identification cards to individuals who
have received recommendations from a doctor that marijuana will help a debilitating medical
condition. It is legal to possess up to two ounces and grow 6 plants (or more with doctor’s
recommendation) with a registry identification card. No regulated market exists. Individual grow
operations or caregiver grow operations limited to five patients is allowed.
2010–2012: Medical marijuana is commercialized and regulated with licensed dispensaries,
grow operations, and product manufacturers open in jurisdictions allowing these types of
businesses.
2013: Amendment 64 takes effect. Personal possession and grow limits for recreational
marijuana are in place but sales are not commercialized. Medical continues as a regulated,
commercial market.
2014 to present:7 Recreational and medical marijuana fully regulated and commercialized.
Licensed retail stores open January 1, 2014.
Amendment 20
In 2000, Colorado passed Amendment 20 allowing those suffering from certain debilitating medical
conditions to grow and possess a limited amount of marijuana with a doctor’s recommendation that it
may help their condition.8 Patients are required to register with the Colorado Department of Public
Health and Environment (CDPHE) and obtain a registry identification card that indicates their status as a
certified medical marijuana patient. The list of conditions eligible for a card includes cachexia, cancer,
glaucoma, HIV/AIDS, muscle spasms, post‐traumatic stress disorder, seizures, severe nausea, and severe
5 Cannabidiol (CBD) is a nonpsychoactive substance derived from cannabis with potential medical uses. For a review of some relevant research, see Scuderi, C. et al. (2009). Cannabidiol in medicine: a review of its therapeutic potential in CNS disorders, Phytotherapy Research, 23 (5), 597‐602. 6 National Conference of State Legislatures, State Medical Marijuana Laws (2018), http://www.ncsl.org/research/health/state‐medical‐marijuana‐laws.aspx. 7 Others group 2010–2013 as the era of medical commercialization and do not differentiate 2013 as it did not increase the availability of marijuana in the commercial market. 8 Colo. Const. Art. XVIII, § 14. Additional information can be accessed at Ballotpedia, Colorado Medical Use of Marijuana, Initiative 20 (2000), https://ballotpedia.org/Colorado_Medical_Use_of_Marijuana,_Initiative_20_(2000). A detailed review of the history of medical marijuana in Colorado and the recent status of the medical marijuana code can be found in the Colorado Department of Regulatory Agencies’ 2014 Sunset Review: Colorado Medical Marijuana Code, available at https://drive.google.com/a/state.co.us/file/d/0B8bNvcf083ydTFpkdVRwdnhTazQ/view.
13
pain. Amendment 20 provides an affirmative defense from prosecution for cardholders who are allowed
to grow six plants (three mature, three immature) and possess up to two ounces of finished product,
unless a doctor determines that additional marijuana is needed to treat a patient’s condition. Patients
can choose to grow their own marijuana or designate a caregiver to grow it for them.
Initially, a caregiver was limited to growing medical marijuana for five patients and his/herself if he/she
was a medical marijuana cardholder. The justification for this limit was challenged in Denver District
Court, and was overturned.9 In 2009, the Colorado Board of Health rejected the five‐patient limit for
caregivers. That same year, the U.S. Department of Justice issued what is known as the Ogden Memo
(see Appendix A), which gave guidance to U.S. Attorneys regarding prosecution for marijuana offenses.
Specifically, the Ogden Memo told U.S. Attorneys that they should not “focus federal resources in your
States on individuals whose actions are in clear and unambiguous compliance with existing state laws
providing for the medical use of marijuana.” 10 The combination of the Court decision, the Board of
Health’s rejection of the five‐patient caregiver limit, and the Ogden Memo set the stage for the
commercialization of medical marijuana. In 2010, two laws were passed: a medical marijuana code was
promulgated by the Legislature through the passage of House Bill 10‐1284, which established a
regulatory structure within the Colorado Department of Revenue (DOR) and the Colorado Department
of Public Health and Environment (CDPHE); and Senate Bill 10‐109, which clarified the definition of a
“bona fide physician patient relationship.” The Marijuana Enforcement Division (MED) was created
within DOR to license and regulate the medical marijuana industry in Colorado.11
The commercialization of medical marijuana followed and the number of patients registered with
CDPHE increased dramatically, from about 5,000 in 2009 to almost 119,000 in 2011. The number of
registered patients dropped to 88,143 as of July 2018.
Amendment 64
Prior to the passage of Amendment 64 in 2012, Initiative 44 was put on the ballot in 2006 in an attempt
to legalize the possession of one ounce or less of marijuana for adults 21 and older. The initiative failed,
with 59% of Colorado voters saying no to the question of allowing possession and use.12 In 2012, a more
expansive initiative was placed on the ballot that would not simply allow for possession but would
create the first legal marketplace for recreational marijuana in the world. Amendment 64 passed, with
55% of voters saying yes to the question.13
9 Lagoy v. Colorado, 2007 CV 6089 (Denver County District Court, 2nd Judicial District, November 15, 2007; Denver County District Court, 2nd Judicial District, November 5, 2009). 10 U.S. Department of Justice (2009). Ogden memo: Investigations and prosecutions in states authorizing the medical use of marijuana, at http://www.justice.gov/sites/default/files/opa/legacy/2009/10/19/medical‐marijuana.pdf. 11 Medical Marijuana Code: C.R.S. 12‐43.3‐101 et seq. For additional information on the MED, see https://www.colorado.gov/enforcement/marijuanaenforcement. 12 Ballotpedia, Colorado Marijuana Possession, Initiative 44 (2006), available at https://ballotpedia.org/Colorado_Marijuana_Possession,_Initiative_44_(2006). 13 Ballotpedia, Colorado Marijuana Legalization Initiative, Amendment 64 (2012), https://ballotpedia.org/Colorado_Marijuana_Legalization_Initiative, Amendment_64_(2012).
14
Amendment 64 allows for individuals 21 years or older to grow up to six plants (three mature and three
immature) and keep all of marijuana produced on the same premises, possess up to one ounce of
marijuana, and give away without remuneration up to one ounce of marijuana to someone 21 years or
older. It also instructed Colorado’s Marijuana Enforcement Division to create rules, regulations, and
licenses to allow for the first recreational marijuana marketplace by July 1, 2013. This included rules for
licensing, ownership, security, labeling, production control, reduction of diversion, health and safety
standards, advertising, and privacy guarantees. These rules resulted in the Retail Marijuana Code.14
The MED began accepting applications for retail stores on October 1, 2013. At that time applicants
needed to have a current medical marijuana license to be eligible for a retail license. The first stores
opened on January 1, 2014.15
Additional rule‐making was conducted by the Department of Revenue, Department of Public Health and
Environment, Department of Agriculture, and the Department of Regulatory Affairs to clarify a variety of
issues that have arisen with the advent of the first legal marijuana marketplace.16 Examples include
issues regarding pesticide application, testing for mold and solvents, THC homogeneity in manufactured
products, among others.
Federal Response
In the wake of Amendment 64 and other recreational legalization efforts throughout the country, in
2013 the United States Department of Justice (USDOJ) issued what is known as the Cole Memo (see
Appendix B).17 This gave guidance to U.S. Attorneys across the country. The Cole Memo set forth
USDOJ’s enforcement priorities, including:
1. Preventing distribution of marijuana to minors
2. Preventing revenue from going to criminal enterprises, gangs, and cartels
3. Preventing diversion of marijuana from states where it is legal under state law in some form to
other states
4. Preventing state‐authorized marijuana activity from being used as a cover or pretext for the
trafficking of other illegal drugs or other illegal activity
5. Preventing violence and the use of firearms in the cultivation and distribution of marijuana
6. Preventing driving under the influence of drugs (DUID) and exacerbation of other adverse public
health consequences associated with marijuana use
7. Preventing growth on public lands with attendant public safety and environmental damages
8. Preventing marijuana possession or use on federal property
14 Retail Marijuana Code: C.R.S. 12‐43.4‐101 et seq. at https://www.colorado.gov/pacific/enforcement/laws‐constitution‐statutes‐and‐regulations‐marijuana‐enforcement. 15 For a detailed review of the history of the regulation of retail marijuana see Department of Regulatory Agencies (2015), 2015 sunset review: Colorado retail marijuana code, at https://drive.google.com/file/d/0B8bNvcf083ydSlh4NWtHTjFoa2s/view. 16 A compendium of amendments, statutes, and rules is available in the Colorado marijuana laws and regulations 2017 (2018). LexisNexis: Charlottesville, VA. This publication is updated annually to reflect changes in statutes and rules. 17 U.S. Department of Justice (2013). Cole memo: Guidance regarding marijuana enforcement, at http://www.justice.gov/iso/opa/resources/3052013829132756857467.pdf.
15
The General Accounting Office (GAO) reported in 2015 that USDOJ’s Office of the Deputy Attorney
General was monitoring the effects of marijuana legalization in two ways.18 First, according to the GAO
report, “U.S. Attorneys prosecute cases that threaten federal marijuana enforcement priorities and
consult with state officials about areas of federal concern, such as the potential impact on enforcement
priorities of edible marijuana products. Second, officials reported they collaborate with DOJ
components, including the Drug Enforcement Administration (DEA) and other federal agencies, including
the Office of National Drug Control Policy, and assess various marijuana enforcement‐related data these
agencies provide.” The GAO report indicated that the USDOJ has not documented its monitoring
approach, leading to a gap in knowledge about state‐level adherence to the Cole memo. In Colorado,
the Rocky Mountain High Intensity Drug Trafficking Area (RMHIDTA), funded by the Office of National
Drug Control Policy, is tracking the impact of marijuana legalization in the state and has produced five
reports of findings.19
Attorney General Jeff Sessions rescinded the Cole Memo on January 4, 2018 and gave full discretion on
the investigation and prosecution of marijuana offenses to the U.S. Attorneys’ offices. This means that a
case no longer must include violations of Cole Memo factors before it is pursued for Federal
prosecution.
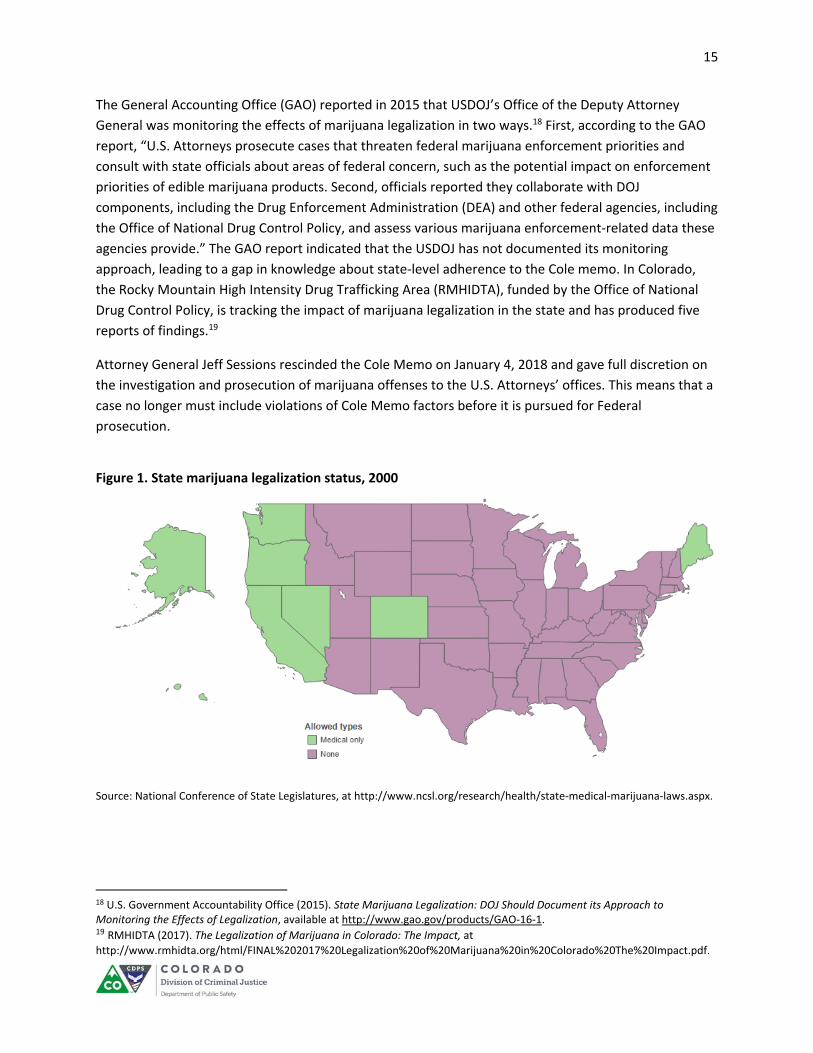
Figure 1. State marijuana legalization status, 2000
Source: National Conference of State Legislatures, at http://www.ncsl.org/research/health/state‐medical‐marijuana‐laws.aspx.
18 U.S. Government Accountability Office (2015). State Marijuana Legalization: DOJ Should Document its Approach to Monitoring the Effects of Legalization, available at http://www.gao.gov/products/GAO‐16‐1. 19 RMHIDTA (2017). The Legalization of Marijuana in Colorado: The Impact, at
http://www.rmhidta.org/html/FINAL%202017%20Legalization%20of%20Marijuana%20in%20Colorado%20The%20Impact.pdf.

16
Figure 2. State marijuana legalization status, 2012
Source: National Conference of State Legislatures, at http://www.ncsl.org/research/health/state‐medical‐marijuana‐laws.aspx.
Figure 3. State marijuana legalization status, 2018
Source: National Conference of State Legislatures, at http://www.ncsl.org/research/health/state‐medical‐marijuana‐laws.aspx.
Organization of this report
Section Two focuses on the public safety impacts of marijuana legalization while Section Three presents
information concerning public health and behavioral services. Section Four presents impacts on youth,
and Section Five provides additional information that may be of interest to the reader.
17
Summary
This report presents data from multiple sources in an effort to provide information for assessing the
impact of the commercialization of marijuana on public safety, public health, behavioral services, and
youth access in Colorado, drawing from a myriad of data sources. It is critical to remember that
important data limitations exist, and these issues are discussed throughout the report. The history of
marijuana laws in Colorado, along with the Ogden and Cole Memos, reflect the dynamic environment in
which regulations and enforcement are critical components. The impact of Amendment 64 on public
safety is the focus of the next section.
18
SECTION TWO:
IMPACT ON PUBLIC SAFETY
Overview
The potential impacts to public safety from the legalization of marijuana were of concern to the
legislature, law enforcement officials, district attorneys, and other public safety stakeholders across the
state. Since no jurisdiction had yet legalized marijuana for recreational purposes, the public safety
impacts were unknown. The Cole Memo (see Appendix B; Section One provides a description of this
memo) provided guidance on several public safety impacts of concern to the U.S. Department of Justice.
The specific public safety areas of interest addressed in Senate Bill 2013‐183 (see Section One for a
description of this bill), some of which were influenced by the Cole Memo, included:
Marijuana‐initiated law enforcement contacts Marijuana arrests Crime around marijuana establishments Marijuana‐related traffic accidents and DUID Organized crime and money laundering Probation infractions Illegal cultivation on public land Diversion out of state Transfer using parcel services
Data Collection Challenges
Meeting the reporting requirements of Senate Bill 2013‐183 remains challenging. For example,
“marijuana‐initiated law enforcement contacts,” a data point mandated in the bill, is not a term used by
any law enforcement agency, nor is contact data (for any purpose) collected systematically by law
enforcement agencies. Further, S.B. 13‐283 required contact data to be disaggregated by race/ethnicity,
and it is not known how a law enforcement officer would determine race/ethnicity of individuals
involved in a marijuana‐initiated contact. In sum, this information does not exist and therefore cannot
be included in this analysis.
Information on arrests is available, but only from 2012 due to improvements in data reporting. The
National Incident Based Reporting System (NIBRS) is part of the Federal Bureau of Investigation’s data
collection system, and is managed locally by the Colorado Bureau of Investigation. NIBRS has
significantly more information than the Uniform Crime Reporting (UCR) system, including information
about drug type, which is not available in UCR data. Colorado became a “NIBRS compliant” state in
2012, with nearly all agencies reporting greater details on crime incidents. For this reason, information
concerning Colorado arrests related to marijuana offenses is unavailable for analysis prior to 2012.
Data on crime around marijuana establishments are not collected in any central repository, but the
Denver Police Department began a process in 2012 to assess whether such crime was a significant
problem, and this information is reported below.
19
Likewise, information on diversion of marijuana out of state and transfer using parcel services is not
collected in any central location. Additionally, with an enhanced focus on marijuana, it is possible that
law enforcement agencies, becoming more aware of the issue, would increase interdiction efforts,
potentially resulting in an increase in seizures which may or may not be related to an actual increase in
diversion.
Significant challenges exist in the collection of information on traffic accidents and driving under the
influence. The state statute on impaired driving does not differentiate between driving under the
influence of alcohol and driving under the influence of drugs. Further, there is no central repository for
toxicology results from drivers that would allow for an examination of impaired driving throughout the
state. The current data system that collects information on roadway fatalities does not capture the
specific toxicology results that would indicate impairment, does not consistently capture information on
surviving drivers involved in fatalities, and is limited to testing results from three drugs detected in the
driver’s system.
S.B. 13‐283 mandates the analysis of “probation data.” To this end, probationer drug tests associated
with marijuana use were analyzed,20 but the State Judicial Branch’s database does not capture whether
an infraction or revocation was marijuana‐related or even related to drugs in general.
Despite significant challenges in meeting all of the statute’s reporting requirements, data that are
available were analyzed to help inform stakeholders about these issues.
Offenses and Arrests21
Data on marijuana arrests and offenses for the period 2012–2017 were obtained from the Colorado
Bureau of Investigation’s (CBI) National Incident‐Based Reporting System (NIBRS) database. The NIBRS
database includes detailed information on arrests and offenses, which the previous UCR summary
reporting system did not provide. Colorado became fully NIBRS compliant in 2012, which limits the years
of historical data available for analysis.
Marijuana Arrests
Overall
The total number of marijuana arrests decreased by 56% between 2012 and 2017, from 12,709 to 6,153
(Table 2). Marijuana possession arrests, which make up the majority of all marijuana arrests, were cut by
more than half (‐59%). Marijuana sales arrests decreased by 17%, while arrests for marijuana production
increased markedly (+51%). Marijuana arrests that were unspecified, meaning the specific reason for
the arrest was not provided by law enforcement, went down by 45%. The arrest rates per 100,000 adult
20 Juvenile probation data is presented in Section Four: Impacts on Youth. 21 While offenses and arrests are related, they are not the same and may display different patterns. An offense is counted when a crime is reported to law enforcement, regardless of whether there is an arrest. For example, there may be a reported burglary with no related arrest. An arrest is a response to a crime, and there may be multiple arrests for a single offense. For example, one robbery committed by two suspects can result in two arrests.

20
population followed similar trends, with the possession rate down 59%, sales down 24%, and production
up 38%.
Age Group
Between 2012 and 2017, a 78% reduction in arrests occurred for those ages 21 and older for whom
marijuana possession of one ounce or less is now legal (Table 2). This compares with a 37% reduction in
the 18‐ to 20‐year‐old group who may legally possess only when they have a medical marijuana card.
Juveniles between the ages of 10 and 17 showed a 16% decrease in the number of marijuana arrests. In
2017, juveniles accounted for over four in ten (43%) of all marijuana arrests compared to 25% in 2012.
For details on arrest type, see Appendix C, Table 4.
The age group with the highest arrest rate in 2017 was 18‐ to 20‐year‐olds, at 908 per 100,000 18‐ to 20‐
year‐olds in the population (Table 3). This was double the juvenile rate (453) and nearly 30 times higher
than the rate for those 21 or older (34).
Race/Ethnicity
The decrease in the number of marijuana arrests by race/ethnicity was greatest for White arrestees
(‐56%) compared to Hispanics (‐39%) and Blacks (‐51%). The marijuana arrest rate for Whites (118 per
100,000) and Hispanics (133 per 100,000) was comparable, but the marijuana arrest rate for Blacks (233
per 100,000) was nearly double that that for Whites (Table 3). (For details on arrest type, see Appendix
C, Table 3.)
Gender
Between 2012 and 2017 the number of males arrested for marijuana offenses (Table 2) decreased 55%
compared to a decline of 38% for females. The arrest rate for males (189 per 100,000) was more than
triple that for females (59 per 100,000) (Table 3). For details on arrest type, see Appendix C, Table 5.

21
Table 2. Marijuana arrests in Colorado, 2012–2017
Number arrested for marijuana offenses
2012 2013 2014 2015 2016 2017
Total 12,709 6,359 6,902 6,728 6,250 6,153
Age group
10 to 17 3,168 3,030 3,325 2,956 2,615 2,655
18 to 20 3,307 2,241 2,221 2,064 2,026 2,099
21 or older 6,234 1,088 1,356 1,708 1,609 1,399
Race
White 9,207 4,377 4,499 4,375 4,129 4,069
Hispanic 2,340 1,328 1,552 1,541 1,414 1,423
Black 957 547 712 655 539 467
Other 205 107 139 157 168 194
Gender
Male 10,331 5,155 5,445 5,324 4,859 4,681
Female 2,378 1,204 1,457 1,404 1,391 1,472
Drug crime type*
Sales 301 224 229 175 221 251
Smuggling 6 5 0 4 8 3
Possession 11,361 5,407 5,962 5,982 5,454 5,154
Production 179 111 175 192 256 271
Unspecified 1,120 766 653 526 439 621
Arrest type^
On‐view arrest 3,059 1,209 1,120 1,074 1,313 1,353
Warrant arrest 804 329 330 282 411 367
Summons/citation 8,846 4,821 5,452 5,372 4,526 4,433
Source: Colorado Bureau of Investigation, National Incident‐Based Reporting System, analyzed by the Division of Criminal Justice. *A person can be charged with more than one drug offense. The totals for drug crime type are slightly larger than the count of total people arrested. ^On‐view are custodial arrests without a warrant or previous incident report. Warrants are custodial arrests based on a warrant or previous incident report. Summons/citations are non‐custodial arrests where a citation is given to the person and they are instructed to appear in court at a later date.
22
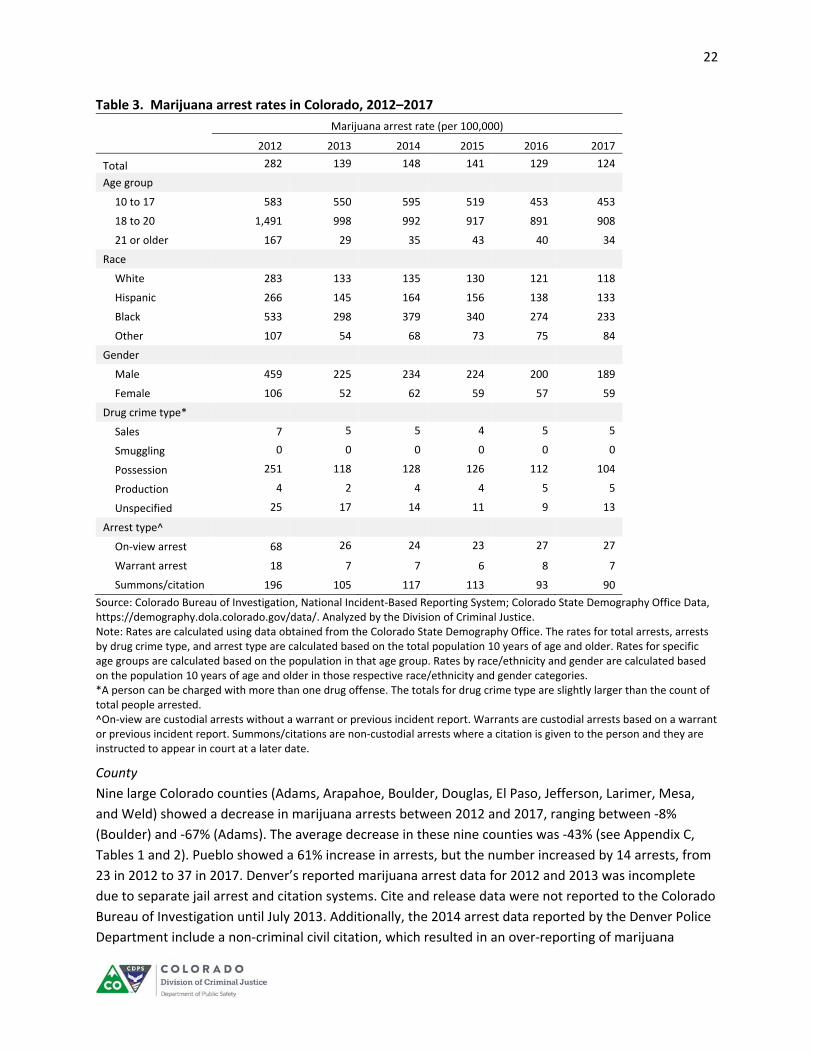
Table 3. Marijuana arrest rates in Colorado, 2012–2017
Marijuana arrest rate (per 100,000)
2012 2013 2014 2015 2016 2017
Total 282 139 148 141 129 124
Age group
10 to 17 583 550 595 519 453 453
18 to 20 1,491 998 992 917 891 908
21 or older 167 29 35 43 40 34
Race
White 283 133 135 130 121 118
Hispanic 266 145 164 156 138 133
Black 533 298 379 340 274 233
Other 107 54 68 73 75 84
Gender
Male 459 225 234 224 200 189
Female 106 52 62 59 57 59
Drug crime type*
Sales 7 5 5 4 5 5
Smuggling 0 0 0 0 0 0
Possession 251 118 128 126 112 104
Production 4 2 4 4 5 5
Unspecified 25 17 14 11 9 13
Arrest type^
On‐view arrest 68 26 24 23 27 27
Warrant arrest 18 7 7 6 8 7
Summons/citation 196 105 117 113 93 90
Source: Colorado Bureau of Investigation, National Incident‐Based Reporting System; Colorado State Demography Office Data, https://demography.dola.colorado.gov/data/. Analyzed by the Division of Criminal Justice. Note: Rates are calculated using data obtained from the Colorado State Demography Office. The rates for total arrests, arrests by drug crime type, and arrest type are calculated based on the total population 10 years of age and older. Rates for specific age groups are calculated based on the population in that age group. Rates by race/ethnicity and gender are calculated based on the population 10 years of age and older in those respective race/ethnicity and gender categories. *A person can be charged with more than one drug offense. The totals for drug crime type are slightly larger than the count of total people arrested. ^On‐view are custodial arrests without a warrant or previous incident report. Warrants are custodial arrests based on a warrant or previous incident report. Summons/citations are non‐custodial arrests where a citation is given to the person and they are instructed to appear in court at a later date.
County
Nine large Colorado counties (Adams, Arapahoe, Boulder, Douglas, El Paso, Jefferson, Larimer, Mesa,
and Weld) showed a decrease in marijuana arrests between 2012 and 2017, ranging between ‐8%
(Boulder) and ‐67% (Adams). The average decrease in these nine counties was ‐43% (see Appendix C,
Tables 1 and 2). Pueblo showed a 61% increase in arrests, but the number increased by 14 arrests, from
23 in 2012 to 37 in 2017. Denver’s reported marijuana arrest data for 2012 and 2013 was incomplete
due to separate jail arrest and citation systems. Cite and release data were not reported to the Colorado
Bureau of Investigation until July 2013. Additionally, the 2014 arrest data reported by the Denver Police
Department include a non‐criminal civil citation, which resulted in an over‐reporting of marijuana
23
arrests for that year. The county‐level data in Appendix C presenting this information should be
interpreted with caution. Separate data provided by the Denver Police Department’s Data Analysis Unit
indicated an 81% decrease in total marijuana arrests, from 1,605 in 2012 to 302 in 2017 (Appendix C,
Table 13).
Agency
The trends for each agency reporting marijuana arrests to the National Incident Based Reporting System
(NIBRS) are presented in Appendix C, Table 12. Nearly all large departments reported decreases in
marijuana arrests. The biggest decreases occurred in the Boulder Police Department (‐89%), Adams
County Sheriff’s Office (‐86%), and El Paso Sheriff’s Office (‐84%). The University of Colorado Police
Department–Boulder experienced a 23% increase in arrests (see Appendix C, Table 2). Also, please see
the note regarding Denver in the previous paragraph.
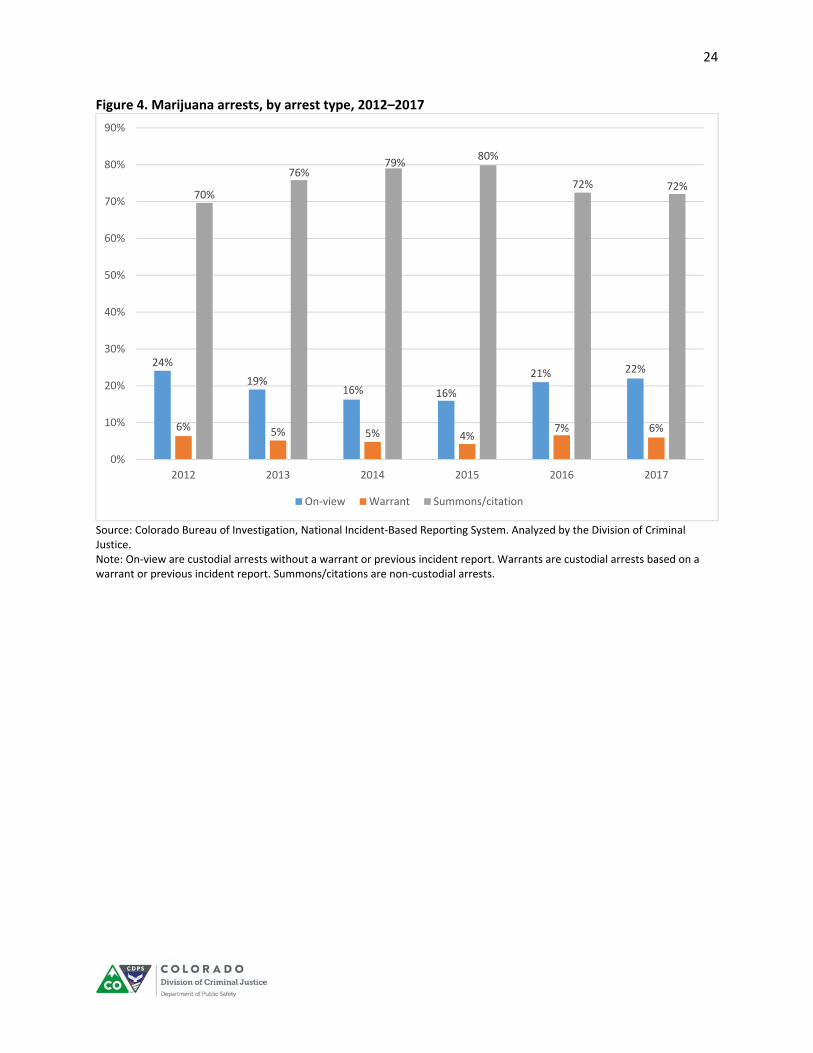
Arrest Type
There are three general arrest types reported by law enforcement in NIBRS. On‐view are custodial
arrests without a warrant or previous incident report. Warrants are custodial arrests based on a warrant
or previous incident report. Summons/citations are non‐custodial arrests where a citation is issued and
the person is instructed to appear in court at a later date. As can be seen in Figure 4, after legalization
the proportion of arrests that resulted in a summons or citation increased 10% between 2012 and 2015,
and on‐view arrests decreased by 8%. This trend reversed in 2016 and 2017 when the ratio of on‐view to
summons/citation arrests was back to pre‐legalization levels.
Table 4 presents detailed data on the different types of marijuana arrests by age, race/ethnicity, and
gender. Juveniles under 18 were more likely to receive a summons/citation (82%) than an on‐view arrest
(14%) or a warrant arrest (4%). Young adults 18‐20 years old were also more likely to receive a
summons/citation (78%) than an on‐view arrest (18%) or a warrant arrest (4%). Adults 21 years or older
were almost equally likely to get an on‐view arrest (44%) as a summons/citation (43%). Whites were less
likely to experience an on‐view arrest (18%) than Hispanics (25%) or Blacks (39%). Males were arrested
on‐view (23%) at a slightly higher rate than females (18%).
24
Figure 4. Marijuana arrests, by arrest type, 2012–2017
Source: Colorado Bureau of Investigation, National Incident‐Based Reporting System. Analyzed by the Division of Criminal Justice. Note: On‐view are custodial arrests without a warrant or previous incident report. Warrants are custodial arrests based on a warrant or previous incident report. Summons/citations are non‐custodial arrests.
24%
19%16% 16%
21% 22%
6% 5% 5% 4%7% 6%
70%
76%79%
80%
72% 72%
0%
10%
20%
30%
40%
50%
60%
70%
80%
90%
2012 2013 2014 2015 2016 2017
On‐view Warrant Summons/citation
25
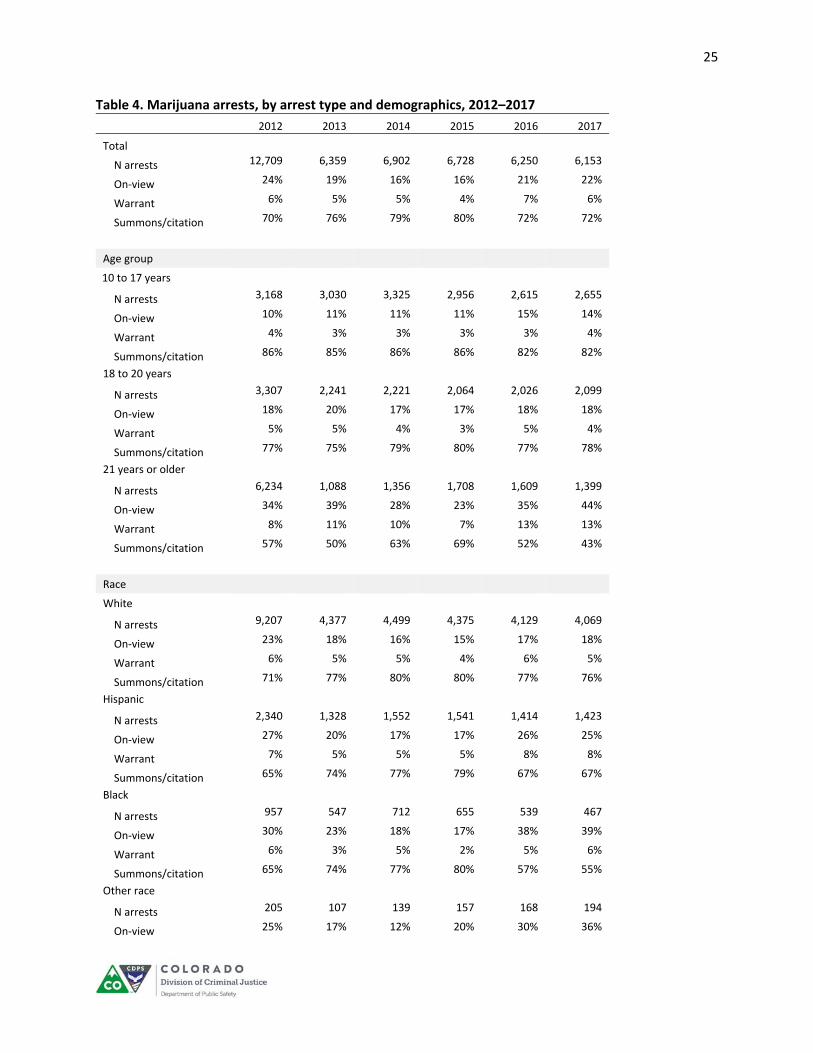
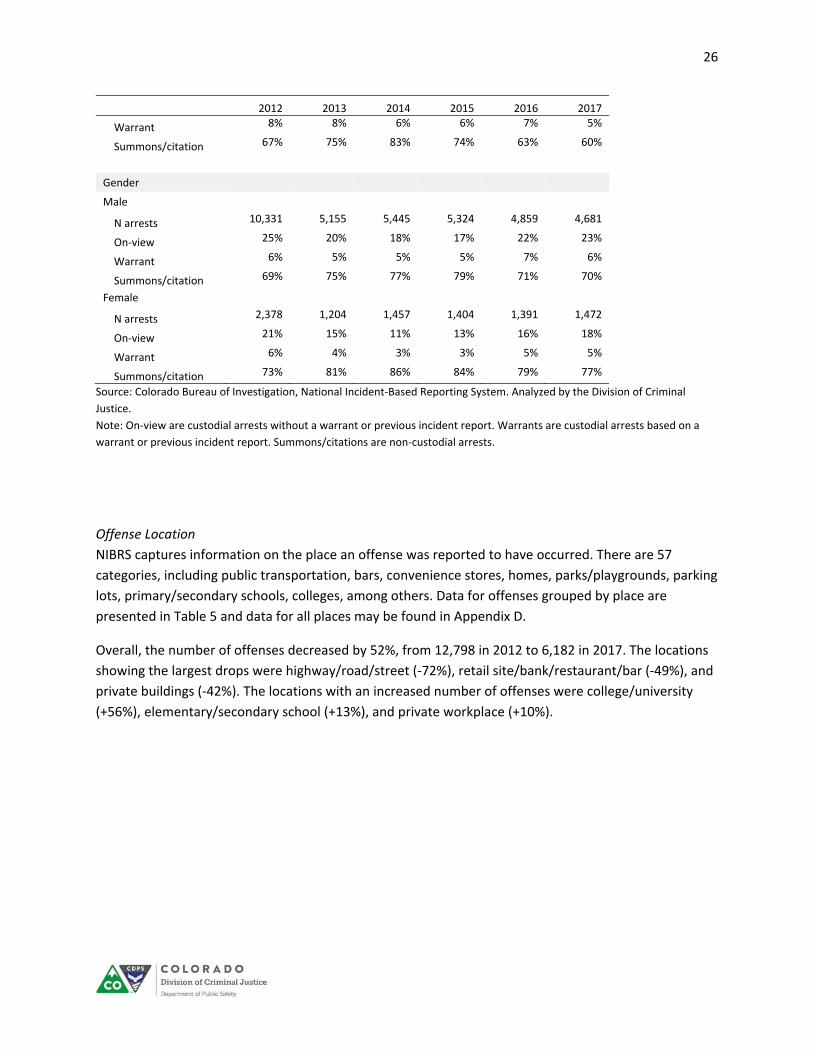
Table 4. Marijuana arrests, by arrest type and demographics, 2012–2017
2012 2013 2014 2015 2016 2017
Total
N arrests 12,709 6,359 6,902 6,728 6,250 6,153
On‐view 24% 19% 16% 16% 21% 22%
Warrant 6% 5% 5% 4% 7% 6%
Summons/citation 70% 76% 79% 80% 72% 72%
Age group
10 to 17 years
N arrests 3,168 3,030 3,325 2,956 2,615 2,655
On‐view 10% 11% 11% 11% 15% 14%
Warrant 4% 3% 3% 3% 3% 4%
Summons/citation 86% 85% 86% 86% 82% 82%
18 to 20 years
N arrests 3,307 2,241 2,221 2,064 2,026 2,099
On‐view 18% 20% 17% 17% 18% 18%
Warrant 5% 5% 4% 3% 5% 4%
Summons/citation 77% 75% 79% 80% 77% 78%
21 years or older
N arrests 6,234 1,088 1,356 1,708 1,609 1,399
On‐view 34% 39% 28% 23% 35% 44%
Warrant 8% 11% 10% 7% 13% 13%
Summons/citation 57% 50% 63% 69% 52% 43%
Race
White
N arrests 9,207 4,377 4,499 4,375 4,129 4,069
On‐view 23% 18% 16% 15% 17% 18%
Warrant 6% 5% 5% 4% 6% 5%
Summons/citation 71% 77% 80% 80% 77% 76%
Hispanic
N arrests 2,340 1,328 1,552 1,541 1,414 1,423
On‐view 27% 20% 17% 17% 26% 25%
Warrant 7% 5% 5% 5% 8% 8%
Summons/citation 65% 74% 77% 79% 67% 67%
Black
N arrests 957 547 712 655 539 467
On‐view 30% 23% 18% 17% 38% 39%
Warrant 6% 3% 5% 2% 5% 6%
Summons/citation 65% 74% 77% 80% 57% 55%
Other race
N arrests 205 107 139 157 168 194
On‐view 25% 17% 12% 20% 30% 36%
26
2012 2013 2014 2015 2016 2017
Warrant 8% 8% 6% 6% 7% 5%
Summons/citation 67% 75% 83% 74% 63% 60%
Gender
Male
N arrests 10,331 5,155 5,445 5,324 4,859 4,681
On‐view 25% 20% 18% 17% 22% 23%
Warrant 6% 5% 5% 5% 7% 6%
Summons/citation 69% 75% 77% 79% 71% 70%
Female
N arrests 2,378 1,204 1,457 1,404 1,391 1,472
On‐view 21% 15% 11% 13% 16% 18%
Warrant 6% 4% 3% 3% 5% 5%
Summons/citation 73% 81% 86% 84% 79% 77%
Source: Colorado Bureau of Investigation, National Incident‐Based Reporting System. Analyzed by the Division of Criminal
Justice.
Note: On‐view are custodial arrests without a warrant or previous incident report. Warrants are custodial arrests based on a
warrant or previous incident report. Summons/citations are non‐custodial arrests.
Offense Location
NIBRS captures information on the place an offense was reported to have occurred. There are 57
categories, including public transportation, bars, convenience stores, homes, parks/playgrounds, parking
lots, primary/secondary schools, colleges, among others. Data for offenses grouped by place are
presented in Table 5 and data for all places may be found in Appendix D.
Overall, the number of offenses decreased by 52%, from 12,798 in 2012 to 6,182 in 2017. The locations
showing the largest drops were highway/road/street (‐72%), retail site/bank/restaurant/bar (‐49%), and
private buildings (‐42%). The locations with an increased number of offenses were college/university
(+56%), elementary/secondary school (+13%), and private workplace (+10%).
27
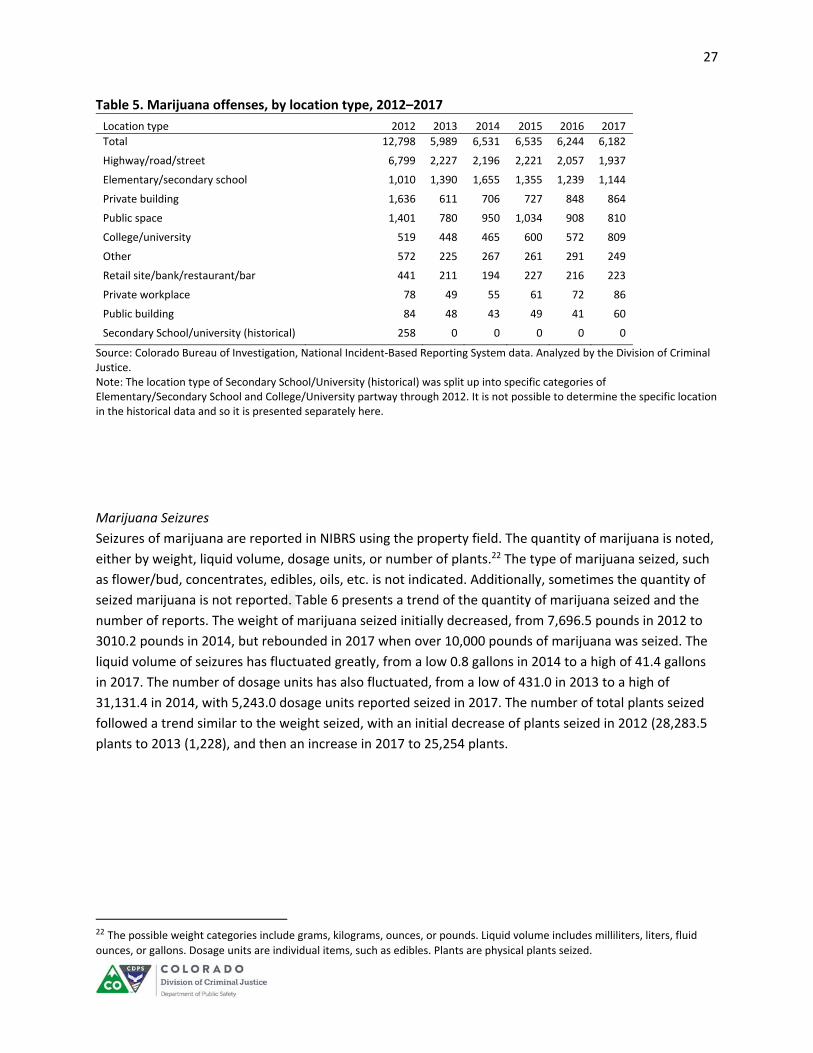
Table 5. Marijuana offenses, by location type, 2012–2017
Location type 2012 2013 2014 2015 2016 2017
Total 12,798 5,989 6,531 6,535 6,244 6,182
Highway/road/street 6,799 2,227 2,196 2,221 2,057 1,937
Elementary/secondary school 1,010 1,390 1,655 1,355 1,239 1,144
Private building 1,636 611 706 727 848 864
Public space 1,401 780 950 1,034 908 810
College/university 519 448 465 600 572 809
Other 572 225 267 261 291 249
Retail site/bank/restaurant/bar 441 211 194 227 216 223
Private workplace 78 49 55 61 72 86
Public building 84 48 43 49 41 60
Secondary School/university (historical) 258 0 0 0 0 0
Source: Colorado Bureau of Investigation, National Incident‐Based Reporting System data. Analyzed by the Division of Criminal Justice. Note: The location type of Secondary School/University (historical) was split up into specific categories of Elementary/Secondary School and College/University partway through 2012. It is not possible to determine the specific location in the historical data and so it is presented separately here.
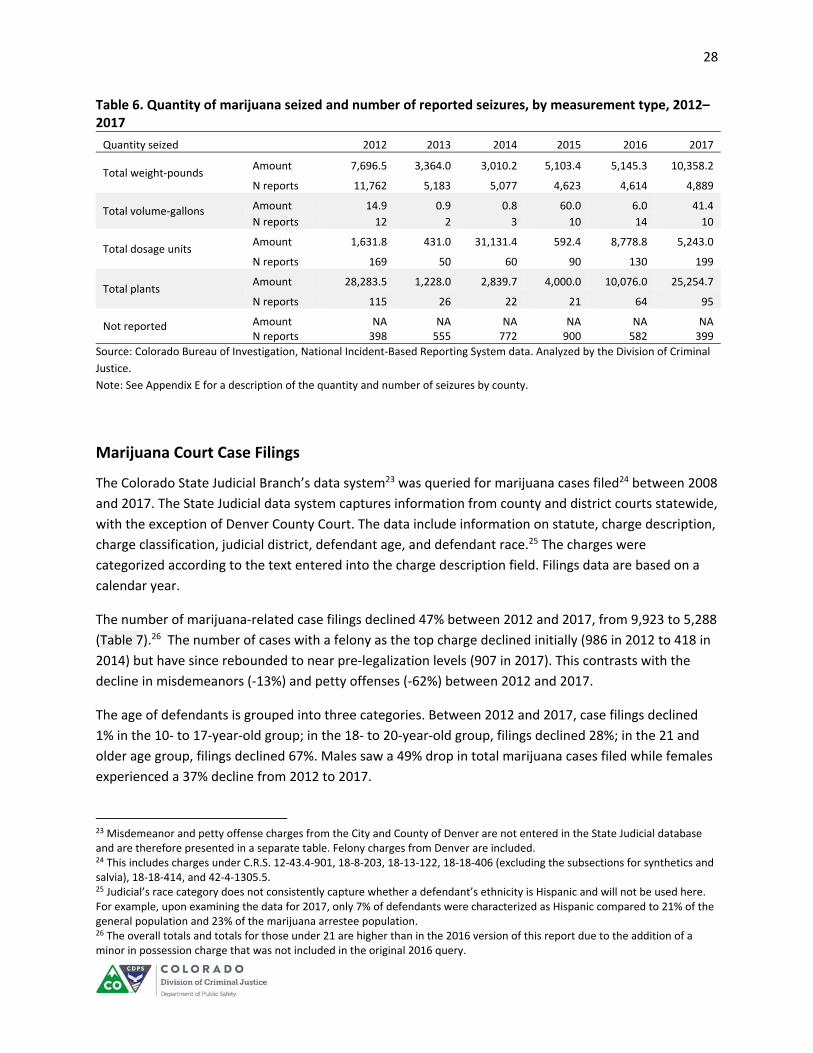
Marijuana Seizures
Seizures of marijuana are reported in NIBRS using the property field. The quantity of marijuana is noted,
either by weight, liquid volume, dosage units, or number of plants.22 The type of marijuana seized, such
as flower/bud, concentrates, edibles, oils, etc. is not indicated. Additionally, sometimes the quantity of
seized marijuana is not reported. Table 6 presents a trend of the quantity of marijuana seized and the
number of reports. The weight of marijuana seized initially decreased, from 7,696.5 pounds in 2012 to
3010.2 pounds in 2014, but rebounded in 2017 when over 10,000 pounds of marijuana was seized. The
liquid volume of seizures has fluctuated greatly, from a low 0.8 gallons in 2014 to a high of 41.4 gallons
in 2017. The number of dosage units has also fluctuated, from a low of 431.0 in 2013 to a high of
31,131.4 in 2014, with 5,243.0 dosage units reported seized in 2017. The number of total plants seized
followed a trend similar to the weight seized, with an initial decrease of plants seized in 2012 (28,283.5
plants to 2013 (1,228), and then an increase in 2017 to 25,254 plants.
22 The possible weight categories include grams, kilograms, ounces, or pounds. Liquid volume includes milliliters, liters, fluid
ounces, or gallons. Dosage units are individual items, such as edibles. Plants are physical plants seized.
28
Table 6. Quantity of marijuana seized and number of reported seizures, by measurement type, 2012–2017
Quantity seized 2012 2013 2014 2015 2016 2017
Total weight‐pounds Amount 7,696.5 3,364.0 3,010.2 5,103.4 5,145.3 10,358.2
N reports 11,762 5,183 5,077 4,623 4,614 4,889
Total volume‐gallons Amount 14.9 0.9 0.8 60.0 6.0 41.4
N reports 12 2 3 10 14 10
Total dosage units Amount 1,631.8 431.0 31,131.4 592.4 8,778.8 5,243.0
N reports 169 50 60 90 130 199
Total plants Amount 28,283.5 1,228.0 2,839.7 4,000.0 10,076.0 25,254.7
N reports 115 26 22 21 64 95
Not reported Amount NA NA NA NA NA NA N reports 398 555 772 900 582 399
Source: Colorado Bureau of Investigation, National Incident‐Based Reporting System data. Analyzed by the Division of Criminal
Justice.
Note: See Appendix E for a description of the quantity and number of seizures by county.
Marijuana Court Case Filings
The Colorado State Judicial Branch’s data system23 was queried for marijuana cases filed24 between 2008
and 2017. The State Judicial data system captures information from county and district courts statewide,
with the exception of Denver County Court. The data include information on statute, charge description,
charge classification, judicial district, defendant age, and defendant race.25 The charges were
categorized according to the text entered into the charge description field. Filings data are based on a
calendar year.
The number of marijuana‐related case filings declined 47% between 2012 and 2017, from 9,923 to 5,288
(Table 7).26 The number of cases with a felony as the top charge declined initially (986 in 2012 to 418 in
2014) but have since rebounded to near pre‐legalization levels (907 in 2017). This contrasts with the
decline in misdemeanors (‐13%) and petty offenses (‐62%) between 2012 and 2017.
The age of defendants is grouped into three categories. Between 2012 and 2017, case filings declined
1% in the 10‐ to 17‐year‐old group; in the 18‐ to 20‐year‐old group, filings declined 28%; in the 21 and
older age group, filings declined 67%. Males saw a 49% drop in total marijuana cases filed while females
experienced a 37% decline from 2012 to 2017.
23 Misdemeanor and petty offense charges from the City and County of Denver are not entered in the State Judicial database and are therefore presented in a separate table. Felony charges from Denver are included. 24 This includes charges under C.R.S. 12‐43.4‐901, 18‐8‐203, 18‐13‐122, 18‐18‐406 (excluding the subsections for synthetics and salvia), 18‐18‐414, and 42‐4‐1305.5. 25 Judicial’s race category does not consistently capture whether a defendant’s ethnicity is Hispanic and will not be used here. For example, upon examining the data for 2017, only 7% of defendants were characterized as Hispanic compared to 21% of the general population and 23% of the marijuana arrestee population. 26 The overall totals and totals for those under 21 are higher than in the 2016 version of this report due to the addition of a minor in possession charge that was not included in the original 2016 query.

29
The charge of marijuana possession underwent a change in 2014 with the addition of the specific charge
of possession of marijuana under the age of 21. Consequently, examining the trend in possession filings
requires adding both of these charges together prior 2015 since that was the first full year the new
charge was consistently used.
Between 2012 and 2017, possession offenses dropped 54% (9,475 to 4,339), possession with intent to
distribute increased 61% (464 to 745), distribution dropped 9% (438 to 398), manufacture increased
42% (467 to 661), and conspiracy increased 45% (168 to 243). There was a 20% increase between 2015
and 2017 (2,927 to 3,502).
Table 7. Marijuana cases filed and charges, by classification, category, and age group, 2008–2017
2008 2009 2010 2011 2012 2013 2014 2015 2016 2017
Total cases filed 11,753 10,902 10,108 9,791 9,923 4,041 4,619 4,934 4,913 5,288 Total charges filed* 18,183 14,222 11,518 11,123 11,238 4,845 5,515 6,544 6,891 7,477 Average number of charges per case 1.5 1.3 1.1 1.1 1.1 1.2 1.2 1.3 1.4 1.4
Age group 10‐17 years old 1,754 1,616 1,640 1,544 1,624 1,492 1,532 1,766 1,496 1,607
18‐20 years old 3,093 2,785 2,451 2,456 2,381 1,491 1,579 1,610 1,621 1,710
21 years or older 6,880 6,484 6,002 5,777 5,901 1,049 1,502 1,548 1,786 1,949
Gender
Male 9,748 9,085 8,348 8,048 8,114 3,315 3,724 3,888 3,933 4,125
Female 1,965 1,792 1,726 1,719 1,787 706 859 1,013 960 1,129
Unknown 40 25 34 24 22 20 36 33 20 34
Highest marijuana charge classification
Felony 1,431 1,412 1,347 1,017 986 627 418 581 789 907
Misdemeanor 778 694 637 628 594 406 531 428 427 472
Petty offense 9,543 8,790 8,122 8,143 8,340 2,932 2,831 3,229 3,006 3,196
Traffic 0 0 0 0 0 76 837 694 690 713
Unknown 1 3 1 1 3 0 2 2 1 0
Charge type* Conspiracy 96 142 178 208 168 126 71 112 179 243
Distribution 440 440 455 428 438 401 305 323 351 398
Manufacture 320 331 464 460 467 169 141 329 564 661
Other 5,745 1,917 23 5 10 5 1 2 3 4
Possession 10,651 10,417 9,580 9,279 9,475 3,477 2,659 1,295 883 837
Possession under age of 21 3 731 2,927 3,306 3,502
Possession with intent to distribute 823 823 643 547 464 328 284 470 609 745
Possession‐consumption in vehicle 1 10 95 1,012 874 830 856
Public consumption 108 152 175 195 206 241 311 212 166 231
Source: Data provided by the Colorado State Judicial Branch, analyzed by the Division of Criminal Justice. Note: This analysis does not include data from the City and County of Denver. * The charge category presents all charges, not just the top charge on the cases filed. The numbers in the charge type section of this table will sum to the value in the Total charges filed row.
30
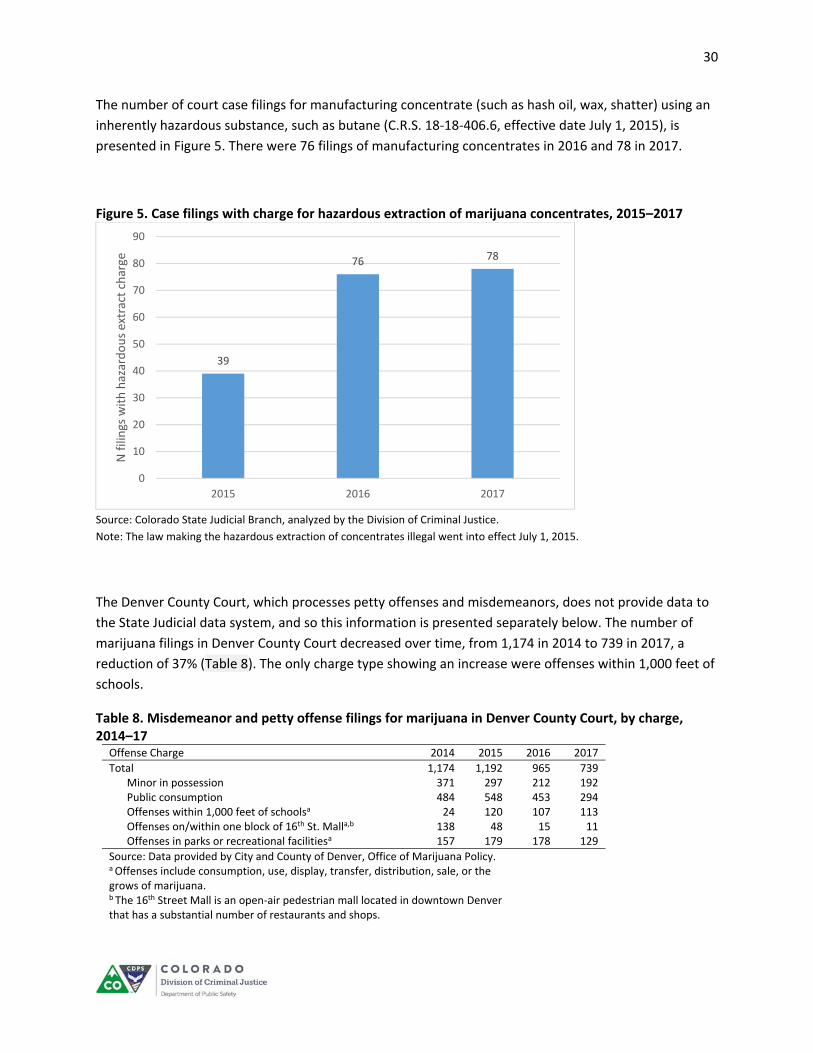
The number of court case filings for manufacturing concentrate (such as hash oil, wax, shatter) using an
inherently hazardous substance, such as butane (C.R.S. 18‐18‐406.6, effective date July 1, 2015), is
presented in Figure 5. There were 76 filings of manufacturing concentrates in 2016 and 78 in 2017.
Figure 5. Case filings with charge for hazardous extraction of marijuana concentrates, 2015–2017
Source: Colorado State Judicial Branch, analyzed by the Division of Criminal Justice.
Note: The law making the hazardous extraction of concentrates illegal went into effect July 1, 2015.
The Denver County Court, which processes petty offenses and misdemeanors, does not provide data to
the State Judicial data system, and so this information is presented separately below. The number of
marijuana filings in Denver County Court decreased over time, from 1,174 in 2014 to 739 in 2017, a
reduction of 37% (Table 8). The only charge type showing an increase were offenses within 1,000 feet of
schools.
Table 8. Misdemeanor and petty offense filings for marijuana in Denver County Court, by charge, 2014–17
Offense Charge 2014 2015 2016 2017
Total 1,174 1,192 965 739 Minor in possession 371 297 212 192 Public consumption 484 548 453 294 Offenses within 1,000 feet of schoolsa 24 120 107 113 Offenses on/within one block of 16th St. Malla,b 138 48 15 11 Offenses in parks or recreational facilitiesa 157 179 178 129
Source: Data provided by City and County of Denver, Office of Marijuana Policy. a Offenses include consumption, use, display, transfer, distribution, sale, or the grows of marijuana. b The 16th Street Mall is an open‐air pedestrian mall located in downtown Denver that has a substantial number of restaurants and shops.
39
76 78
0
10
20
30
40
50
60
70
80
90
2015 2016 2017
N filings with hazardous extract charge
31
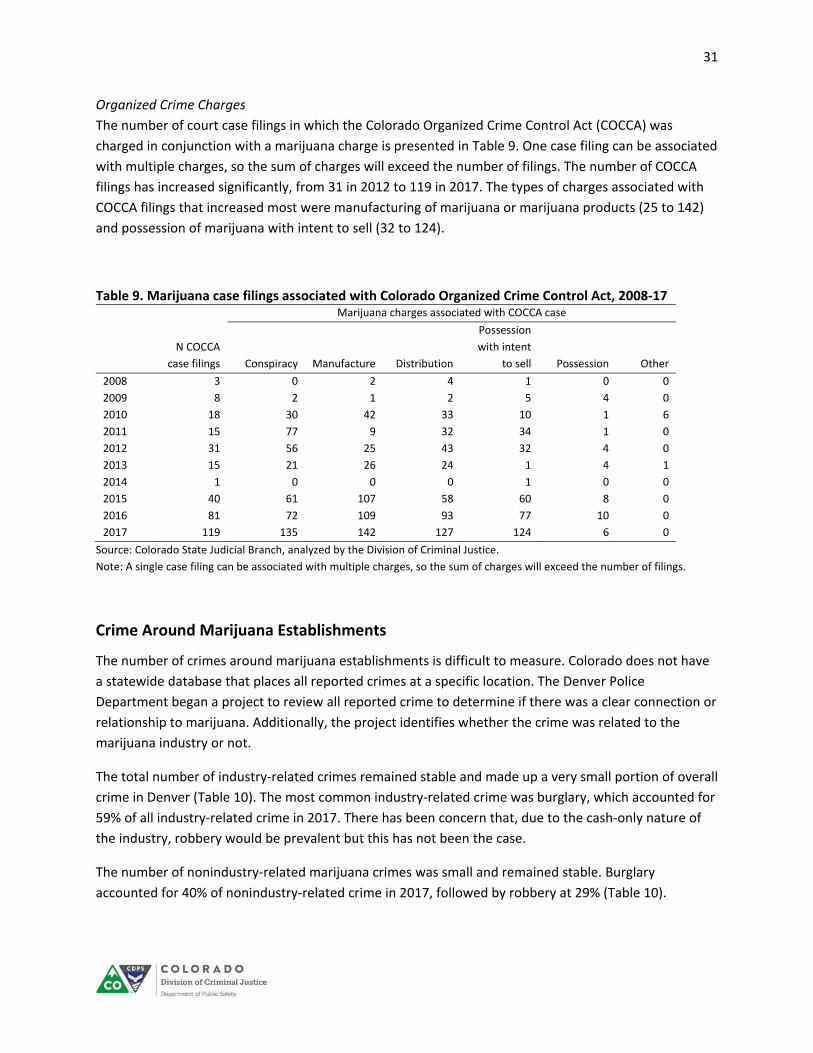
Organized Crime Charges
The number of court case filings in which the Colorado Organized Crime Control Act (COCCA) was
charged in conjunction with a marijuana charge is presented in Table 9. One case filing can be associated
with multiple charges, so the sum of charges will exceed the number of filings. The number of COCCA
filings has increased significantly, from 31 in 2012 to 119 in 2017. The types of charges associated with
COCCA filings that increased most were manufacturing of marijuana or marijuana products (25 to 142)
and possession of marijuana with intent to sell (32 to 124).
Table 9. Marijuana case filings associated with Colorado Organized Crime Control Act, 2008‐17 Marijuana charges associated with COCCA case
N COCCA
case filings Conspiracy Manufacture Distribution
Possession
with intent
to sell Possession Other
2008 3 0 2 4 1 0 0
2009 8 2 1 2 5 4 0
2010 18 30 42 33 10 1 6
2011 15 77 9 32 34 1 0
2012 31 56 25 43 32 4 0
2013 15 21 26 24 1 4 1
2014 1 0 0 0 1 0 0
2015 40 61 107 58 60 8 0
2016 81 72 109 93 77 10 0
2017 119 135 142 127 124 6 0
Source: Colorado State Judicial Branch, analyzed by the Division of Criminal Justice.
Note: A single case filing can be associated with multiple charges, so the sum of charges will exceed the number of filings.
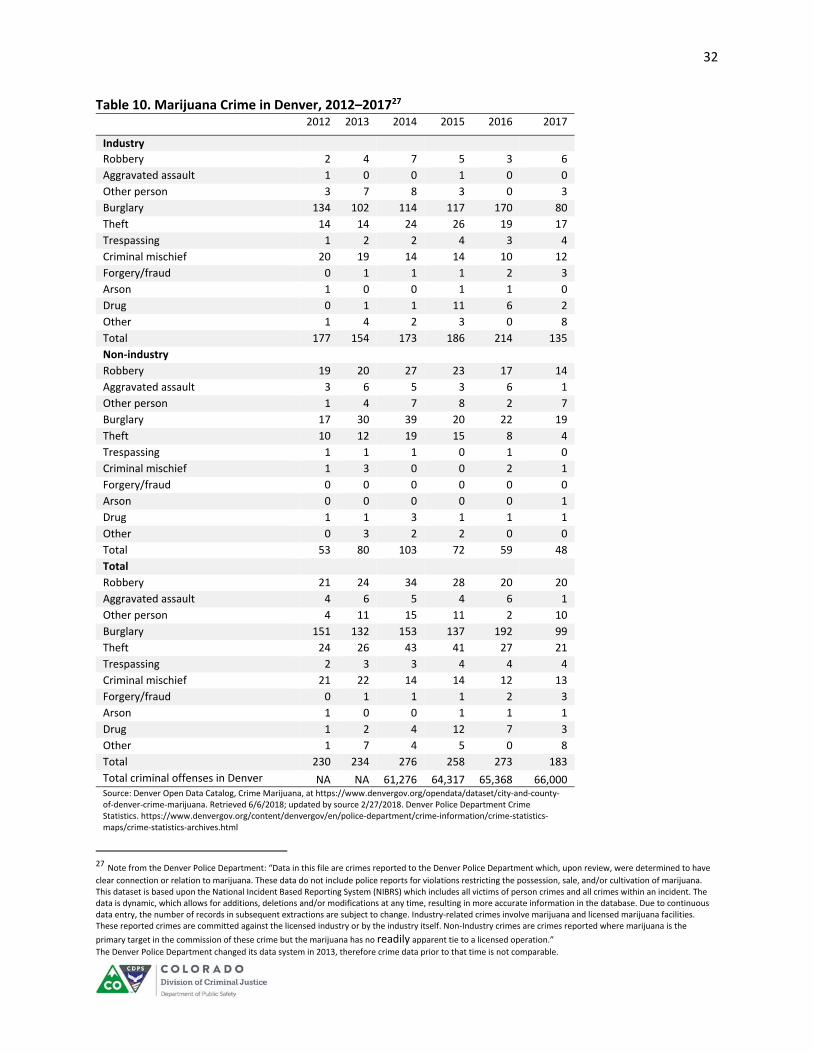
Crime Around Marijuana Establishments
The number of crimes around marijuana establishments is difficult to measure. Colorado does not have
a statewide database that places all reported crimes at a specific location. The Denver Police
Department began a project to review all reported crime to determine if there was a clear connection or
relationship to marijuana. Additionally, the project identifies whether the crime was related to the
marijuana industry or not.
The total number of industry‐related crimes remained stable and made up a very small portion of overall
crime in Denver (Table 10). The most common industry‐related crime was burglary, which accounted for
59% of all industry‐related crime in 2017. There has been concern that, due to the cash‐only nature of
the industry, robbery would be prevalent but this has not been the case.
The number of nonindustry‐related marijuana crimes was small and remained stable. Burglary
accounted for 40% of nonindustry‐related crime in 2017, followed by robbery at 29% (Table 10).
32
Table 10. Marijuana Crime in Denver, 2012–201727 2012 2013 2014 2015 2016 2017
Industry
Robbery 2 4 7 5 3 6
Aggravated assault 1 0 0 1 0 0
Other person 3 7 8 3 0 3
Burglary 134 102 114 117 170 80
Theft 14 14 24 26 19 17
Trespassing 1 2 2 4 3 4
Criminal mischief 20 19 14 14 10 12
Forgery/fraud 0 1 1 1 2 3
Arson 1 0 0 1 1 0
Drug 0 1 1 11 6 2
Other 1 4 2 3 0 8
Total 177 154 173 186 214 135
Non‐industry
Robbery 19 20 27 23 17 14
Aggravated assault 3 6 5 3 6 1
Other person 1 4 7 8 2 7
Burglary 17 30 39 20 22 19
Theft 10 12 19 15 8 4
Trespassing 1 1 1 0 1 0
Criminal mischief 1 3 0 0 2 1
Forgery/fraud 0 0 0 0 0 0
Arson 0 0 0 0 0 1
Drug 1 1 3 1 1 1
Other 0 3 2 2 0 0
Total 53 80 103 72 59 48
Total
Robbery 21 24 34 28 20 20
Aggravated assault 4 6 5 4 6 1
Other person 4 11 15 11 2 10
Burglary 151 132 153 137 192 99
Theft 24 26 43 41 27 21
Trespassing 2 3 3 4 4 4
Criminal mischief 21 22 14 14 12 13
Forgery/fraud 0 1 1 1 2 3
Arson 1 0 0 1 1 1
Drug 1 2 4 12 7 3
Other 1 7 4 5 0 8
Total 230 234 276 258 273 183
Total criminal offenses in Denver NA NA 61,276 64,317 65,368 66,000 Source: Denver Open Data Catalog, Crime Marijuana, at https://www.denvergov.org/opendata/dataset/city‐and‐county‐of‐denver‐crime‐marijuana. Retrieved 6/6/2018; updated by source 2/27/2018. Denver Police Department Crime Statistics. https://www.denvergov.org/content/denvergov/en/police‐department/crime‐information/crime‐statistics‐maps/crime‐statistics‐archives.html
27 Note from the Denver Police Department: “Data in this file are crimes reported to the Denver Police Department which, upon review, were determined to have
clear connection or relation to marijuana. These data do not include police reports for violations restricting the possession, sale, and/or cultivation of marijuana. This dataset is based upon the National Incident Based Reporting System (NIBRS) which includes all victims of person crimes and all crimes within an incident. The data is dynamic, which allows for additions, deletions and/or modifications at any time, resulting in more accurate information in the database. Due to continuous data entry, the number of records in subsequent extractions are subject to change. Industry‐related crimes involve marijuana and licensed marijuana facilities. These reported crimes are committed against the licensed industry or by the industry itself. Non‐Industry crimes are crimes reported where marijuana is the
primary target in the commission of these crime but the marijuana has no readily apparent tie to a licensed operation.” The Denver Police Department changed its data system in 2013, therefore crime data prior to that time is not comparable.
33
Traffic Safety
Driving Under the Influence28
Detection Issues
It is difficult to gauge the scope of DUID for a number of reasons. First, there is no criminal charge that
specifies that the driver is impaired by drugs instead of, or in combination with, alcohol. The current
statute applies to driving under the influence of alcohol, drugs, or a combination of the two.29 Second,
there is no central repository of toxicology results that would allow for an analysis of trends. Third, at a
traffic stop, law enforcement may choose not to pursue additional toxicology testing if the driver is
exhibiting indicia of impairment from alcohol. The additional time and cost required for further
toxicology testing may not be considered worthwhile if the burden of proof for impairment is already
being met by a BAC (blood alcohol content) level.
Colorado established a limit of 5 ng/mL of Delta 9‐THC in whole blood that creates a permissible
inference that a “defendant was under the influence of one or more drugs.”30 After an arrest, if the
officer has probable cause to believe the suspect is impaired by drugs and/or alcohol,31 the officer may
transfer the suspect to a location where blood can be drawn for further toxicology screening. The Delta‐
9 THC level in blood decreases rapidly in the first hour after use, then gradually thereafter, making
prompt testing critical.32
Importantly, the findings below should be considered in light of the fact that the number of peace
officers who have been trained to identify driving impairment from drugs other than alcohol has
increased substantially in recent years. In 2012 there were 129 peace officers statewide trained as Drug
Recognition Experts (DREs) and by June of 2018 there were 214. Additionally, hundreds of additional
peace officers have also received training in Advanced Roadside Impaired Driving Enforcement (ARIDE).
Figure 6 depicts results from a study that examined Delta‐9 THC concentration, subjective high, and
performance of subjects.33 It shows that THC concentration peaks early, but the impairing effects on
driving‐related performance tasks and subjective high continue long after the peak concentration. This
suggests that at there are performance deficits that follow the peak of THC concentration. Furthermore,
high THC concentration in whole‐blood does not perfectly correspond to impairment.
28 In 2017 the Colorado General Assembly enacted House Bill 1315, mandating the Division of Criminal Justice (DCJ) in the
Colorado Department of Public Safety collect and analyze specific data regarding driving under the influence of drugs and alcohol. It includes a requirement to report on the number of convictions with evidentiary test results indicating impairment by alcohol, marijuana, Schedule I drugs (C.R.S., 18‐18‐203), other drugs, or any combination of these. This report is available at http://cdpsdocs.state.co.us/ors/docs/reports/2018‐DUI_HB17‐1315.pdf. Much of the information presented in this section is excerpted from this report. 29 C.R.S. 42‐4‐1301. 30 C.R.S. 42‐4‐1301 (6)(a)(IV). 31 An officer may also transport a suspect for blood screening when alcohol is the only substance suspected. There are evidentiary breath alcohol testers available to law enforcement that are easy to administer and that are available in jails and some police stations. 32 Atha, M. (2000). Blood and urine drug testing for cannabinoids, available at http://www.idmu.co.uk/pdfs/drugtest.pdf. 33 Berghaus et al. 1998, Sticht and Käferstein 1998, and Robbe 1994 as cited in Compton, R. (2017, July). Marijuana‐Impaired Driving ‐ A Report to Congress. (DOT HS 812 440). Washington, DC: National Highway Traffic Safety Administration.
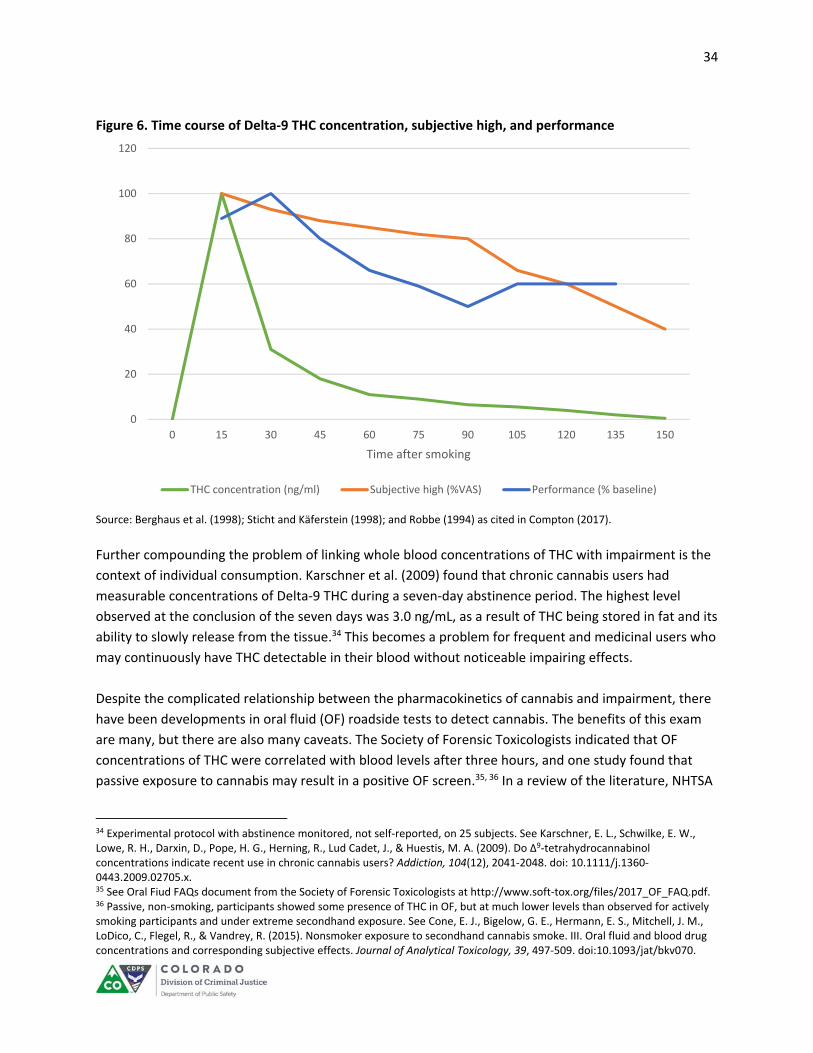
34
Figure 6. Time course of Delta‐9 THC concentration, subjective high, and performance
Source: Berghaus et al. (1998); Sticht and Käferstein (1998); and Robbe (1994) as cited in Compton (2017).
Further compounding the problem of linking whole blood concentrations of THC with impairment is the
context of individual consumption. Karschner et al. (2009) found that chronic cannabis users had
measurable concentrations of Delta‐9 THC during a seven‐day abstinence period. The highest level
observed at the conclusion of the seven days was 3.0 ng/mL, as a result of THC being stored in fat and its
ability to slowly release from the tissue.34 This becomes a problem for frequent and medicinal users who
may continuously have THC detectable in their blood without noticeable impairing effects.
Despite the complicated relationship between the pharmacokinetics of cannabis and impairment, there
have been developments in oral fluid (OF) roadside tests to detect cannabis. The benefits of this exam
are many, but there are also many caveats. The Society of Forensic Toxicologists indicated that OF
concentrations of THC were correlated with blood levels after three hours, and one study found that
passive exposure to cannabis may result in a positive OF screen.35, 36 In a review of the literature, NHTSA
34 Experimental protocol with abstinence monitored, not self‐reported, on 25 subjects. See Karschner, E. L., Schwilke, E. W., Lowe, R. H., Darxin, D., Pope, H. G., Herning, R., Lud Cadet, J., & Huestis, M. A. (2009). Do ∆9‐tetrahydrocannabinol concentrations indicate recent use in chronic cannabis users? Addiction, 104(12), 2041‐2048. doi: 10.1111/j.1360‐0443.2009.02705.x. 35 See Oral Fiud FAQs document from the Society of Forensic Toxicologists at http://www.soft‐tox.org/files/2017_OF_FAQ.pdf. 36 Passive, non‐smoking, participants showed some presence of THC in OF, but at much lower levels than observed for actively smoking participants and under extreme secondhand exposure. See Cone, E. J., Bigelow, G. E., Hermann, E. S., Mitchell, J. M., LoDico, C., Flegel, R., & Vandrey, R. (2015). Nonsmoker exposure to secondhand cannabis smoke. III. Oral fluid and blood drug concentrations and corresponding subjective effects. Journal of Analytical Toxicology, 39, 497‐509. doi:10.1093/jat/bkv070.
0
20
40
60
80
100
120
0 15 30 45 60 75 90 105 120 135 150
Time after smoking
THC concentration (ng/ml) Subjective high (%VAS) Performance (% baseline)

35
indicated that these screening devices “have not been shown to be completely reliable and accurate” in
its 2017 Marijuana‐Impaired Driving report.37 THC concentrations in OF fluid are known to have large
variability among occasional and heavy users. Furthermore, the peak of THC concentration varies
depending on the method of consumption, with higher concentrations and an initial spike in
concentration when smoked as opposed to when ingested.
Marijuana and Driving
The information in this section was excerpted from the study of impaired driving published pursuant to
HB 17‐1315, which analyzed data for 2016.38 In 2016, cannabis screens were conducted for 3,946 of the
27,244 case filings (approximately 14.5%). Of these, about a quarter (26.9%, n=1,061) of test results
indicated that no cannabinoids were detected.39 However, the 26.9% figure may be an underestimate
because there is not always a record that indicates a cannabinoid screen was performed, even if
marijuana metabolites were found. For example, in cases when the 9‐panel drug screen does not return
any positive results, it is not possible to confirm that a drug toxicology screen existed. Efforts are
underway to obtain additional data to avoid this issue in future analyses.
Among those cases with a positive cannabinoid screen, 73.1% (n=2,885) were further confirmed for
cannabis metabolites,40 establishing the presence of Delta‐9 THC, the primary psychoactive ingredient in
marijuana (Table 11). The presence of Delta‐9 THC typically indicates recent use of cannabis.
Quantitative values of Delta‐9 THC ranged from 1.0 ng/mL to 73.0 ng/mL, with a median of 5.9 and a
mean of 8.7 ng/mL.
Table 11 shows that, for those 2,885 cases that had a positive cannabinoid screen and a follow‐up
confirmation for cannabis metabolites, 13.7% of cannabis metabolite confirmations did not detect
Delta‐9 THC and 47.5% detected Delta‐9 THC at 5.0 ng/mL or above.
37 Compton, R. (2017, July). Marijuana‐Impaired Driving ‐ A Report to Congress. (DOT HS 812 440). Washington, DC: National Highway Traffic Safety Administration. See https://www.nhtsa.gov/sites/nhtsa.dot.gov/files/documents/812440‐marijuana‐impaired‐driving‐report‐to‐congress.pdf. 38 Bui, B. & Reed, J. (2018). Driving under the influence of drugs and alcohol: A report pursuant to House Bill 17‐1315. Lakewood, CO: Colorado Division of Criminal Justice. Available at http://cdpsdocs.state.co.us/ors/docs/reports/2018‐DUI_HB17‐1315.pdf 39 This is an enzyme‐linked immunosorbent assay (ELISA) screen that primarily targets THC‐COOH. 40 The confirmation test is done via liquid chromatography tandem mass spectrometry.
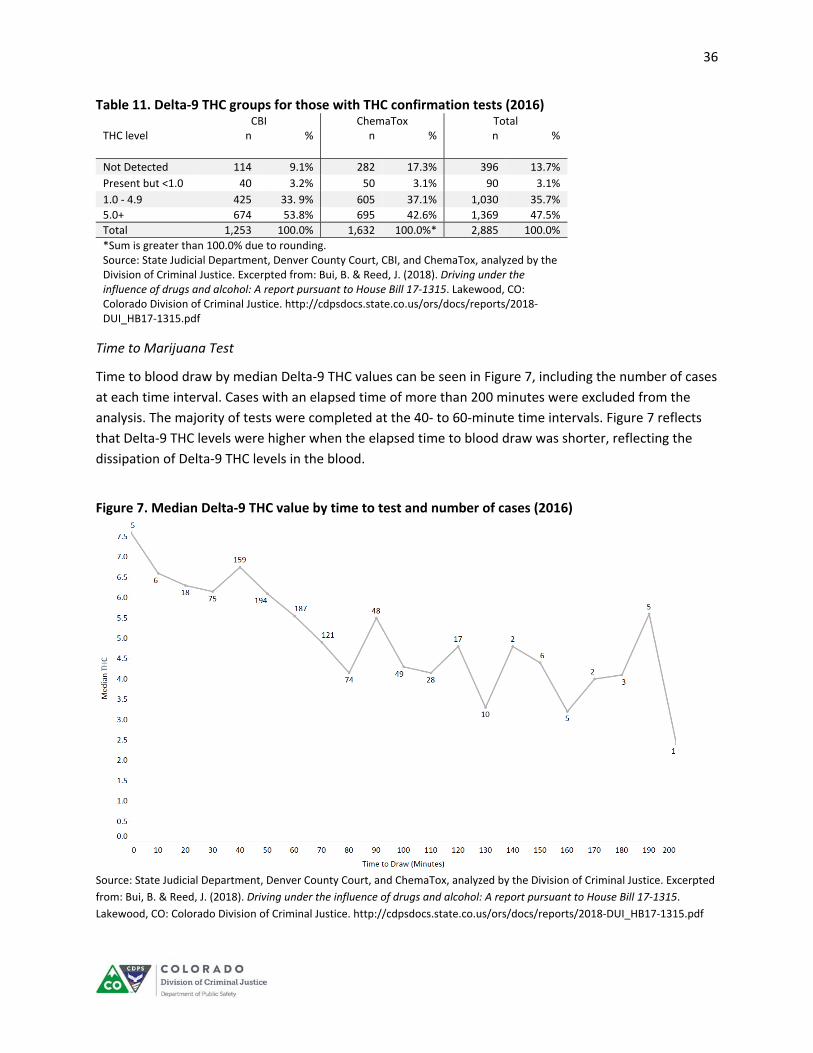
36
Table 11. Delta‐9 THC groups for those with THC confirmation tests (2016) CBI ChemaTox Total THC level n % n % n %
Not Detected 114 9.1% 282 17.3% 396 13.7%
Present but <1.0 40 3.2% 50 3.1% 90 3.1%
1.0 ‐ 4.9 425 33. 9% 605 37.1% 1,030 35.7%
5.0+ 674 53.8% 695 42.6% 1,369 47.5%
Total 1,253 100.0% 1,632 100.0%* 2,885 100.0%
*Sum is greater than 100.0% due to rounding. Source: State Judicial Department, Denver County Court, CBI, and ChemaTox, analyzed by the Division of Criminal Justice. Excerpted from: Bui, B. & Reed, J. (2018). Driving under the influence of drugs and alcohol: A report pursuant to House Bill 17‐1315. Lakewood, CO: Colorado Division of Criminal Justice. http://cdpsdocs.state.co.us/ors/docs/reports/2018‐DUI_HB17‐1315.pdf
Time to Marijuana Test
Time to blood draw by median Delta‐9 THC values can be seen in Figure 7, including the number of cases
at each time interval. Cases with an elapsed time of more than 200 minutes were excluded from the
analysis. The majority of tests were completed at the 40‐ to 60‐minute time intervals. Figure 7 reflects
that Delta‐9 THC levels were higher when the elapsed time to blood draw was shorter, reflecting the
dissipation of Delta‐9 THC levels in the blood.
Figure 7. Median Delta‐9 THC value by time to test and number of cases (2016)
Source: State Judicial Department, Denver County Court, and ChemaTox, analyzed by the Division of Criminal Justice. Excerpted
from: Bui, B. & Reed, J. (2018). Driving under the influence of drugs and alcohol: A report pursuant to House Bill 17‐1315.
Lakewood, CO: Colorado Division of Criminal Justice. http://cdpsdocs.state.co.us/ors/docs/reports/2018‐DUI_HB17‐1315.pdf

37
Figure 8 depicts the mean and median elapsed time for cases with a positive cannabinoid screen along
with offense time, draw time, and positive values of Delta‐9 THC. The median and mean of the elapsed
time for each Delta‐9 THC bin decreases as the THC values increase. This aligns with evidence in the
research literature that suggests Delta‐9 THC peaks early and then quickly dissipates, as also reflected in
Figure 6. The same pattern is shown in Figure 9.
Figure 8. Mean and median Delta‐9 THC value by time‐to‐test (2016)
Source: State Judicial Department, Denver County Court, and ChemaTox, analyzed by the Division of Criminal Justice. Excerpted
from: Bui, B. & Reed, J. (2018). Driving under the influence of drugs and alcohol: A report pursuant to House Bill 17‐1315.
Lakewood, CO: Colorado Division of Criminal Justice. http://cdpsdocs.state.co.us/ors/docs/reports/2018‐DUI_HB17‐1315.pdf
Figure 9. Boxplot of Delta‐9 THC distribution and time‐to‐test categories (2016)
Source: State Judicial Department, Denver County Court, and ChemaTox, analyzed by the Division of Criminal Justice. Excerpted
from: Bui, B. & Reed, J. (2018). Driving under the influence of drugs and alcohol: A report pursuant to House Bill 17‐1315.
Lakewood, CO: Colorado Division of Criminal Justice. http://cdpsdocs.state.co.us/ors/docs/reports/2018‐DUI_HB17‐1315.pdf
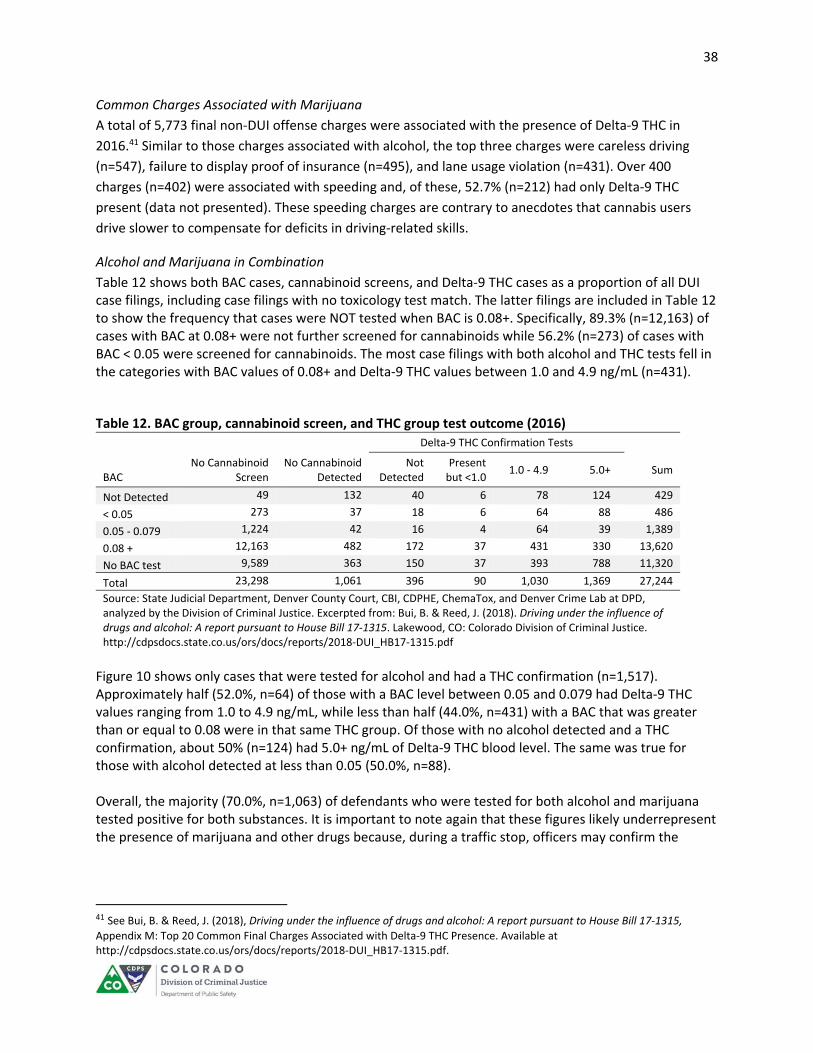
38
Common Charges Associated with Marijuana
A total of 5,773 final non‐DUI offense charges were associated with the presence of Delta‐9 THC in
2016.41 Similar to those charges associated with alcohol, the top three charges were careless driving
(n=547), failure to display proof of insurance (n=495), and lane usage violation (n=431). Over 400
charges (n=402) were associated with speeding and, of these, 52.7% (n=212) had only Delta‐9 THC
present (data not presented). These speeding charges are contrary to anecdotes that cannabis users
drive slower to compensate for deficits in driving‐related skills.
Alcohol and Marijuana in Combination
Table 12 shows both BAC cases, cannabinoid screens, and Delta‐9 THC cases as a proportion of all DUI case filings, including case filings with no toxicology test match. The latter filings are included in Table 12 to show the frequency that cases were NOT tested when BAC is 0.08+. Specifically, 89.3% (n=12,163) of cases with BAC at 0.08+ were not further screened for cannabinoids while 56.2% (n=273) of cases with BAC < 0.05 were screened for cannabinoids. The most case filings with both alcohol and THC tests fell in the categories with BAC values of 0.08+ and Delta‐9 THC values between 1.0 and 4.9 ng/mL (n=431).
Table 12. BAC group, cannabinoid screen, and THC group test outcome (2016)
Delta‐9 THC Confirmation Tests
BAC No Cannabinoid
Screen No Cannabinoid
Detected Not
Detected Present but <1.0
1.0 ‐ 4.9 5.0+ Sum
Not Detected 49 132 40 6 78 124 429
< 0.05 273 37 18 6 64 88 486
0.05 ‐ 0.079 1,224 42 16 4 64 39 1,389
0.08 + 12,163 482 172 37 431 330 13,620
No BAC test 9,589 363 150 37 393 788 11,320
Total 23,298 1,061 396 90 1,030 1,369 27,244
Source: State Judicial Department, Denver County Court, CBI, CDPHE, ChemaTox, and Denver Crime Lab at DPD, analyzed by the Division of Criminal Justice. Excerpted from: Bui, B. & Reed, J. (2018). Driving under the influence of drugs and alcohol: A report pursuant to House Bill 17‐1315. Lakewood, CO: Colorado Division of Criminal Justice. http://cdpsdocs.state.co.us/ors/docs/reports/2018‐DUI_HB17‐1315.pdf
Figure 10 shows only cases that were tested for alcohol and had a THC confirmation (n=1,517). Approximately half (52.0%, n=64) of those with a BAC level between 0.05 and 0.079 had Delta‐9 THC values ranging from 1.0 to 4.9 ng/mL, while less than half (44.0%, n=431) with a BAC that was greater than or equal to 0.08 were in that same THC group. Of those with no alcohol detected and a THC confirmation, about 50% (n=124) had 5.0+ ng/mL of Delta‐9 THC blood level. The same was true for those with alcohol detected at less than 0.05 (50.0%, n=88). Overall, the majority (70.0%, n=1,063) of defendants who were tested for both alcohol and marijuana tested positive for both substances. It is important to note again that these figures likely underrepresent the presence of marijuana and other drugs because, during a traffic stop, officers may confirm the
41 See Bui, B. & Reed, J. (2018), Driving under the influence of drugs and alcohol: A report pursuant to House Bill 17‐1315, Appendix M: Top 20 Common Final Charges Associated with Delta‐9 THC Presence. Available at http://cdpsdocs.state.co.us/ors/docs/reports/2018‐DUI_HB17‐1315.pdf.

39
presence of alcohol above the per se limit and stop further testing at that point. Figure 10. BAC group by THC group bar graph (2016)
Source: State Judicial Department, Denver County Court, CBI, CDPHE, ChemaTox, and Denver Crime Lab at DPD, analyzed by the
Division of Criminal Justice. Excerpted from: Bui, B. & Reed, J. (2018). Driving under the influence of drugs and alcohol: A report
pursuant to House Bill 17‐1315. Lakewood, CO: Colorado Division of Criminal Justice.
http://cdpsdocs.state.co.us/ors/docs/reports/2018‐DUI_HB17‐1315.pdf
Polydrug use
In this analysis, "drugs" are presented in three categories: alcohol, THC, and "other drug," which
includes illicit drugs and prescription drugs. Of the 17,824 cases where toxicology tests were conducted
for alcohol as well as other drugs, the vast majority (86.4%, n=15,395) of suspects were found to have
one drug present, while 12.7% (n=2,264) cases had more than one drug present (see Table 13). A very
small percentage (0.9%, n=165) of toxicology results showed no drug detected ‐‐ i.e., no alcohol, THC or
other drugs. Polydrug use is the detection of any amount of two or more drugs in a toxicology test.
Again, please note that polydrug use is likely underrepresented because, when alcohol is obviously
present, many officers do not request further drug testing due to the cost and time associated with
additional testing.
Keeping in mind that this may be an underestimate, nevertheless, 12.7% (n=2,264) of cases with
toxicology findings in 2016 had more than one drug present (see Table 13). Other drugs included illicit
drugs and prescription drugs. A very small percentage (0.9%, n=165) of toxicology results showed no
drug detected, while 86.4% (n=15,395) of suspects were found to have one drug present.
16%
10%13%
18%
2% 3% 3% 4%
31%
36%
52%
44%
50% 50%
32%34%
0%
10%
20%
30%
40%
50%
60%
Alcohol NotDetected
< 0.05 0.05 ‐ 0.079 0.08 +
THC Not Detected
Present but <1.0
1.0 ‐ 4.9
5.0+

40
Alcohol was the primary substance detected for those with one drug present, followed by marijuana
and, finally, other drugs. Of those cases with only one drug present, 91.3% of cases had alcohol only
present compared to 6.2% of cases with only marijuana present. However, note that not all alcohol tests
had a drug screen and not all drugs are included in a drug screen.
When further examining the 12.7% of cases with polydrug use, 36.6% were a combination of alcohol and
marijuana and 20.7% involved marijuana and an additional drug. Another 10.3% of polydrug cases
involved alcohol, marijuana, and at least one other drug. Almost half (46.9%) of all polydrug records had
both alcohol and Delta‐9 THC present. Additionally, 15.5% of the 2,264 polydrug cases had no alcohol or
marijuana use reported (see Table 13).
Again, these results should be interpreted cautiously because of the practice of limited drug testing
when the presence of alcohol is obvious to the arresting officer.
Table 13. Presence of any drug and polydrug use (2016) Drug Count Drug(s) Detected n % Subtotal % Total
No Drug None Detected 165 100.0% 0.9%
One Drug Alcohol Only 14,052 91.3% 78.8%
THC Only 957 6.2% 5.4%
Single Other Drug 386 2.5% 2.2%
Subtotal 15,395 100.0%
Polydrug Alcohol and THC 829 36.6% 4.7%
Alcohol and Other 380 16.8% 2.1%
THC and Other 469 20.7% 2.6%
Alcohol, THC, and Other(s) 234 10.3% 1.3%
Polydrug Not Alcohol or THC 352 15.5% 2.0%
Subtotal 2,264 100.0%
Total 17,824 100.0%
Source: State Judicial Department, Denver County Court, CBI, CDPHE, ChemaTox, and Denver
Crime Lab at DPD, analyzed by the Division of Criminal Justice. Excerpted from: Bui, B. & Reed,
J. (2018). Driving under the influence of drugs and alcohol: A report pursuant to House Bill 17‐
1315. Lakewood, CO: Colorado Division of Criminal Justice. At
http://cdpsdocs.state.co.us/ors/docs/reports/2018‐DUI_HB17‐1315.pdf
Marijuana and DUI Dispositions
Table 14 shows the dispositions of DUI charges with a Delta‐9 THC confirmation test (n=2,676). As with
the previous table, this information includes all other charges that were amended, but does not show
the specific disposition of final charges that were not DUI charges. The highest proportion of guilty
dispositions occurred for those in the ‘5.0+ ng’ (74.7%, n=947) category.
Overall, more than half of all cases in each THC category had a disposition of guilty. However, three out
of the four THC categories had dismissal rates of around 20.0% while one, the ‘5.0+ ng’ group, had a
dismissal rate of only 9.7%.
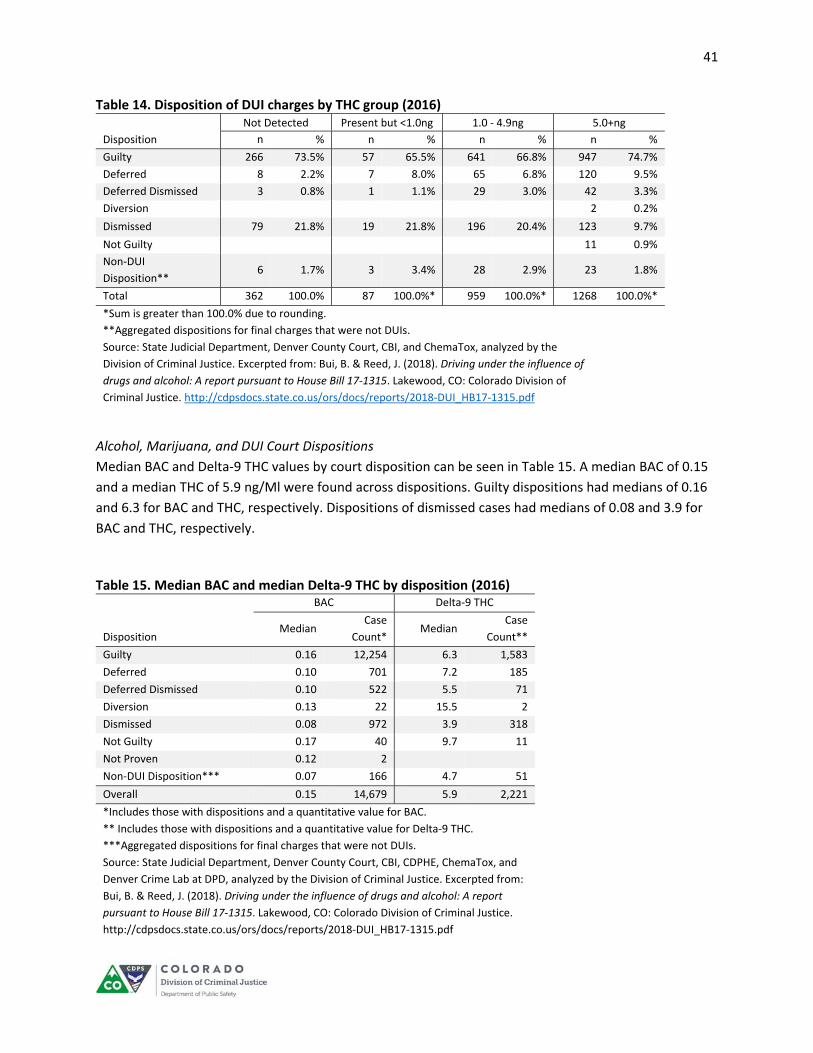
41
Table 14. Disposition of DUI charges by THC group (2016) Not Detected Present but <1.0ng 1.0 ‐ 4.9ng 5.0+ng
Disposition n % n % n % n %
Guilty 266 73.5% 57 65.5% 641 66.8% 947 74.7%
Deferred 8 2.2% 7 8.0% 65 6.8% 120 9.5%
Deferred Dismissed 3 0.8% 1 1.1% 29 3.0% 42 3.3%
Diversion 2 0.2%
Dismissed 79 21.8% 19 21.8% 196 20.4% 123 9.7%
Not Guilty 11 0.9%
Non‐DUI
Disposition** 6 1.7% 3 3.4% 28 2.9% 23 1.8%
Total 362 100.0% 87 100.0%* 959 100.0%* 1268 100.0%*
*Sum is greater than 100.0% due to rounding.
**Aggregated dispositions for final charges that were not DUIs.
Source: State Judicial Department, Denver County Court, CBI, and ChemaTox, analyzed by the
Division of Criminal Justice. Excerpted from: Bui, B. & Reed, J. (2018). Driving under the influence of
drugs and alcohol: A report pursuant to House Bill 17‐1315. Lakewood, CO: Colorado Division of
Criminal Justice. http://cdpsdocs.state.co.us/ors/docs/reports/2018‐DUI_HB17‐1315.pdf
Alcohol, Marijuana, and DUI Court Dispositions
Median BAC and Delta‐9 THC values by court disposition can be seen in Table 15. A median BAC of 0.15
and a median THC of 5.9 ng/Ml were found across dispositions. Guilty dispositions had medians of 0.16
and 6.3 for BAC and THC, respectively. Dispositions of dismissed cases had medians of 0.08 and 3.9 for
BAC and THC, respectively.
Table 15. Median BAC and median Delta‐9 THC by disposition (2016) BAC Delta‐9 THC
Disposition Median
Case
Count* Median
Case
Count**
Guilty 0.16 12,254 6.3 1,583
Deferred 0.10 701 7.2 185
Deferred Dismissed 0.10 522 5.5 71
Diversion 0.13 22 15.5 2
Dismissed 0.08 972 3.9 318
Not Guilty 0.17 40 9.7 11
Not Proven 0.12 2
Non‐DUI Disposition*** 0.07 166 4.7 51
Overall 0.15 14,679 5.9 2,221
*Includes those with dispositions and a quantitative value for BAC.
** Includes those with dispositions and a quantitative value for Delta‐9 THC.
***Aggregated dispositions for final charges that were not DUIs.
Source: State Judicial Department, Denver County Court, CBI, CDPHE, ChemaTox, and
Denver Crime Lab at DPD, analyzed by the Division of Criminal Justice. Excerpted from:
Bui, B. & Reed, J. (2018). Driving under the influence of drugs and alcohol: A report
pursuant to House Bill 17‐1315. Lakewood, CO: Colorado Division of Criminal Justice.
http://cdpsdocs.state.co.us/ors/docs/reports/2018‐DUI_HB17‐1315.pdf

42
Dispositions of ‘Guilty’, ‘Deferred’, and ‘Deferred Dismissed’ were combined to find overall conviction
rates for the various categories of BAC and Delta‐9 THC presence (Table 16). Final non‐DUI charges were
included in the analysis, but a guilty disposition for a non‐DUI charge was not counted as a DUI
conviction. This analysis involved of 1,431 case filings with results for both alcohol and Delta‐9 THC. Only
38 of these toxicology results indicated no alcohol or marijuana was present. A little over a quarter of all
cases that had dispositions and tests for both alcohol and Delta‐9 THC fell in the 0.08+ BAC Group and in
the 1.0 – 4.9 THC Group (28.2%, n=403).
Generally, in 2016, conviction rates were the highest for BAC values of 0.08+ (93.2% to 95.9%). This was
followed by conviction rates for Delta‐9 THC values of 5.0+ ng/mL with rates ranging from 84.3% to
95.9%. These findings suggest that convictions are more common at the per se level for alcohol and at
the permissible inference level for Delta‐9 THC.
Table 16. BAC group and Delta‐9 THC group conviction rate of final DUI charges (2016)
THC level
Not Detected Present but <1.0 1.0 ‐ 4.9 5.0+
BAC level Total
Cases
Conviction
Rate
Total
Cases
Conviction
Rate
Total
Cases
Conviction
Rate
Total
Cases
Conviction
Rate
Grand
Total
Not Detected 38 63.2%* 6 50.0% 70 57.1% 115 84.3% 229
< 0.05 16 50.0% 5 20.0% 63 60.3% 85 88.2% 169
0.05 ‐ 0.079 14 92.9% 4 75.0% 60 81.7% 34 85.3% 112
0.08 + 162 93.2% 36 94.4% 403 94.8% 320 95.9% 921
Grand Total 230 51 596 554 1431
*Final non‐DUI charges were included in the analysis.
Source: State Judicial Department, Denver County Court, CBI, CDPHE, ChemaTox, and Denver Crime Lab at DPD, analyzed by the
Division of Criminal Justice. Excerpted from: Bui, B. & Reed, J. (2018). Driving under the influence of drugs and alcohol: A report
pursuant to House Bill 17‐1315. Lakewood, CO: Colorado Division of Criminal Justice.
http://cdpsdocs.state.co.us/ors/docs/reports/2018‐DUI_HB17‐1315.pdf
Toxicology
A total of ten labs are currently certified by the CDPHE to perform toxicology testing for DUI/DUID
purposes. Only two of the 10 labs routinely perform blood drug analysis for DUI/DUID where a fatality
has not occurred; these are the Colorado Bureau of Investigation and ChemaTox Laboratory, Inc.
ChemaTox is a private lab based in Boulder that performs screenings for more than 160 law
enforcement agencies. In 2016, Chematox performed 3,208 toxicology screenings, and in the first eight
months of 2017 it performed 2,399 (Table 17). Of those 5,607 during the two‐year period, 62% tested
positive on the initial cannabinoid screen for metabolites of THC, which can be present for weeks after
consumption. Of those that tested positive on the initial screen, about 80% tested positive for
psychoactive Delta‐9 THC at 1ng/mL or greater.
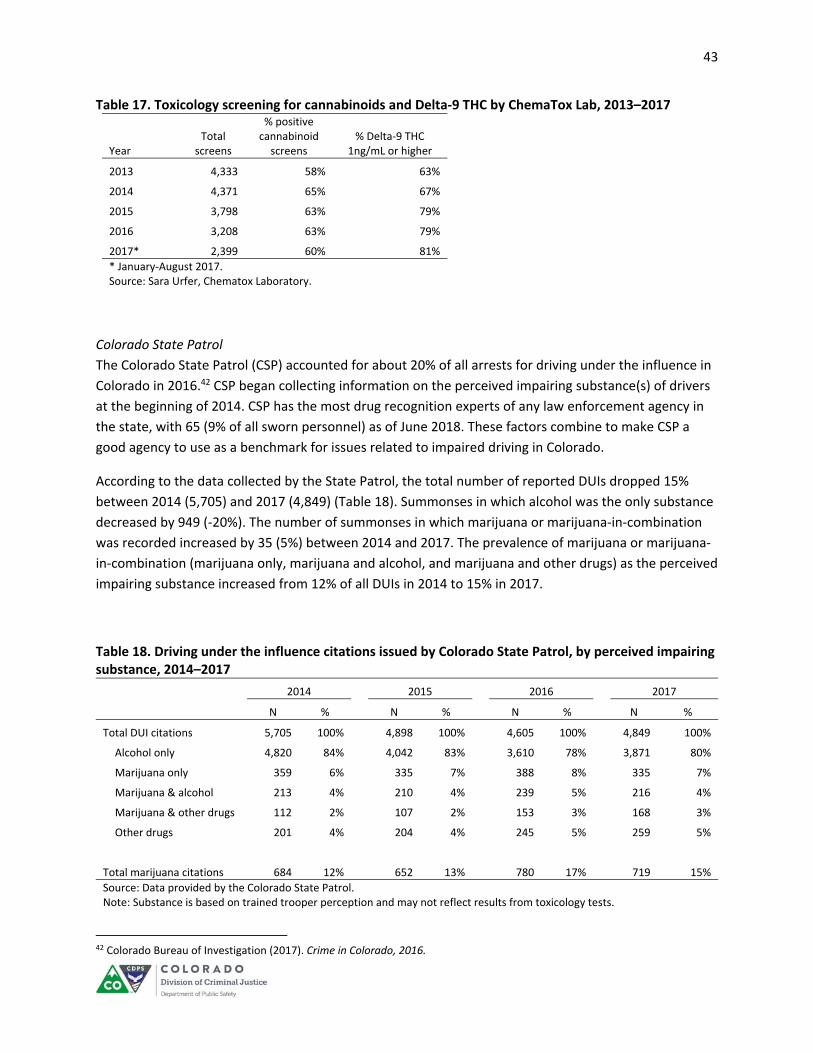
43
Table 17. Toxicology screening for cannabinoids and Delta‐9 THC by ChemaTox Lab, 2013–2017
Year Total
screens
% positive cannabinoid screens
% Delta‐9 THC 1ng/mL or higher
2013 4,333 58% 63%
2014 4,371 65% 67%
2015 3,798 63% 79%
2016 3,208 63% 79%
2017* 2,399 60% 81%
* January‐August 2017. Source: Sara Urfer, Chematox Laboratory.
Colorado State Patrol
The Colorado State Patrol (CSP) accounted for about 20% of all arrests for driving under the influence in
Colorado in 2016.42 CSP began collecting information on the perceived impairing substance(s) of drivers
at the beginning of 2014. CSP has the most drug recognition experts of any law enforcement agency in
the state, with 65 (9% of all sworn personnel) as of June 2018. These factors combine to make CSP a
good agency to use as a benchmark for issues related to impaired driving in Colorado.
According to the data collected by the State Patrol, the total number of reported DUIs dropped 15%
between 2014 (5,705) and 2017 (4,849) (Table 18). Summonses in which alcohol was the only substance
decreased by 949 (‐20%). The number of summonses in which marijuana or marijuana‐in‐combination
was recorded increased by 35 (5%) between 2014 and 2017. The prevalence of marijuana or marijuana‐
in‐combination (marijuana only, marijuana and alcohol, and marijuana and other drugs) as the perceived
impairing substance increased from 12% of all DUIs in 2014 to 15% in 2017.
Table 18. Driving under the influence citations issued by Colorado State Patrol, by perceived impairing substance, 2014–2017
2014 2015 2016 2017
N % N % N % N %
Total DUI citations 5,705 100% 4,898 100% 4,605 100% 4,849 100%
Alcohol only 4,820 84% 4,042 83% 3,610 78% 3,871 80%
Marijuana only 359 6% 335 7% 388 8% 335 7%
Marijuana & alcohol 213 4% 210 4% 239 5% 216 4%
Marijuana & other drugs 112 2% 107 2% 153 3% 168 3%
Other drugs 201 4% 204 4% 245 5% 259 5%
Total marijuana citations 684 12% 652 13% 780 17% 719 15%
Source: Data provided by the Colorado State Patrol. Note: Substance is based on trained trooper perception and may not reflect results from toxicology tests.
42 Colorado Bureau of Investigation (2017). Crime in Colorado, 2016.

44
Local Police Departments
The Denver Police Department began collecting data on DUID in 2013 (Table 19). The number of cases of
driving under the influence of marijuana or marijuana‐in‐combination was small but increased from 33
in 2013 to 63 in 2017. In 2013, these accounted for 1.1% of all DUI citations in Denver and in 2017 these
accounted for 3.3% of all DUI citations.
Table 19. Driving under the influence citations issued by Denver Police Department, by impairment reason, 2013–2017 2013 2014 2015 2016 2017
DUI Total 2,896 2,619 2,532 2,262 1,895 DUI Drugs 84 129 148 122 119
Marijuana 33 66 73 63 63 Other drugs 51 63 75 59 56
Note: Marijuana includes marijuana alone or in combination with alcohol or other drugs. Other includes other drugs alone or in combination with alcohol. Source: Denver Office of Excise and License (2018).
The Aurora Police Department also provided data regarding driving under the influence of marijuana. In
2017, 9.2% of DUI citations involved a driver who tested positive for Delta‐9 THC (Table 20).
Table 20. Driving under the influence citations issued by Aurora Police Department, by marijuana involvement, 2014–2017 2014 2015 2016 2017
DUI Total 1,995 1,684 1,374 1,386 Marijuana confirmed 60 72 178 128
Note: “Marijuana confirmed” indicates a positive toxicology test for Delta‐9 THC.
Source: Aurora Police Department (2018).
Mandated Treatment for Driving Under the Influence
Drivers convicted of driving under the influence in Colorado are mandated to attend approved
treatment classes before their driver’s license privilege can be reinstated. When they are admitted into
treatment, the primary drug of abuse is captured in the Drug/Alcohol Coordinated Data System
(DACODS). Admissions for DUI treatment where alcohol was reported as the primary drug dropped 23%
from 2002 to 2017 (Figure 11). In that same period, admissions in which marijuana was the primary drug
increased by 52%.

45
Figure 11. DUI treatment admission trends, 2008–2017
Source: Colorado Department of Human Services, Office of Behavioral Health, Drug/Alcohol Coordinated Data System, analyzed by the Division of Criminal Justice.
The proportion of individuals participating in DUI treatment with alcohol as the primary drug declined from 93% in 2012 to 86% in 2017. During that same time, clients reporting marijuana as their primary drug increased from 5% to 10% of DUI admissions (Figure 12).
Figure 12. Treatment admissions for DUI, by percent reporting primary drug, 2008–2017
Source: Colorado Department of Human Services, Office of Behavioral Health, Drug/Alcohol Coordinated Data System, analyzed
by the Division of Criminal Justice.
1,307 1,312 1,306 1,444 1,487 1,675 1,910 2,205 2,359 2,264
31,733 31,227
27,55925,652 25,781 25,659
26,79525,818
23,573
19,931
541 451 484 551 595 690 746 834 809 8910
5,000
10,000
15,000
20,000
25,000
30,000
35,000
2008 2009 2010 2011 2012 2013 2014 2015 2016 2017
Marijuana Alcohol Any other drugs
94% 95% 94% 93% 93% 92% 91% 89% 88% 86%
4% 4% 4% 5% 5% 6% 6% 8% 9% 10%
2% 1% 2% 2% 2% 2% 3% 3% 3% 4%
0%
10%
20%
30%
40%
50%
60%
70%
80%
90%
100%
2008 2009 2010 2011 2012 2013 2014 2015 2016 2017
Alcohol Marijuana Any other
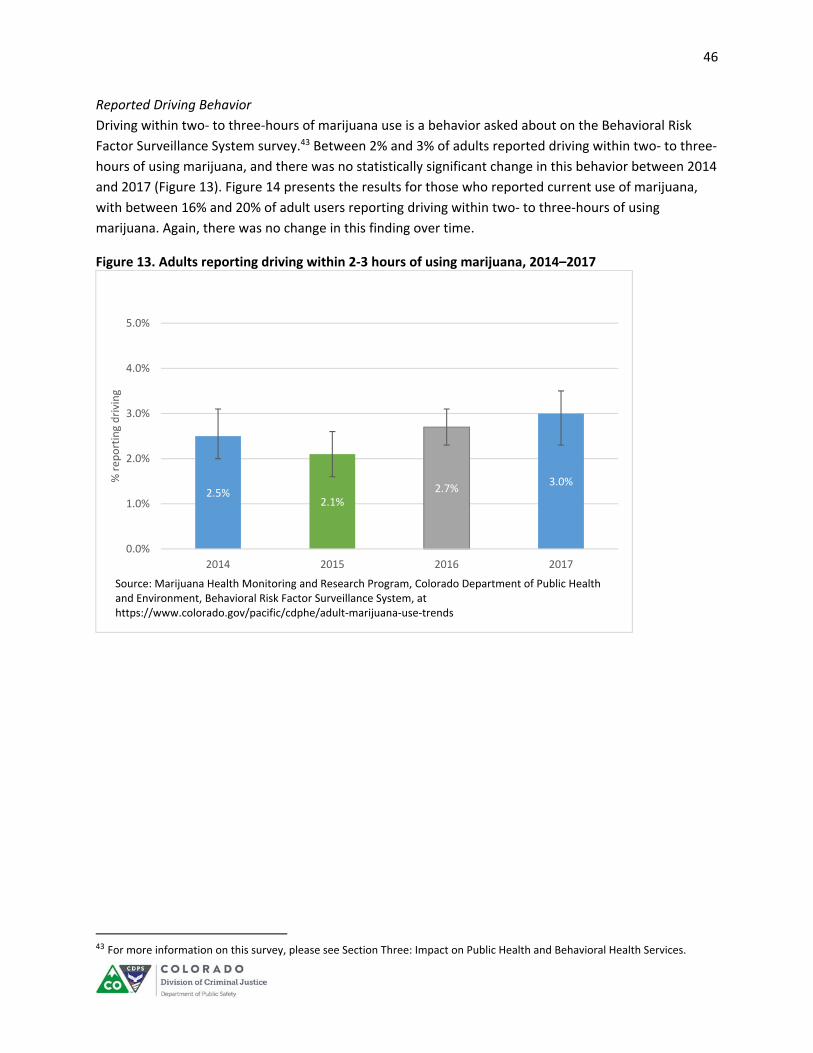
46
Reported Driving Behavior
Driving within two‐ to three‐hours of marijuana use is a behavior asked about on the Behavioral Risk
Factor Surveillance System survey.43 Between 2% and 3% of adults reported driving within two‐ to three‐
hours of using marijuana, and there was no statistically significant change in this behavior between 2014
and 2017 (Figure 13). Figure 14 presents the results for those who reported current use of marijuana,
with between 16% and 20% of adult users reporting driving within two‐ to three‐hours of using
marijuana. Again, there was no change in this finding over time.
Figure 13. Adults reporting driving within 2‐3 hours of using marijuana, 2014–2017
43 For more information on this survey, please see Section Three: Impact on Public Health and Behavioral Health Services.
2.5%2.1%
2.7%3.0%
0.0%
1.0%
2.0%
3.0%
4.0%
5.0%
2014 2015 2016 2017
% reporting driving
Source: Marijuana Health Monitoring and Research Program, Colorado Department of Public Health and Environment, Behavioral Risk Factor Surveillance System, at https://www.colorado.gov/pacific/cdphe/adult‐marijuana‐use‐trends
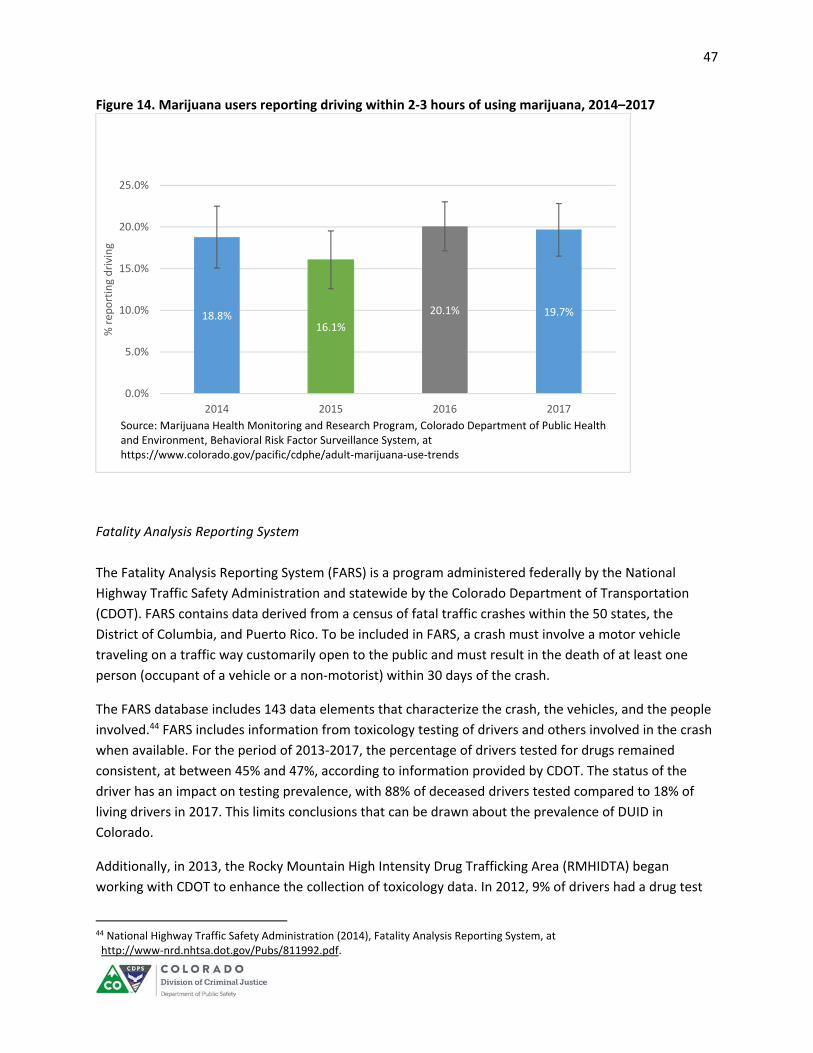
47
Figure 14. Marijuana users reporting driving within 2‐3 hours of using marijuana, 2014–2017
Fatality Analysis Reporting System
The Fatality Analysis Reporting System (FARS) is a program administered federally by the National
Highway Traffic Safety Administration and statewide by the Colorado Department of Transportation
(CDOT). FARS contains data derived from a census of fatal traffic crashes within the 50 states, the
District of Columbia, and Puerto Rico. To be included in FARS, a crash must involve a motor vehicle
traveling on a traffic way customarily open to the public and must result in the death of at least one
person (occupant of a vehicle or a non‐motorist) within 30 days of the crash.
The FARS database includes 143 data elements that characterize the crash, the vehicles, and the people
involved.44 FARS includes information from toxicology testing of drivers and others involved in the crash
when available. For the period of 2013‐2017, the percentage of drivers tested for drugs remained
consistent, at between 45% and 47%, according to information provided by CDOT. The status of the
driver has an impact on testing prevalence, with 88% of deceased drivers tested compared to 18% of
living drivers in 2017. This limits conclusions that can be drawn about the prevalence of DUID in
Colorado.
Additionally, in 2013, the Rocky Mountain High Intensity Drug Trafficking Area (RMHIDTA) began
working with CDOT to enhance the collection of toxicology data. In 2012, 9% of drivers had a drug test
44 National Highway Traffic Safety Administration (2014), Fatality Analysis Reporting System, at http://www‐nrd.nhtsa.dot.gov/Pubs/811992.pdf.
18.8%16.1%
20.1% 19.7%
0.0%
5.0%
10.0%
15.0%
20.0%
25.0%
2014 2015 2016 2017
% reporting driving
Source: Marijuana Health Monitoring and Research Program, Colorado Department of Public Health and Environment, Behavioral Risk Factor Surveillance System, at https://www.colorado.gov/pacific/cdphe/adult‐marijuana‐use‐trends

48
conducted, but the results were not reported to CDOT. The partnership between CDOT and RMHIDTA,
where additional contact was made with coroners or law enforcement to obtain results, has virtually
eliminated this problem of missing data. This improvement in the completeness of Colorado’s FARS
data, however, makes comparisons to years prior to 2013 difficult.
The type of testing reported also precludes making any definitive statements about driver impairment.
The primary compound in cannabis that produces psychoactive effects is Delta‐9‐THC, which begins to
dissipate in blood rapidly after consumption. There are other active metabolites of THC (11‐OH‐THC)
which dissipate quickly and inactive metabolites (THC‐COOH) that are detectable in blood for longer
periods of time.45 It is not always possible to tell in the FARS data if the test detected psychoactive Delta‐
9‐THC or the other metabolites of THC.
Information regarding the number of fatalities, drivers, and crashes, and the prevalence of drug and
alcohol testing, is presented in Table 21. A little less than half of drivers (45%‐47%) involved in fatal
crashes were tested for alcohol and/or drugs. However, in about two‐thirds of crashes there was at least
one driver tested.
The number and percent of fatalities where the driver was impaired at a BAC ≥ .08 is presented in Table
22. In 2017, a little over one‐quarter (26%) of fatalities occurred when a driver was legally impaired by
alcohol. The percent of fatalities with drivers who tested positive for Delta‐9 THC at the 5 ng/mL level
was 8% in 2017, down from 13% in 2016 (Table 23). It should be noted that the improved reporting for
the specific level of Delta‐9 THC occurred in 2016, which makes comparison to prior years invalid.
45 Huestis, M., Henningfield, J., and Cone, E. (1992). Blood cannabinoids I: Absorption of THC and formation of 11‐OH‐THC and THC‐COOH during and after marijuana smoking, Journal of analytical toxicology, 16, 276‐282. Available at https://www.researchgate.net/publication/21817925_Blood_cannabinoids_I_absorption_of_THC_and_formation_of_11‐OH‐THC_and_THC‐COOH_during_and_after_marijuana_smoking
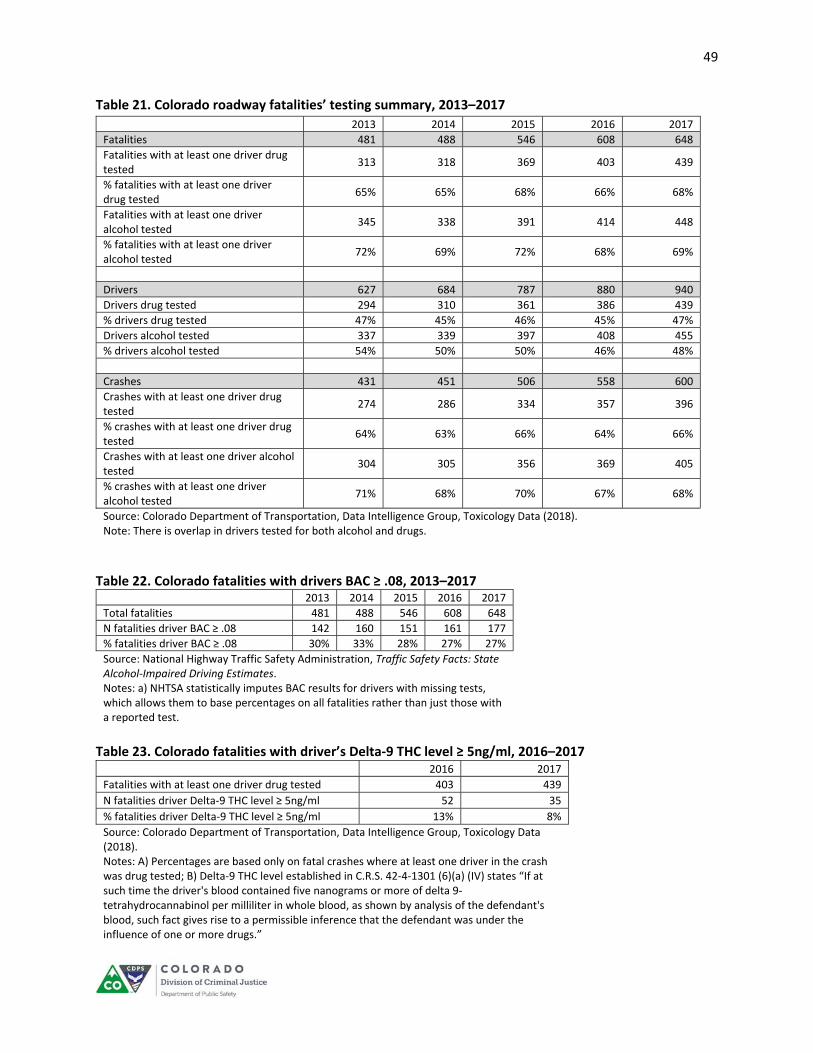
49
Table 21. Colorado roadway fatalities’ testing summary, 2013–2017
2013 2014 2015 2016 2017
Fatalities 481 488 546 608 648
Fatalities with at least one driver drug tested
313 318 369 403 439
% fatalities with at least one driver drug tested
65% 65% 68% 66% 68%
Fatalities with at least one driver alcohol tested
345 338 391 414 448
% fatalities with at least one driver alcohol tested
72% 69% 72% 68% 69%
Drivers 627 684 787 880 940
Drivers drug tested 294 310 361 386 439
% drivers drug tested 47% 45% 46% 45% 47%
Drivers alcohol tested 337 339 397 408 455
% drivers alcohol tested 54% 50% 50% 46% 48%
Crashes 431 451 506 558 600
Crashes with at least one driver drug tested
274 286 334 357 396
% crashes with at least one driver drug tested
64% 63% 66% 64% 66%
Crashes with at least one driver alcohol tested
304 305 356 369 405
% crashes with at least one driver alcohol tested
71% 68% 70% 67% 68%
Source: Colorado Department of Transportation, Data Intelligence Group, Toxicology Data (2018). Note: There is overlap in drivers tested for both alcohol and drugs.
Table 22. Colorado fatalities with drivers BAC ≥ .08, 2013–2017 2013 2014 2015 2016 2017
Total fatalities 481 488 546 608 648
N fatalities driver BAC ≥ .08 142 160 151 161 177
% fatalities driver BAC ≥ .08 30% 33% 28% 27% 27%
Source: National Highway Traffic Safety Administration, Traffic Safety Facts: State Alcohol‐Impaired Driving Estimates. Notes: a) NHTSA statistically imputes BAC results for drivers with missing tests, which allows them to base percentages on all fatalities rather than just those with a reported test.
Table 23. Colorado fatalities with driver’s Delta‐9 THC level ≥ 5ng/ml, 2016–2017 2016 2017
Fatalities with at least one driver drug tested 403 439
N fatalities driver Delta‐9 THC level ≥ 5ng/ml 52 35
% fatalities driver Delta‐9 THC level ≥ 5ng/ml 13% 8%
Source: Colorado Department of Transportation, Data Intelligence Group, Toxicology Data (2018). Notes: A) Percentages are based only on fatal crashes where at least one driver in the crash was drug tested; B) Delta‐9 THC level established in C.R.S. 42‐4‐1301 (6)(a) (IV) states “If at such time the driver's blood contained five nanograms or more of delta 9‐tetrahydrocannabinol per milliliter in whole blood, as shown by analysis of the defendant's blood, such fact gives rise to a permissible inference that the defendant was under the influence of one or more drugs.”

50
Reporting by CDOT regarding whether a driver in a fatal crash tested positive for a cannabinoid has been
consistent since 2013. It is important to remember that presence of a cannabinoid does not indicate
impairment from marijuana. The number of drivers testing positive for cannabinoid‐only or cannabinoid‐
in‐combination increased from 47 in 2013 to 133 in 2017 (Figure 15). The number of drivers in fatal
crashes testing positive for cannabinoid‐only increased from 18 to 48 during that same period. The
percentage of drug‐tested drivers who tested positive for some cannabinoid (alone or in combination
with some other drug) increased from 16% in 2013 to 30% in 2017. However, only about half of all
drivers involved in fatal crashes were tested for drugs.
The number of fatalities in which the driver tested positive for cannabinoid‐only or cannabinoid‐in‐
combination increased from 55 in 2013 to 139 in 2017 (Figure 16). The number of fatalities in which the
driver tested positive for cannabinoid‐only increased from 23 in 2013 to 46 in 2017. The percentage of
all fatalities with a cannabinoid positive (alone or in combination) driver increased from 18% in 2013 to
32% in 2017. Again, it should be noted that only about half of all drivers were tested for drugs.
In 2016, CDOT improved data collection on the specific metabolites present in the blood of drivers,
especially Delta‐9 THC. Figure 17 presents the 2016 and 2017 data on drivers with Delta‐9 THC detected
in their blood. The number of drivers with any detectable Delta‐9 THC increased from 71 (18.4% of
tested drivers) in 2016 to 88 (20.0% of tested drivers) in 2017. However, when the drivers who test
positive at the 5 ng/mL level were examined separately, there were 45 (11.7% of tested drivers) who
tested positive at the 5 ng/mL46 level in 2016 and 33 (7.5% of tested drivers) in 2017.
The number of fatalities where a driver tested positive for any Delta‐9 THC increased from 77 in 2016 to
97 in 2017 (Figure 18). Fatalities where the driver tested positive at or above the 5 ng/mL level
decreased from 52 in 2016 to 35 in 2017.
It should be noted that a recent study found that the annual changes in overall fatality rate for Colorado
was similar to a group of control states pre‐ and post‐legalization.47
46 Delta‐9 THC level established in C.R.S. 42‐4‐1301 (6)(a) (IV) states “If at such time the driver's blood contained five
nanograms or more of delta 9‐tetrahydrocannabinol per milliliter in whole blood, as shown by analysis of the defendant's blood, such fact gives rise to a permissible inference that the defendant was under the influence of one or more drugs.” 47 Aydelotte, J. et al. (2017). Crash fatality rates after recreational marijuana legalization in Washington and Colorado. American Journal of Public Health, 107(8), 1329‐1331.
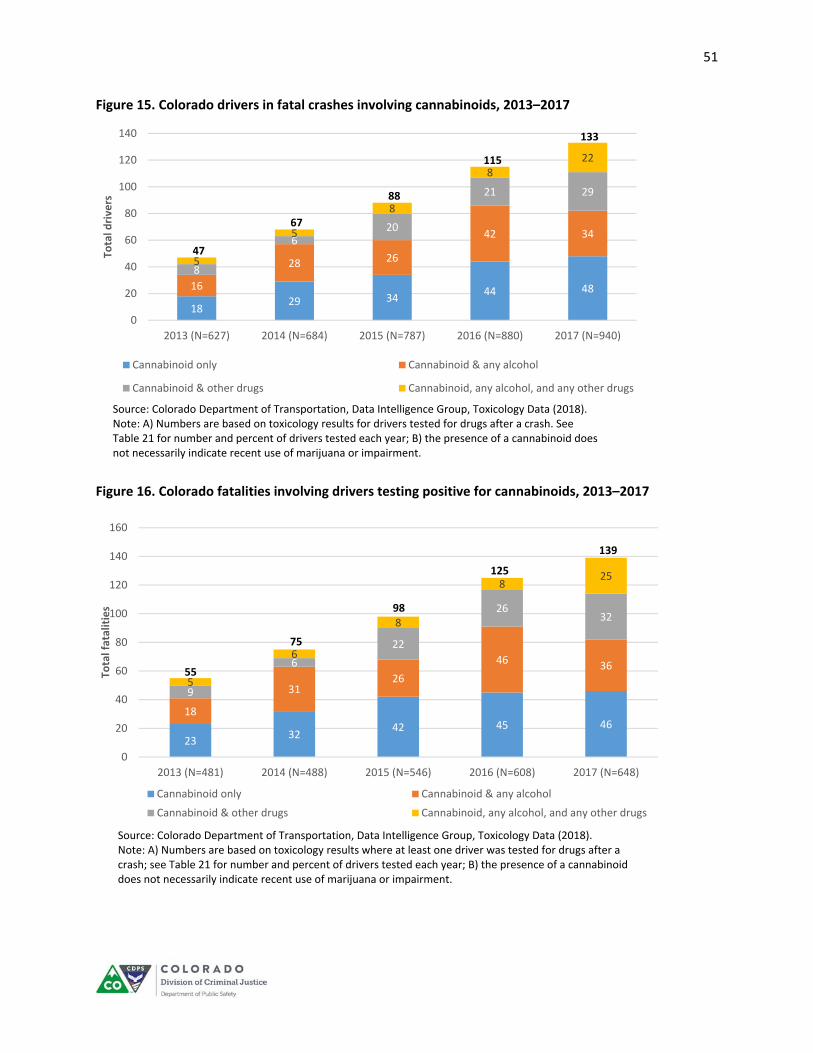
51
Figure 15. Colorado drivers in fatal crashes involving cannabinoids, 2013–2017
Figure 16. Colorado fatalities involving drivers testing positive for cannabinoids, 2013–2017
1829 34
44 4816
28 26
42 34
8
620
21 29
5
5
8
822
0
20
40
60
80
100
120
140
2013 (N=627) 2014 (N=684) 2015 (N=787) 2016 (N=880) 2017 (N=940)
Total d
rive
rs
Cannabinoid only Cannabinoid & any alcohol
Cannabinoid & other drugs Cannabinoid, any alcohol, and any other drugs
47
67
115
88
133
Source: Colorado Department of Transportation, Data Intelligence Group, Toxicology Data (2018).Note: A) Numbers are based on toxicology results for drivers tested for drugs after a crash. SeeTable 21 for number and percent of drivers tested each year; B) the presence of a cannabinoid does not necessarily indicate recent use of marijuana or impairment.
2332
42 45 4618
3126
46 36
9
6
22
2632
5
6
8
825
0
20
40
60
80
100
120
140
160
2013 (N=481) 2014 (N=488) 2015 (N=546) 2016 (N=608) 2017 (N=648)
Total fatalities
Cannabinoid only Cannabinoid & any alcohol
Cannabinoid & other drugs Cannabinoid, any alcohol, and any other drugs
Source: Colorado Department of Transportation, Data Intelligence Group, Toxicology Data (2018).Note: A) Numbers are based on toxicology results where at least one driver was tested for drugs after a crash; see Table 21 for number and percent of drivers tested each year; B) the presence of a cannabinoid does not necessarily indicate recent use of marijuana or impairment.
55
75
98
125
139

52
Figure 17. Colorado: Drug tested drivers in fatal crashes, by Delta‐9 THC level, 2016–2017
0.8%
6.0%
11.7%
18.4%
3.0%
9.6%
7.5%
20.0%
0.0%
5.0%
10.0%
15.0%
20.0%
25.0%
Present but less than1ng
1ng to <5ng 5ng or higher Any Delta 9 detected
% of all d
rug tested drive
rs
Delta 9 THC level of driver
2016 2017
3 13
23
42 45
33
71
88
Source: Colorado Department of Transportation, Data Intelligence Group, Toxicology Data (2018).Notes: A) Numbers are based on toxicology results for drivers tested for drugs after a crash. In 2016, 386 drivers (44% of total) were tested and in 2017 there were 439 drivers tested (47%); B) Delta‐9 THC level established in C.R.S. 42‐4‐1301 (6)(a) (IV) states “If at such time the driver's blood contained five nanograms or more of delta 9‐tetrahydrocannabinol per milliliter in whole blood, as shown by analysis of the defendant's blood, such fact gives rise to a permissible inference that the defendant was under the influence of one or more drugs;” C) Reporting on the specific presence of Delta‐9 THC levels was not reliable prior to 2016.
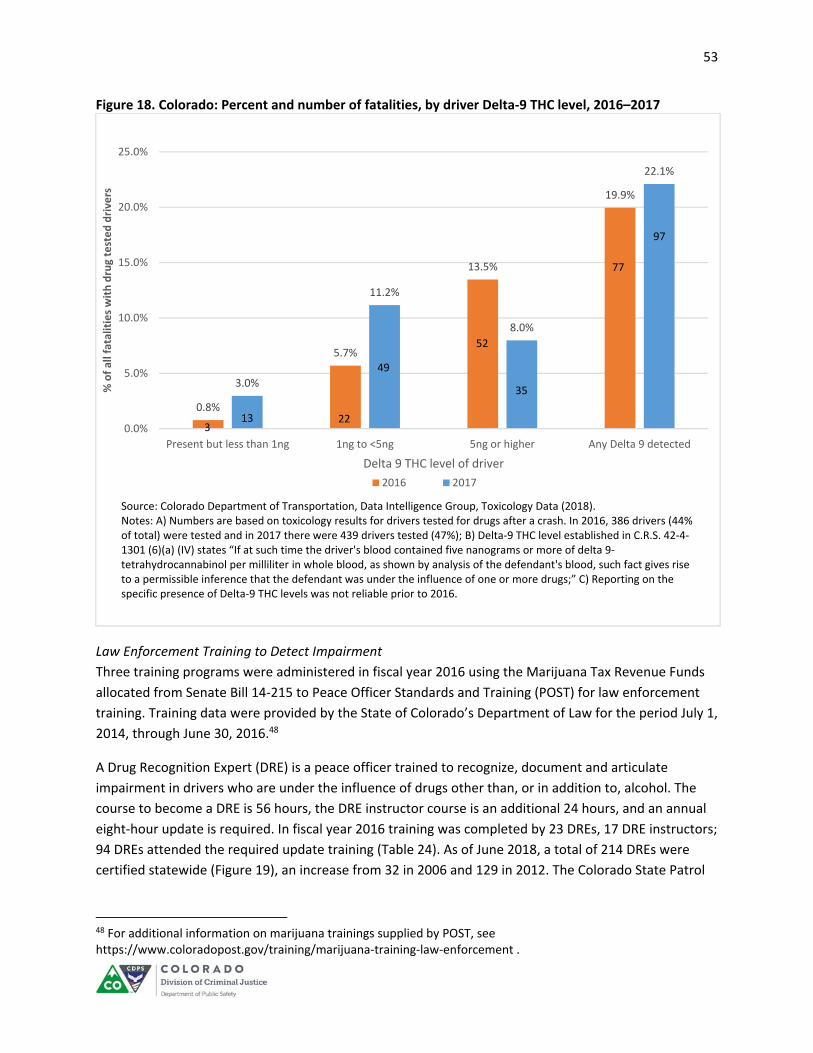
53
Figure 18. Colorado: Percent and number of fatalities, by driver Delta‐9 THC level, 2016–2017
Law Enforcement Training to Detect Impairment
Three training programs were administered in fiscal year 2016 using the Marijuana Tax Revenue Funds
allocated from Senate Bill 14‐215 to Peace Officer Standards and Training (POST) for law enforcement
training. Training data were provided by the State of Colorado’s Department of Law for the period July 1,
2014, through June 30, 2016.48
A Drug Recognition Expert (DRE) is a peace officer trained to recognize, document and articulate
impairment in drivers who are under the influence of drugs other than, or in addition to, alcohol. The
course to become a DRE is 56 hours, the DRE instructor course is an additional 24 hours, and an annual
eight‐hour update is required. In fiscal year 2016 training was completed by 23 DREs, 17 DRE instructors;
94 DREs attended the required update training (Table 24). As of June 2018, a total of 214 DREs were
certified statewide (Figure 19), an increase from 32 in 2006 and 129 in 2012. The Colorado State Patrol
48 For additional information on marijuana trainings supplied by POST, see https://www.coloradopost.gov/training/marijuana‐training‐law‐enforcement .
0.8%
5.7%
13.5%
19.9%
3.0%
11.2%
8.0%
22.1%
0.0%
5.0%
10.0%
15.0%
20.0%
25.0%
Present but less than 1ng 1ng to <5ng 5ng or higher Any Delta 9 detected
% of all fatalities with drug tested drive
rs
Delta 9 THC level of driver
2016 2017
Source: Colorado Department of Transportation, Data Intelligence Group, Toxicology Data (2018).Notes: A) Numbers are based on toxicology results for drivers tested for drugs after a crash. In 2016, 386 drivers (44% of total) were tested and in 2017 there were 439 drivers tested (47%); B) Delta‐9 THC level established in C.R.S. 42‐4‐1301 (6)(a) (IV) states “If at such time the driver's blood contained five nanograms or more of delta 9‐tetrahydrocannabinol per milliliter in whole blood, as shown by analysis of the defendant's blood, such fact gives rise to a permissible inference that the defendant was under the influence of one or more drugs;” C) Reporting on the specific presence of Delta‐9 THC levels was not reliable prior to 2016.
313 22
49
52
35
77
97
54
(61) and Denver Police Department (27) have the greatest number of DREs. (For a complete summary of
agency training see Appendix G.)
The Advanced Roadside Impaired Driving Enforcement (ARIDE) program was created to address the gap
in training between the Standardized Field Sobriety Testing and the Drug Recognition Expert program.
ARIDE bridges the gap between these two programs by providing officers with general knowledge
related to drug impairment and by promoting the use of DREs. ARIDE training is 16 hours long. In fiscal
year 2016, ARIDE training was completed by 136 peace officers (Table 24).
The Introduction to Marijuana for Law Enforcement (Marijuana 101) course is designed to clarify legal
issues for peace officers. Topics covered include potential lawsuits, the difference between
Amendments 20 and 64, changes to possession charges and limits, the meaning of caregiver and
medical marijuana patient, how marijuana has changed the way law enforcement conducts and
develops probable cause for a search, how to query a medical marijuana card on the Colorado Crime
Information Center database, and investigations. This course allows the peace officers attending to
participate in scenario‐based training and gain an understanding of marijuana laws. In fiscal year 2016
this training was provided to 1,575 peace officers and 135 school resource officers (Table 24). POST also
hosted a marijuana education conference that included 372 attendees from law enforcement agencies
from across the country.
Table 24. Law enforcement impaired driving training funded by Marijuana Cash Tax Fund FY 2015 FY 2016
Training type Number of classes
Number officers trained
Number of classes
Number officers trained
Drug Recognition Expert Operator 3 56 4 23 Instructor 2 17 2 17 Annual update 2 160 2 94
ARIDE 35 562 15 136
Marijuana for Law Enforcement Law enforcement 103 2,256 106 1,575 School Resource Officers 1 70 11 135 Train the Trainer 2 14
Sobriety checkpoint training 15 97 DUI report writing 14 Marijuana conference 372 attendees
Source: Colorado Attorney General’s Office, Peace Officer Standards and Training.
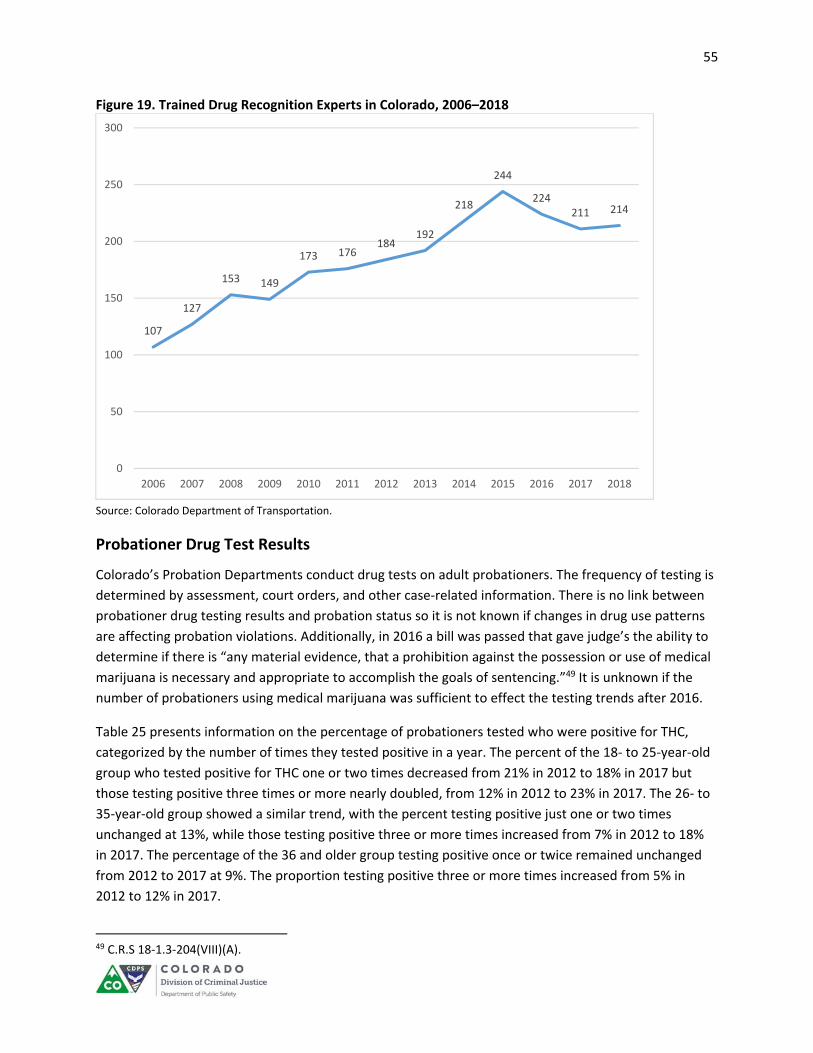
55
Figure 19. Trained Drug Recognition Experts in Colorado, 2006–2018
Source: Colorado Department of Transportation.
Probationer Drug Test Results
Colorado’s Probation Departments conduct drug tests on adult probationers. The frequency of testing is
determined by assessment, court orders, and other case‐related information. There is no link between
probationer drug testing results and probation status so it is not known if changes in drug use patterns
are affecting probation violations. Additionally, in 2016 a bill was passed that gave judge’s the ability to
determine if there is “any material evidence, that a prohibition against the possession or use of medical
marijuana is necessary and appropriate to accomplish the goals of sentencing.”49 It is unknown if the
number of probationers using medical marijuana was sufficient to effect the testing trends after 2016.
Table 25 presents information on the percentage of probationers tested who were positive for THC,
categorized by the number of times they tested positive in a year. The percent of the 18‐ to 25‐year‐old
group who tested positive for THC one or two times decreased from 21% in 2012 to 18% in 2017 but
those testing positive three times or more nearly doubled, from 12% in 2012 to 23% in 2017. The 26‐ to
35‐year‐old group showed a similar trend, with the percent testing positive just one or two times
unchanged at 13%, while those testing positive three or more times increased from 7% in 2012 to 18%
in 2017. The percentage of the 36 and older group testing positive once or twice remained unchanged
from 2012 to 2017 at 9%. The proportion testing positive three or more times increased from 5% in
2012 to 12% in 2017.
49 C.R.S 18‐1.3‐204(VIII)(A).
107
127
153 149
173 176184
192
218
244
224211 214
0
50
100
150
200
250
300
2006 2007 2008 2009 2010 2011 2012 2013 2014 2015 2016 2017 2018

56
Table 25. Adult probationer drug test results for THC, by age group and number of times positive in a year, 2012‐17
Age group Test results 2012 2013 2014 2015 2016 2017
18 to 25 years N tested 17,231 15,983 18,832 17,845 16,916 16,305
0 times positive
68% 69% 66% 64% 61% 58%
1‐2 times positive
21% 18% 18% 18% 18% 18%
3 times or more positive
12% 12% 16% 19% 21% 23%
26 to 35 years N tested 15,851 16,192 21,290 21,582 21,944 22,078
0 times positive
79% 81% 79% 75% 72% 69%
1‐2 times positive
13% 12% 11% 12% 12% 13%
3 times or more positive
7% 8% 10% 12% 15% 18%
36 years or older
N tested 16,594 17,561 23,543 24,016 23,937 24,324
0 times positive
86% 88% 86% 84% 81% 78%
1‐2 times positive
9% 8% 8% 8% 9% 9%
3 times or more positive
5% 5% 7% 8% 10% 12%
Note: Percentages may not sum to 100 due to rounding. Source: Data provided by Colorado State Judicial Department, analyzed by the Division of Criminal Justice.
The percent of all drug tests that were positive for THC increased across all adult age groups (Figure 20).
For 18‐ to 25‐year‐olds, 12% of tests were positive in 2012 and 23% were positive in 2017. For 26‐ to 35‐
year‐olds, 7% of tests were positive in 2012, which more than doubled to 16% in 2017. The percent of
drug tests for those 36 years or older also doubled, from 5% in 2012 to 11% in 2017.
Figure 20. Adult probationers’ drug tests that were positive for THC, by age group, 2012–2017
Source: Data provided by Colorado State Judicial Department, analyzed by the Division of Criminal Justice.
12%
7%
5%
13%
7%
4%
13%
7%
5%
16%
10%
6%
21%
14%
9%
23%
16%
11%
0%
5%
10%
15%
20%
25%
18 to 25 26 to 35 36 or older
Percent probationers with positive
THC test
2012 2013 2014 2015 2016 2017

57
Illegal Cultivation on Public Lands
Data from the National Forest Service, Bureau of Land Management, National Park Service, and the
Colorado Division of Parks and Wildlife was obtained to determine what enforcement actions have been
undertaken regarding cultivation of marijuana on public lands. The number of growing operations and
plants seized shows no discernible trend (Table 26). Prior to legalization, the year with the greatest
activity was 2012, with 11 grow operations seized, accounting for approximately 46,622 plants. Recent
data indicated an increase in illegal growing activity on public lands, with 63,602 plans seized in 2016
and 80,826 in 2017. Two maps, Figures 21 and 22, show the number of grow operations and plants
seized from 2009–2012 and 2013–2017. In the period 2013‐2017, the most plants seized were in Custer,
Pueblo, and Huerfano Counties.
Table 26. Marijuana plants seized on public land, by agency, 2009–2017
Plants seized
Year Grows seized
National Forest Service
Bureau of Land Management
National Park Service
Total number of plants
2009 8 29,200 177 4 29,381 2010 5 15,665 0 0 15,665 2011 4 3,970 0 0 3,970 2012 11 46,662 0 0 46,662 2013 3 4,980 0 0 4,980 2014 4 4,484 0 0 4,484 2015 6 22,830 2,200 0 25,030 2016 8 63,602 0 0 63,602 2017 22 71,626 9,200 0 80,826
Source: Data provided by National Forest Service, National Park Service, and Bureau of Land Management, analyzed by the Division of Criminal Justice.
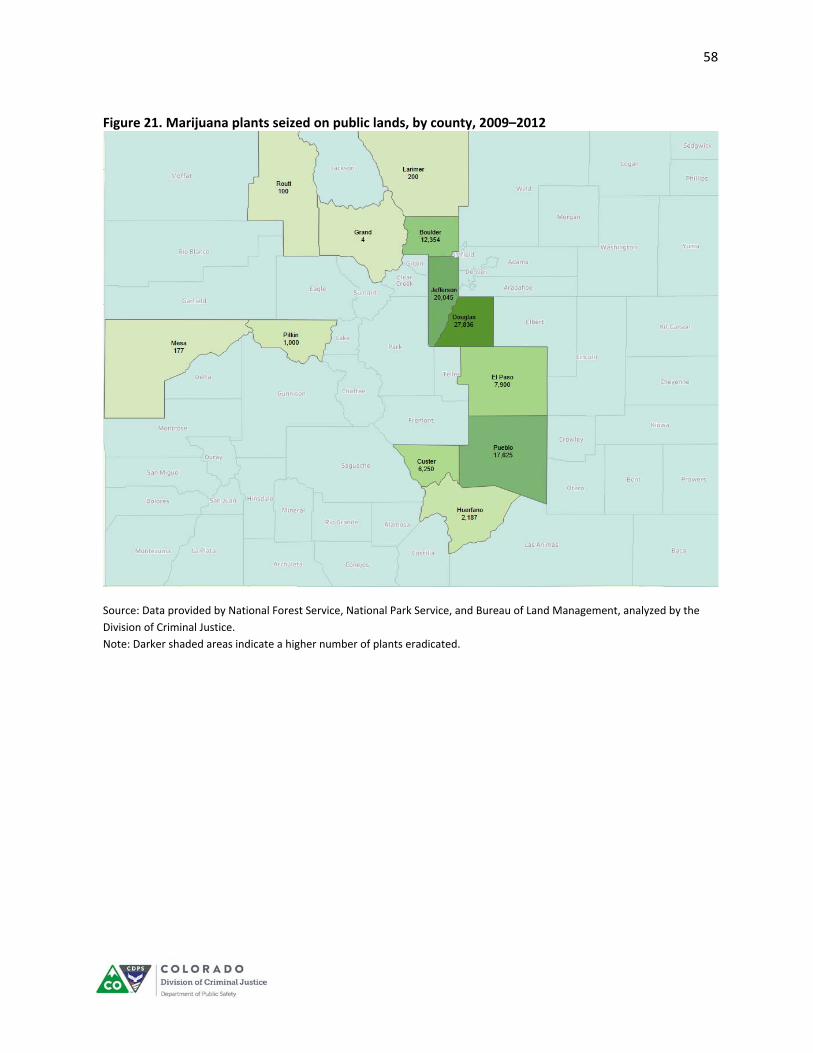
58
Figure 21. Marijuana plants seized on public lands, by county, 2009–2012
Source: Data provided by National Forest Service, National Park Service, and Bureau of Land Management, analyzed by the
Division of Criminal Justice.
Note: Darker shaded areas indicate a higher number of plants eradicated.
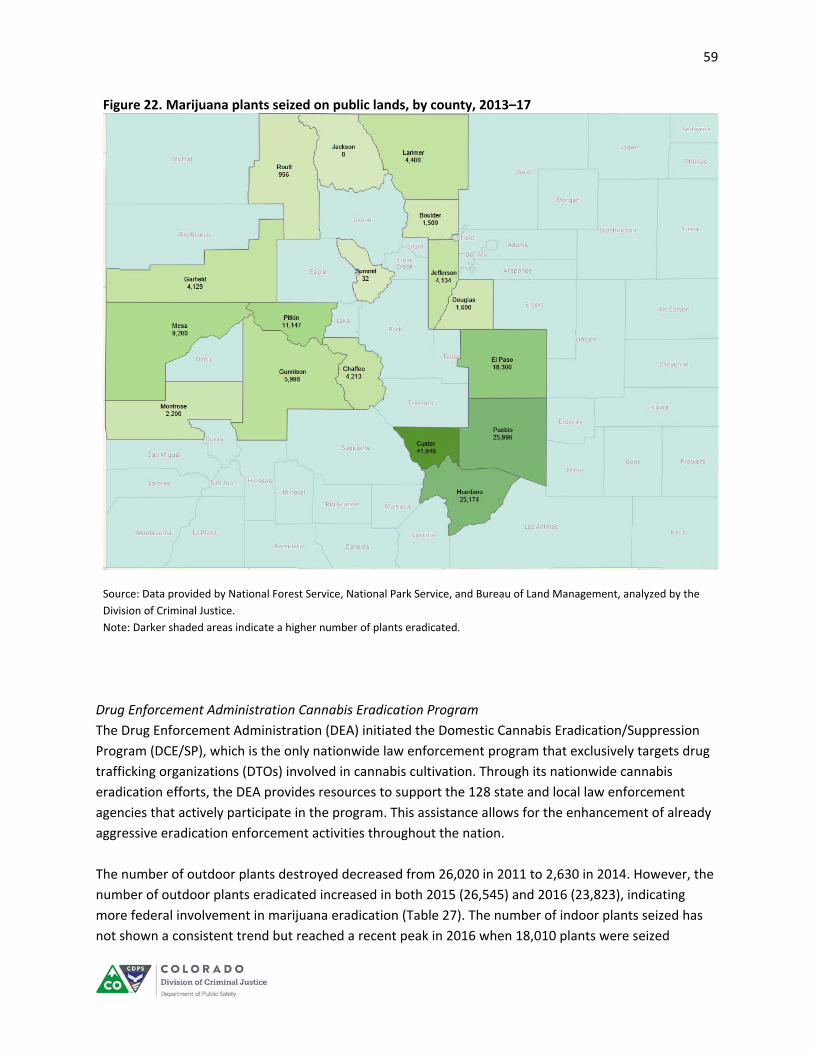
59
Figure 22. Marijuana plants seized on public lands, by county, 2013–17
Source: Data provided by National Forest Service, National Park Service, and Bureau of Land Management, analyzed by the
Division of Criminal Justice.
Note: Darker shaded areas indicate a higher number of plants eradicated.
Drug Enforcement Administration Cannabis Eradication Program
The Drug Enforcement Administration (DEA) initiated the Domestic Cannabis Eradication/Suppression
Program (DCE/SP), which is the only nationwide law enforcement program that exclusively targets drug
trafficking organizations (DTOs) involved in cannabis cultivation. Through its nationwide cannabis
eradication efforts, the DEA provides resources to support the 128 state and local law enforcement
agencies that actively participate in the program. This assistance allows for the enhancement of already
aggressive eradication enforcement activities throughout the nation.
The number of outdoor plants destroyed decreased from 26,020 in 2011 to 2,630 in 2014. However, the
number of outdoor plants eradicated increased in both 2015 (26,545) and 2016 (23,823), indicating
more federal involvement in marijuana eradication (Table 27). The number of indoor plants seized has
not shown a consistent trend but reached a recent peak in 2016 when 18,010 plants were seized

60
indoors. The number of arrests climbed over the past three years as well as the number of weapons
seized (Table 27).
Table 27. Drug Enforcement Administration cannabis eradication/suppression program in Colorado, 2006–2017
Year Outdoor grow sites
Outdoor plants
Indoor grow sites
Indoor plants
Bulk processed marijuana (pounds)
Number of
arrests Weapons seized
Assets seized (value)
2006 14 3,819 47 3,667 1,727 193 19 $932,679
2007 31 2,498 45 2,430 57 143 29 $903,944
2008 17 5,564 29 24,469 64 36 0 $3,094,240
2009 28 29,655 7 235 62 5 0 $12,500
2010 7 6,331 50 5,492 0 60 0 $153,674
2011 16 26,020 3 4 125 11 0 $15,626
2012 3 21,235 7 2,069 515 9 47 $354,325
2013 2 5,562 19 11,042 1,636 2 11 $257,938
2014 3 2,630 18 5,426 381 6 23 $2,066,855
2015 6 26,545 2 527 159 14 0 $0
2016 13 23,823 78 18,010 3,659 15 66 $2,320,552
2017 9 2,059 37 3,706 3,550 24 79 $475,412
Source: U.S. Department of Justice, Drug Enforcement Administration. Cannabis Eradication, at http://www.justice.gov/dea/ops/cannabis.shtml, Sourcebook of Criminal Justice Statistics, at http://www.albany.edu/sourcebook
Diversion Out of State
The amount of marijuana diverted out of Colorado is difficult to estimate, because a relatively small
percentage of black market drugs are seized according to law enforcement officials. There is also no
central database to which all law enforcement agencies report drug seizures and the originating state of
the drug. The Colorado Information Analysis Center (CIAC), in the Department of Public Safety, is
developing a comprehensive overview of where and how marijuana is being diverted out of Colorado. At
present, staff is working to identify data sources that can reliably report on marijuana that is diverted
from Colorado to other states. Currently, the best data available on diversion out of the state comes
from the National Seizure System maintained by the El Paso Intelligence Center (EPIC). EPIC is an
organization that provides intelligence and operational support to law enforcement agencies at all
levels. EPIC has a data portal where law enforcement can enter information about drug seizures (among
other things) including state of origin, state of interdiction, and destination state.
Interdiction state is the focus here because that is where the law enforcement impact of the seizure
occurs and the information is the most reliable. The number of seizures reported increased from 2012
(286) to 2015 (768) but then declined, with 608 seizures reported to EPIC in 2017 (Table 28). Law
enforcement agencies in Kansas and Nebraska intercepted 65% of the Colorado‐sourced marijuana
reported to EPIC in 2017, similar to prior years. Seizures used to be almost exclusively of marijuana
flower, with that accounting for 90% of reported seizures in 2012. By 2017, 58% of seizures were for
flower, 26% were for concentrates/hash, and 16% were for edibles (Table 28).
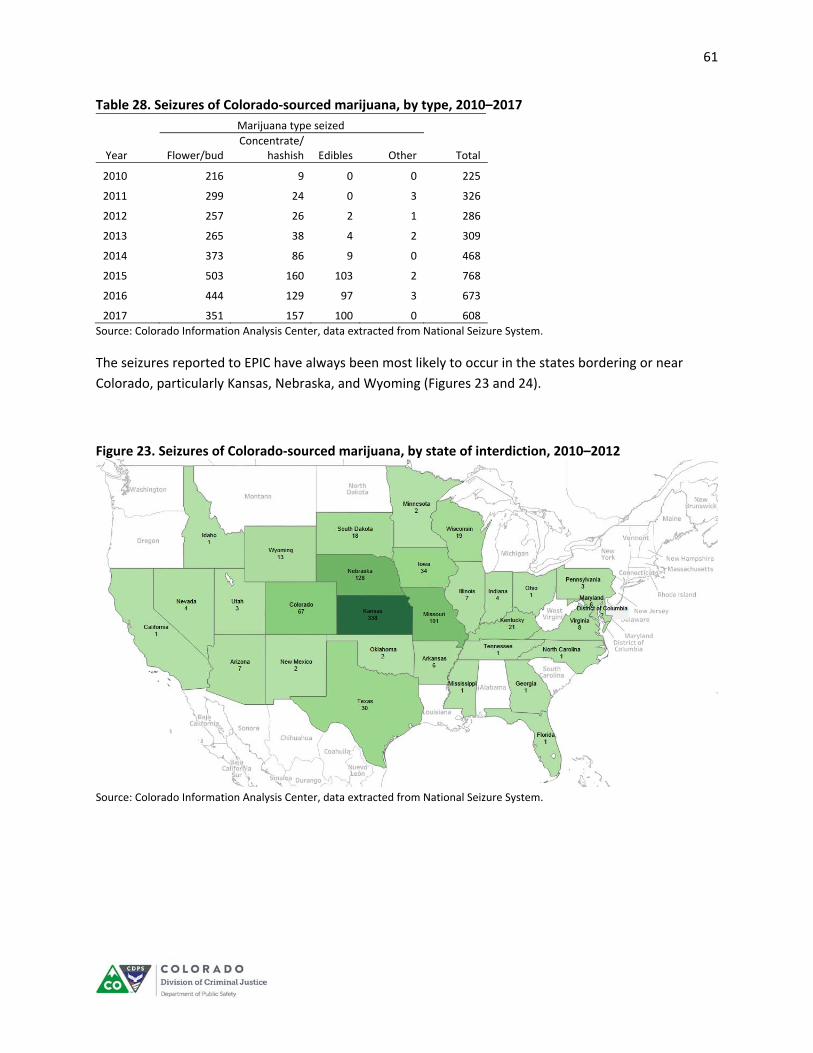
61
Table 28. Seizures of Colorado‐sourced marijuana, by type, 2010–2017
Marijuana type seized
Year Flower/bud Concentrate/
hashish Edibles Other Total
2010 216 9 0 0 225
2011 299 24 0 3 326
2012 257 26 2 1 286
2013 265 38 4 2 309
2014 373 86 9 0 468
2015 503 160 103 2 768
2016 444 129 97 3 673
2017 351 157 100 0 608
Source: Colorado Information Analysis Center, data extracted from National Seizure System.
The seizures reported to EPIC have always been most likely to occur in the states bordering or near
Colorado, particularly Kansas, Nebraska, and Wyoming (Figures 23 and 24).
Figure 23. Seizures of Colorado‐sourced marijuana, by state of interdiction, 2010–2012
Source: Colorado Information Analysis Center, data extracted from National Seizure System.

62
Figure 24. Seizures of Colorado‐sourced marijuana, by state of interdiction, 2013–2017
Source: Colorado Information Analysis Center, data extracted from National Seizure System.
Transfer Using Parcel Services
The United States Postal Inspection Service reported the number of seizures to the Rocky Mountain High
Intensity Drug Trafficking Area (RMHIDTA) organization. Table 29 presents the trend from 2010 through
2017, which indicates regular increases in both the number of parcels and amount of marijuana
products seized.
Table 29. Marijuana Seizures by United States Postal Inspection Service, 2010–2017
Year N parcels
seized Pounds seized
2010 15 57.2
2011 36 68.2
2012 158 262.0
2013 207 493.1
2014 320 469.9
2015 581 1247.0
2016 854 1725.5
2017 1,009 2,001.0
Source: Rocky Mountain High Intensity Drug Trafficking Area (2018). The Legalization of Marijuana in Colorado: The Impact,
Volume 5.
Note: Data provided to RMHIDTA from the United States Postal Inspection Service.

63
SECTION THREE:
IMPACT ON PUBLIC HEALTH AND BEHAVIORAL HEALTH SERVICES
Overview
This section summarizes several sources of data to examine the impact of marijuana legalization on
public health and behavioral health services in Colorado. The Department of Public Health and
Environment (CDPHE) monitors environmental and public health for the state and is statutorily
mandated to measure and report on public health impacts. CDPHE produces a report every two years
that provides an in‐depth understanding of the public health concerns in the state; the next report is
expected in January 2019.
CDPHE is required by statute to monitor marijuana use patterns and potential marijuana adverse health
effects. To this end, CDPHE uses the Behavioral Risk Factor Surveillance System (BRFSS), the National
Survey of Drug Use and Health (NSDUH), a long‐term survey conducted by the Substance Abuse and
Mental Health Services Administration (SAMHSA), and data provided by the Colorado Hospital
Association and the Rocky Mountain Poison and Drug Center.
The American College Health Association administers the National College Health Assessment, an annual
survey of college students that asks a few questions about marijuana. These data are discussed below.
Data provided by the Colorado Department of Human Services, Office of Behavioral Health, inform two
treatment topics in this section. The first focuses on licensed facilities that report treatment admissions
in which marijuana is listed as the client’s primary drug of abuse. The second reviews trends in the
frequency of use by clients in treatment for marijuana abuse.
Adult Usage
Behavioral Risk Factor Surveillance System
The Colorado Behavioral Risk Factor Surveillance System (BRFSS), sponsored by the Centers for Disease
Control and Prevention, is a telephone survey of adults 18 and older that monitors lifestyles and
behaviors related to the leading causes of mortality and morbidity. In recent years, health professionals
and the public have become increasingly aware of how such lifestyle factors as cigarette smoking, being
overweight, sedentary lifestyle, and the nonuse of seat belts contribute to injury, illness, and death.50
In 2014, questions were added to the Colorado BRFSS regarding lifetime and past 30‐day marijuana use,
age of first use, and whether respondents drove after recent use. In 2015, questions were added to
estimate methods and frequency of marijuana use, and respondents’ perception of harm from use. In
2016, the questions about lifetime use and age of first use were removed. By continuing collection of
50 Additional information on the Colorado BRFSS can be accessed at https://www.colorado.gov/pacific/cdphe/adult‐marijuana‐use‐trends.

64
these data over time, CDPHE will be able to monitor any changes in marijuana use patterns among
Colorado adults.
In 2017, the BRFSS survey included 9,802 respondents throughout Colorado. Results were weighted to
represent 4,384,556 Colorado adults 18 years and older. The BRFSS and other sample‐based surveys
employ weights to account for the fact that information is obtained from a sample and used to
represent the larger population. The weights account for sampling design, nonparticipants, and
adjustments in age, sex, education, marital status, home ownership, telephone source (landline or cell
phone), region, and race/ethnicity to match the sample with the population. Some questions were only
asked of those respondents who reported current marijuana use.
Marijuana use remained stable from 2014 to 2016, at 13.5%. In 2017, use significantly increased to
15.5% of Colorado adults reported using marijuana in the past 30 days (Figure 25).
Prevalence of marijuana use differed by age and gender. In 2017, more males reported current (past 30‐
day) use of marijuana (19.8%) than females (11.2%). Current use for males increased significantly from
2016 (16.4%) to 2017 (19.8%), but female use remained stable (Figure 26).
Figure 27 presents trend data for past 30‐day marijuana use stratified by age group. In 2017, past 30‐day
marijuana use among 18‐ to 25‐year‐old respondents (29.2%) was not significantly different from 26‐ to
34‐year‐olds (26.4%). However, both of those age groups reported significantly higher past 30‐day use
compared 35‐ to 64‐year‐olds (12.5%) and those 65 and older (5.6%). There was no significant difference
in reported use for 18‐ to 25‐year‐olds or 35‐ to 64‐year‐olds from 2014 to 2017. However, reported use
for those ages 26 to 34 years significantly increased from 2016 (19.4%) to 2017 (26.4%)
Past 30‐day marijuana use did not significantly differ by race/ethnicity (Figure 28). There were small,
nonsignificant differences between Blacks reporting past 30‐day marijuana use (13.1%) in 2017 and
Whites (16.1%) and Hispanics (14.4%). There was no significant change from 2014 to 2017 among
racial/ethnic groups.
Sexual orientation was related to past 30‐day marijuana use (Figure 29). In 2017, 34.7% of those who
identified their sexual orientation as gay, lesbian, or bisexual reported use in the past 30 days compared
to 14.5% for those who identified as heterosexual. From 2016 to 2017, there was a significant increase
in use among those who identify as gay, lesbian, or bisexual, from 22.5% to 34.7% (Figure 29).
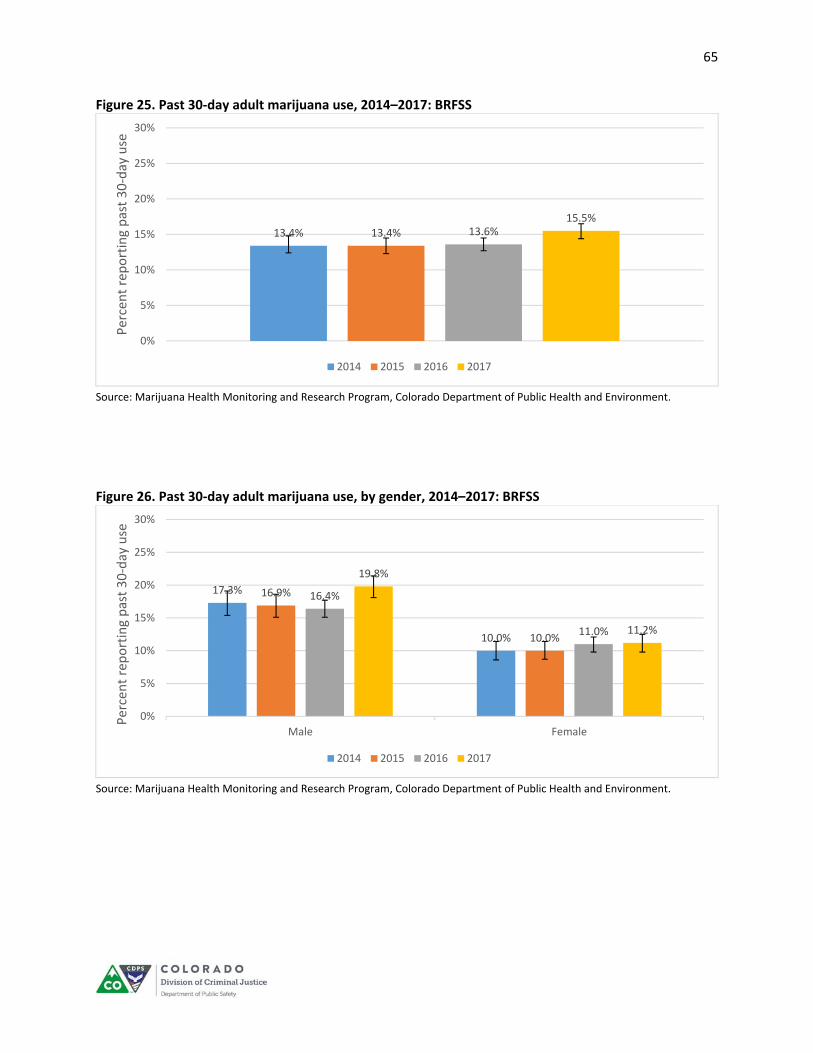
65
Figure 25. Past 30‐day adult marijuana use, 2014–2017: BRFSS
Source: Marijuana Health Monitoring and Research Program, Colorado Department of Public Health and Environment.
Figure 26. Past 30‐day adult marijuana use, by gender, 2014–2017: BRFSS
Source: Marijuana Health Monitoring and Research Program, Colorado Department of Public Health and Environment.
13.4% 13.4% 13.6%15.5%
0%
5%
10%
15%
20%
25%
30%Percent reporting past 30‐day use
2014 2015 2016 2017
17.3%
10.0%
16.9%
10.0%
16.4%
11.0%
19.8%
11.2%
0%
5%
10%
15%
20%
25%
30%
Male Female
Percent reporting past 30‐day use
2014 2015 2016 2017
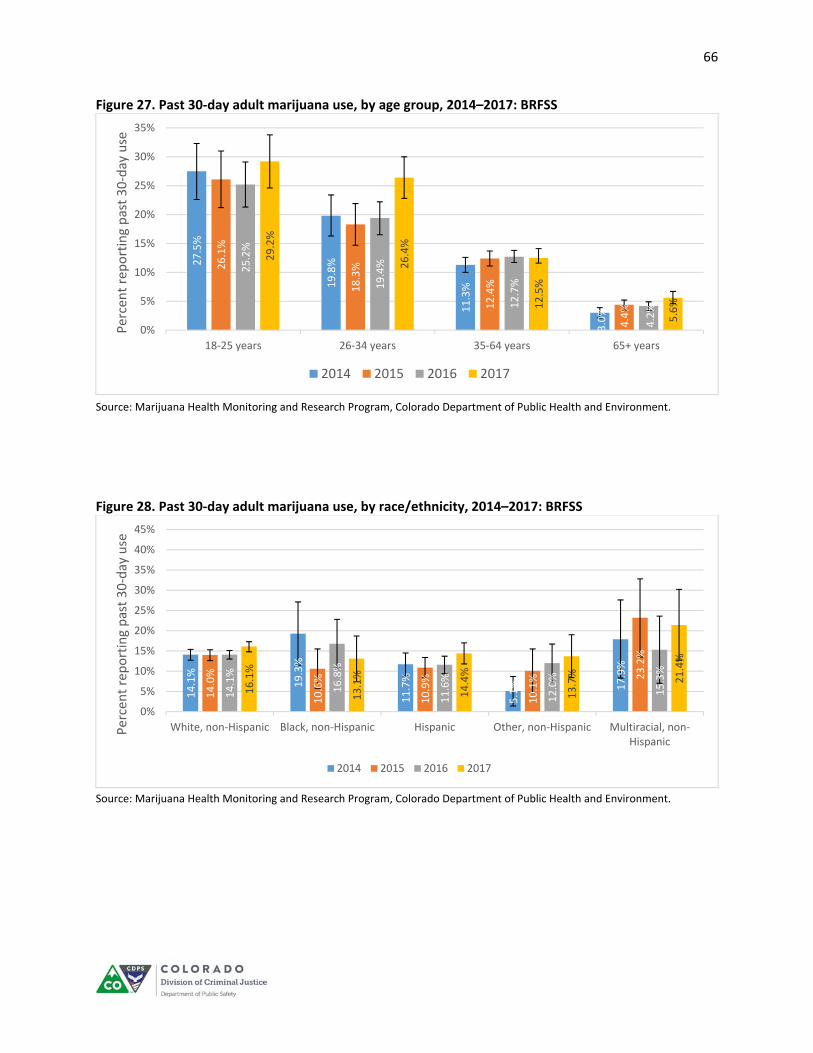
66
Figure 27. Past 30‐day adult marijuana use, by age group, 2014–2017: BRFSS
Source: Marijuana Health Monitoring and Research Program, Colorado Department of Public Health and Environment.
Figure 28. Past 30‐day adult marijuana use, by race/ethnicity, 2014–2017: BRFSS
Source: Marijuana Health Monitoring and Research Program, Colorado Department of Public Health and Environment.
27.5%
19.8%
11.3%
3.0%
26.1%
18.3%
12.4%
4.4%
25.2%
19.4%
12.7%
4.2%
29.2%
26.4%
12.5%
5.6%
0%
5%
10%
15%
20%
25%
30%
35%
18‐25 years 26‐34 years 35‐64 years 65+ years
Percent reporting past 30‐day use
2014 2015 2016 2017
14.1%
19.3%
11.7%
5.1% 17.9%
14.0%
10.6%
10.9%
10.1% 23.2%
14.1%
16.8%
11.6%
12.0%
15.3%
16.1%
13.1%
14.4%
13.7% 21.4%
0%
5%
10%
15%
20%
25%
30%
35%
40%
45%
White, non‐Hispanic Black, non‐Hispanic Hispanic Other, non‐Hispanic Multiracial, non‐Hispanic
Percent reporting past 30‐day use
2014 2015 2016 2017

67
Figure 29. Past 30‐day adult marijuana use, by sexual orientation, 2014–2017: BRFSS
Source: Marijuana Health Monitoring and Research Program, Colorado Department of Public Health and Environment.
The geographic BRFSS marijuana use estimates for Colorado are presented in two ways. Annual data
were grouped into six regions (Figure 31), while county‐level data for 2014 through 2017 were only
available as a four‐year average (Figure 32). The trends within each region from 2014 through 2017 are
presented in Figure 30, and 2017 data are presented in a map in Figure 31. In 2017, the region with the
lowest rate was the Northeast (12.4%) while the highest usage rates were in the Southwest (18.3%)
(Figure 30).
Figure 30. Past 30‐day adult marijuana use by region, 2014–2017: BRFSS
Source: Marijuana Health Monitoring and Research Program, Colorado Department of Public Health and Environment.
13.0%
30.1%
12.4%
36.9%
13.3%
22.5%
14.5%
34.7%
0%
5%
10%
15%
20%
25%
30%
35%
40%
45%
Heterosexual Gay, lesbian, bisexual, or other
Percent reporting past 30‐day use
2014 2015 2016 2017
15.1%
11.8%
10.3%
11.7%
11.2%
13.8%
13.5%
11.2% 16.0%
13.2%
12.2% 17.1%
13.9%
10.6% 15.6%
12.7%
15.6%
17.1%
16.7%
12.4%
15.4%
13.9%
13.5% 18.3%
0%
5%
10%
15%
20%
25%
Denver‐Boulder Northeast Northwest South Central Southeast Southwest
Percent reporting past 30‐day use
Region
2014 2015 2016 2017

68
Figure 31. Past 30‐day adult marijuana use, 2017: BRFSS
12.4% 18.3%
Source: Marijuana Health Monitoring and Research Program, Colorado Department of Public Health and Environment.
County‐level estimates of past 30‐day marijuana use are presented in Figure 32. Due to the relatively
small number of responses in each county, the results are combined for the four‐year period from 2014
to 2017. The counties with the three highest past 30‐day marijuana use were Ouray (28.3%), La Plata
(25.1%), and Pitkin (24.5%). The counties with the lowest past 30‐day marijuana use were Philips (0.0%),
Baca (2.5%), and Kit Carson (4.4%).
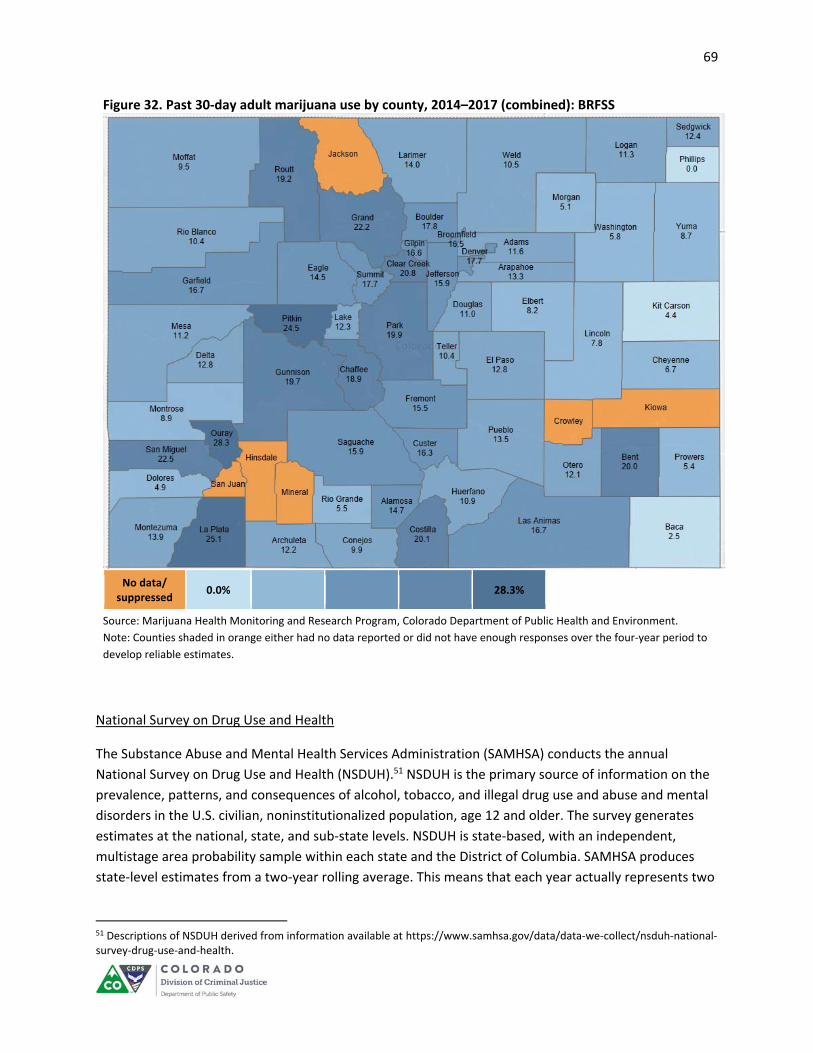
69
Figure 32. Past 30‐day adult marijuana use by county, 2014–2017 (combined): BRFSS
No data/
suppressed 0.0% 28.3%
Source: Marijuana Health Monitoring and Research Program, Colorado Department of Public Health and Environment.
Note: Counties shaded in orange either had no data reported or did not have enough responses over the four‐year period to
develop reliable estimates.
National Survey on Drug Use and Health
The Substance Abuse and Mental Health Services Administration (SAMHSA) conducts the annual
National Survey on Drug Use and Health (NSDUH).51 NSDUH is the primary source of information on the
prevalence, patterns, and consequences of alcohol, tobacco, and illegal drug use and abuse and mental
disorders in the U.S. civilian, noninstitutionalized population, age 12 and older. The survey generates
estimates at the national, state, and sub‐state levels. NSDUH is state‐based, with an independent,
multistage area probability sample within each state and the District of Columbia. SAMHSA produces
state‐level estimates from a two‐year rolling average. This means that each year actually represents two
51 Descriptions of NSDUH derived from information available at https://www.samhsa.gov/data/data‐we‐collect/nsduh‐national‐survey‐drug‐use‐and‐health.
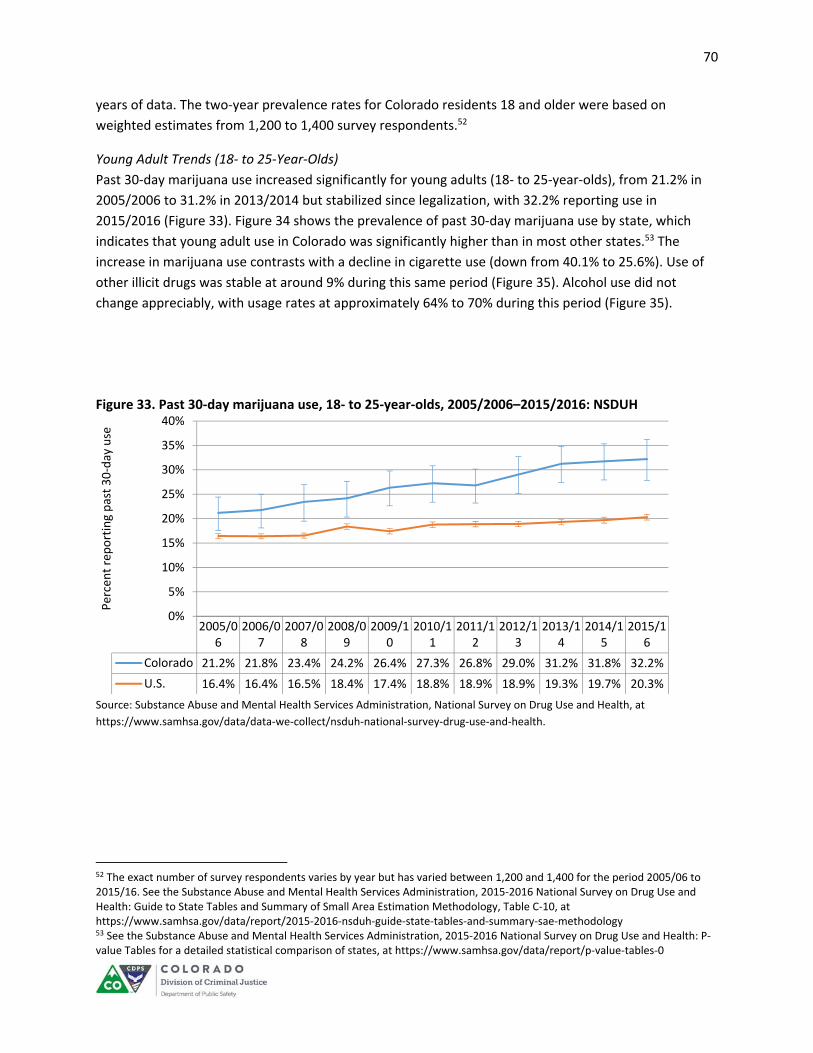
70
years of data. The two‐year prevalence rates for Colorado residents 18 and older were based on
weighted estimates from 1,200 to 1,400 survey respondents.52
Young Adult Trends (18‐ to 25‐Year‐Olds)
Past 30‐day marijuana use increased significantly for young adults (18‐ to 25‐year‐olds), from 21.2% in
2005/2006 to 31.2% in 2013/2014 but stabilized since legalization, with 32.2% reporting use in
2015/2016 (Figure 33). Figure 34 shows the prevalence of past 30‐day marijuana use by state, which
indicates that young adult use in Colorado was significantly higher than in most other states.53 The
increase in marijuana use contrasts with a decline in cigarette use (down from 40.1% to 25.6%). Use of
other illicit drugs was stable at around 9% during this same period (Figure 35). Alcohol use did not
change appreciably, with usage rates at approximately 64% to 70% during this period (Figure 35).
Figure 33. Past 30‐day marijuana use, 18‐ to 25‐year‐olds, 2005/2006–2015/2016: NSDUH
Source: Substance Abuse and Mental Health Services Administration, National Survey on Drug Use and Health, at https://www.samhsa.gov/data/data‐we‐collect/nsduh‐national‐survey‐drug‐use‐and‐health.
52 The exact number of survey respondents varies by year but has varied between 1,200 and 1,400 for the period 2005/06 to 2015/16. See the Substance Abuse and Mental Health Services Administration, 2015‐2016 National Survey on Drug Use and Health: Guide to State Tables and Summary of Small Area Estimation Methodology, Table C‐10, at https://www.samhsa.gov/data/report/2015‐2016‐nsduh‐guide‐state‐tables‐and‐summary‐sae‐methodology 53 See the Substance Abuse and Mental Health Services Administration, 2015‐2016 National Survey on Drug Use and Health: P‐value Tables for a detailed statistical comparison of states, at https://www.samhsa.gov/data/report/p‐value‐tables‐0
2005/06
2006/07
2007/08
2008/09
2009/10
2010/11
2011/12
2012/13
2013/14
2014/15
2015/16
Colorado 21.2% 21.8% 23.4% 24.2% 26.4% 27.3% 26.8% 29.0% 31.2% 31.8% 32.2%
U.S. 16.4% 16.4% 16.5% 18.4% 17.4% 18.8% 18.9% 18.9% 19.3% 19.7% 20.3%
0%
5%
10%
15%
20%
25%
30%
35%
40%
Percent reporting past 30‐day use

71
Figure 34. Past 30‐day marijuana use, 18‐ to 25‐year‐olds, by state, 2015/2016
Source: Substance Abuse and Mental Health Services Administration (2018), National Survey on Drug Use
and Health, 2015‐16 National Survey on Drug Use and Health National Maps of Prevalence Estimates, by State. See
https://www.samhsa.gov/data/sites/default/files/NSDUHsaeMaps2016/NSDUHsaeMaps2016.pdf
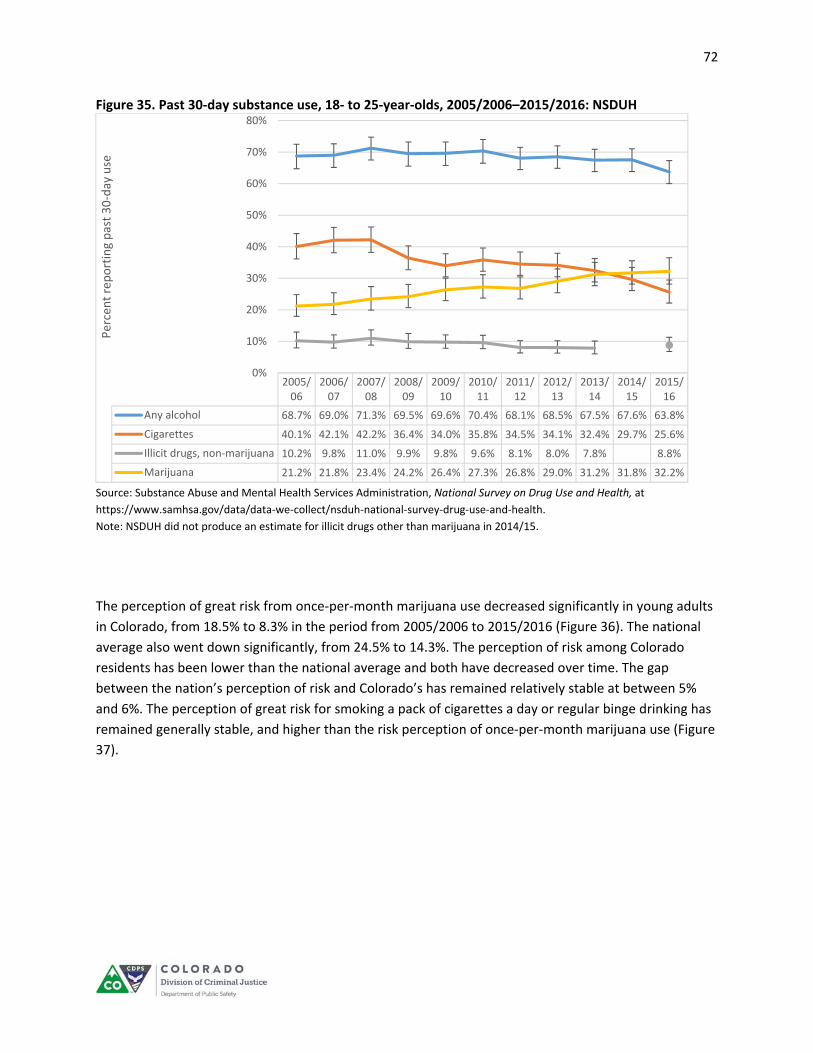
72
Figure 35. Past 30‐day substance use, 18‐ to 25‐year‐olds, 2005/2006–2015/2016: NSDUH
Source: Substance Abuse and Mental Health Services Administration, National Survey on Drug Use and Health, at
https://www.samhsa.gov/data/data‐we‐collect/nsduh‐national‐survey‐drug‐use‐and‐health.
Note: NSDUH did not produce an estimate for illicit drugs other than marijuana in 2014/15.
The perception of great risk from once‐per‐month marijuana use decreased significantly in young adults
in Colorado, from 18.5% to 8.3% in the period from 2005/2006 to 2015/2016 (Figure 36). The national
average also went down significantly, from 24.5% to 14.3%. The perception of risk among Colorado
residents has been lower than the national average and both have decreased over time. The gap
between the nation’s perception of risk and Colorado’s has remained relatively stable at between 5%
and 6%. The perception of great risk for smoking a pack of cigarettes a day or regular binge drinking has
remained generally stable, and higher than the risk perception of once‐per‐month marijuana use (Figure
37).
2005/06
2006/07
2007/08
2008/09
2009/10
2010/11
2011/12
2012/13
2013/14
2014/15
2015/16
Any alcohol 68.7% 69.0% 71.3% 69.5% 69.6% 70.4% 68.1% 68.5% 67.5% 67.6% 63.8%
Cigarettes 40.1% 42.1% 42.2% 36.4% 34.0% 35.8% 34.5% 34.1% 32.4% 29.7% 25.6%
Illicit drugs, non‐marijuana 10.2% 9.8% 11.0% 9.9% 9.8% 9.6% 8.1% 8.0% 7.8% 8.8%
Marijuana 21.2% 21.8% 23.4% 24.2% 26.4% 27.3% 26.8% 29.0% 31.2% 31.8% 32.2%
0%
10%
20%
30%
40%
50%
60%
70%
80%Percent reporting past 30‐day use

73
Figure 36. Perception of great risk for using marijuana once a month, 18‐ to 25‐year‐olds, 2005/2006–2015/2016: NSDUH
Source: Substance Abuse and Mental Health Services Administration, National Survey on Drug Use and Health, at https://www.samhsa.gov/data/data‐we‐collect/nsduh‐national‐survey‐drug‐use‐and‐health
Figure 37. Perception of great risk for using various substances, 18‐ to 25‐year‐olds, 2005/2006–2015/2016: NSDUH
Source: Substance Abuse and Mental Health Services Administration, National Survey on Drug Use and Health, at
https://www.samhsa.gov/data/data‐we‐collect/nsduh‐national‐survey‐drug‐use‐and‐health.
2005/06 2006/07 2007/08 2008/09 2009/10 2010/11 2011/12 2012/13 2013/14 2015/16
Colorado 18.5% 17.1% 16.2% 14.9% 13.2% 10.9% 11.7% 10.7% 8.4% 8.3%
United States 24.5% 24.6% 23.7% 21.3% 19.2% 18.3% 17.4% 15.8% 14.2% 14.3%
0%
5%
10%
15%
20%
25%
30%
35%
40%
45%
50%
Percent reporting "great risk" of beh
avior
2005/06
2006/07
2007/08
2008/09
2009/10
2010/11
2011/12
2012/13
2013/14
2015/16
Drinking 5+ drinks a couple oftimes a week
29.7% 25.6% 26.1% 29.9% 28.8% 27.7% 28.7% 26.9% 26.1% 32.1%
Smoking a pack of cigarettes perday
71.7% 71.0% 69.5% 67.0% 66.4% 65.2% 64.9% 66.5% 66.6% 67.1%
Smoking marijuana once a month 18.5% 17.1% 16.2% 14.9% 13.2% 10.9% 11.7% 10.7% 8.4% 8.3%
0%
10%
20%
30%
40%
50%
60%
70%
80%
Percent reporting "great risk" of beh
avior
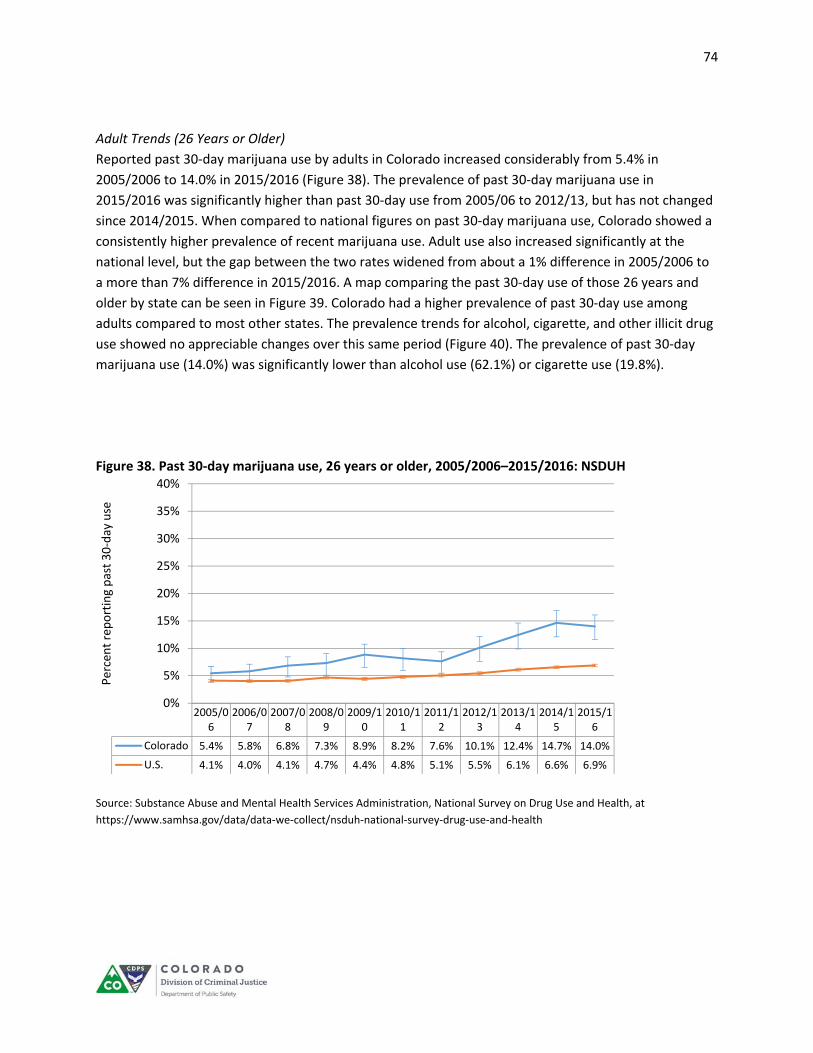
74
Adult Trends (26 Years or Older)
Reported past 30‐day marijuana use by adults in Colorado increased considerably from 5.4% in
2005/2006 to 14.0% in 2015/2016 (Figure 38). The prevalence of past 30‐day marijuana use in
2015/2016 was significantly higher than past 30‐day use from 2005/06 to 2012/13, but has not changed
since 2014/2015. When compared to national figures on past 30‐day marijuana use, Colorado showed a
consistently higher prevalence of recent marijuana use. Adult use also increased significantly at the
national level, but the gap between the two rates widened from about a 1% difference in 2005/2006 to
a more than 7% difference in 2015/2016. A map comparing the past 30‐day use of those 26 years and
older by state can be seen in Figure 39. Colorado had a higher prevalence of past 30‐day use among
adults compared to most other states. The prevalence trends for alcohol, cigarette, and other illicit drug
use showed no appreciable changes over this same period (Figure 40). The prevalence of past 30‐day
marijuana use (14.0%) was significantly lower than alcohol use (62.1%) or cigarette use (19.8%).
Figure 38. Past 30‐day marijuana use, 26 years or older, 2005/2006–2015/2016: NSDUH
Source: Substance Abuse and Mental Health Services Administration, National Survey on Drug Use and Health, at
https://www.samhsa.gov/data/data‐we‐collect/nsduh‐national‐survey‐drug‐use‐and‐health
2005/06
2006/07
2007/08
2008/09
2009/10
2010/11
2011/12
2012/13
2013/14
2014/15
2015/16
Colorado 5.4% 5.8% 6.8% 7.3% 8.9% 8.2% 7.6% 10.1% 12.4% 14.7% 14.0%
U.S. 4.1% 4.0% 4.1% 4.7% 4.4% 4.8% 5.1% 5.5% 6.1% 6.6% 6.9%
0%
5%
10%
15%
20%
25%
30%
35%
40%
Percent reporting past 30‐day use

75
Figure 39. Past 30‐day marijuana use, 26 years or older, by state, 2015/2016: NSDUH
Source: Substance Abuse and Mental Health Services Administration (2018), National Survey on Drug Use and Health, 2015‐16 National Survey on Drug Use and Health National Maps of Prevalence Estimates, by State. See https://www.samhsa.gov/data/sites/default/files/NSDUHsaeMaps2016/NSDUHsaeMaps2016.pdf
Figure 40. Past 30‐day substance use, 26 years or older, 2005/2006–2015/2016: NSDUH
Source: Substance Abuse and Mental Health Services Administration, National Survey on Drug Use and Health, at https://www.samhsa.gov/data/data‐we‐collect/nsduh‐national‐survey‐drug‐use‐and‐health Note: NSDUH did not produce an estimate for illicit drugs other than marijuana in 2014/15.
2005/06
2006/07
2007/08
2008/09
2009/10
2010/11
2011/12
2012/13
2013/14
2014/15
2015/16
Any alcohol 62.2% 63.8% 66.0% 66.1% 66.9% 65.4% 63.2% 65.5% 66.2% 63.4% 62.1%
Cigarettes 20.6% 23.0% 24.2% 21.5% 20.4% 21.5% 22.7% 20.9% 19.3% 19.8% 19.8%
Illicit drugs, non‐marijuana 3.0% 3.5% 3.4% 2.5% 3.2% 2.9% 2.8% 3.3% 3.7% 3.1%
Marijuana 5.4% 5.8% 6.8% 7.3% 8.9% 8.2% 7.6% 10.1% 12.4% 14.7% 14.0%
0%
10%
20%
30%
40%
50%
60%
70%
80%
Percent reporting past 30‐day use

76
The perceived risk by adults from using marijuana once a month showed a significant decrease in
Colorado, from 32.8% in 2005/2006 to 18.9% in 2015/2016 (Figure 41). The perception of great risk at
the national level also decreased significantly, from 42.0% in 2005/2006 to 30.9% in 2015/2016. The gap
between the nation’s perception of risk and Colorado’s has remained relatively stable over time. The
perception of great risk for smoking a pack of cigarettes a day or regular binge drinking remained stable
(Figure 42).
Figure 41. Perception of great risk for using marijuana once a month, 26 years or older, 2005/2006–2015/2016: NSDUH
Source: Substance Abuse and Mental Health Services Administration, National Survey on Drug Use and Health, at
https://www.samhsa.gov/data/data‐we‐collect/nsduh‐national‐survey‐drug‐use‐and‐health.
2005/06 2006/07 2007/08 2008/09 2009/10 2010/11 2011/12 2012/13 2013/14 2015/16
Colorado 32.8% 30.5% 30.7% 28.9% 23.8% 22.7% 26.5% 24.2% 19.8% 18.9%
U.S. 42.0% 41.9% 40.6% 38.7% 36.5% 35.2% 34.4% 32.4% 30.1% 30.9%
0%
5%
10%
15%
20%
25%
30%
35%
40%
45%
50%
Percent reporting "great risk" of behavior
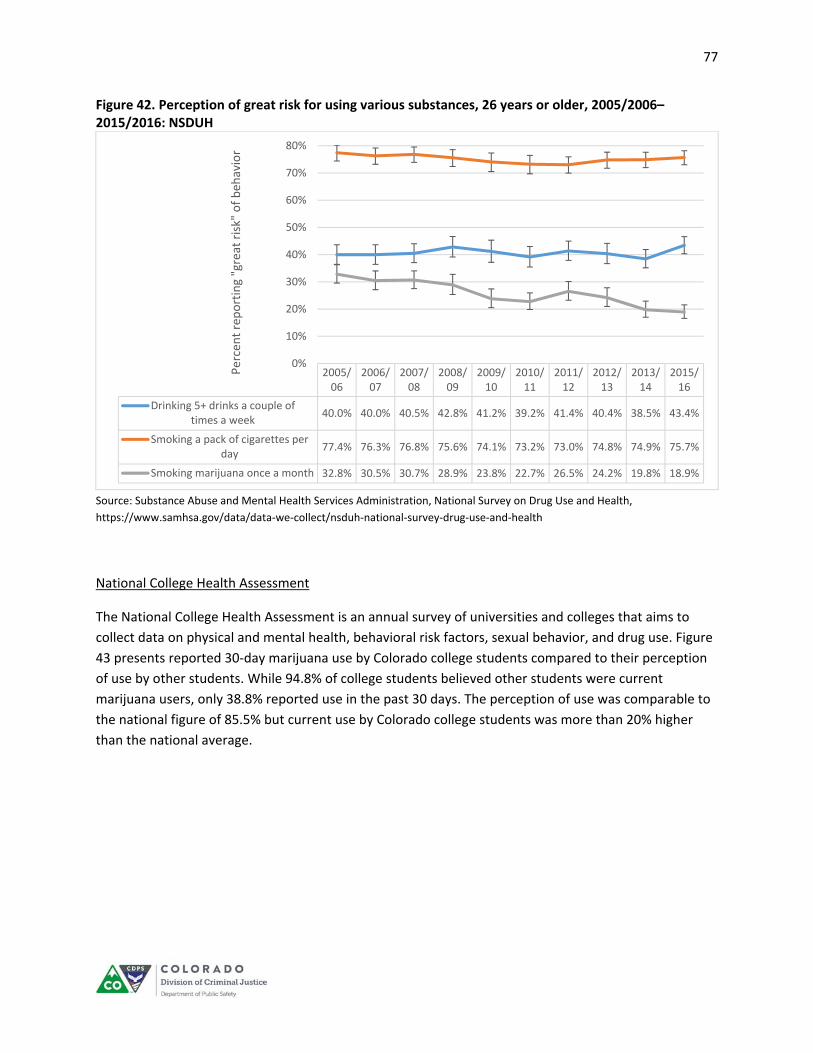
77
Figure 42. Perception of great risk for using various substances, 26 years or older, 2005/2006–2015/2016: NSDUH
Source: Substance Abuse and Mental Health Services Administration, National Survey on Drug Use and Health,
https://www.samhsa.gov/data/data‐we‐collect/nsduh‐national‐survey‐drug‐use‐and‐health
National College Health Assessment
The National College Health Assessment is an annual survey of universities and colleges that aims to
collect data on physical and mental health, behavioral risk factors, sexual behavior, and drug use. Figure
43 presents reported 30‐day marijuana use by Colorado college students compared to their perception
of use by other students. While 94.8% of college students believed other students were current
marijuana users, only 38.8% reported use in the past 30 days. The perception of use was comparable to
the national figure of 85.5% but current use by Colorado college students was more than 20% higher
than the national average.
2005/06
2006/07
2007/08
2008/09
2009/10
2010/11
2011/12
2012/13
2013/14
2015/16
Drinking 5+ drinks a couple oftimes a week
40.0% 40.0% 40.5% 42.8% 41.2% 39.2% 41.4% 40.4% 38.5% 43.4%
Smoking a pack of cigarettes perday
77.4% 76.3% 76.8% 75.6% 74.1% 73.2% 73.0% 74.8% 74.9% 75.7%
Smoking marijuana once a month 32.8% 30.5% 30.7% 28.9% 23.8% 22.7% 26.5% 24.2% 19.8% 18.9%
0%
10%
20%
30%
40%
50%
60%
70%
80%
Percent reporting "great risk" of beh
avior

78
Figure 43. Reported past 30‐day marijuana use compared to perceived use by college students, 2017 (Colorado) and 2016 (National)
Source: Coalition of Colorado Campus Alcohol and Drug Educators (2017), National College Health Assessment survey.
Hospitalizations and Emergency Department Visits
CDPHE analyzed data provided by the Colorado Hospital Association (CHA) and categorized
hospitalizations and emergency department visits for possibly marijuana involvement. The International
Classification of Diseases, Clinical Modification, Volume 9 (ICD‐9‐CM) discharge diagnosis codes were
used to determine possible marijuana involvement from January 2000‐September 2015. The revised
International Classification of Diseases, Clinical Modification, Volume 10 (ICD‐10‐CM) discharge
diagnosis coding system was used from October 2015‐December 2016. Due to changes in coding
systems, variable structures, and policies at CHA, the marijuana numbers for 2016 are considered by
CDPHE to be preliminary. CDPHE is exercising caution in the interpretation of these data during this
coding transition. Final interpretations of results were not expected until October 2018, at which time
they will be made publicly available on CDPHE's website. Use of these codes does not mean that the
encounter was motivated by marijuana exposure, but simply that it was a possibility.
The four ICD‐9‐CM codes used are: 305.2‐Marijuana (Cannabis Abuse); 304.3‐Marijuana (Cannabis
Dependence); 969.6‐Poisoning by psychodysleptics (hallucinogens); and E854.1‐Accidental poisoning by
psychodysleptics (hallucinogens). For the purposes of 969.6 and E854.1, hallucinogens can include
cannabis, LSD, mescaline, and psilocybin (mushrooms). There are 53 separate codes for cannabis events
94.8%
85.5%
38.8%
18.4%
0%
10%
20%
30%
40%
50%
60%
70%
80%
90%
100%
Colorado (2017) National (2016)
Percent reporting past 30‐day use or perception of use
Perceived Actual

79
in the ICD‐10‐CM coding system. All ICD‐10‐CM codes are specific to cannabis and include cannabis
poisonings, use, abuse, and dependence. Inclusion of at least one marijuana related ICD‐9/10‐CM code
in the up to 30 listed discharge diagnosis codes qualified the encounter as a possible marijuana
exposure, diagnosis, or simply a billing code.
The findings presented in Figure 44 reflect four different eras of legalization in Colorado. In 2000 (prior
to medical legalization), the rate was 575 hospitalizations with possible marijuana indications per
100,000 hospitalizations. This increased significantly during the era when medical marijuana was
legalized but not commercialized (2001–2009), rising to 803 such hospitalizations per 100,000. The era
of medical marijuana commercialization (2010–2013) reflected another significant jump, to 1,440 per
100,000 hospitalizations. The era of retail commercialization (2014–September 2015) again showed
another significant increase, to 2,696 possible marijuana‐related hospitalizations per 100,000.54 The
period from October 2015‐December 2015 indicated another increase, but caution should be used in
interpreting these results due to the changes in coding schemes.
Figure 44. Rates of hospitalizations with possible marijuana exposures, diagnoses, or billing codes per 100,000 hospitalizations, by legalization eras in Colorado
Source: Data provided by Colorado Hospital Association with analysis provided by Colorado Department of Public Health and Environment, Marijuana Health Monitoring Program. Notes: (1) An individual can be represented more than once in the data; therefore, the rate is hospitalizations with marijuana codes per 100,000 total hospitalizations. (2) The period from October 2015 onward should be interpreted with caution due to the changes in coding schemes.
54 Updated data for emergency department visits and hospitalizations will be released after publication of this report, along
with the comprehensive update of the Monitoring Health Concerns Related to Marijuana in Colorado report. See https://www.colorado.gov/pacific/cdphe/marijuana‐health‐report for additional information and updates.
575
803
1,440
2,696
3,3393,517
0
500
1,000
1,500
2,000
2,500
3,000
3,500
4,000
2000 2001‐2009 2010‐2013 2014‐Sept 2015 Oct‐Dec 2015 2016
Rate per 100,000 events
Hospitalizations
ICD‐9‐CM Coding ICD‐10‐CM Coding
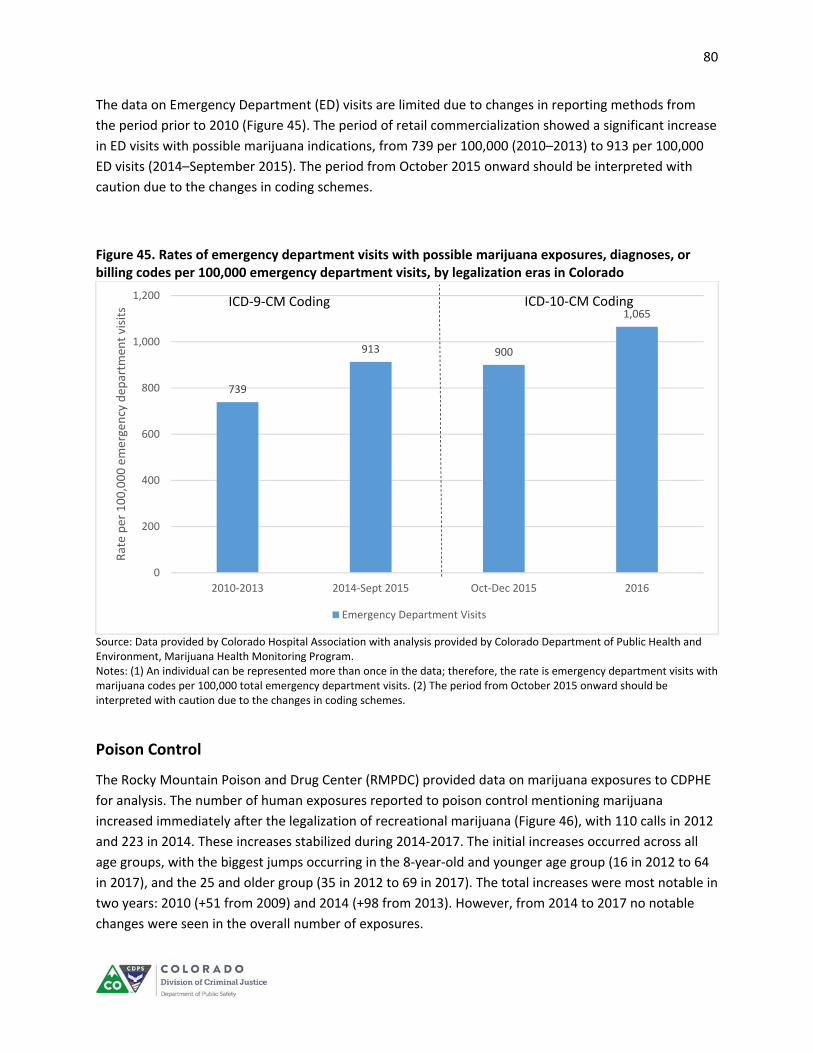
80
The data on Emergency Department (ED) visits are limited due to changes in reporting methods from
the period prior to 2010 (Figure 45). The period of retail commercialization showed a significant increase
in ED visits with possible marijuana indications, from 739 per 100,000 (2010–2013) to 913 per 100,000
ED visits (2014–September 2015). The period from October 2015 onward should be interpreted with
caution due to the changes in coding schemes.
Figure 45. Rates of emergency department visits with possible marijuana exposures, diagnoses, or billing codes per 100,000 emergency department visits, by legalization eras in Colorado
Source: Data provided by Colorado Hospital Association with analysis provided by Colorado Department of Public Health and Environment, Marijuana Health Monitoring Program. Notes: (1) An individual can be represented more than once in the data; therefore, the rate is emergency department visits with marijuana codes per 100,000 total emergency department visits. (2) The period from October 2015 onward should be interpreted with caution due to the changes in coding schemes.
Poison Control
The Rocky Mountain Poison and Drug Center (RMPDC) provided data on marijuana exposures to CDPHE
for analysis. The number of human exposures reported to poison control mentioning marijuana
increased immediately after the legalization of recreational marijuana (Figure 46), with 110 calls in 2012
and 223 in 2014. These increases stabilized during 2014‐2017. The initial increases occurred across all
age groups, with the biggest jumps occurring in the 8‐year‐old and younger age group (16 in 2012 to 64
in 2017), and the 25 and older group (35 in 2012 to 69 in 2017). The total increases were most notable in
two years: 2010 (+51 from 2009) and 2014 (+98 from 2013). However, from 2014 to 2017 no notable
changes were seen in the overall number of exposures.
739
913 900
1,065
0
200
400
600
800
1,000
1,200
2010‐2013 2014‐Sept 2015 Oct‐Dec 2015 2016
Rate per 100,000 emergency dep
artm
ent visits
Emergency Department Visits
ICD‐9‐CM Coding ICD‐10‐CM Coding
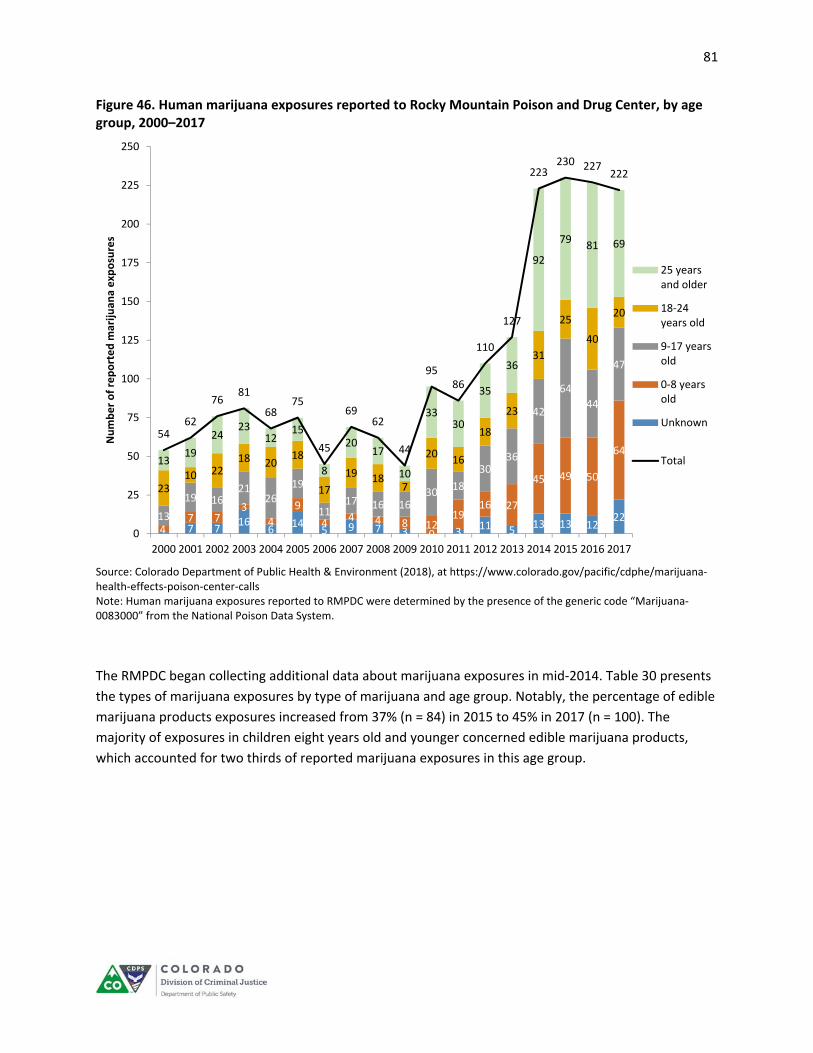
81
Figure 46. Human marijuana exposures reported to Rocky Mountain Poison and Drug Center, by age group, 2000–2017
Source: Colorado Department of Public Health & Environment (2018), at https://www.colorado.gov/pacific/cdphe/marijuana‐health‐effects‐poison‐center‐calls Note: Human marijuana exposures reported to RMPDC were determined by the presence of the generic code “Marijuana‐0083000” from the National Poison Data System.
The RMPDC began collecting additional data about marijuana exposures in mid‐2014. Table 30 presents
the types of marijuana exposures by type of marijuana and age group. Notably, the percentage of edible
marijuana products exposures increased from 37% (n = 84) in 2015 to 45% in 2017 (n = 100). The
majority of exposures in children eight years old and younger concerned edible marijuana products,
which accounted for two thirds of reported marijuana exposures in this age group.
7 716
614
5 9 7 3 0 311 5
13 13 1222
47 7
34
9
44 4 8 12
1916 27
45 49 50
64
13
19 1621
2619
1117 16 16
3018
3036
42
64
44
47
2310 22
18 2018
17
19 187
2016
18
23
31
25
40
20
1319
2423
1215
8
2017
10
3330
35
36
92
7981 69
5462
7681
6875
45
6962
44
9586
110
127
223230 227
222
0
25
50
75
100
125
150
175
200
225
250
2000 2001 2002 2003 2004 2005 2006 2007 2008 2009 2010 2011 2012 2013 2014 2015 2016 2017
Number of reported m
arijuan
a exp
osures
25 yearsand older
18‐24years old
9‐17 yearsold
0‐8 yearsold
Unknown
Total

82
Table 30. Human marijuana exposures reported to Rocky Mountain Poison and Drug Center, by age group and marijuana type, 2015‐2017
Percent of each marijuana type
Age group Total
reports Smokeable Marijuana
Edible Marijuana
Other Marijuana Cannabidiol
All ages
2015 230 54.8% 36.5% 8.3% 0.4%
2016 227 52.0% 37.4% 8.8% 1.8%
2017 222 38.7% 45.0% 14.0% 2.3%
0 to 8 years old
2015 49 40.8% 51.0% 8.2% 0.0%
2016 50 30.0% 62.0% 8.0% 0.0%
2017 64 23.4% 65.6% 10.9% 0.0%
2015 64 64.1% 28.1% 6.3% 1.6%
2016 44 61.4% 31.8% 4.5% 2.3%
2017 47 59.6% 27.7% 12.8% 0.0%
2015 25 68.0% 28.0% 4.0% 0.0%
2016 40 60.0% 30.0% 7.5% 2.5%
2017 20 35.0% 20.0% 45.0% 0.0%
2015 79 54.4% 32.9% 12.7% 0.0%
2016 81 54.3% 29.6% 13.6% 2.5%
2017 69 39.1% 43.5% 10.1% 7.2%
Source: Colorado Department of Public Health and Environment (2018), at https://www.colorado.gov/pacific/cdphe/marijuana‐health‐effects‐poison‐center‐calls Note: The data on specific type of marijuana were not collected until July 2014, consequently the information in this table only covers the period from 2015‐2017.
Treatment Trends
The Colorado Department of Human Services, Office of Behavioral Health (OBH), is required to collect
and report substance use treatment data from licensed providers as a requirement of SAMHSA
(Substance Abuse and Mental Health Service Administration) funding. The data are entered into OBH’s
Drug/Alcohol Coordinated Data System (DACODS) and are the source of the information provided
below. These data include the top three drugs of abuse, demographic characteristics, referral source,
referral reason, time in treatment, client residence, and more.
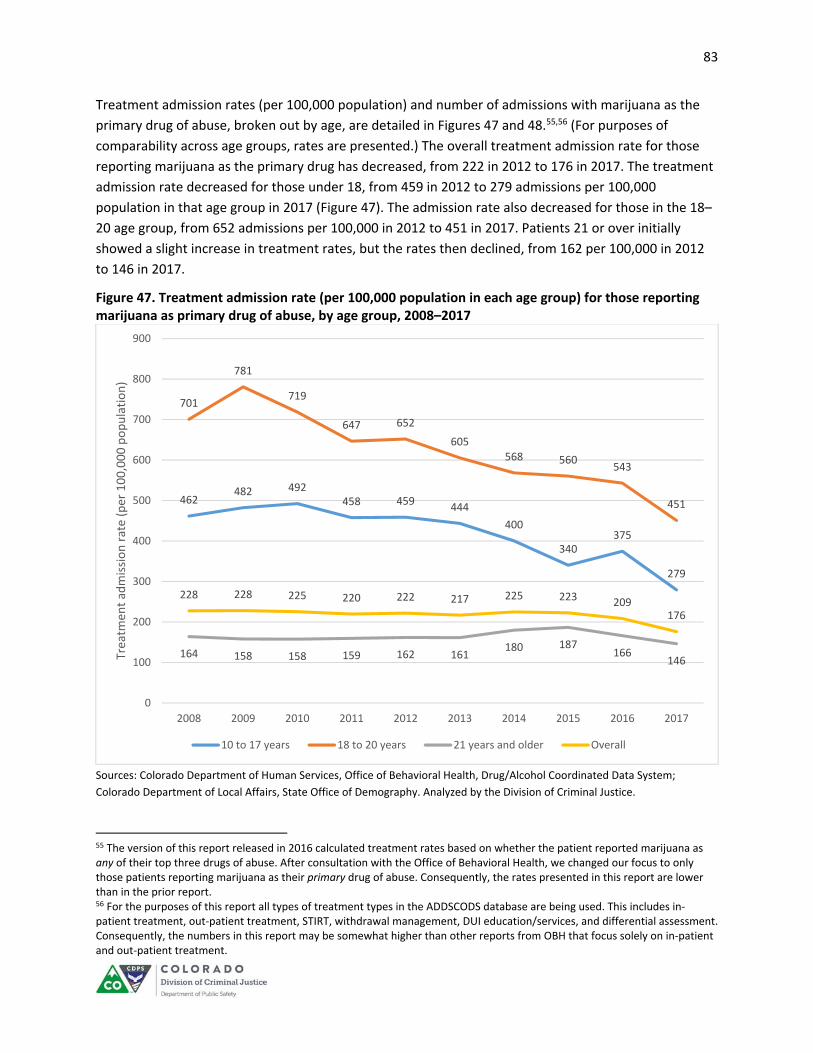
83
Treatment admission rates (per 100,000 population) and number of admissions with marijuana as the
primary drug of abuse, broken out by age, are detailed in Figures 47 and 48.55,56 (For purposes of
comparability across age groups, rates are presented.) The overall treatment admission rate for those
reporting marijuana as the primary drug has decreased, from 222 in 2012 to 176 in 2017. The treatment
admission rate decreased for those under 18, from 459 in 2012 to 279 admissions per 100,000
population in that age group in 2017 (Figure 47). The admission rate also decreased for those in the 18–
20 age group, from 652 admissions per 100,000 in 2012 to 451 in 2017. Patients 21 or over initially
showed a slight increase in treatment rates, but the rates then declined, from 162 per 100,000 in 2012
to 146 in 2017.
Figure 47. Treatment admission rate (per 100,000 population in each age group) for those reporting marijuana as primary drug of abuse, by age group, 2008–2017
Sources: Colorado Department of Human Services, Office of Behavioral Health, Drug/Alcohol Coordinated Data System;
Colorado Department of Local Affairs, State Office of Demography. Analyzed by the Division of Criminal Justice.
55 The version of this report released in 2016 calculated treatment rates based on whether the patient reported marijuana as any of their top three drugs of abuse. After consultation with the Office of Behavioral Health, we changed our focus to only those patients reporting marijuana as their primary drug of abuse. Consequently, the rates presented in this report are lower than in the prior report. 56 For the purposes of this report all types of treatment types in the ADDSCODS database are being used. This includes in‐patient treatment, out‐patient treatment, STIRT, withdrawal management, DUI education/services, and differential assessment. Consequently, the numbers in this report may be somewhat higher than other reports from OBH that focus solely on in‐patient and out‐patient treatment.
462482 492
458 459444
400
340375
279
701
781
719
647 652
605
568 560543
451
164 158 158 159 162 161180 187
166146
228 228 225 220 222 217 225 223 209176
0
100
200
300
400
500
600
700
800
900
2008 2009 2010 2011 2012 2013 2014 2015 2016 2017
Treatm
ent ad
mission rate (per 100,000 population)
10 to 17 years 18 to 20 years 21 years and older Overall

84
Figure 48. Number of treatment admissions reporting marijuana as primary drug of abuse, by age group, 2008–2017
Source: Colorado Department of Human Services, Office of Behavioral Health, Drug/Alcohol Coordinated Data System. Analyzed
by the Division of Criminal Justice.
2,443 2,563 2,634 2,468 2,495 2,444 2,2391,938
2,1641,6371,466 1,629 1,503 1,403 1,446 1,359 1,272 1,261 1,235 1,042
5,716 5,613 5,693 5,857 6,047 6,143
6,9907,413
6,736
6,051
9617 9790 9819 97289988 9946
10501 1061210135
8730
0
2,000
4,000
6,000
8,000
10,000
12,000
2008 2009 2010 2011 2012 2013 2014 2015 2016 2017
N treatmen
t ad
missions
10 to 17 years 18 to 20 years 21 years and older Overall

85
Marijuana was reported as the primary drug of abuse by 71.8% of youth under the age of 18 who were
admitted for treatment in 2017 (Figure 49). This contrasts with 22.9% of 18‐ to 20‐year‐olds and 6.1% of
adults 21 years or older.
Figure 49. Percent of treatment admissions with marijuana reported as the primary drug of abuse, by age group, 2008–2017
Source: Colorado Department of Human Services, Office of Behavioral Health, Drug/Alcohol Coordinated Data System. Analyzed
by the Division of Criminal Justice.
61.6% 63.1%66.7% 67.1% 66.5% 67.9% 68.5% 69.4% 68.9%
71.8%
16.6% 18.1% 19.2% 18.8% 19.1% 20.1% 20.3%23.0% 24.2% 22.9%
4.9% 4.9% 5.6% 5.5% 5.5% 5.6% 6.0% 6.4% 6.0% 6.1%
7.41% 7.63% 8.61% 8.33% 8.23% 8.28% 8.38% 8.56% 8.43% 8.24%
0%
10%
20%
30%
40%
50%
60%
70%
80%
2008 2009 2010 2011 2012 2013 2014 2015 2016 2017
10 to 17 years 18 to 20 years 21 years and older Overall
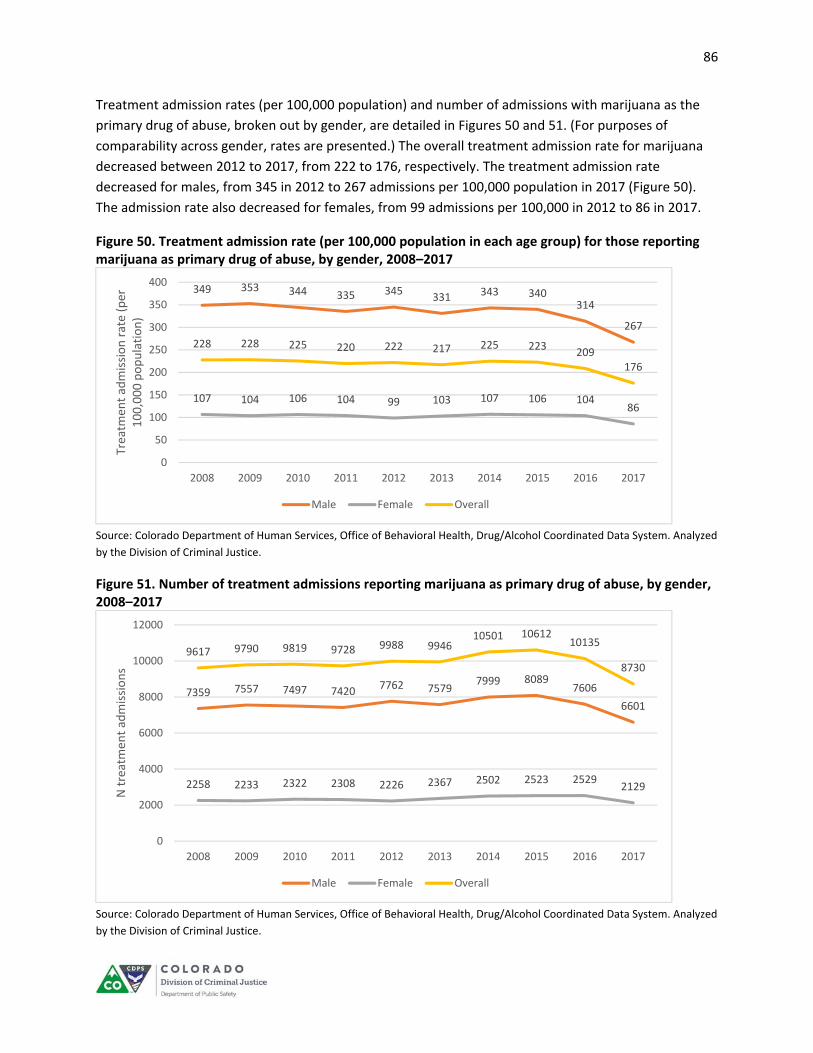
86
Treatment admission rates (per 100,000 population) and number of admissions with marijuana as the
primary drug of abuse, broken out by gender, are detailed in Figures 50 and 51. (For purposes of
comparability across gender, rates are presented.) The overall treatment admission rate for marijuana
decreased between 2012 to 2017, from 222 to 176, respectively. The treatment admission rate
decreased for males, from 345 in 2012 to 267 admissions per 100,000 population in 2017 (Figure 50).
The admission rate also decreased for females, from 99 admissions per 100,000 in 2012 to 86 in 2017.
Figure 50. Treatment admission rate (per 100,000 population in each age group) for those reporting marijuana as primary drug of abuse, by gender, 2008–2017
Source: Colorado Department of Human Services, Office of Behavioral Health, Drug/Alcohol Coordinated Data System. Analyzed
by the Division of Criminal Justice.
Figure 51. Number of treatment admissions reporting marijuana as primary drug of abuse, by gender, 2008–2017
Source: Colorado Department of Human Services, Office of Behavioral Health, Drug/Alcohol Coordinated Data System. Analyzed
by the Division of Criminal Justice.
349 353 344 335 345331 343 340
314
267
107 104 106 104 99 103 107 106 10486
228 228 225 220 222 217 225 223209
176
0
50
100
150
200
250
300
350
400
2008 2009 2010 2011 2012 2013 2014 2015 2016 2017
Treatm
ent ad
mission rate (per
100,000 population)
Male Female Overall
7359 7557 7497 74207762 7579
7999 80897606
6601
2258 2233 2322 2308 2226 2367 2502 2523 25292129
9617 9790 9819 9728 9988 994610501 10612
10135
8730
0
2000
4000
6000
8000
10000
12000
2008 2009 2010 2011 2012 2013 2014 2015 2016 2017
N treatmen
t ad
missions
Male Female Overall

87
Marijuana was reported as the primary drug of abuse by 8.0% of all treatment admissions and 8.7% of
males admitted for treatment in 2017 (Figure 52). This contrasts with 7.0% of females in 2017.
Figure 52. Percent of treatment admissions with marijuana reported as the primary drug of abuse, by gender, 2008–2017
Source: Colorado Department of Human Services, Office of Behavioral Health, Drug/Alcohol Coordinated Data System. Analyzed
by the Division of Criminal Justice.
The average age at first use for those seeking treatment for marijuana abuse remained stable at 14.5–
15.0 years (Figure 53) during the period 2008–2017. The average age at first treatment increased after
2008, from 23.9 years in 2008 to 26.1 years in 2017. The time from first usage to first treatment
increased, from around 9.3 years in 2008 to 11.3 years in 2017. The reasons behind this change are
unknown at this time, but OBH is tracking this development.
7.5%7.8%
9.0% 8.8% 8.8% 8.7% 8.8% 8.9% 8.7% 8.7%
7.2% 7.0%7.6%
7.2%6.8%
7.2% 7.3% 7.5% 7.6%7.0%
7.4% 7.6%
8.6%8.3% 8.2% 8.3% 8.4% 8.6% 8.4% 8.2%
0%
1%
2%
3%
4%
5%
6%
7%
8%
9%
10%
2008 2009 2010 2011 2012 2013 2014 2015 2016 2017
Percent of treatment admissions with marijuana as primary drug, by gender
Male Female Overall

88
Figure 53. Age at first use of marijuana and age at first treatment, 2008–2017
Source: Colorado Department of Human Services, Office of Behavioral Health, Drug/Alcohol Coordinated Data System. Analyzed
by the Division of Criminal Justice.
The DACODS collects information on frequency of drug use in the 30 days prior to treatment (Figure 54).
In 2008, 23% of clients seeking treatment were occasional users (1–7 days of use in the past 30 days)
and 10% were heavy users (22 days or more). By 2017, this distribution changed and occasional users
(19%) were outnumbered by heavy users (25%), suggesting that those seeking treatment were more
likely to be heavy users prior to admission. Reported methods of marijuana use have not changed over
time, with the most common method of marijuana use being smoking (91.8%), followed by eatables
(4.0%), and inhalation (3.6%) (data not presented).
14.6 14.5 14.6 14.5 14.6 14.5 14.7 14.8 14.8 14.8
23.9 23.8 23.7 24.0 24.2 23.925.1
25.8 25.326.1
0.0
5.0
10.0
15.0
20.0
25.0
30.0
2008 2009 2010 2011 2012 2013 2014 2015 2016 2017
Age of First Use Age of First Treatment
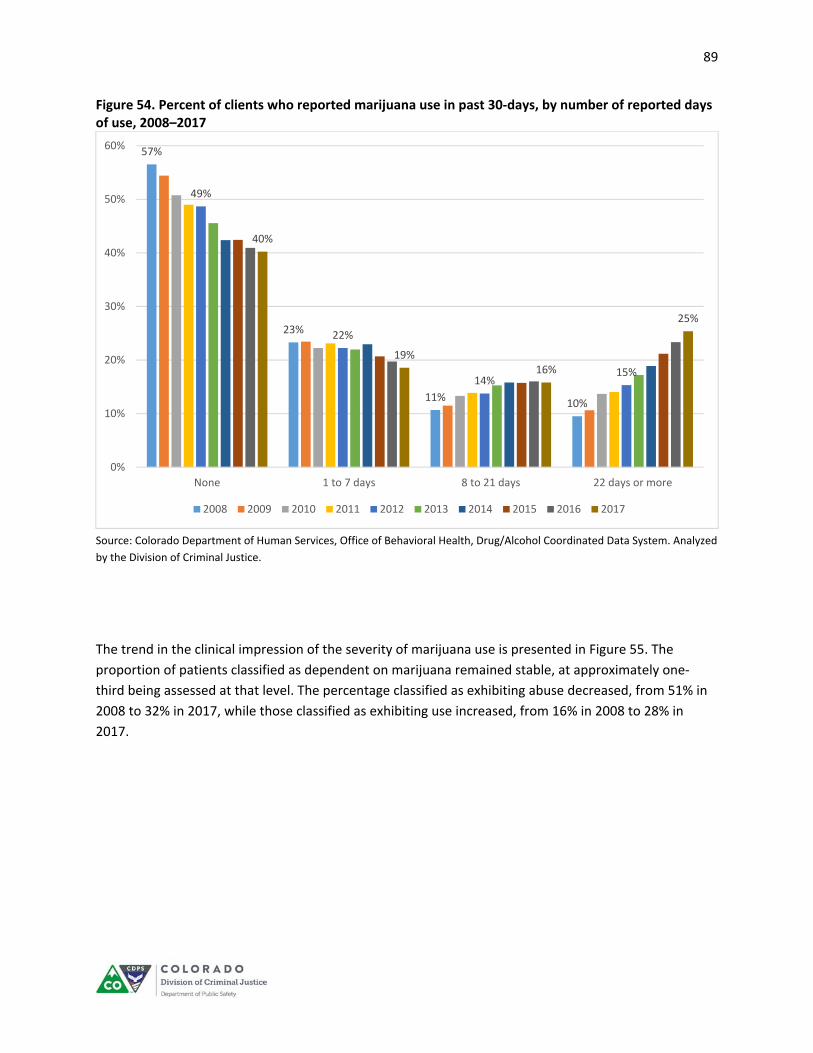
89
Figure 54. Percent of clients who reported marijuana use in past 30‐days, by number of reported days of use, 2008–2017
Source: Colorado Department of Human Services, Office of Behavioral Health, Drug/Alcohol Coordinated Data System. Analyzed
by the Division of Criminal Justice.
The trend in the clinical impression of the severity of marijuana use is presented in Figure 55. The
proportion of patients classified as dependent on marijuana remained stable, at approximately one‐
third being assessed at that level. The percentage classified as exhibiting abuse decreased, from 51% in
2008 to 32% in 2017, while those classified as exhibiting use increased, from 16% in 2008 to 28% in
2017.
57%
23%
11%10%
49%
22%
14%15%
40%
19%16%
25%
0%
10%
20%
30%
40%
50%
60%
None 1 to 7 days 8 to 21 days 22 days or more
2008 2009 2010 2011 2012 2013 2014 2015 2016 2017
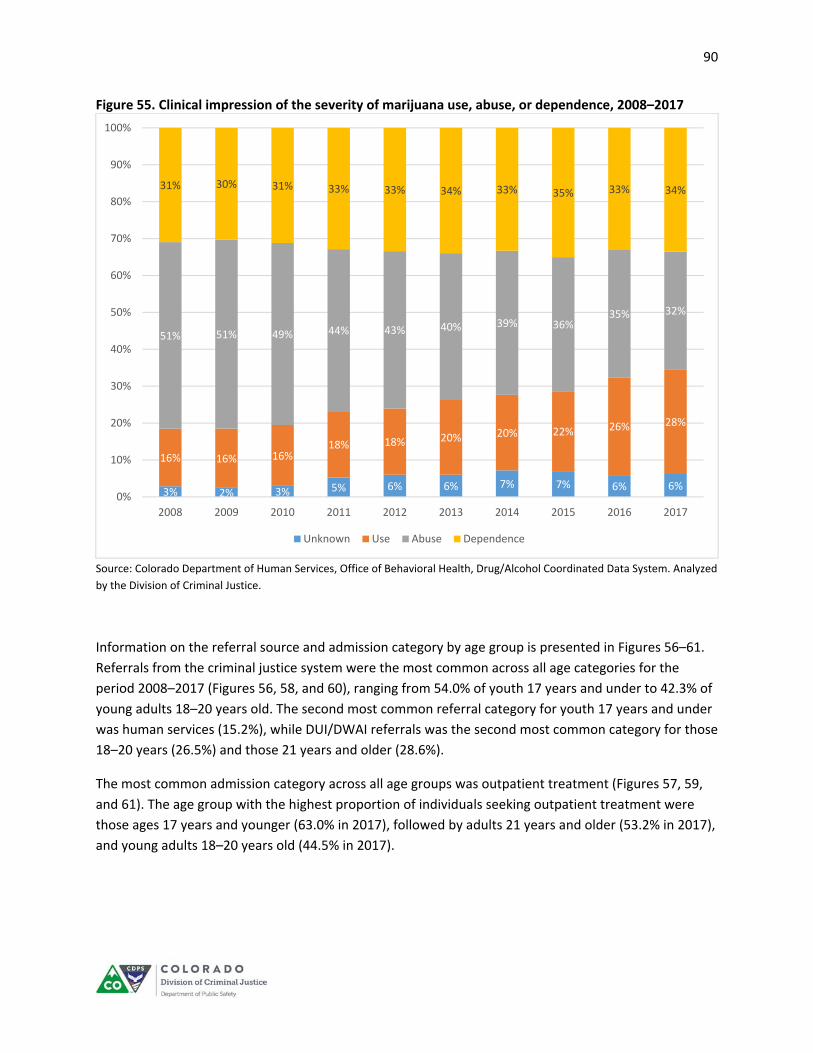
90
Figure 55. Clinical impression of the severity of marijuana use, abuse, or dependence, 2008–2017
Source: Colorado Department of Human Services, Office of Behavioral Health, Drug/Alcohol Coordinated Data System. Analyzed
by the Division of Criminal Justice.
Information on the referral source and admission category by age group is presented in Figures 56–61.
Referrals from the criminal justice system were the most common across all age categories for the
period 2008–2017 (Figures 56, 58, and 60), ranging from 54.0% of youth 17 years and under to 42.3% of
young adults 18–20 years old. The second most common referral category for youth 17 years and under
was human services (15.2%), while DUI/DWAI referrals was the second most common category for those
18–20 years (26.5%) and those 21 years and older (28.6%).
The most common admission category across all age groups was outpatient treatment (Figures 57, 59,
and 61). The age group with the highest proportion of individuals seeking outpatient treatment were
those ages 17 years and younger (63.0% in 2017), followed by adults 21 years and older (53.2% in 2017),
and young adults 18–20 years old (44.5% in 2017).
3% 2% 3% 5% 6% 6% 7% 7% 6% 6%
16% 16% 16%18% 18% 20% 20% 22% 26% 28%
51% 51% 49% 44% 43% 40% 39% 36%35% 32%
31% 30% 31% 33% 33% 34% 33% 35% 33% 34%
0%
10%
20%
30%
40%
50%
60%
70%
80%
90%
100%
2008 2009 2010 2011 2012 2013 2014 2015 2016 2017
Unknown Use Abuse Dependence
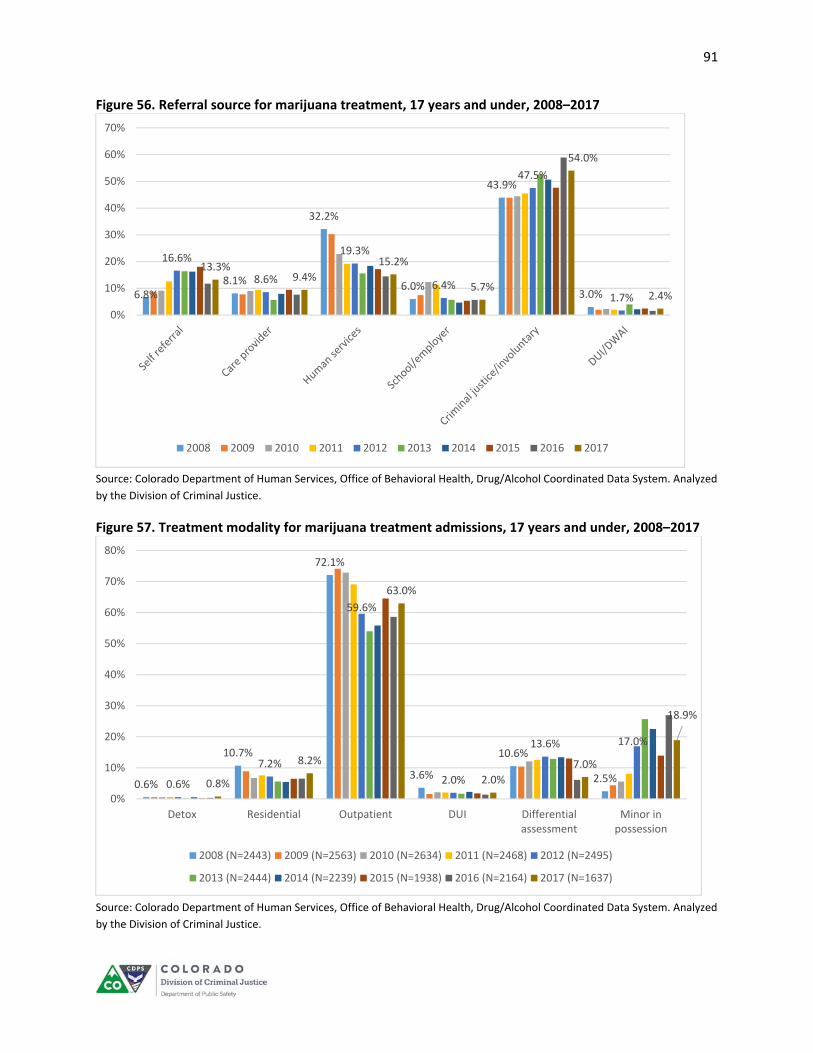
91
Figure 56. Referral source for marijuana treatment, 17 years and under, 2008–2017
Source: Colorado Department of Human Services, Office of Behavioral Health, Drug/Alcohol Coordinated Data System. Analyzed
by the Division of Criminal Justice.
Figure 57. Treatment modality for marijuana treatment admissions, 17 years and under, 2008–2017
Source: Colorado Department of Human Services, Office of Behavioral Health, Drug/Alcohol Coordinated Data System. Analyzed
by the Division of Criminal Justice.
6.8%8.1%
32.2%
6.0%
43.9%
3.0%
16.6%
8.6%
19.3%
6.4%
47.5%
1.7%
13.3%9.4%
15.2%
5.7%
54.0%
2.4%
0%
10%
20%
30%
40%
50%
60%
70%
2008 2009 2010 2011 2012 2013 2014 2015 2016 2017
0.6%
10.7%
72.1%
3.6%
10.6%
2.5%0.6%
7.2%
59.6%
2.0%
13.6% 17.0%
0.8%
8.2%
63.0%
2.0%
7.0%
18.9%
0%
10%
20%
30%
40%
50%
60%
70%
80%
Detox Residential Outpatient DUI Differentialassessment
Minor inpossession
2008 (N=2443) 2009 (N=2563) 2010 (N=2634) 2011 (N=2468) 2012 (N=2495)
2013 (N=2444) 2014 (N=2239) 2015 (N=1938) 2016 (N=2164) 2017 (N=1637)

92
Figure 58. Referral source for marijuana treatment, 18 to 20 years old, 2008–2017
Source: Colorado Department of Human Services, Office of Behavioral Health, Drug/Alcohol Coordinated Data System. Analyzed
by the Division of Criminal Justice.
Figure 59. Treatment modality for marijuana treatment admissions, 18 to 20 years old, 2008–2017
Source: Colorado Department of Human Services, Office of Behavioral Health, Drug/Alcohol Coordinated Data System.
Note: STIRT stands for Strategic Intensive Remediation Treatment. Analyzed by the Division of Criminal Justice.
7.3%12.6% 10.4%
1.4%
47.7%
20.5%
11.5% 10.2%
5.0%0.5%
52.2%
20.5%
15.0%11.3%
3.6%1.3%
42.3%
26.5%
0%
10%
20%
30%
40%
50%
60%
2008 2009 2010 2011 2012 2013 2014 2015 2016 2017
8.6%
4.7%
49.7%
1.2%
23.6%
9.0%
3.1%
7.9%
3.5%
44.7%
1.8%
20.5%
7.4%
14.2%
5.3% 5.9%
44.5%
0.4%
29.3%
7.1% 7.6%
0%
10%
20%
30%
40%
50%
60%
Detox Residential Outpatient STIRT DUI Differentialassessment
Minor inpossession
2008 (N=1466) 2009 (N=1629) 2010 (N=1503) 2011 (N=1403) 2012 (N=1446)
2013 (N=1359) 2014 (N=1272) 2015 (N=1261) 2016 (N=1235) 2017 (N=1637)

93
Figure 60. Referral source for marijuana treatment, adults 21 and older, 2008–2017
Source: Colorado Department of Human Services, Office of Behavioral Health, Drug/Alcohol Coordinated Data System. Analyzed
by the Division of Criminal Justice.
Figure 61. Treatment modality for marijuana treatment admissions, adults 21 years and older, 2008–2017
Source: Colorado Department of Human Services, Office of Behavioral Health, Drug/Alcohol Coordinated Data System.
Note: STIRT stands for Strategic Intensive Remediation Treatment. Analyzed by the Division of Criminal Justice.
5.8%
13.1% 13.7%
1.3%
51.3%
14.8%10.6% 9.9% 8.7%
0.7%
51.2%
18.8%
13.0%
6.8% 6.6%
0.5%
44.5%
28.6%
0%
10%
20%
30%
40%
50%
60%
2008 2009 2010 2011 2012 2013 2014 2015 2016 2017
6.2% 6.8%
57.8%
4.6%
15.3%
9.3%
0.0%
6.4% 6.4%
56.9%
3.1%
18.9%
7.9%
0.3%
4.6% 3.6%
53.2%
1.1%
31.8%
5.6%
0.1%0%
10%
20%
30%
40%
50%
60%
70%
Detox Residential Outpatient STIRT DUI Differentialassessment
Minor inpossession
2008 (N=5716) 2009 (N=5613) 2010 (N=5693) 2011 (N=5857) 2012 (N=6047)
2013 (N=6143) 2014 (N=6990) 2015 (N=7413) 2016 (N=6736) 2017 (N=6051)
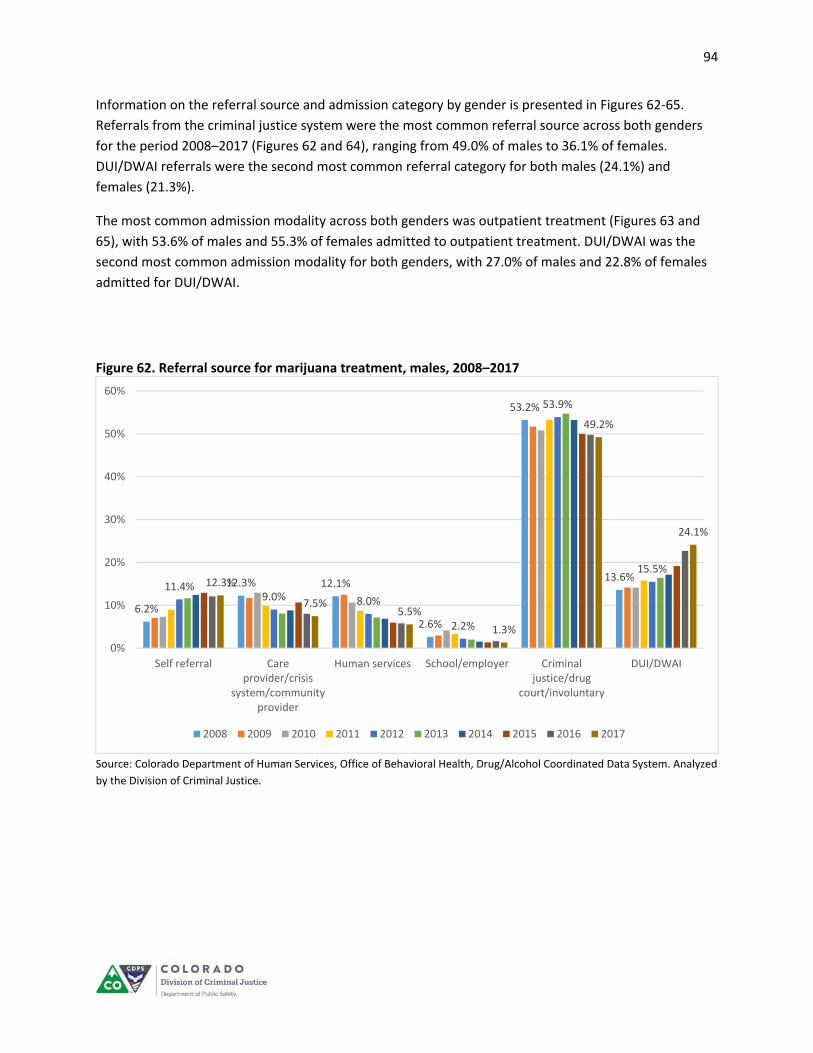
94
Information on the referral source and admission category by gender is presented in Figures 62‐65.
Referrals from the criminal justice system were the most common referral source across both genders
for the period 2008–2017 (Figures 62 and 64), ranging from 49.0% of males to 36.1% of females.
DUI/DWAI referrals were the second most common referral category for both males (24.1%) and
females (21.3%).
The most common admission modality across both genders was outpatient treatment (Figures 63 and
65), with 53.6% of males and 55.3% of females admitted to outpatient treatment. DUI/DWAI was the
second most common admission modality for both genders, with 27.0% of males and 22.8% of females
admitted for DUI/DWAI.
Figure 62. Referral source for marijuana treatment, males, 2008–2017
Source: Colorado Department of Human Services, Office of Behavioral Health, Drug/Alcohol Coordinated Data System. Analyzed
by the Division of Criminal Justice.
6.2%
12.3% 12.1%
2.6%
53.2%
13.6%11.4%
9.0% 8.0%
2.2%
53.9%
15.5%12.3%
7.5%5.5%
1.3%
49.2%
24.1%
0%
10%
20%
30%
40%
50%
60%
Self referral Careprovider/crisis
system/communityprovider
Human services School/employer Criminaljustice/drug
court/involuntary
DUI/DWAI
2008 2009 2010 2011 2012 2013 2014 2015 2016 2017
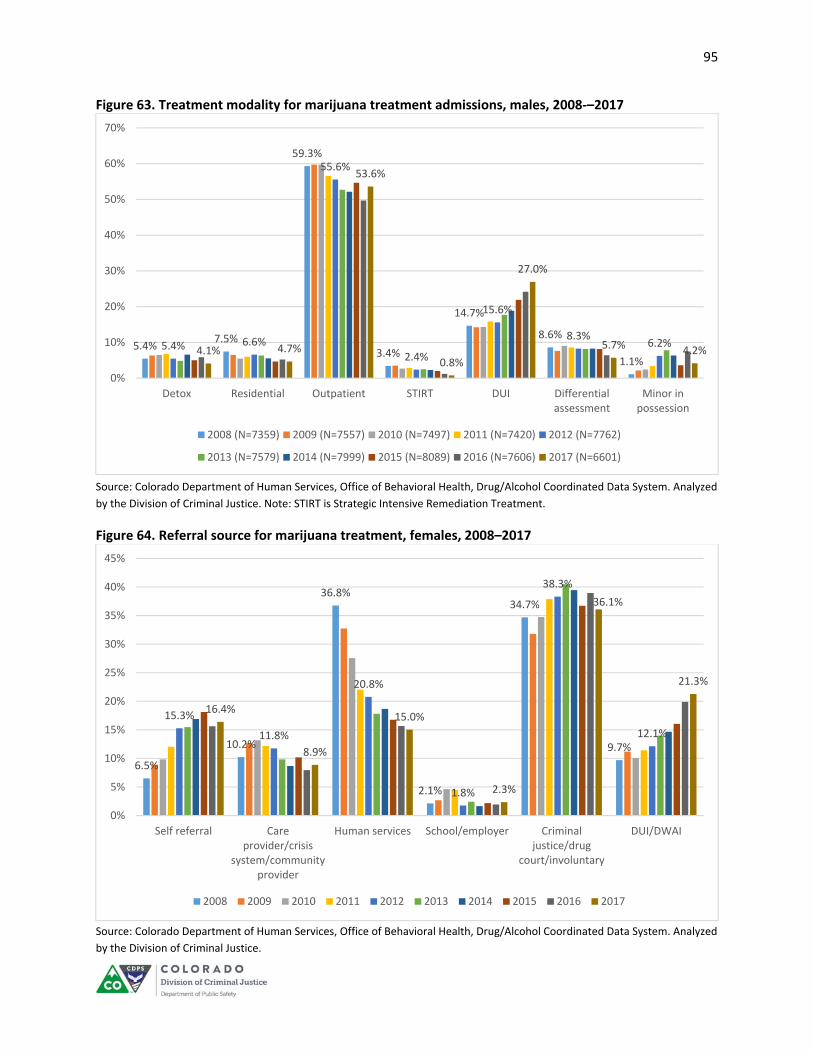
95
Figure 63. Treatment modality for marijuana treatment admissions, males, 2008‐–2017
Source: Colorado Department of Human Services, Office of Behavioral Health, Drug/Alcohol Coordinated Data System. Analyzed
by the Division of Criminal Justice. Note: STIRT is Strategic Intensive Remediation Treatment.
Figure 64. Referral source for marijuana treatment, females, 2008–2017
Source: Colorado Department of Human Services, Office of Behavioral Health, Drug/Alcohol Coordinated Data System. Analyzed
by the Division of Criminal Justice.
5.4%7.5%
59.3%
3.4%
14.7%
8.6%
1.1%
5.4% 6.6%
55.6%
2.4%
15.6%
8.3%6.2%
4.1% 4.7%
53.6%
0.8%
27.0%
5.7% 4.2%
0%
10%
20%
30%
40%
50%
60%
70%
Detox Residential Outpatient STIRT DUI Differentialassessment
Minor inpossession
2008 (N=7359) 2009 (N=7557) 2010 (N=7497) 2011 (N=7420) 2012 (N=7762)
2013 (N=7579) 2014 (N=7999) 2015 (N=8089) 2016 (N=7606) 2017 (N=6601)
6.5%
10.2%
36.8%
2.1%
34.7%
9.7%
15.3%
11.8%
20.8%
1.8%
38.3%
12.1%
16.4%
8.9%
15.0%
2.3%
36.1%
21.3%
0%
5%
10%
15%
20%
25%
30%
35%
40%
45%
Self referral Careprovider/crisis
system/communityprovider
Human services School/employer Criminaljustice/drug
court/involuntary
DUI/DWAI
2008 2009 2010 2011 2012 2013 2014 2015 2016 2017

96
Figure 65. Treatment modality for marijuana treatment admissions, females, 2008–2017
Source: Colorado Department of Human Services, Office of Behavioral Health, Drug/Alcohol Coordinated Data System. Analyzed
by the Division of Criminal Justice. Note: STIRT is Strategic Intensive Remediation Treatment.
A geographic breakdown of treatment admissions in 2017 per 100,000 population of those ages 10 and
over is presented in Figures 66 and 67. The county rates presented in Figure 66 must be interpreted with
caution due to the requirement that a county must have at least 30 treatment admissions before data
can be released. Figure 67 presents data by region and shows how different the treatment rates were
throughout the state. In 2017, the Southeast region had the highest rate (275.1), while the Denver
Metro area had the lowest rate (139.3).
4.3%7.7%
63.2%
1.2%
10.1%12.2%
1.3%4.2% 4.9%
56.7%
1.4%
12.4% 12.8%
7.4%3.6% 4.8%
55.3%
0.8%
22.8%
7.0% 5.7%
0%
10%
20%
30%
40%
50%
60%
70%
Detox Residential Outpatient STIRT DUI Differentialassessment
Minor inpossession
2008 (N=2258) 2009 (N=2233) 2010 (N=2322) 2011 (N=2308) 2012 (N=2226)
2013 (N=2367) 2014 (N=2502) 2015 (N=2523) 2016 (N=2529) 2017 (N=2129)
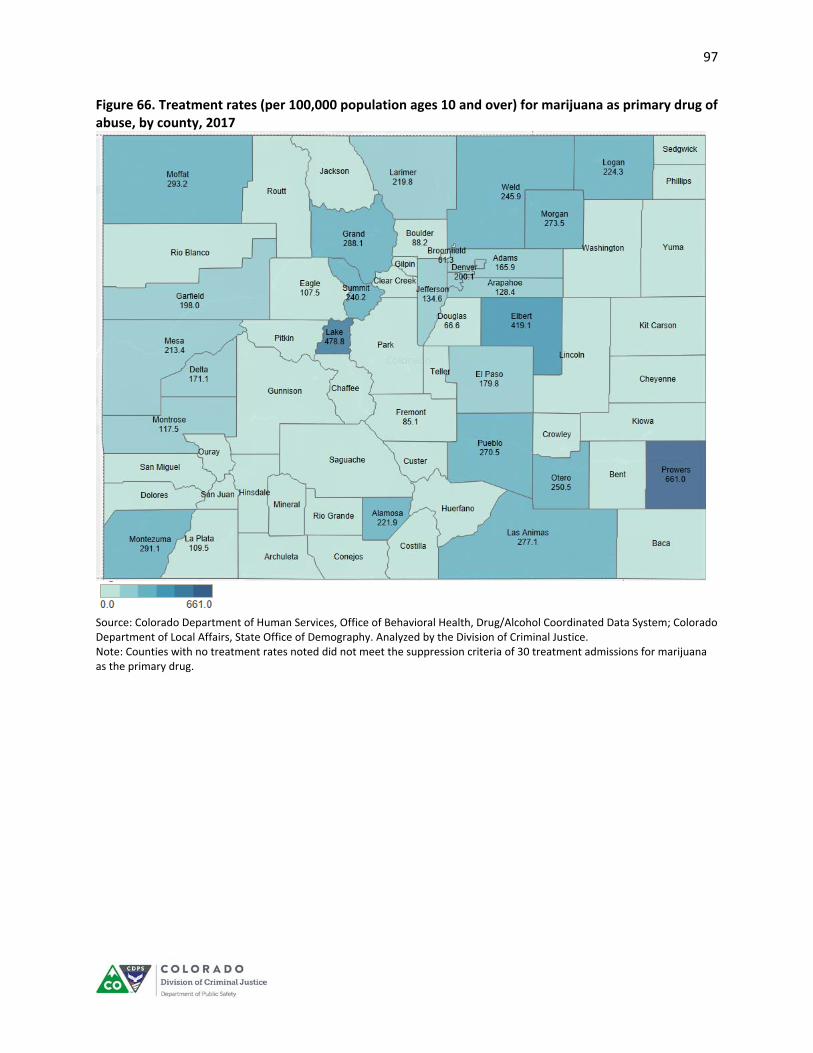
97
Figure 66. Treatment rates (per 100,000 population ages 10 and over) for marijuana as primary drug of abuse, by county, 2017
Source: Colorado Department of Human Services, Office of Behavioral Health, Drug/Alcohol Coordinated Data System; Colorado Department of Local Affairs, State Office of Demography. Analyzed by the Division of Criminal Justice. Note: Counties with no treatment rates noted did not meet the suppression criteria of 30 treatment admissions for marijuana as the primary drug.
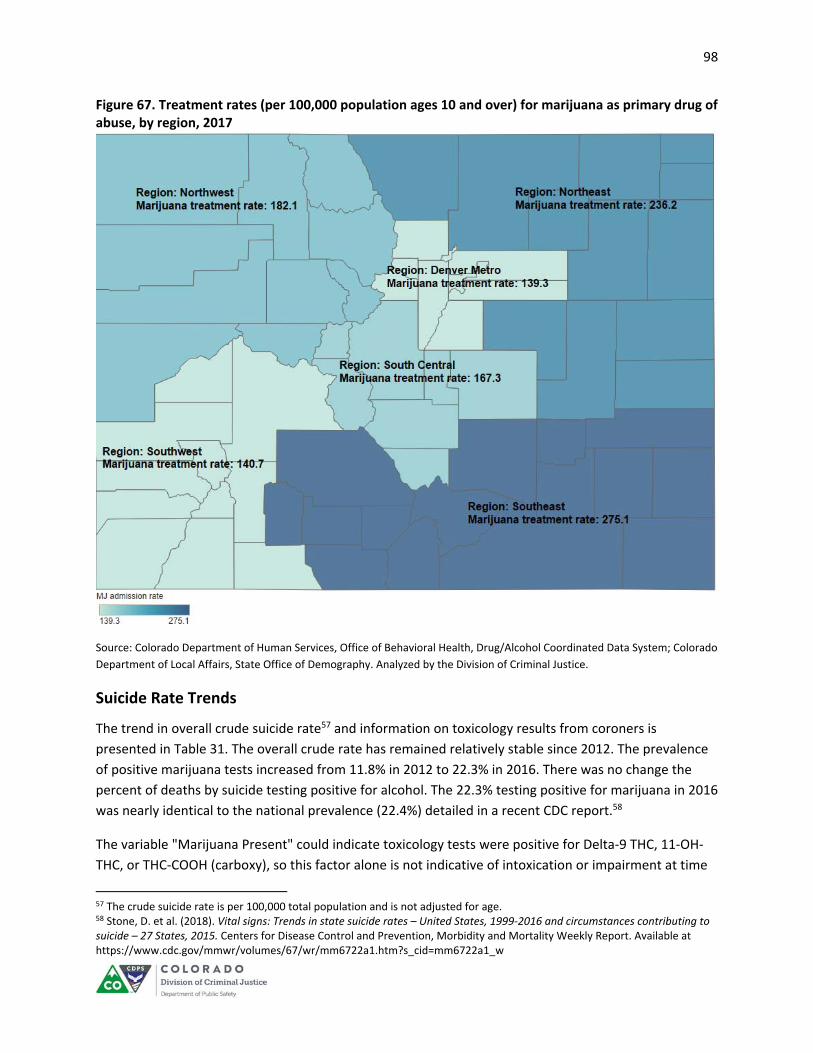
98
Figure 67. Treatment rates (per 100,000 population ages 10 and over) for marijuana as primary drug of abuse, by region, 2017
Source: Colorado Department of Human Services, Office of Behavioral Health, Drug/Alcohol Coordinated Data System; Colorado
Department of Local Affairs, State Office of Demography. Analyzed by the Division of Criminal Justice.
Suicide Rate Trends
The trend in overall crude suicide rate57 and information on toxicology results from coroners is
presented in Table 31. The overall crude rate has remained relatively stable since 2012. The prevalence
of positive marijuana tests increased from 11.8% in 2012 to 22.3% in 2016. There was no change the
percent of deaths by suicide testing positive for alcohol. The 22.3% testing positive for marijuana in 2016
was nearly identical to the national prevalence (22.4%) detailed in a recent CDC report.58
The variable "Marijuana Present" could indicate toxicology tests were positive for Delta‐9 THC, 11‐OH‐
THC, or THC‐COOH (carboxy), so this factor alone is not indicative of intoxication or impairment at time
57 The crude suicide rate is per 100,000 total population and is not adjusted for age. 58 Stone, D. et al. (2018). Vital signs: Trends in state suicide rates – United States, 1999‐2016 and circumstances contributing to suicide – 27 States, 2015. Centers for Disease Control and Prevention, Morbidity and Mortality Weekly Report. Available at https://www.cdc.gov/mmwr/volumes/67/wr/mm6722a1.htm?s_cid=mm6722a1_w
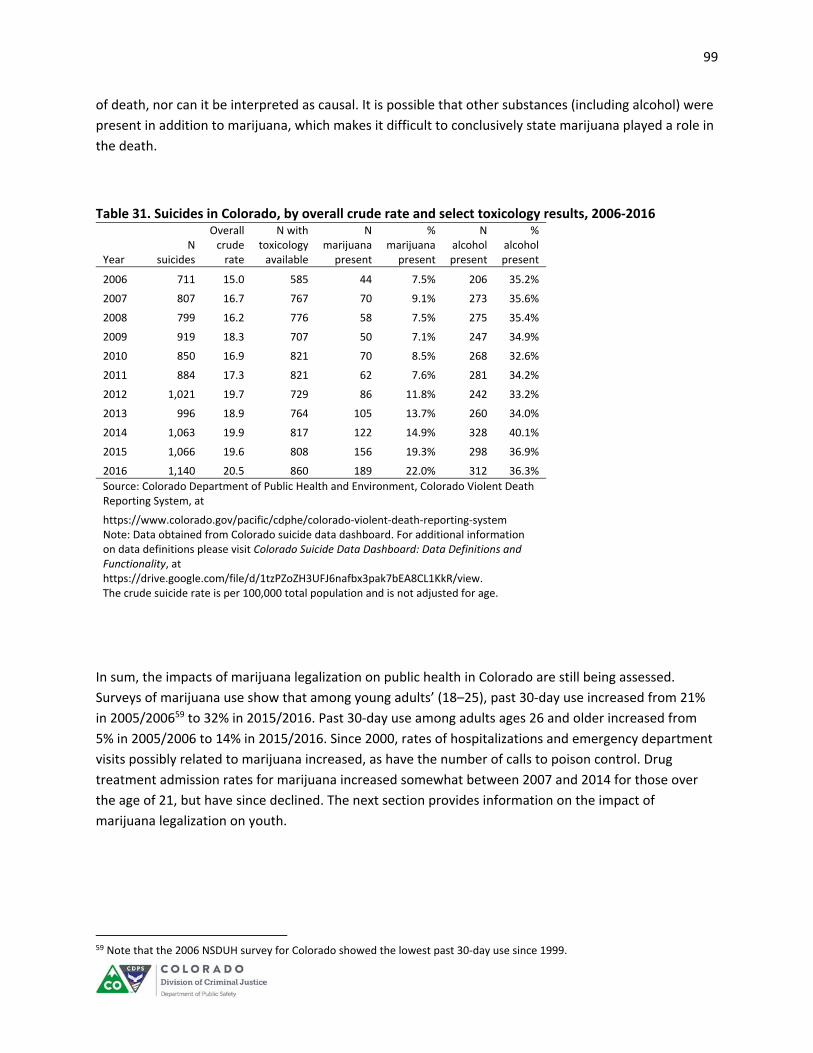
99
of death, nor can it be interpreted as causal. It is possible that other substances (including alcohol) were
present in addition to marijuana, which makes it difficult to conclusively state marijuana played a role in
the death.
Table 31. Suicides in Colorado, by overall crude rate and select toxicology results, 2006‐2016
Year N
suicides
Overall crude rate
N with toxicology available
N marijuana
present
% marijuana
present
N alcohol present
% alcohol present
2006 711 15.0 585 44 7.5% 206 35.2%
2007 807 16.7 767 70 9.1% 273 35.6%
2008 799 16.2 776 58 7.5% 275 35.4%
2009 919 18.3 707 50 7.1% 247 34.9%
2010 850 16.9 821 70 8.5% 268 32.6%
2011 884 17.3 821 62 7.6% 281 34.2%
2012 1,021 19.7 729 86 11.8% 242 33.2%
2013 996 18.9 764 105 13.7% 260 34.0%
2014 1,063 19.9 817 122 14.9% 328 40.1%
2015 1,066 19.6 808 156 19.3% 298 36.9%
2016 1,140 20.5 860 189 22.0% 312 36.3%
Source: Colorado Department of Public Health and Environment, Colorado Violent Death Reporting System, at
https://www.colorado.gov/pacific/cdphe/colorado‐violent‐death‐reporting‐system Note: Data obtained from Colorado suicide data dashboard. For additional information on data definitions please visit Colorado Suicide Data Dashboard: Data Definitions and Functionality, at https://drive.google.com/file/d/1tzPZoZH3UFJ6nafbx3pak7bEA8CL1KkR/view. The crude suicide rate is per 100,000 total population and is not adjusted for age.
In sum, the impacts of marijuana legalization on public health in Colorado are still being assessed.
Surveys of marijuana use show that among young adults’ (18–25), past 30‐day use increased from 21%
in 2005/200659 to 32% in 2015/2016. Past 30‐day use among adults ages 26 and older increased from
5% in 2005/2006 to 14% in 2015/2016. Since 2000, rates of hospitalizations and emergency department
visits possibly related to marijuana increased, as have the number of calls to poison control. Drug
treatment admission rates for marijuana increased somewhat between 2007 and 2014 for those over
the age of 21, but have since declined. The next section provides information on the impact of
marijuana legalization on youth.
59 Note that the 2006 NSDUH survey for Colorado showed the lowest past 30‐day use since 1999.

100
SECTION FOUR: IMPACT ON YOUTH
Overview
This section focuses on the impact of marijuana legalization on youth under the age of 18. The topics
include youth use, diversion of marijuana to youth, youth arrests, comprehensive school information,
drug‐endangered children,60 and other potential impacts.
Information regarding youth marijuana use was obtained from surveys that ask students about drug use
and other risky behavior. The Healthy Kids Colorado Survey (HKCS) is a biennial survey administered to
high school and middle school youth by the Colorado Department of Public Health and Environment
(CDPHE). The 2017 HKCS surveyed more than 53,800 high and middle school students. The National
Survey on Drug Use and Health (NSDUH) is administered annually to those ages 12 and older by the
federal Substance Abuse and Mental Health Services Administration. SAMHSA produces state‐level
estimates from a two‐year rolling sample. The two‐year prevalence rates for Colorado residents 12 to 17
years old were based on weighted estimates from between 500 to 650 survey respondents.
The public safety impacts are examined by using official offense and arrest data from the Colorado
Bureau of Investigation, court filings data, and drug testing information from the State Division of
Probation Services in the Judicial Branch.
Information about schools was gathered from discipline data made available by the Colorado
Department of Education. These data include trends on suspensions, expulsions, and law enforcement
referrals for drugs. The data system in place from 2004–2016 did not capture whether marijuana was
the specific drug that led to the discipline, as it was grouped with all other drugs. In the 2016–2017
school year, marijuana was reported separately as a reason for school discipline.61 However, since the
most commonly used illicit drug in the youth population is marijuana, changes in drug discipline trends
can logically be linked to changes in marijuana use. Discussions with school administrators and the
2016–2017 analysis results support this assumption.
The impact of retail marijuana on drug‐endangered children is difficult to answer. The term “drug‐
endangered children” has not been defined by the legislature, and identifying relevant data is
problematic. The Department of Human Services, Division of Child Welfare does not collect specific
information on whether drug use or abuse is a contributing factor for at‐risk families. Nevertheless, a
few data elements may be informative. The CDPHE’s Colorado Behavioral Risk Factor Surveillance
System (BRFSS) is a group of health‐related telephone surveys that collect data from residents regarding
their health‐related risk behaviors, chronic health conditions, and use of preventive services. The Child
Health Survey is a component of the BRFSS that asks parents, with children ages 1‐14, about various
behaviors, including parental marijuana usage and marijuana storage in the home. Questions about
60 Senate Bill 2013‐283, which mandated this report, included drug‐endangered children in the list of topics to study. 61The 2015–2016 school year was the first in which marijuana was recorded as a discipline reason, but it was not reported for
the full year.
101
marijuana were first added in 2014. The CDPHE’s Pregnancy Risk Assessment Monitoring System
(PRAMS) is a surveillance system designed to identify and monitor behaviors and experiences of women
before, during, and after pregnancy. Information about marijuana use before, during, and after
pregnancy is collected by surveying a sample of women who have recently given birth.
A second proxy for drug‐endangered children are reports from pregnant women entering substance
abuse treatment, by type of drug they report and frequency of marijuana use prior to entering
treatment.
Youth Use
Survey Data
Healthy Kids Colorado Survey
The CDPHE’s Healthy Kids Colorado Survey (HKCS) collects health information biennially (every odd year)
from thousands of Colorado public school high school and middle school students.62 Surveys are
completed by students from a random sample of selected schools and randomly selected classrooms
within those schools. Results are weighted to represent student enrollment in all Colorado public high
schools (2005, 2009, 2011, 2013, 2015, 2017) and public middle schools (2013, 2015, 2017). The HKCS
and other sample‐based surveys employ statistical weights to account for the fact that information is
obtained from a sample and used to represent the larger population. The weights account for sampling
design, school and student nonparticipation and nonresponse, and overall adjustments in grade, sex,
and ethnicity that match the sample and the population.
A total of 53,850 randomly selected students from 190 randomly selected schools participated in the
2017 HKCS. The sample includes 47,146 students in 157 public high schools and 6,704 students in 33
public middle schools (Table 32).
62 More detailed information about the Healthy Kids Colorado Survey can be accessed at https://www.colorado.gov/cdphe/hkcs. HKCS is Colorado’s version of the national Youth Risk Behavioral Survey (YRBS), a biennial survey overseen by the Centers for Disease Control and Prevention. More information about the YRBS can be found here https://www.cdc.gov/healthyyouth/data/yrbs/results.htm

102
Table 32. Sample information for Healthy Kids Colorado Survey (HKCS)
High school Middle schoola
Year N
Responses N
Responses
2005 1,498 ‐‐
2009 1,511 ‐‐
2011 1,523 ‐‐
2013 25,197 14,187
2015 15,970 997
2017 47,146 6,704
Source: Colorado Department of Public Health and Environment, Healthy Kids Colorado Survey Technical Documentation. aThe middle school survey was not conducted prior to 2013. Note: The response rate from the 2007 survey was too low to allow for accurate weighting of the results and these data are not presented.
The proportion of Colorado high school students reporting using marijuana ever in their lifetime
remained statistically unchanged between 2005 and 2017 (Figure 68). Further, Figure 1 shows there was
no statistically significant difference between Colorado student responses compared to national data.
Figure 68. High school students’ lifetime marijuana use, Colorado and Nation, 2005–2017: HKCS
2005 2009 2011 2013 2015 2017
Colorado 42.4 42.6 39.5 36.9 38.0 35.2
Nation 38.4 36.8 39.9 40.7 38.6 35.6
0
10
20
30
40
50
60
Percent reporting use
Colorado Nation
Source: Marijuana Health Monitoring and Research Program, Colorado Department of Public Health and Environment (2018). Healthy Kids Colorado Survey; Centers for Disease Control and Prevention (2018). Youth Risk Behavior Surveillance System, at https://www.cdc.gov/healthyyouth/data/yrbs/index.htm
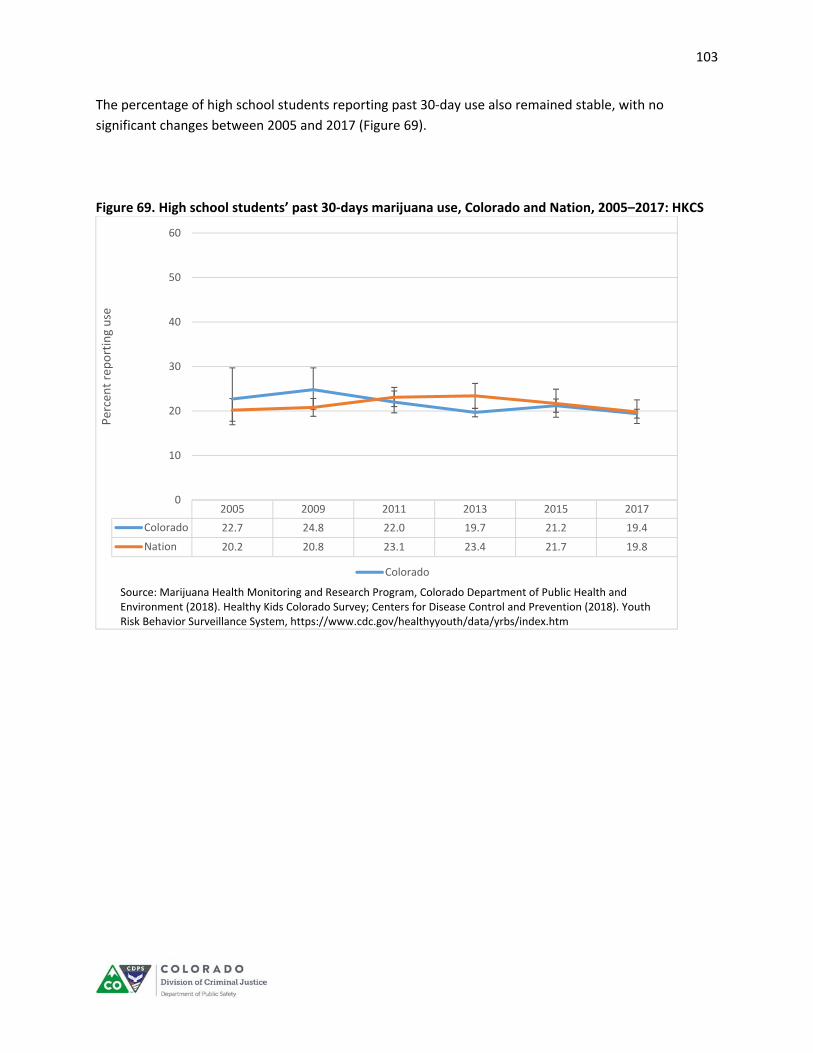
103
The percentage of high school students reporting past 30‐day use also remained stable, with no
significant changes between 2005 and 2017 (Figure 69).
Figure 69. High school students’ past 30‐days marijuana use, Colorado and Nation, 2005–2017: HKCS
2005 2009 2011 2013 2015 2017
Colorado 22.7 24.8 22.0 19.7 21.2 19.4
Nation 20.2 20.8 23.1 23.4 21.7 19.8
0
10
20
30
40
50
60
Percent reporting use
Colorado
Source: Marijuana Health Monitoring and Research Program, Colorado Department of Public Health and Environment (2018). Healthy Kids Colorado Survey; Centers for Disease Control and Prevention (2018). Youth Risk Behavior Surveillance System, https://www.cdc.gov/healthyyouth/data/yrbs/index.htm
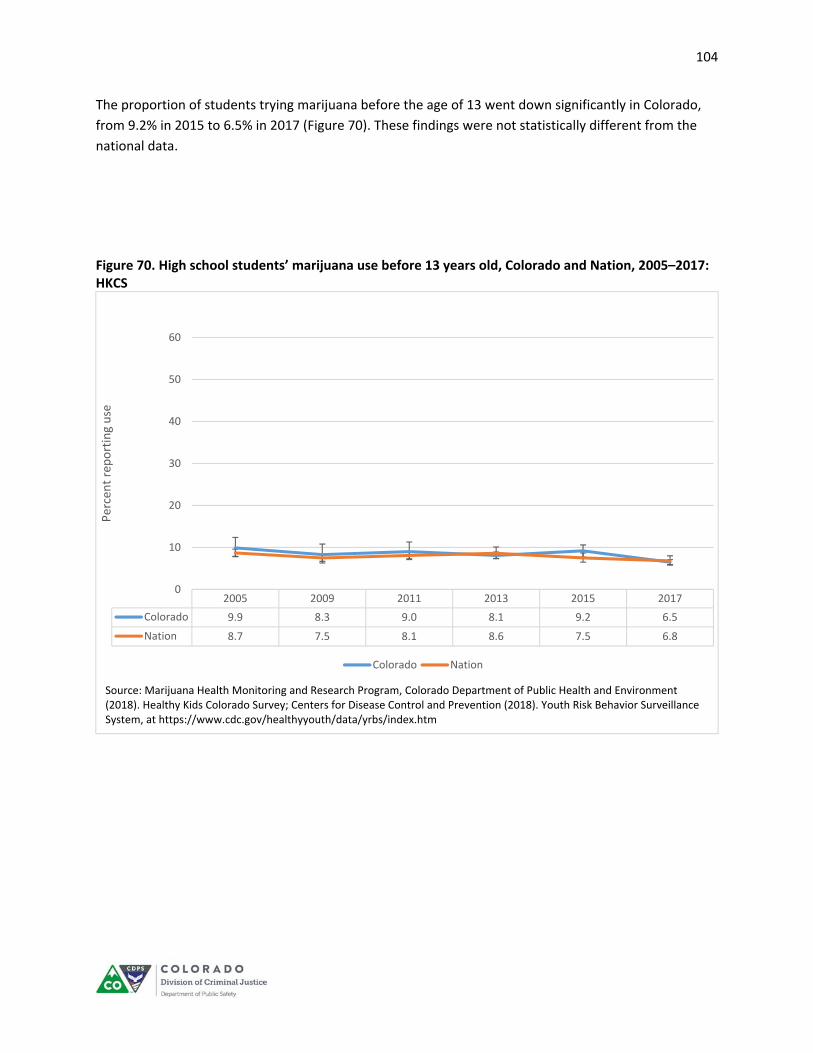
104
The proportion of students trying marijuana before the age of 13 went down significantly in Colorado,
from 9.2% in 2015 to 6.5% in 2017 (Figure 70). These findings were not statistically different from the
national data.
Figure 70. High school students’ marijuana use before 13 years old, Colorado and Nation, 2005–2017: HKCS
2005 2009 2011 2013 2015 2017
Colorado 9.9 8.3 9.0 8.1 9.2 6.5
Nation 8.7 7.5 8.1 8.6 7.5 6.8
0
10
20
30
40
50
60
Percent reporting use
Colorado Nation
Source: Marijuana Health Monitoring and Research Program, Colorado Department of Public Health and Environment (2018). Healthy Kids Colorado Survey; Centers for Disease Control and Prevention (2018). Youth Risk Behavior Surveillance System, at https://www.cdc.gov/healthyyouth/data/yrbs/index.htm

105
Prevalence trends for the three most commonly used substances by high school students are presented
in Figure 71. The prevalence of marijuana use has not changed significantly in the past six survey
administrations (2005, 2009, 2011, 2013, 2015, and 2017). Alcohol and cigarette use trended
downward, with the largest reduction linked to current alcohol use, down from 47.4% in 2005 to 28.7%
in 2017. Although youth’s cigarette smoking was at an all‐time low, 27% of youth report using nicotine
through vapor products including e‐cigarettes. Data on e‐cigarettes was added to the 2015
administration of HKCS.
Figure 71. High school students’ past 30‐day substance use, 2005–2017: HKCS
22.724.8
22.019.7
21.219.4
47.4
40.8
36.4
31.0
30.228.7
18.7 17.715.7
10.78.6
7.2
30.3
32.6
0
10
20
30
40
50
60
2005 2009 2011 2013 2015 2017
Percent reporting past 30‐day use
Current marijuana use Current alcohol use
Current cigarette use Current cigarette, e‐cigarette, other tobacco use
Source: Marijuana Health Monitoring and Research Program, Colorado Department of Public Health and Environment (2018). Healthy Kids Colorado Survey; Centers for Disease Control and Prevention (2018). Youth Risk Behavior Surveillance System, at https://www.cdc.gov/healthyyouth/data/yrbs/index.htm
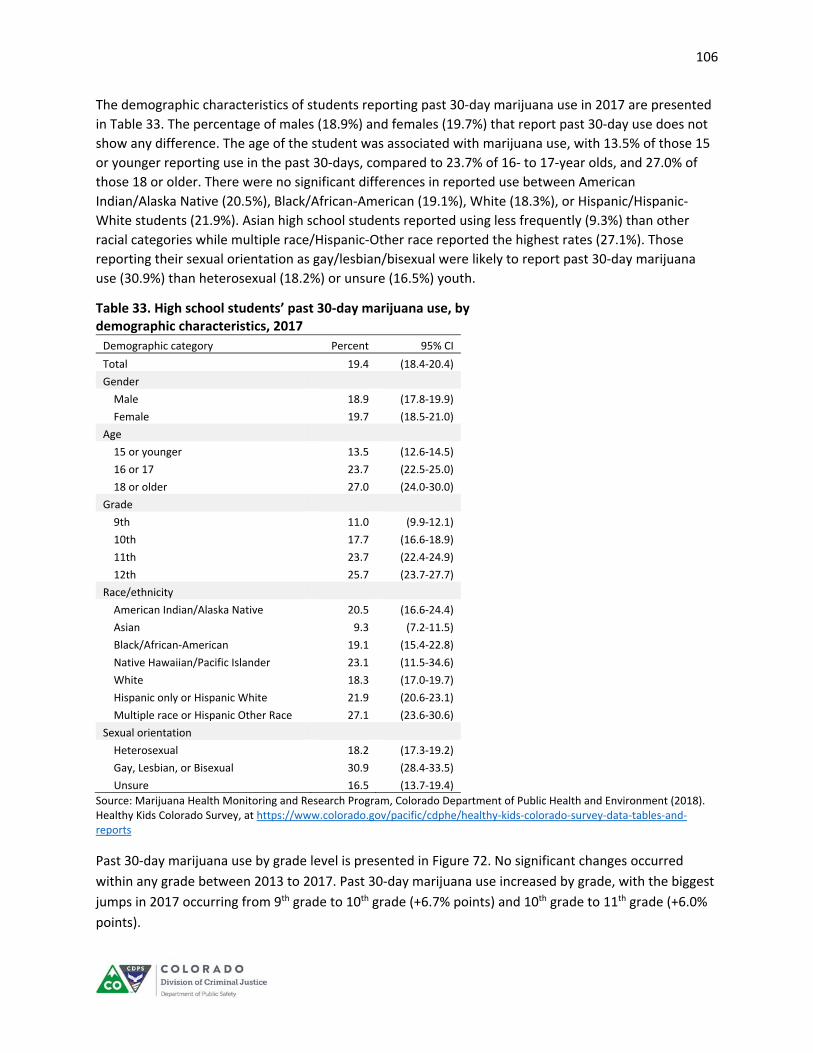
106
The demographic characteristics of students reporting past 30‐day marijuana use in 2017 are presented
in Table 33. The percentage of males (18.9%) and females (19.7%) that report past 30‐day use does not
show any difference. The age of the student was associated with marijuana use, with 13.5% of those 15
or younger reporting use in the past 30‐days, compared to 23.7% of 16‐ to 17‐year olds, and 27.0% of
those 18 or older. There were no significant differences in reported use between American
Indian/Alaska Native (20.5%), Black/African‐American (19.1%), White (18.3%), or Hispanic/Hispanic‐
White students (21.9%). Asian high school students reported using less frequently (9.3%) than other
racial categories while multiple race/Hispanic‐Other race reported the highest rates (27.1%). Those
reporting their sexual orientation as gay/lesbian/bisexual were likely to report past 30‐day marijuana
use (30.9%) than heterosexual (18.2%) or unsure (16.5%) youth.
Table 33. High school students’ past 30‐day marijuana use, by demographic characteristics, 2017
Demographic category Percent 95% CI
Total 19.4 (18.4‐20.4)
Gender
Male 18.9 (17.8‐19.9)
Female 19.7 (18.5‐21.0)
Age
15 or younger 13.5 (12.6‐14.5)
16 or 17 23.7 (22.5‐25.0)
18 or older 27.0 (24.0‐30.0)
Grade
9th 11.0 (9.9‐12.1)
10th 17.7 (16.6‐18.9)
11th 23.7 (22.4‐24.9)
12th 25.7 (23.7‐27.7)
Race/ethnicity
American Indian/Alaska Native 20.5 (16.6‐24.4)
Asian 9.3 (7.2‐11.5)
Black/African‐American 19.1 (15.4‐22.8)
Native Hawaiian/Pacific Islander 23.1 (11.5‐34.6)
White 18.3 (17.0‐19.7)
Hispanic only or Hispanic White 21.9 (20.6‐23.1)
Multiple race or Hispanic Other Race 27.1 (23.6‐30.6)
Sexual orientation
Heterosexual 18.2 (17.3‐19.2)
Gay, Lesbian, or Bisexual 30.9 (28.4‐33.5)
Unsure 16.5 (13.7‐19.4)
Source: Marijuana Health Monitoring and Research Program, Colorado Department of Public Health and Environment (2018). Healthy Kids Colorado Survey, at https://www.colorado.gov/pacific/cdphe/healthy‐kids‐colorado‐survey‐data‐tables‐and‐reports
Past 30‐day marijuana use by grade level is presented in Figure 72. No significant changes occurred
within any grade between 2013 to 2017. Past 30‐day marijuana use increased by grade, with the biggest
jumps in 2017 occurring from 9th grade to 10th grade (+6.7% points) and 10th grade to 11th grade (+6.0%
points).
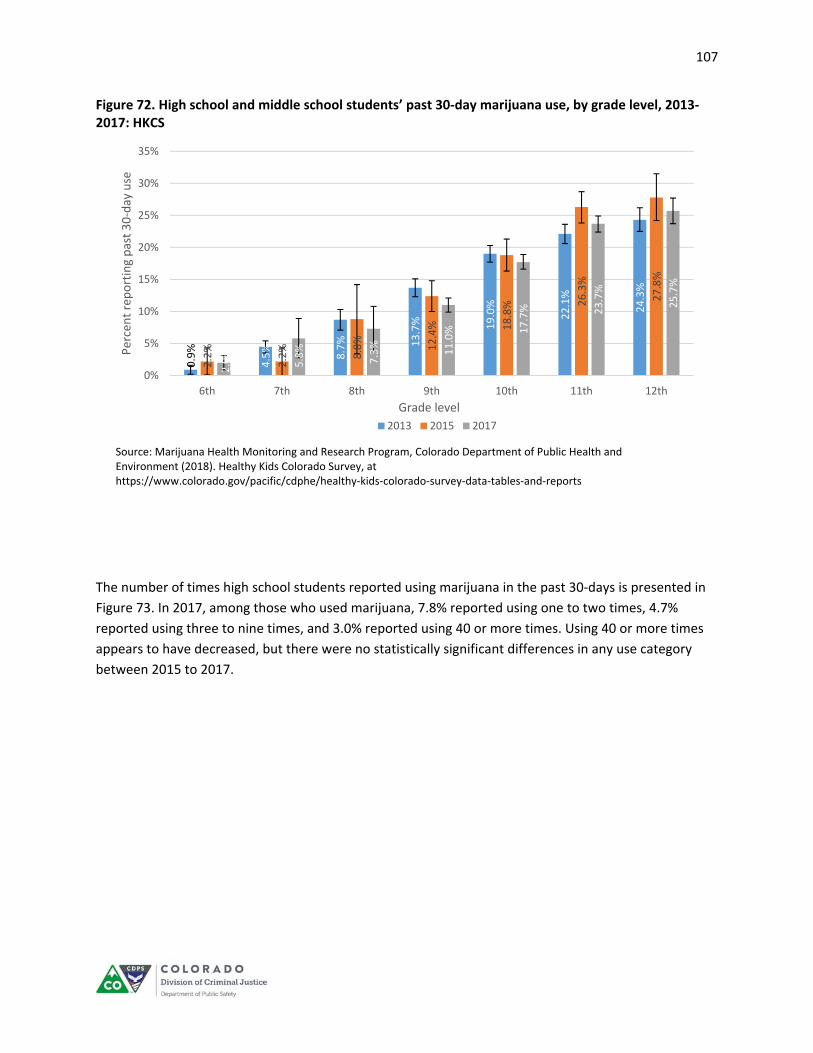
107
Figure 72. High school and middle school students’ past 30‐day marijuana use, by grade level, 2013‐2017: HKCS
The number of times high school students reported using marijuana in the past 30‐days is presented in
Figure 73. In 2017, among those who used marijuana, 7.8% reported using one to two times, 4.7%
reported using three to nine times, and 3.0% reported using 40 or more times. Using 40 or more times
appears to have decreased, but there were no statistically significant differences in any use category
between 2015 to 2017.
0.9%
4.5%
8.7% 13.7% 19.0%
22.1%
24.3%
2.2%
2.2%
8.8%
12.4% 18.8% 26.3%
27.8%
2.0%
5.8%
7.3%
11.0% 17.7% 23.7%
25.7%
0%
5%
10%
15%
20%
25%
30%
35%
6th 7th 8th 9th 10th 11th 12th
Percent reporting past 30‐day use
Grade level
2013 2015 2017
Source: Marijuana Health Monitoring and Research Program, Colorado Department of Public Health and Environment (2018). Healthy Kids Colorado Survey, athttps://www.colorado.gov/pacific/cdphe/healthy‐kids‐colorado‐survey‐data‐tables‐and‐reports

108
Figure 73. High school students’ marijuana use frequency in past 30 days, 2005–2017: HKCS
Source: Marijuana Health Monitoring and Research Program, Colorado Department of Public Health and Environment (2018).
Healthy Kids Colorado Survey, at
https://www.colorado.gov/pacific/cdphe/healthy‐kids‐colorado‐survey‐hkcs‐monitoring‐trends‐youth‐marijuana‐use
The most common method of marijuana use, reported by the 19.4% of high school students who used
marijuana in the past 30‐days, was smoking (88.4%), followed by eating (35.6%), and dabbing63 (34.4%).
The percent of high school students reporting eating and dabbing marijuana in the past 30‐days both
increased significantly from 2015 to 2017 (Figure 74).
63 Dabbing is a method of use in which a high THC concentrate (25%‐90% THC) is placed on a small metal “nail,” heated up to a very high temperature, and then inhaled through a glass device known as a “dab rig.” For a more complete description of concentrates and dabbing, see https://www.ncbi.nlm.nih.gov/pmc/articles/PMC5679763/; https://ajp.psychiatryonline.org/doi/full/10.1176/appi.ajp‐rj.2016.110604; https://www.theatlantic.com/national/archive/2013/05/amateurs‐guide‐dabs/315221/.
6.9%
5.5%
3.9%
2.6% 3.8%
6.8%
4.4%
3.8%
2.5%
5.3%
7.6%
6.0%
3.0%
2.2%
6.0%7.1%
4.7%
2.6%
2.3%
5.3%6.6%
4.7%
2.4%
1.9%
4.1%
7.6%
5.3%
2.7%
1.8%
3.9%
7.8%
4.7%
2.2%
1.7% 3.0%
0%
2%
4%
6%
8%
10%
12%
1‐2 times 3‐9 times 10‐19 times 20‐39 times 40 times or more
Percent reporting freq
uen
cy of use in
past 3o‐days
Number of times used per month
2005 2007 2009 2011 2013 2015 2017
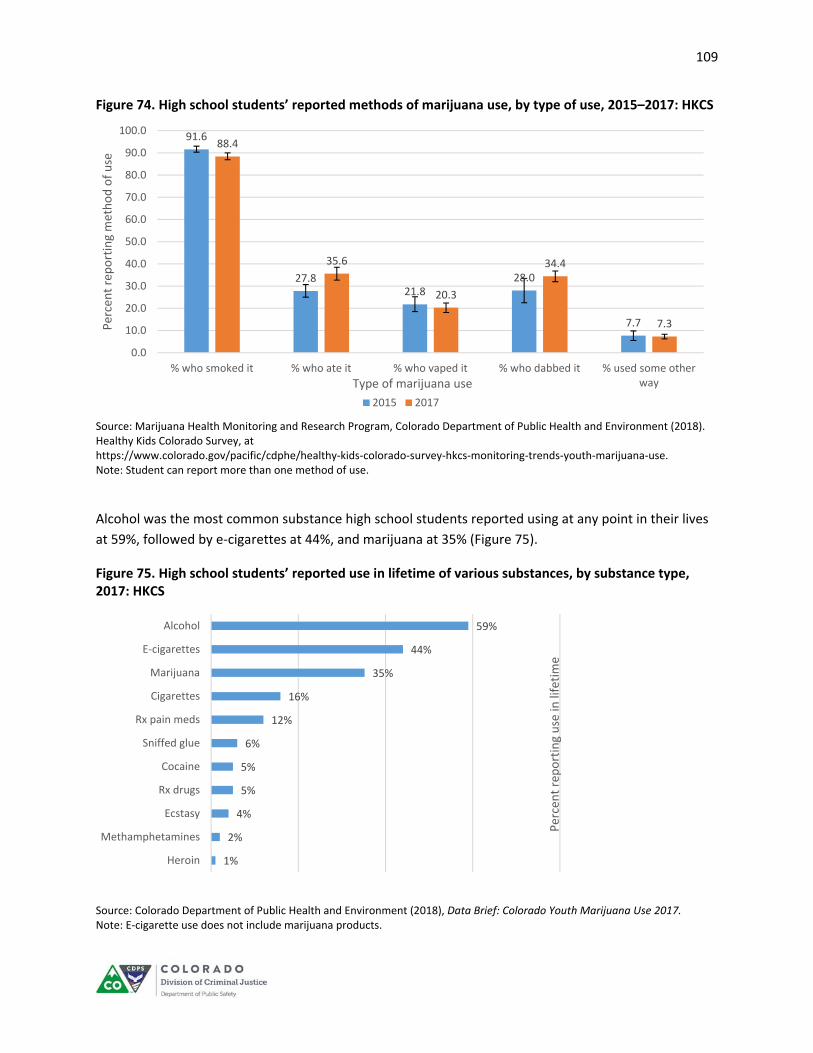
109
Figure 74. High school students’ reported methods of marijuana use, by type of use, 2015–2017: HKCS
Source: Marijuana Health Monitoring and Research Program, Colorado Department of Public Health and Environment (2018). Healthy Kids Colorado Survey, at https://www.colorado.gov/pacific/cdphe/healthy‐kids‐colorado‐survey‐hkcs‐monitoring‐trends‐youth‐marijuana‐use. Note: Student can report more than one method of use.
Alcohol was the most common substance high school students reported using at any point in their lives
at 59%, followed by e‐cigarettes at 44%, and marijuana at 35% (Figure 75).
Figure 75. High school students’ reported use in lifetime of various substances, by substance type, 2017: HKCS
Source: Colorado Department of Public Health and Environment (2018), Data Brief: Colorado Youth Marijuana Use 2017. Note: E‐cigarette use does not include marijuana products.
91.6
27.821.8
28.0
7.7
88.4
35.6
20.3
34.4
7.3
0.0
10.0
20.0
30.0
40.0
50.0
60.0
70.0
80.0
90.0
100.0
% who smoked it % who ate it % who vaped it % who dabbed it % used some otherway
Percent reporting method of use
Type of marijuana use
2015 2017
59%
44%
35%
16%
12%
6%
5%
5%
4%
2%
1%
Alcohol
E‐cigarettes
Marijuana
Cigarettes
Rx pain meds
Sniffed glue
Cocaine
Rx drugs
Ecstasy
Methamphetamines
Heroin
Percent reporting use in
lifetime
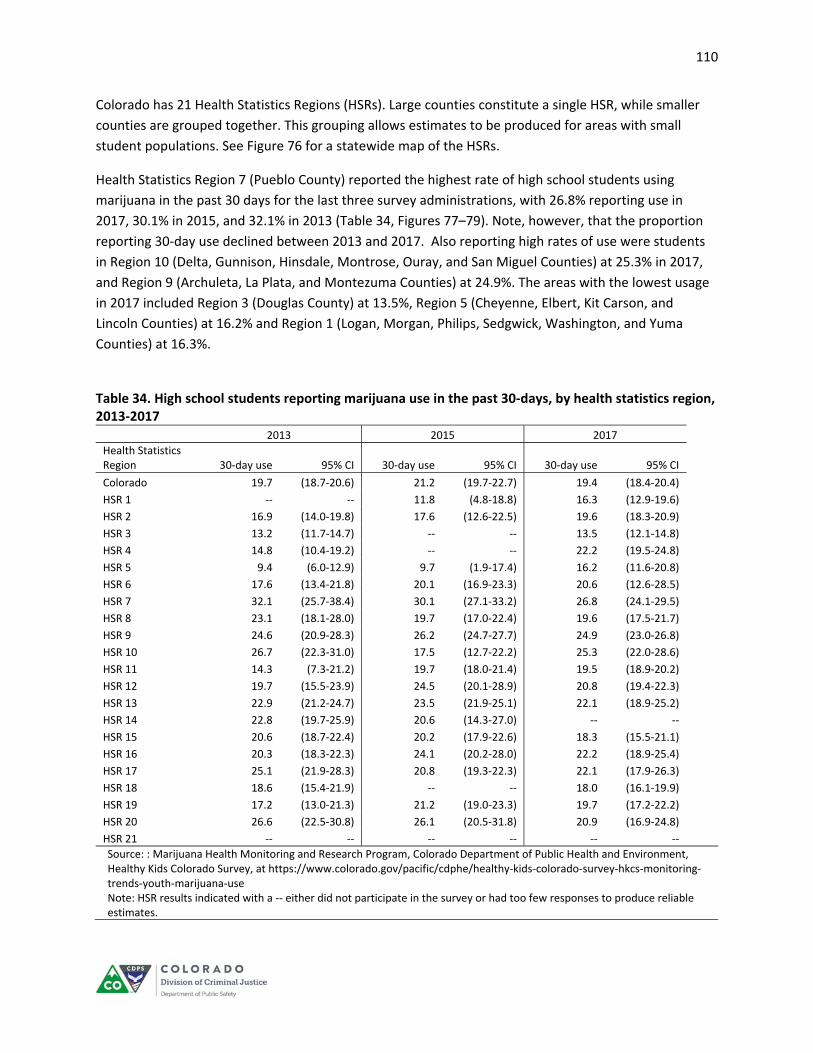
110
Colorado has 21 Health Statistics Regions (HSRs). Large counties constitute a single HSR, while smaller
counties are grouped together. This grouping allows estimates to be produced for areas with small
student populations. See Figure 76 for a statewide map of the HSRs.
Health Statistics Region 7 (Pueblo County) reported the highest rate of high school students using
marijuana in the past 30 days for the last three survey administrations, with 26.8% reporting use in
2017, 30.1% in 2015, and 32.1% in 2013 (Table 34, Figures 77–79). Note, however, that the proportion
reporting 30‐day use declined between 2013 and 2017. Also reporting high rates of use were students
in Region 10 (Delta, Gunnison, Hinsdale, Montrose, Ouray, and San Miguel Counties) at 25.3% in 2017,
and Region 9 (Archuleta, La Plata, and Montezuma Counties) at 24.9%. The areas with the lowest usage
in 2017 included Region 3 (Douglas County) at 13.5%, Region 5 (Cheyenne, Elbert, Kit Carson, and
Lincoln Counties) at 16.2% and Region 1 (Logan, Morgan, Philips, Sedgwick, Washington, and Yuma
Counties) at 16.3%.
Table 34. High school students reporting marijuana use in the past 30‐days, by health statistics region, 2013‐2017 2013 2015 2017
Health Statistics Region 30‐day use 95% CI 30‐day use 95% CI 30‐day use 95% CI
Colorado 19.7 (18.7‐20.6) 21.2 (19.7‐22.7) 19.4 (18.4‐20.4)
HSR 1 ‐‐ ‐‐ 11.8 (4.8‐18.8) 16.3 (12.9‐19.6)
HSR 2 16.9 (14.0‐19.8) 17.6 (12.6‐22.5) 19.6 (18.3‐20.9)
HSR 3 13.2 (11.7‐14.7) ‐‐ ‐‐ 13.5 (12.1‐14.8)
HSR 4 14.8 (10.4‐19.2) ‐‐ ‐‐ 22.2 (19.5‐24.8)
HSR 5 9.4 (6.0‐12.9) 9.7 (1.9‐17.4) 16.2 (11.6‐20.8)
HSR 6 17.6 (13.4‐21.8) 20.1 (16.9‐23.3) 20.6 (12.6‐28.5)
HSR 7 32.1 (25.7‐38.4) 30.1 (27.1‐33.2) 26.8 (24.1‐29.5)
HSR 8 23.1 (18.1‐28.0) 19.7 (17.0‐22.4) 19.6 (17.5‐21.7)
HSR 9 24.6 (20.9‐28.3) 26.2 (24.7‐27.7) 24.9 (23.0‐26.8)
HSR 10 26.7 (22.3‐31.0) 17.5 (12.7‐22.2) 25.3 (22.0‐28.6)
HSR 11 14.3 (7.3‐21.2) 19.7 (18.0‐21.4) 19.5 (18.9‐20.2)
HSR 12 19.7 (15.5‐23.9) 24.5 (20.1‐28.9) 20.8 (19.4‐22.3)
HSR 13 22.9 (21.2‐24.7) 23.5 (21.9‐25.1) 22.1 (18.9‐25.2)
HSR 14 22.8 (19.7‐25.9) 20.6 (14.3‐27.0) ‐‐ ‐‐
HSR 15 20.6 (18.7‐22.4) 20.2 (17.9‐22.6) 18.3 (15.5‐21.1)
HSR 16 20.3 (18.3‐22.3) 24.1 (20.2‐28.0) 22.2 (18.9‐25.4)
HSR 17 25.1 (21.9‐28.3) 20.8 (19.3‐22.3) 22.1 (17.9‐26.3)
HSR 18 18.6 (15.4‐21.9) ‐‐ ‐‐ 18.0 (16.1‐19.9)
HSR 19 17.2 (13.0‐21.3) 21.2 (19.0‐23.3) 19.7 (17.2‐22.2)
HSR 20 26.6 (22.5‐30.8) 26.1 (20.5‐31.8) 20.9 (16.9‐24.8)
HSR 21 ‐‐ ‐‐ ‐‐ ‐‐ ‐‐ ‐‐
Source: : Marijuana Health Monitoring and Research Program, Colorado Department of Public Health and Environment, Healthy Kids Colorado Survey, at https://www.colorado.gov/pacific/cdphe/healthy‐kids‐colorado‐survey‐hkcs‐monitoring‐trends‐youth‐marijuana‐use Note: HSR results indicated with a ‐‐ either did not participate in the survey or had too few responses to produce reliable estimates.
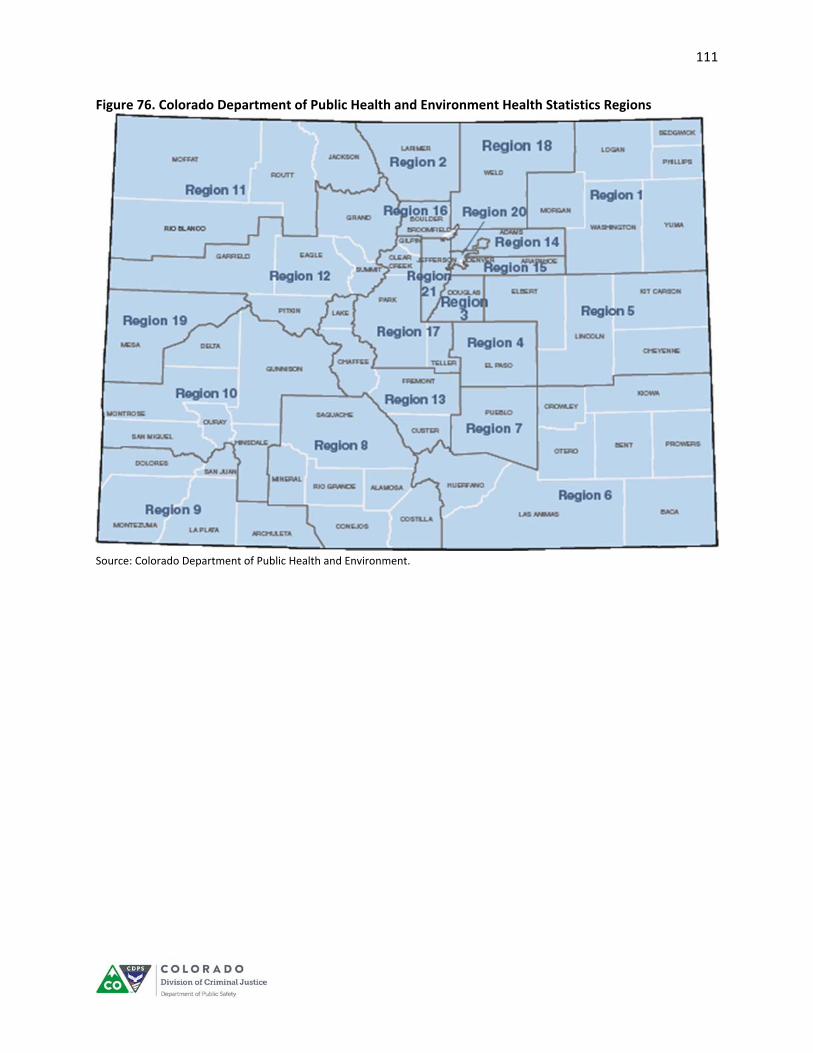
111
Figure 76. Colorado Department of Public Health and Environment Health Statistics Regions
Source: Colorado Department of Public Health and Environment.

112
Figure 77. High school students’ past 30‐day marijuana use, by health statistics region, 2017: HKCS
Source: Marijuana Health Monitoring and Research Program, Colorado Department of Public Health and Environment, Healthy Kids Colorado Survey, at https://www.colorado.gov/pacific/cdphe/healthy‐kids‐colorado‐survey‐hkcs‐monitoring‐trends‐youth‐marijuana‐use Note: Adams County (Region 14) and Jefferson County (Region 21) did not have enough responses to create reliable estimates in the 2017 Healthy Kids Colorado Survey.
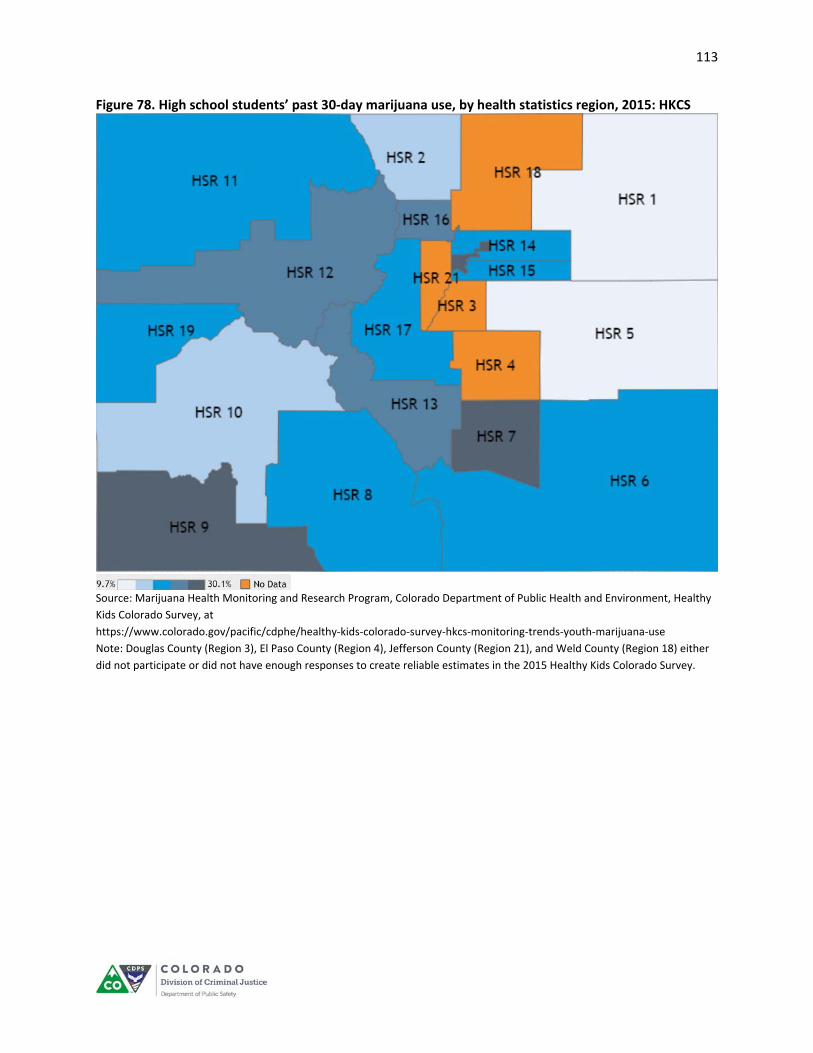
113
Figure 78. High school students’ past 30‐day marijuana use, by health statistics region, 2015: HKCS
Source: Marijuana Health Monitoring and Research Program, Colorado Department of Public Health and Environment, Healthy
Kids Colorado Survey, at
https://www.colorado.gov/pacific/cdphe/healthy‐kids‐colorado‐survey‐hkcs‐monitoring‐trends‐youth‐marijuana‐use
Note: Douglas County (Region 3), El Paso County (Region 4), Jefferson County (Region 21), and Weld County (Region 18) either
did not participate or did not have enough responses to create reliable estimates in the 2015 Healthy Kids Colorado Survey.
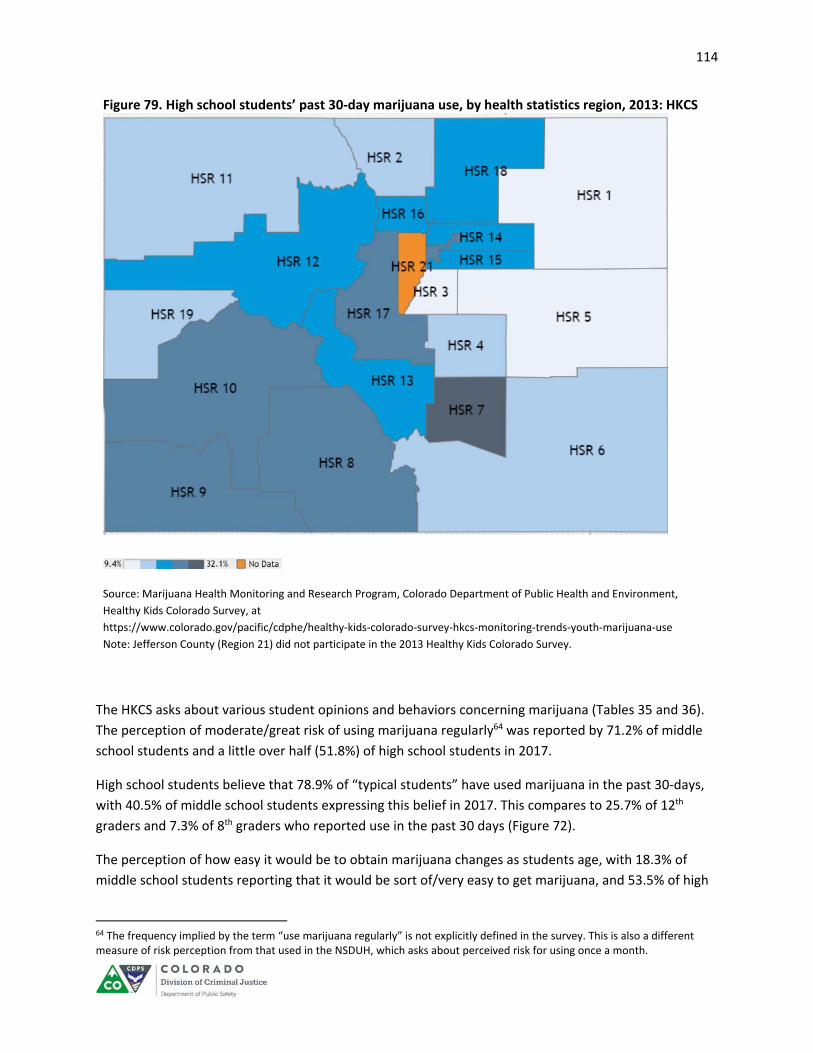
114
Figure 79. High school students’ past 30‐day marijuana use, by health statistics region, 2013: HKCS
Source: Marijuana Health Monitoring and Research Program, Colorado Department of Public Health and Environment,
Healthy Kids Colorado Survey, at
https://www.colorado.gov/pacific/cdphe/healthy‐kids‐colorado‐survey‐hkcs‐monitoring‐trends‐youth‐marijuana‐use
Note: Jefferson County (Region 21) did not participate in the 2013 Healthy Kids Colorado Survey.
The HKCS asks about various student opinions and behaviors concerning marijuana (Tables 35 and 36).
The perception of moderate/great risk of using marijuana regularly64 was reported by 71.2% of middle
school students and a little over half (51.8%) of high school students in 2017.
High school students believe that 78.9% of “typical students” have used marijuana in the past 30‐days,
with 40.5% of middle school students expressing this belief in 2017. This compares to 25.7% of 12th
graders and 7.3% of 8th graders who reported use in the past 30 days (Figure 72).
The perception of how easy it would be to obtain marijuana changes as students age, with 18.3% of
middle school students reporting that it would be sort of/very easy to get marijuana, and 53.5% of high
64 The frequency implied by the term “use marijuana regularly” is not explicitly defined in the survey. This is also a different measure of risk perception from that used in the NSDUH, which asks about perceived risk for using once a month.
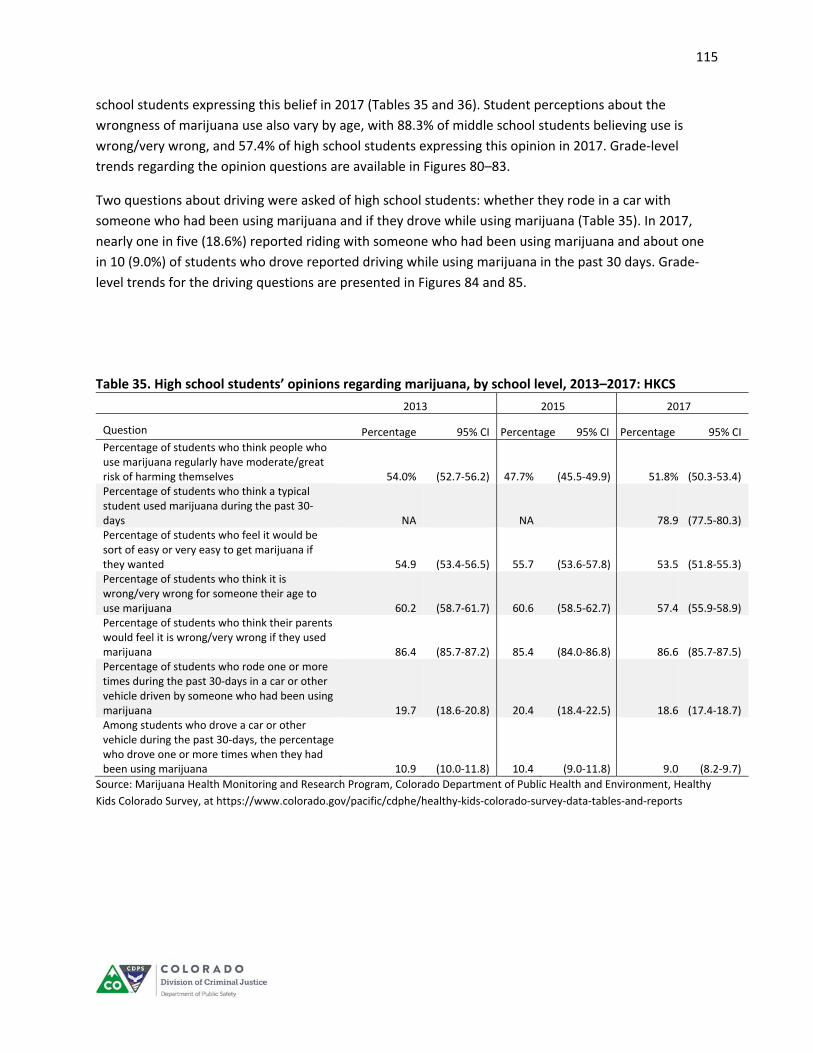
115
school students expressing this belief in 2017 (Tables 35 and 36). Student perceptions about the
wrongness of marijuana use also vary by age, with 88.3% of middle school students believing use is
wrong/very wrong, and 57.4% of high school students expressing this opinion in 2017. Grade‐level
trends regarding the opinion questions are available in Figures 80–83.
Two questions about driving were asked of high school students: whether they rode in a car with
someone who had been using marijuana and if they drove while using marijuana (Table 35). In 2017,
nearly one in five (18.6%) reported riding with someone who had been using marijuana and about one
in 10 (9.0%) of students who drove reported driving while using marijuana in the past 30 days. Grade‐
level trends for the driving questions are presented in Figures 84 and 85.
Table 35. High school students’ opinions regarding marijuana, by school level, 2013–2017: HKCS
2013 2015 2017
Question Percentage 95% CI Percentage 95% CI Percentage 95% CI
Percentage of students who think people who use marijuana regularly have moderate/great risk of harming themselves 54.0% (52.7‐56.2) 47.7% (45.5‐49.9) 51.8% (50.3‐53.4) Percentage of students who think a typical student used marijuana during the past 30‐days NA NA 78.9 (77.5‐80.3) Percentage of students who feel it would be sort of easy or very easy to get marijuana if they wanted 54.9 (53.4‐56.5) 55.7 (53.6‐57.8) 53.5 (51.8‐55.3) Percentage of students who think it is wrong/very wrong for someone their age to use marijuana 60.2 (58.7‐61.7) 60.6 (58.5‐62.7) 57.4 (55.9‐58.9) Percentage of students who think their parents would feel it is wrong/very wrong if they used marijuana 86.4 (85.7‐87.2) 85.4 (84.0‐86.8) 86.6 (85.7‐87.5) Percentage of students who rode one or more times during the past 30‐days in a car or other vehicle driven by someone who had been using marijuana 19.7 (18.6‐20.8) 20.4 (18.4‐22.5) 18.6 (17.4‐18.7) Among students who drove a car or other vehicle during the past 30‐days, the percentage who drove one or more times when they had been using marijuana 10.9 (10.0‐11.8) 10.4 (9.0‐11.8) 9.0 (8.2‐9.7)
Source: Marijuana Health Monitoring and Research Program, Colorado Department of Public Health and Environment, Healthy
Kids Colorado Survey, at https://www.colorado.gov/pacific/cdphe/healthy‐kids‐colorado‐survey‐data‐tables‐and‐reports
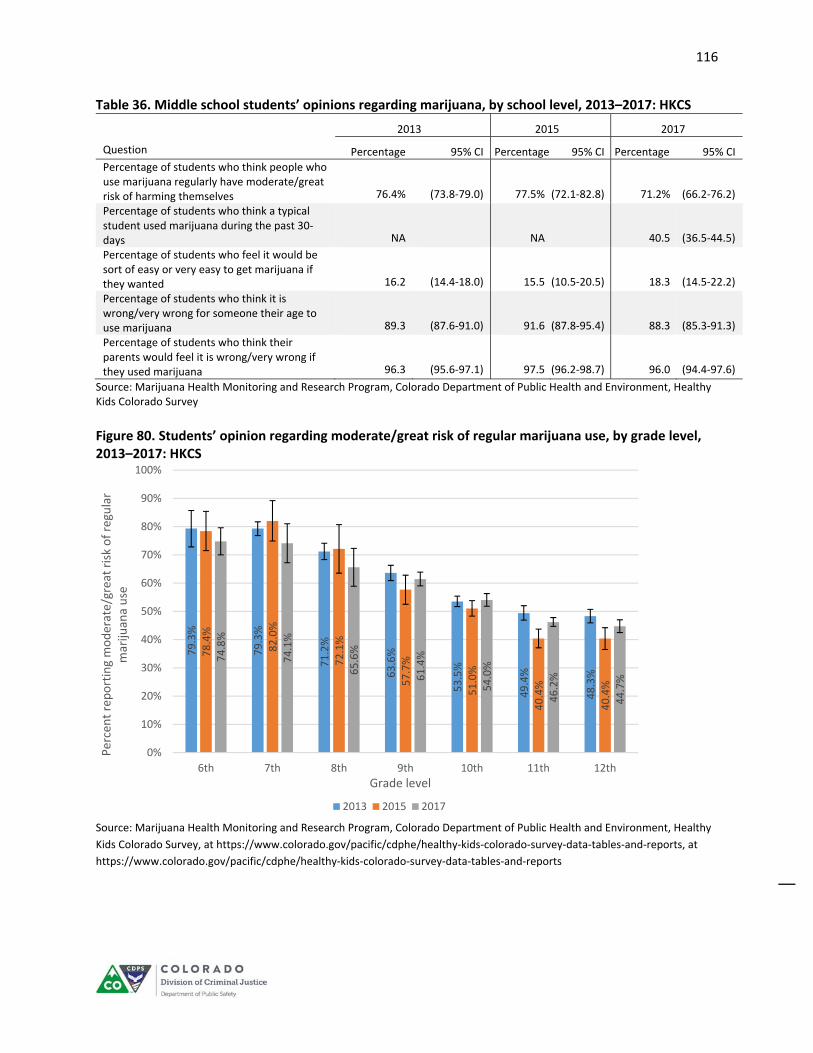
116
Table 36. Middle school students’ opinions regarding marijuana, by school level, 2013–2017: HKCS
2013 2015 2017
Question Percentage 95% CI Percentage 95% CI Percentage 95% CI
Percentage of students who think people who use marijuana regularly have moderate/great risk of harming themselves 76.4% (73.8‐79.0) 77.5% (72.1‐82.8) 71.2% (66.2‐76.2)
Percentage of students who think a typical student used marijuana during the past 30‐days NA NA 40.5 (36.5‐44.5)
Percentage of students who feel it would be sort of easy or very easy to get marijuana if they wanted 16.2 (14.4‐18.0) 15.5 (10.5‐20.5) 18.3 (14.5‐22.2)
Percentage of students who think it is wrong/very wrong for someone their age to use marijuana 89.3 (87.6‐91.0) 91.6 (87.8‐95.4) 88.3 (85.3‐91.3)
Percentage of students who think their parents would feel it is wrong/very wrong if they used marijuana 96.3 (95.6‐97.1) 97.5 (96.2‐98.7) 96.0 (94.4‐97.6)
Source: Marijuana Health Monitoring and Research Program, Colorado Department of Public Health and Environment, Healthy Kids Colorado Survey Figure 80. Students’ opinion regarding moderate/great risk of regular marijuana use, by grade level, 2013–2017: HKCS
Source: Marijuana Health Monitoring and Research Program, Colorado Department of Public Health and Environment, Healthy
Kids Colorado Survey, at https://www.colorado.gov/pacific/cdphe/healthy‐kids‐colorado‐survey‐data‐tables‐and‐reports, at
https://www.colorado.gov/pacific/cdphe/healthy‐kids‐colorado‐survey‐data‐tables‐and‐reports
79.3%
79.3%
71.2%
63.6%
53.5%
49.4%
48.3%
78.4%
82.0%
72.1%
57.7%
51.0%
40.4%
40.4%
74.8%
74.1%
65.6%
61.4%
54.0%
46.2%
44.7%
0%
10%
20%
30%
40%
50%
60%
70%
80%
90%
100%
6th 7th 8th 9th 10th 11th 12th
Percent reporting moderate/grea
t risk of regu
lar
mariju
ana use
Grade level
2013 2015 2017

117
Source: Marijuana Health Monitoring and Research Program, Colorado Department of Public Health and Environment, Healthy
Kids Colorado Survey, at https://www.colorado.gov/pacific/cdphe/healthy‐kids‐colorado‐survey‐data‐tables‐and‐reports
Figure 82. Students’ opinion regarding whether marijuana use is wrong, by grade level, 2013–2017: HKCS
Source: Marijuana Health Monitoring and Research Program, Colorado Department of Public Health and Environment, Healthy
Kids Colorado Survey, at https://www.colorado.gov/pacific/cdphe/healthy‐kids‐colorado‐survey‐data‐tables‐and‐reports
95.5%
91.0%
82.8%
72.1%
62.0%
55.8%
49.5%
94.1%
92.7%
88.3%
74.4%
64.1%
52.0%
49.9%
93.9%
90.0%
81.6%
71.3%
59.9%
52.3%
44.9%
0%
10%
20%
30%
40%
50%
60%
70%
80%
90%
100%
6th 7th 8th 9th 10th 11th 12th
Percent believing mariju
ana use is wrong
Grade level
2013 2015 2017
5.7%
13.8%
26.2% 41.5%
51.9%
60.3%
67.7%
5.8%
13.5%
25.3% 40.7% 52.9% 65.0%
66.6%
8.9%
17.6%
26.6% 38.6% 50.8%
60.7%
65.4%
0%
10%
20%
30%
40%
50%
60%
70%
80%
6th 7th 8th 9th 10th 11th 12th
Percent reporting mariju
ana ea
sy/very ea
sy
to get
Grade level
2013 2015 2017
Figure 81. Students’ opinion regarding marijuana being easy/very easy to get, by grade level, 2013–2017: HKCS
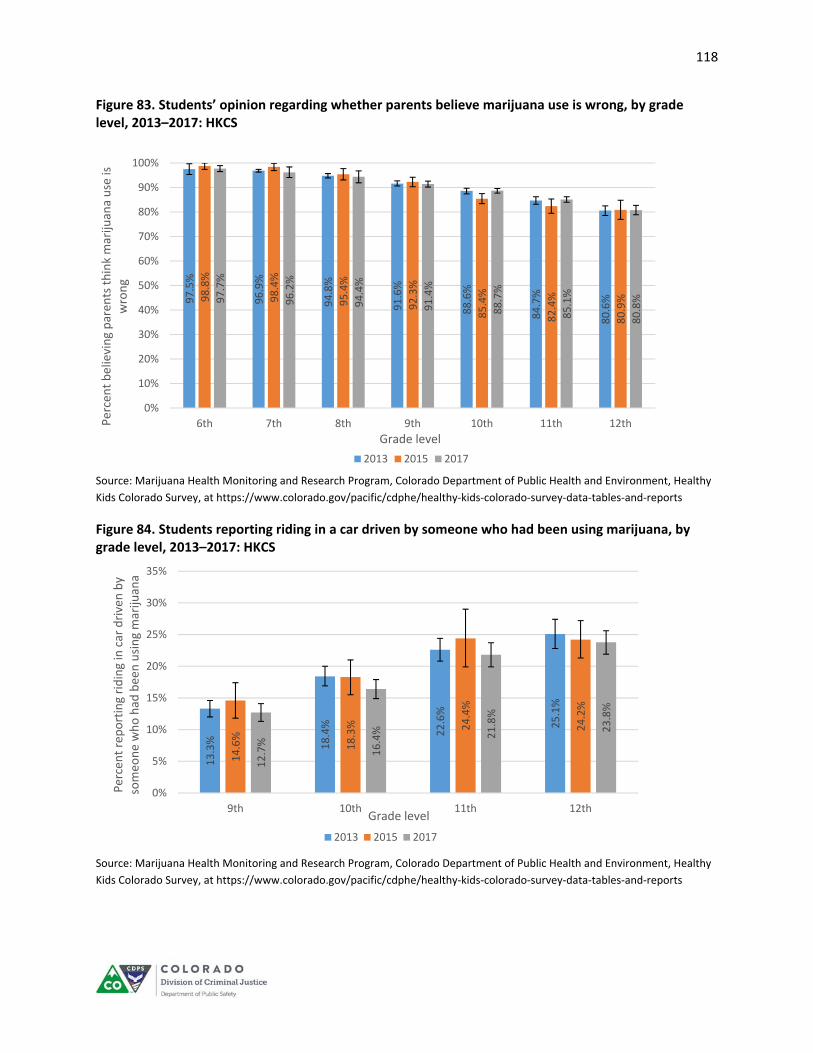
118
Figure 83. Students’ opinion regarding whether parents believe marijuana use is wrong, by grade level, 2013–2017: HKCS
Source: Marijuana Health Monitoring and Research Program, Colorado Department of Public Health and Environment, Healthy
Kids Colorado Survey, at https://www.colorado.gov/pacific/cdphe/healthy‐kids‐colorado‐survey‐data‐tables‐and‐reports
Figure 84. Students reporting riding in a car driven by someone who had been using marijuana, by grade level, 2013–2017: HKCS
Source: Marijuana Health Monitoring and Research Program, Colorado Department of Public Health and Environment, Healthy
Kids Colorado Survey, at https://www.colorado.gov/pacific/cdphe/healthy‐kids‐colorado‐survey‐data‐tables‐and‐reports
97.5%
96.9%
94.8%
91.6%
88.6%
84.7%
80.6%98.8%
98.4%
95.4%
92.3%
85.4%
82.4%
80.9%97.7%
96.2%
94.4%
91.4%
88.7%
85.1%
80.8%
0%
10%
20%
30%
40%
50%
60%
70%
80%
90%
100%
6th 7th 8th 9th 10th 11th 12thPercent believing paren
ts think mariju
ana use is
wrong
Grade level
2013 2015 2017
13.3% 18.4%
22.6%
25.1%
14.6%
18.3% 24.4%
24.2%
12.7%
16.4% 21.8%
23.8%
0%
5%
10%
15%
20%
25%
30%
35%
9th 10th 11th 12th
Percent reporting riding in car driven by
someo
ne who had
bee
n using mariju
ana
Grade level
2013 2015 2017

119
Figure 85. Students reporting driving car when they had been using marijuana, by grade level, 2013–2017: HKCS
Source: Marijuana Health Monitoring and Research Program, Colorado Department of Public Health and Environment, Healthy
Kids Colorado Survey, at https://www.colorado.gov/pacific/cdphe/healthy‐kids‐colorado‐survey‐data‐tables‐and‐reports
National Survey on Drug Use and Health
The federal Substance Abuse and Mental Health Services Administration (SAMHSA) conducts the annual
National Survey on Drug Use and Health (NSDUH).65 The NSDUH is the primary source of information on
the prevalence, patterns, and consequences of alcohol, tobacco, and illegal drug use and abuse, and
mental disorders in the U.S. civilian, noninstitutionalized population, age 12 and older. The survey
generates estimates at the national, state, and sub‐state levels. The NSDUH is state‐based, with an
independent, multistage area probability sample within each state and the District of Columbia.
SAMHSA produces state‐level estimates from a two‐year rolling sample. This means that each year
presented in this report actually represents two years of data. The two‐year usage prevalence rates for
Colorado residents 12 to 17 years old are based on weighted estimates from between 500 to 650 survey
respondents.
The proportion of Colorado youth reporting marijuana use in the past 30 days was significantly higher
than the national average for the entire period from 2008/2009 through 2015/2016 (Figure 86).66 The
2015/2016 30‐day marijuana use percentage in Colorado (9.1%) was significantly lower than the
2014/2015 estimate (11.1%) and was equal to the 2007/2008 estimate. A map with state‐level estimates
65 Descriptions of the NSDUH are derived from information available at http://www.samhsa.gov/data/population‐data‐nsduh/reports. 66 SAMHSA produces p‐value tables that compare different geographic areas. P‐values below .05 are considered statistically significant.
11.1%14.1%
11.1%14.0%
10.0%13.4%
0%
5%
10%
15%
20%
25%
30%
35%
11th 12thPercent reporting driving a car when
they had
bee
n using mariju
ana
Grade level2013 2015 2017

120
of 30‐day usage is presented in Figure 87 and indicates that Colorado was in the top 20% of states for
youth marijuana usage.
Figure 86. Past 30‐day marijuana use, 12–17 years old, 2005/2006–2015/2016: NSDUH
Source: Substance Abuse and Mental Health Services Administration, National Survey on Drug Use and Health, at https://www.samhsa.gov/data/data‐we‐collect/nsduh‐national‐survey‐drug‐use‐and‐health
Figure 87. Past 30‐day marijuana use, 12‐ to 17‐year‐olds, by state, 2015/2016
Source: Substance Abuse and Mental Health Services Administration (2018), National Survey on Drug Use
and Health, 2015‐16 National Survey on Drug Use and Health National Maps of Prevalence Estimates, by State. Available at
https://www.samhsa.gov/data/sites/default/files/NSDUHsaeMaps2016/NSDUHsaeMaps2016.pdf
2005/06
2006/07
2007/08
2008/09
2009/10
2010/11
2011/12
2012/13
2013/14
2014/15
2015/16
Colorado 7.6% 8.1% 9.1% 10.2% 9.9% 10.7% 10.5% 11.2% 12.6% 11.1% 9.1%
U.S. 6.7% 6.7% 6.7% 7.4% 7.0% 7.6% 7.5% 7.1% 7.2% 7.2% 6.8%
0.0%
5.0%
10.0%
15.0%
20.0%
25.0%
30.0%
35.0%
40.0%
Percent reporting past 30‐day use
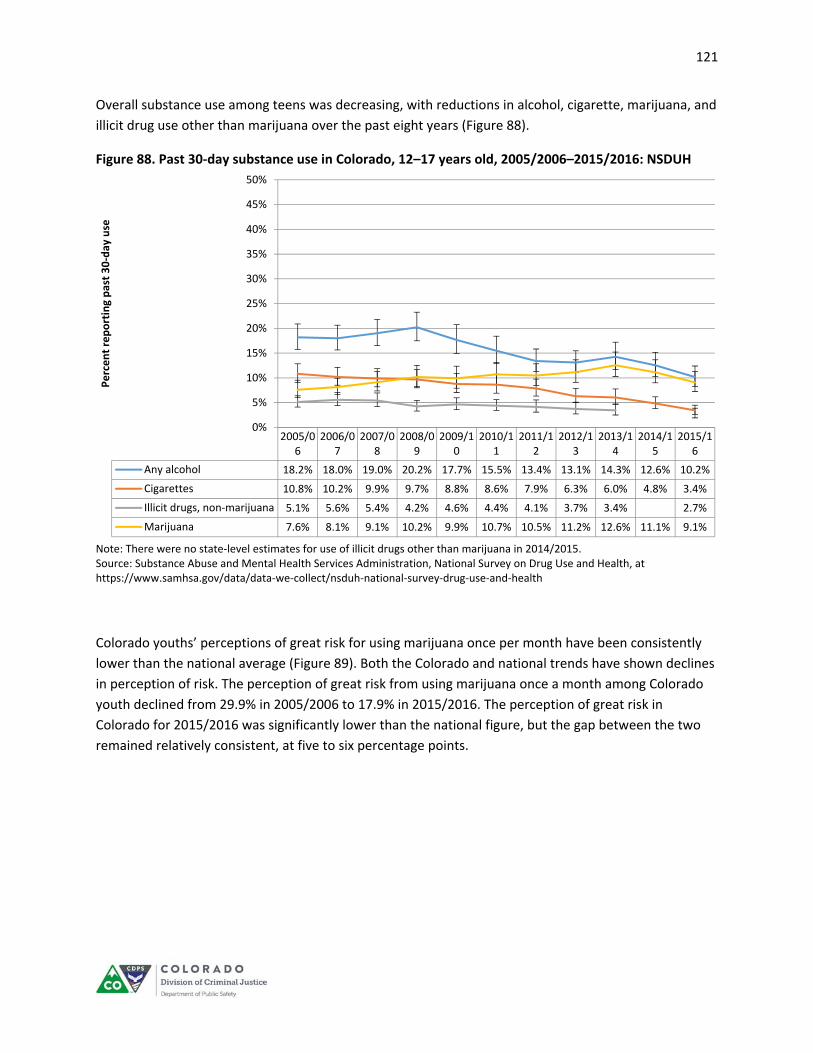
121
Overall substance use among teens was decreasing, with reductions in alcohol, cigarette, marijuana, and
illicit drug use other than marijuana over the past eight years (Figure 88).
Figure 88. Past 30‐day substance use in Colorado, 12–17 years old, 2005/2006–2015/2016: NSDUH
Note: There were no state‐level estimates for use of illicit drugs other than marijuana in 2014/2015. Source: Substance Abuse and Mental Health Services Administration, National Survey on Drug Use and Health, at https://www.samhsa.gov/data/data‐we‐collect/nsduh‐national‐survey‐drug‐use‐and‐health
Colorado youths’ perceptions of great risk for using marijuana once per month have been consistently
lower than the national average (Figure 89). Both the Colorado and national trends have shown declines
in perception of risk. The perception of great risk from using marijuana once a month among Colorado
youth declined from 29.9% in 2005/2006 to 17.9% in 2015/2016. The perception of great risk in
Colorado for 2015/2016 was significantly lower than the national figure, but the gap between the two
remained relatively consistent, at five to six percentage points.
2005/06
2006/07
2007/08
2008/09
2009/10
2010/11
2011/12
2012/13
2013/14
2014/15
2015/16
Any alcohol 18.2% 18.0% 19.0% 20.2% 17.7% 15.5% 13.4% 13.1% 14.3% 12.6% 10.2%
Cigarettes 10.8% 10.2% 9.9% 9.7% 8.8% 8.6% 7.9% 6.3% 6.0% 4.8% 3.4%
Illicit drugs, non‐marijuana 5.1% 5.6% 5.4% 4.2% 4.6% 4.4% 4.1% 3.7% 3.4% 2.7%
Marijuana 7.6% 8.1% 9.1% 10.2% 9.9% 10.7% 10.5% 11.2% 12.6% 11.1% 9.1%
0%
5%
10%
15%
20%
25%
30%
35%
40%
45%
50%
Percent reporting past 30‐day use
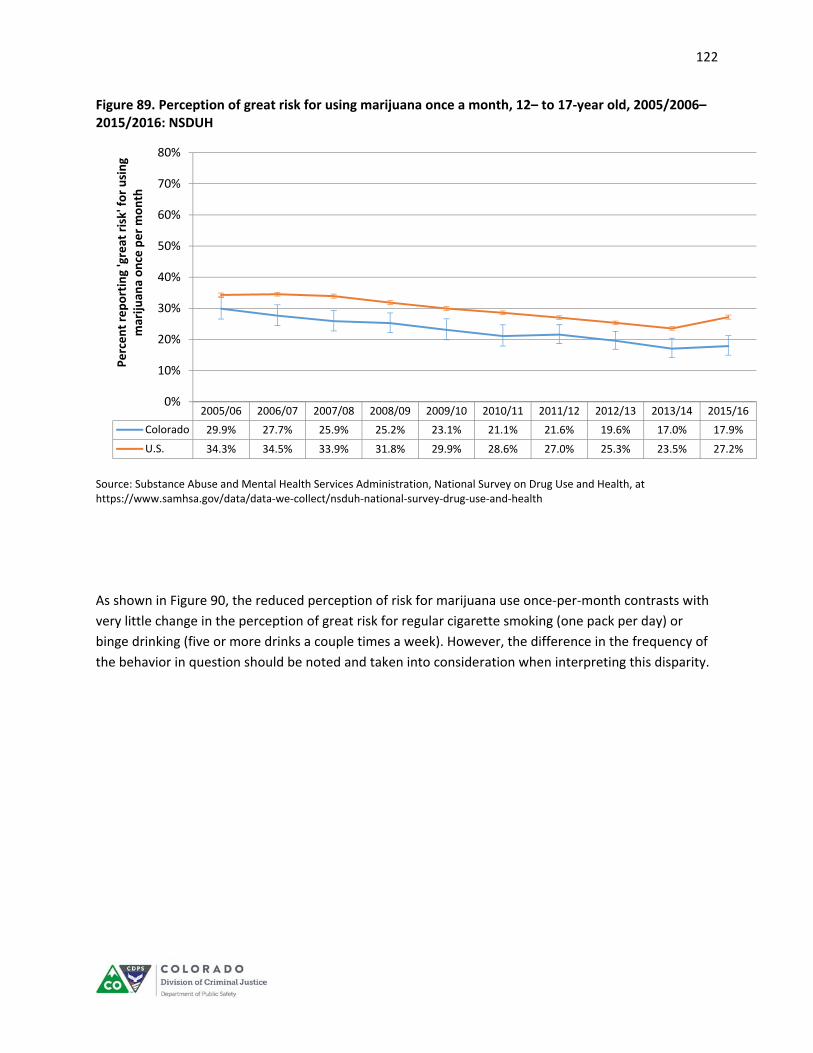
122
Figure 89. Perception of great risk for using marijuana once a month, 12– to 17‐year old, 2005/2006–2015/2016: NSDUH
Source: Substance Abuse and Mental Health Services Administration, National Survey on Drug Use and Health, at https://www.samhsa.gov/data/data‐we‐collect/nsduh‐national‐survey‐drug‐use‐and‐health
As shown in Figure 90, the reduced perception of risk for marijuana use once‐per‐month contrasts with
very little change in the perception of great risk for regular cigarette smoking (one pack per day) or
binge drinking (five or more drinks a couple times a week). However, the difference in the frequency of
the behavior in question should be noted and taken into consideration when interpreting this disparity.
2005/06 2006/07 2007/08 2008/09 2009/10 2010/11 2011/12 2012/13 2013/14 2015/16
Colorado 29.9% 27.7% 25.9% 25.2% 23.1% 21.1% 21.6% 19.6% 17.0% 17.9%
U.S. 34.3% 34.5% 33.9% 31.8% 29.9% 28.6% 27.0% 25.3% 23.5% 27.2%
0%
10%
20%
30%
40%
50%
60%
70%
80%
Percent reporting 'great risk' for using
marijuan
a once per month
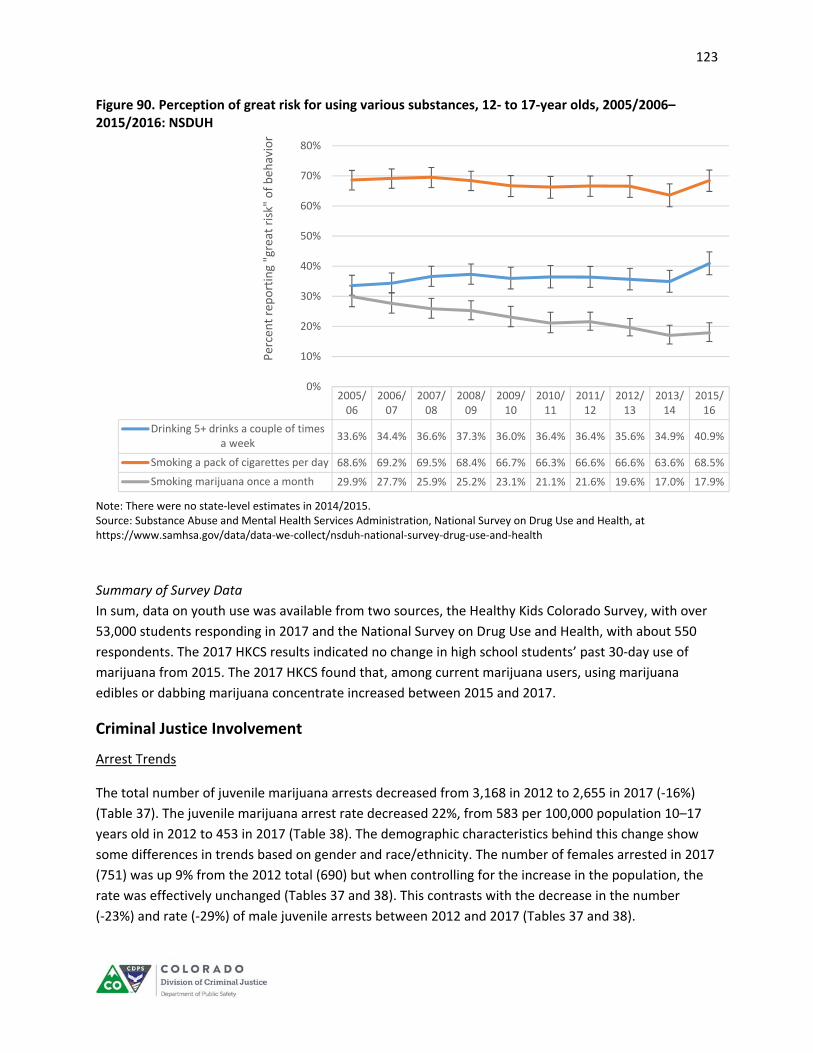
123
Figure 90. Perception of great risk for using various substances, 12‐ to 17‐year olds, 2005/2006–2015/2016: NSDUH
Note: There were no state‐level estimates in 2014/2015. Source: Substance Abuse and Mental Health Services Administration, National Survey on Drug Use and Health, at https://www.samhsa.gov/data/data‐we‐collect/nsduh‐national‐survey‐drug‐use‐and‐health
Summary of Survey Data
In sum, data on youth use was available from two sources, the Healthy Kids Colorado Survey, with over
53,000 students responding in 2017 and the National Survey on Drug Use and Health, with about 550
respondents. The 2017 HKCS results indicated no change in high school students’ past 30‐day use of
marijuana from 2015. The 2017 HKCS found that, among current marijuana users, using marijuana
edibles or dabbing marijuana concentrate increased between 2015 and 2017.
Criminal Justice Involvement
Arrest Trends
The total number of juvenile marijuana arrests decreased from 3,168 in 2012 to 2,655 in 2017 (‐16%)
(Table 37). The juvenile marijuana arrest rate decreased 22%, from 583 per 100,000 population 10–17
years old in 2012 to 453 in 2017 (Table 38). The demographic characteristics behind this change show
some differences in trends based on gender and race/ethnicity. The number of females arrested in 2017
(751) was up 9% from the 2012 total (690) but when controlling for the increase in the population, the
rate was effectively unchanged (Tables 37 and 38). This contrasts with the decrease in the number
(‐23%) and rate (‐29%) of male juvenile arrests between 2012 and 2017 (Tables 37 and 38).
2005/06
2006/07
2007/08
2008/09
2009/10
2010/11
2011/12
2012/13
2013/14
2015/16
Drinking 5+ drinks a couple of timesa week
33.6% 34.4% 36.6% 37.3% 36.0% 36.4% 36.4% 35.6% 34.9% 40.9%
Smoking a pack of cigarettes per day 68.6% 69.2% 69.5% 68.4% 66.7% 66.3% 66.6% 66.6% 63.6% 68.5%
Smoking marijuana once a month 29.9% 27.7% 25.9% 25.2% 23.1% 21.1% 21.6% 19.6% 17.0% 17.9%
0%
10%
20%
30%
40%
50%
60%
70%
80%
Percent reporting "great risk" of beh
avior
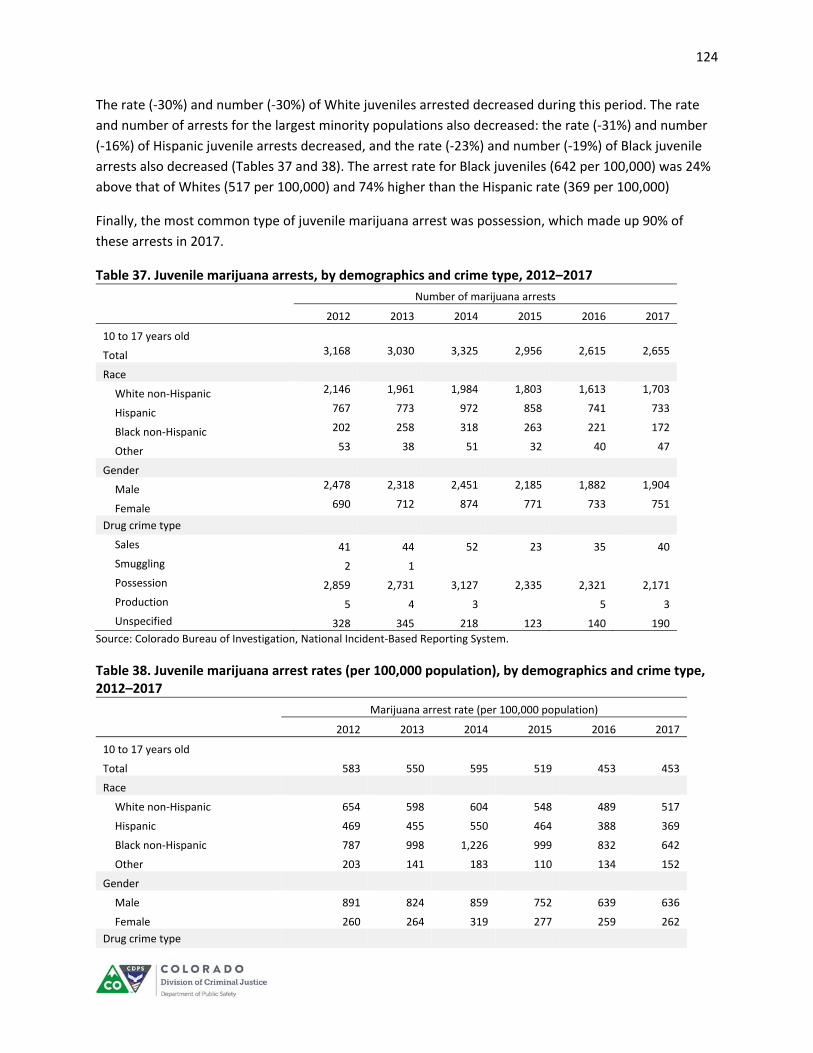
124
The rate (‐30%) and number (‐30%) of White juveniles arrested decreased during this period. The rate
and number of arrests for the largest minority populations also decreased: the rate (‐31%) and number
(‐16%) of Hispanic juvenile arrests decreased, and the rate (‐23%) and number (‐19%) of Black juvenile
arrests also decreased (Tables 37 and 38). The arrest rate for Black juveniles (642 per 100,000) was 24%
above that of Whites (517 per 100,000) and 74% higher than the Hispanic rate (369 per 100,000)
Finally, the most common type of juvenile marijuana arrest was possession, which made up 90% of
these arrests in 2017.
Table 37. Juvenile marijuana arrests, by demographics and crime type, 2012–2017
Number of marijuana arrests
2012 2013 2014 2015 2016 2017
10 to 17 years old
Total 3,168 3,030 3,325 2,956 2,615 2,655
Race
White non‐Hispanic 2,146 1,961 1,984 1,803 1,613 1,703
Hispanic 767 773 972 858 741 733
Black non‐Hispanic 202 258 318 263 221 172
Other 53 38 51 32 40 47
Gender
Male 2,478 2,318 2,451 2,185 1,882 1,904
Female 690 712 874 771 733 751
Drug crime type
Sales 41 44 52 23 35 40
Smuggling 2 1
Possession 2,859 2,731 3,127 2,335 2,321 2,171
Production 5 4 3 5 3
Unspecified 328 345 218 123 140 190
Source: Colorado Bureau of Investigation, National Incident‐Based Reporting System.
Table 38. Juvenile marijuana arrest rates (per 100,000 population), by demographics and crime type, 2012–2017
Marijuana arrest rate (per 100,000 population)
2012 2013 2014 2015 2016 2017
10 to 17 years old
Total 583 550 595 519 453 453
Race
White non‐Hispanic 654 598 604 548 489 517
Hispanic 469 455 550 464 388 369
Black non‐Hispanic 787 998 1,226 999 832 642
Other 203 141 183 110 134 152
Gender
Male 891 824 859 752 639 636
Female 260 264 319 277 259 262
Drug crime type
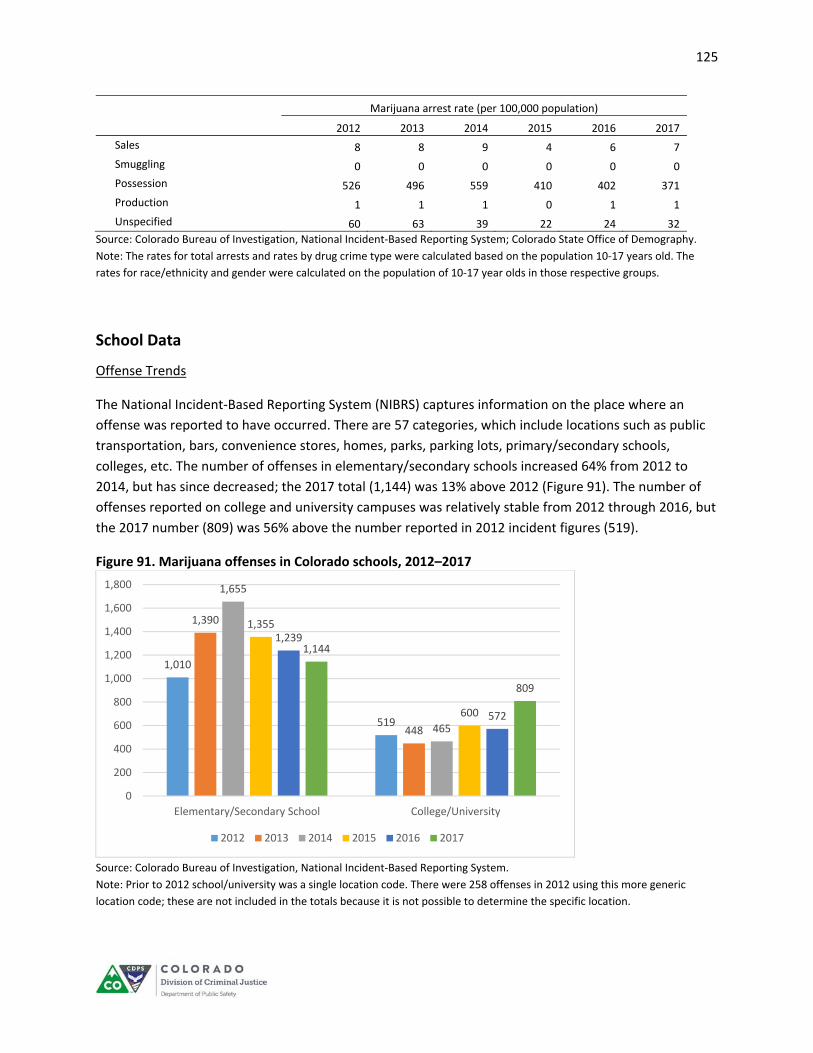
125
Marijuana arrest rate (per 100,000 population)
2012 2013 2014 2015 2016 2017
Sales 8 8 9 4 6 7
Smuggling 0 0 0 0 0 0
Possession 526 496 559 410 402 371
Production 1 1 1 0 1 1
Unspecified 60 63 39 22 24 32
Source: Colorado Bureau of Investigation, National Incident‐Based Reporting System; Colorado State Office of Demography.
Note: The rates for total arrests and rates by drug crime type were calculated based on the population 10‐17 years old. The
rates for race/ethnicity and gender were calculated on the population of 10‐17 year olds in those respective groups.
School Data
Offense Trends
The National Incident‐Based Reporting System (NIBRS) captures information on the place where an
offense was reported to have occurred. There are 57 categories, which include locations such as public
transportation, bars, convenience stores, homes, parks, parking lots, primary/secondary schools,
colleges, etc. The number of offenses in elementary/secondary schools increased 64% from 2012 to
2014, but has since decreased; the 2017 total (1,144) was 13% above 2012 (Figure 91). The number of
offenses reported on college and university campuses was relatively stable from 2012 through 2016, but
the 2017 number (809) was 56% above the number reported in 2012 incident figures (519).
Figure 91. Marijuana offenses in Colorado schools, 2012–2017
Source: Colorado Bureau of Investigation, National Incident‐Based Reporting System.
Note: Prior to 2012 school/university was a single location code. There were 258 offenses in 2012 using this more generic
location code; these are not included in the totals because it is not possible to determine the specific location.
1,010
519
1,390
448
1,655
465
1,355
600
1,239
572
1,144
809
0
200
400
600
800
1,000
1,200
1,400
1,600
1,800
Elementary/Secondary School College/University
2012 2013 2014 2015 2016 2017
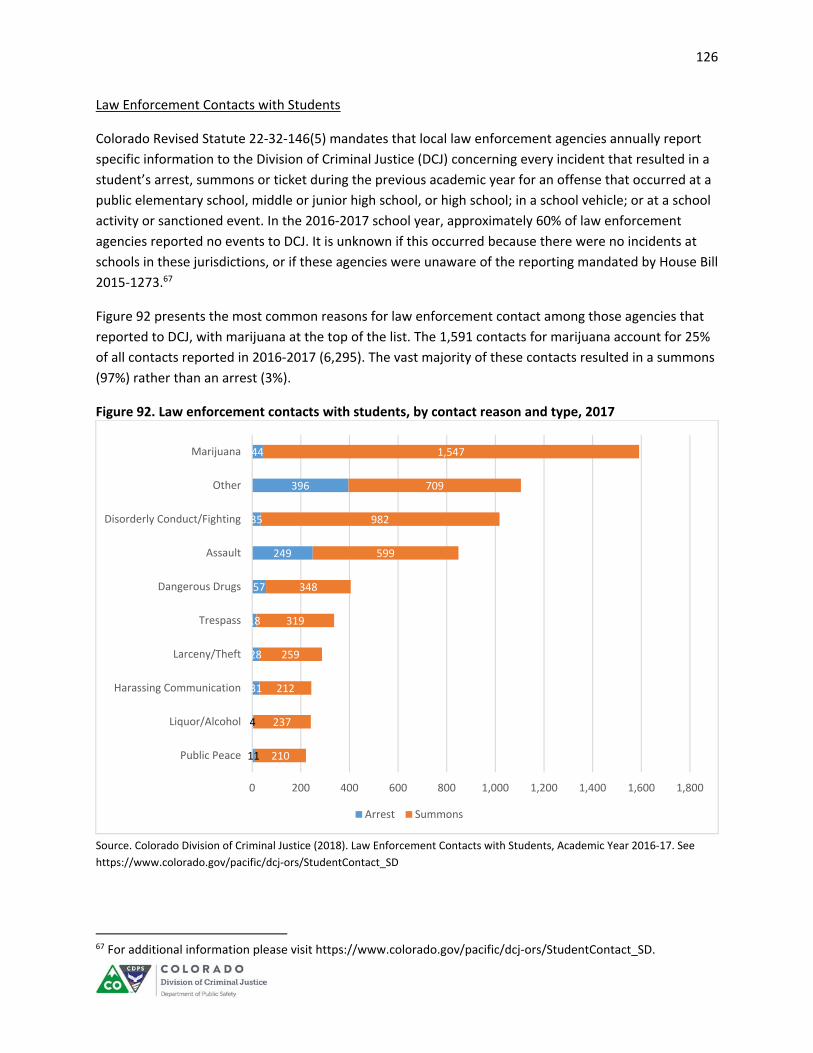
126
Law Enforcement Contacts with Students
Colorado Revised Statute 22‐32‐146(5) mandates that local law enforcement agencies annually report
specific information to the Division of Criminal Justice (DCJ) concerning every incident that resulted in a
student’s arrest, summons or ticket during the previous academic year for an offense that occurred at a
public elementary school, middle or junior high school, or high school; in a school vehicle; or at a school
activity or sanctioned event. In the 2016‐2017 school year, approximately 60% of law enforcement
agencies reported no events to DCJ. It is unknown if this occurred because there were no incidents at
schools in these jurisdictions, or if these agencies were unaware of the reporting mandated by House Bill
2015‐1273.67
Figure 92 presents the most common reasons for law enforcement contact among those agencies that
reported to DCJ, with marijuana at the top of the list. The 1,591 contacts for marijuana account for 25%
of all contacts reported in 2016‐2017 (6,295). The vast majority of these contacts resulted in a summons
(97%) rather than an arrest (3%).
Figure 92. Law enforcement contacts with students, by contact reason and type, 2017
Source. Colorado Division of Criminal Justice (2018). Law Enforcement Contacts with Students, Academic Year 2016‐17. See
https://www.colorado.gov/pacific/dcj‐ors/StudentContact_SD
67 For additional information please visit https://www.colorado.gov/pacific/dcj‐ors/StudentContact_SD.
11
4
31
28
18
57
249
35
396
44
210
237
212
259
319
348
599
982
709
1,547
0 200 400 600 800 1,000 1,200 1,400 1,600 1,800
Public Peace
Liquor/Alcohol
Harassing Communication
Larceny/Theft
Trespass
Dangerous Drugs
Assault
Disorderly Conduct/Fighting
Other
Marijuana
Arrest Summons
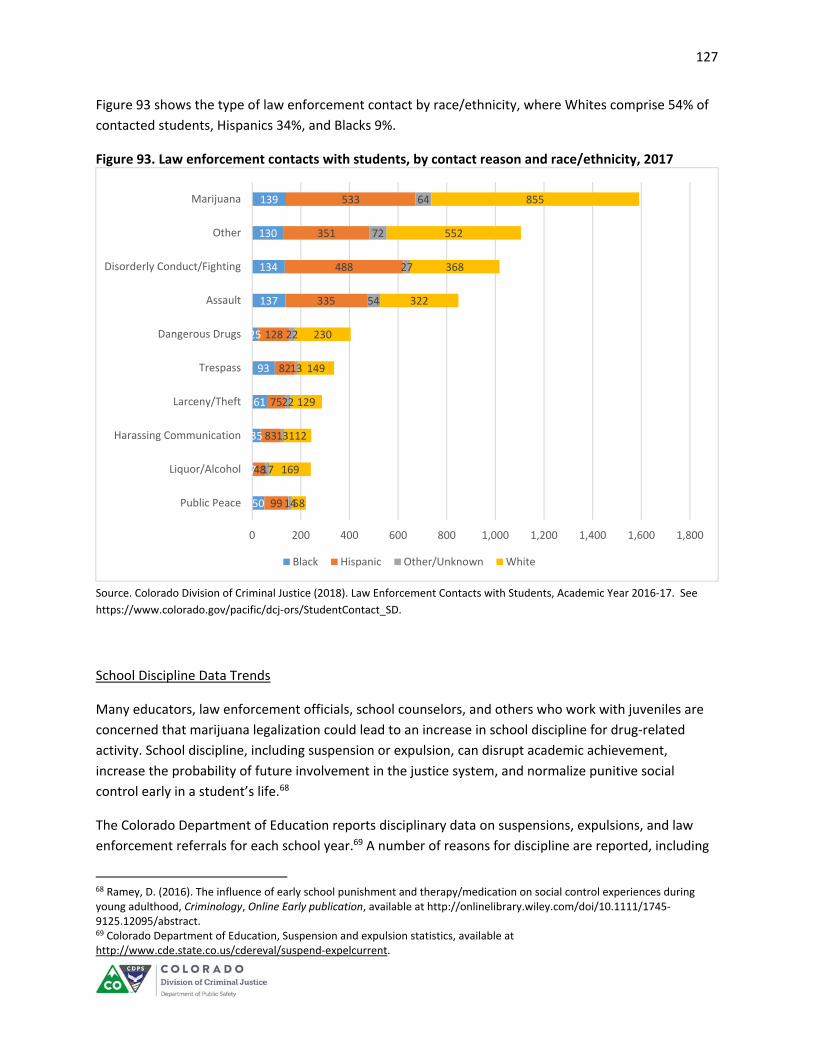
127
Figure 93 shows the type of law enforcement contact by race/ethnicity, where Whites comprise 54% of
contacted students, Hispanics 34%, and Blacks 9%.
Figure 93. Law enforcement contacts with students, by contact reason and race/ethnicity, 2017
Source. Colorado Division of Criminal Justice (2018). Law Enforcement Contacts with Students, Academic Year 2016‐17. See
https://www.colorado.gov/pacific/dcj‐ors/StudentContact_SD.
School Discipline Data Trends
Many educators, law enforcement officials, school counselors, and others who work with juveniles are
concerned that marijuana legalization could lead to an increase in school discipline for drug‐related
activity. School discipline, including suspension or expulsion, can disrupt academic achievement,
increase the probability of future involvement in the justice system, and normalize punitive social
control early in a student’s life.68
The Colorado Department of Education reports disciplinary data on suspensions, expulsions, and law
enforcement referrals for each school year.69 A number of reasons for discipline are reported, including
68 Ramey, D. (2016). The influence of early school punishment and therapy/medication on social control experiences during young adulthood, Criminology, Online Early publication, available at http://onlinelibrary.wiley.com/doi/10.1111/1745‐9125.12095/abstract. 69 Colorado Department of Education, Suspension and expulsion statistics, available at http://www.cde.state.co.us/cdereval/suspend‐expelcurrent.
50
7
35
61
93
25
137
134
130
139
99
48
83
75
82
128
335
488
351
533
14
17
13
22
13
22
54
27
72
64
58
169
112
129
149
230
322
368
552
855
0 200 400 600 800 1,000 1,200 1,400 1,600 1,800
Public Peace
Liquor/Alcohol
Harassing Communication
Larceny/Theft
Trespass
Dangerous Drugs
Assault
Disorderly Conduct/Fighting
Other
Marijuana
Black Hispanic Other/Unknown White
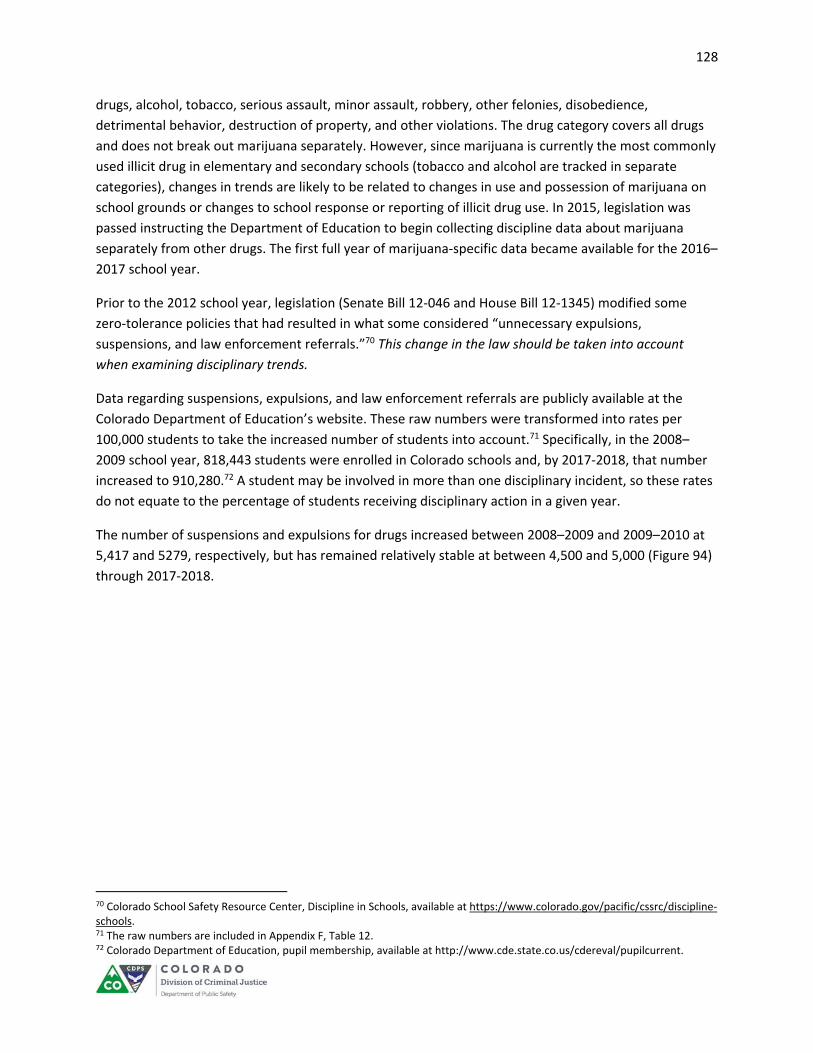
128
drugs, alcohol, tobacco, serious assault, minor assault, robbery, other felonies, disobedience,
detrimental behavior, destruction of property, and other violations. The drug category covers all drugs
and does not break out marijuana separately. However, since marijuana is currently the most commonly
used illicit drug in elementary and secondary schools (tobacco and alcohol are tracked in separate
categories), changes in trends are likely to be related to changes in use and possession of marijuana on
school grounds or changes to school response or reporting of illicit drug use. In 2015, legislation was
passed instructing the Department of Education to begin collecting discipline data about marijuana
separately from other drugs. The first full year of marijuana‐specific data became available for the 2016–
2017 school year.
Prior to the 2012 school year, legislation (Senate Bill 12‐046 and House Bill 12‐1345) modified some
zero‐tolerance policies that had resulted in what some considered “unnecessary expulsions,
suspensions, and law enforcement referrals.”70 This change in the law should be taken into account
when examining disciplinary trends.
Data regarding suspensions, expulsions, and law enforcement referrals are publicly available at the
Colorado Department of Education’s website. These raw numbers were transformed into rates per
100,000 students to take the increased number of students into account.71 Specifically, in the 2008–
2009 school year, 818,443 students were enrolled in Colorado schools and, by 2017‐2018, that number
increased to 910,280.72 A student may be involved in more than one disciplinary incident, so these rates
do not equate to the percentage of students receiving disciplinary action in a given year.
The number of suspensions and expulsions for drugs increased between 2008–2009 and 2009–2010 at
5,417 and 5279, respectively, but has remained relatively stable at between 4,500 and 5,000 (Figure 94)
through 2017‐2018.
70 Colorado School Safety Resource Center, Discipline in Schools, available at https://www.colorado.gov/pacific/cssrc/discipline‐schools. 71 The raw numbers are included in Appendix F, Table 12. 72 Colorado Department of Education, pupil membership, available at http://www.cde.state.co.us/cdereval/pupilcurrent.

129
Figure 94. Number of drug suspensions and expulsions in Colorado public schools, 2004–2018
Source: Colorado Department of Education, at http://www.cde.state.co.us/cdereval/suspend‐expelcurrent.
The drug suspension rate began to increase in 2009–2010, up 29% from 2008–2009. Since that increase,
the drug suspension rate has remained relatively stable, with a slight decrease in the last two years
(Figure 95). This contrasts with the overall suspension rate for any school code of conduct violation,
which has increased in the past four years.
3,394 3,409 3,287 3,212 3,202
4,2124,650 4,561 4,319
4,714 4,5294,236 4,153
4,619
590 579 546 567 534
753
767 718614
535446
337 308
346
0
1,000
2,000
3,000
4,000
5,000
6,000
2004‐2005
2005‐2006
2006‐2007
2007‐2008
2008‐2009
2009‐2010
2010‐2011
2011‐2012
2012‐2013
2013‐2014
2014‐2015
2015‐2016
2016‐2017
2017‐2018
Drug suspensions Drug expulsions
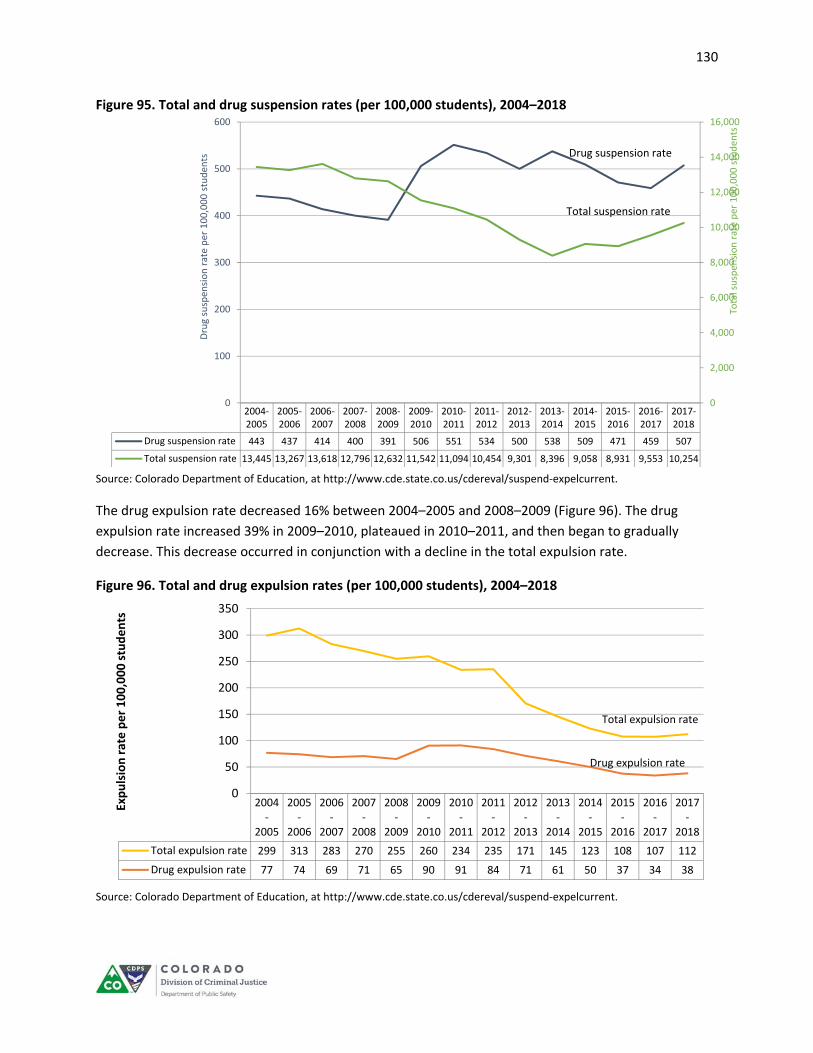
130
Figure 95. Total and drug suspension rates (per 100,000 students), 2004–2018
Source: Colorado Department of Education, at http://www.cde.state.co.us/cdereval/suspend‐expelcurrent.
The drug expulsion rate decreased 16% between 2004–2005 and 2008–2009 (Figure 96). The drug
expulsion rate increased 39% in 2009–2010, plateaued in 2010–2011, and then began to gradually
decrease. This decrease occurred in conjunction with a decline in the total expulsion rate.
Figure 96. Total and drug expulsion rates (per 100,000 students), 2004–2018
Source: Colorado Department of Education, at http://www.cde.state.co.us/cdereval/suspend‐expelcurrent.
2004‐2005
2005‐2006
2006‐2007
2007‐2008
2008‐2009
2009‐2010
2010‐2011
2011‐2012
2012‐2013
2013‐2014
2014‐2015
2015‐2016
2016‐2017
2017‐2018
Drug suspension rate 443 437 414 400 391 506 551 534 500 538 509 471 459 507
Total suspension rate 13,445 13,267 13,618 12,796 12,632 11,542 11,094 10,454 9,301 8,396 9,058 8,931 9,553 10,254
0
2,000
4,000
6,000
8,000
10,000
12,000
14,000
16,000
0
100
200
300
400
500
600
Total suspen
sion rate per 100,000 studen
ts
Drug suspen
sion rate per 100,000 studen
ts Drug suspension rate
Total suspension rate
2004‐
2005
2005‐
2006
2006‐
2007
2007‐
2008
2008‐
2009
2009‐
2010
2010‐
2011
2011‐
2012
2012‐
2013
2013‐
2014
2014‐
2015
2015‐
2016
2016‐
2017
2017‐
2018
Total expulsion rate 299 313 283 270 255 260 234 235 171 145 123 108 107 112
Drug expulsion rate 77 74 69 71 65 90 91 84 71 61 50 37 34 38
0
50
100
150
200
250
300
350
Expulsion rate per 100,000 students
Total expulsion rate
Drug expulsion rate

131
The law enforcement referral rate for drug‐related behaviors was relatively stable from 2005–2006
through 2012–2013, but declined 43% between 2012‐2013 and 2016‐2017 (Figure 97). The reasons for
this decline are not entirely clear. Discussions with school administrators point to changes in policies
regarding referrals to law enforcement rather than a reduction in student possession or use.
Figure 97. Total and drug law enforcement referral rates per 100,000 students, 2004–2018
Source: Colorado Department of Education, at http://www.cde.state.co.us/cdereval/suspend‐expelcurrent.
The percentage of drug expulsions among all expulsions was stable from 2004–2005 to 2008–2009, at
around 25% (Figure 98). It increased by 16 percentage points, from 26% to 42%, in 2012–2013. Since
that high point, it has come down eight percentage points, standing at 34% in 2017–2018. The
percentage of drug‐related behavior referrals among all law enforcement referrals follows a similar
pattern. It was stable from 2004–2005 to 2008–2009 at around 23%, began to increase in 2009–2010,
peaked in 2013–2014 at 37% of all law enforcement referrals, and dropped to 29% in 2017–2018. The
percentage of drug suspensions among all suspensions has remained at around 5%–6% of all
suspensions.
2004‐
2005
2005‐
2006
2006‐
2007
2007‐
2008
2008‐
2009
2009‐
2010
2010‐
2011
2011‐
2012
2012‐
2013
2013‐
2014
2014‐
2015
2015‐
2016
2016‐
2017
2017‐
2018
Total LE referral rate 1,295 1,092 1,016 1,021 924 911 829 741 652 559 421 428 391 440
Drug LE referral rate 302 256 244 240 232 263 267 228 222 208 130 127 120 126
0
200
400
600
800
1,000
1,200
1,400
Law enforcem
ent referral rate per 100,000
studen
ts
Total LE referral rate
Drug LE referral rate
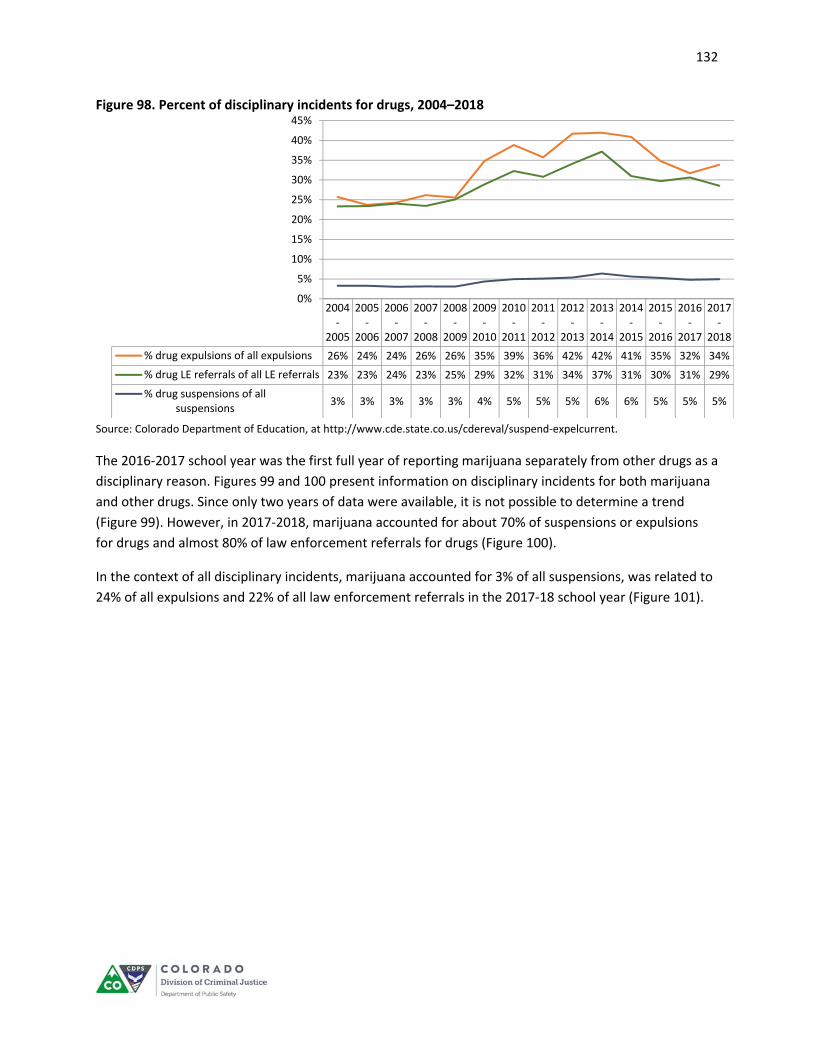
132
Figure 98. Percent of disciplinary incidents for drugs, 2004–2018
Source: Colorado Department of Education, at http://www.cde.state.co.us/cdereval/suspend‐expelcurrent.
The 2016‐2017 school year was the first full year of reporting marijuana separately from other drugs as a
disciplinary reason. Figures 99 and 100 present information on disciplinary incidents for both marijuana
and other drugs. Since only two years of data were available, it is not possible to determine a trend
(Figure 99). However, in 2017‐2018, marijuana accounted for about 70% of suspensions or expulsions
for drugs and almost 80% of law enforcement referrals for drugs (Figure 100).
In the context of all disciplinary incidents, marijuana accounted for 3% of all suspensions, was related to
24% of all expulsions and 22% of all law enforcement referrals in the 2017‐18 school year (Figure 101).
2004‐
2005
2005‐
2006
2006‐
2007
2007‐
2008
2008‐
2009
2009‐
2010
2010‐
2011
2011‐
2012
2012‐
2013
2013‐
2014
2014‐
2015
2015‐
2016
2016‐
2017
2017‐
2018
% drug expulsions of all expulsions 26% 24% 24% 26% 26% 35% 39% 36% 42% 42% 41% 35% 32% 34%
% drug LE referrals of all LE referrals 23% 23% 24% 23% 25% 29% 32% 31% 34% 37% 31% 30% 31% 29%
% drug suspensions of allsuspensions
3% 3% 3% 3% 3% 4% 5% 5% 5% 6% 6% 5% 5% 5%
0%
5%
10%
15%
20%
25%
30%
35%
40%
45%

133
Figure 99. Disciplinary incidents for drugs in Colorado schools, 2016–2018
Figure 100. Distribution of disciplinary incidents for drugs in Colorado schools, 2016–2018
1,006
1,432
97 101232 264
3,147 3,187
211 245
851 880
0
500
1,000
1,500
2,000
2,500
3,000
3,500
2016‐2017 2017‐2018 2016‐2017 2017‐2018 2016‐2017 2017‐2018
Suspensions Expulsions Law enforcement referrals
Other drug violations Marijuana violations
24%31% 31% 29%
21% 23%
76%69% 69% 71%
79% 77%
0%
10%
20%
30%
40%
50%
60%
70%
80%
90%
100%
2016‐2017 2017‐2018 2016‐2017 2017‐2018 2016‐2017 2017‐2018
Suspensions Expulsions Law enforcement referrals
% other drug violations % marijuana violations

134
Figure 101. Percent of disciplinary incidents for marijuana compared to other reasons, 2016–2018
Source: Colorado Department of Education, at http://www.cde.state.co.us/cdereval/suspend‐expelcurrent.
There was concern among legalization stakeholders that school dropouts would increase and graduation rates would decrease after legalization. This is not reflected in the data presented in Figure 102.
96% 97%
78% 76% 76% 78%
4% 3%
22% 24% 24% 22%
0%
10%
20%
30%
40%
50%
60%
70%
80%
90%
100%
2016‐2017 2017‐2018 2016‐2017 2017‐2018 2016‐2017 2017‐2018
Suspensions Expulsions Law enforcement referrals
% all other violations % marijuana violations

135
Figure 102. Colorado graduation and dropout rates, 2005–2017
Source: Colorado Department of Education, http://www.cde.state.co.us/cdereval.
In sum, since legalization, reported discipline incidents due to drugs have not increased. It should be
noted that recent declines in rates of suspension and expulsion, and fewer referrals to law enforcement,
are likely associated with school reform efforts mandated in Senate Bill 12‐046 and House Bill 12‐1345.
Probation Testing Data
Colorado’s Probation Departments conduct drug tests on juvenile probationers. The frequency of testing
is determined by assessment, court orders, and other case‐related information. Table 39 presents
information on the percentage of juvenile probationers who tested positive for THC. The percentage of
the 10‐ to 14‐year‐old group testing positive for THC one or two times has remained relatively stable, at
about 20%, while the percentage testing positive three or more times rose from 16% to 23%. The
percentage of 15‐ to 17‐year‐olds testing positive one or two times was also stable, at around 26%,
while those testing positive three or more times increased from 23% to 30%. There is currently no link
between probationer drug testing results and probation status, so it remains unknown if changes in drug
use patterns affect probation violations.
74.1%
75.0%
73.9%74.6%
72.4%
73.9%
75.4% 76.9%77.3% 77.3%
78.9% 79.0%
4.5% 4.4%
3.8%3.6%
3.1% 3.0%
2.9%2.5% 2.4% 2.5%2.3% 2.3%
0.0%
0.5%
1.0%
1.5%
2.0%
2.5%
3.0%
3.5%
4.0%
4.5%
5.0%
68.0%
70.0%
72.0%
74.0%
76.0%
78.0%
80.0%
2005‐2006
2006‐2007
2007‐2008
2008‐2009
2009‐2010
2010‐2011
2011‐2012
2012‐2013
2013‐2014
2014‐2015
2015‐2016
2016‐2017
Dropout rate
Graduation rate
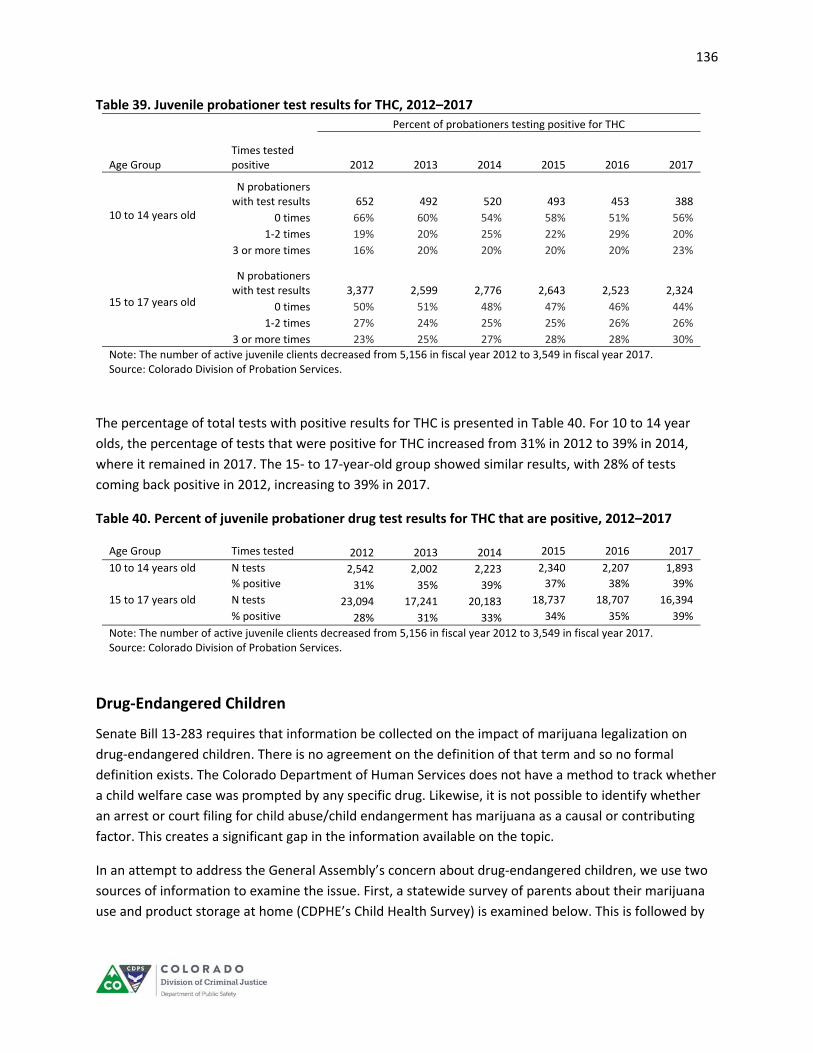
136
Table 39. Juvenile probationer test results for THC, 2012–2017
Percent of probationers testing positive for THC
Age Group Times tested positive 2012 2013 2014 2015 2016 2017
10 to 14 years old
N probationers with test results 652 492 520 493 453 388
0 times 66% 60% 54% 58% 51% 56%
1‐2 times 19% 20% 25% 22% 29% 20%
3 or more times 16% 20% 20% 20% 20% 23%
15 to 17 years old
N probationers with test results 3,377 2,599 2,776 2,643 2,523 2,324
0 times 50% 51% 48% 47% 46% 44%
1‐2 times 27% 24% 25% 25% 26% 26%
3 or more times 23% 25% 27% 28% 28% 30%
Note: The number of active juvenile clients decreased from 5,156 in fiscal year 2012 to 3,549 in fiscal year 2017. Source: Colorado Division of Probation Services.
The percentage of total tests with positive results for THC is presented in Table 40. For 10 to 14 year
olds, the percentage of tests that were positive for THC increased from 31% in 2012 to 39% in 2014,
where it remained in 2017. The 15‐ to 17‐year‐old group showed similar results, with 28% of tests
coming back positive in 2012, increasing to 39% in 2017.
Table 40. Percent of juvenile probationer drug test results for THC that are positive, 2012–2017
Age Group Times tested 2012 2013 2014 2015 2016 2017
10 to 14 years old N tests 2,542 2,002 2,223 2,340 2,207 1,893
% positive 31% 35% 39% 37% 38% 39%
15 to 17 years old N tests 23,094 17,241 20,183 18,737 18,707 16,394
% positive 28% 31% 33% 34% 35% 39%
Note: The number of active juvenile clients decreased from 5,156 in fiscal year 2012 to 3,549 in fiscal year 2017. Source: Colorado Division of Probation Services.
Drug‐Endangered Children
Senate Bill 13‐283 requires that information be collected on the impact of marijuana legalization on
drug‐endangered children. There is no agreement on the definition of that term and so no formal
definition exists. The Colorado Department of Human Services does not have a method to track whether
a child welfare case was prompted by any specific drug. Likewise, it is not possible to identify whether
an arrest or court filing for child abuse/child endangerment has marijuana as a causal or contributing
factor. This creates a significant gap in the information available on the topic.
In an attempt to address the General Assembly’s concern about drug‐endangered children, we use two
sources of information to examine the issue. First, a statewide survey of parents about their marijuana
use and product storage at home (CDPHE’s Child Health Survey) is examined below. This is followed by
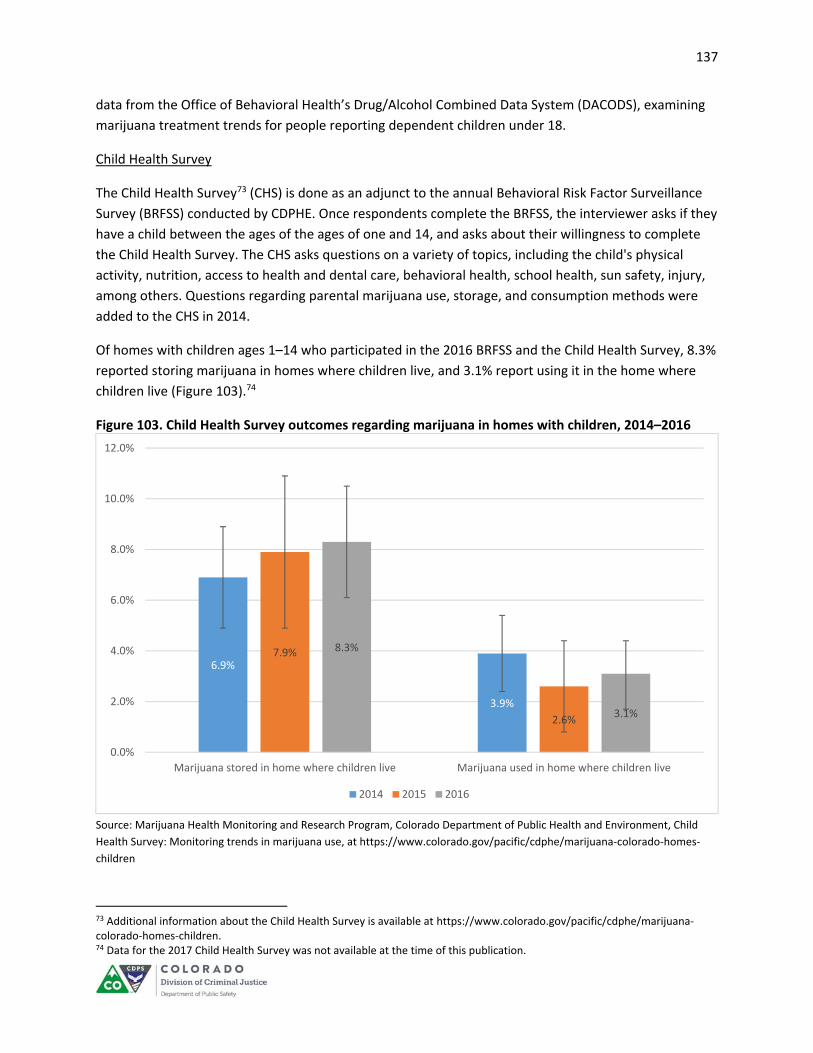
137
data from the Office of Behavioral Health’s Drug/Alcohol Combined Data System (DACODS), examining
marijuana treatment trends for people reporting dependent children under 18.
Child Health Survey
The Child Health Survey73 (CHS) is done as an adjunct to the annual Behavioral Risk Factor Surveillance
Survey (BRFSS) conducted by CDPHE. Once respondents complete the BRFSS, the interviewer asks if they
have a child between the ages of the ages of one and 14, and asks about their willingness to complete
the Child Health Survey. The CHS asks questions on a variety of topics, including the child's physical
activity, nutrition, access to health and dental care, behavioral health, school health, sun safety, injury,
among others. Questions regarding parental marijuana use, storage, and consumption methods were
added to the CHS in 2014.
Of homes with children ages 1–14 who participated in the 2016 BRFSS and the Child Health Survey, 8.3%
reported storing marijuana in homes where children live, and 3.1% report using it in the home where
children live (Figure 103).74
Figure 103. Child Health Survey outcomes regarding marijuana in homes with children, 2014–2016
Source: Marijuana Health Monitoring and Research Program, Colorado Department of Public Health and Environment, Child
Health Survey: Monitoring trends in marijuana use, at https://www.colorado.gov/pacific/cdphe/marijuana‐colorado‐homes‐
children
73 Additional information about the Child Health Survey is available at https://www.colorado.gov/pacific/cdphe/marijuana‐colorado‐homes‐children. 74 Data for the 2017 Child Health Survey was not available at the time of this publication.
6.9%
3.9%
7.9%
2.6%
8.3%
3.1%
0.0%
2.0%
4.0%
6.0%
8.0%
10.0%
12.0%
Marijuana stored in home where children live Marijuana used in home where children live
2014 2015 2016
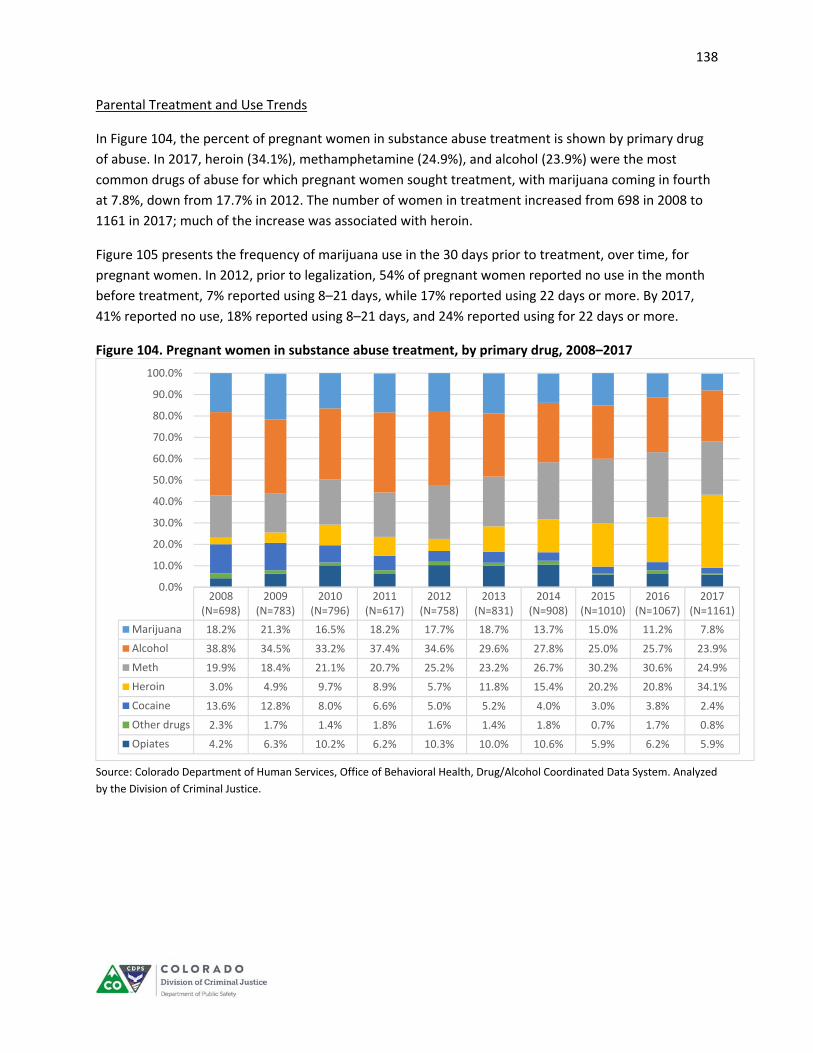
138
Parental Treatment and Use Trends
In Figure 104, the percent of pregnant women in substance abuse treatment is shown by primary drug
of abuse. In 2017, heroin (34.1%), methamphetamine (24.9%), and alcohol (23.9%) were the most
common drugs of abuse for which pregnant women sought treatment, with marijuana coming in fourth
at 7.8%, down from 17.7% in 2012. The number of women in treatment increased from 698 in 2008 to
1161 in 2017; much of the increase was associated with heroin.
Figure 105 presents the frequency of marijuana use in the 30 days prior to treatment, over time, for
pregnant women. In 2012, prior to legalization, 54% of pregnant women reported no use in the month
before treatment, 7% reported using 8–21 days, while 17% reported using 22 days or more. By 2017,
41% reported no use, 18% reported using 8–21 days, and 24% reported using for 22 days or more.
Figure 104. Pregnant women in substance abuse treatment, by primary drug, 2008–2017
Source: Colorado Department of Human Services, Office of Behavioral Health, Drug/Alcohol Coordinated Data System. Analyzed
by the Division of Criminal Justice.
2008(N=698)
2009(N=783)
2010(N=796)
2011(N=617)
2012(N=758)
2013(N=831)
2014(N=908)
2015(N=1010)
2016(N=1067)
2017(N=1161)
Marijuana 18.2% 21.3% 16.5% 18.2% 17.7% 18.7% 13.7% 15.0% 11.2% 7.8%
Alcohol 38.8% 34.5% 33.2% 37.4% 34.6% 29.6% 27.8% 25.0% 25.7% 23.9%
Meth 19.9% 18.4% 21.1% 20.7% 25.2% 23.2% 26.7% 30.2% 30.6% 24.9%
Heroin 3.0% 4.9% 9.7% 8.9% 5.7% 11.8% 15.4% 20.2% 20.8% 34.1%
Cocaine 13.6% 12.8% 8.0% 6.6% 5.0% 5.2% 4.0% 3.0% 3.8% 2.4%
Other drugs 2.3% 1.7% 1.4% 1.8% 1.6% 1.4% 1.8% 0.7% 1.7% 0.8%
Opiates 4.2% 6.3% 10.2% 6.2% 10.3% 10.0% 10.6% 5.9% 6.2% 5.9%
0.0%
10.0%
20.0%
30.0%
40.0%
50.0%
60.0%
70.0%
80.0%
90.0%
100.0%
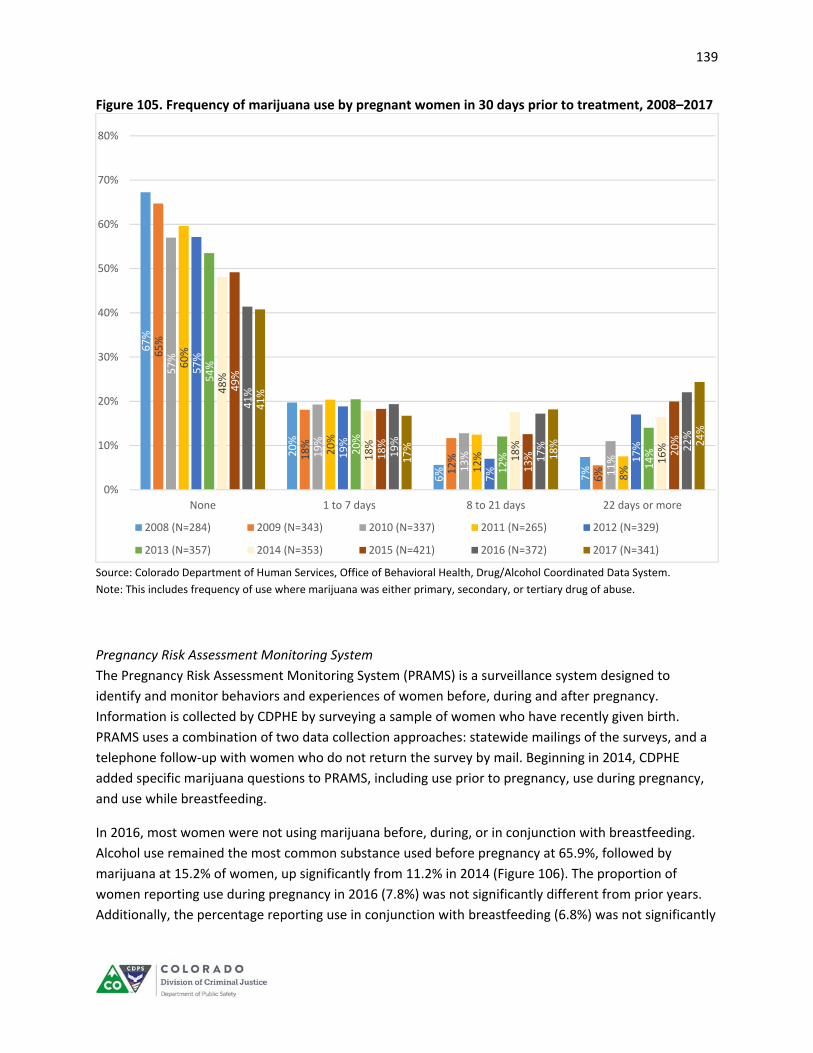
139
Figure 105. Frequency of marijuana use by pregnant women in 30 days prior to treatment, 2008–2017
Source: Colorado Department of Human Services, Office of Behavioral Health, Drug/Alcohol Coordinated Data System.
Note: This includes frequency of use where marijuana was either primary, secondary, or tertiary drug of abuse.
Pregnancy Risk Assessment Monitoring System
The Pregnancy Risk Assessment Monitoring System (PRAMS) is a surveillance system designed to
identify and monitor behaviors and experiences of women before, during and after pregnancy.
Information is collected by CDPHE by surveying a sample of women who have recently given birth.
PRAMS uses a combination of two data collection approaches: statewide mailings of the surveys, and a
telephone follow‐up with women who do not return the survey by mail. Beginning in 2014, CDPHE
added specific marijuana questions to PRAMS, including use prior to pregnancy, use during pregnancy,
and use while breastfeeding.
In 2016, most women were not using marijuana before, during, or in conjunction with breastfeeding.
Alcohol use remained the most common substance used before pregnancy at 65.9%, followed by
marijuana at 15.2% of women, up significantly from 11.2% in 2014 (Figure 106). The proportion of
women reporting use during pregnancy in 2016 (7.8%) was not significantly different from prior years.
Additionally, the percentage reporting use in conjunction with breastfeeding (6.8%) was not significantly
67%
20%
6% 7%
65%
18%
12%
6%
57%
19%
13%
11%
60%
20%
12%
8%
57%
19%
7%
17%
54%
20%
12%
14%
48%
18%
18%
16%
49%
18%
13% 20%
41%
19%
17% 22%
41%
17%
18% 24%
0%
10%
20%
30%
40%
50%
60%
70%
80%
None 1 to 7 days 8 to 21 days 22 days or more
2008 (N=284) 2009 (N=343) 2010 (N=337) 2011 (N=265) 2012 (N=329)
2013 (N=357) 2014 (N=353) 2015 (N=421) 2016 (N=372) 2017 (N=341)

140
different from prior years. Alcohol continued to be used at higher rates than marijuana before, during
and after pregnancy.
Figure 106. Marijuana use before and during pregnancy and in conjunction with breastfeeding, 2014–2016
Source: Marijuana Health Monitoring and Research Program, Colorado Department of Public Health and Environment, Marijuana use during pregnancy and breastfeeding in Colorado, at https://www.colorado.gov/pacific/cdphe/pregnancy‐risk‐assessment‐monitoring‐system‐prams‐monitoring‐trends‐marijuana‐use.
In sum, this section focused on the impact of marijuana legalization on youth. Survey data reflect that
the proportion of students using marijuana in their lifetime remained stable between 2005 and 2017,
and lifetime use rates (at 35.3% in Colorado in 2017, according to HKCS) was not different from the
national cohort. The proportion of Colorado students reporting past 30‐day use remained statistically
unchanged between 2005 and 2017 (at 19.4% in 2017, according to HKCS) and again was not different
from the national cohort. (Note that the NSDUH survey, with a small sample of Colorado students,
showed 30‐day use declining.) Additionally, marijuana was the most common reason for law
enforcement contact with students in 2017, but it is noteworthy that graduation rates continued to
increase through the 2016‐2017 academic year and dropout rates remained stable since 2012‐2013. The
proportion of juveniles on probation who tested positive for THC increased between 2012 and 2017 but
it is unknown how this affected revocation rates. Finally, a relatively small percentage of households
reported storing (8.3%) or using (3.1%) marijuana in a home where children live. The number of
pregnant women entering substance abuse treatment decreased but those who do enter treatment had
more severe recent use histories. The use of marijuana before pregnancy (15.2%) increased significantly
from 2014 but use during pregnancy (7.8%), or in conjunction with breastfeeding did not change
significantly. The use of alcohol before pregnancy (65.9% in 2017) or during pregnancy (17.3% in 2017)
was considerably more common, however.
11.2
5.74.5
13.2
5.7 5.7
15.2
7.86.8
0
2
4
6
8
10
12
14
16
18
20
Before pregnancy During pregnancy In conjunction withbreastfeeding
Percent reporting use
2014 2015 2016

141
SECTION FIVE:
ADDITIONAL INFORMATION
Licensing and Revenue
Marijuana Enforcement Division
The Marijuana Enforcement Division75 (MED) is tasked with licensing and regulating the medical and
retail marijuana industries in Colorado. The Division implements legislation, develops rules, conducts
background investigations, issues business licenses, and enforces compliance mandates in order to
maintain a robust regulatory structure. MED promotes transparency and clarity for all stakeholders by
utilizing a highly collaborative process through which it develops industry regulations and furthers its
primary mission of ensuring public safety.
Licensees Statewide
As reflected in Table 41, the total number of marijuana business licenses issued increased sharply for the
first two years after legalization, up 30% from 2014 (2,249) to 2016 (2,934). Recent growth, between
2016 and 2018, was more moderate, up 6% (from 2,934 to 3,101). The number of medical licenses
dropped slightly (‐5%) during this period while the total number of retail licenses increased 18%
between 2016 and 2018.76
Licenses for marijuana businesses were concentrated in Denver (1,226), El Paso (370), and Pueblo (303)
Counties (Figure 107). The largest number of retail store licenses were in Denver (182), Boulder (54), and
Pueblo (32) Counties (Figure 108). Denver County also had the largest number of medical center licenses
(199) followed by El Paso (134) and Boulder (26) (Figure 109). There were 232 retail cultivations in
Denver, 167 in Pueblo, and 60 in Boulder (Figure 110). There were 369 medical cultivations in Denver
County, 179 in El Paso County, and 35 in Pueblo County (Figure 111). Additional information on the
location of different license types can be found in Figures 112‐115 and the data supporting the maps is
located in Appendix H, Tables 20 and 21.
75 Additional information on the MED can be obtained at https://www.colorado.gov/enforcement/marijuanaenforcement. 76 Labs test for potency of products, homogeneity of THC throughout a product, solvents, and microbial contamination.

142
Table 41. Licensed marijuana premises, by license type, 2014‐18
2014 2015 2016 2017 2018
Total licensed premises 2,249 2,592 2,934 3,051 3,101
Medical 1,416 1,469 1,584 1,531 1,511
Centers 505 516 528 506 498
Cultivations 748 751 788 759 735
Product manufacturers 163 202 524 254 254
Testing facilities 0 0 14 12 10
Operator 0 0 0 5 6
Transporter 0 0 0 8 8
Retail 833 1,123 1,350 1,520 1,590
Stores 322 424 459 509 529
Cultivations 397 514 633 720 742
Product manufacturers 98 168 244 279 287
Testing facilities 16 17 14 12 13
Operator 0 0 0 6 9
Transporter 0 0 0 10 10
Source: Colorado Department of Revenue, Marijuana Enforcement Division, 2014 Annual Update; 2015 Annual Update; 2016 MED Annual Update; 2017 MED Annual Update. At https://www.colorado.gov/pacific/enforcement/med‐updates. Note: For additional information on the different marijuana business license types and archived lists please visit: https://www.colorado.gov/pacific/enforcement/med‐licensed‐facilities

143
Figure 107. Marijuana licensees, by county, May 2018
Source: Colorado Department of Revenue, Marijuana Enforcement Division, MED Licensed Facilities, at https://www.colorado.gov/pacific/enforcement/med‐licensed‐facilities.

144
Figure 108. Retail store licensees, by county, May 2018
Source: Colorado Department of Revenue, Marijuana Enforcement Division, MED Licensed Facilities, at https://www.colorado.gov/pacific/enforcement/med‐licensed‐facilities.
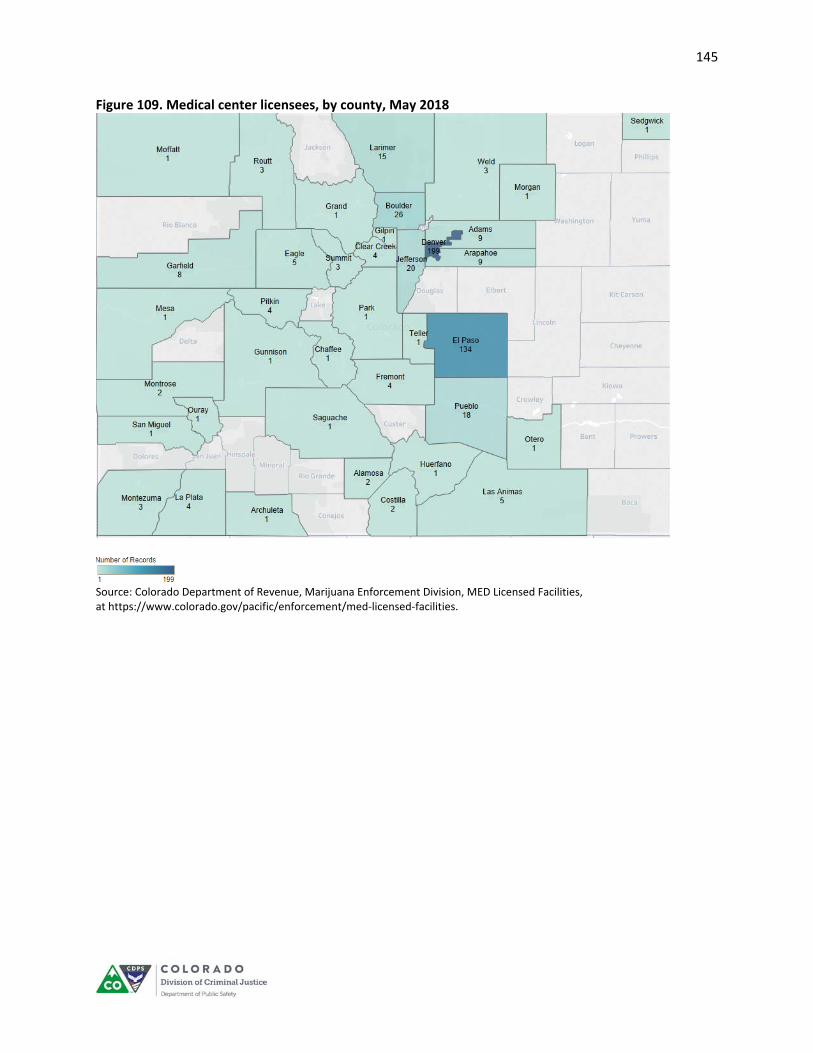
145
Figure 109. Medical center licensees, by county, May 2018
Source: Colorado Department of Revenue, Marijuana Enforcement Division, MED Licensed Facilities, at https://www.colorado.gov/pacific/enforcement/med‐licensed‐facilities.

146
Figure 110. Retail cultivation licensees, by county, May 2018
Source: Colorado Department of Revenue, Marijuana Enforcement Division, MED Licensed Facilities, at https://www.colorado.gov/pacific/enforcement/med‐licensed‐facilities.

147
Figure 111. Medical cultivation licensees, by county, May 2018
Source: Colorado Department of Revenue, Marijuana Enforcement Division, MED Licensed Facilities, at https://www.colorado.gov/pacific/enforcement/med‐licensed‐facilities.

148
Figure 112. Retail product manufacture licenses, by county, May 2018
Source: Colorado Department of Revenue, Marijuana Enforcement Division, MED Licensed Facilities, at https://www.colorado.gov/pacific/enforcement/med‐licensed‐facilities.

149
Figure 113. Medical product manufacture licenses, by county, May 2018
Source: Colorado Department of Revenue, Marijuana Enforcement Division, MED Licensed Facilities, at https://www.colorado.gov/pacific/enforcement/med‐licensed‐facilities.

150
Figure 114. Other retail licensees, by county, May 2018
Source: Colorado Department of Revenue, Marijuana Enforcement Division, MED Licensed Facilities, at https://www.colorado.gov/pacific/enforcement/med‐licensed‐facilities.

151
Figure 115. Other medical licensees, by county, May 2018
Source: Colorado Department of Revenue, Marijuana Enforcement Division, MED Licensed Facilities, at https://www.colorado.gov/pacific/enforcement/med‐licensed‐facilities.
Tax Revenue and Sales
The total revenue from taxes, licenses, and fees increased 266% from calendar year 2014 to 2017, going
from $67,594,325 up to $247,368,474 (Figure 116 and Table 42). The revenue increase was driven by
the sales taxes, excise taxes, licenses, and fees for retail marijuana. In calendar year 2017, total sales
taxes, excise, taxes, licenses and fees from retail marijuana accounted for $226,812,442, or 92% of all
marijuana revenue. On average, Colorado collects approximately $20 million per month in taxes,
licenses, and fees from all marijuana sources (Table 42).
The excise tax revenue collected to fund the Public School Capital Construction Assistance Fund reached
$40,256,542 in calendar year 2017, with an additional $31,558,383 sent to the Public School Fund.
Between 2016 and 2018 marijuana excise taxes have contributed between $5‐6 million dollars per
month directly to school construction or other public school needs (Figure 118). The taxes distributed to
local governments increased 305%, from $4,005,458 in 2014 to $16,204,671 in 2017.
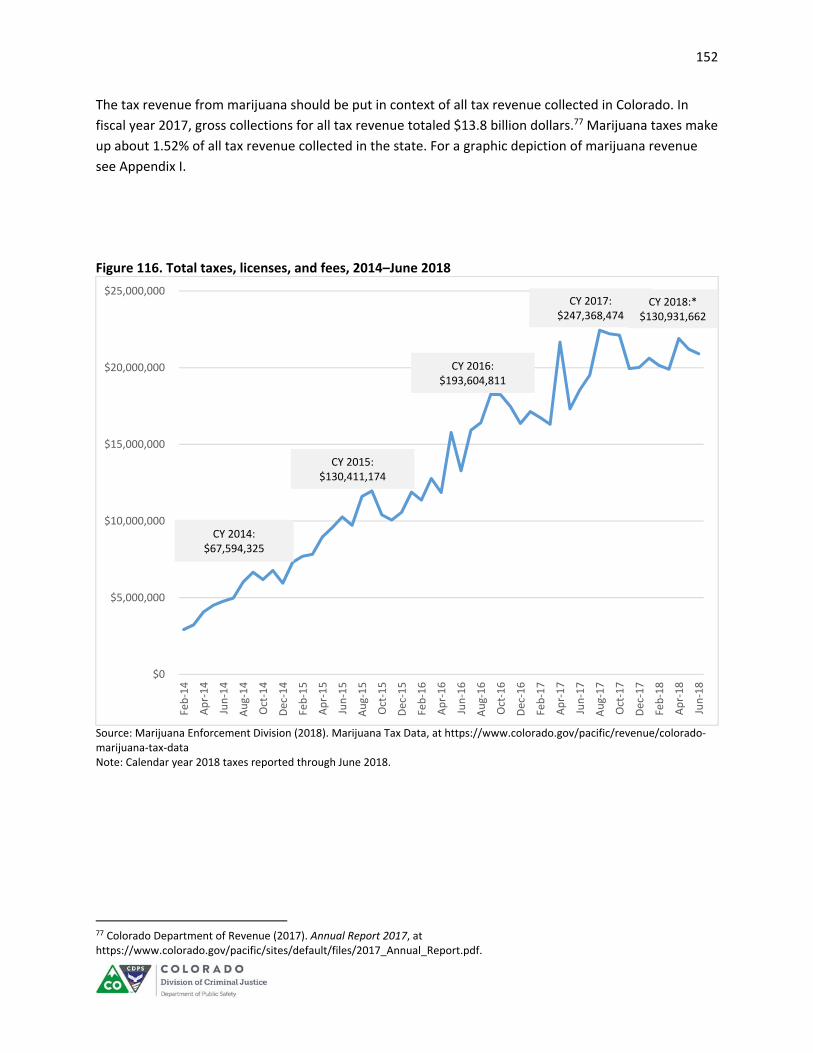
152
The tax revenue from marijuana should be put in context of all tax revenue collected in Colorado. In
fiscal year 2017, gross collections for all tax revenue totaled $13.8 billion dollars.77 Marijuana taxes make
up about 1.52% of all tax revenue collected in the state. For a graphic depiction of marijuana revenue
see Appendix I.
Figure 116. Total taxes, licenses, and fees, 2014–June 2018
Source: Marijuana Enforcement Division (2018). Marijuana Tax Data, at https://www.colorado.gov/pacific/revenue/colorado‐marijuana‐tax‐data Note: Calendar year 2018 taxes reported through June 2018.
77 Colorado Department of Revenue (2017). Annual Report 2017, at https://www.colorado.gov/pacific/sites/default/files/2017_Annual_Report.pdf.
$0
$5,000,000
$10,000,000
$15,000,000
$20,000,000
$25,000,000
Feb‐14
Apr‐14
Jun‐14
Aug‐14
Oct‐14
Dec‐14
Feb‐15
Apr‐15
Jun‐15
Aug‐15
Oct‐15
Dec‐15
Feb‐16
Apr‐16
Jun‐16
Aug‐16
Oct‐16
Dec‐16
Feb‐17
Apr‐17
Jun‐17
Aug‐17
Oct‐17
Dec‐17
Feb‐18
Apr‐18
Jun‐18
CY 2015: $130,411,174
CY 2014: $67,594,325
CY 2016: $193,604,811
CY 2017: $247,368,474
CY 2018:* $130,931,662
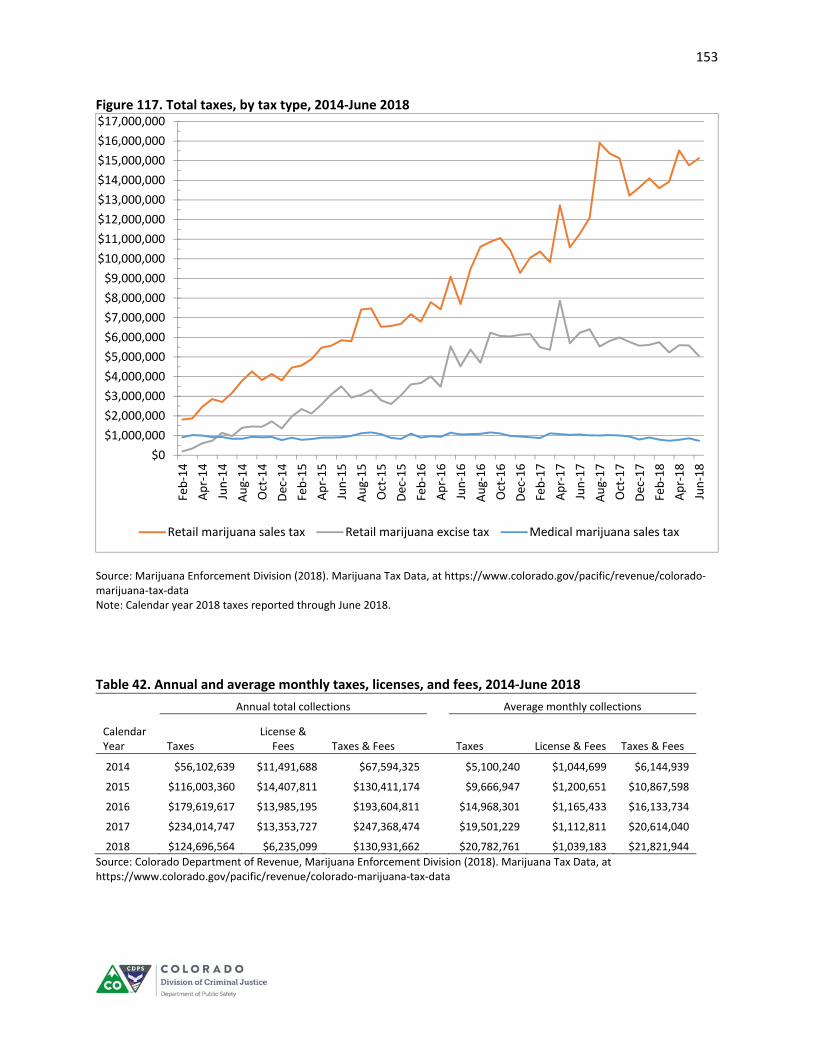
153
Figure 117. Total taxes, by tax type, 2014‐June 2018
Source: Marijuana Enforcement Division (2018). Marijuana Tax Data, at https://www.colorado.gov/pacific/revenue/colorado‐marijuana‐tax‐data Note: Calendar year 2018 taxes reported through June 2018.
Table 42. Annual and average monthly taxes, licenses, and fees, 2014‐June 2018
Annual total collections Average monthly collections
Calendar Year Taxes
License & Fees Taxes & Fees Taxes License & Fees Taxes & Fees
2014 $56,102,639 $11,491,688 $67,594,325 $5,100,240 $1,044,699 $6,144,939
2015 $116,003,360 $14,407,811 $130,411,174 $9,666,947 $1,200,651 $10,867,598
2016 $179,619,617 $13,985,195 $193,604,811 $14,968,301 $1,165,433 $16,133,734
2017 $234,014,747 $13,353,727 $247,368,474 $19,501,229 $1,112,811 $20,614,040
2018 $124,696,564 $6,235,099 $130,931,662 $20,782,761 $1,039,183 $21,821,944
Source: Colorado Department of Revenue, Marijuana Enforcement Division (2018). Marijuana Tax Data, at https://www.colorado.gov/pacific/revenue/colorado‐marijuana‐tax‐data
$0
$1,000,000
$2,000,000
$3,000,000
$4,000,000
$5,000,000
$6,000,000
$7,000,000
$8,000,000
$9,000,000
$10,000,000
$11,000,000
$12,000,000
$13,000,000
$14,000,000
$15,000,000
$16,000,000
$17,000,000
Feb‐14
Apr‐14
Jun‐14
Aug‐14
Oct‐14
Dec‐14
Feb‐15
Apr‐15
Jun‐15
Aug‐15
Oct‐15
Dec‐15
Feb‐16
Apr‐16
Jun‐16
Aug‐16
Oct‐16
Dec‐16
Feb‐17
Apr‐17
Jun‐17
Aug‐17
Oct‐17
Dec‐17
Feb‐18
Apr‐18
Jun‐18
Retail marijuana sales tax Retail marijuana excise tax Medical marijuana sales tax

154
Figure 118. Monthly transfer of marijuana excise taxes to school construction fund and general public school fund, 2014‐June 2018
Source: Colorado Department of Revenue, Marijuana Enforcement Division (2018). Marijuana Tax Data, at https://www.colorado.gov/pacific/revenue/colorado‐marijuana‐tax‐data Note: Amendment 64 calls for the transfer of the first $40 million in retail marijuana excise taxes to the Public School Capital Construction Assistance Fund (BEST) every year. Once this $40 million is reached the taxes are transferred to the general public school fund for the rest of the fiscal year.
The sales of retail marijuana products have more than tripled over the past four years, from $303 million
in 2014 to $1.09 billion in 2017 (Table 2). In 2017, an average of $90 million in retail marijuana products
were sold, up from $25 million in 2014 (Table 43 & Figure 119). The sales of medical marijuana products
increased initially but have been decreasing gradually over the past year, from $445 million in 2016 to
$416 million in 2017 (Table 43). The average monthly sales of medical marijuana products also declined,
from $37 million in 2016 to $34 million in 2017 (Table 43 and Figure 119).
Table 43. Annual and average monthly sales of marijuana products, 2014‐June 2018
Annual total sales Average monthly sales
Calendar Year Medical Retail Total Medical Retail Total
2014 $380,284,040 $303,239,699 $683,523,739 $31,690,337 $25,269,975 $56,960,312
2015 $418,054,912 $577,536,343 $995,591,255 $34,837,909 $48,128,029 $82,965,938
2016 $445,616,062 $861,587,411 $1,307,203,473 $37,134,672 $71,798,951 $108,933,623
2017 $416,516,782 $1,091,185,437 $1,507,702,219 $34,709,732 $90,932,120 $125,641,852
2018 $138,387,136 $474,477,654 $612,864,790 $27,677,427 $94,895,531 $122,572,958
Source: Colorado Department of Revenue, Marijuana Enforcement Division (2018). Marijuana Sales Reports, at
https://www.colorado.gov/pacific/revenue/colorado‐marijuana‐sales‐reports
Notes: Medical marijuana sales (gross sales minus wholesale) and sales of accessories/other products that do not contain
medical marijuana. Retail marijuana sales (gross sales minus wholesale) and does not include sales of accessories/other
products that do not contain retail marijuana.
0
1,000,000
2,000,000
3,000,000
4,000,000
5,000,000
6,000,000
7,000,000
8,000,000
Feb‐14
Apr‐14
Jun‐14
Aug‐14
Oct‐14
Dec‐14
Feb‐15
Apr‐15
Jun‐15
Aug‐15
Oct‐15
Dec‐15
Feb‐16
Apr‐16
Jun‐16
Aug‐16
Oct‐16
Dec‐16
Feb‐17
Apr‐17
Jun‐17
Aug‐17
Oct‐17
Dec‐17
Feb‐18
Apr‐18
Jun‐18
Public School Capital Construction Assistance Fund Transfer Public School Fund
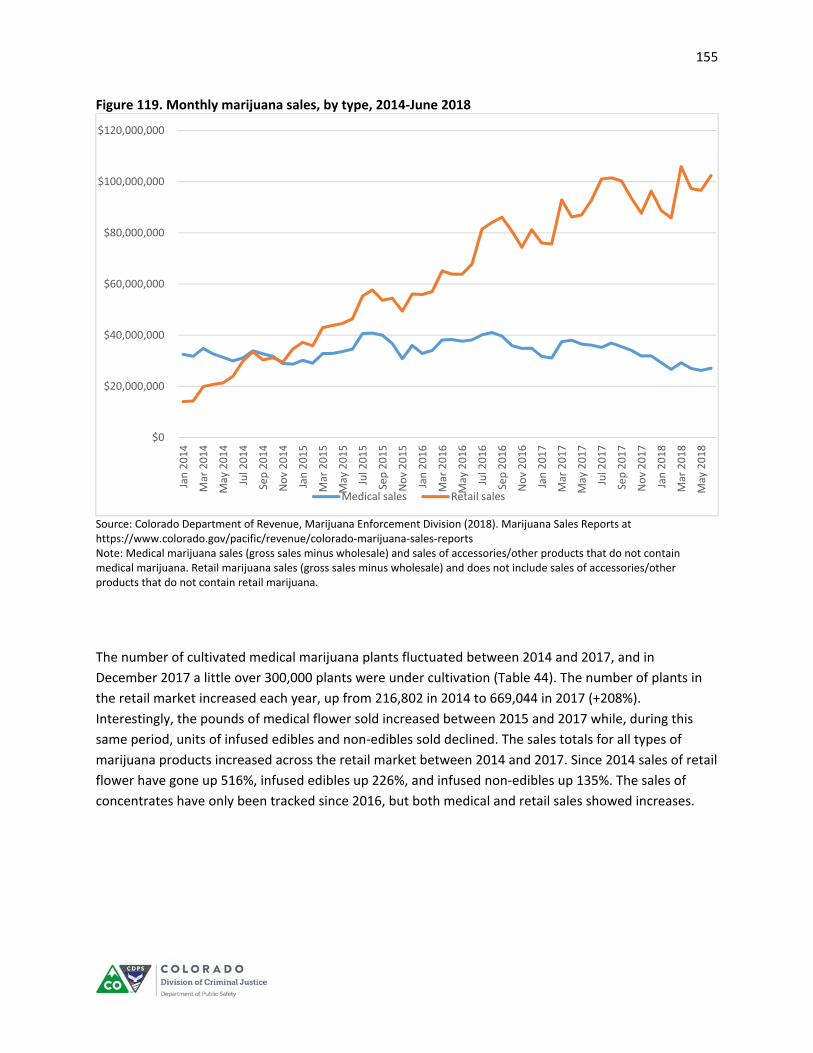
155
Figure 119. Monthly marijuana sales, by type, 2014‐June 2018
Source: Colorado Department of Revenue, Marijuana Enforcement Division (2018). Marijuana Sales Reports at https://www.colorado.gov/pacific/revenue/colorado‐marijuana‐sales‐reports Note: Medical marijuana sales (gross sales minus wholesale) and sales of accessories/other products that do not contain medical marijuana. Retail marijuana sales (gross sales minus wholesale) and does not include sales of accessories/other products that do not contain retail marijuana.
The number of cultivated medical marijuana plants fluctuated between 2014 and 2017, and in
December 2017 a little over 300,000 plants were under cultivation (Table 44). The number of plants in
the retail market increased each year, up from 216,802 in 2014 to 669,044 in 2017 (+208%).
Interestingly, the pounds of medical flower sold increased between 2015 and 2017 while, during this
same period, units of infused edibles and non‐edibles sold declined. The sales totals for all types of
marijuana products increased across the retail market between 2014 and 2017. Since 2014 sales of retail
flower have gone up 516%, infused edibles up 226%, and infused non‐edibles up 135%. The sales of
concentrates have only been tracked since 2016, but both medical and retail sales showed increases.
$0
$20,000,000
$40,000,000
$60,000,000
$80,000,000
$100,000,000
$120,000,000
Jan 2014
Mar 2014
May 2014
Jul 2014
Sep 2014
Nov 2014
Jan 2015
Mar 2015
May 2015
Jul 2015
Sep 2015
Nov 2015
Jan 2016
Mar 2016
May 2016
Jul 2016
Sep 2016
Nov 2016
Jan 2017
Mar 2017
May 2017
Jul 2017
Sep 2017
Nov 2017
Jan 2018
Mar 2018
May 2018
Medical sales Retail sales

156
Table 44. Plants cultivated and annual sales totals, by type of marijuana product, 2014‐2017
2014 2015 2016 2017
Plants cultivated (monthly average in December)
Medical 302,793 327,960 350,206 305,063
Retail 216,802 346,921 525,225 669,044
Annual Sales
Medical bud/flower (lbs) 109,578 144,537 159,998 172,994
Retail bud/flower (lbs) 38,660 106,932 175,642 238,149
Medical infused edibles (units) 1,964,917 2,261,875 2,117,838 1,851,098
Retail infused edibles (units) 2,850,733 5,280,297 7,250,936 9,295,329
Medical infused non‐edibles (units) 411,099 485,362 292,401 210,823
Retail infused non‐edibles (units) 359,412 801,215 761,764 843,646
Medical concentrate (lbs) ‐‐ -- 10,037 14,092
Retail concentrate (lbs) ‐‐ -- 7,611 13,798
Source: Colorado Department of Revenue, Marijuana Enforcement Division. 2014 Annual Update; 2015 Annual Update; 2016 MED Annual Update; 2017 MED Annual Update, at https://www.colorado.gov/pacific/enforcement/med‐updates. Note: Sales amounts for concentrates was not reported prior to 2016.
Medical Marijuana Cardholders
Colorado Department of Public Health and Environment Process
The Medical Marijuana Registry is administered by the Colorado Department of Public Health and
Environment (CDPHE) pursuant to CRS 25‐1.5‐106. To apply for a medical marijuana registry card, a
person must be a Colorado resident with a valid Social Security number, be receiving treatment for a
qualifying debilitating medical condition, and be examined by a doctor with whom the person has a
bona fide physician‐patient relationship. The doctor must recommend the use of marijuana for the
patient’s condition and specify the number of plants required to alleviate the symptoms of the
condition. If the applicant is a minor, additional requirements apply, including a signed parental consent
form, two separate physician recommendations, and a copy of the minor’s state‐issued birth certificate.
Cardholders can choose to grow their own marijuana plants or designate a caregiver to grow the plants
for them. The commercial dispensary market can act as the caregiver and can service the number of
patients allowed by the Marijuana Enforcement Division.78 Cardholders also have the choice of
designating a private person as caregiver.
78 The Marijuana Enforcement Division licenses each dispensary to grow a certain number of plants based on the number of patients registered and their recommended plant count.
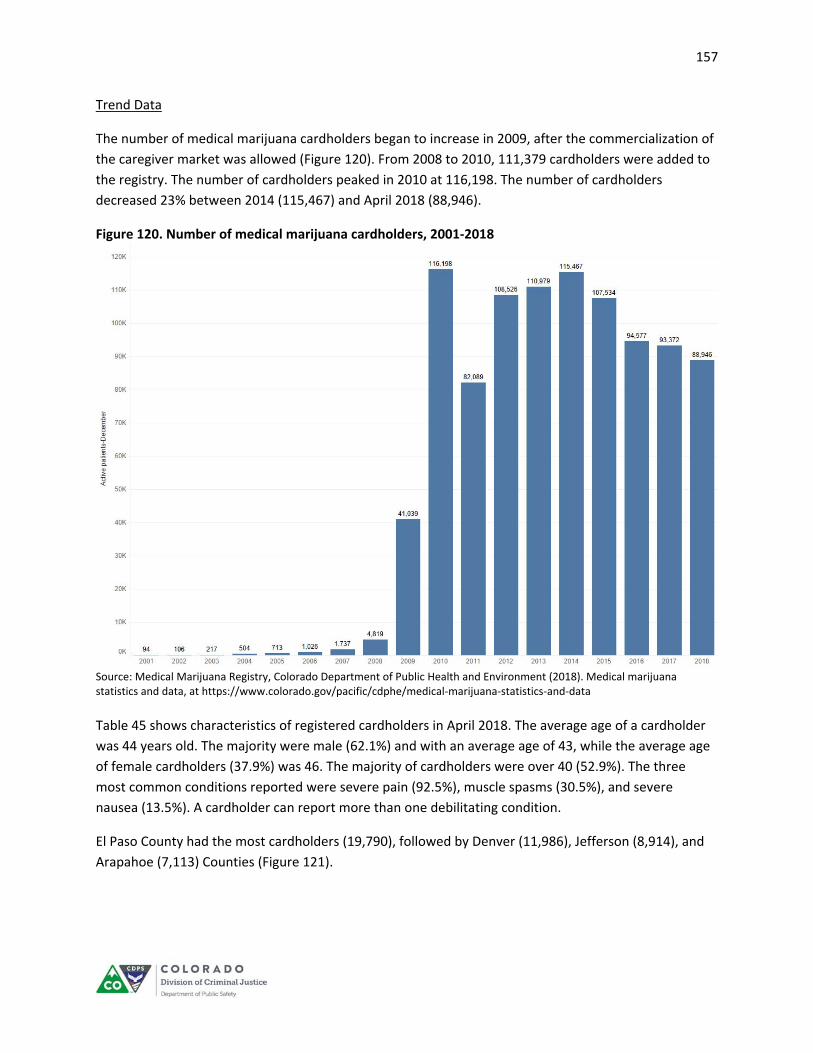
157
Trend Data
The number of medical marijuana cardholders began to increase in 2009, after the commercialization of
the caregiver market was allowed (Figure 120). From 2008 to 2010, 111,379 cardholders were added to
the registry. The number of cardholders peaked in 2010 at 116,198. The number of cardholders
decreased 23% between 2014 (115,467) and April 2018 (88,946).
Figure 120. Number of medical marijuana cardholders, 2001‐2018
Source: Medical Marijuana Registry, Colorado Department of Public Health and Environment (2018). Medical marijuana statistics and data, at https://www.colorado.gov/pacific/cdphe/medical‐marijuana‐statistics‐and‐data
Table 45 shows characteristics of registered cardholders in April 2018. The average age of a cardholder
was 44 years old. The majority were male (62.1%) and with an average age of 43, while the average age
of female cardholders (37.9%) was 46. The majority of cardholders were over 40 (52.9%). The three
most common conditions reported were severe pain (92.5%), muscle spasms (30.5%), and severe
nausea (13.5%). A cardholder can report more than one debilitating condition.
El Paso County had the most cardholders (19,790), followed by Denver (11,986), Jefferson (8,914), and
Arapahoe (7,113) Counties (Figure 121).
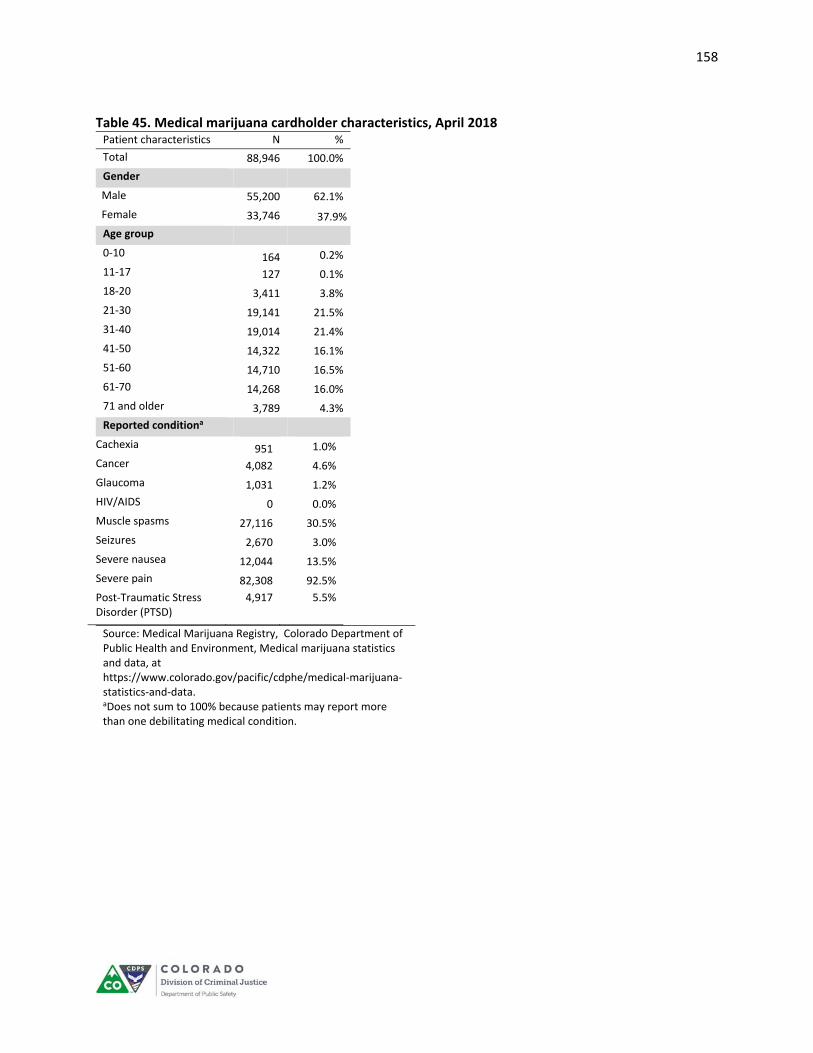
158
Table 45. Medical marijuana cardholder characteristics, April 2018 Patient characteristics N %
Total 88,946 100.0%
Gender
Male 55,200 62.1%
Female 33,746 37.9%
Age group
0‐10 164 0.2%
11‐17 127 0.1%
18‐20 3,411 3.8%
21‐30 19,141 21.5%
31‐40 19,014 21.4%
41‐50 14,322 16.1%
51‐60 14,710 16.5%
61‐70 14,268 16.0%
71 and older 3,789 4.3%
Reported conditiona
Cachexia 951 1.0%
Cancer 4,082 4.6%
Glaucoma 1,031 1.2%
HIV/AIDS 0 0.0%
Muscle spasms 27,116 30.5%
Seizures 2,670 3.0%
Severe nausea 12,044 13.5%
Severe pain 82,308 92.5%
Post‐Traumatic Stress Disorder (PTSD)
4,917 5.5%
Source: Medical Marijuana Registry, Colorado Department of Public Health and Environment, Medical marijuana statistics and data, at https://www.colorado.gov/pacific/cdphe/medical‐marijuana‐statistics‐and‐data. aDoes not sum to 100% because patients may report more than one debilitating medical condition.
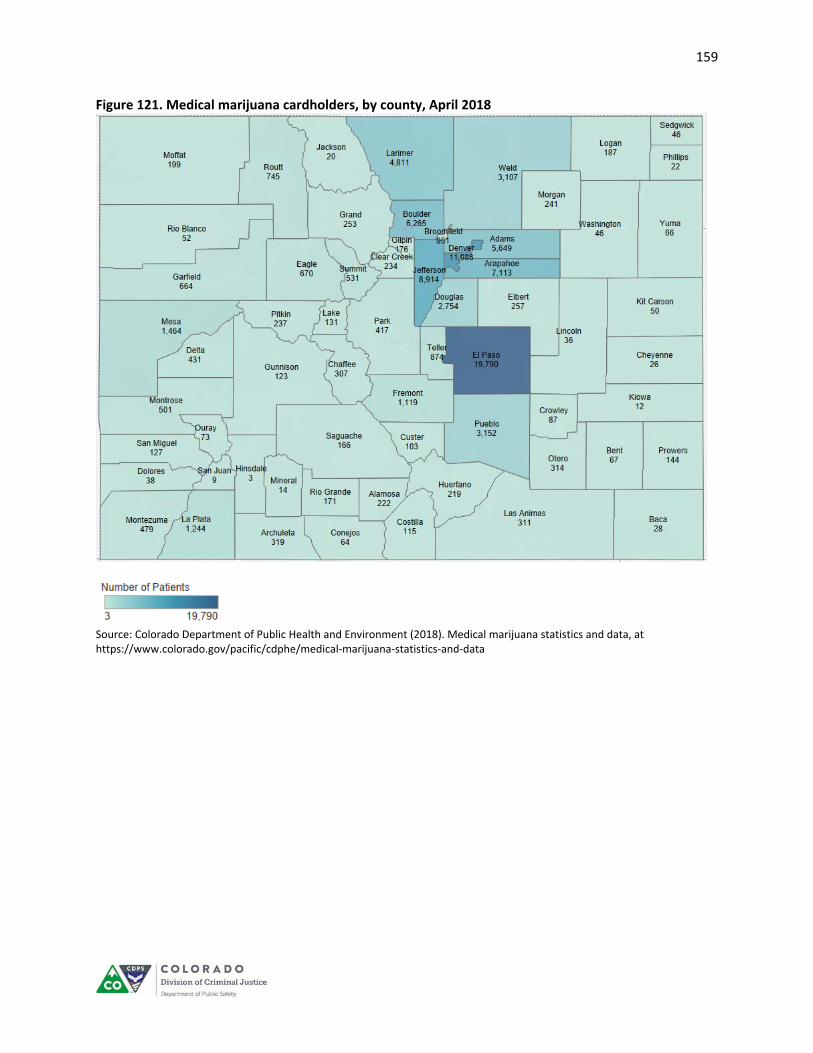
159
Figure 121. Medical marijuana cardholders, by county, April 2018
Source: Colorado Department of Public Health and Environment (2018). Medical marijuana statistics and data, at https://www.colorado.gov/pacific/cdphe/medical‐marijuana‐statistics‐and‐data
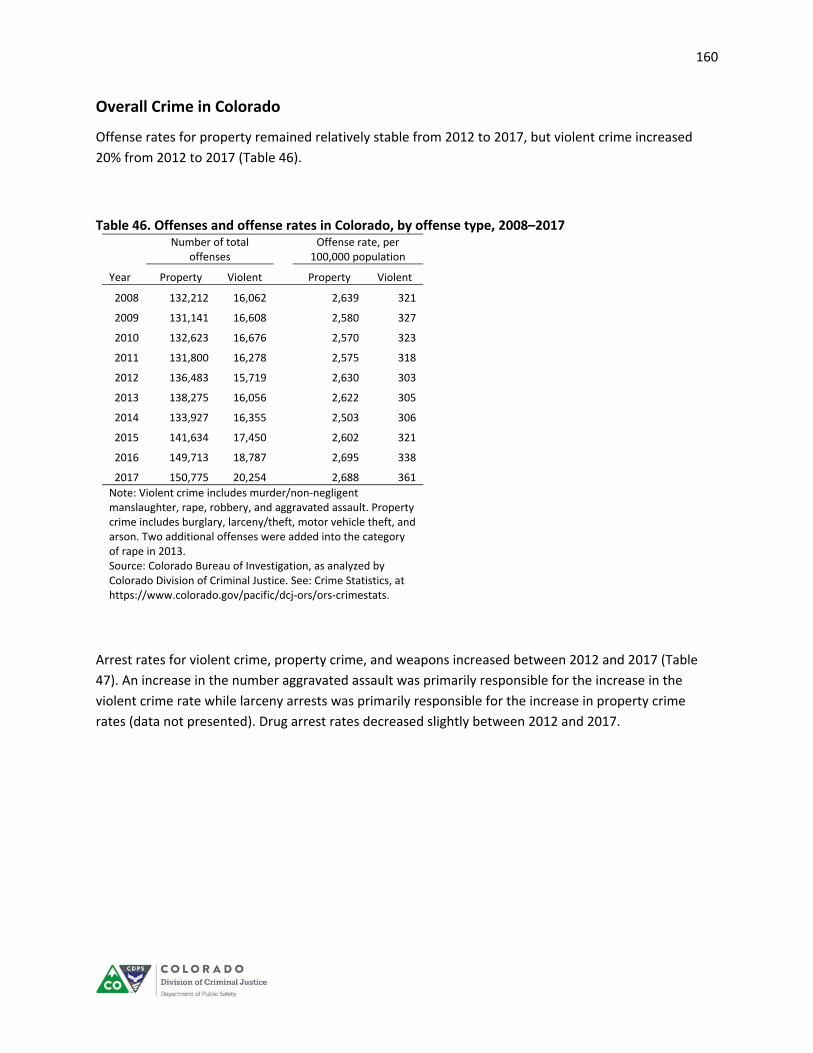
160
Overall Crime in Colorado
Offense rates for property remained relatively stable from 2012 to 2017, but violent crime increased
20% from 2012 to 2017 (Table 46).
Table 46. Offenses and offense rates in Colorado, by offense type, 2008–2017
Number of total
offenses Offense rate, per
100,000 population
Year Property Violent Property Violent
2008 132,212 16,062 2,639 321
2009 131,141 16,608 2,580 327
2010 132,623 16,676 2,570 323
2011 131,800 16,278 2,575 318
2012 136,483 15,719 2,630 303
2013 138,275 16,056 2,622 305
2014 133,927 16,355 2,503 306
2015 141,634 17,450 2,602 321
2016 149,713 18,787 2,695 338
2017 150,775 20,254 2,688 361
Note: Violent crime includes murder/non‐negligent manslaughter, rape, robbery, and aggravated assault. Property crime includes burglary, larceny/theft, motor vehicle theft, and arson. Two additional offenses were added into the category of rape in 2013. Source: Colorado Bureau of Investigation, as analyzed by Colorado Division of Criminal Justice. See: Crime Statistics, at https://www.colorado.gov/pacific/dcj‐ors/ors‐crimestats.
Arrest rates for violent crime, property crime, and weapons increased between 2012 and 2017 (Table
47). An increase in the number aggravated assault was primarily responsible for the increase in the
violent crime rate while larceny arrests was primarily responsible for the increase in property crime
rates (data not presented). Drug arrest rates decreased slightly between 2012 and 2017.
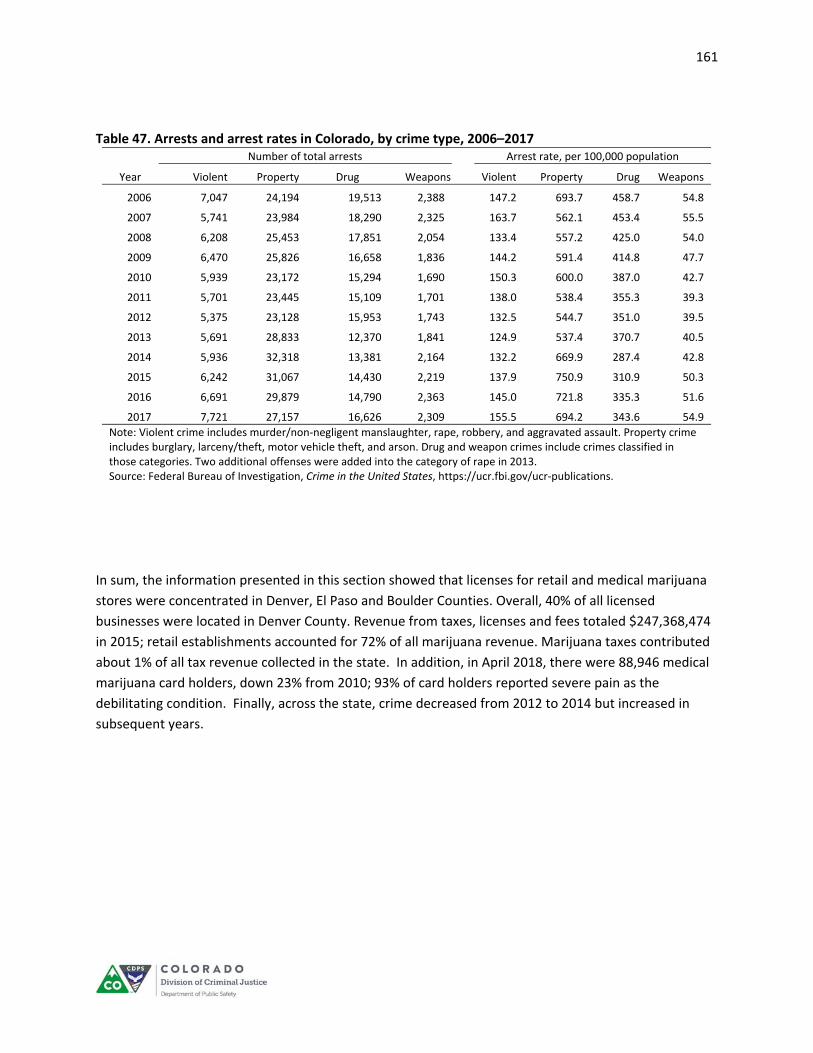
161
Table 47. Arrests and arrest rates in Colorado, by crime type, 2006–2017 Number of total arrests Arrest rate, per 100,000 population
Year Violent Property Drug Weapons Violent Property Drug Weapons
2006 7,047 24,194 19,513 2,388 147.2 693.7 458.7 54.8
2007 5,741 23,984 18,290 2,325 163.7 562.1 453.4 55.5
2008 6,208 25,453 17,851 2,054 133.4 557.2 425.0 54.0
2009 6,470 25,826 16,658 1,836 144.2 591.4 414.8 47.7
2010 5,939 23,172 15,294 1,690 150.3 600.0 387.0 42.7
2011 5,701 23,445 15,109 1,701 138.0 538.4 355.3 39.3
2012 5,375 23,128 15,953 1,743 132.5 544.7 351.0 39.5
2013 5,691 28,833 12,370 1,841 124.9 537.4 370.7 40.5
2014 5,936 32,318 13,381 2,164 132.2 669.9 287.4 42.8
2015 6,242 31,067 14,430 2,219 137.9 750.9 310.9 50.3
2016 6,691 29,879 14,790 2,363 145.0 721.8 335.3 51.6
2017 7,721 27,157 16,626 2,309 155.5 694.2 343.6 54.9
Note: Violent crime includes murder/non‐negligent manslaughter, rape, robbery, and aggravated assault. Property crime includes burglary, larceny/theft, motor vehicle theft, and arson. Drug and weapon crimes include crimes classified in those categories. Two additional offenses were added into the category of rape in 2013. Source: Federal Bureau of Investigation, Crime in the United States, https://ucr.fbi.gov/ucr‐publications.
In sum, the information presented in this section showed that licenses for retail and medical marijuana
stores were concentrated in Denver, El Paso and Boulder Counties. Overall, 40% of all licensed
businesses were located in Denver County. Revenue from taxes, licenses and fees totaled $247,368,474
in 2015; retail establishments accounted for 72% of all marijuana revenue. Marijuana taxes contributed
about 1% of all tax revenue collected in the state. In addition, in April 2018, there were 88,946 medical
marijuana card holders, down 23% from 2010; 93% of card holders reported severe pain as the
debilitating condition. Finally, across the state, crime decreased from 2012 to 2014 but increased in
subsequent years.

162
APPENDIX A:
OGDEN MEMORANDUM

163
164
165

166
APPENDIX B:
COLE MEMORANDUM

167
168

169
170

171
APPENDIX C:
MARIJUANA ARRESTS

172
Appendix C, Table 1. Marijuana arrests, by county, 2012‐2017
Number of marijuana arrests
County 2012 2013 2014 2015 2016 2017
Unknown 1265 275 333 337 273 278
Adams 2222 938 813 729 683 736
Alamosa 2 6 12 21 15 23
Arapahoe 1466 700 813 703 687 581
Archuleta 17 3 6 19 11 4
Baca 17 7 1 1 2 0
Bent 0 1 0 1 0 0
Boulder 712 433 352 391 445 656
Broomfield 294 127 132 76 113 108
Chaffee 47 14 17 13 19 10
Cheyenne 2 1 0 0 0 0
Clear Creek 44 7 6 9 2 1
Conejos 2 0 0 0 0 0
Costilla 0 0 1 0 0 0
Crowley 0 0 0 1 0 3
Custer 1 1 3 4 2 2
Delta 15 15 8 2 24 21
Denver 168 451 836 1127 613 267
Dolores 0 1 1 0 0 4
Douglas 533 331 213 258 265 388
Eagle 259 124 93 114 90 89
El Paso 848 517 592 479 538 447
Elbert 17 19 17 7 4 12
Fremont 38 11 5 12 6 24
Garfield 164 50 44 87 84 123
Gilpin 96 7 4 6 3 6
Grand 14 2 4 0 2 0
Gunnison 37 29 31 49 33 44
Hinsdale 0 0 0 0 2 0
Huerfano 13 0 4 6 9 1
Jackson 0 0 0 0 0 0
Jefferson 1443 746 920 840 841 849
Kiowa 1 3 0 0 0 0
Kit Carson 18 11 4 17 10 15
La Plata 54 53 81 65 69 80
Lake 24 3 3 0 2 1
Larimer 896 464 459 419 514 470
Las Animas 7 5 1 1 0 4
Lincoln 1 0 0 1 1 7
Logan 41 3 28 34 17 11
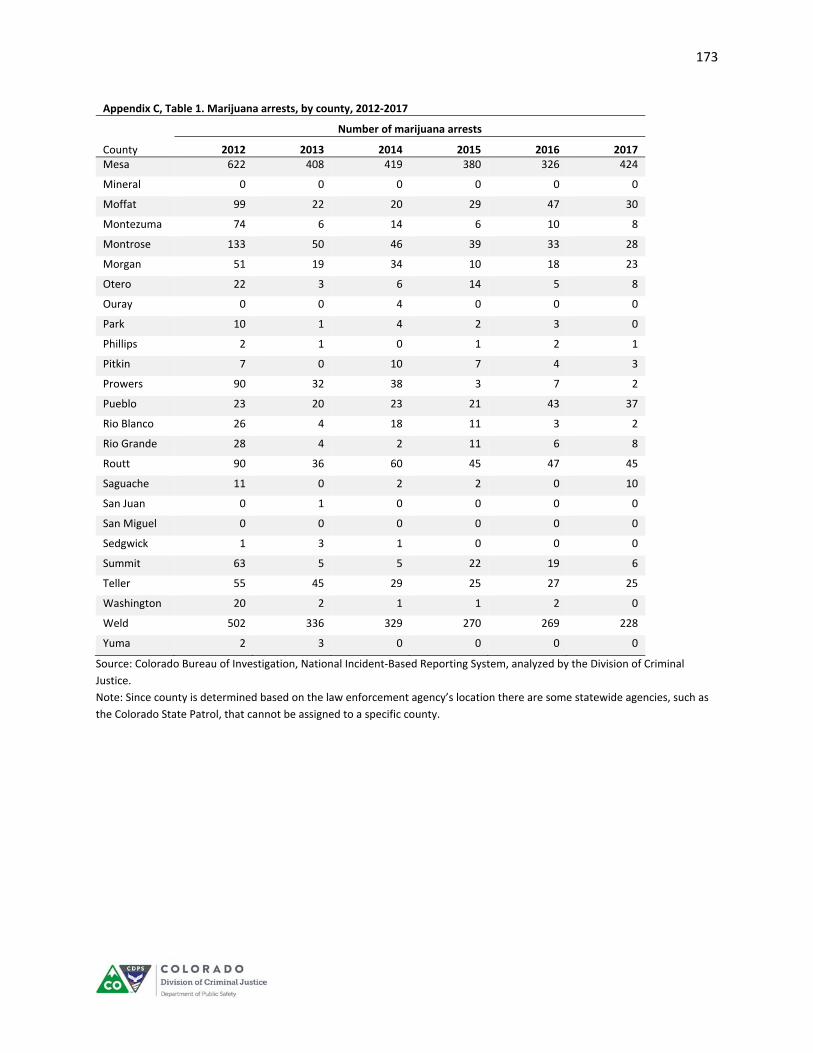
173
Appendix C, Table 1. Marijuana arrests, by county, 2012‐2017
Number of marijuana arrests
County 2012 2013 2014 2015 2016 2017 Mesa 622 408 419 380 326 424
Mineral 0 0 0 0 0 0
Moffat 99 22 20 29 47 30
Montezuma 74 6 14 6 10 8
Montrose 133 50 46 39 33 28
Morgan 51 19 34 10 18 23
Otero 22 3 6 14 5 8
Ouray 0 0 4 0 0 0
Park 10 1 4 2 3 0
Phillips 2 1 0 1 2 1
Pitkin 7 0 10 7 4 3
Prowers 90 32 38 3 7 2
Pueblo 23 20 23 21 43 37
Rio Blanco 26 4 18 11 3 2
Rio Grande 28 4 2 11 6 8
Routt 90 36 60 45 47 45
Saguache 11 0 2 2 0 10
San Juan 0 1 0 0 0 0
San Miguel 0 0 0 0 0 0
Sedgwick 1 3 1 0 0 0
Summit 63 5 5 22 19 6
Teller 55 45 29 25 27 25
Washington 20 2 1 1 2 0
Weld 502 336 329 270 269 228
Yuma 2 3 0 0 0 0
Source: Colorado Bureau of Investigation, National Incident‐Based Reporting System, analyzed by the Division of Criminal
Justice.
Note: Since county is determined based on the law enforcement agency’s location there are some statewide agencies, such as
the Colorado State Patrol, that cannot be assigned to a specific county.

174
Appendix C, Table 2. Marijuana arrest rate (per 100,000 county population), by county, 2012‐2017
Arrest rate (per 100,000 population)
County 2012 2013 2014 2015 2016 2017
Adams 576 237 200 175 161 169 Alamosa 15 45 89 154 109 165 Arapahoe 286 134 152 129 124 103 Archuleta 156 27 54 170 95 34 Baca 512 216 31 32 64 0 Bent 0 19 0 19 0 0 Boulder 263 157 126 137 154 223 Broomfield 581 244 246 134 194 179 Chaffee 284 84 101 77 109 57 Cheyenne 124 62 0 0 0 0 Clear Creek 533 85 72 106 23 12 Conejos 29 0 0 0 0 0 Costilla 0 0 31 0 0 0 Crowley 0 0 0 19 0 62 Custer 25 25 74 96 46 46 Delta 56 56 30 7 88 76 Denver 30 80 144 189 101 43 Dolores 0 56 58 0 0 219 Douglas 210 126 78 92 92 131 Eagle 580 273 202 244 190 184 El Paso 153 92 103 82 90 73 Elbert 81 89 78 31 18 50 Fremont 89 26 12 28 14 55 Garfield 340 103 90 175 165 236 Gilpin 1,956 140 77 114 56 111 Grand 111 16 31 0 15 0 Gunnison 269 208 219 339 224 295 Hinsdale 0 0 0 0 288 0 Huerfano 217 0 68 102 148 16 Jackson 0 0 0 0 0 0 Jefferson 298 152 185 167 165 164 Kiowa 78 238 0 0 0 0 Kit Carson 253 152 57 237 150 224 La Plata 116 112 168 133 139 156 Lake 383 48 47 0 30 15 Larimer 327 166 160 142 171 154 Las Animas 53 39 8 8 0 32 Lincoln 21 0 0 20 20 141
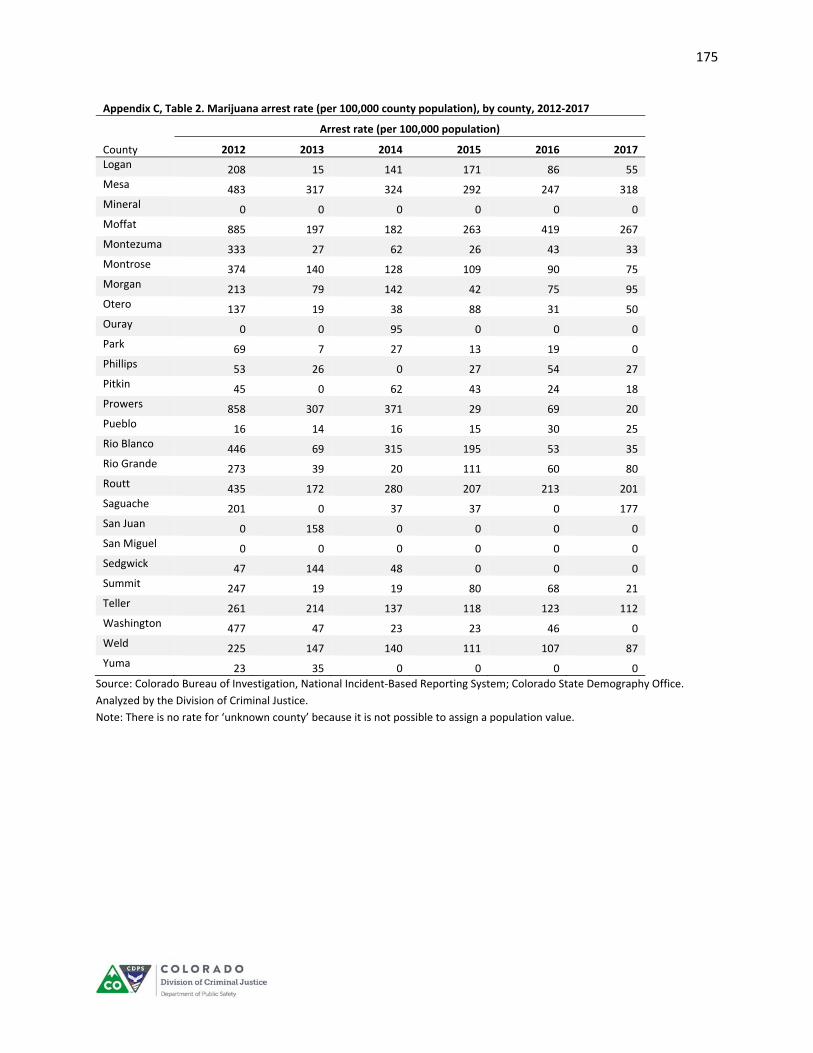
175
Appendix C, Table 2. Marijuana arrest rate (per 100,000 county population), by county, 2012‐2017
Arrest rate (per 100,000 population)
County 2012 2013 2014 2015 2016 2017 Logan 208 15 141 171 86 55 Mesa 483 317 324 292 247 318 Mineral 0 0 0 0 0 0 Moffat 885 197 182 263 419 267 Montezuma 333 27 62 26 43 33 Montrose 374 140 128 109 90 75 Morgan 213 79 142 42 75 95 Otero 137 19 38 88 31 50 Ouray 0 0 95 0 0 0 Park 69 7 27 13 19 0 Phillips 53 26 0 27 54 27 Pitkin 45 0 62 43 24 18 Prowers 858 307 371 29 69 20 Pueblo 16 14 16 15 30 25 Rio Blanco 446 69 315 195 53 35 Rio Grande 273 39 20 111 60 80 Routt 435 172 280 207 213 201 Saguache 201 0 37 37 0 177 San Juan 0 158 0 0 0 0 San Miguel 0 0 0 0 0 0 Sedgwick 47 144 48 0 0 0 Summit 247 19 19 80 68 21 Teller 261 214 137 118 123 112 Washington 477 47 23 23 46 0 Weld 225 147 140 111 107 87 Yuma 23 35 0 0 0 0
Source: Colorado Bureau of Investigation, National Incident‐Based Reporting System; Colorado State Demography Office.
Analyzed by the Division of Criminal Justice.
Note: There is no rate for ‘unknown county’ because it is not possible to assign a population value.
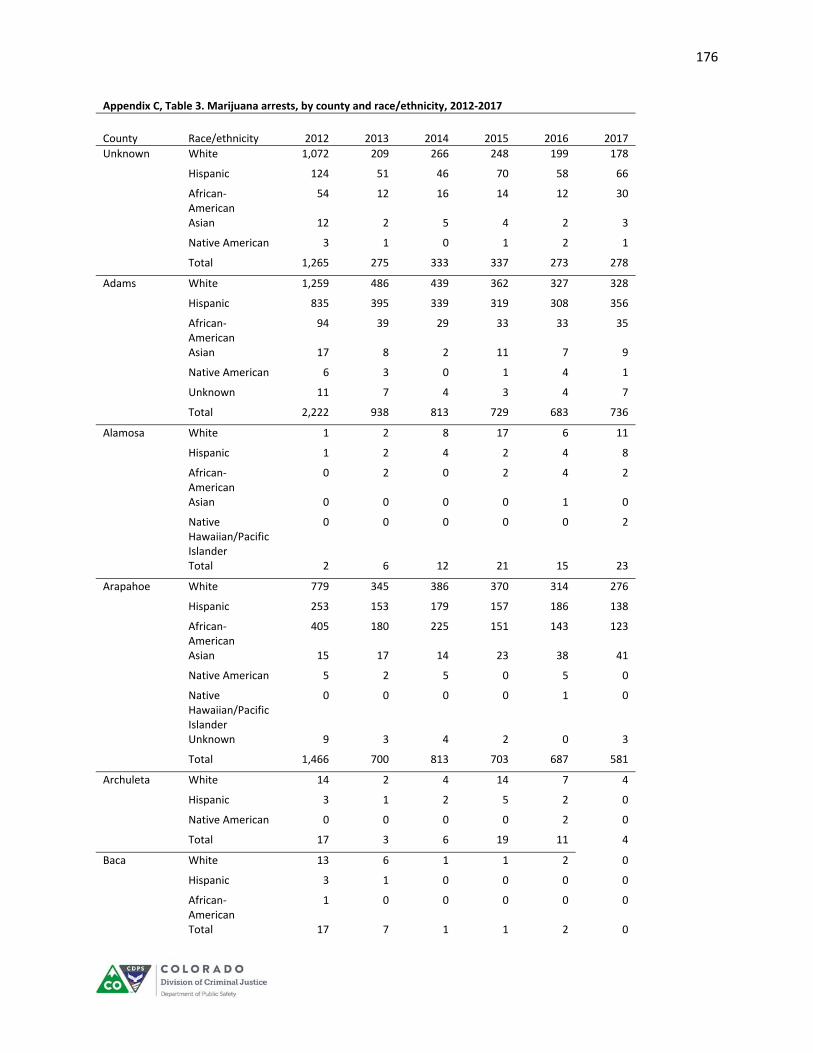
176
Appendix C, Table 3. Marijuana arrests, by county and race/ethnicity, 2012‐2017
County Race/ethnicity 2012 2013 2014 2015 2016 2017
Unknown White 1,072 209 266 248 199 178
Hispanic 124 51 46 70 58 66
African‐American
54 12 16 14 12 30
Asian 12 2 5 4 2 3
Native American 3 1 0 1 2 1
Total 1,265 275 333 337 273 278
Adams White 1,259 486 439 362 327 328
Hispanic 835 395 339 319 308 356
African‐American
94 39 29 33 33 35
Asian 17 8 2 11 7 9
Native American 6 3 0 1 4 1
Unknown 11 7 4 3 4 7
Total 2,222 938 813 729 683 736
Alamosa White 1 2 8 17 6 11
Hispanic 1 2 4 2 4 8
African‐American
0 2 0 2 4 2
Asian 0 0 0 0 1 0
Native Hawaiian/Pacific Islander
0 0 0 0 0 2
Total 2 6 12 21 15 23
Arapahoe White 779 345 386 370 314 276
Hispanic 253 153 179 157 186 138
African‐American
405 180 225 151 143 123
Asian 15 17 14 23 38 41
Native American 5 2 5 0 5 0
Native Hawaiian/Pacific Islander
0 0 0 0 1 0
Unknown 9 3 4 2 0 3
Total 1,466 700 813 703 687 581
Archuleta White 14 2 4 14 7 4
Hispanic 3 1 2 5 2 0
Native American 0 0 0 0 2 0
Total 17 3 6 19 11 4
Baca White 13 6 1 1 2 0
Hispanic 3 1 0 0 0 0
African‐American
1 0 0 0 0 0
Total 17 7 1 1 2 0

177
Appendix C, Table 3. Marijuana arrests, by county and race/ethnicity, 2012‐2017
County Race/ethnicity 2012 2013 2014 2015 2016 2017
Bent White 0 0 0 1 0 0
Unknown 0 1 0 0 0 0
Total 0 1 0 1 0 0
Boulder White 591 373 284 291 332 508
Hispanic 83 39 47 82 79 104
African‐American
28 16 11 8 17 16
Asian 8 5 7 10 10 24
Native American 1 0 0 0 3 1
Native Hawaiian/Pacific Islander
0 0 0 0 2 0
Unknown 1 0 3 0 2 3
Total 712 433 352 391 445 656
Broomfield White 251 106 111 59 83 69
Hispanic 34 16 9 13 23 37
African‐American
6 5 4 2 2 0
Asian 2 0 2 1 2 0
Native American 1 0 1 0 0 1
Unknown 0 0 5 1 3 1
Total 294 127 132 76 113 108
Chaffee White 45 13 15 11 18 9
Hispanic 1 1 0 0 1 0
African‐American
1 0 2 2 0 1
Total 47 14 17 13 19 10
Cheyenne White 2 0 0 0 0 0
African‐American
0 1 0 0 0 0
Total 2 1 0 0 0 0
Clear Creek White 37 7 5 9 1 1
Hispanic 5 0 1 0 1 0
Asian 2 0 0 0 0 0
Total 44 7 6 9 2 1
Conejos White 1 0 0 0 0 0
Hispanic 1 0 0 0 0 0
Total 2 0 0 0 0 0
Costilla Hispanic 0 0 1 0 0 0
Total 0 0 1 0 0 0
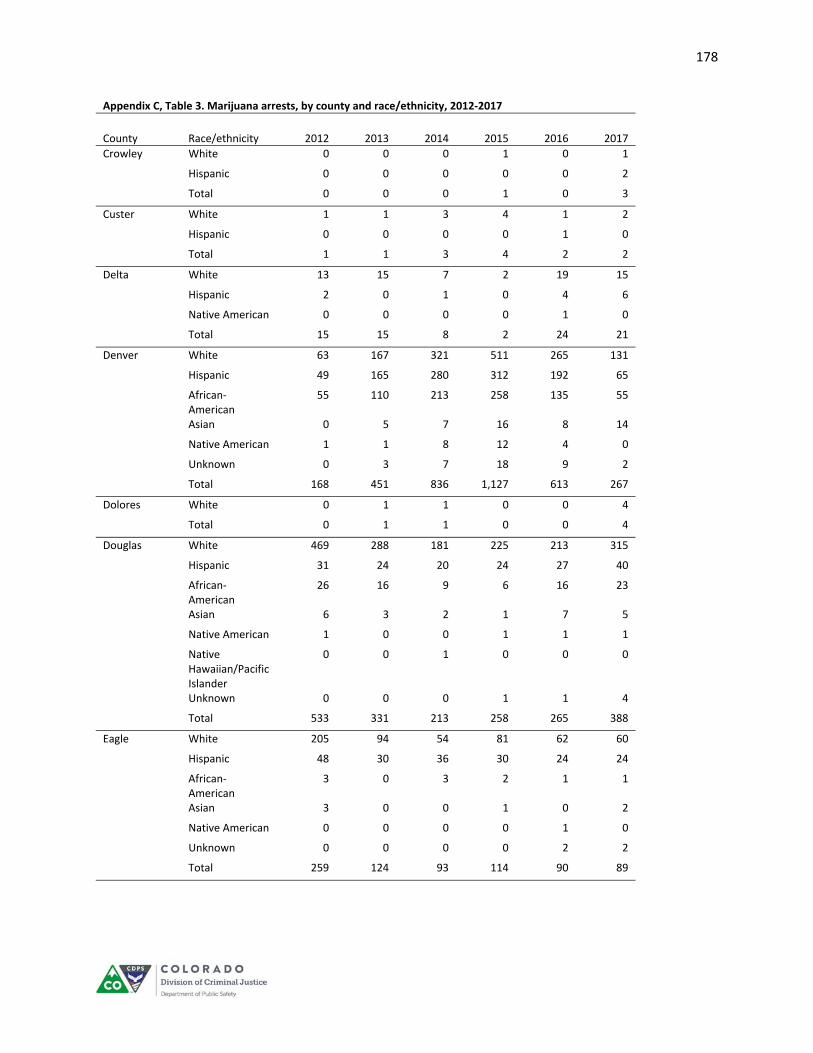
178
Appendix C, Table 3. Marijuana arrests, by county and race/ethnicity, 2012‐2017
County Race/ethnicity 2012 2013 2014 2015 2016 2017
Crowley White 0 0 0 1 0 1
Hispanic 0 0 0 0 0 2
Total 0 0 0 1 0 3
Custer White 1 1 3 4 1 2
Hispanic 0 0 0 0 1 0
Total 1 1 3 4 2 2
Delta White 13 15 7 2 19 15
Hispanic 2 0 1 0 4 6
Native American 0 0 0 0 1 0
Total 15 15 8 2 24 21
Denver White 63 167 321 511 265 131
Hispanic 49 165 280 312 192 65
African‐American
55 110 213 258 135 55
Asian 0 5 7 16 8 14
Native American 1 1 8 12 4 0
Unknown 0 3 7 18 9 2
Total 168 451 836 1,127 613 267
Dolores White 0 1 1 0 0 4
Total 0 1 1 0 0 4
Douglas White 469 288 181 225 213 315
Hispanic 31 24 20 24 27 40
African‐American
26 16 9 6 16 23
Asian 6 3 2 1 7 5
Native American 1 0 0 1 1 1
Native Hawaiian/Pacific Islander
0 0 1 0 0 0
Unknown 0 0 0 1 1 4
Total 533 331 213 258 265 388
Eagle White 205 94 54 81 62 60
Hispanic 48 30 36 30 24 24
African‐American
3 0 3 2 1 1
Asian 3 0 0 1 0 2
Native American 0 0 0 0 1 0
Unknown 0 0 0 0 2 2
Total 259 124 93 114 90 89
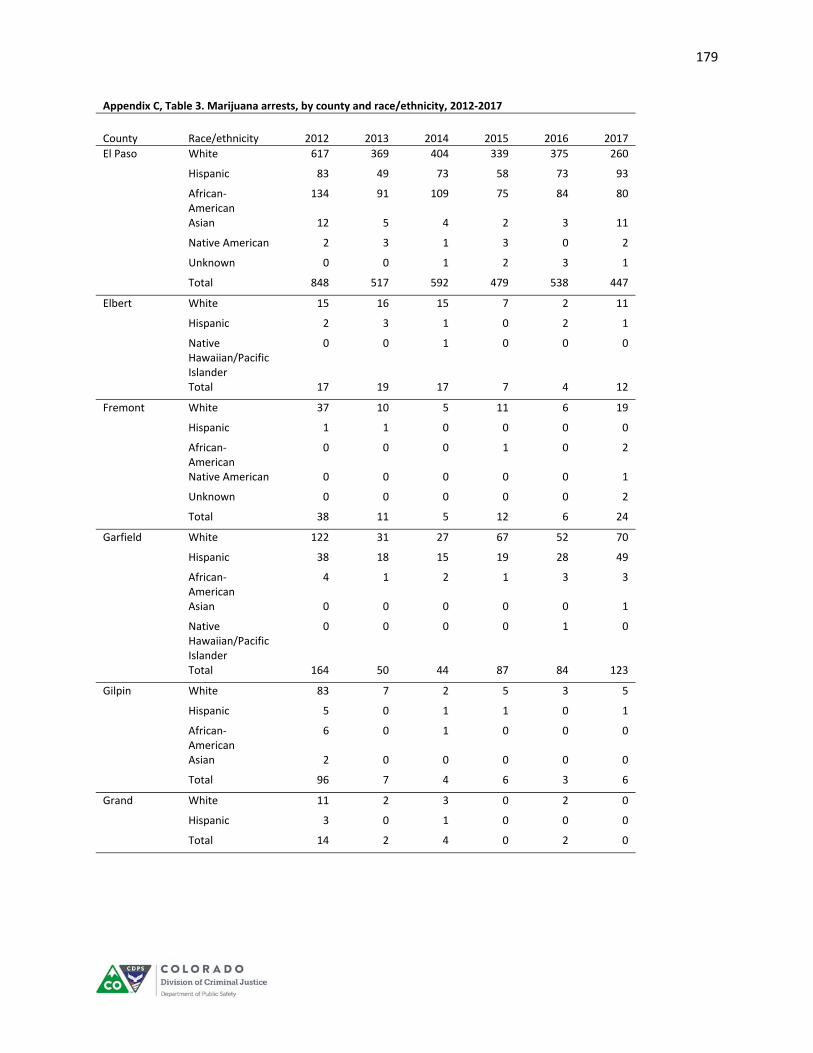
179
Appendix C, Table 3. Marijuana arrests, by county and race/ethnicity, 2012‐2017
County Race/ethnicity 2012 2013 2014 2015 2016 2017
El Paso White 617 369 404 339 375 260
Hispanic 83 49 73 58 73 93
African‐American
134 91 109 75 84 80
Asian 12 5 4 2 3 11
Native American 2 3 1 3 0 2
Unknown 0 0 1 2 3 1
Total 848 517 592 479 538 447
Elbert White 15 16 15 7 2 11
Hispanic 2 3 1 0 2 1
Native Hawaiian/Pacific Islander
0 0 1 0 0 0
Total 17 19 17 7 4 12
Fremont White 37 10 5 11 6 19
Hispanic 1 1 0 0 0 0
African‐American
0 0 0 1 0 2
Native American 0 0 0 0 0 1
Unknown 0 0 0 0 0 2
Total 38 11 5 12 6 24
Garfield White 122 31 27 67 52 70
Hispanic 38 18 15 19 28 49
African‐American
4 1 2 1 3 3
Asian 0 0 0 0 0 1
Native Hawaiian/Pacific Islander
0 0 0 0 1 0
Total 164 50 44 87 84 123
Gilpin White 83 7 2 5 3 5
Hispanic 5 0 1 1 0 1
African‐American
6 0 1 0 0 0
Asian 2 0 0 0 0 0
Total 96 7 4 6 3 6
Grand White 11 2 3 0 2 0
Hispanic 3 0 1 0 0 0
Total 14 2 4 0 2 0
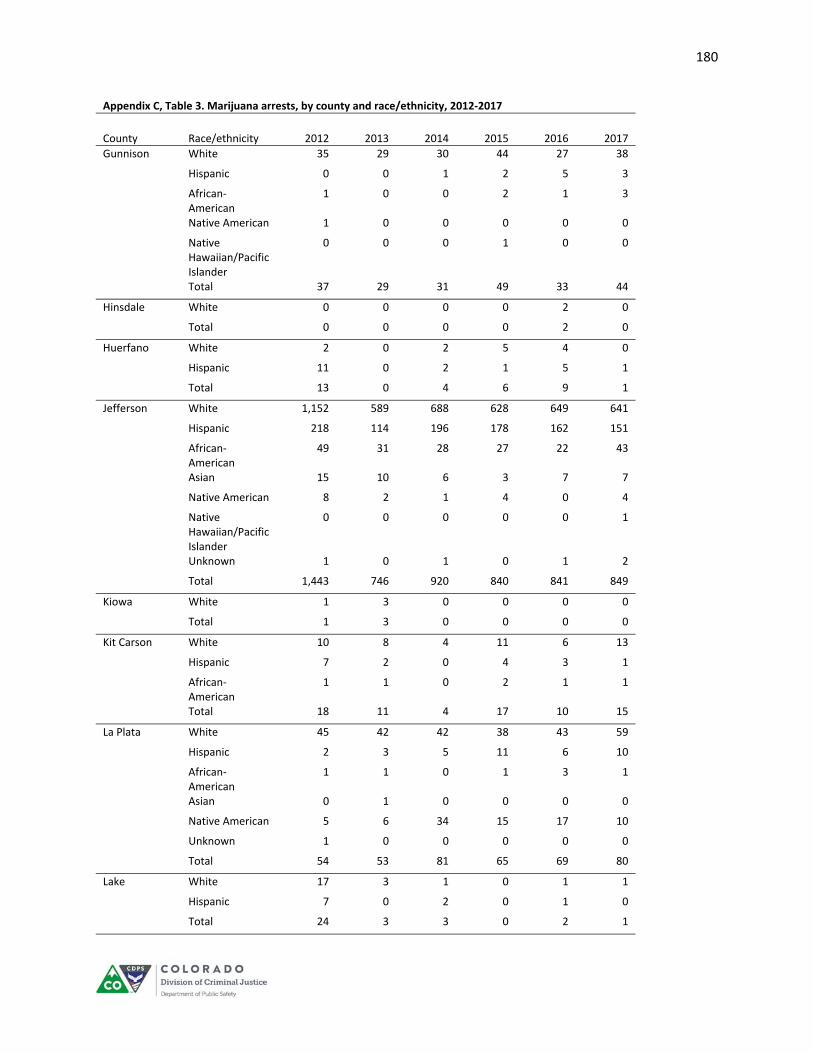
180
Appendix C, Table 3. Marijuana arrests, by county and race/ethnicity, 2012‐2017
County Race/ethnicity 2012 2013 2014 2015 2016 2017
Gunnison White 35 29 30 44 27 38
Hispanic 0 0 1 2 5 3
African‐American
1 0 0 2 1 3
Native American 1 0 0 0 0 0
Native Hawaiian/Pacific Islander
0 0 0 1 0 0
Total 37 29 31 49 33 44
Hinsdale White 0 0 0 0 2 0
Total 0 0 0 0 2 0
Huerfano White 2 0 2 5 4 0
Hispanic 11 0 2 1 5 1
Total 13 0 4 6 9 1
Jefferson White 1,152 589 688 628 649 641
Hispanic 218 114 196 178 162 151
African‐American
49 31 28 27 22 43
Asian 15 10 6 3 7 7
Native American 8 2 1 4 0 4
Native Hawaiian/Pacific Islander
0 0 0 0 0 1
Unknown 1 0 1 0 1 2
Total 1,443 746 920 840 841 849
Kiowa White 1 3 0 0 0 0
Total 1 3 0 0 0 0
Kit Carson White 10 8 4 11 6 13
Hispanic 7 2 0 4 3 1
African‐American
1 1 0 2 1 1
Total 18 11 4 17 10 15
La Plata White 45 42 42 38 43 59
Hispanic 2 3 5 11 6 10
African‐American
1 1 0 1 3 1
Asian 0 1 0 0 0 0
Native American 5 6 34 15 17 10
Unknown 1 0 0 0 0 0
Total 54 53 81 65 69 80
Lake White 17 3 1 0 1 1
Hispanic 7 0 2 0 1 0
Total 24 3 3 0 2 1
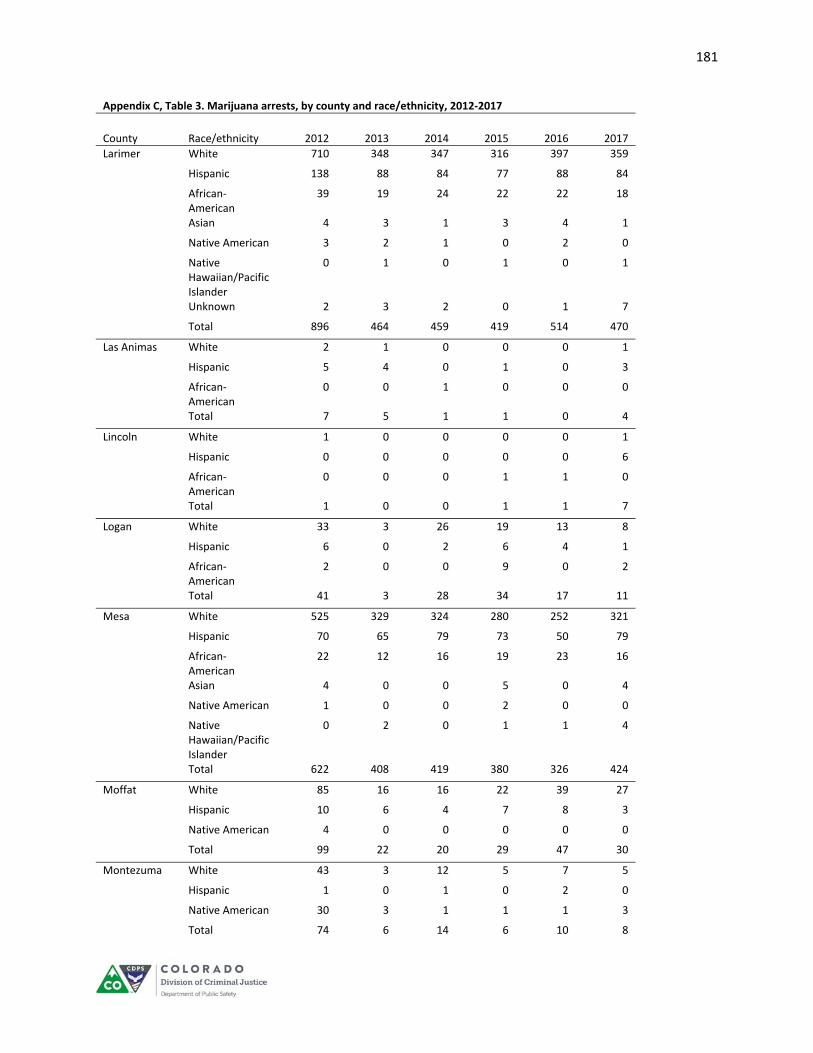
181
Appendix C, Table 3. Marijuana arrests, by county and race/ethnicity, 2012‐2017
County Race/ethnicity 2012 2013 2014 2015 2016 2017
Larimer White 710 348 347 316 397 359
Hispanic 138 88 84 77 88 84
African‐American
39 19 24 22 22 18
Asian 4 3 1 3 4 1
Native American 3 2 1 0 2 0
Native Hawaiian/Pacific Islander
0 1 0 1 0 1
Unknown 2 3 2 0 1 7
Total 896 464 459 419 514 470
Las Animas White 2 1 0 0 0 1
Hispanic 5 4 0 1 0 3
African‐American
0 0 1 0 0 0
Total 7 5 1 1 0 4
Lincoln White 1 0 0 0 0 1
Hispanic 0 0 0 0 0 6
African‐American
0 0 0 1 1 0
Total 1 0 0 1 1 7
Logan White 33 3 26 19 13 8
Hispanic 6 0 2 6 4 1
African‐American
2 0 0 9 0 2
Total 41 3 28 34 17 11
Mesa White 525 329 324 280 252 321
Hispanic 70 65 79 73 50 79
African‐American
22 12 16 19 23 16
Asian 4 0 0 5 0 4
Native American 1 0 0 2 0 0
Native Hawaiian/Pacific Islander
0 2 0 1 1 4
Total 622 408 419 380 326 424
Moffat White 85 16 16 22 39 27
Hispanic 10 6 4 7 8 3
Native American 4 0 0 0 0 0
Total 99 22 20 29 47 30
Montezuma White 43 3 12 5 7 5
Hispanic 1 0 1 0 2 0
Native American 30 3 1 1 1 3
Total 74 6 14 6 10 8
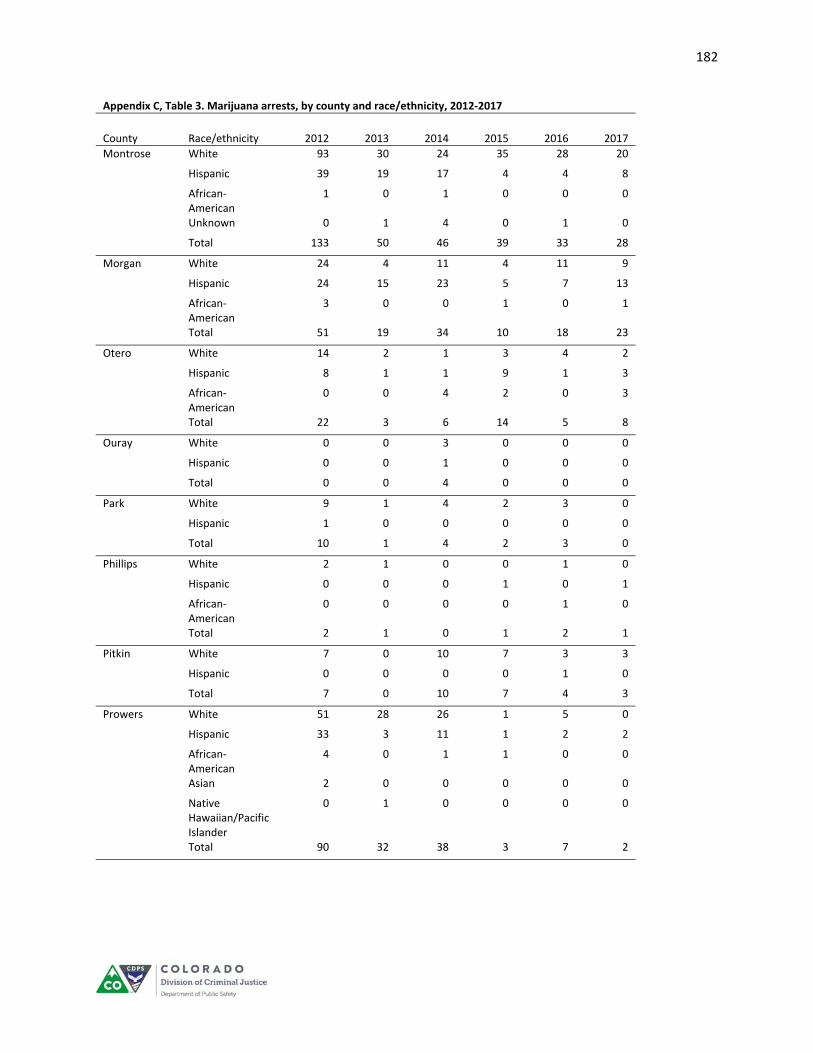
182
Appendix C, Table 3. Marijuana arrests, by county and race/ethnicity, 2012‐2017
County Race/ethnicity 2012 2013 2014 2015 2016 2017
Montrose White 93 30 24 35 28 20
Hispanic 39 19 17 4 4 8
African‐American
1 0 1 0 0 0
Unknown 0 1 4 0 1 0
Total 133 50 46 39 33 28
Morgan White 24 4 11 4 11 9
Hispanic 24 15 23 5 7 13
African‐American
3 0 0 1 0 1
Total 51 19 34 10 18 23
Otero White 14 2 1 3 4 2
Hispanic 8 1 1 9 1 3
African‐American
0 0 4 2 0 3
Total 22 3 6 14 5 8
Ouray White 0 0 3 0 0 0
Hispanic 0 0 1 0 0 0
Total 0 0 4 0 0 0
Park White 9 1 4 2 3 0
Hispanic 1 0 0 0 0 0
Total 10 1 4 2 3 0
Phillips White 2 1 0 0 1 0
Hispanic 0 0 0 1 0 1
African‐American
0 0 0 0 1 0
Total 2 1 0 1 2 1
Pitkin White 7 0 10 7 3 3
Hispanic 0 0 0 0 1 0
Total 7 0 10 7 4 3
Prowers White 51 28 26 1 5 0
Hispanic 33 3 11 1 2 2
African‐American
4 0 1 1 0 0
Asian 2 0 0 0 0 0
Native Hawaiian/Pacific Islander
0 1 0 0 0 0
Total 90 32 38 3 7 2
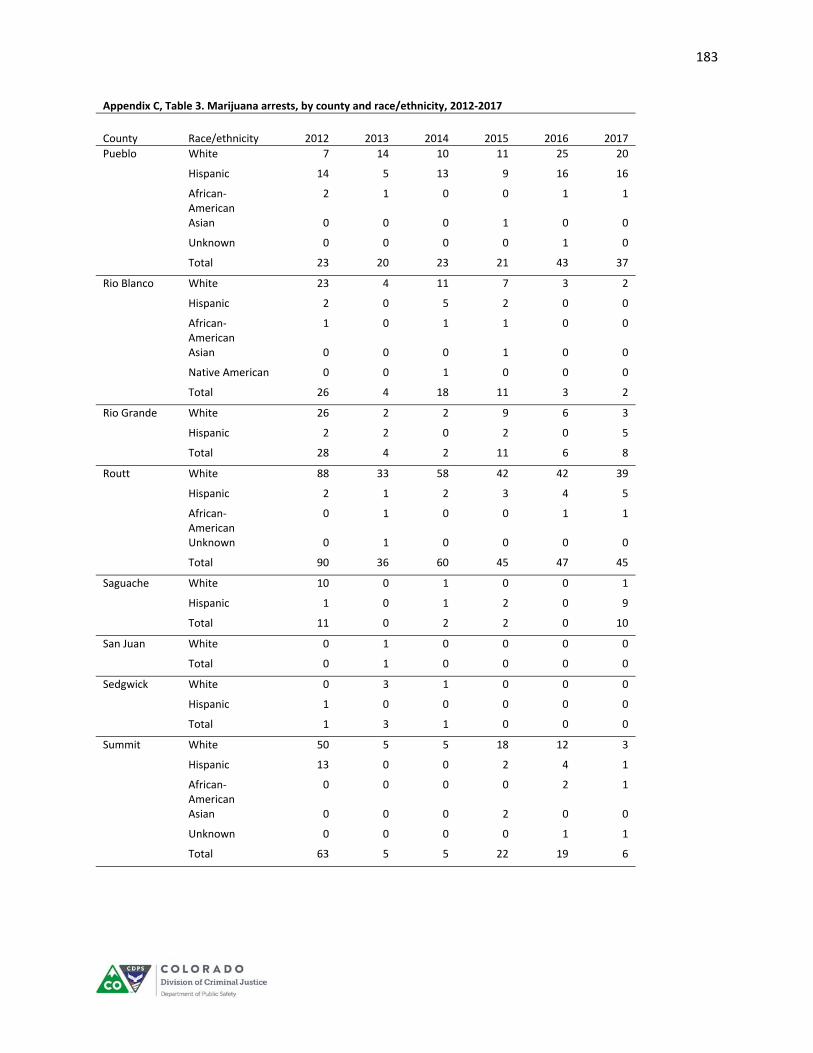
183
Appendix C, Table 3. Marijuana arrests, by county and race/ethnicity, 2012‐2017
County Race/ethnicity 2012 2013 2014 2015 2016 2017
Pueblo White 7 14 10 11 25 20
Hispanic 14 5 13 9 16 16
African‐American
2 1 0 0 1 1
Asian 0 0 0 1 0 0
Unknown 0 0 0 0 1 0
Total 23 20 23 21 43 37
Rio Blanco White 23 4 11 7 3 2
Hispanic 2 0 5 2 0 0
African‐American
1 0 1 1 0 0
Asian 0 0 0 1 0 0
Native American 0 0 1 0 0 0
Total 26 4 18 11 3 2
Rio Grande White 26 2 2 9 6 3
Hispanic 2 2 0 2 0 5
Total 28 4 2 11 6 8
Routt White 88 33 58 42 42 39
Hispanic 2 1 2 3 4 5
African‐American
0 1 0 0 1 1
Unknown 0 1 0 0 0 0
Total 90 36 60 45 47 45
Saguache White 10 0 1 0 0 1
Hispanic 1 0 1 2 0 9
Total 11 0 2 2 0 10
San Juan White 0 1 0 0 0 0
Total 0 1 0 0 0 0
Sedgwick White 0 3 1 0 0 0
Hispanic 1 0 0 0 0 0
Total 1 3 1 0 0 0
Summit White 50 5 5 18 12 3
Hispanic 13 0 0 2 4 1
African‐American
0 0 0 0 2 1
Asian 0 0 0 2 0 0
Unknown 0 0 0 0 1 1
Total 63 5 5 22 19 6
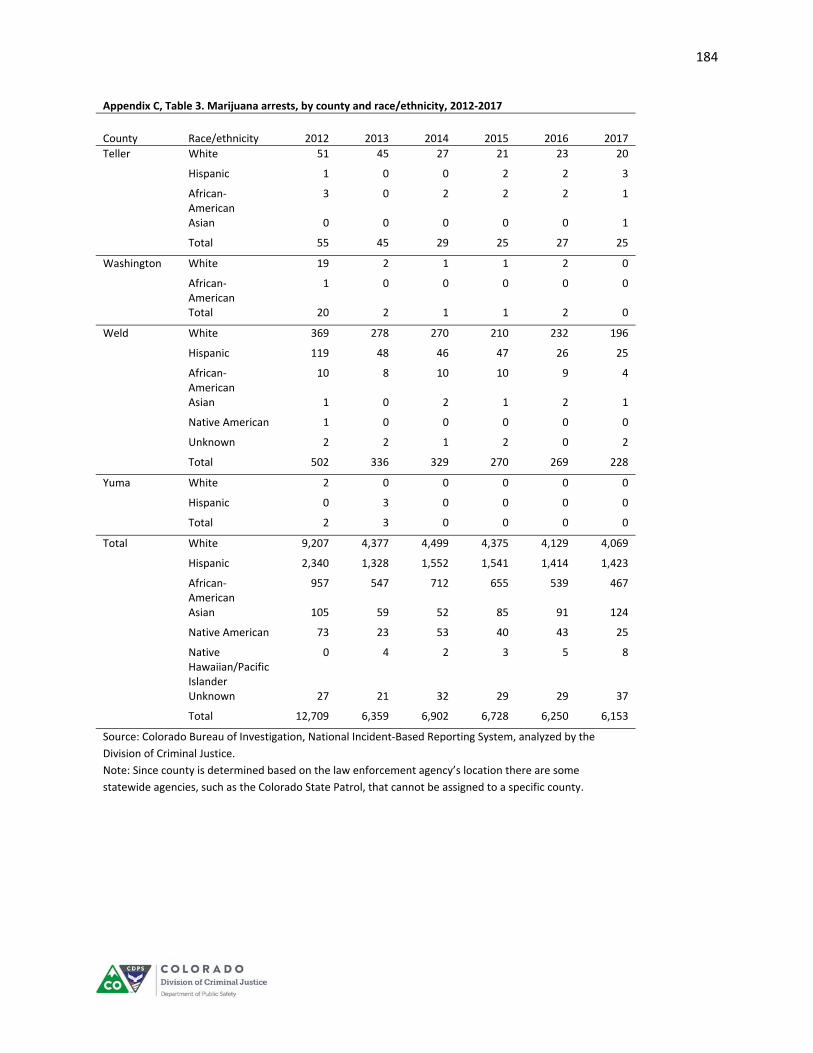
184
Appendix C, Table 3. Marijuana arrests, by county and race/ethnicity, 2012‐2017
County Race/ethnicity 2012 2013 2014 2015 2016 2017
Teller White 51 45 27 21 23 20
Hispanic 1 0 0 2 2 3
African‐American
3 0 2 2 2 1
Asian 0 0 0 0 0 1
Total 55 45 29 25 27 25
Washington White 19 2 1 1 2 0
African‐American
1 0 0 0 0 0
Total 20 2 1 1 2 0
Weld White 369 278 270 210 232 196
Hispanic 119 48 46 47 26 25
African‐American
10 8 10 10 9 4
Asian 1 0 2 1 2 1
Native American 1 0 0 0 0 0
Unknown 2 2 1 2 0 2
Total 502 336 329 270 269 228
Yuma White 2 0 0 0 0 0
Hispanic 0 3 0 0 0 0
Total 2 3 0 0 0 0
Total White 9,207 4,377 4,499 4,375 4,129 4,069
Hispanic 2,340 1,328 1,552 1,541 1,414 1,423
African‐American
957 547 712 655 539 467
Asian 105 59 52 85 91 124
Native American 73 23 53 40 43 25
Native Hawaiian/Pacific Islander
0 4 2 3 5 8
Unknown 27 21 32 29 29 37
Total 12,709 6,359 6,902 6,728 6,250 6,153
Source: Colorado Bureau of Investigation, National Incident‐Based Reporting System, analyzed by the
Division of Criminal Justice.
Note: Since county is determined based on the law enforcement agency’s location there are some
statewide agencies, such as the Colorado State Patrol, that cannot be assigned to a specific county.

185
Appendix C, Table 4. Marijuana arrests, by county and age group, 2012‐2017
County Age group 2012 2013 2014 2015 2016 2017
Unknown Under 18
55 28 45 54 51 40
18 to 20 272 177 192 158 132 126
21 or older
938 70 96 125 90 112
Total 1,265 275 333 337 273 278
Adams Under 18
586 489 492 475 420 437
18 to 20 517 270 249 198 188 201
21 or older
1,119 179 72 56 75 98
Total 2,222 938 813 729 683 736
Alamosa Under 18
0 0 0 2 1 4
18 to 20 0 5 10 17 13 17
21 or older
2 1 2 2 1 2
Total 2 6 12 21 15 23
Arapahoe Under 18
393 335 390 291 299 238
18 to 20 325 222 195 177 134 110
21 or older
748 143 228 235 254 233
Total 1,466 700 813 703 687 581
Archuleta Under 18
7 3 3 11 7 2
18 to 20 7 0 3 7 1 0
21 or older
3 0 0 1 3 2
Total 17 3 6 19 11 4
Baca Under 18
0 0 0 0 0 0
18 to 20 1 2 0 1 0 0
21 or older
16 5 1 0 2 0
Total 17 7 1 1 2 0
Bent Under 18
0 0 0 1 0 0
18 to 20 0 1 0 0 0 0
21 or older
0 0 0 0 0 0
Total 0 1 0 1 0 0
Boulder Under 18
121 87 116 120 119 106
18 to 20 365 281 191 240 282 517
21 or older
226 65 45 31 44 33
Total 712 433 352 391 445 656
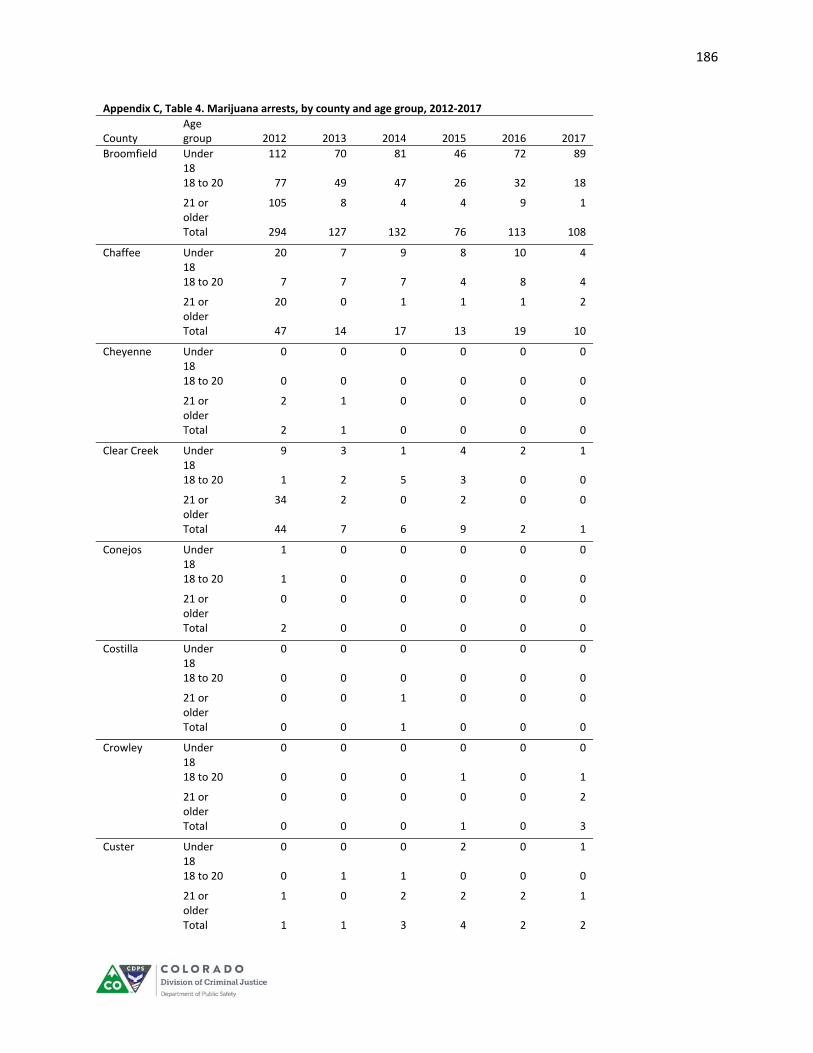
186
Appendix C, Table 4. Marijuana arrests, by county and age group, 2012‐2017
County Age group 2012 2013 2014 2015 2016 2017
Broomfield Under 18
112 70 81 46 72 89
18 to 20 77 49 47 26 32 18
21 or older
105 8 4 4 9 1
Total 294 127 132 76 113 108
Chaffee Under 18
20 7 9 8 10 4
18 to 20 7 7 7 4 8 4
21 or older
20 0 1 1 1 2
Total 47 14 17 13 19 10
Cheyenne Under 18
0 0 0 0 0 0
18 to 20 0 0 0 0 0 0
21 or older
2 1 0 0 0 0
Total 2 1 0 0 0 0
Clear Creek Under 18
9 3 1 4 2 1
18 to 20 1 2 5 3 0 0
21 or older
34 2 0 2 0 0
Total 44 7 6 9 2 1
Conejos Under 18
1 0 0 0 0 0
18 to 20 1 0 0 0 0 0
21 or older
0 0 0 0 0 0
Total 2 0 0 0 0 0
Costilla Under 18
0 0 0 0 0 0
18 to 20 0 0 0 0 0 0
21 or older
0 0 1 0 0 0
Total 0 0 1 0 0 0
Crowley Under 18
0 0 0 0 0 0
18 to 20 0 0 0 1 0 1
21 or older
0 0 0 0 0 2
Total 0 0 0 1 0 3
Custer Under 18
0 0 0 2 0 1
18 to 20 0 1 1 0 0 0
21 or older
1 0 2 2 2 1
Total 1 1 3 4 2 2
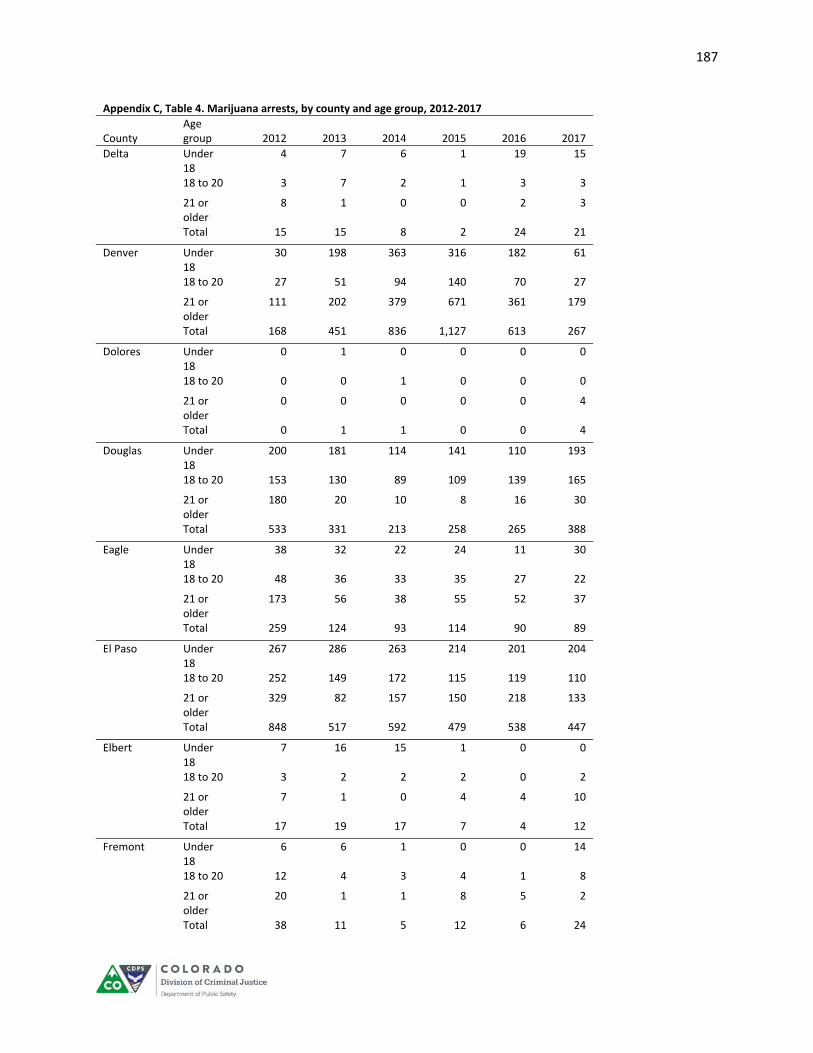
187
Appendix C, Table 4. Marijuana arrests, by county and age group, 2012‐2017
County Age group 2012 2013 2014 2015 2016 2017
Delta Under 18
4 7 6 1 19 15
18 to 20 3 7 2 1 3 3
21 or older
8 1 0 0 2 3
Total 15 15 8 2 24 21
Denver Under 18
30 198 363 316 182 61
18 to 20 27 51 94 140 70 27
21 or older
111 202 379 671 361 179
Total 168 451 836 1,127 613 267
Dolores Under 18
0 1 0 0 0 0
18 to 20 0 0 1 0 0 0
21 or older
0 0 0 0 0 4
Total 0 1 1 0 0 4
Douglas Under 18
200 181 114 141 110 193
18 to 20 153 130 89 109 139 165
21 or older
180 20 10 8 16 30
Total 533 331 213 258 265 388
Eagle Under 18
38 32 22 24 11 30
18 to 20 48 36 33 35 27 22
21 or older
173 56 38 55 52 37
Total 259 124 93 114 90 89
El Paso Under 18
267 286 263 214 201 204
18 to 20 252 149 172 115 119 110
21 or older
329 82 157 150 218 133
Total 848 517 592 479 538 447
Elbert Under 18
7 16 15 1 0 0
18 to 20 3 2 2 2 0 2
21 or older
7 1 0 4 4 10
Total 17 19 17 7 4 12
Fremont Under 18
6 6 1 0 0 14
18 to 20 12 4 3 4 1 8
21 or older
20 1 1 8 5 2
Total 38 11 5 12 6 24
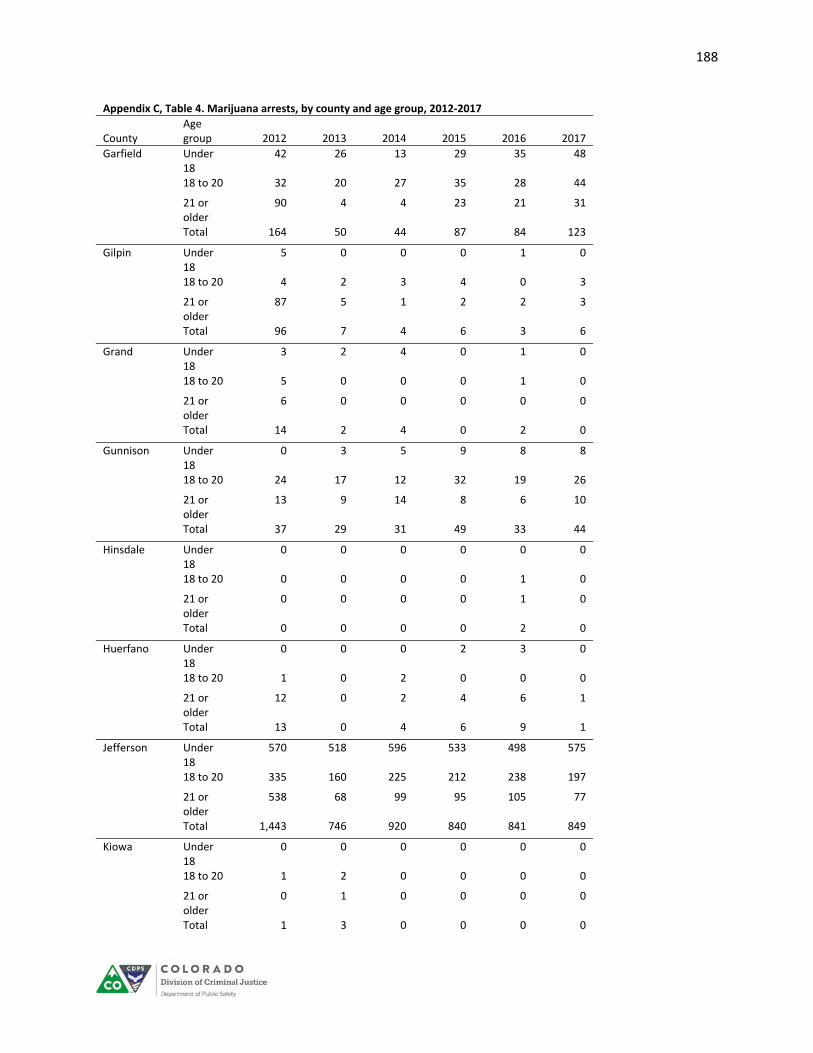
188
Appendix C, Table 4. Marijuana arrests, by county and age group, 2012‐2017
County Age group 2012 2013 2014 2015 2016 2017
Garfield Under 18
42 26 13 29 35 48
18 to 20 32 20 27 35 28 44
21 or older
90 4 4 23 21 31
Total 164 50 44 87 84 123
Gilpin Under 18
5 0 0 0 1 0
18 to 20 4 2 3 4 0 3
21 or older
87 5 1 2 2 3
Total 96 7 4 6 3 6
Grand Under 18
3 2 4 0 1 0
18 to 20 5 0 0 0 1 0
21 or older
6 0 0 0 0 0
Total 14 2 4 0 2 0
Gunnison Under 18
0 3 5 9 8 8
18 to 20 24 17 12 32 19 26
21 or older
13 9 14 8 6 10
Total 37 29 31 49 33 44
Hinsdale Under 18
0 0 0 0 0 0
18 to 20 0 0 0 0 1 0
21 or older
0 0 0 0 1 0
Total 0 0 0 0 2 0
Huerfano Under 18
0 0 0 2 3 0
18 to 20 1 0 2 0 0 0
21 or older
12 0 2 4 6 1
Total 13 0 4 6 9 1
Jefferson Under 18
570 518 596 533 498 575
18 to 20 335 160 225 212 238 197
21 or older
538 68 99 95 105 77
Total 1,443 746 920 840 841 849
Kiowa Under 18
0 0 0 0 0 0
18 to 20 1 2 0 0 0 0
21 or older
0 1 0 0 0 0
Total 1 3 0 0 0 0
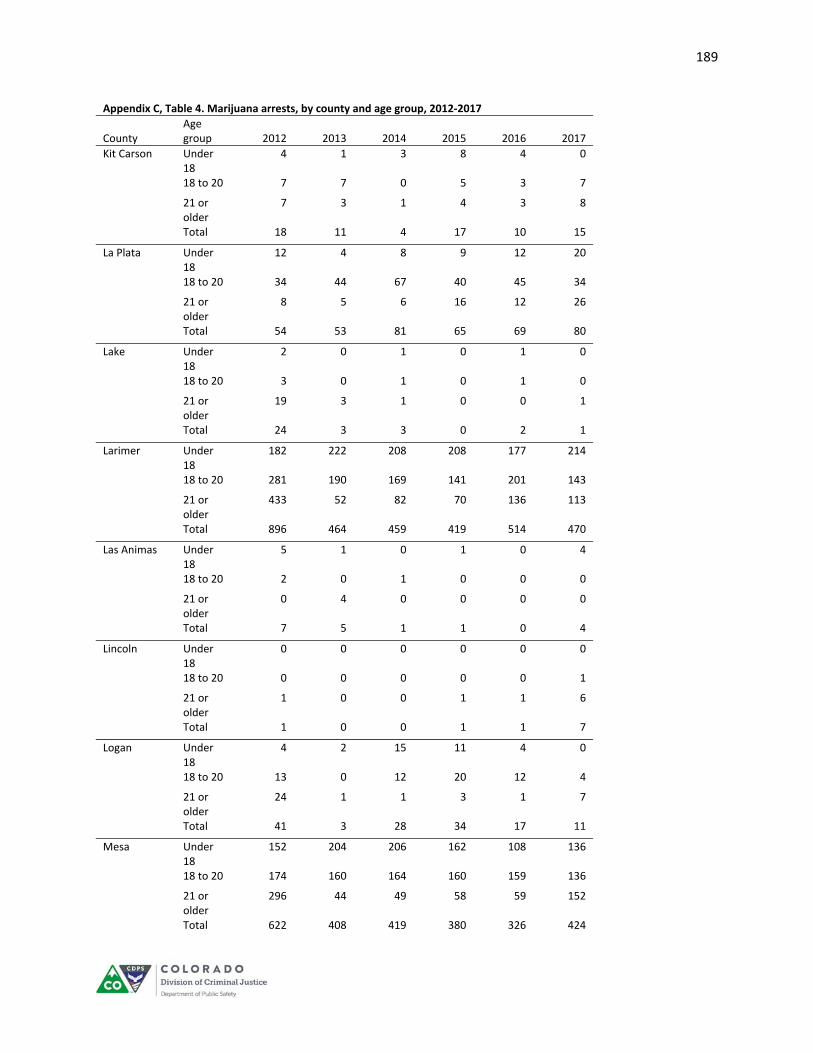
189
Appendix C, Table 4. Marijuana arrests, by county and age group, 2012‐2017
County Age group 2012 2013 2014 2015 2016 2017
Kit Carson Under 18
4 1 3 8 4 0
18 to 20 7 7 0 5 3 7
21 or older
7 3 1 4 3 8
Total 18 11 4 17 10 15
La Plata Under 18
12 4 8 9 12 20
18 to 20 34 44 67 40 45 34
21 or older
8 5 6 16 12 26
Total 54 53 81 65 69 80
Lake Under 18
2 0 1 0 1 0
18 to 20 3 0 1 0 1 0
21 or older
19 3 1 0 0 1
Total 24 3 3 0 2 1
Larimer Under 18
182 222 208 208 177 214
18 to 20 281 190 169 141 201 143
21 or older
433 52 82 70 136 113
Total 896 464 459 419 514 470
Las Animas Under 18
5 1 0 1 0 4
18 to 20 2 0 1 0 0 0
21 or older
0 4 0 0 0 0
Total 7 5 1 1 0 4
Lincoln Under 18
0 0 0 0 0 0
18 to 20 0 0 0 0 0 1
21 or older
1 0 0 1 1 6
Total 1 0 0 1 1 7
Logan Under 18
4 2 15 11 4 0
18 to 20 13 0 12 20 12 4
21 or older
24 1 1 3 1 7
Total 41 3 28 34 17 11
Mesa Under 18
152 204 206 162 108 136
18 to 20 174 160 164 160 159 136
21 or older
296 44 49 58 59 152
Total 622 408 419 380 326 424
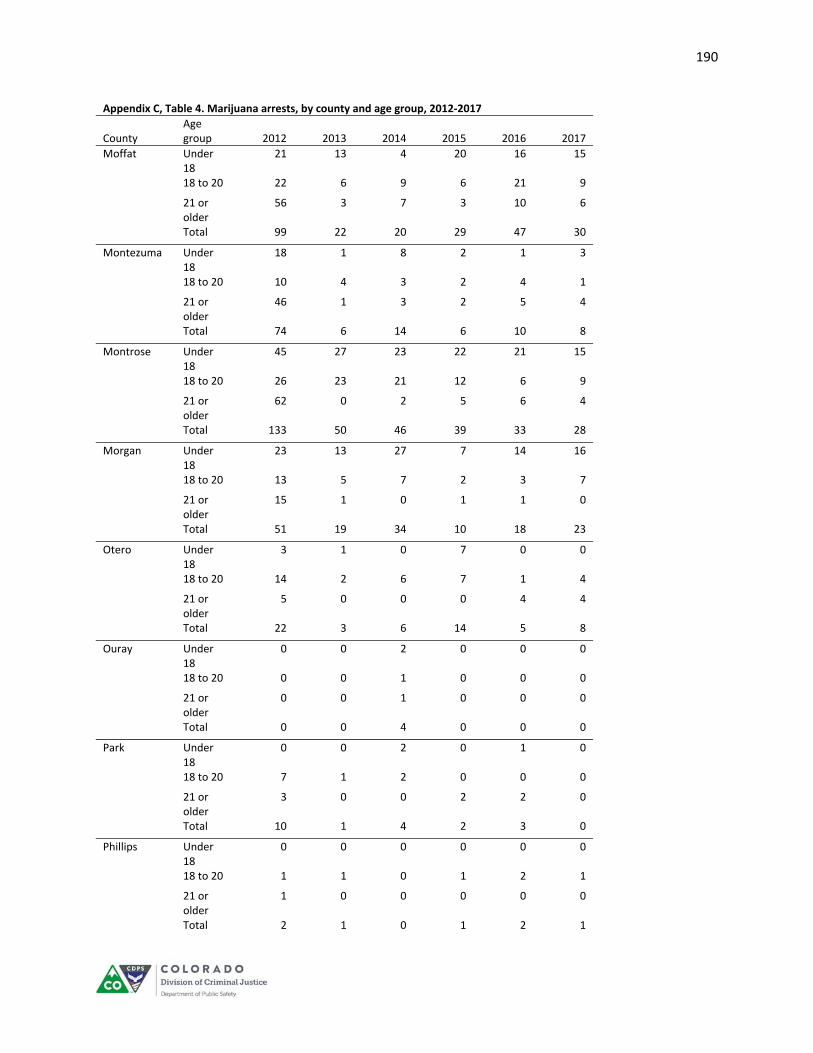
190
Appendix C, Table 4. Marijuana arrests, by county and age group, 2012‐2017
County Age group 2012 2013 2014 2015 2016 2017
Moffat Under 18
21 13 4 20 16 15
18 to 20 22 6 9 6 21 9
21 or older
56 3 7 3 10 6
Total 99 22 20 29 47 30
Montezuma Under 18
18 1 8 2 1 3
18 to 20 10 4 3 2 4 1
21 or older
46 1 3 2 5 4
Total 74 6 14 6 10 8
Montrose Under 18
45 27 23 22 21 15
18 to 20 26 23 21 12 6 9
21 or older
62 0 2 5 6 4
Total 133 50 46 39 33 28
Morgan Under 18
23 13 27 7 14 16
18 to 20 13 5 7 2 3 7
21 or older
15 1 0 1 1 0
Total 51 19 34 10 18 23
Otero Under 18
3 1 0 7 0 0
18 to 20 14 2 6 7 1 4
21 or older
5 0 0 0 4 4
Total 22 3 6 14 5 8
Ouray Under 18
0 0 2 0 0 0
18 to 20 0 0 1 0 0 0
21 or older
0 0 1 0 0 0
Total 0 0 4 0 0 0
Park Under 18
0 0 2 0 1 0
18 to 20 7 1 2 0 0 0
21 or older
3 0 0 2 2 0
Total 10 1 4 2 3 0
Phillips Under 18
0 0 0 0 0 0
18 to 20 1 1 0 1 2 1
21 or older
1 0 0 0 0 0
Total 2 1 0 1 2 1

191
Appendix C, Table 4. Marijuana arrests, by county and age group, 2012‐2017
County Age group 2012 2013 2014 2015 2016 2017
Pitkin Under 18
2 0 4 6 3 3
18 to 20 0 0 5 1 1 0
21 or older
5 0 1 0 0 0
Total 7 0 10 7 4 3
Prowers Under 18
18 11 18 1 1 2
18 to 20 20 12 16 2 1 0
21 or older
52 9 4 0 5 0
Total 90 32 38 3 7 2
Pueblo Under 18
1 1 4 3 4 11
18 to 20 2 17 14 10 4 18
21 or older
20 2 5 8 35 8
Total 23 20 23 21 43 37
Rio Blanco Under 18
2 0 4 3 0 0
18 to 20 7 4 13 7 3 2
21 or older
17 0 1 1 0 0
Total 26 4 18 11 3 2
Rio Grande Under 18
11 0 1 9 4 7
18 to 20 6 0 1 1 1 1
21 or older
11 4 0 1 1 0
Total 28 4 2 11 6 8
Routt Under 18
18 9 19 11 27 9
18 to 20 34 23 34 25 12 34
21 or older
38 4 7 9 8 2
Total 90 36 60 45 47 45
Saguache Under 18
4 0 1 1 0 3
18 to 20 6 0 1 1 0 0
21 or older
1 0 0 0 0 7
Total 11 0 2 2 0 10
San Juan Under 18
0 0 0 0 0 0
18 to 20 0 0 0 0 0 0
21 or older
0 1 0 0 0 0
Total 0 1 0 0 0 0

192
Appendix C, Table 4. Marijuana arrests, by county and age group, 2012‐2017
County Age group 2012 2013 2014 2015 2016 2017
Sedgwick Under 18
0 3 0 0 0 0
18 to 20 0 0 1 0 0 0
21 or older
1 0 0 0 0 0
Total 1 3 1 0 0 0
Summit Under 18
9 2 1 5 2 1
18 to 20 13 1 1 9 5 3
21 or older
41 2 3 8 12 2
Total 63 5 5 22 19 6
Teller Under 18
12 27 12 11 9 11
18 to 20 13 13 10 8 12 9
21 or older
30 5 7 6 6 5
Total 55 45 29 25 27 25
Washington Under 18
0 1 1 0 2 0
18 to 20 4 1 0 1 0 0
21 or older
16 0 0 0 0 0
Total 20 2 1 1 2 0
Weld Under 18
144 186 214 165 154 115
18 to 20 122 130 97 82 93 75
21 or older
236 20 18 23 22 38
Total 502 336 329 270 269 228
Yuma Under 18
0 3 0 0 0 0
18 to 20 0 0 0 0 0 0
21 or older
2 0 0 0 0 0
Total 2 3 0 0 0 0
Total Under 18
3,168 3,030 3,325 2,956 2,615 2,655
18 to 20 3,307 2,241 2,221 2,064 2,026 2,099
21 or older
6,234 1,088 1,356 1,708 1,609 1,399
Total 12,709 6,359 6,902 6,728 6,250 6,153
Source: Colorado Bureau of Investigation, National Incident‐Based Reporting System, analyzed by
the Division of Criminal Justice.
Note: Since county is determined based on the law enforcement agency’s location there are some
statewide agencies, such as the Colorado State Patrol, that cannot be assigned to a specific county.
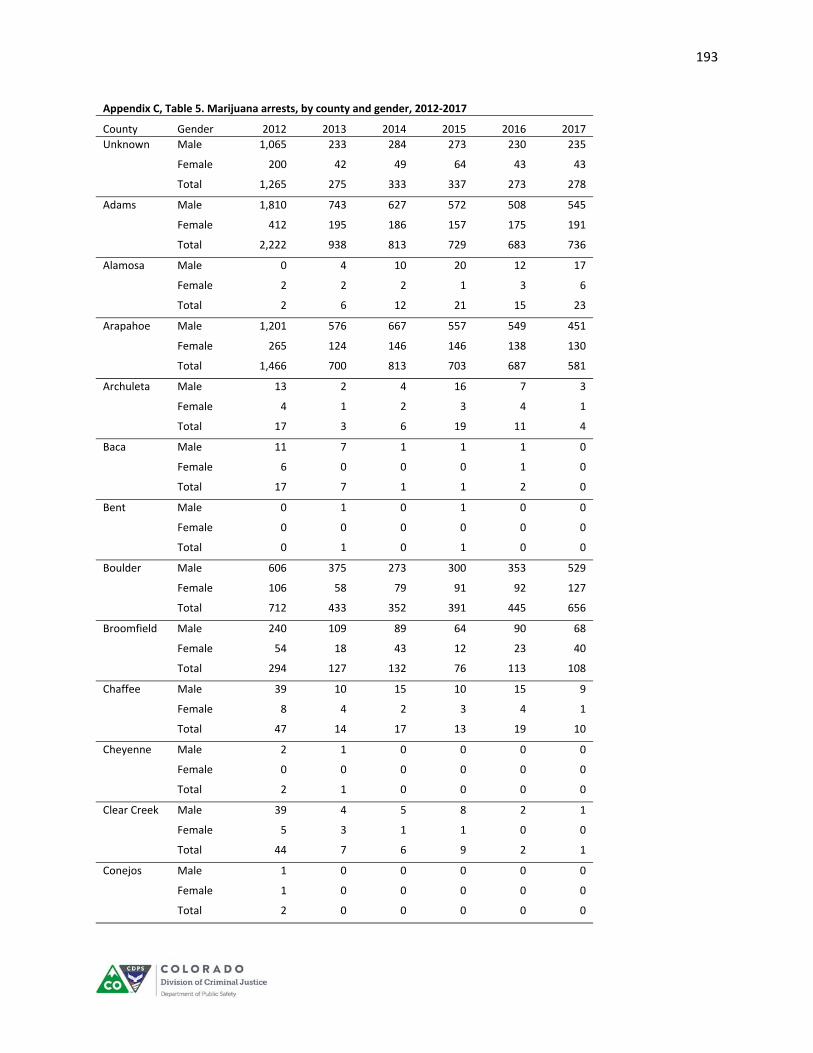
193
Appendix C, Table 5. Marijuana arrests, by county and gender, 2012‐2017
County Gender 2012 2013 2014 2015 2016 2017
Unknown Male 1,065 233 284 273 230 235
Female 200 42 49 64 43 43
Total 1,265 275 333 337 273 278
Adams Male 1,810 743 627 572 508 545
Female 412 195 186 157 175 191
Total 2,222 938 813 729 683 736
Alamosa Male 0 4 10 20 12 17
Female 2 2 2 1 3 6
Total 2 6 12 21 15 23
Arapahoe Male 1,201 576 667 557 549 451
Female 265 124 146 146 138 130
Total 1,466 700 813 703 687 581
Archuleta Male 13 2 4 16 7 3
Female 4 1 2 3 4 1
Total 17 3 6 19 11 4
Baca Male 11 7 1 1 1 0
Female 6 0 0 0 1 0
Total 17 7 1 1 2 0
Bent Male 0 1 0 1 0 0
Female 0 0 0 0 0 0
Total 0 1 0 1 0 0
Boulder Male 606 375 273 300 353 529
Female 106 58 79 91 92 127
Total 712 433 352 391 445 656
Broomfield Male 240 109 89 64 90 68
Female 54 18 43 12 23 40
Total 294 127 132 76 113 108
Chaffee Male 39 10 15 10 15 9
Female 8 4 2 3 4 1
Total 47 14 17 13 19 10
Cheyenne Male 2 1 0 0 0 0
Female 0 0 0 0 0 0
Total 2 1 0 0 0 0
Clear Creek Male 39 4 5 8 2 1
Female 5 3 1 1 0 0
Total 44 7 6 9 2 1
Conejos Male 1 0 0 0 0 0
Female 1 0 0 0 0 0
Total 2 0 0 0 0 0
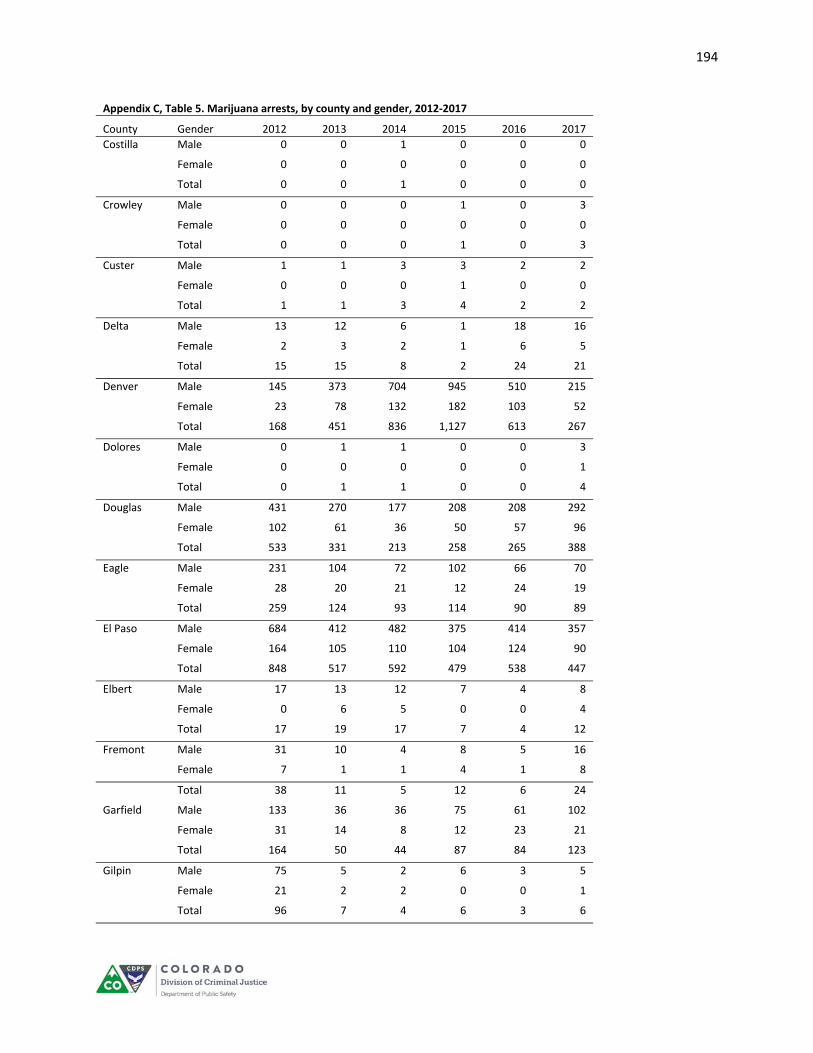
194
Appendix C, Table 5. Marijuana arrests, by county and gender, 2012‐2017
County Gender 2012 2013 2014 2015 2016 2017
Costilla Male 0 0 1 0 0 0
Female 0 0 0 0 0 0
Total 0 0 1 0 0 0
Crowley Male 0 0 0 1 0 3
Female 0 0 0 0 0 0
Total 0 0 0 1 0 3
Custer Male 1 1 3 3 2 2
Female 0 0 0 1 0 0
Total 1 1 3 4 2 2
Delta Male 13 12 6 1 18 16
Female 2 3 2 1 6 5
Total 15 15 8 2 24 21
Denver Male 145 373 704 945 510 215
Female 23 78 132 182 103 52
Total 168 451 836 1,127 613 267
Dolores Male 0 1 1 0 0 3
Female 0 0 0 0 0 1
Total 0 1 1 0 0 4
Douglas Male 431 270 177 208 208 292
Female 102 61 36 50 57 96
Total 533 331 213 258 265 388
Eagle Male 231 104 72 102 66 70
Female 28 20 21 12 24 19
Total 259 124 93 114 90 89
El Paso Male 684 412 482 375 414 357
Female 164 105 110 104 124 90
Total 848 517 592 479 538 447
Elbert Male 17 13 12 7 4 8
Female 0 6 5 0 0 4
Total 17 19 17 7 4 12
Fremont Male 31 10 4 8 5 16
Female 7 1 1 4 1 8
Total 38 11 5 12 6 24
Garfield Male 133 36 36 75 61 102
Female 31 14 8 12 23 21
Total 164 50 44 87 84 123
Gilpin Male 75 5 2 6 3 5
Female 21 2 2 0 0 1
Total 96 7 4 6 3 6
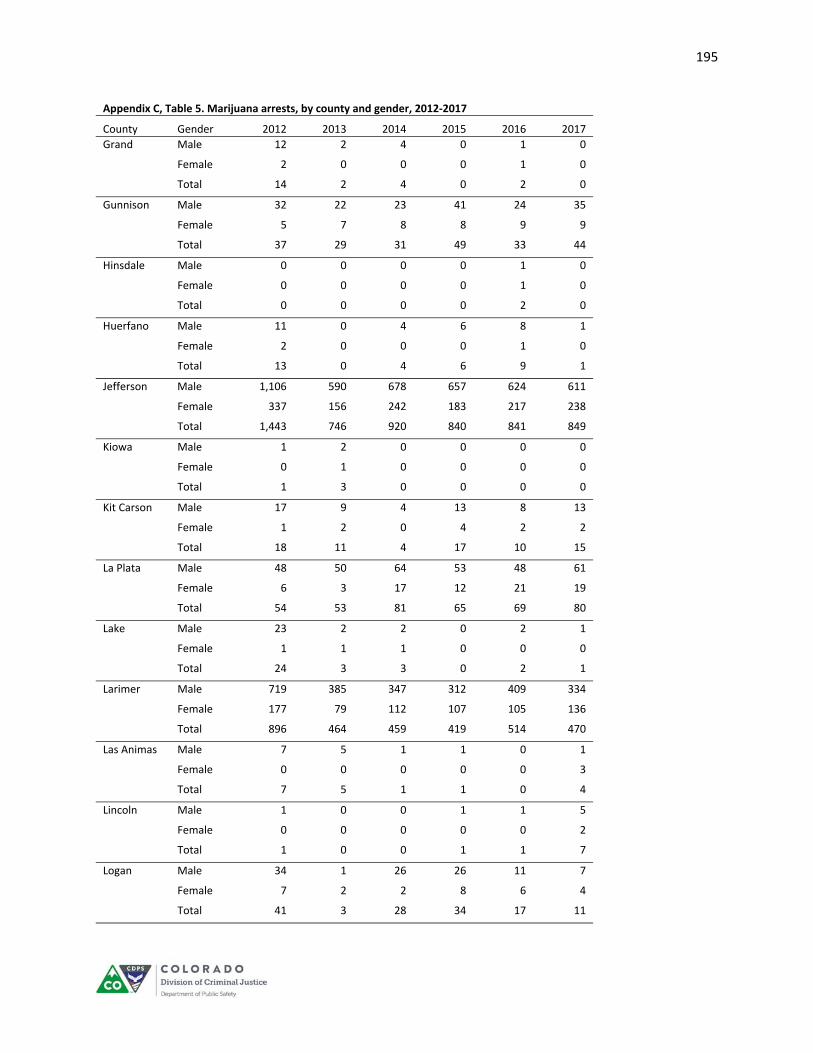
195
Appendix C, Table 5. Marijuana arrests, by county and gender, 2012‐2017
County Gender 2012 2013 2014 2015 2016 2017
Grand Male 12 2 4 0 1 0
Female 2 0 0 0 1 0
Total 14 2 4 0 2 0
Gunnison Male 32 22 23 41 24 35
Female 5 7 8 8 9 9
Total 37 29 31 49 33 44
Hinsdale Male 0 0 0 0 1 0
Female 0 0 0 0 1 0
Total 0 0 0 0 2 0
Huerfano Male 11 0 4 6 8 1
Female 2 0 0 0 1 0
Total 13 0 4 6 9 1
Jefferson Male 1,106 590 678 657 624 611
Female 337 156 242 183 217 238
Total 1,443 746 920 840 841 849
Kiowa Male 1 2 0 0 0 0
Female 0 1 0 0 0 0
Total 1 3 0 0 0 0
Kit Carson Male 17 9 4 13 8 13
Female 1 2 0 4 2 2
Total 18 11 4 17 10 15
La Plata Male 48 50 64 53 48 61
Female 6 3 17 12 21 19
Total 54 53 81 65 69 80
Lake Male 23 2 2 0 2 1
Female 1 1 1 0 0 0
Total 24 3 3 0 2 1
Larimer Male 719 385 347 312 409 334
Female 177 79 112 107 105 136
Total 896 464 459 419 514 470
Las Animas Male 7 5 1 1 0 1
Female 0 0 0 0 0 3
Total 7 5 1 1 0 4
Lincoln Male 1 0 0 1 1 5
Female 0 0 0 0 0 2
Total 1 0 0 1 1 7
Logan Male 34 1 26 26 11 7
Female 7 2 2 8 6 4
Total 41 3 28 34 17 11
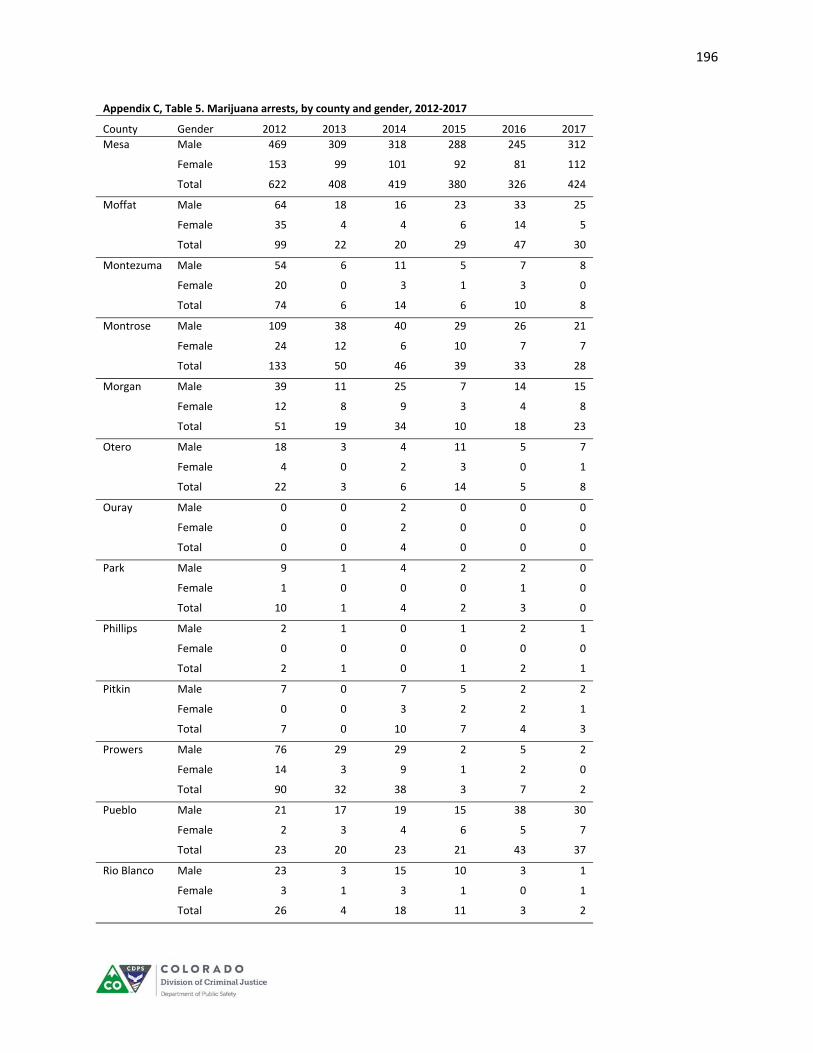
196
Appendix C, Table 5. Marijuana arrests, by county and gender, 2012‐2017
County Gender 2012 2013 2014 2015 2016 2017
Mesa Male 469 309 318 288 245 312
Female 153 99 101 92 81 112
Total 622 408 419 380 326 424
Moffat Male 64 18 16 23 33 25
Female 35 4 4 6 14 5
Total 99 22 20 29 47 30
Montezuma Male 54 6 11 5 7 8
Female 20 0 3 1 3 0
Total 74 6 14 6 10 8
Montrose Male 109 38 40 29 26 21
Female 24 12 6 10 7 7
Total 133 50 46 39 33 28
Morgan Male 39 11 25 7 14 15
Female 12 8 9 3 4 8
Total 51 19 34 10 18 23
Otero Male 18 3 4 11 5 7
Female 4 0 2 3 0 1
Total 22 3 6 14 5 8
Ouray Male 0 0 2 0 0 0
Female 0 0 2 0 0 0
Total 0 0 4 0 0 0
Park Male 9 1 4 2 2 0
Female 1 0 0 0 1 0
Total 10 1 4 2 3 0
Phillips Male 2 1 0 1 2 1
Female 0 0 0 0 0 0
Total 2 1 0 1 2 1
Pitkin Male 7 0 7 5 2 2
Female 0 0 3 2 2 1
Total 7 0 10 7 4 3
Prowers Male 76 29 29 2 5 2
Female 14 3 9 1 2 0
Total 90 32 38 3 7 2
Pueblo Male 21 17 19 15 38 30
Female 2 3 4 6 5 7
Total 23 20 23 21 43 37
Rio Blanco Male 23 3 15 10 3 1
Female 3 1 3 1 0 1
Total 26 4 18 11 3 2
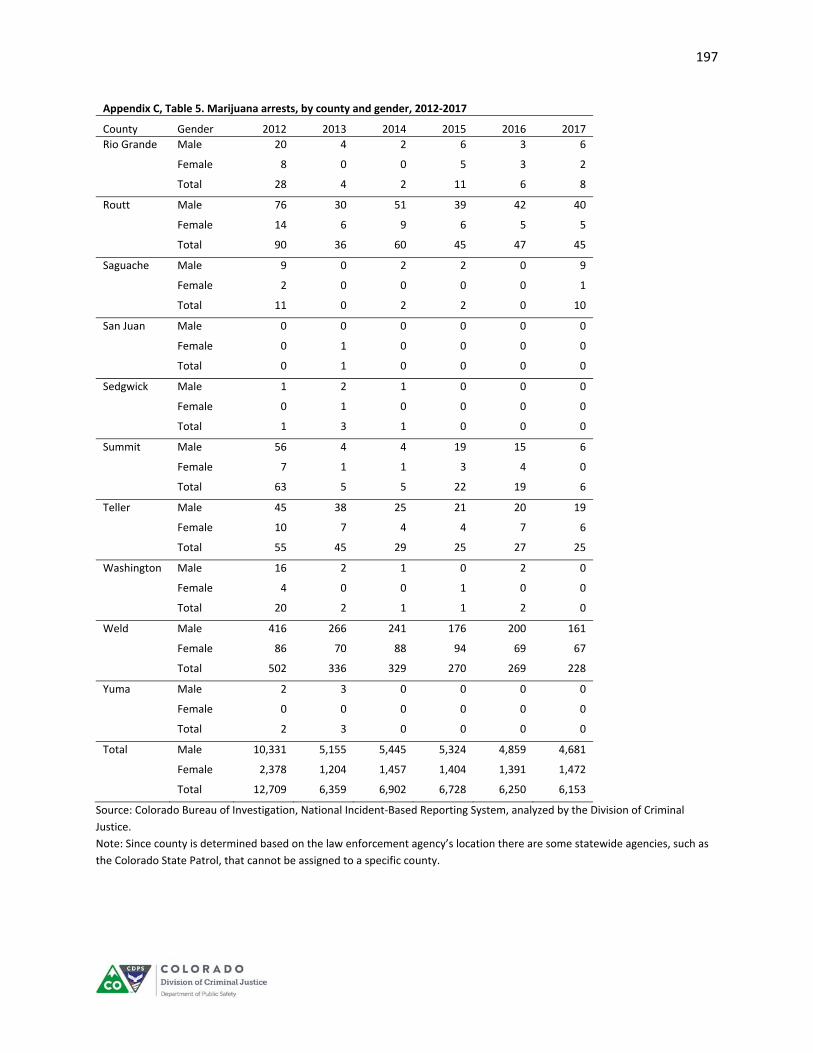
197
Appendix C, Table 5. Marijuana arrests, by county and gender, 2012‐2017
County Gender 2012 2013 2014 2015 2016 2017
Rio Grande Male 20 4 2 6 3 6
Female 8 0 0 5 3 2
Total 28 4 2 11 6 8
Routt Male 76 30 51 39 42 40
Female 14 6 9 6 5 5
Total 90 36 60 45 47 45
Saguache Male 9 0 2 2 0 9
Female 2 0 0 0 0 1
Total 11 0 2 2 0 10
San Juan Male 0 0 0 0 0 0
Female 0 1 0 0 0 0
Total 0 1 0 0 0 0
Sedgwick Male 1 2 1 0 0 0
Female 0 1 0 0 0 0
Total 1 3 1 0 0 0
Summit Male 56 4 4 19 15 6
Female 7 1 1 3 4 0
Total 63 5 5 22 19 6
Teller Male 45 38 25 21 20 19
Female 10 7 4 4 7 6
Total 55 45 29 25 27 25
Washington Male 16 2 1 0 2 0
Female 4 0 0 1 0 0
Total 20 2 1 1 2 0
Weld Male 416 266 241 176 200 161
Female 86 70 88 94 69 67
Total 502 336 329 270 269 228
Yuma Male 2 3 0 0 0 0
Female 0 0 0 0 0 0
Total 2 3 0 0 0 0
Total Male 10,331 5,155 5,445 5,324 4,859 4,681
Female 2,378 1,204 1,457 1,404 1,391 1,472
Total 12,709 6,359 6,902 6,728 6,250 6,153
Source: Colorado Bureau of Investigation, National Incident‐Based Reporting System, analyzed by the Division of Criminal
Justice.
Note: Since county is determined based on the law enforcement agency’s location there are some statewide agencies, such as
the Colorado State Patrol, that cannot be assigned to a specific county.

198
Appendix C, Table 6. Marijuana arrests, by county and arrest type, 2012‐2017
County Arrest type 2012 2013 2014 2015 2016 2017
Unknown On‐View Arrest 724 194 165 197 129 181
Taken Into Custody 31 14 27 21 36 20
Summoned/Cited 510 67 141 119 108 77
Total 1,265 275 333 337 273 278
Adams On‐View Arrest 688 202 152 155 135 117
Taken Into Custody 146 60 70 52 59 82
Summoned/Cited 1,388 676 591 522 489 537
Total 2,222 938 813 729 683 736
Alamosa On‐View Arrest 0 0 0 0 0 4
Taken Into Custody 0 0 0 0 1 0
Summoned/Cited 2 6 12 21 14 19
Total 2 6 12 21 15 23
Arapahoe On‐View Arrest 321 128 114 116 403 366
Taken Into Custody 77 37 43 39 53 22
Summoned/Cited 1,068 535 656 548 231 193
Total 1,466 700 813 703 687 581
Archuleta On‐View Arrest 1 0 0 0 0 0
Taken Into Custody 0 0 0 0 4 2
Summoned/Cited 16 3 6 19 7 2
Total 17 3 6 19 11 4
Baca On‐View Arrest 3 0 0 1 0 0
Taken Into Custody 1 7 1 0 2 0
Summoned/Cited 13 0 0 0 0 0
Total 17 7 1 1 2 0
Bent Summoned/Cited 0 1 0 1 0 0
Total 0 1 0 1 0 0
Boulder On‐View Arrest 101 41 40 28 46 31
Taken Into Custody 22 7 20 11 12 21
Summoned/Cited 589 385 292 352 387 604
Total 712 433 352 391 445 656
Broomfield On‐View Arrest 65 15 6 8 14 3
Taken Into Custody 3 2 2 1 1 0
Summoned/Cited 226 110 124 67 98 105
Total 294 127 132 76 113 108
Chaffee On‐View Arrest 10 2 2 0 2 0
Taken Into Custody 11 2 0 1 4 0
Summoned/Cited 26 10 15 12 13 10
Total 47 14 17 13 19 10
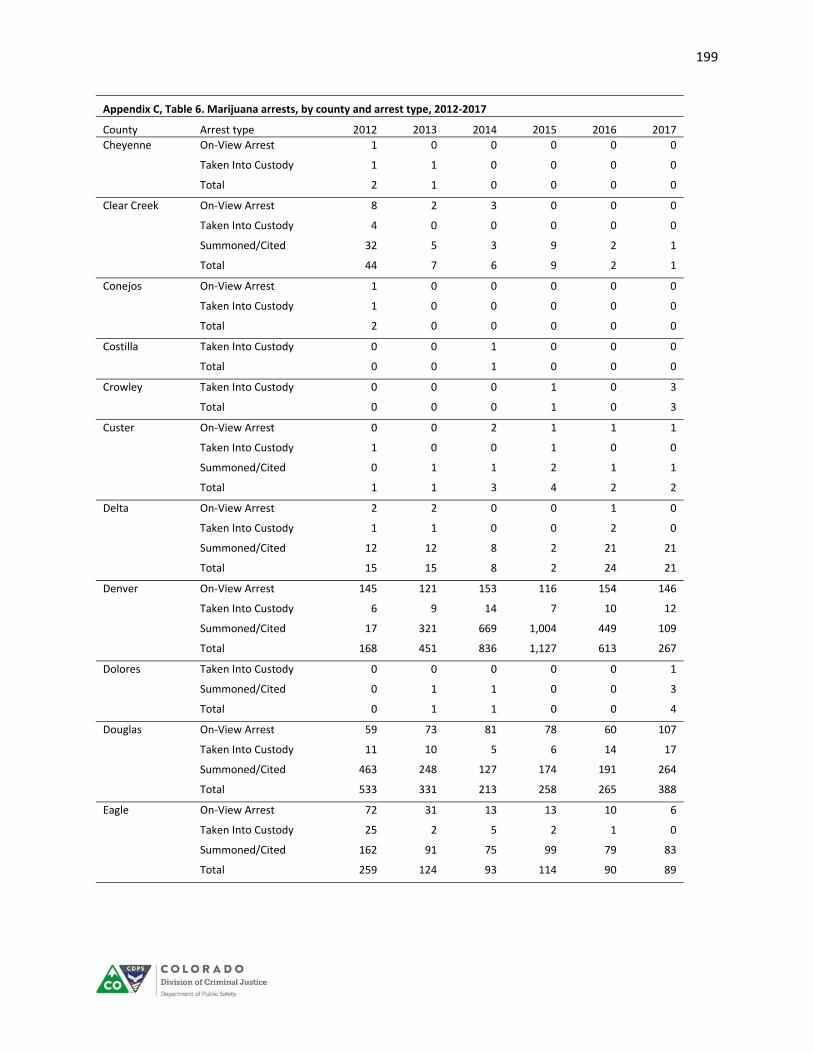
199
Appendix C, Table 6. Marijuana arrests, by county and arrest type, 2012‐2017
County Arrest type 2012 2013 2014 2015 2016 2017
Cheyenne On‐View Arrest 1 0 0 0 0 0
Taken Into Custody 1 1 0 0 0 0
Total 2 1 0 0 0 0
Clear Creek On‐View Arrest 8 2 3 0 0 0
Taken Into Custody 4 0 0 0 0 0
Summoned/Cited 32 5 3 9 2 1
Total 44 7 6 9 2 1
Conejos On‐View Arrest 1 0 0 0 0 0
Taken Into Custody 1 0 0 0 0 0
Total 2 0 0 0 0 0
Costilla Taken Into Custody 0 0 1 0 0 0
Total 0 0 1 0 0 0
Crowley Taken Into Custody 0 0 0 1 0 3
Total 0 0 0 1 0 3
Custer On‐View Arrest 0 0 2 1 1 1
Taken Into Custody 1 0 0 1 0 0
Summoned/Cited 0 1 1 2 1 1
Total 1 1 3 4 2 2
Delta On‐View Arrest 2 2 0 0 1 0
Taken Into Custody 1 1 0 0 2 0
Summoned/Cited 12 12 8 2 21 21
Total 15 15 8 2 24 21
Denver On‐View Arrest 145 121 153 116 154 146
Taken Into Custody 6 9 14 7 10 12
Summoned/Cited 17 321 669 1,004 449 109
Total 168 451 836 1,127 613 267
Dolores Taken Into Custody 0 0 0 0 0 1
Summoned/Cited 0 1 1 0 0 3
Total 0 1 1 0 0 4
Douglas On‐View Arrest 59 73 81 78 60 107
Taken Into Custody 11 10 5 6 14 17
Summoned/Cited 463 248 127 174 191 264
Total 533 331 213 258 265 388
Eagle On‐View Arrest 72 31 13 13 10 6
Taken Into Custody 25 2 5 2 1 0
Summoned/Cited 162 91 75 99 79 83
Total 259 124 93 114 90 89
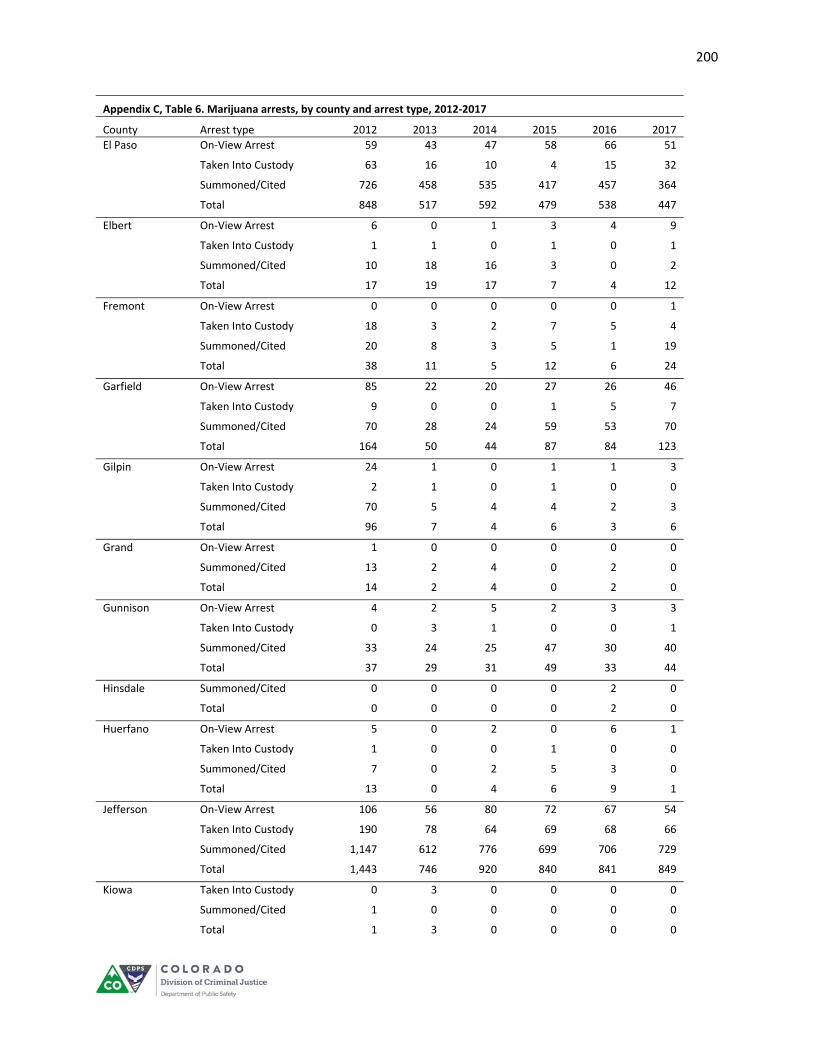
200
Appendix C, Table 6. Marijuana arrests, by county and arrest type, 2012‐2017
County Arrest type 2012 2013 2014 2015 2016 2017
El Paso On‐View Arrest 59 43 47 58 66 51
Taken Into Custody 63 16 10 4 15 32
Summoned/Cited 726 458 535 417 457 364
Total 848 517 592 479 538 447
Elbert On‐View Arrest 6 0 1 3 4 9
Taken Into Custody 1 1 0 1 0 1
Summoned/Cited 10 18 16 3 0 2
Total 17 19 17 7 4 12
Fremont On‐View Arrest 0 0 0 0 0 1
Taken Into Custody 18 3 2 7 5 4
Summoned/Cited 20 8 3 5 1 19
Total 38 11 5 12 6 24
Garfield On‐View Arrest 85 22 20 27 26 46
Taken Into Custody 9 0 0 1 5 7
Summoned/Cited 70 28 24 59 53 70
Total 164 50 44 87 84 123
Gilpin On‐View Arrest 24 1 0 1 1 3
Taken Into Custody 2 1 0 1 0 0
Summoned/Cited 70 5 4 4 2 3
Total 96 7 4 6 3 6
Grand On‐View Arrest 1 0 0 0 0 0
Summoned/Cited 13 2 4 0 2 0
Total 14 2 4 0 2 0
Gunnison On‐View Arrest 4 2 5 2 3 3
Taken Into Custody 0 3 1 0 0 1
Summoned/Cited 33 24 25 47 30 40
Total 37 29 31 49 33 44
Hinsdale Summoned/Cited 0 0 0 0 2 0
Total 0 0 0 0 2 0
Huerfano On‐View Arrest 5 0 2 0 6 1
Taken Into Custody 1 0 0 1 0 0
Summoned/Cited 7 0 2 5 3 0
Total 13 0 4 6 9 1
Jefferson On‐View Arrest 106 56 80 72 67 54
Taken Into Custody 190 78 64 69 68 66
Summoned/Cited 1,147 612 776 699 706 729
Total 1,443 746 920 840 841 849
Kiowa Taken Into Custody 0 3 0 0 0 0
Summoned/Cited 1 0 0 0 0 0
Total 1 3 0 0 0 0

201
Appendix C, Table 6. Marijuana arrests, by county and arrest type, 2012‐2017
County Arrest type 2012 2013 2014 2015 2016 2017
Kit Carson On‐View Arrest 1 6 1 2 4 9
Taken Into Custody 3 3 0 3 4 4
Summoned/Cited 14 2 3 12 2 2
Total 18 11 4 17 10 15
La Plata On‐View Arrest 2 0 0 1 5 2
Taken Into Custody 2 4 4 2 1 1
Summoned/Cited 50 49 77 62 63 77
Total 54 53 81 65 69 80
Lake On‐View Arrest 1 0 0 0 0 1
Taken Into Custody 9 1 0 0 0 0
Summoned/Cited 14 2 3 0 2 0
Total 24 3 3 0 2 1
Larimer On‐View Arrest 145 48 62 40 43 40
Taken Into Custody 16 3 4 11 13 2
Summoned/Cited 735 413 393 368 458 428
Total 896 464 459 419 514 470
Las Animas On‐View Arrest 0 1 0 0 0 0
Taken Into Custody 2 4 1 0 0 3
Summoned/Cited 5 0 0 1 0 1
Total 7 5 1 1 0 4
Lincoln On‐View Arrest 1 0 0 1 0 6
Taken Into Custody 0 0 0 0 1 0
Summoned/Cited 0 0 0 0 0 1
Total 1 0 0 1 1 7
Logan On‐View Arrest 25 1 5 3 3 4
Taken Into Custody 5 1 0 4 1 3
Summoned/Cited 11 1 23 27 13 4
Total 41 3 28 34 17 11
Mesa On‐View Arrest 100 70 71 74 40 79
Taken Into Custody 60 11 14 17 26 19
Summoned/Cited 462 327 334 289 260 326
Total 622 408 419 380 326 424
Moffat On‐View Arrest 47 7 8 7 14 12
Taken Into Custody 1 0 0 0 0 0
Summoned/Cited 51 15 12 22 33 18
Total 99 22 20 29 47 30
Montezuma On‐View Arrest 18 3 7 3 5 4
Taken Into Custody 1 0 0 0 0 0
Summoned/Cited 55 3 7 3 5 4
Total 74 6 14 6 10 8

202
Appendix C, Table 6. Marijuana arrests, by county and arrest type, 2012‐2017
County Arrest type 2012 2013 2014 2015 2016 2017
Montrose On‐View Arrest 13 6 2 2 2 2
Taken Into Custody 6 1 4 0 2 2
Summoned/Cited 114 43 40 37 29 24
Total 133 50 46 39 33 28
Morgan On‐View Arrest 7 1 1 0 0 0
Taken Into Custody 2 0 0 2 1 0
Summoned/Cited 42 18 33 8 17 23
Total 51 19 34 10 18 23
Otero On‐View Arrest 0 0 0 1 0 1
Taken Into Custody 3 0 1 0 2 1
Summoned/Cited 19 3 5 13 3 6
Total 22 3 6 14 5 8
Ouray Summoned/Cited 0 0 4 0 0 0
Total 0 0 4 0 0 0
Park On‐View Arrest 6 0 0 2 3 0
Summoned/Cited 4 1 4 0 0 0
Total 10 1 4 2 3 0
Phillips On‐View Arrest 0 1 0 0 2 1
Taken Into Custody 1 0 0 0 0 0
Summoned/Cited 1 0 0 1 0 0
Total 2 1 0 1 2 1
Pitkin On‐View Arrest 5 0 2 1 0 0
Summoned/Cited 2 0 8 6 4 3
Total 7 0 10 7 4 3
Prowers On‐View Arrest 13 7 0 1 0 0
Taken Into Custody 8 4 6 0 6 0
Summoned/Cited 69 21 32 2 1 2
Total 90 32 38 3 7 2
Pueblo On‐View Arrest 21 3 2 1 2 1
Taken Into Custody 2 4 9 7 37 20
Summoned/Cited 0 13 12 13 4 16
Total 23 20 23 21 43 37
Rio Blanco On‐View Arrest 8 1 0 1 0 1
Taken Into Custody 2 1 1 1 3 1
Summoned/Cited 16 2 17 9 0 0
Total 26 4 18 11 3 2
Rio Grande On‐View Arrest 0 0 0 0 0 2
Taken Into Custody 0 3 0 1 0 0
Summoned/Cited 28 1 2 10 6 6
Total 28 4 2 11 6 8
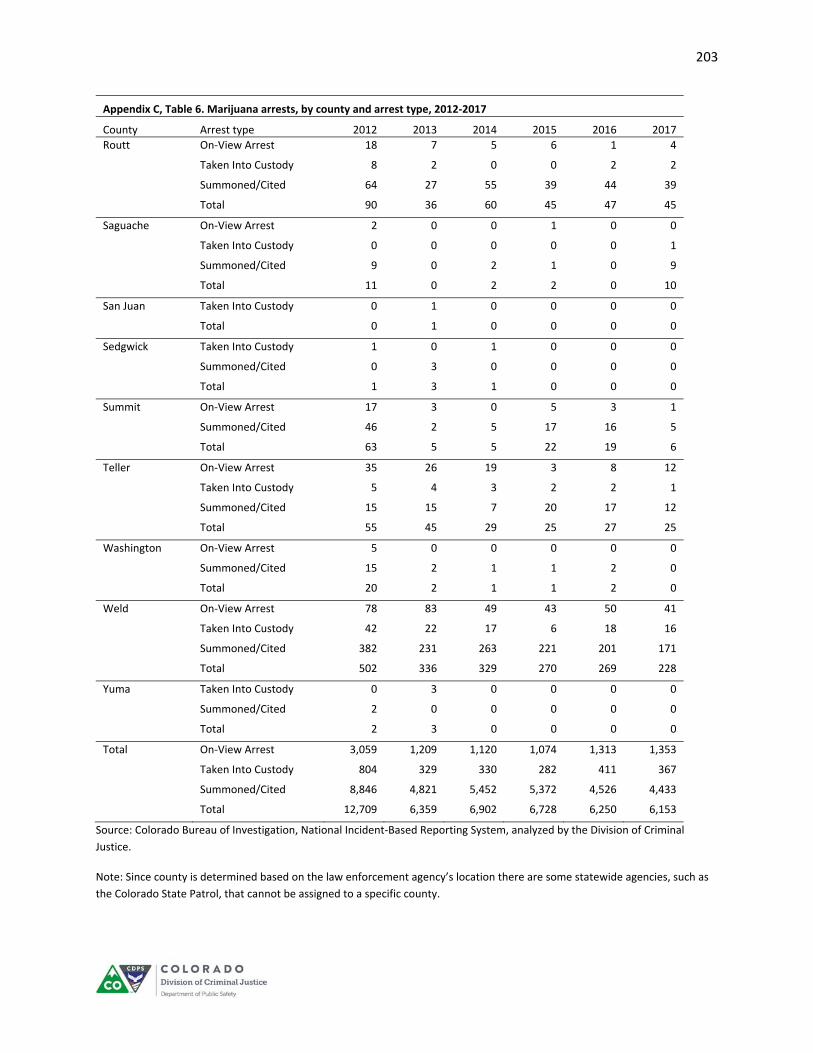
203
Appendix C, Table 6. Marijuana arrests, by county and arrest type, 2012‐2017
County Arrest type 2012 2013 2014 2015 2016 2017
Routt On‐View Arrest 18 7 5 6 1 4
Taken Into Custody 8 2 0 0 2 2
Summoned/Cited 64 27 55 39 44 39
Total 90 36 60 45 47 45
Saguache On‐View Arrest 2 0 0 1 0 0
Taken Into Custody 0 0 0 0 0 1
Summoned/Cited 9 0 2 1 0 9
Total 11 0 2 2 0 10
San Juan Taken Into Custody 0 1 0 0 0 0
Total 0 1 0 0 0 0
Sedgwick Taken Into Custody 1 0 1 0 0 0
Summoned/Cited 0 3 0 0 0 0
Total 1 3 1 0 0 0
Summit On‐View Arrest 17 3 0 5 3 1
Summoned/Cited 46 2 5 17 16 5
Total 63 5 5 22 19 6
Teller On‐View Arrest 35 26 19 3 8 12
Taken Into Custody 5 4 3 2 2 1
Summoned/Cited 15 15 7 20 17 12
Total 55 45 29 25 27 25
Washington On‐View Arrest 5 0 0 0 0 0
Summoned/Cited 15 2 1 1 2 0
Total 20 2 1 1 2 0
Weld On‐View Arrest 78 83 49 43 50 41
Taken Into Custody 42 22 17 6 18 16
Summoned/Cited 382 231 263 221 201 171
Total 502 336 329 270 269 228
Yuma Taken Into Custody 0 3 0 0 0 0
Summoned/Cited 2 0 0 0 0 0
Total 2 3 0 0 0 0
Total On‐View Arrest 3,059 1,209 1,120 1,074 1,313 1,353
Taken Into Custody 804 329 330 282 411 367
Summoned/Cited 8,846 4,821 5,452 5,372 4,526 4,433
Total 12,709 6,359 6,902 6,728 6,250 6,153
Source: Colorado Bureau of Investigation, National Incident‐Based Reporting System, analyzed by the Division of Criminal
Justice.
Note: Since county is determined based on the law enforcement agency’s location there are some statewide agencies, such as
the Colorado State Patrol, that cannot be assigned to a specific county.

204

205
Appendix C, Table 7. Marijuana possession arrests, by county and drug crime type, 2012‐2017 Marijuana‐Possession County 2012 2013 2014 2015 2016 2017
Unknown 1,140 237 288 298 245 238
Adams 2,071 862 717 643 604 614
Alamosa 2 6 9 21 4 12
Arapahoe 1,373 608 669 570 535 442
Archuleta 17 3 6 18 8 2
Baca 15 7 1 Bent 1 1 Boulder 664 378 301 341 403 608
Broomfield 290 121 130 73 107 108
Chaffee 45 14 17 9 18 8
Cheyenne 2 1 Clear Creek 40 7 6 9 2 1
Conejos 2 Crowley 1 2
Custer 1 1 1
Delta 15 12 8 2 22 15
Denver 58 371 750 1,051 496 115
Dolores 1 1 Douglas 524 274 210 256 255 371
Eagle 237 72 61 102 77 83
El Paso 673 426 486 445 493 403
Elbert 17 19 16 6 4 10
Fremont 31 11 4 3 1
Garfield 153 42 31 81 73 94
Gilpin 94 5 4 5 2 5
Grand 13 2 4 2
Gunnison 37 24 26 47 29 31
Hinsdale 2
Huerfano 13 2 5 3
Jefferson 1,310 650 832 772 799 803
Kiowa 1 3 Kit Carson 18 11 4 16 10 11
La Plata 54 53 81 40 54 41
Lake 23 2 1 1 1
Larimer 521 283 283 308 393 378
Las Animas 7 2 1 4
Lincoln 1 Logan 39 2 28 34 17 9
Mesa 573 324 347 286 246 256
Moffat 95 22 19 29 45 29
Montezuma 60 6 11 6 10 7
Montrose 131 49 45 37 31 28
Morgan 50 18 32 9 17 22
Otero 15 3 5 14 4 6
Ouray 4 Park 7 1 4 Phillips 2 1 1 2 1
Pitkin 7 9 5 4 3
Prowers 90 30 35 2 3 2
Pueblo 11 9 13 18 40 34
Rio Blanco 26 4 18 11 3 2
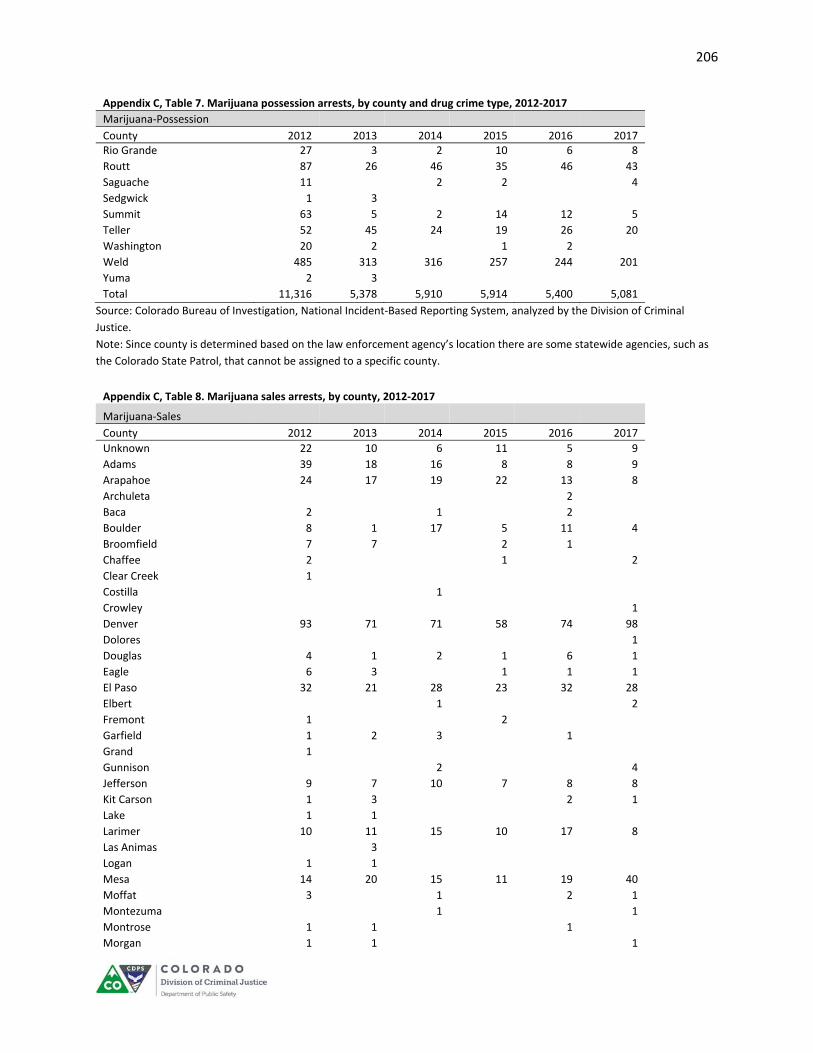
206
Appendix C, Table 7. Marijuana possession arrests, by county and drug crime type, 2012‐2017 Marijuana‐Possession County 2012 2013 2014 2015 2016 2017 Rio Grande 27 3 2 10 6 8
Routt 87 26 46 35 46 43
Saguache 11 2 2 4
Sedgwick 1 3 Summit 63 5 2 14 12 5
Teller 52 45 24 19 26 20
Washington 20 2 1 2
Weld 485 313 316 257 244 201
Yuma 2 3 Total 11,316 5,378 5,910 5,914 5,400 5,081
Source: Colorado Bureau of Investigation, National Incident‐Based Reporting System, analyzed by the Division of Criminal
Justice.
Note: Since county is determined based on the law enforcement agency’s location there are some statewide agencies, such as
the Colorado State Patrol, that cannot be assigned to a specific county.
Appendix C, Table 8. Marijuana sales arrests, by county, 2012‐2017
Marijuana‐Sales County 2012 2013 2014 2015 2016 2017
Unknown 22 10 6 11 5 9
Adams 39 18 16 8 8 9
Arapahoe 24 17 19 22 13 8
Archuleta 2
Baca 2 1 2
Boulder 8 1 17 5 11 4
Broomfield 7 7 2 1
Chaffee 2 1 2
Clear Creek 1 Costilla 1 Crowley 1
Denver 93 71 71 58 74 98
Dolores 1
Douglas 4 1 2 1 6 1
Eagle 6 3 1 1 1
El Paso 32 21 28 23 32 28
Elbert 1 2
Fremont 1 2 Garfield 1 2 3 1
Grand 1 Gunnison 2 4
Jefferson 9 7 10 7 8 8
Kit Carson 1 3 2 1
Lake 1 1 Larimer 10 11 15 10 17 8
Las Animas 3 Logan 1 1 Mesa 14 20 15 11 19 40
Moffat 3 1 2 1
Montezuma 1 1
Montrose 1 1 1
Morgan 1 1 1

207
Appendix C, Table 8. Marijuana sales arrests, by county, 2012‐2017
Marijuana‐Sales County 2012 2013 2014 2015 2016 2017 Otero 1 Park 1 1
Pitkin 2 Prowers 2 2 1 1
Pueblo 1 1
Rio Grande 1 1 Routt 1 1 San Juan 1 Teller 2 3 5 4
Weld 11 16 11 4 7 16
Total 297 220 225 174 220 248
Source: Colorado Bureau of Investigation, National Incident‐Based Reporting System, analyzed by the Division of Criminal
Justice.
Note: Since county is determined based on the law enforcement agency’s location there are some statewide agencies, such as
the Colorado State Patrol, that cannot be assigned to a specific county.
Appendix C, Table 9. Marijuana production arrests, by county, 2012–2017
Marijuana‐Production County 2012 2013 2014 2015 2016 2017
Unknown 2 2 2 4 1
Adams 39 15 6 8 14 19
Arapahoe 65 67 122 103 127 120
Boulder 1 1 7 2 2
Broomfield 2 1
Clear Creek 1 Custer 2 1 1
Denver 15 6 14 16 42 54
Douglas 2 9
Eagle 2 1 1 El Paso 20 4 2 3 3 7
Elbert 1 1
Fremont 1 1 2 1
Gilpin 2 2 1 Gunnison 2 1 2 1
Huerfano 2 1 6 1
Jefferson 6 4 9 13 10 8
Kit Carson 3
Lake 3 1 Larimer 5 1 5 7 13 13
Lincoln 7
Logan 1
Mesa 3 4 3 9 11 9
Moffat 4 Montrose 1 1 Morgan 1
Otero 1 1 1
Park 1 2 2
Prowers 2
Routt 3

208
Appendix C, Table 9. Marijuana production arrests, by county, 2012–2017
Marijuana‐Production County 2012 2013 2014 2015 2016 2017 Sedgwick 1 Teller 1 1
Weld 7 4 2 6 3 9
Total 179 111 175 188 248 267
Appendix C, Table 10. Marijuana arrests for unknown reason, by county, 2012–2017
Marijuana‐Unknown County 2012 2013 2014 2015 2016 2017
Unknown 111 32 38 24 18 31
Adams 134 85 99 98 72 110
Alamosa 3 1 11 11
Arapahoe 6 9 5 9 9 12
Archuleta 1 1 2
Boulder 39 53 34 38 30 43
Broomfield 2 1 2 4
Chaffee 3 1
Clear Creek 2 1 Custer 1 3 1 1
Delta 3 2 6
Denver 2 3 1 2 1
Dolores 3
Douglas 5 56 2 1 6 10
Eagle 27 55 34 17 15 6
El Paso 132 68 81 11 17 20
Fremont 8 6 3 23
Garfield 11 6 10 6 11 33
Gilpin 1 1
Gunnison 3 2 4 8
Jefferson 172 120 76 59 34 33
Kit Carson 1 La Plata 1 25 15 39
Lake 1 1
Larimer 360 169 156 94 90 71
Las Animas 1 Logan 1 1
Mesa 43 68 65 82 57 136
Moffat 2 Montezuma 14 2 Montrose 1 1 1
Morgan 2 1 Otero 6 Park 1 Pitkin 1 Prowers 1 1 Pueblo 12 10 10 3 2 3
Rio Grande 1 Routt 3 10 14 6 1 2
Saguache 7
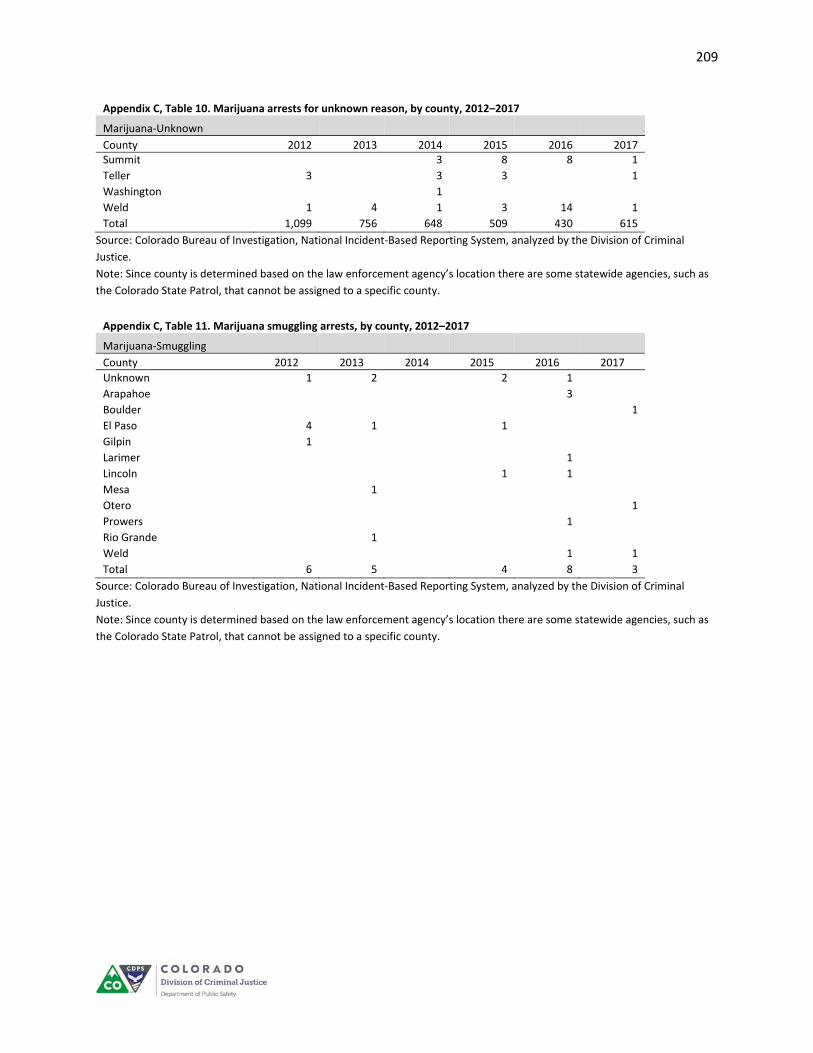
209
Appendix C, Table 10. Marijuana arrests for unknown reason, by county, 2012–2017
Marijuana‐Unknown County 2012 2013 2014 2015 2016 2017 Summit 3 8 8 1
Teller 3 3 3 1
Washington 1 Weld 1 4 1 3 14 1
Total 1,099 756 648 509 430 615
Source: Colorado Bureau of Investigation, National Incident‐Based Reporting System, analyzed by the Division of Criminal
Justice.
Note: Since county is determined based on the law enforcement agency’s location there are some statewide agencies, such as
the Colorado State Patrol, that cannot be assigned to a specific county.
Appendix C, Table 11. Marijuana smuggling arrests, by county, 2012–2017
Marijuana‐Smuggling County 2012 2013 2014 2015 2016 2017
Unknown 1 2 2 1
Arapahoe 3
Boulder 1
El Paso 4 1 1 Gilpin 1 Larimer 1
Lincoln 1 1
Mesa 1 Otero 1
Prowers 1
Rio Grande 1 Weld 1 1
Total 6 5 4 8 3
Source: Colorado Bureau of Investigation, National Incident‐Based Reporting System, analyzed by the Division of Criminal
Justice.
Note: Since county is determined based on the law enforcement agency’s location there are some statewide agencies, such as
the Colorado State Patrol, that cannot be assigned to a specific county.

210
Appendix C, Table 12. Marijuana arrests, by agency, 2012–2017
Agency 2012 2013 2014 2015 2016 2017
Acet (All Crimes Enforcement Team) 0 0 0 0 0 1
Adams County SO 678 262 154 150 112 98
Adams State College 0 6 12 16 14 9
Aims Community College PD 2 0 0 0 0 0
Alamosa County SO 2 0 0 0 0 0
Alamosa PD 0 0 0 5 1 14
Arapahoe Community College 1 1 1 1 1 0
Araphaoe County SO 77 39 50 22 39 58
Archuleta County SO 1 0 0 1 4 2
Arvada PD 432 205 246 263 194 190
Aspen PD 7 0 10 3 0 2
Ault PD 2 0 3 3 3 0
Auraria Department of Public Safety 5 0 0 7 6 7
Aurora PD 727 397 509 429 447 356
Avon PD 58 7 23 18 7 20
Baca County SO 4 3 0 1 0 0
Basalt PD 7 4 1 3 0 0
Bayfield PD 0 0 0 3 3 3
Bent County SO 0 1 0 1 0 0
Berthoud PD 5 5 0 0 0 0
Black Hawk PD 66 0 1 2 0 2
Boulder County SO 0 0 0 48 52 71
Boulder PD 137 76 71 42 30 15
Bow Mar PD 0 0 0 0 0 1
Breckenridge PD 1 0 4 16 12 4
Brighton PD 193 107 146 153 118 151
Broomfield PD 294 127 132 76 113 108
Brush PD 10 2 0 2 7 3
Buena Vista PD 1 2 2 11 6 6
Burlington PD 8 3 1 3 4 5
Campo PD 13 4 0 0 0 0
Canon City PD 21 7 4 6 0 20
Carbondale PD 0 1 0 0 4 6
Castle Rock PD 112 63 37 67 61 102
Centennial PD 78 32 34 14 30 20
Center PD 4 0 1 2 0 10
Central City PD 0 4 2 0 0 0
Chaffee County SO 19 3 3 2 7 2
Cherry Hills Village PD 0 4 0 3 0 0
Cheyenne County SO 2 1 0 0 0 0
Clear Creek County SO 31 4 5 6 2 1
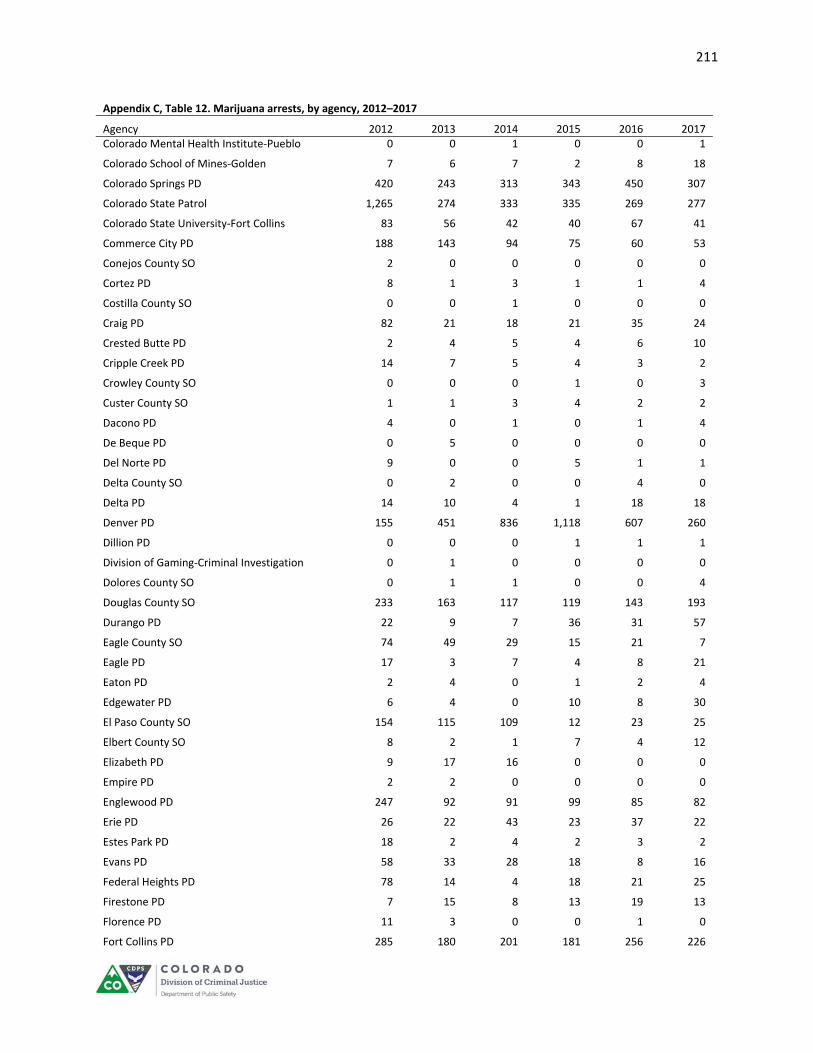
211
Appendix C, Table 12. Marijuana arrests, by agency, 2012–2017
Agency 2012 2013 2014 2015 2016 2017 Colorado Mental Health Institute‐Pueblo 0 0 1 0 0 1
Colorado School of Mines‐Golden 7 6 7 2 8 18
Colorado Springs PD 420 243 313 343 450 307
Colorado State Patrol 1,265 274 333 335 269 277
Colorado State University‐Fort Collins 83 56 42 40 67 41
Commerce City PD 188 143 94 75 60 53
Conejos County SO 2 0 0 0 0 0
Cortez PD 8 1 3 1 1 4
Costilla County SO 0 0 1 0 0 0
Craig PD 82 21 18 21 35 24
Crested Butte PD 2 4 5 4 6 10
Cripple Creek PD 14 7 5 4 3 2
Crowley County SO 0 0 0 1 0 3
Custer County SO 1 1 3 4 2 2
Dacono PD 4 0 1 0 1 4
De Beque PD 0 5 0 0 0 0
Del Norte PD 9 0 0 5 1 1
Delta County SO 0 2 0 0 4 0
Delta PD 14 10 4 1 18 18
Denver PD 155 451 836 1,118 607 260
Dillion PD 0 0 0 1 1 1
Division of Gaming‐Criminal Investigation 0 1 0 0 0 0
Dolores County SO 0 1 1 0 0 4
Douglas County SO 233 163 117 119 143 193
Durango PD 22 9 7 36 31 57
Eagle County SO 74 49 29 15 21 7
Eagle PD 17 3 7 4 8 21
Eaton PD 2 4 0 1 2 4
Edgewater PD 6 4 0 10 8 30
El Paso County SO 154 115 109 12 23 25
Elbert County SO 8 2 1 7 4 12
Elizabeth PD 9 17 16 0 0 0
Empire PD 2 2 0 0 0 0
Englewood PD 247 92 91 99 85 82
Erie PD 26 22 43 23 37 22
Estes Park PD 18 2 4 2 3 2
Evans PD 58 33 28 18 8 16
Federal Heights PD 78 14 4 18 21 25
Firestone PD 7 15 8 13 19 13
Florence PD 11 3 0 0 1 0
Fort Collins PD 285 180 201 181 256 226

212
Appendix C, Table 12. Marijuana arrests, by agency, 2012–2017
Agency 2012 2013 2014 2015 2016 2017 Fort Lewis College PD 32 42 67 26 34 20
Fort Lupton PD 46 3 10 11 3 5
Fort Morgan PD 34 17 27 8 10 20
Fountain PD 151 89 70 58 31 92
Fowler PD 1 0 0 0 4 1
Frederick PD 17 8 16 16 10 13
Fremont County SO 6 1 1 6 5 4
Frisco PD 15 0 0 0 0 0
Fruita PD 26 41 37 26 12 8
Garden City PD 1 1 3 1 2 0
Garfield County SO 14 9 4 13 15 26
Georgetown PD 0 1 0 2 0 0
Gilpin County SO 30 3 1 4 3 4
Glendale PD 3 2 0 3 2 0
Glenwood Springs PD 136 29 28 38 40 36
Golden PD 78 41 50 43 38 43
Granby PD 14 2 4 0 2 0
Grand Junction PD 492 296 299 279 274 328
Greeley PD 250 176 141 107 94 81
Greenwood Village PD 131 49 31 50 30 22
Gunison PD 32 24 16 42 25 28
Gunnison County SO 0 1 2 1 0 5
Gypsum PD 0 0 3 14 3 3
Haxtun PD 0 0 4 0 0 2
Hinsdale County SO 0 0 0 0 2 0
Holyoke PD 2 1 0 1 2 0
Hotchkiss PD 1 1 4 1 2 3
Hudson PD 2 0 4 0 0 0
Huerfano County SO 1 0 1 1 6 1
Hugo Marshals Office 0 0 0 1 1 0
Idaho Springs PD 11 0 1 1 0 0
Jefferson County SO 414 210 202 209 197 216
Johnstown PD 9 1 0 0 8 15
Keensburg PD 0 1 0 2 0 0
Kersey PD 0 6 2 4 0 1
Kiowa County SO 1 3 0 0 0 0
Kit Carson County SO 10 8 3 14 6 10
La Junta PD 20 3 6 14 1 6
La Plata County SO 0 2 7 0 1 0
Lafayette PD 125 26 36 15 30 25
Lake County SO 10 0 1 0 0 1

213
Appendix C, Table 12. Marijuana arrests, by agency, 2012–2017
Agency 2012 2013 2014 2015 2016 2017 Lakeside PD 13 0 1 3 1 0
Lakewood PD 371 217 319 237 336 291
Lamar PD 71 28 28 2 0 2
Larimer County SO 224 66 65 38 37 42
LaSalle PD 3 0 0 0 0 0
Leadville PD 14 3 2 0 2 0
Lincoln County SO 1 0 0 0 0 7
Littleton PD 167 62 65 51 40 32
Lochbuie PD 0 2 1 8 0 1
Logan County SO 37 2 12 5 6 5
Lone Tree PD 92 13 5 17 12 23
Longmont PD 72 48 73 74 72 43
Louisville PD 0 1 10 11 27 36
Loveland PD 281 155 146 158 145 159
Mancos PD 0 0 0 1 0 1
Manitou Springs PD 66 43 67 53 24 4
Mead PD 3 8 12 13 16 4
Meeker PD 4 0 1 0 0 0
Mesa County SO 104 66 71 66 35 69
Milliken PD 0 3 10 5 7 8
Minturn PD 1 0 0 0 0 0
Moffat County SO 17 1 2 8 12 6
Monte Vista PD 19 2 2 6 5 7
Montezuma County SO 66 5 11 4 9 3
Montrose County SO 25 12 11 6 11 3
Montrose PD 108 38 35 33 22 25
Monument PD 17 5 1 2 5 11
Morgan County SO 7 0 7 0 1 0
Morrison PD 2 0 0 0 0 0
Mountain View PD 1 0 1 0 1 2
Mt Crested Butte PD 3 0 8 2 2 1
Nederland PD 0 0 0 0 1 0
Northglenn PD 212 100 106 88 65 61
Oak Creek PD 0 0 0 0 0 1
Otero County SO 1 0 0 0 0 1
Ouray PD 0 0 4 0 0 0
Pagosa Springs PD 16 3 6 18 7 2
Palisade PD 0 0 12 9 5 19
Palmer Lake Marshal 1 0 0 0 0 0
Paonia PD 0 2 0 0 0 0
Parachute PD 13 2 10 25 14 8

214
Appendix C, Table 12. Marijuana arrests, by agency, 2012–2017
Agency 2012 2013 2014 2015 2016 2017 Park County SO 10 1 4 2 3 0
Parker PD 96 92 54 55 49 70
Phillips County SO 0 0 0 0 0 1
Pikes Peak Community College PD 4 0 1 0 1 0
Pitkin County SO 0 0 0 4 4 1
Platteville PD 0 0 0 0 1 0
Prowers County SO 19 4 10 1 7 0
Pueblo County SO 1 16 17 20 40 36
Pueblo PD 22 4 5 1 3 0
Rangely PD 4 3 17 8 3 1
Red Rocks PD 11 0 3 3 2 1
Rifle PD 0 9 2 10 10 42
Rio Blanco County SO 18 1 0 3 0 1
Rio Grande County SO 0 2 0 0 0 0
Routt County SO 10 0 1 5 1 2
Saguache County SO 7 0 1 0 0 0
Salida PD 27 9 12 0 6 2
San Juan County SO 0 1 0 0 0 0
San Miguel County SO 0 0 0 0 4 0
Sedgwick County SO 1 3 1 0 0 0
Severance PD 2 0 1 0 3 2
Sheridan PD 35 22 32 31 13 10
Silt PD 1 0 0 1 1 5
Silverthorne PD 5 0 1 3 5 1
Southwest Drug Task Force 0 0 0 2 0 0
Springfield PD 0 0 1 0 2 0
Steamboat Springs PD 80 36 55 40 46 40
Sterling PD 4 1 16 29 11 6
Summit County SO 42 5 0 2 1 0
Teller County SO 17 1 6 5 1 2
Thornton PD 426 169 155 129 189 237
Tinmath PD 0 0 1 0 6 0
Trinidad PD 7 5 1 1 0 4
University of Colorado PD ‐ Denver/Anschutz Medical Campus
8 0 0 2 0 0
University of Colorado PD‐ Boulder 378 282 162 201 233 466
University of Colorado PD‐Colorado Springs 35 22 31 11 4 8
University of Northern Colorado‐Greeley 0 13 16 16 22 9
Vail PD 102 61 30 60 51 38
Walsenburg PD 12 0 3 5 3 0
Washington County SO 20 2 1 1 2 0
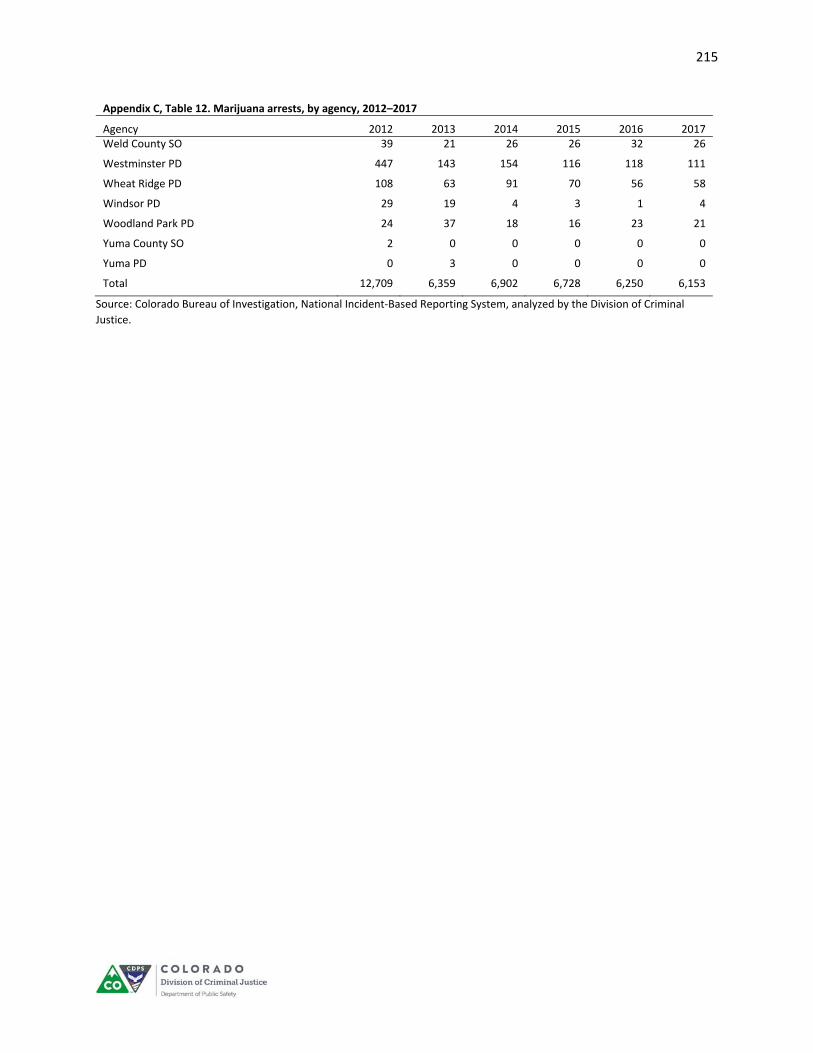
215
Appendix C, Table 12. Marijuana arrests, by agency, 2012–2017
Agency 2012 2013 2014 2015 2016 2017 Weld County SO 39 21 26 26 32 26
Westminster PD 447 143 154 116 118 111
Wheat Ridge PD 108 63 91 70 56 58
Windsor PD 29 19 4 3 1 4
Woodland Park PD 24 37 18 16 23 21
Yuma County SO 2 0 0 0 0 0
Yuma PD 0 3 0 0 0 0
Total 12,709 6,359 6,902 6,728 6,250 6,153
Source: Colorado Bureau of Investigation, National Incident‐Based Reporting System, analyzed by the Division of Criminal
Justice.

216
Appendix C, Table 13. Marijuana arrests in Denver, 2012–2017
Arrests 2012 2013 2014 2015 2016 2017
Total (Individual)* 1,605 903 474 526 499 302
Gender
Male 1,319 743 390 434 400 239
Female 286 160 84 91 98 62
Unknown/Not Listed 0 0 0 1 1 1
Age
Under 18 378 396 312 302 302 119
18‐20 287 93 56 82 56 30
21 and older 939 414 106 142 140 152
Unknown/Not Listed 1 0 0 0 1 1
Race/ethnicity
White (non‐Hispanic) 835 385 129 160 104 137
African‐American 469 219 130 133 118 47
Hispanic 272 277 195 201 237 99
Asian / Pacific Islander 14 6 4 15 16 17
Native American 13 11 5 3 2 0
Other/Unknown/Not Listed 2 5 11 14 22 2
Type of crime **
Possession 1,587 667 397 431 389 336
Production/cultivation 1 6 9 55 61 107
Sales 10 46 71 97 99 108
Smuggling 0 0 0 0 0 0
Unspecified/Other 8 184 0 0 0 0
Source: Denver Police Department Data Analysis Unit. * Does not include warrant arrests for marijuana charges or Civil or Administrative Citations for certain marijuana violations after 2014
** Count of Charge Types, not individual arrests. Type of Crimes may not sum to total arrests as one individual may be charged with multiple crimes.

217
APPENDIX D:
OFFENSES REPORTED, BY LOCATION
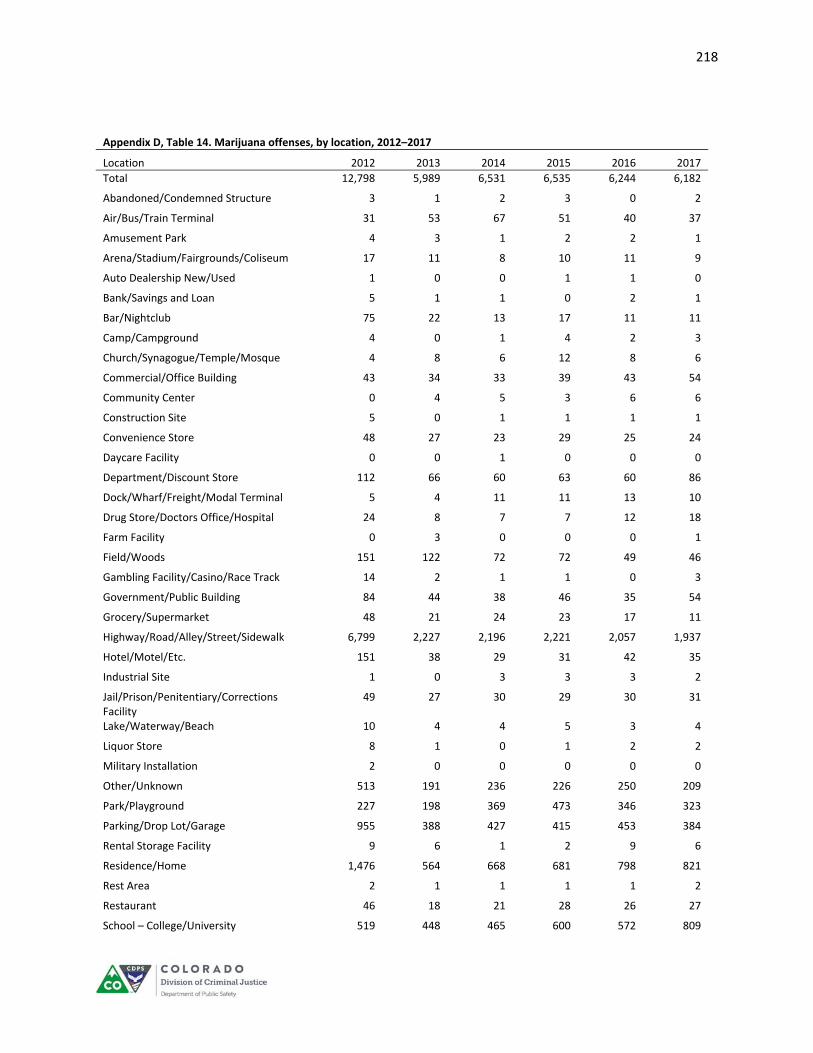
218
Appendix D, Table 14. Marijuana offenses, by location, 2012–2017
Location 2012 2013 2014 2015 2016 2017
Total 12,798 5,989 6,531 6,535 6,244 6,182
Abandoned/Condemned Structure 3 1 2 3 0 2
Air/Bus/Train Terminal 31 53 67 51 40 37
Amusement Park 4 3 1 2 2 1
Arena/Stadium/Fairgrounds/Coliseum 17 11 8 10 11 9
Auto Dealership New/Used 1 0 0 1 1 0
Bank/Savings and Loan 5 1 1 0 2 1
Bar/Nightclub 75 22 13 17 11 11
Camp/Campground 4 0 1 4 2 3
Church/Synagogue/Temple/Mosque 4 8 6 12 8 6
Commercial/Office Building 43 34 33 39 43 54
Community Center 0 4 5 3 6 6
Construction Site 5 0 1 1 1 1
Convenience Store 48 27 23 29 25 24
Daycare Facility 0 0 1 0 0 0
Department/Discount Store 112 66 60 63 60 86
Dock/Wharf/Freight/Modal Terminal 5 4 11 11 13 10
Drug Store/Doctors Office/Hospital 24 8 7 7 12 18
Farm Facility 0 3 0 0 0 1
Field/Woods 151 122 72 72 49 46
Gambling Facility/Casino/Race Track 14 2 1 1 0 3
Government/Public Building 84 44 38 46 35 54
Grocery/Supermarket 48 21 24 23 17 11
Highway/Road/Alley/Street/Sidewalk 6,799 2,227 2,196 2,221 2,057 1,937
Hotel/Motel/Etc. 151 38 29 31 42 35
Industrial Site 1 0 3 3 3 2
Jail/Prison/Penitentiary/Corrections Facility
49 27 30 29 30 31
Lake/Waterway/Beach 10 4 4 5 3 4
Liquor Store 8 1 0 1 2 2
Military Installation 2 0 0 0 0 0
Other/Unknown 513 191 236 226 250 209
Park/Playground 227 198 369 473 346 323
Parking/Drop Lot/Garage 955 388 427 415 453 384
Rental Storage Facility 9 6 1 2 9 6
Residence/Home 1,476 564 668 681 798 821
Rest Area 2 1 1 1 1 2
Restaurant 46 18 21 28 26 27
School – College/University 519 448 465 600 572 809
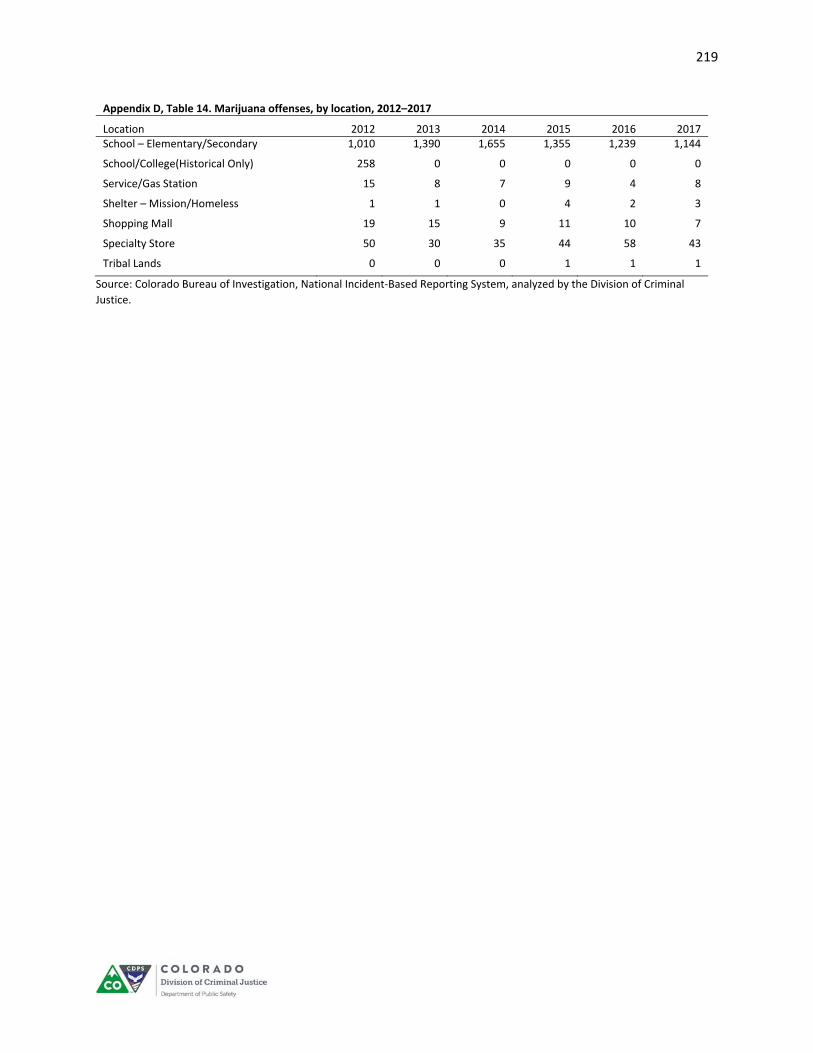
219
Appendix D, Table 14. Marijuana offenses, by location, 2012–2017
Location 2012 2013 2014 2015 2016 2017 School – Elementary/Secondary 1,010 1,390 1,655 1,355 1,239 1,144
School/College(Historical Only) 258 0 0 0 0 0
Service/Gas Station 15 8 7 9 4 8
Shelter – Mission/Homeless 1 1 0 4 2 3
Shopping Mall 19 15 9 11 10 7
Specialty Store 50 30 35 44 58 43
Tribal Lands 0 0 0 1 1 1
Source: Colorado Bureau of Investigation, National Incident‐Based Reporting System, analyzed by the Division of Criminal
Justice.
220
APPENDIX E:
MARIJUANA DRUG SEIZURES, BY COUNTY
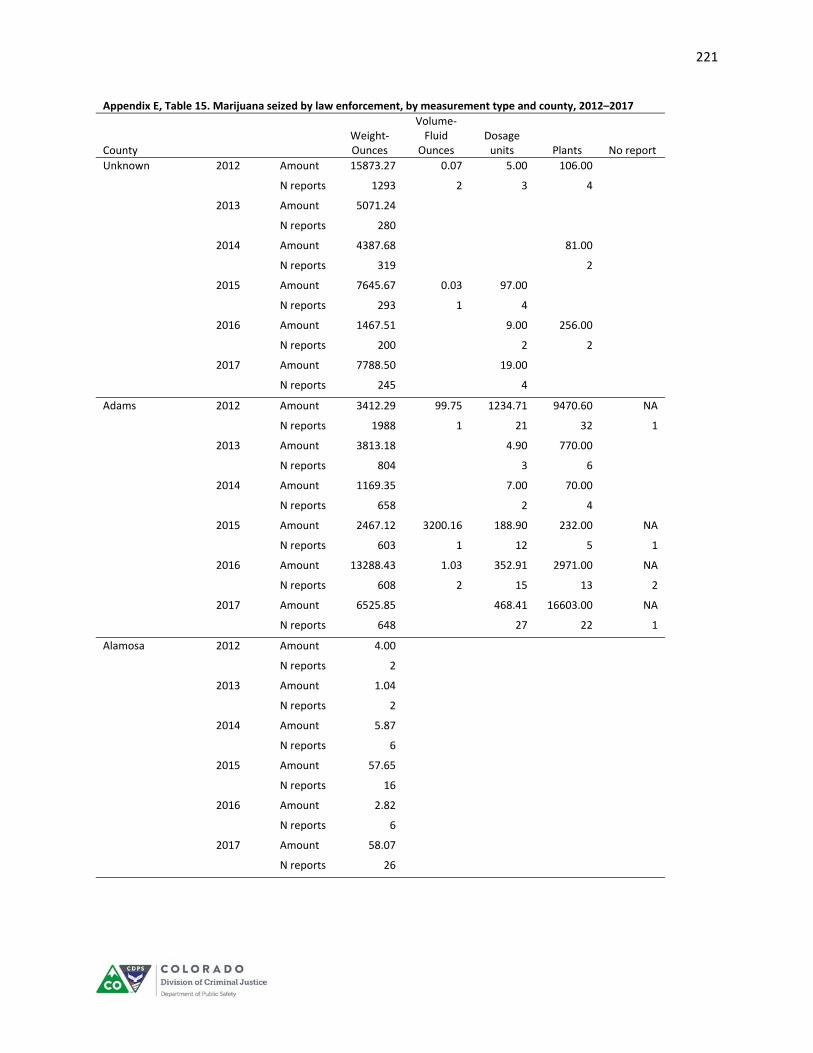
221
Appendix E, Table 15. Marijuana seized by law enforcement, by measurement type and county, 2012–2017
County Weight‐Ounces
Volume‐Fluid
Ounces Dosage units Plants No report
Unknown 2012 Amount 15873.27 0.07 5.00 106.00
N reports 1293 2 3 4
2013 Amount 5071.24
N reports 280
2014 Amount 4387.68 81.00
N reports 319 2
2015 Amount 7645.67 0.03 97.00
N reports 293 1 4
2016 Amount 1467.51 9.00 256.00
N reports 200 2 2
2017 Amount 7788.50 19.00
N reports 245 4
Adams 2012 Amount 3412.29 99.75 1234.71 9470.60 NA
N reports 1988 1 21 32 1
2013 Amount 3813.18 4.90 770.00
N reports 804 3 6
2014 Amount 1169.35 7.00 70.00
N reports 658 2 4
2015 Amount 2467.12 3200.16 188.90 232.00 NA
N reports 603 1 12 5 1
2016 Amount 13288.43 1.03 352.91 2971.00 NA
N reports 608 2 15 13 2
2017 Amount 6525.85 468.41 16603.00 NA
N reports 648 27 22 1
Alamosa 2012 Amount 4.00
N reports 2
2013 Amount 1.04
N reports 2
2014 Amount 5.87
N reports 6
2015 Amount 57.65
N reports 16
2016 Amount 2.82
N reports 6
2017 Amount 58.07
N reports 26
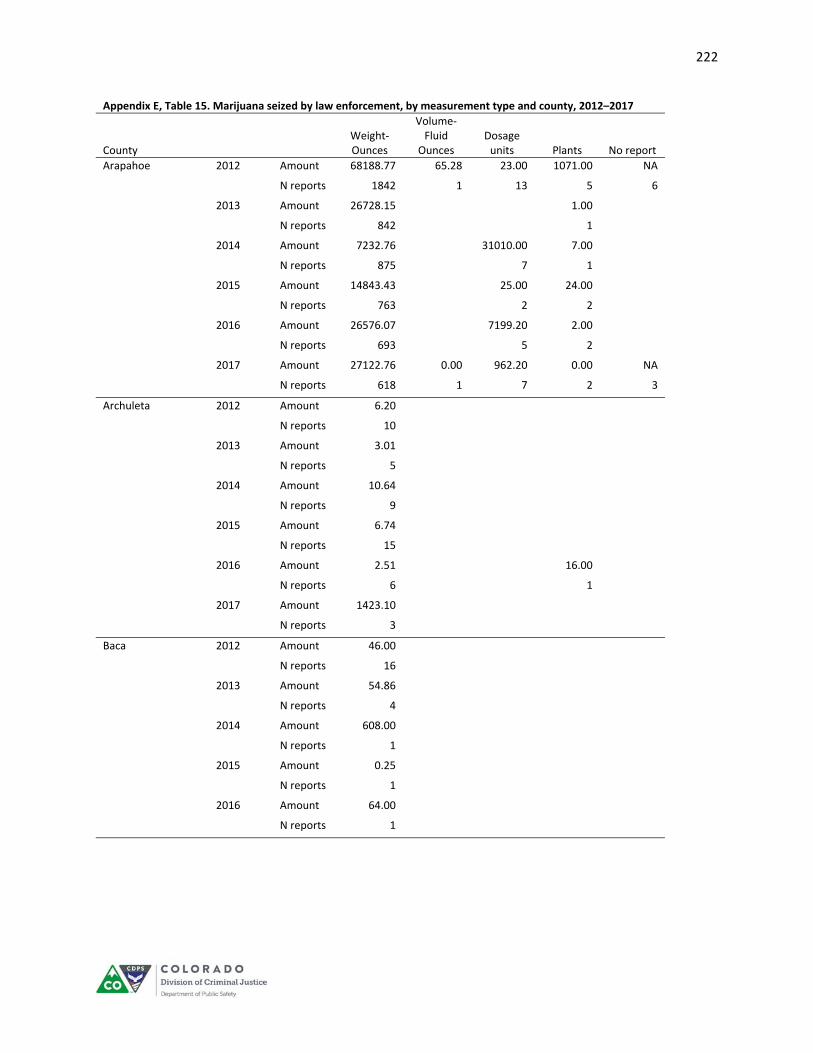
222
Appendix E, Table 15. Marijuana seized by law enforcement, by measurement type and county, 2012–2017
County Weight‐Ounces
Volume‐Fluid
Ounces Dosage units Plants No report
Arapahoe 2012 Amount 68188.77 65.28 23.00 1071.00 NA
N reports 1842 1 13 5 6
2013 Amount 26728.15 1.00
N reports 842 1
2014 Amount 7232.76 31010.00 7.00
N reports 875 7 1
2015 Amount 14843.43 25.00 24.00
N reports 763 2 2
2016 Amount 26576.07 7199.20 2.00
N reports 693 5 2
2017 Amount 27122.76 0.00 962.20 0.00 NA
N reports 618 1 7 2 3
Archuleta 2012 Amount 6.20
N reports 10
2013 Amount 3.01
N reports 5
2014 Amount 10.64
N reports 9
2015 Amount 6.74
N reports 15
2016 Amount 2.51 16.00
N reports 6 1
2017 Amount 1423.10
N reports 3
Baca 2012 Amount 46.00
N reports 16
2013 Amount 54.86
N reports 4
2014 Amount 608.00
N reports 1
2015 Amount 0.25
N reports 1
2016 Amount 64.00
N reports 1
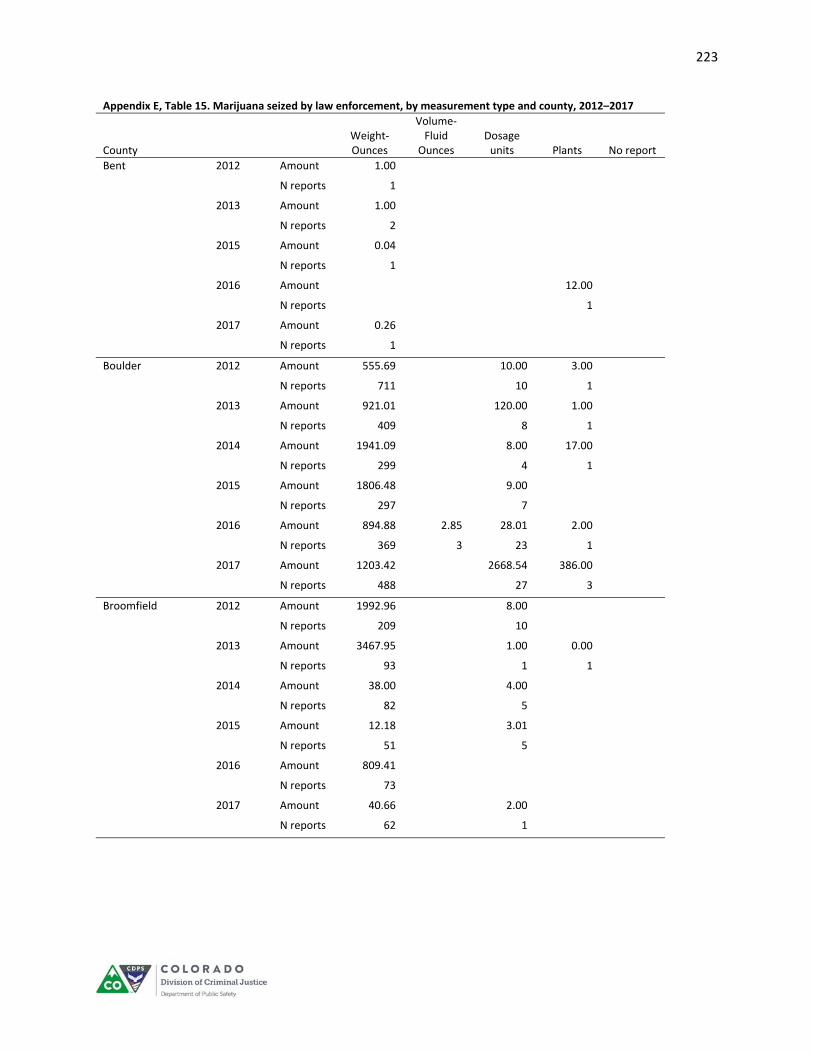
223
Appendix E, Table 15. Marijuana seized by law enforcement, by measurement type and county, 2012–2017
County Weight‐Ounces
Volume‐Fluid
Ounces Dosage units Plants No report
Bent 2012 Amount 1.00
N reports 1
2013 Amount 1.00
N reports 2
2015 Amount 0.04
N reports 1
2016 Amount 12.00
N reports 1
2017 Amount 0.26
N reports 1
Boulder 2012 Amount 555.69 10.00 3.00
N reports 711 10 1
2013 Amount 921.01 120.00 1.00
N reports 409 8 1
2014 Amount 1941.09 8.00 17.00
N reports 299 4 1
2015 Amount 1806.48 9.00
N reports 297 7
2016 Amount 894.88 2.85 28.01 2.00
N reports 369 3 23 1
2017 Amount 1203.42 2668.54 386.00
N reports 488 27 3
Broomfield 2012 Amount 1992.96 8.00
N reports 209 10
2013 Amount 3467.95 1.00 0.00
N reports 93 1 1
2014 Amount 38.00 4.00
N reports 82 5
2015 Amount 12.18 3.01
N reports 51 5
2016 Amount 809.41
N reports 73
2017 Amount 40.66 2.00
N reports 62 1

224
Appendix E, Table 15. Marijuana seized by law enforcement, by measurement type and county, 2012–2017
County Weight‐Ounces
Volume‐Fluid
Ounces Dosage units Plants No report
Chaffee 2012 Amount 44.34 2.00 10.00
N reports 42 1 1
2013 Amount 3.19 8.00
N reports 13 1
2014 Amount 3.09 1.00
N reports 14 1
2015 Amount 5.13
N reports 12
2016 Amount 19.97 1.00
N reports 19 1
2017 Amount 11.00
N reports 11
Cheyenne 2012 Amount 11.30 3.00
N reports 3 1
2013 Amount 12.00
N reports 1
2014 Amount 0.39
N reports 1
Clear Creek 2012 Amount 80.87 4.00 323.00
N reports 44 4 2
2013 Amount 16.65 12.00
N reports 7 3
2014 Amount 2.38
N reports 7
2015 Amount 5.47
N reports 7
2016 Amount 3.00 0.00
N reports 1 1
2017 Amount 0.04 1.00
N reports 1 1
Conejos 2012 Amount 2.00
N reports 1
Costilla 2014 Amount 0.07
N reports 1
Crowley 2015 Amount 0.00
N reports 1
2017 Amount 3246.94
N reports 2
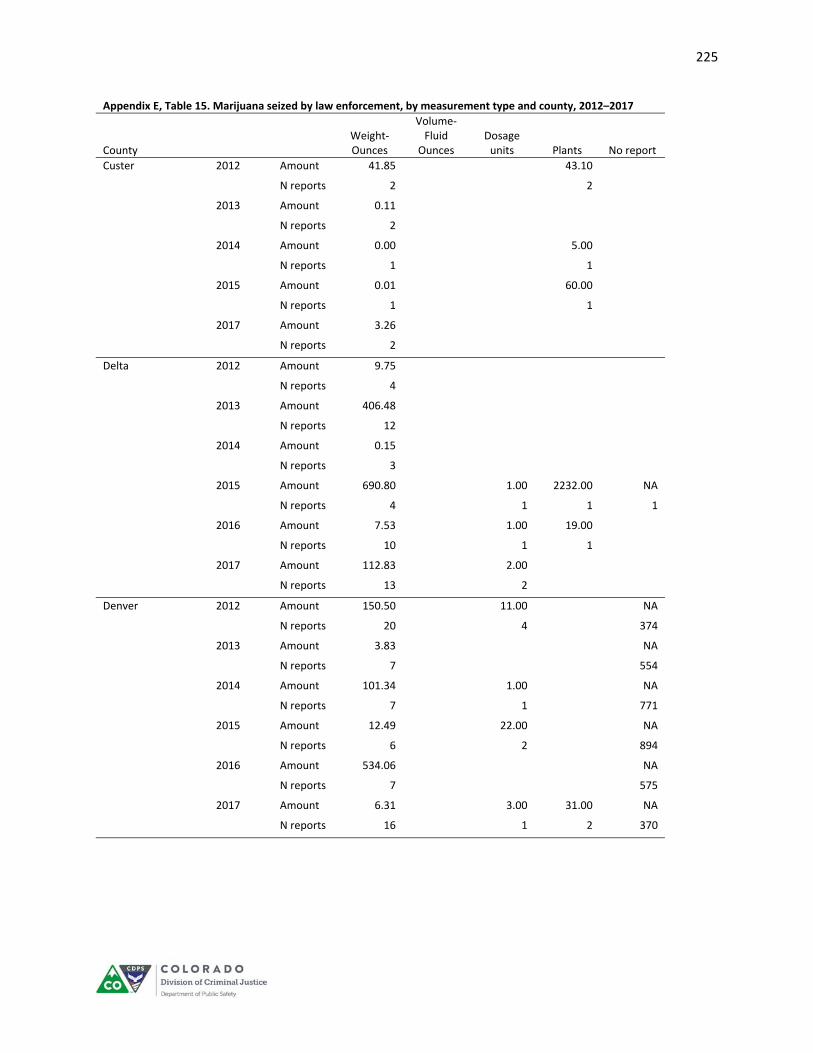
225
Appendix E, Table 15. Marijuana seized by law enforcement, by measurement type and county, 2012–2017
County Weight‐Ounces
Volume‐Fluid
Ounces Dosage units Plants No report
Custer 2012 Amount 41.85 43.10
N reports 2 2
2013 Amount 0.11
N reports 2
2014 Amount 0.00 5.00
N reports 1 1
2015 Amount 0.01 60.00
N reports 1 1
2017 Amount 3.26
N reports 2
Delta 2012 Amount 9.75
N reports 4
2013 Amount 406.48
N reports 12
2014 Amount 0.15
N reports 3
2015 Amount 690.80 1.00 2232.00 NA
N reports 4 1 1 1
2016 Amount 7.53 1.00 19.00
N reports 10 1 1
2017 Amount 112.83 2.00
N reports 13 2
Denver 2012 Amount 150.50 11.00 NA
N reports 20 4 374
2013 Amount 3.83 NA
N reports 7 554
2014 Amount 101.34 1.00 NA
N reports 7 1 771
2015 Amount 12.49 22.00 NA
N reports 6 2 894
2016 Amount 534.06 NA
N reports 7 575
2017 Amount 6.31 3.00 31.00 NA
N reports 16 1 2 370
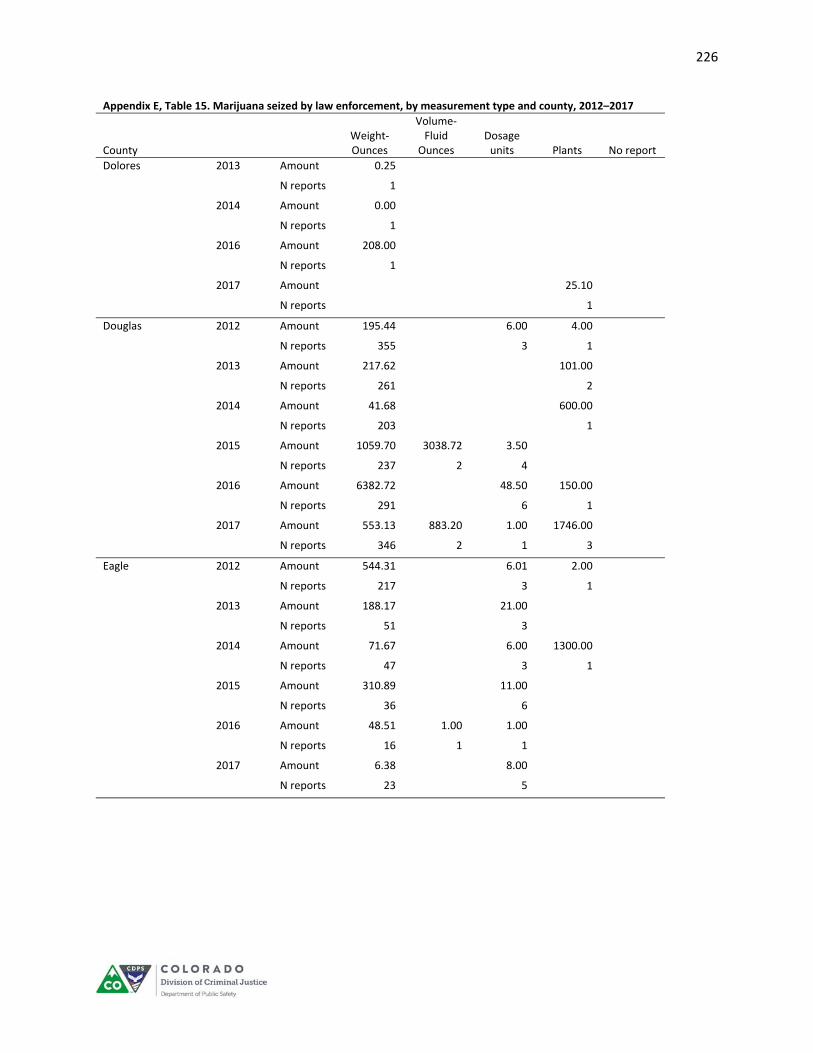
226
Appendix E, Table 15. Marijuana seized by law enforcement, by measurement type and county, 2012–2017
County Weight‐Ounces
Volume‐Fluid
Ounces Dosage units Plants No report
Dolores 2013 Amount 0.25
N reports 1
2014 Amount 0.00
N reports 1
2016 Amount 208.00
N reports 1
2017 Amount 25.10
N reports 1
Douglas 2012 Amount 195.44 6.00 4.00
N reports 355 3 1
2013 Amount 217.62 101.00
N reports 261 2
2014 Amount 41.68 600.00
N reports 203 1
2015 Amount 1059.70 3038.72 3.50
N reports 237 2 4
2016 Amount 6382.72 48.50 150.00
N reports 291 6 1
2017 Amount 553.13 883.20 1.00 1746.00
N reports 346 2 1 3
Eagle 2012 Amount 544.31 6.01 2.00
N reports 217 3 1
2013 Amount 188.17 21.00
N reports 51 3
2014 Amount 71.67 6.00 1300.00
N reports 47 3 1
2015 Amount 310.89 11.00
N reports 36 6
2016 Amount 48.51 1.00 1.00
N reports 16 1 1
2017 Amount 6.38 8.00
N reports 23 5

227
Appendix E, Table 15. Marijuana seized by law enforcement, by measurement type and county, 2012–2017
County Weight‐Ounces
Volume‐Fluid
Ounces Dosage units Plants No report
El Paso 2012 Amount 2792.80 0.00 12.00 2217.24
N reports 810 1 7 40
2013 Amount 963.33 113.92 22.00 110.00
N reports 449 2 3 4
2014 Amount 934.65 102.40 5.00 9.00
N reports 523 1 5 3
2015 Amount 1250.27 771.84 9.00 1.00
N reports 453 2 9 1
2016 Amount 5855.36 14.80 19.00 328.00
N reports 458 3 11 4
2017 Amount 20903.04 1241.60 461.00 3061.00
N reports 500 2 24 25
Elbert 2012 Amount 52.26 0.60
N reports 12 1
2013 Amount 309.64
N reports 11
2014 Amount 5.03 6.25
N reports 11 3
2015 Amount 29.88 1.00
N reports 4 1
2016 Amount 268.39 13.00
N reports 5 1
2017 Amount 93.10 180.00
N reports 13 3
Fremont 2012 Amount 65.94 26.20 1.00
N reports 60 9 1
2013 Amount 11.28 202.00
N reports 25 4
2014 Amount 26569.06 2.00
N reports 35 2
2015 Amount 0.57 5.00
N reports 7 2
2016 Amount 48.62 7.00
N reports 7 4
2017 Amount 2091.43 24.50 NA
N reports 26 7 1
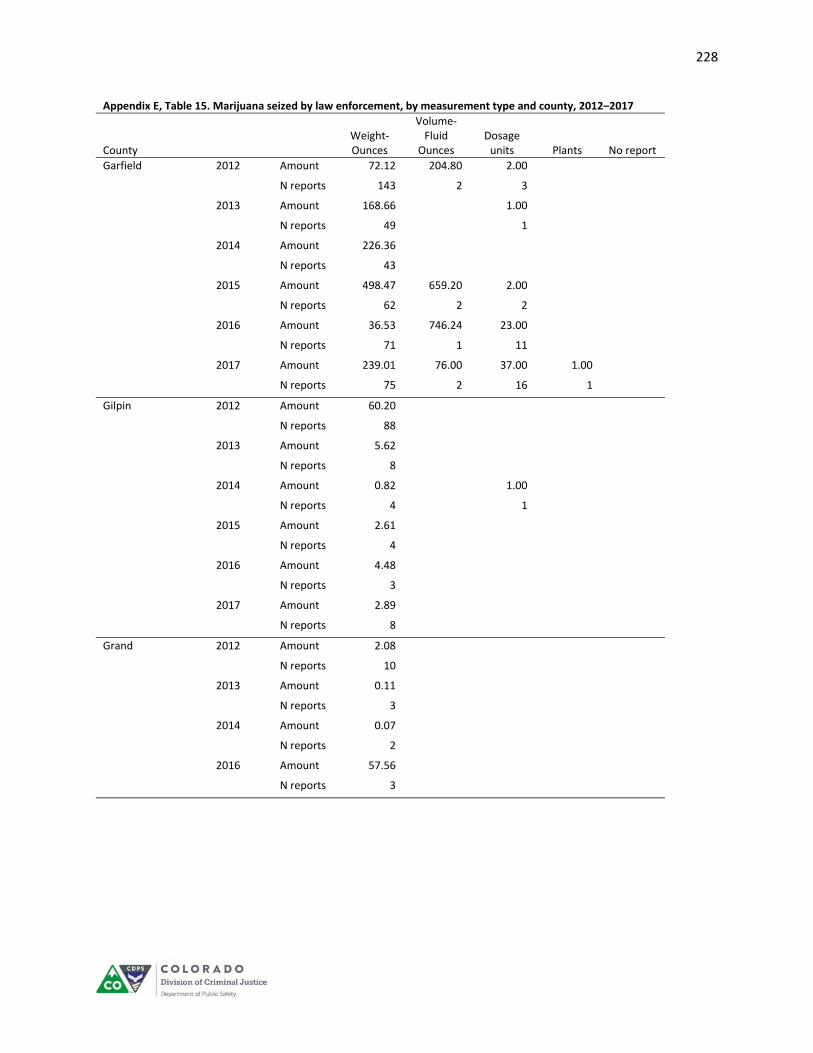
228
Appendix E, Table 15. Marijuana seized by law enforcement, by measurement type and county, 2012–2017
County Weight‐Ounces
Volume‐Fluid
Ounces Dosage units Plants No report
Garfield 2012 Amount 72.12 204.80 2.00
N reports 143 2 3
2013 Amount 168.66 1.00
N reports 49 1
2014 Amount 226.36
N reports 43
2015 Amount 498.47 659.20 2.00
N reports 62 2 2
2016 Amount 36.53 746.24 23.00
N reports 71 1 11
2017 Amount 239.01 76.00 37.00 1.00
N reports 75 2 16 1
Gilpin 2012 Amount 60.20
N reports 88
2013 Amount 5.62
N reports 8
2014 Amount 0.82 1.00
N reports 4 1
2015 Amount 2.61
N reports 4
2016 Amount 4.48
N reports 3
2017 Amount 2.89
N reports 8
Grand 2012 Amount 2.08
N reports 10
2013 Amount 0.11
N reports 3
2014 Amount 0.07
N reports 2
2016 Amount 57.56
N reports 3

229
Appendix E, Table 15. Marijuana seized by law enforcement, by measurement type and county, 2012–2017
County Weight‐Ounces
Volume‐Fluid
Ounces Dosage units Plants No report
Gunnison 2012 Amount 115.66 17.00
N reports 36 2
2013 Amount 44.75 18.00
N reports 24 1
2014 Amount 40.21
N reports 23
2015 Amount 30.51 0.03 66.00
N reports 32 1 1
2016 Amount 3.92 124.00
N reports 22 1
2017 Amount 9.44 5.30 30.00
N reports 36 4 1
Hinsdale 2012 Amount 0.50
N reports 1
2016 Amount 0.05
N reports 1
Huerfano 2012 Amount 1.95 154.00
N reports 12 2
2013 Amount 6.00
N reports 1
2014 Amount 7.35 54.00
N reports 3 1
2015 Amount 6.03 513.00
N reports 4 1
2016 Amount 0.00 634.00
N reports 1 2
2017 Amount 22.50 493.00
N reports 1 1
Jackson 2012 Amount 8.00
N reports 1
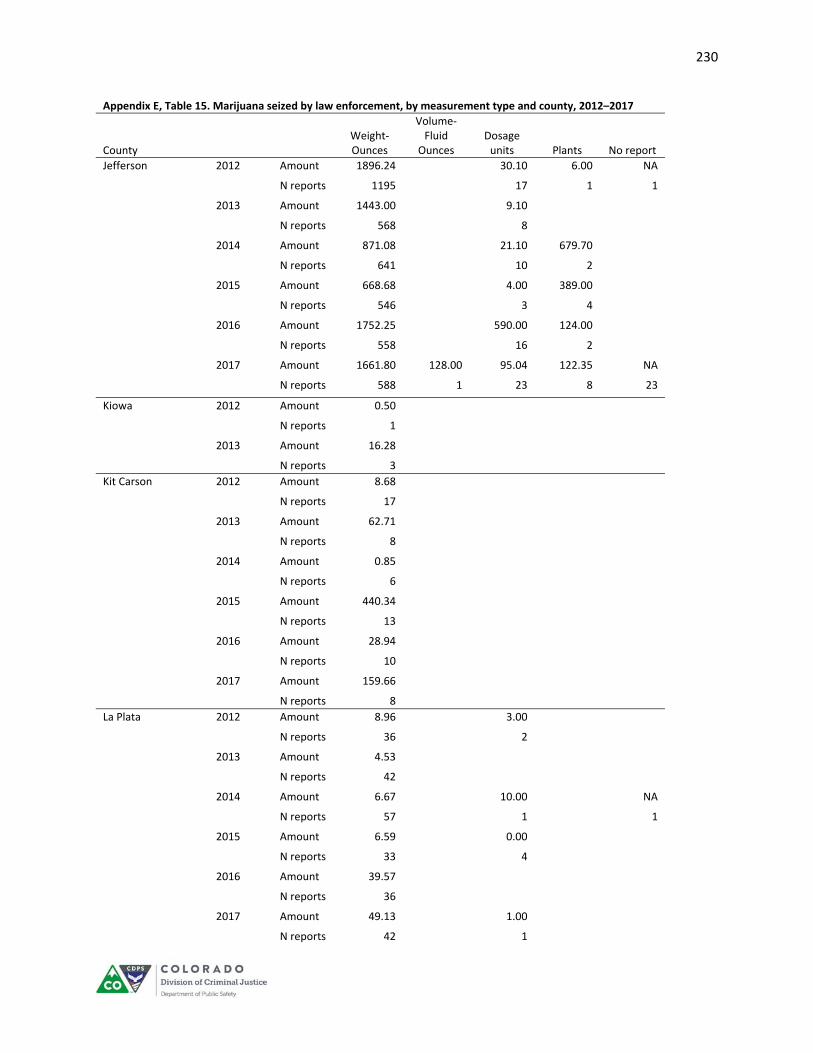
230
Appendix E, Table 15. Marijuana seized by law enforcement, by measurement type and county, 2012–2017
County Weight‐Ounces
Volume‐Fluid
Ounces Dosage units Plants No report
Jefferson 2012 Amount 1896.24 30.10 6.00 NA
N reports 1195 17 1 1
2013 Amount 1443.00 9.10
N reports 568 8
2014 Amount 871.08 21.10 679.70
N reports 641 10 2
2015 Amount 668.68 4.00 389.00
N reports 546 3 4
2016 Amount 1752.25 590.00 124.00
N reports 558 16 2
2017 Amount 1661.80 128.00 95.04 122.35 NA
N reports 588 1 23 8 23
Kiowa 2012 Amount 0.50
N reports 1
2013 Amount 16.28
N reports 3 Kit Carson 2012 Amount 8.68
N reports 17
2013 Amount 62.71
N reports 8
2014 Amount 0.85
N reports 6
2015 Amount 440.34
N reports 13
2016 Amount 28.94
N reports 10
2017 Amount 159.66
N reports 8 La Plata 2012 Amount 8.96 3.00
N reports 36 2
2013 Amount 4.53
N reports 42
2014 Amount 6.67 10.00 NA
N reports 57 1 1
2015 Amount 6.59 0.00
N reports 33 4
2016 Amount 39.57
N reports 36
2017 Amount 49.13 1.00
N reports 42 1

231
Appendix E, Table 15. Marijuana seized by law enforcement, by measurement type and county, 2012–2017
County Weight‐Ounces
Volume‐Fluid
Ounces Dosage units Plants No report
Lake 2012 Amount 48.25 300.00
N reports 18 1
2013 Amount 8.00
N reports 3
2014 Amount 32.07
N reports 2
2017 Amount 17.38
N reports 2
Larimer 2012 Amount 11064.00 4.34 48.50 NA
N reports 709 2 26 6
2013 Amount 263.55 31.00 3.00 NA
N reports 301 10 1 1
2014 Amount 337.57 30.00 2.00
N reports 293 3 1
2015 Amount 36882.04 10.00 99.00 NA
N reports 288 5 1 2
2016 Amount 5699.23 0.13 40.00 1.00
N reports 334 1 6 1
2017 Amount 9472.63 187.00 6.00
N reports 320 6 1
Las Animas 2012 Amount 3.32
N reports 6
2013 Amount 8.13
N reports 7
2015 Amount 0.11
N reports 1
2016 Amount 0.01
N reports 1
2017 Amount 0.28
N reports 4
Lincoln 2015 Amount 17.00
N reports 1
2016 Amount 86.24
N reports 1
2017 Amount 1752.00 84.00
N reports 1 2
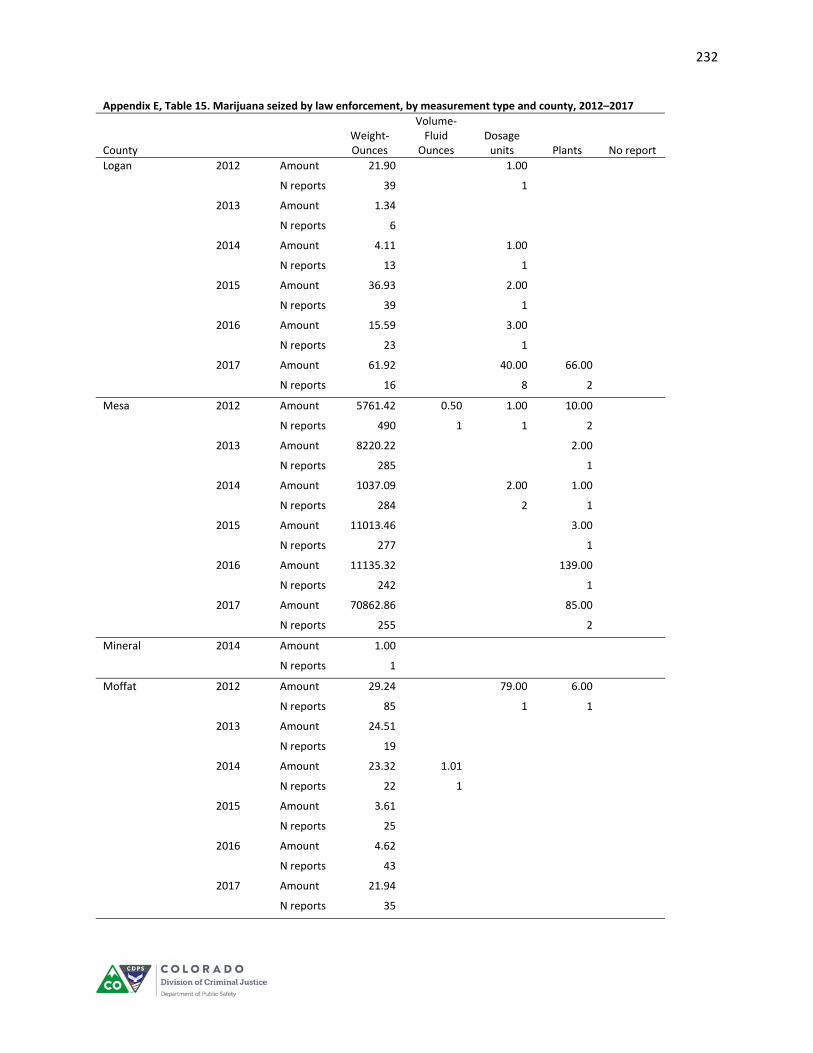
232
Appendix E, Table 15. Marijuana seized by law enforcement, by measurement type and county, 2012–2017
County Weight‐Ounces
Volume‐Fluid
Ounces Dosage units Plants No report
Logan 2012 Amount 21.90 1.00
N reports 39 1
2013 Amount 1.34
N reports 6
2014 Amount 4.11 1.00
N reports 13 1
2015 Amount 36.93 2.00
N reports 39 1
2016 Amount 15.59 3.00
N reports 23 1
2017 Amount 61.92 40.00 66.00
N reports 16 8 2
Mesa 2012 Amount 5761.42 0.50 1.00 10.00
N reports 490 1 1 2
2013 Amount 8220.22 2.00
N reports 285 1
2014 Amount 1037.09 2.00 1.00
N reports 284 2 1
2015 Amount 11013.46 3.00
N reports 277 1
2016 Amount 11135.32 139.00
N reports 242 1
2017 Amount 70862.86 85.00
N reports 255 2
Mineral 2014 Amount 1.00
N reports 1
Moffat 2012 Amount 29.24 79.00 6.00
N reports 85 1 1
2013 Amount 24.51
N reports 19
2014 Amount 23.32 1.01
N reports 22 1
2015 Amount 3.61
N reports 25
2016 Amount 4.62
N reports 43
2017 Amount 21.94
N reports 35
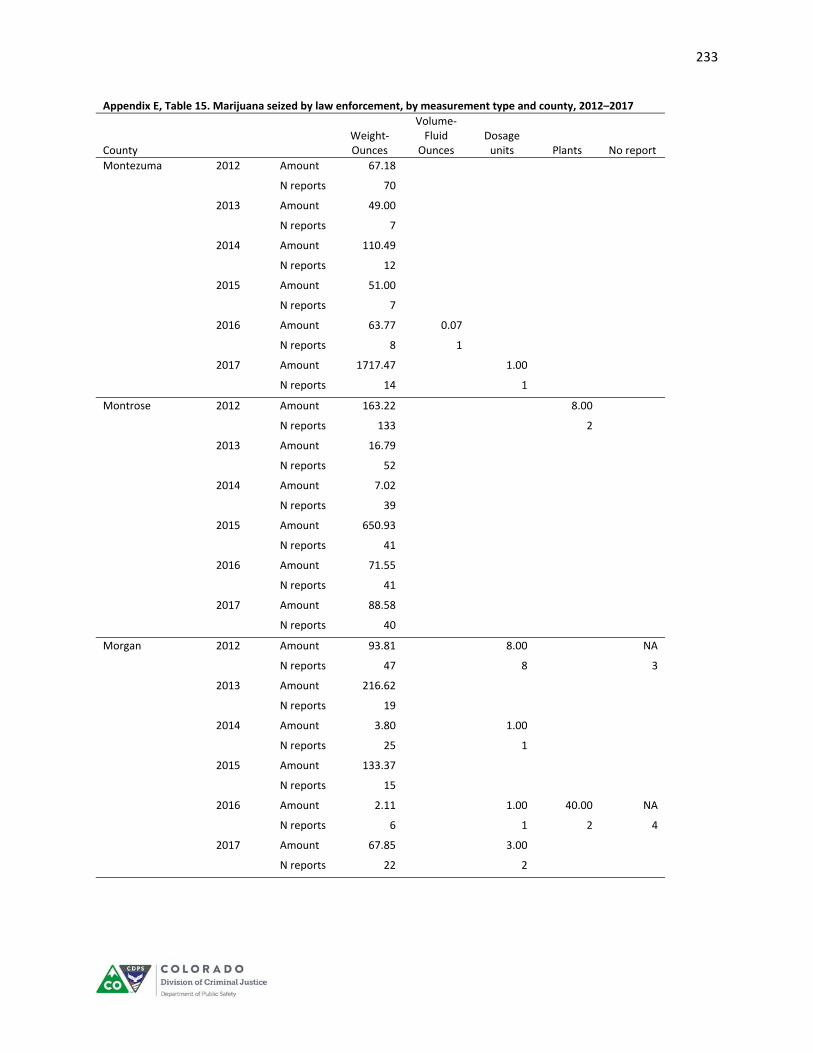
233
Appendix E, Table 15. Marijuana seized by law enforcement, by measurement type and county, 2012–2017
County Weight‐Ounces
Volume‐Fluid
Ounces Dosage units Plants No report
Montezuma 2012 Amount 67.18
N reports 70
2013 Amount 49.00
N reports 7
2014 Amount 110.49
N reports 12
2015 Amount 51.00
N reports 7
2016 Amount 63.77 0.07
N reports 8 1
2017 Amount 1717.47 1.00
N reports 14 1
Montrose 2012 Amount 163.22 8.00
N reports 133 2
2013 Amount 16.79
N reports 52
2014 Amount 7.02
N reports 39
2015 Amount 650.93
N reports 41
2016 Amount 71.55
N reports 41
2017 Amount 88.58
N reports 40
Morgan 2012 Amount 93.81 8.00 NA
N reports 47 8 3
2013 Amount 216.62
N reports 19
2014 Amount 3.80 1.00
N reports 25 1
2015 Amount 133.37
N reports 15
2016 Amount 2.11 1.00 40.00 NA
N reports 6 1 2 4
2017 Amount 67.85 3.00
N reports 22 2

234
Appendix E, Table 15. Marijuana seized by law enforcement, by measurement type and county, 2012–2017
County Weight‐Ounces
Volume‐Fluid
Ounces Dosage units Plants No report
Otero 2012 Amount 7482.84 18.00
N reports 13 1
2013 Amount 2.12
N reports 1
2014 Amount 2.03
N reports 4
2015 Amount 3.82
N reports 5
2016 Amount 10.07
N reports 2
2017 Amount 643.62 3.00
N reports 8 3
Ouray 2012 Amount 1.94
N reports 1
2014 Amount 0.50
N reports 3
2015 Amount 0.00
N reports 1
Park 2012 Amount 7.51 30.01
N reports 12 1
2013 Amount 2.00
N reports 2
2014 Amount 5.01
N reports 5
2015 Amount 2.00 170.00
N reports 2 2
2016 Amount 3.00 897.00
N reports 2 2
2017 Amount 9.00 212.00
N reports 1 1
Phillips 2012 Amount 2.00
N reports 3
2015 Amount 0.04
N reports 1
2016 Amount 0.11
N reports 2

235
Appendix E, Table 15. Marijuana seized by law enforcement, by measurement type and county, 2012–2017
County Weight‐Ounces
Volume‐Fluid
Ounces Dosage units Plants No report
Pitkin 2012 Amount 23.77 NA
N reports 23 1
2013 Amount 2.27
N reports 4
2014 Amount 3.52 6.00
N reports 12 2
2015 Amount 7.49 8.00
N reports 8 1
2016 Amount 3.00 4.00
N reports 2 2
2017 Amount 15.42 7.00
N reports 4 3
Prowers 2012 Amount 234.52
N reports 77
2013 Amount 102.69
N reports 29
2014 Amount 480.99 0.03
N reports 24 1
2015 Amount 1.18
N reports 3
2016 Amount 225.16 0.10
N reports 2 1
2017 Amount 0.04
N reports 1
Pueblo 2012 Amount 571.51 2.00 14150.00 NA
N reports 63 2 2 2
2013 Amount 78.97 59.00
N reports 53 2
2014 Amount 543.50 0.04
N reports 56 1
2015 Amount 313.70 177.00 NA
N reports 73 8 2
2016 Amount 2383.76 1.00 261.00 2889.00 NA
N reports 80 1 5 19 1
2017 Amount 843.51 2969.60 121.00 582.27 NA
N reports 64 1 8 5 1
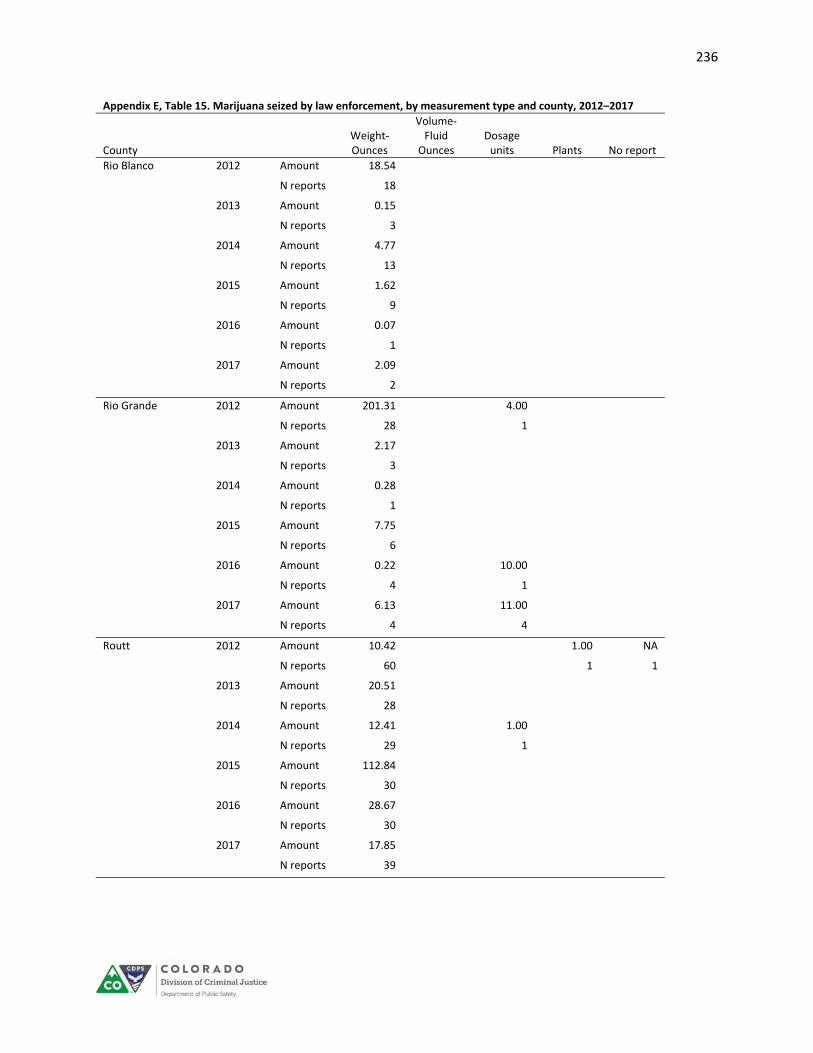
236
Appendix E, Table 15. Marijuana seized by law enforcement, by measurement type and county, 2012–2017
County Weight‐Ounces
Volume‐Fluid
Ounces Dosage units Plants No report
Rio Blanco 2012 Amount 18.54
N reports 18
2013 Amount 0.15
N reports 3
2014 Amount 4.77
N reports 13
2015 Amount 1.62
N reports 9
2016 Amount 0.07
N reports 1
2017 Amount 2.09
N reports 2
Rio Grande 2012 Amount 201.31 4.00
N reports 28 1
2013 Amount 2.17
N reports 3
2014 Amount 0.28
N reports 1
2015 Amount 7.75
N reports 6
2016 Amount 0.22 10.00
N reports 4 1
2017 Amount 6.13 11.00
N reports 4 4
Routt 2012 Amount 10.42 1.00 NA
N reports 60 1 1
2013 Amount 20.51
N reports 28
2014 Amount 12.41 1.00
N reports 29 1
2015 Amount 112.84
N reports 30
2016 Amount 28.67
N reports 30
2017 Amount 17.85
N reports 39
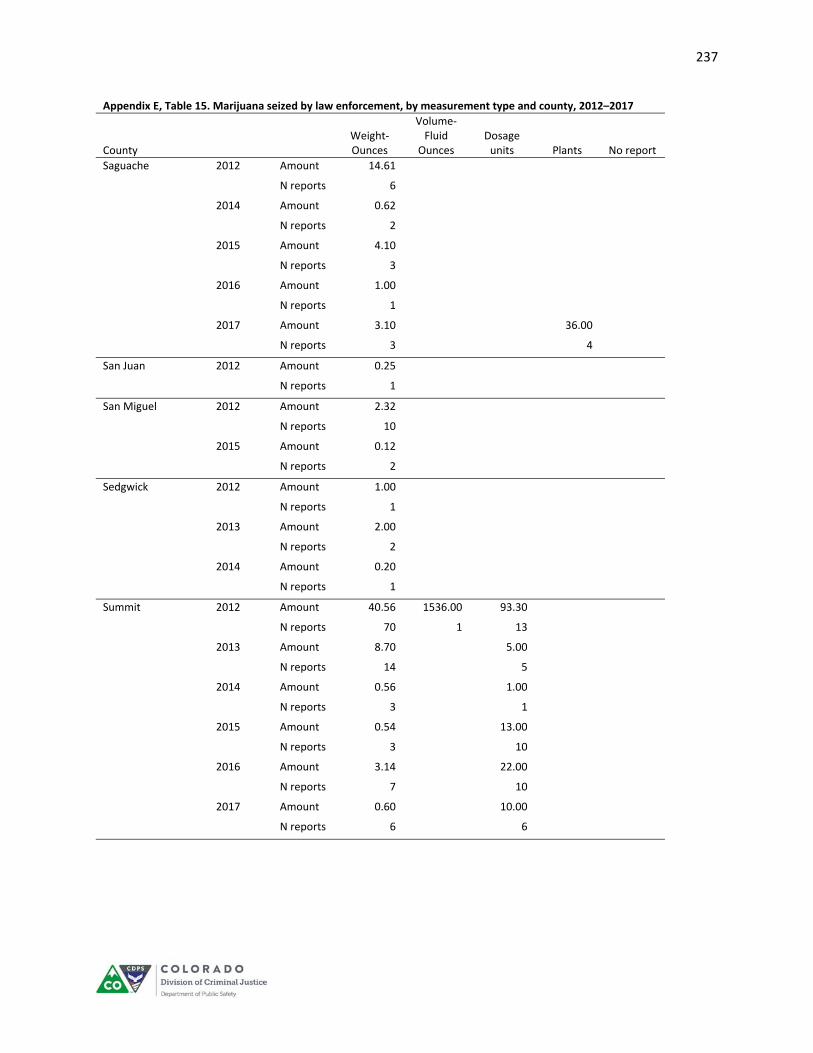
237
Appendix E, Table 15. Marijuana seized by law enforcement, by measurement type and county, 2012–2017
County Weight‐Ounces
Volume‐Fluid
Ounces Dosage units Plants No report
Saguache 2012 Amount 14.61
N reports 6
2014 Amount 0.62
N reports 2
2015 Amount 4.10
N reports 3
2016 Amount 1.00
N reports 1
2017 Amount 3.10 36.00
N reports 3 4
San Juan 2012 Amount 0.25
N reports 1
San Miguel 2012 Amount 2.32
N reports 10
2015 Amount 0.12
N reports 2
Sedgwick 2012 Amount 1.00
N reports 1
2013 Amount 2.00
N reports 2
2014 Amount 0.20
N reports 1
Summit 2012 Amount 40.56 1536.00 93.30
N reports 70 1 13
2013 Amount 8.70 5.00
N reports 14 5
2014 Amount 0.56 1.00
N reports 3 1
2015 Amount 0.54 13.00
N reports 3 10
2016 Amount 3.14 22.00
N reports 7 10
2017 Amount 0.60 10.00
N reports 6 6
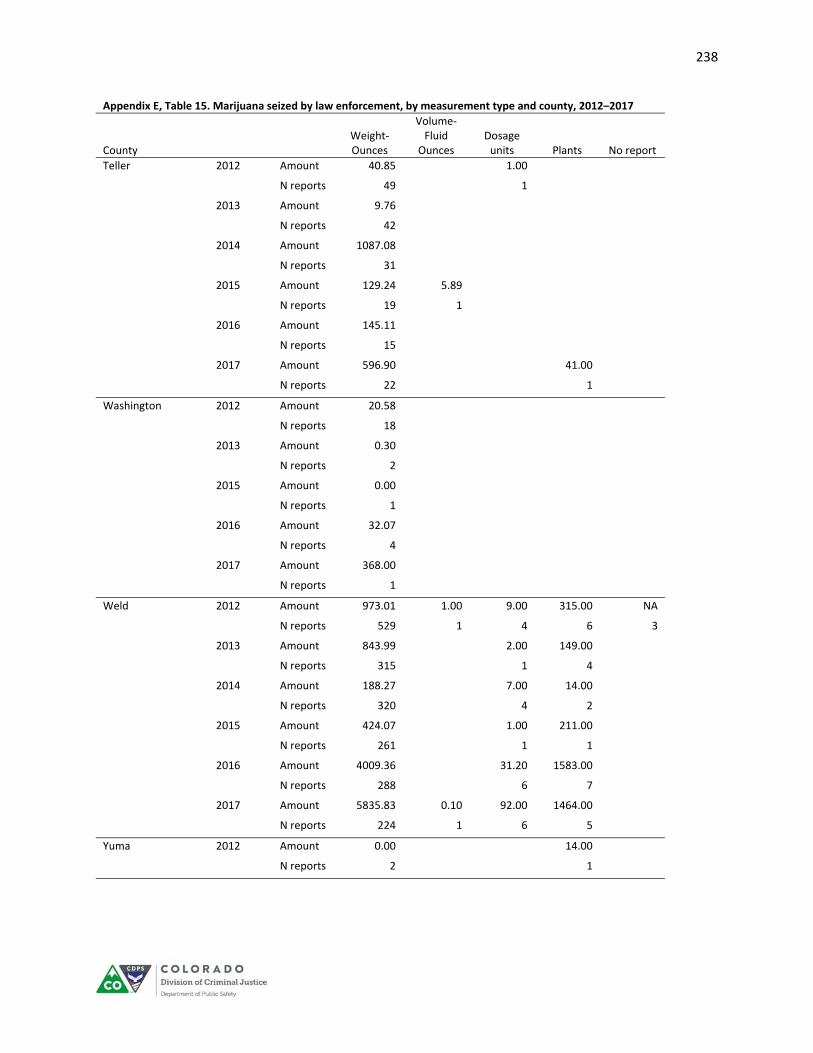
238
Appendix E, Table 15. Marijuana seized by law enforcement, by measurement type and county, 2012–2017
County Weight‐Ounces
Volume‐Fluid
Ounces Dosage units Plants No report
Teller 2012 Amount 40.85 1.00
N reports 49 1
2013 Amount 9.76
N reports 42
2014 Amount 1087.08
N reports 31
2015 Amount 129.24 5.89
N reports 19 1
2016 Amount 145.11
N reports 15
2017 Amount 596.90 41.00
N reports 22 1
Washington 2012 Amount 20.58
N reports 18
2013 Amount 0.30
N reports 2
2015 Amount 0.00
N reports 1
2016 Amount 32.07
N reports 4
2017 Amount 368.00
N reports 1
Weld 2012 Amount 973.01 1.00 9.00 315.00 NA
N reports 529 1 4 6 3
2013 Amount 843.99 2.00 149.00
N reports 315 1 4
2014 Amount 188.27 7.00 14.00
N reports 320 4 2
2015 Amount 424.07 1.00 211.00
N reports 261 1 1
2016 Amount 4009.36 31.20 1583.00
N reports 288 6 7
2017 Amount 5835.83 0.10 92.00 1464.00
N reports 224 1 6 5
Yuma 2012 Amount 0.00 14.00
N reports 2 1

239
Appendix E, Table 15. Marijuana seized by law enforcement, by measurement type and county, 2012–2017
County Weight‐Ounces
Volume‐Fluid
Ounces Dosage units Plants No report
Total 2012 Amount 123144.33 1911.73 1631.82 28283.55 NA
N reports 11762 12 169 115 398
2013 Amount 53823.42 113.92 431.00 1228.00 NA
N reports 5183 2 50 26 555
2014 Amount 48162.52 103.45 31131.35 2839.74 NA
N reports 5077 3 60 22 772
2015 Amount 81654.96 7675.87 592.42 4000.00 NA
N reports 4623 10 90 21 900
2016 Amount 82325.29 767.21 8778.82 10076.00 NA
N reports 4614 14 130 64 582
2017 Amount 165707.19 89847.62 5242.99 25254.73 NA
N reports 4888 11 199 95 399
Source: Colorado Bureau of Investigation, National Incident‐Based Reporting System, analyzed by the Division of Criminal
Justice.

240
APPENDIX F:
COURT FILINGS

241
Appendix F, Table 16. Marijuana court filings, by age group, 2008‐2017
Age group 2008 2009 2010 2011 2012 2013 2014 2015 2016 2017
10‐17 years old
Total cases 1,754 1,616 1,640 1,544 1,624 1,492 1,532 1,766 1,496 1,607
Total charges 2,463 1,942 1,757 1,631 1,720 1,588 1,767 2,213 1,969 2,048
Charge law class
Felony 204 216 170 127 123 104 30 24 31 20
Misdemeanor 113 98 94 73 64 102 201 143 100 149
Petty offense 2,146 1,628 1,493 1,431 1,533 1,380 1,499 2,013 1,815 1,862
Traffic 0 0 0 0 0 2 36 33 23 17
Unknown 0 0 0 0 0 0 1 0 0 0
Charge category
Conspiracy 9 12 14 14 12 4 7 3 6 6
Manufacture 10 7 10 8 2 6 0 5 2 1
Distribution 56 80 59 64 58 67 77 40 27 51
Possession with intent 99 93 73 43 40 47 40 43 54 49
Possession 1,542 1,455 1,512 1,455 1,537 1,389 1,076 430 201 186
Public consumption 61 85 88 49 71 73 71 31 8 16
Possession under 21 0 0 0 0 0 0 460 1,628 1,648 1,719
Other 686 212 1 0 0 0 0 0 0 0
Possession‐consumption in vehicle
0 0 0 0 0 2 36 33 23 20
18‐20 years old
Total cases 3,093 2,785 2,451 2,456 2,381 1,491 1,579 1,610 1,621 1,710
Total charges 4,769 3,659 2,685 2,622 2,548 1,627 1,847 2,048 2,112 2,280 Charge law class
Felony 412 452 329 197 179 132 56 77 60 89
Misdemeanor 286 249 224 201 183 148 168 99 96 112
Petty offense 4,071 2,957 2,132 2,223 2,186 1,330 1,419 1,687 1,807 1,922
Traffic 0 0 0 0 0 17 203 185 149 157
Unknown 0 1 0 1 0 0 1 0 0 0
Charge category
Conspiracy 14 36 38 19 11 6 5 9 11 13
Manufacture 43 39 22 26 26 10 8 5 4 15
Distribution 90 109 83 63 67 47 52 47 33 35
Possession with intent 181 189 126 73 65 60 31 46 40 53
Possession 2,619 2,623 2,380 2,373 2,322 1,412 1,193 443 256 238
Public consumption 21 28 32 66 53 71 88 43 23 21
Possession under 21 0 0 0 0 0 3 266 1,269 1,595 1,744
Other 1,801 636 4 1 3 1 1 1 1 2
Possession‐consumption in vehicle
0 0 0 1 1 17 203 185 149 159
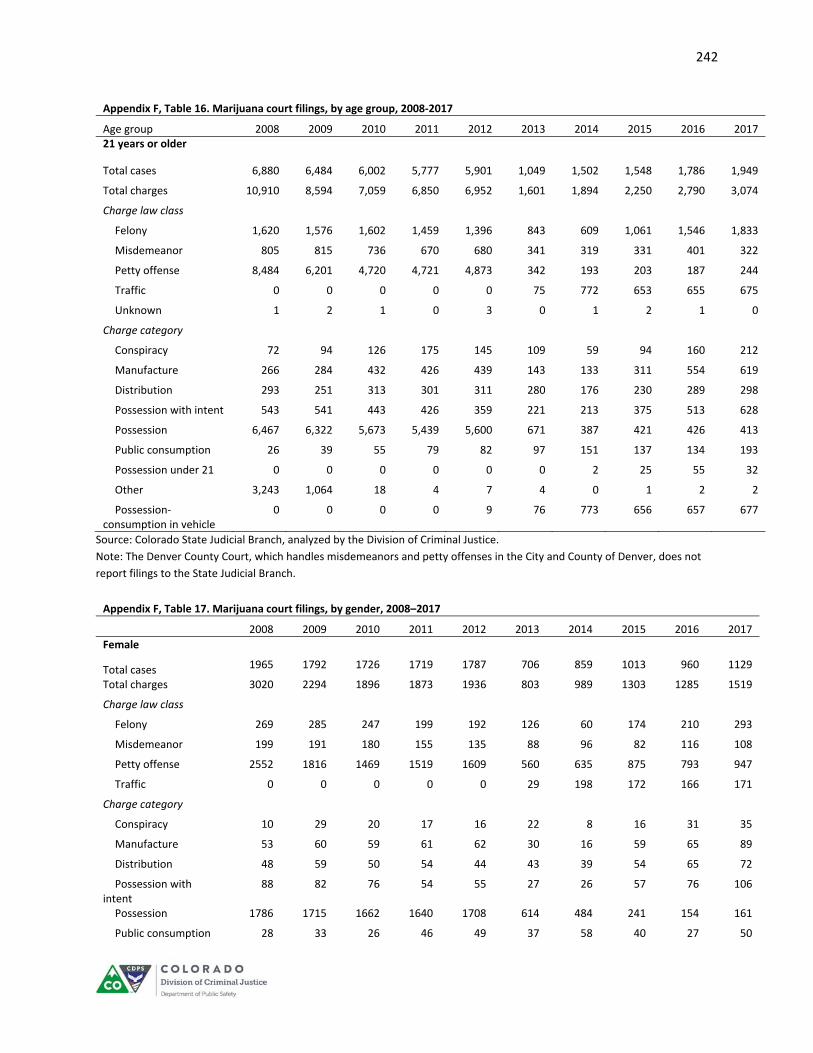
242
Appendix F, Table 16. Marijuana court filings, by age group, 2008‐2017
Age group 2008 2009 2010 2011 2012 2013 2014 2015 2016 2017 21 years or older
Total cases 6,880 6,484 6,002 5,777 5,901 1,049 1,502 1,548 1,786 1,949
Total charges 10,910 8,594 7,059 6,850 6,952 1,601 1,894 2,250 2,790 3,074
Charge law class
Felony 1,620 1,576 1,602 1,459 1,396 843 609 1,061 1,546 1,833
Misdemeanor 805 815 736 670 680 341 319 331 401 322
Petty offense 8,484 6,201 4,720 4,721 4,873 342 193 203 187 244
Traffic 0 0 0 0 0 75 772 653 655 675
Unknown 1 2 1 0 3 0 1 2 1 0
Charge category
Conspiracy 72 94 126 175 145 109 59 94 160 212
Manufacture 266 284 432 426 439 143 133 311 554 619
Distribution 293 251 313 301 311 280 176 230 289 298
Possession with intent 543 541 443 426 359 221 213 375 513 628
Possession 6,467 6,322 5,673 5,439 5,600 671 387 421 426 413
Public consumption 26 39 55 79 82 97 151 137 134 193
Possession under 21 0 0 0 0 0 0 2 25 55 32
Other 3,243 1,064 18 4 7 4 0 1 2 2
Possession‐consumption in vehicle
0 0 0 0 9 76 773 656 657 677
Source: Colorado State Judicial Branch, analyzed by the Division of Criminal Justice.
Note: The Denver County Court, which handles misdemeanors and petty offenses in the City and County of Denver, does not
report filings to the State Judicial Branch.
Appendix F, Table 17. Marijuana court filings, by gender, 2008–2017
2008 2009 2010 2011 2012 2013 2014 2015 2016 2017
Female
Total cases 1965 1792 1726 1719 1787 706 859 1013 960 1129
Total charges 3020 2294 1896 1873 1936 803 989 1303 1285 1519
Charge law class
Felony 269 285 247 199 192 126 60 174 210 293
Misdemeanor 199 191 180 155 135 88 96 82 116 108
Petty offense 2552 1816 1469 1519 1609 560 635 875 793 947
Traffic 0 0 0 0 0 29 198 172 166 171
Charge category
Conspiracy 10 29 20 17 16 22 8 16 31 35
Manufacture 53 60 59 61 62 30 16 59 65 89
Distribution 48 59 50 54 44 43 39 54 65 72
Possession with intent
88 82 76 54 55 27 26 57 76 106
Possession 1786 1715 1662 1640 1708 614 484 241 154 161
Public consumption 28 33 26 46 49 37 58 40 27 50

243
Appendix F, Table 17. Marijuana court filings, by gender, 2008–2017
2008 2009 2010 2011 2012 2013 2014 2015 2016 2017 Possession under 21 0 0 0 0 0 0 160 664 700 835
Other 1007 316 3 1 1 1 0 0 0 0
Possession‐consumption in vehicle
0 0 0 0 1 29 198 172 167 171
Male Total cases 9748 9085 8348 8048 8114 3315 3724 3888 3933 4125
Total charges 15099 11898 9580 9216 9276 4001 4482 5181 5576 5868
Charge law class
Felony 1957 1957 1845 1580 1502 953 630 986 1423 1645
Misdemeanor 999 968 873 785 790 502 591 490 479 474
Petty offense 12142 8968 6860 6848 6981 2481 2468 3010 3018 3072
Traffic 0 0 0 0 0 65 790 693 655 677
Unknown 1 3 1 1 3 0 3 2 1 0
Charge category
Conspiracy 85 113 156 191 152 97 63 90 146 195
Manufacture 264 270 404 395 403 129 125 260 495 545
Distribution 389 381 400 374 391 351 261 263 281 311
Possession with intent
731 740 566 488 408 301 258 407 529 623
Possession 8829 8679 7885 7615 7748 2847 2165 1047 728 674
Public consumption 80 119 149 148 156 203 253 172 138 180
Possession under 21 0 0 0 0 0 3 565 2244 2600 2652
Other 4721 1596 20 4 9 4 1 2 3 4
Possession‐consumption in vehicle
0 0 0 1 9 66 791 696 656 684
Source: Colorado State Judicial Branch, analyzed by the Division of Criminal Justice.
Note: The Denver County Court, which handles misdemeanors and petty offenses in the City and County of Denver, does not
report filings to the State Judicial Branch. Felony filings from Denver District Court are included in these data.
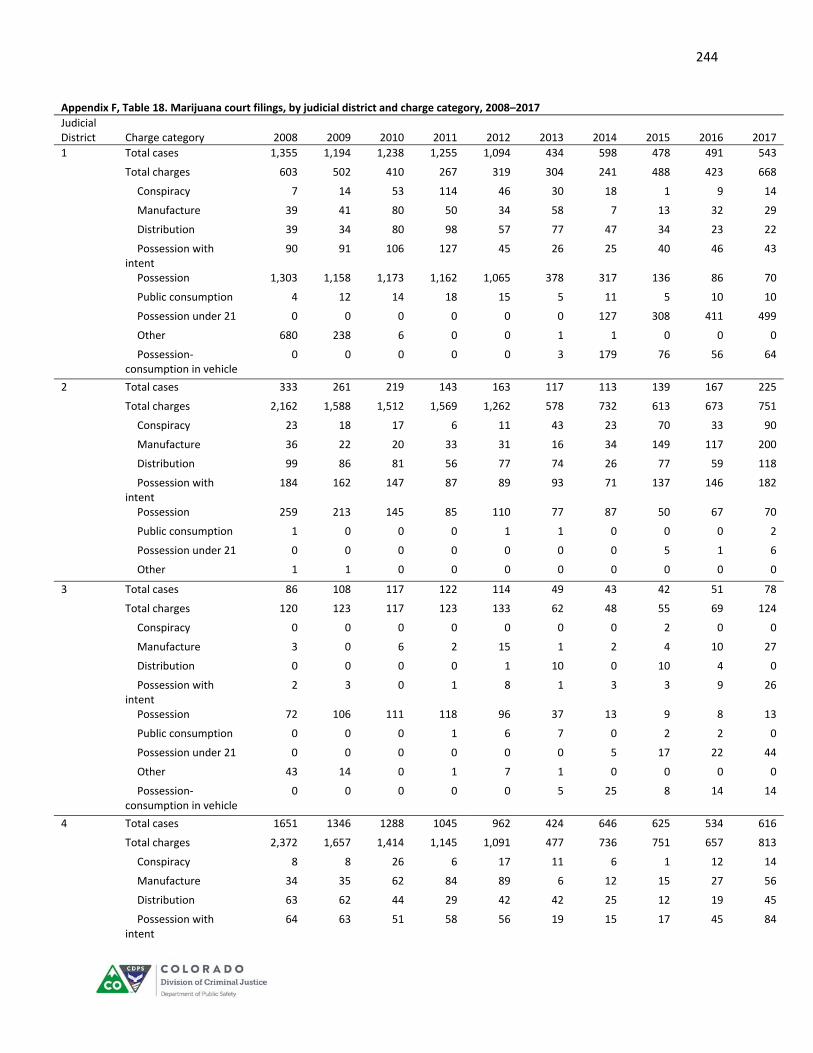
244
Appendix F, Table 18. Marijuana court filings, by judicial district and charge category, 2008–2017
Judicial District Charge category 2008 2009 2010 2011 2012 2013 2014 2015 2016 2017
1 Total cases 1,355 1,194 1,238 1,255 1,094 434 598 478 491 543
Total charges 603 502 410 267 319 304 241 488 423 668
Conspiracy 7 14 53 114 46 30 18 1 9 14
Manufacture 39 41 80 50 34 58 7 13 32 29
Distribution 39 34 80 98 57 77 47 34 23 22
Possession with intent
90 91 106 127 45 26 25 40 46 43
Possession 1,303 1,158 1,173 1,162 1,065 378 317 136 86 70
Public consumption 4 12 14 18 15 5 11 5 10 10
Possession under 21 0 0 0 0 0 0 127 308 411 499
Other 680 238 6 0 0 1 1 0 0 0
Possession‐consumption in vehicle
0 0 0 0 0 3 179 76 56 64
2 Total cases 333 261 219 143 163 117 113 139 167 225
Total charges 2,162 1,588 1,512 1,569 1,262 578 732 613 673 751
Conspiracy 23 18 17 6 11 43 23 70 33 90
Manufacture 36 22 20 33 31 16 34 149 117 200
Distribution 99 86 81 56 77 74 26 77 59 118
Possession with intent
184 162 147 87 89 93 71 137 146 182
Possession 259 213 145 85 110 77 87 50 67 70
Public consumption 1 0 0 0 1 1 0 0 0 2
Possession under 21 0 0 0 0 0 0 0 5 1 6
Other 1 1 0 0 0 0 0 0 0 0
3 Total cases 86 108 117 122 114 49 43 42 51 78
Total charges 120 123 117 123 133 62 48 55 69 124
Conspiracy 0 0 0 0 0 0 0 2 0 0
Manufacture 3 0 6 2 15 1 2 4 10 27
Distribution 0 0 0 0 1 10 0 10 4 0
Possession with intent
2 3 0 1 8 1 3 3 9 26
Possession 72 106 111 118 96 37 13 9 8 13
Public consumption 0 0 0 1 6 7 0 2 2 0
Possession under 21 0 0 0 0 0 0 5 17 22 44
Other 43 14 0 1 7 1 0 0 0 0
Possession‐consumption in vehicle
0 0 0 0 0 5 25 8 14 14
4 Total cases 1651 1346 1288 1045 962 424 646 625 534 616
Total charges 2,372 1,657 1,414 1,145 1,091 477 736 751 657 813
Conspiracy 8 8 26 6 17 11 6 1 12 14
Manufacture 34 35 62 84 89 6 12 15 27 56
Distribution 63 62 44 29 42 42 25 12 19 45
Possession with intent
64 63 51 58 56 19 15 17 45 84

245
Appendix F, Table 18. Marijuana court filings, by judicial district and charge category, 2008–2017
Judicial District Charge category 2008 2009 2010 2011 2012 2013 2014 2015 2016 2017
Possession 1,498 1,260 1,213 948 864 349 276 122 103 80
Public consumption 3 6 16 19 18 17 104 37 34 25
Possession under 21 0 0 0 0 0 0 133 399 267 352
Other 702 223 2 1 1 0 0 0 1 0
Possession‐consumption in vehicle
0 0 0 0 4 33 165 148 149 157
5 Total cases 589 466 405 371 551 167 224 241 221 209
Total charges 979 644 454 408 593 190 258 315 289 261
Conspiracy 2 3 4 2 2 3 1 1 1 1
Manufacture 6 4 9 5 20 1 17 12 5 4
Distribution 9 23 7 12 9 11 5 12 11 11
Possession with intent
7 16 9 9 2 15 2 8 12 3
Possession 549 471 422 371 549 143 112 60 28 17
Public consumption 1 2 3 9 11 15 25 16 6 2
Possession under 21 0 0 0 0 0 0 21 119 142 134
Other 405 125 0 0 0 0 0 0 0 0
Possession‐consumption in vehicle
0 0 0 0 0 2 75 87 84 89
6 Total cases 132 114 114 149 98 16 32 37 42 37
Total charges 201 150 122 152 105 16 34 47 51 45
Conspiracy 2 0 1 0 0 0 0 0 0 0
Manufacture 2 1 3 0 1 0 0 0 0 0
Distribution 2 4 4 0 8 0 1 4 2 1
Possession with intent
8 4 3 2 5 0 0 3 0 4
Possession 121 109 108 150 89 16 11 8 2 1
Public consumption 0 2 2 0 2 0 0 4 1 2
Possession under 21 0 0 0 0 0 0 7 9 21 27
Other 66 30 1 0 0 0 0 0 0 0
Possession‐consumption in vehicle
0 0 0 0 0 0 15 19 25 10
7 Total cases 327 283 299 282 245 104 135 139 215 190
Total charges 477 351 313 293 264 108 164 167 250 226
Conspiracy 1 5 1 0 0 1 0 0 0 0
Manufacture 6 10 9 6 5 4 4 7 14 3
Distribution 2 6 4 0 4 3 4 2 6 2
Possession with intent
7 5 8 3 4 0 3 3 8 3
Possession 295 280 283 283 249 89 60 19 19 36
Public consumption 4 3 8 1 1 10 12 5 7 6
Possession under 21 0 0 0 0 0 0 22 78 131 134
Other 162 42 0 0 0 0 0 0 0 0
Possession‐consumption in vehicle
0 0 0 0 1 1 59 53 65 42

246
Appendix F, Table 18. Marijuana court filings, by judicial district and charge category, 2008–2017
Judicial District Charge category 2008 2009 2010 2011 2012 2013 2014 2015 2016 2017
8 Total cases 950 740 786 832 903 436 399 425 400 365
Total charges 1,442 925 862 905 956 479 420 510 492 433
Conspiracy 2 1 6 7 7 10 0 2 5 2
Manufacture 40 16 36 30 20 14 2 14 19 8
Distribution 23 31 14 22 7 26 14 10 17 7
Possession with intent
40 34 37 27 28 10 8 26 21 17
Possession 735 652 748 802 856 355 268 97 72 51
Public consumption 26 27 19 17 37 55 45 36 29 25
Possession under 21 0 0 0 0 0 0 56 293 304 295
Other 576 164 2 0 1 0 0 0 0 0
Possession‐consumption in vehicle
0 0 0 0 0 9 27 32 25 28
9 Total cases 277 302 248 236 280 97 131 159 157 138
Total charges 484 387 281 269 312 107 156 201 192 175
Conspiracy 1 0 5 4 0 0 0 2 0 0
Manufacture 8 4 3 9 3 0 0 2 4 0
Distribution 7 11 21 21 20 10 11 12 3 7
Possession with intent
18 13 9 10 10 9 2 3 4 9
Possession 261 295 242 221 272 85 76 25 10 9
Public consumption 3 2 0 4 7 1 12 5 3 2
Possession under 21 0 0 0 0 0 0 20 93 115 100
Other 186 62 1 0 0 0 0 0 0 1
Possession‐consumption in vehicle
0 0 0 0 0 2 35 59 53 47
10 Total cases 235 283 247 201 191 75 110 114 143 134
Total charges 334 349 283 214 214 92 119 147 215 180
Conspiracy 5 1 0 1 1 0 0 1 13 13
Manufacture 7 5 8 8 7 9 1 3 63 32
Distribution 2 2 15 4 15 4 3 15 8 8
Possession with intent
22 26 7 4 5 4 7 25 40 28
Possession 233 277 252 196 182 62 47 55 30 23
Public consumption 1 1 1 1 3 2 2 5 0 3
Possession under 21 0 0 0 0 0 0 2 25 35 61
Other 64 37 0 0 0 2 0 0 0 0
Possession‐consumption in vehicle
0 0 0 0 1 9 57 18 26 12
11 Total cases 340 303 177 183 208 62 116 115 107 98
Total charges 531 380 194 209 222 67 133 138 127 121
Conspiracy 8 0 0 0 1 0 1 2 0 0
Manufacture 9 7 3 9 5 1 3 12 14 7
Distribution 1 8 10 8 4 2 5 7 2 7

247
Appendix F, Table 18. Marijuana court filings, by judicial district and charge category, 2008–2017
Judicial District Charge category 2008 2009 2010 2011 2012 2013 2014 2015 2016 2017
Possession with intent
5 11 5 9 3 0 4 1 3 5
Possession 324 295 175 178 201 57 57 20 12 5
Public consumption 2 4 1 5 8 6 8 1 15 1
Possession under 21 0 0 0 0 0 0 18 78 56 66
Other 182 55 0 0 0 0 0 0 0 0
Possession‐consumption in vehicle
0 0 0 0 0 1 37 17 25 30
12 Total cases 226 300 177 131 108 27 54 76 67 65
Total charges 353 373 180 142 112 29 61 103 89 97
Conspiracy 1 3 0 2 1 0 0 4 4 6
Manufacture 1 2 0 2 1 2 0 3 3 22
Distribution 16 7 0 4 1 0 3 8 2 2
Possession with intent
1 5 2 1 2 1 6 1 9 8
Possession 212 293 177 132 107 23 26 37 18 10
Public consumption 3 1 1 1 0 0 1 2 1 0
Possession under 21 0 0 0 0 0 0 3 31 44 36
Other 119 62 0 0 0 0 0 0 0 0
Possession‐consumption in vehicle
0 0 0 0 0 3 22 17 8 13
13 Total cases 254 280 232 206 206 78 105 133 128 131
Total charges 400 358 268 255 229 95 124 165 173 168
Conspiracy 1 5 2 4 0 2 1 0 0 3
Manufacture 3 0 1 2 5 0 0 3 3 9
Distribution 4 3 3 5 1 3 5 7 5 8
Possession with intent
6 18 19 23 10 12 4 12 8 8
Possession 242 284 241 213 208 78 59 59 45 52
Public consumption 2 2 2 8 2 0 2 1 0 1
Possession under 21 0 0 0 0 0 0 18 41 76 56
Other 142 46 0 0 1 0 0 0 0 0
Possession‐consumption in vehicle
0 0 0 0 2 0 35 42 36 31
14 Total cases 282 324 293 298 299 94 104 141 133 130
Total charges 461 434 306 315 315 104 129 188 195 175
Conspiracy 2 11 0 0 0 0 1 0 0 2
Manufacture 4 12 3 4 6 3 0 1 1 0
Distribution 13 10 4 4 2 2 4 6 12 11
Possession with intent
10 15 5 7 3 7 3 2 5 4
Possession 255 329 292 298 298 84 32 12 7 3
Public consumption 5 0 2 2 6 3 1 5 4 0
Possession under 21 0 0 0 0 0 0 70 145 154 131
Other 172 57 0 0 0 0 0 0 0 0

248
Appendix F, Table 18. Marijuana court filings, by judicial district and charge category, 2008–2017
Judicial District Charge category 2008 2009 2010 2011 2012 2013 2014 2015 2016 2017
Possession‐consumption in vehicle
0 0 0 0 0 5 18 17 12 24
15 Total cases 90 103 79 61 86 33 33 52 37 27
Total charges 150 135 86 68 88 43 42 63 43 31
Conspiracy 0 0 0 0 0 2 0 0 0 0
Manufacture 0 2 2 4 0 0 2 3 0 2
Distribution 6 1 3 0 0 4 5 7 6 3
Possession with intent
6 4 5 8 3 8 1 7 4 2
Possession 87 99 75 56 85 29 19 6 5 4
Possession under 21 0 0 0 0 0 0 3 32 16 13
Other 51 29 1 0 0 0 0 0 0 0
Possession‐consumption in vehicle
0 0 0 0 0 0 12 8 12 7
16 Total cases 63 73 40 52 57 12 30 53 26 50
Total charges 97 95 40 56 57 12 33 62 38 60
Conspiracy 0 0 0 0 0 0 1 0 8 0
Manufacture 3 2 0 2 1 0 0 0 0 4
Distribution 15 0 0 1 1 0 1 1 9 0
Possession with intent
5 5 2 2 0 0 0 0 1 8
Possession 51 68 38 51 55 10 10 7 3 5
Public consumption 0 2 0 0 0 2 0 0 0 0
Possession under 21 0 0 0 0 0 0 13 46 12 32
Other 23 18 0 0 0 0 0 0 0 0
Possession‐consumption in vehicle
0 0 0 0 0 0 8 8 5 11
17 Total cases 975 985 1106 1175 1263 391 346 314 296 289
Total charges 1,500 1,272 1,285 1,367 1,569 454 401 369 389 359
Conspiracy 7 22 33 14 34 0 6 2 6 1
Manufacture 28 49 105 124 170 16 17 6 30 30
Distribution 27 37 32 52 70 38 30 14 17 25
Possession with intent
71 74 77 58 74 33 22 28 44 45
Possession 936 958 1,036 1,112 1,215 353 232 143 97 99
Public consumption 7 3 1 6 6 9 15 18 10 10
Possession under 21 0 0 0 0 0 0 15 106 139 101
Other 424 129 1 1 0 0 0 0 0 0
Possession‐consumption in vehicle
0 0 0 0 0 5 64 52 46 48
18 Total cases 1243 1233 1105 1095 1142 574 549 731 787 850
Total charges 1,839 1,554 1,252 1,199 1,270 650 675 978 1,280 1,308
Conspiracy 10 36 15 20 38 10 10 16 68 67
Manufacture 28 69 82 47 23 15 28 45 152 128
Distribution 24 48 55 41 57 43 26 44 82 62
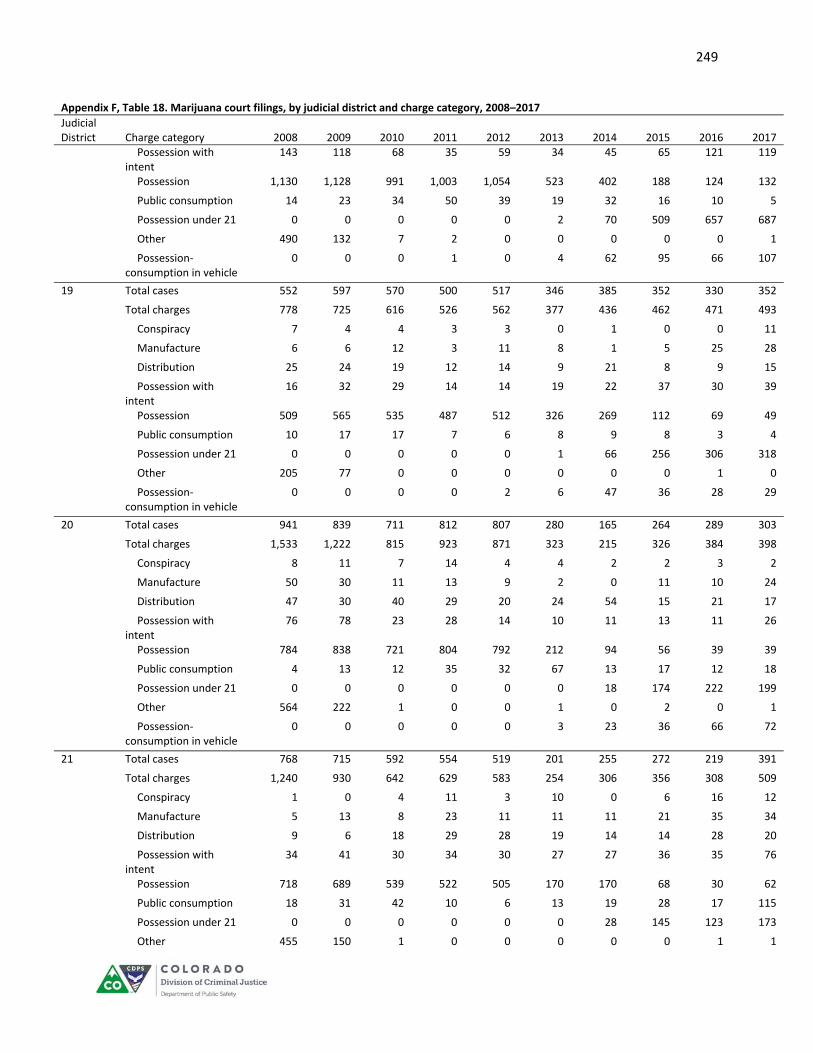
249
Appendix F, Table 18. Marijuana court filings, by judicial district and charge category, 2008–2017
Judicial District Charge category 2008 2009 2010 2011 2012 2013 2014 2015 2016 2017
Possession with intent
143 118 68 35 59 34 45 65 121 119
Possession 1,130 1,128 991 1,003 1,054 523 402 188 124 132
Public consumption 14 23 34 50 39 19 32 16 10 5
Possession under 21 0 0 0 0 0 2 70 509 657 687
Other 490 132 7 2 0 0 0 0 0 1
Possession‐consumption in vehicle
0 0 0 1 0 4 62 95 66 107
19 Total cases 552 597 570 500 517 346 385 352 330 352
Total charges 778 725 616 526 562 377 436 462 471 493
Conspiracy 7 4 4 3 3 0 1 0 0 11
Manufacture 6 6 12 3 11 8 1 5 25 28
Distribution 25 24 19 12 14 9 21 8 9 15
Possession with intent
16 32 29 14 14 19 22 37 30 39
Possession 509 565 535 487 512 326 269 112 69 49
Public consumption 10 17 17 7 6 8 9 8 3 4
Possession under 21 0 0 0 0 0 1 66 256 306 318
Other 205 77 0 0 0 0 0 0 1 0
Possession‐consumption in vehicle
0 0 0 0 2 6 47 36 28 29
20 Total cases 941 839 711 812 807 280 165 264 289 303
Total charges 1,533 1,222 815 923 871 323 215 326 384 398
Conspiracy 8 11 7 14 4 4 2 2 3 2
Manufacture 50 30 11 13 9 2 0 11 10 24
Distribution 47 30 40 29 20 24 54 15 21 17
Possession with intent
76 78 23 28 14 10 11 13 11 26
Possession 784 838 721 804 792 212 94 56 39 39
Public consumption 4 13 12 35 32 67 13 17 12 18
Possession under 21 0 0 0 0 0 0 18 174 222 199
Other 564 222 1 0 0 1 0 2 0 1
Possession‐consumption in vehicle
0 0 0 0 0 3 23 36 66 72
21 Total cases 768 715 592 554 519 201 255 272 219 391
Total charges 1,240 930 642 629 583 254 306 356 308 509
Conspiracy 1 0 4 11 3 10 0 6 16 12
Manufacture 5 13 8 23 11 11 11 21 35 34
Distribution 9 6 18 29 28 19 14 14 28 20
Possession with intent
34 41 30 34 30 27 27 36 35 76
Possession 718 689 539 522 505 170 170 68 30 62
Public consumption 18 31 42 10 6 13 19 28 17 115
Possession under 21 0 0 0 0 0 0 28 145 123 173
Other 455 150 1 0 0 0 0 0 1 1

250
Appendix F, Table 18. Marijuana court filings, by judicial district and charge category, 2008–2017
Judicial District Charge category 2008 2009 2010 2011 2012 2013 2014 2015 2016 2017
Possession‐consumption in vehicle
0 0 0 0 0 4 37 38 23 16
22 Total cases 84 53 65 88 110 24 46 32 73 67
Total charges 127 68 66 89 111 24 52 40 83 82
Conspiracy 0 0 0 0 0 0 0 0 1 5
Manufacture 2 1 1 0 0 2 0 0 0 14
Distribution 7 7 1 1 0 0 1 4 6 7
Possession with intent
8 5 1 0 0 0 3 3 7 6
Possession 77 50 63 87 111 21 22 6 9 7
Public consumption 0 1 0 1 0 1 0 1 2 0
Possession under 21 0 0 0 0 0 0 16 18 52 38
Other 33 4 0 0 0 0 0 0 0 0
Possession‐consumption in vehicle
0 0 0 0 0 0 10 8 6 5
Source: Colorado State Judicial Branch, analyzed by the Division of Criminal Justice.
Note: The Denver County Court, which handles misdemeanors and petty offenses in the City and County of Denver, does not
report filings to the State Judicial Branch. Felony filings from Denver District Court are included in these data.
251
APPENDIX G:
CERTIFIED DRUG RECOGNITION EXPERTS, BY AGENCY
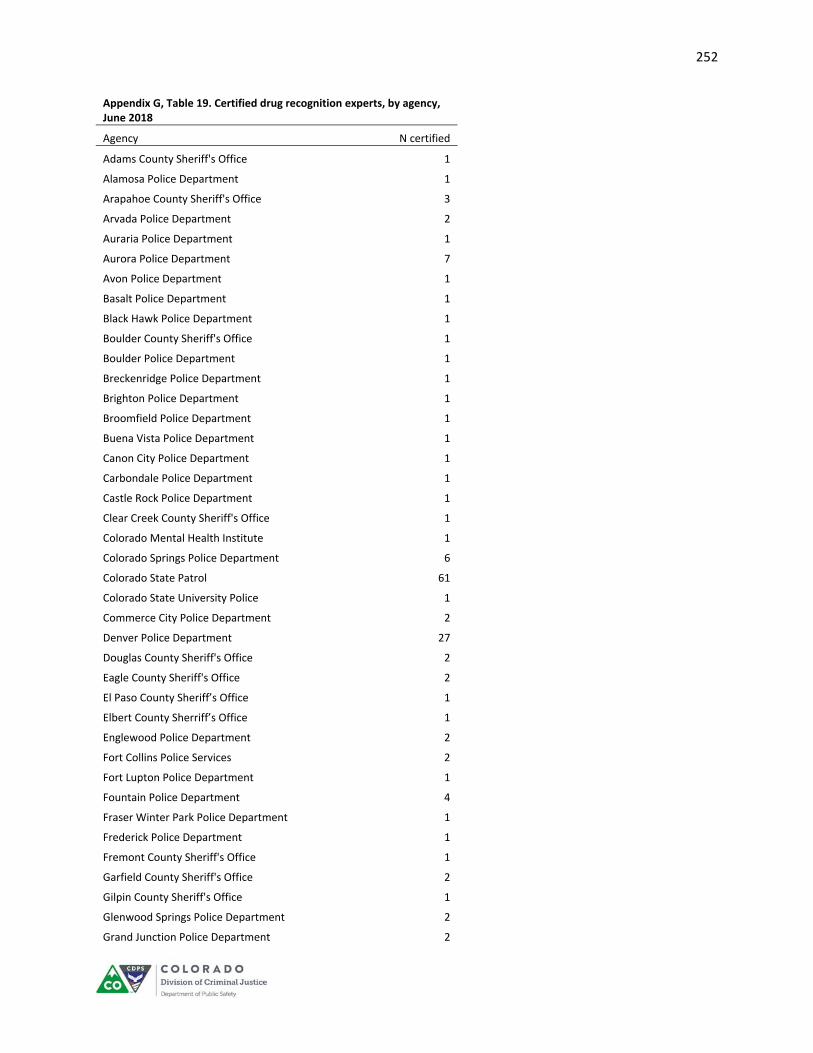
252
Appendix G, Table 19. Certified drug recognition experts, by agency, June 2018
Agency N certified
Adams County Sheriff's Office 1
Alamosa Police Department 1
Arapahoe County Sheriff's Office 3
Arvada Police Department 2
Auraria Police Department 1
Aurora Police Department 7
Avon Police Department 1
Basalt Police Department 1
Black Hawk Police Department 1
Boulder County Sheriff's Office 1
Boulder Police Department 1
Breckenridge Police Department 1
Brighton Police Department 1
Broomfield Police Department 1
Buena Vista Police Department 1
Canon City Police Department 1
Carbondale Police Department 1
Castle Rock Police Department 1
Clear Creek County Sheriff's Office 1
Colorado Mental Health Institute 1
Colorado Springs Police Department 6
Colorado State Patrol 61
Colorado State University Police 1
Commerce City Police Department 2
Denver Police Department 27
Douglas County Sheriff's Office 2
Eagle County Sheriff's Office 2
El Paso County Sheriff’s Office 1
Elbert County Sherriff’s Office 1
Englewood Police Department 2
Fort Collins Police Services 2
Fort Lupton Police Department 1
Fountain Police Department 4
Fraser Winter Park Police Department 1
Frederick Police Department 1
Fremont County Sheriff's Office 1
Garfield County Sheriff's Office 2
Gilpin County Sheriff's Office 1
Glenwood Springs Police Department 2
Grand Junction Police Department 2

253
Appendix G, Table 19. Certified drug recognition experts, by agency, June 2018
Agency N certified
Greeley Police Department 2
Greenwood Village Police Department 1
Gunnison County Sherriff’s Office 1
Gunnison Police Department 1
Jefferson County Sheriff's Office 1
Lafayette Police Department 3
Lakewood Police Department 2
Larimer County Sheriff's Office 1
Logan County Sheriff's Office 1
Longmont Police Department 5
Loveland Police Department 5
Montezuma County Sheriff's Office 1
Montrose Police Department 1
Northglenn Police Department 2
Oak Creek Police Department 1
Pagosa Springs Police Department 1
Parachute Police Department 1
Park County Sheriff's Office 1
Parker Police Department 4
Pitkin County Sheriff's Office 1
Pueblo County Sheriff's Office 3
Pueblo Police Department 2
Rangely Police Department 1
Rifle Police Department 1
Salida Police Department 1
San Miguel County Sheriff's Office 1
Steamboat Springs Police Department 2
Sterling Police Department 1
Telluride Marshal's Office 1
Thornton Police Department 6 U.S. Air Force Academy 10 Security Forces Squadron 1
Vail Police Department 2
Weld County Sheriff's Office 1
Westminster Police Department 2
Wheat Ridge Police Department 1
Woodland Park Police Department 1
Grand Total 214
Source: Colorado Department of Transportation, Drug Recognition Experts Program.

254
APPENDIX H:
MARIJUANA BUSINESS LICENSEES, BY COUNTY
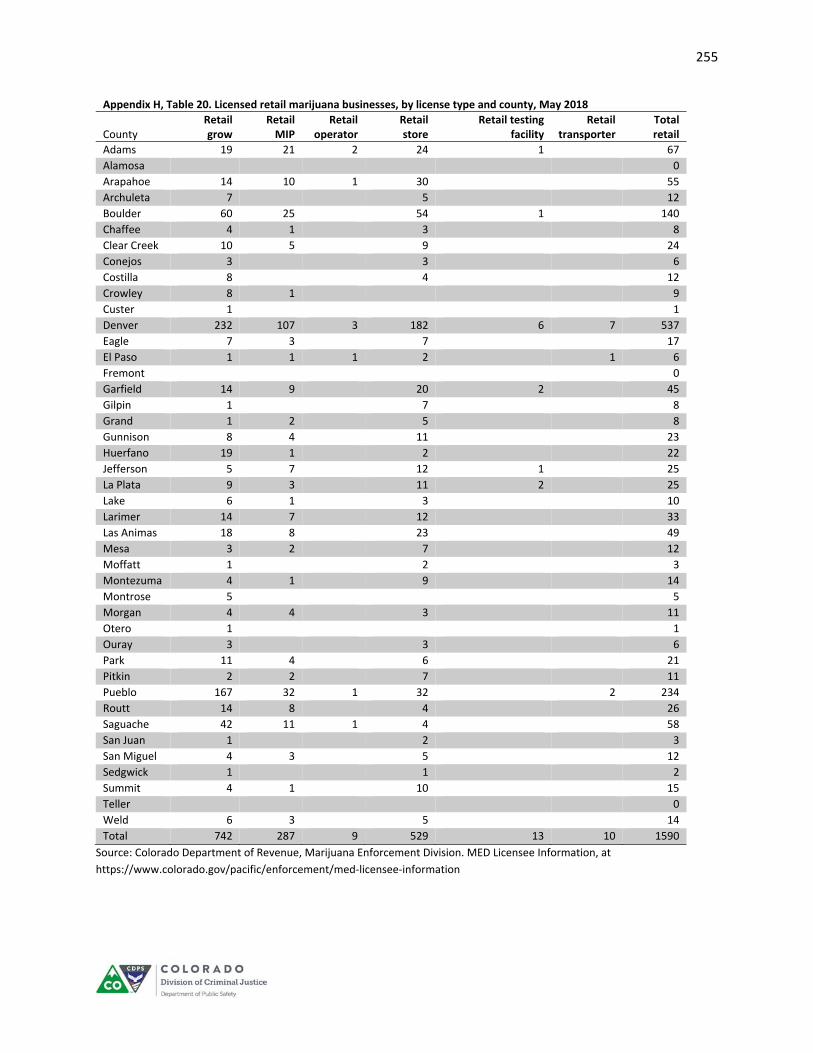
255
Appendix H, Table 20. Licensed retail marijuana businesses, by license type and county, May 2018
County Retail grow
Retail MIP
Retail operator
Retail store
Retail testing facility
Retail transporter
Total retail
Adams 19 21 2 24 1 67
Alamosa 0
Arapahoe 14 10 1 30 55
Archuleta 7 5 12
Boulder 60 25 54 1 140
Chaffee 4 1 3 8
Clear Creek 10 5 9 24
Conejos 3 3 6
Costilla 8 4 12
Crowley 8 1 9
Custer 1 1
Denver 232 107 3 182 6 7 537
Eagle 7 3 7 17
El Paso 1 1 1 2 1 6
Fremont 0
Garfield 14 9 20 2 45
Gilpin 1 7 8
Grand 1 2 5 8
Gunnison 8 4 11 23
Huerfano 19 1 2 22
Jefferson 5 7 12 1 25
La Plata 9 3 11 2 25
Lake 6 1 3 10
Larimer 14 7 12 33
Las Animas 18 8 23 49
Mesa 3 2 7 12
Moffatt 1 2 3
Montezuma 4 1 9 14
Montrose 5 5
Morgan 4 4 3 11
Otero 1 1
Ouray 3 3 6
Park 11 4 6 21
Pitkin 2 2 7 11
Pueblo 167 32 1 32 2 234
Routt 14 8 4 26
Saguache 42 11 1 4 58
San Juan 1 2 3
San Miguel 4 3 5 12
Sedgwick 1 1 2
Summit 4 1 10 15
Teller 0
Weld 6 3 5 14
Total 742 287 9 529 13 10 1590
Source: Colorado Department of Revenue, Marijuana Enforcement Division. MED Licensee Information, at
https://www.colorado.gov/pacific/enforcement/med‐licensee‐information
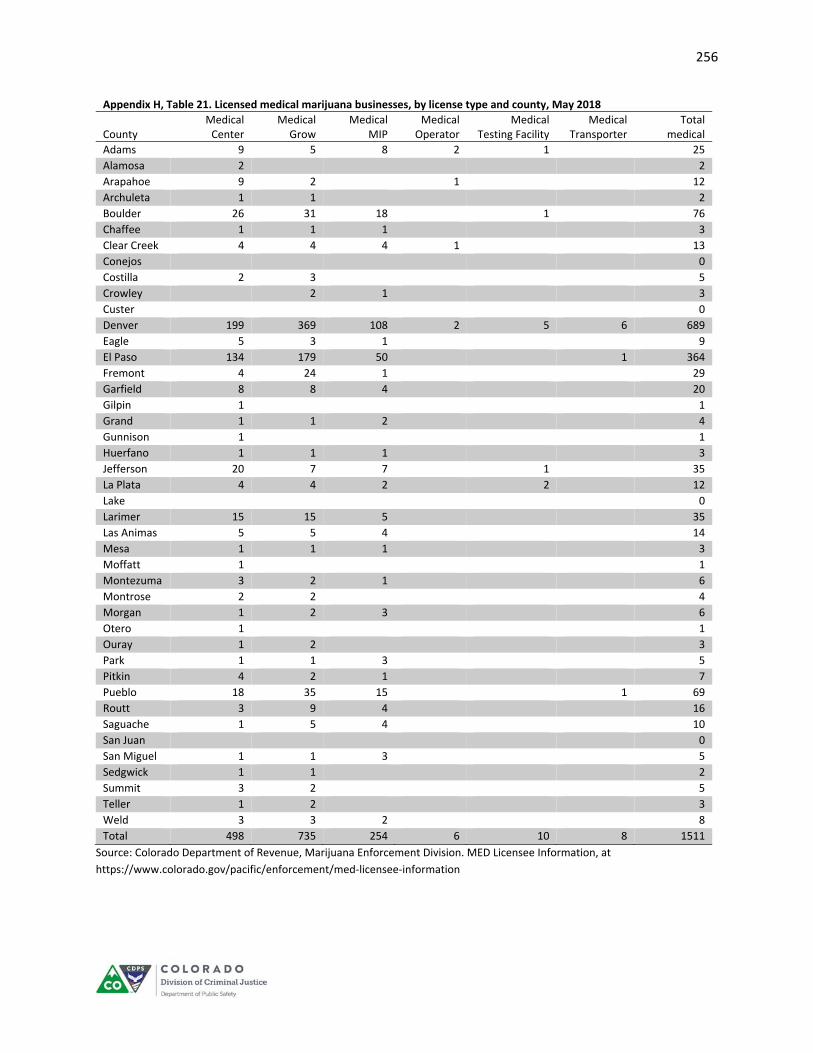
256
Appendix H, Table 21. Licensed medical marijuana businesses, by license type and county, May 2018
County Medical Center
Medical Grow
Medical MIP
Medical Operator
Medical Testing Facility
Medical Transporter
Total medical
Adams 9 5 8 2 1 25
Alamosa 2 2
Arapahoe 9 2 1 12
Archuleta 1 1 2
Boulder 26 31 18 1 76
Chaffee 1 1 1 3
Clear Creek 4 4 4 1 13
Conejos 0
Costilla 2 3 5
Crowley 2 1 3
Custer 0
Denver 199 369 108 2 5 6 689
Eagle 5 3 1 9
El Paso 134 179 50 1 364
Fremont 4 24 1 29
Garfield 8 8 4 20
Gilpin 1 1
Grand 1 1 2 4
Gunnison 1 1
Huerfano 1 1 1 3
Jefferson 20 7 7 1 35
La Plata 4 4 2 2 12
Lake 0
Larimer 15 15 5 35
Las Animas 5 5 4 14
Mesa 1 1 1 3
Moffatt 1 1
Montezuma 3 2 1 6
Montrose 2 2 4
Morgan 1 2 3 6
Otero 1 1
Ouray 1 2 3
Park 1 1 3 5
Pitkin 4 2 1 7
Pueblo 18 35 15 1 69
Routt 3 9 4 16
Saguache 1 5 4 10
San Juan 0
San Miguel 1 1 3 5
Sedgwick 1 1 2
Summit 3 2 5
Teller 1 2 3
Weld 3 3 2 8
Total 498 735 254 6 10 8 1511
Source: Colorado Department of Revenue, Marijuana Enforcement Division. MED Licensee Information, at
https://www.colorado.gov/pacific/enforcement/med‐licensee‐information

257
APPENDIX I:
DISTRIBUTION OF MARIJUANA TAX AND FEE REVENUE, FY 2017‐18 FLOWCHART
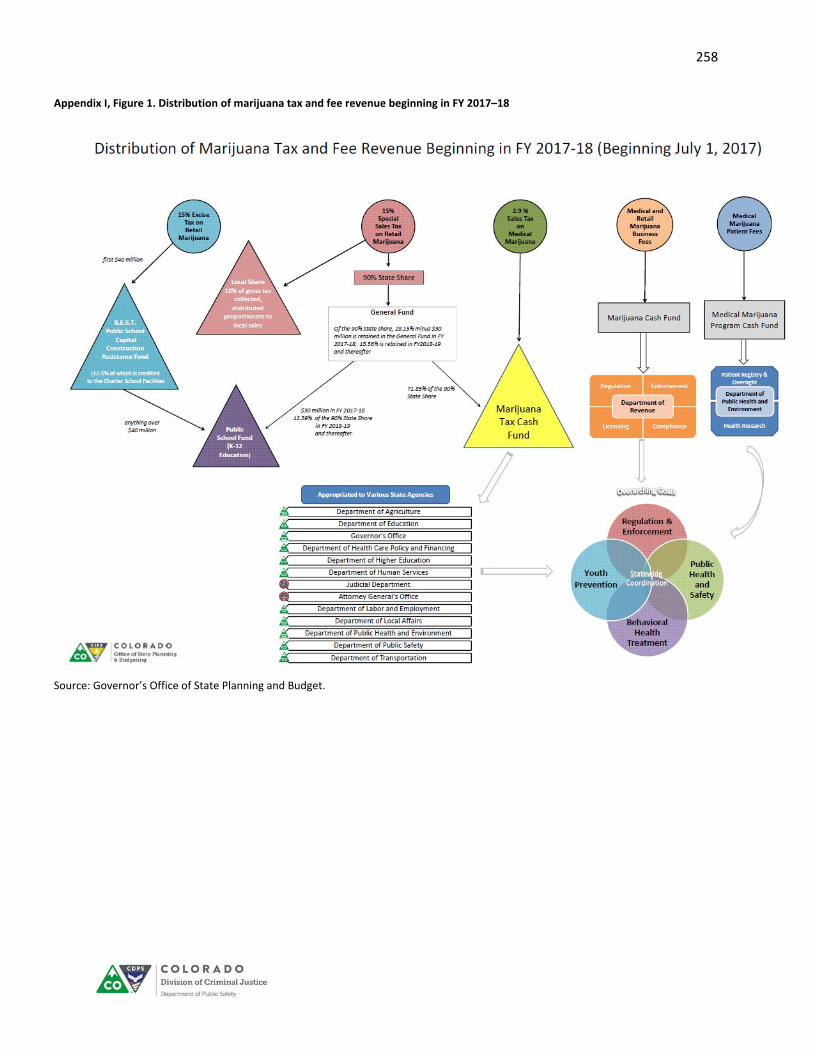
258
Appendix I, Figure 1. Distribution of marijuana tax and fee revenue beginning in FY 2017–18
Source: Governor’s Office of State Planning and Budget.


Office of Research and Statistics Division of Criminal Justice Colorado Department of Public Safety 700 Kipling Street, Suite 1000 Lakewood, CO 80215 https://www.colorado.gov/pacific/dcj-ors