Embed Size (px)
Citation preview
Impacts of landscape resource diversity and availability on bee foraging and fitness Doctoral Thesis for a joint doctoral degree at the Faculty of Sustainability, Leuphana University Lüneburg, Germany and the Faculty of Science, Health, Education and Engineering, University of the Sunshine Coast, Australia Benjamin Felix Kaluza 2016
The dissertation: “Impacts of landscape resource diversity and availability on bee foraging and fitness” Is submitted by: Benjamin Felix Kaluza, born on 17.03.1983 in Coburg, Germany The dissertation is guided by the regulations specified in the “Agreement on a Joint Doctoral Degree Programme” between the Leuphana University Lüneburg, Germany and the University of the Sunshine Coast, Australia, from 13.06.2014. The dissertation is submitted to: the Faculty of Sustainability, Leuphana University Lüneburg, Germany, as well as the Faculty of Science, Health, Education and Engineering, University of the Sunshine Coast, Australia to earn the academic degree of: Doctor of natural science (Dr. rer. nat.; Leuphana) and Doctor of Philosophy (Ph.D., University of the Sunshine Coast) Submitted on: 28.11.2016 Principal doctoral advisor: Dr. Sara Leonhardt (Würzburg, Germany) Supervisor: Prof. Dr. Helen Wallace (Sunshine Coast, Australia) Supervisor: Prof. Dr. Alexandra-Maria Klein (Freiburg, Germany) Reviewer: Prof. Dr. Jörn Fischer (Lüneburg, Germany) Reviewer: Prof. Dr. Jürgen Tautz (Würzburg, Germany) Reviewer: Jean-François Odoux (Surgères, France) Date of disputation: 10.04.2017 Copyright notice Chapters II-V have been either published, are accepted or in preparation for publication in international peer-reviewed journals. The authors hold the copyright of the text and figures. However, the publishers hold the exclusive right to publish or use the material for their purposes. Reprint of any of the materials presented in this thesis requires permission of the publishers and of the author of this thesis. Photographs are copyright of the owners as stated in the caption. Image (next page): the Australian eusocial stingless bee Tetragonula carbonaria. Image by Tobias Smith
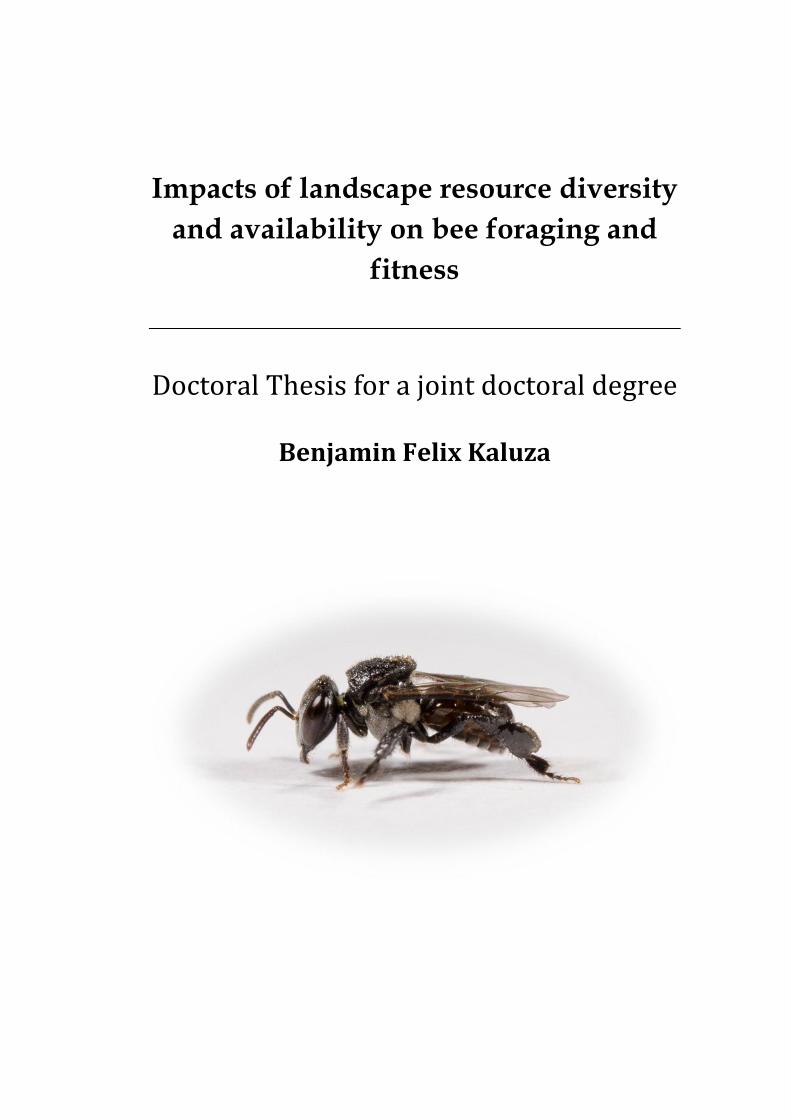
Impacts of landscape resource diversity and availability on bee foraging and fitness Doctoral Thesis for a joint doctoral degree Benjamin Felix Kaluza
_____ II
INCLUDED PUBLICATIONS This thesis is based on the following manuscripts:
1. Benjamin F. Kaluza, Helen Wallace, Tim A. Heard, Alexandra-Maria Klein &
Sara D. Leonhardt (2016): ―Urban gardens promote bee foraging over natural
habitats and plantations‖. Ecology and Evolution 6(5): 1304-1316.
2. Sara D. Leonhardt, Benjamin F. Kaluza, Helen Wallace & Tim A. Heard (2016):
―Resources or landmarks: which factors drive homing success in Tetragonula
carbonaria foraging in natural and disturbed landscapes?‖. Journal of
Comparative Physiology A 202(9): 701-708.
3. Benjamin F. Kaluza, Helen Wallace, Alexander Keller, Tim A. Heard, Bradley
Jeffers, Nora Drescher, Nico Blüthgen & Sara D. Leonhardt (2016): ―Generalist
social bees maximize diversity intake in plant species rich and resource abundant
environments‖. (under revision in: Ecological Monographs)
4. Benjamin F. Kaluza, Helen M. Wallace, Tim A. Heard, Vanessa Minden,
Alexandra-Maria Klein & Sara D. Leonhardt (2016): ―Biodiversity drives social
bee fitness‖. (prepared for submission).
_____ III
ABSTRACT Loss of natural and semi-natural habitat due to increasing human land use for
agriculture and housing has led to widespread declines in bee pollinator diversity and
abundance, which raised global concerns about the stability of pollination services. Bee
population dynamics depend on floral resource diversity and availability in the
surrounding landscape, and loss of plant biodiversity may thus directly impair the
fitness of individual bee species. However, whether and how plant and resource
diversity and availability affect foraging patterns, resource intake, resource quantity and
nutrient quality and ultimately fitness of generalist social bees remains unclear.
In this thesis, we placed hives of the Australian eusocial stingless bee Tetragonula
carbonaria (Apidae, Meliponini) in natural habitat (subtropical forests) and two
landscapes differently altered by humans (suburban gardens and macadamia
plantations), varying in plant species richness, resource abundance and respective
habitat patch size. Foraging patterns and resource intake were compared between
landscapes in different seasons and colony growth and fitness were monitored over two
and a half years.
Bee foraging activity, pollen and sugar intake, diversity of collected pollen and resin
resources, resource quantity (colony food stores), colony fitness (brood volume, queen-
and worker reproduction) and colony growth overwhelmingly increased with plant
species richness in the surrounding habitat. However, plant species richness and thus
bee fitness was highest in gardens, not in natural forests, as bees in gardens benefited
from the continuous floral resource availability of both natural and exotic plants across
seasons. In contrast, foraging rates and success, forager orientation and consequently
colony fitness was largely reduced in plantations. While bees maximized diversity of
collected resources, collecting more diverse resources did however not increase
resource functionality and nutritional quality, which appeared to be primarily driven by
the surrounding plant community in our study. Conversely, individual worker fitness
(body fat and size) was not affected by available resource diversity and abundance,
showing that colonies seem not to increase the nutritional investment in single workers,
but in overall worker population size.
This thesis consequently revealed the outstanding role of plant biodiversity as a key
driver of (social) bee fitness by providing more foraging resources, even when only
small but florally diverse patches are available.
_____ IV
ZUSAMMENFASSUNG Der Verlust von natürlichem oder naturnahem Habitat durch fortschreitende menschliche
Landnutzung für Landwirtschaft oder Besiedlung hat vielerorts zu Einbrüchen der
Bienenvorkommen und -vielfalt geführt, so dass die Stabilität globaler Bestäubungsleistungen
als gefährdet gilt. Da Populationsdynamiken der Bienen stark von Vielfalt und Verfügbarkeit
der Blütenressourcen in Landschaften abhängen, nimmt die Fitness einzelner Bienenarten
vermutlich mit dem Rückgang der Pflanzen-Biodiversität ebenfalls ab. Es ist bislang aber
unbekannt, inwiefern Vielfalt und Verfügbarkeit von Pflanzenressourcen das Sammelverhalten,
den Ressourceneintrag, die Menge und den Nährwert der Ressourcen und schließlich die Fitness
sozialer Bienen beeinflusst.
Für diese Doktorarbeit wurden Bienenstöcke der eusozialen, stachellosen Bienenart
Tetragonula carbonaria (Apidae, Meliponini) in ihrem natürlichen Habitat in Australien
(subtropische Wälder) und zwei weiteren, menschengeformten Landschaften platziert (Gärten in
Vorstädten und Macadamia-Plantagen), wobei sich Pflanzenreichtum, Ressourcenangebot und
Fläche der jeweiligen Landschaftstypen zwischen den Standorten unterschieden. Das
Sammelverhalten der Bienen und ihr Ressourceneintrag wurde zwischen den Landschaften
verglichen und Koloniewachstum und -fitness über zweieinhalb Jahre beobachtet.
Mit ansteigendem Pflanzenreichtum in der Umgebung stiegen Sammelaktivität, Pollen- und
Zuckereintrag, die Vielfalt von Pollen und Harztypen, Ressourcenvorräte im Nest, die
Koloniefitness (Brutvolumen, Königinnen- und Arbeiterinnen-Zucht) und somit Kolonie-
wachstum der Bienen drastisch an. Der höchste Pflanzenreichtum wurde allerdings in Gärten
festgestellt und nicht im natürlichen Habitat (Wälder), und Bienen in Gärten konnten somit
durch alle Jahreszeiten kontinuierlich Blütenressourcen von heimischen und exotischen
Pflanzen nutzen. Im Gegensatz dazu waren in Plantagen Ressourceneintrag,
Orientierungsvermögen und letztlich Koloniefitness deutlich geringer. Während die Bienen
jeweils eine größtmögliche Diversität verschiedener Ressourcen gesammelt haben, stieg die
Ressourcenqualität aber nicht direkt mit der Ressourcendiversität an, sondern wurde stattdessen
vermutlich mehr von der Zusammensetzung der umgebenden Pflanzengemeinschaft beeinflusst.
Die Fitness einzelner Arbeiterinnen (Körperfettanteil und Größe) hing darüber hinaus auch nicht
von dem Ressourcenspektrum ab, was nahe legt, dass einzelne Kolonien nicht die Futterqualität
und –menge bei der Larvenaufzucht reduzieren, sondern stattdessen die Anzahl der produzierten
Arbeiterinnen.
Diese Doktorarbeit belegt damit die herausragende Rolle, die die Pflanzenvielfalt für die
Bienenfitness einnimmt. Höhere Pflanzenvielfalt und somit bessere Ressourcenverfügbarkeit
kann damit das Überleben von Bienen absichern, selbst wenn nur kleine Vegetationsflecken mit
hoher Pflanzendiversität zur Verfügung stehen.
_____ V
CONTENTS I. GENERAL INTRODUCTION 1 1.1. Introduction to pollination 1 1.2. Bees as pollinators 2
1.2.1. Honey bees 2 1.2.2. Wild bees 3 1.2.3. Stingless bees 4
1.3. Declines in wild bees 6 1.3.1. Drivers of wild bee decline 7
1.4. Impacts of landscape change on bees 9 1.5. Foraging for resources 11
1.5.1. Food resource availability 12 1.5.2. Food resource diversity 12 1.5.3. Foraging regulation 14
1.6. Resource quantity and quality 16 1.6.1. Resource quality 17
1.7. Bee fitness 19 1.7.1. Individual fitness 20 1.7.2. Colony fitness 20
1.8. Research scope 22 1.8.1. Model species and study design 22 1.8.2. Research questions 22
1.9. Thesis outline 25 1.10. References 27 II. URBAN GARDENS PROMOTE BEE FORAGING OVER NATURAL HABITATS AND PLANTATIONS 45 2.1. Abstract 45 2.2. Introduction 46 2.3. Methods 48
2.3.1. Study species and landscapes 48 2.3.2. Experimental setup 49 2.3.3. Observations of foraging patterns 51 2.3.4. Resource intake 52 2.3.5. Statistical analysis 53
2.4. Results 54 2.4.1. Foraging patterns 54 2.4.2. Resource intake 56 2.4.3. Influence of weather 59
Contents
_____ VI
2.5. Discussion 59 2.5.1. Foraging patterns 59 2.5.2. Resource intake 61
2.6. Acknowledgments 63 2.7. References 64 2.8. Supplementary material 70 III. RESOURCES OR LANDMARKS: WHICH FACTORS DRIVE HOMING SUCCESS IN TETRAGONULA CARBONARIA FORAGING IN NATURAL AND DISTURBED LANDSCAPES? 79 3.1. Abstract 79 3.2. Introduction 79 3.3. Methods 81
3.3.1. Study species and landscapes 81 3.3.2. Experimental setup 82 3.3.3. Assessing habitat homogeneity 83 3.3.4. Recording homing and foraging success 84 3.3.5. Statistical analysis 85
3.4. Results 87 3.5. Discussion 87 3.6. Acknowledgments 90 3.7. References 90 IV. GENERALIST SOCIAL BEES MAXIMIZE DIVERSITY INTAKE IN PLANT SPECIES RICH AND RESOURCE ABUNDANT ENVIRONMENTS 95 4.1. Abstract 95 4.2. Introduction 96 4.3. Methods 100
4.3.1. Experimental setup 100 4.3.2. Plant richness and resource abundance in landscapes 100 4.3.3. Resource diversity collected by bees 101 4.3.4. Resource functionality 103 4.3.5. Statistical analysis 104
4.4. Results 106 4.4.1. Plant richness and resource abundance in landscapes 106 4.4.2. Resource diversity collected by bees 106 4.4.3. Resource functionality 108
4.5. Discussion 110 4.5.1. Plant richness and resource abundance in landscapes 111 4.5.2. Resource diversity and evenness 112 4.5.3. Resource functionality 114
Contents
_____ VII
4.5.4. Conclusion 117 4.6. Acknowledgements 118 4.7. References 118 4.8. Supplementary material 127 V. BIODIVERSITY DRIVES SOCIAL BEE FITNESS 141 5.1. Abstract 141 5.2. Introduction 142 5.3. Methods 144
5.3.1. Experimental setup 144 5.3.2. Hive reproduction 145 5.3.3. Fitness responses: a) Colony fitness 146 5.3.4. Fitness responses: b) Individual fitness 147 5.3.5. Food quantity and quality 147 5.3.6. Statistical analysis 148
5.4. Results 150 5.4.1. Colony fitness 150 5.4.2. Individual fitness 152
5.5. Discussion 152 5.5.1. Colony fitness 154 5.5.2. Individual fitness 157 5.5.3. Conclusions 158
5.6. Acknowledgments 158 5.7. References 159 5.8. Supplementary material 166 VI. SYNOPSIS 177 6.1. Summary of findings 177 6.2. Stingless bees in macadamia plantations 180 6.3. Urban habitat for bees 183 6.4. Effects of plant biodiversity on social bees 185 6.5. References 189 VII. APPENDIX 194 7.1. Appendix I: GLMMS for Chapter II 194 7.2. Appendix II: plant species list 207 VIII. ACKNOWLEDGEMENTS 243
Contents
_____ VIII
LIST OF FIGURES I. GENERAL INTRODUCTION 1
Figure I.1. Stingless bees and meliponiculture 5
Figure I.2. Resource foraging and storage by Tetragonula carbonaria 18
Figure I.3. Proposed theoretical framework describing resource use of stingless bees 25 II. URBAN GARDENS PROMOTE BEE FORAGING OVER NATURAL HABITATS AND PLANTATIONS 45 Figure II.1. Location of study sites in Australia 50
Figure II.2. Number of foragers per minute in different landscapes 56
Figure II.3. Proportional resource intake in different landscapes 57
Figure II.4. Pollen and sucrose intake in different landscapes 58
Figure II.5. Number of foragers per minute across seasons 74
Figure II.6. Proportional resource intake across seasons 75
Figure II.7. Hive foraging activity, pollen loads and sucrose concentration across seasons 76
Figure II.8. Pollen and sucrose intake across seasons 77 III. RESOURCES OR LANDMARKS: WHICH FACTORS DRIVE HOMING SUCCESS IN TETRAGONULA CARBONARIA FORAGING IN NATURAL AND DISTURBED LANDSCAPES? 79 Figure III.1. Landscape types used to study homing success 82
Figure III.2. Proportion & first arrival of returning bees & foragers 86 IV. GENERALIST SOCIAL BEES MAXIMIZE DIVERSITY INTAKE IN PLANT SPECIES RICH AND RESOURCE ABUNDANT ENVIRONMENTS 95 Figure IV.1. Diversity of collected pollen and resin types in different landscapes 107
Figure IV.2. Functionality & quality of collected resources in different landscapes 109
Figure IV.3. Comparison of pollen colour and morphospecies diversity 130
Figure IV.4. Comparison of pollen colour and genetic diversity 133
Figure IV.5. Diversity of collected pollen types over time in different landscapes 134
Figure IV.6. Antimicrobial actvity of different microorganisms 136
Figure IV.7. Comparison of hive foraging activity and collected resource diversity 137 V. BIODIVERSITY DRIVES SOCIAL BEE FITNESS 141 Figure V.1. Bee hive reproduction over time and in relation to plant species richness 151
Figure V.2. Colony fitness in relation to plant species richness & total food quantity 153
Figure V.3. Proposed mechanisms regulating social bee fitness 156 VI. SYNOPSIS 177
Contents
_____ IX
LIST OF TABLES I. GENERAL INTRODUCTION 1 II. URBAN GARDENS PROMOTE BEE FORAGING OVER NATURAL HABITATS AND PLANTATIONS 45
Table II.1. Results of GLMMs for each response variable 55
Table II.2. Location of study sites and geographic information 70
Table II.3. Correlation matrix of forager numbers and weather variables 72
Table II.4. Results of GLMMs with weather factors included as explanatory variables 73 III. RESOURCES OR LANDMARKS: WHICH FACTORS DRIVE HOMING SUCCESS IN TETRAGONULA CARBONARIA FORAGING IN NATURAL AND DISTURBED LANDSCAPES? 79 Table III.1. Parameters recorded to compare homing success between landscapes 83
Table III.2. Variance explained (R2) for all response variables 87 IV. GENERALIST SOCIAL BEES MAXIMIZE DIVERSITY INTAKE IN PLANT SPECIES RICH AND RESOURCE ABUNDANT ENVIRONMENTS 95 Table IV.1. Plant/tree richness and plant/tree resource abundance in landscapes 106
Table IV.2. Comparison of Landscape model and Richness/abundance model 108
Table IV.3. Factor matrix showing the optimized abundance estimates 127
Table IV.4. Frequency matrix to calculate relative abundance of all plants per study site 128 V. BIODIVERSITY DRIVES SOCIAL BEE FITNESS 141 Table V.1. Bee fitness response explained by the Biodiversity model & Resource model 150
Table V.2. Amino acids in nest pollen 167
Table V.3. Macro- and micro-elements in nest pollen 170
Table V.4. Corellation matrix of fitness variables 173
Table V.5. Models comparison of single variables on hive reproduction 175 VI. SYNOPSIS 177
Contents
_____ X
LIST OF SUPPLEMENTARY MATERIALS I. GENERAL INTRODUCTION 1 II. URBAN GARDENS PROMOTE BEE FORAGING OVER NATURAL HABITATS AND PLANTATIONS 45
SM II.1. Location of study sites and geographic information 70
SM II.2. Influence of daytime 71
SM II.3. Correlation matrix of forager numbers and weather variables 72
SM II.4. Results of generalized linear mixed effect models 73
SM II.5. Foraging patterns and resource intake per season 74 III. RESOURCES OR LANDMARKS: WHICH FACTORS DRIVE HOMING SUCCESS IN TETRAGONULA CARBONARIA FORAGING IN NATURAL AND DISTURBED LANDSCAPES? 79 IV. GENERALIST SOCIAL BEES MAXIMIZE DIVERSITY INTAKE IN PLANT SPECIES RICH AND RESOURCE ABUNDANT ENVIRONMENTS 95 SM IV.1. Calculation of plant resource abundance 127
SM IV.2. Palynological analysis of pollen by microscopy 128
SM IV.3. Pollen DNA meta-barcoding 131
SM IV.4. Variation in pollen diversity across seasons 133
SM IV.5. Antimicrobial activity of resin against individual microbes 135
SM IV.6. Regulation of resource diversity maximization 137 V. BIODIVERSITY DRIVES SOCIAL BEE FITNESS 141 SM V.1. Amino acids, macro- and micro-elements in nest pollen 166
SM V.2. Correlation matrix 173
SM V.3. Selection of tested biodiversity variables 175 VI. SYNOPSIS 177
_____ 1
I. GENERAL INTRODUCTION Bee resource foraging and its consequences for bee fitness and bee declines 1.1. Introduction to pollination
Plant-pollinator interactions are among the most ecologically important plant-animal
relationships (Kearns et al. 1998). Many plants could not set seed and reproduce without
pollinators, pollinators in return would decline without floral rewards, and further
destabilize other species (Kearns et al. 1998; Memmott et al. 2007; Ollerton et al. 2011).
Globally, about 85 % of flowering plant species are pollinated by animals, with the
proportion increasing from temperate zones (78 %) to the tropical regions, where up to
94 % of the plants are animal pollinated (Ollerton et al. 2011).
Pollination by animals is a key ecosystem service. The term ‗ecosystem service‘, popularized in the Millennium Ecosystem Assessment (2005), refers hereby to the
multitude of (free) benefits people obtain from ecosystems (Fisher et al. 2008).
Pollination is important to the sexual reproduction of many crops and thus for food
production, as 87 of the 124 leading global food crops depend or benefit from animal
pollination, and pollination accounts for 35 % of global food production volume (Klein
et al. 2007). Animal pollination further improves quantity and commercial quality of
many crops compared to wind or self-pollination (Bommarco et al. 2012b; Garratt et al.
2014; Klatt et al. 2014). The resulting global economic value of pollination was
estimated to be € 153 billion in 2005 (Gallai et al. 2009). Specifically production of
fruits, vegetables and stimulants (such as coffee) are vulnerable to pollinator decline and
global production could not meet current demand without pollinators. Moreover, global
reliance on pollination (based on pollination dependencies and economic factors, like
producer prices and purchasing power parities) show an increasing trend between 1993-
2009 (Lautenbach et al. 2012). This increased dependence on pollinators is predicted to
increase consumer prices and fuel potential conflicts between pollination services and
other land uses (Aizen et al. 2008; Lautenbach et al. 2012).
Biodiversity is a critical driver of ecosystem functions (e.g. pollination), as it
maintains the stability of ecosystem services and provides insurance against changing
environmental conditions (Loreau et al. 2001). In theory, higher biodiversity can
support pollinator populations, as higher biodiversity provides a greater variety of
I. General introduction
_____ 2
resources to be exploited by consumers (Duffy et al. 2007). Increasing species richness
of primary producers (e.g. flowering plants) could thus enhance biomass and richness of
consumers (Gamfeldt et al. 2005). Multiple species or functional groups in diverse
ecosystems may support the same ecosystem function, thereby increasing the resilience
of the whole system (Yachi and Loreau 1999; Blüthgen and Klein 2011). Moreover, a
greater number of producers and consumers in biodiverse ecosystems results in more
interactions within or across trophic levels which can further stabilize ecosystem
services (Ives et al. 2005; Balvanera et al. 2006). However, the mechanisms by which
biodiversity as central driver affects pollinators in real ecosystems are not fully
understood to date.
1.2. Bees as pollinators 1.2.1. Honey bees
Bees, specifically honey bees (Apis mellifera), are the most economically valuable
pollinators of crops worldwide, and contribute significantly to human food production
(Klein et al. 2007). Honey bees are kept and propagated in managed hives and are the
most widely used pollinators in agriculture (Watanabe 1994). They increase yield in
some animal-pollinated crops by up to 96 % and are often the only commercial solution
to ensure crop pollination (Klein et al. 2007). Furthermore, honey bees also provide
pollination services to many wild plants, although the amount they contribute is
disputed (Potts et al. 2010b; Garibaldi et al. 2013). While honey bees are versatile,
cheap and convenient to keep compared to wild bees, they are not the most effective
pollinators for some crops, such as almond (Bosch and Blas 1994; Brittain et al. 2013b),
watermelon (Kremen et al. 2004) or coffee (Klein et al. 2003; Jha and Vandermeer
2009).
HONEY BEE DECLINE. Today, there is clear evidence for severe regional declines in
domestic honey bee stocks in the USA (59 % loss of colonies between 1947 and 2005)
and Europe (25 % in central Europe between 1985 and 2005), raising substantial
concerns about the future availability of honey bee pollination services (Potts et al.
2010b; vanEngelsdorp and Meixner 2010).
Modern pollination industries are under threat by multiple stressors, some specific to
honey bees. Global trade has accelerated the spread of honey bee pests like parasitic
mites (Varroa jacobsoni, V. destructor and Acarapis woodi; (Watanabe 1994)), the
1.2. Bees as pollinators
_____ 3
small hive beetle (Aethina tumida) and the microsporidian parasite Nosema ceranae
(Klein et al. 2007), that have eliminated wild and feral honey bee colonies in many
regions in Europe and the USA, leaving only those kept by beekeepers (Potts et al.
2010a). Furthermore, beekeeping is an industry in decline, with aging beekeepers in
Europe and North America (Klein et al. 2007; Potts et al. 2010b). Honey bees have
suffered severe losses particularly since 2006-2007 in the USA when a syndrome called
colony collapse disorder (CCD) was first described, with bees simply mysteriously
vanishing from their hives (Oldroyd 2007; vanEngelsdorp et al. 2009). At the same
time, many beekeepers and researchers also documented serious losses of honey bee
colonies in Europe (Decourtye et al. 2010; Genersch et al. 2010). After years of intense
research, there is now a general consensus that pests and pathogens are the single most
important cause of otherwise inexplicable colony losses (Johnson et al. 2009; Genersch
2010; Nazzi and Pennacchio 2014).
Despite the described regional losses and pressing threats in Europe and North
America, the global number of honey bee hives has increased by about 45 % in
1961-2007. However, the proportion of agricultural crops depending on pollinators is
increasing much more rapidly (>300 %) so that demand for pollination services could
outstrip the increase in hive numbers, leaving the dependence of agricultural crop
pollination on a single pollinator species even more worrisome (Aizen and Harder 2009;
Potts et al. 2010a).
1.2.2. Wild bees Social and solitary bees, wasps, flies, beetles, butterflies and moths comprise the vast
majority of the world‘s pollinators (Vanbergen and the Insect Pollinators Initiative
2013). Many wild pollinators are crucial for the pollination of fruit, vegetable, oil, seed
and nut crops (Vanbergen and the Insect Pollinators Initiative 2013; Gill et al. 2016).
Globally, wild insects pollinate crops more effectively than honey bees and thus
enhance crop fruit set independently of honey bee visitation (Garibaldi et al. 2013). Yet
in contrast to managed honey bees, wild pollinators provide crop pollination as a free
ecosystem service.
Bees are the most effective pollinators of many crops and are the most numerous
flower visitors worldwide (Klein et al. 2007; Winfree 2010). Bees are obligate
florivores throughout their life cycle, with both adults and larvae dependent on floral
products, primarily pollen and nectar (Winfree 2010; Nicolson 2011). Wild bees alone,
in this context defined as native social or solitary bees not managed for pollination, can
I. General introduction
_____ 4
fully pollinate crops in some agricultural contexts (Klein et al. 2003; Winfree et al.
2007b).
WILD BEE POLLINATION BENEFIT. Wild bees can further improve crop pollination
when (managed) honey bees are already present: Brittain et al. (2013a) describe within-
tree specialisation of native pollinators in almonds, as well as continued pollination by
native pollinators at high wind speeds, when honey bee foraging ceased. In apple
orchards, honey bees were found to prefer only densely flowering trees, whereas wild
bees visited and pollinated trees more evenly throughout the orchard (Mallinger and
Gratton 2015). More importantly, wild bees can enhance honey bee pollination
effectiveness by directly re-depositing pollen or altering the behaviour of honey bees to
switch between flowers more frequently, providing synergistic pollination effects
(sunflowers: Greenleaf and Kremen 2006; almonds: Brittain et al. 2013b). Wild bees
thus help stabilize pollination services, and visitation and fruit set consequently
decrease when crops are at greater distances from natural habitat of wild bees (Garibaldi
et al. 2011).
Aside from crop pollination, wild bees are of critical importance in natural
ecosystems (Winfree 2010). The importance of wild pollinators dramatically increases
in subtropical and tropical ecosystems, yet most tropical pollination systems remain
poorly studied and management techniques only exist for a small number of non-Apis
taxa (Winfree 2010; Winfree et al. 2011; Garibaldi et al. 2013). It is thus imperative to
include other wild bee taxa in research to secure pollination in subtropical and tropical
environments.
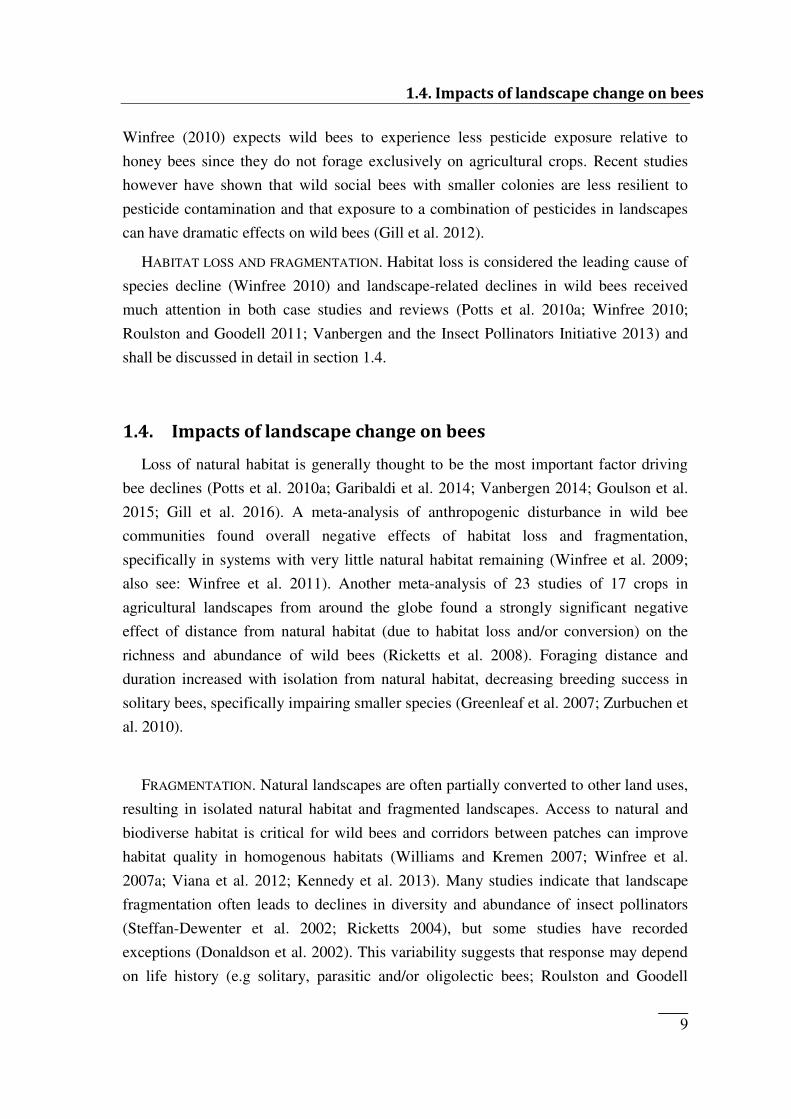
1.2.3. Stingless bees Stingless bees (Hymenoptera: Meliponini) are considered particularly important
pollinators in paleo- and neotropical ecosystems, but knowledge about stingless bees in
pollination is still very patchy (Corlett 2004; Giannini et al. 2014). They are a
monophyletic group of at least 600 described species in 61 genera and inhabit tropical
regions worldwide (Rasmussen and Cameron 2010). At least twelve species of two
genera (Austroplebeia and Tetragonula) are found on the Australian continent (Dollin et
al. 1997; Dollin et al. 2015). Meliponini are highly eusocial bees, i.e. they form colonies
with cooperative brood care, overlapping generations, and colonies are divided into
reproductive (queens, drones) and non-reproductive castes (workers) (Roubik 1989;
Michener 2007).
1.2. Bees as pollinators
_____ 5
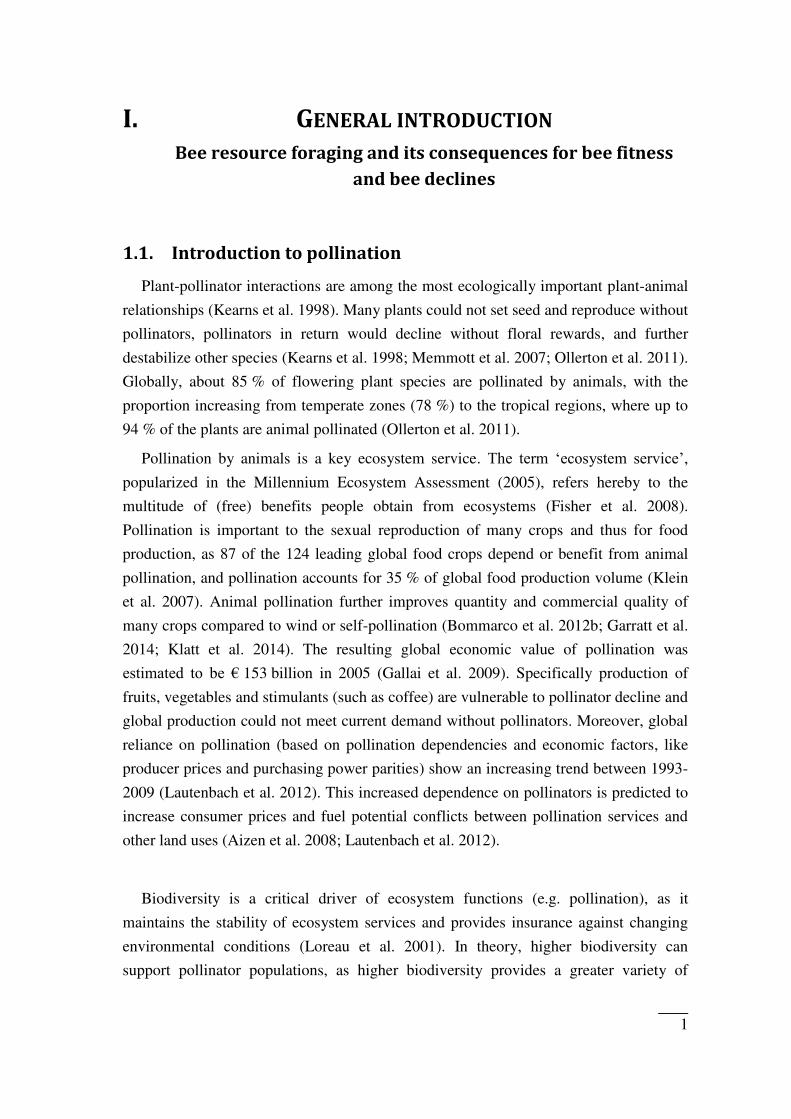
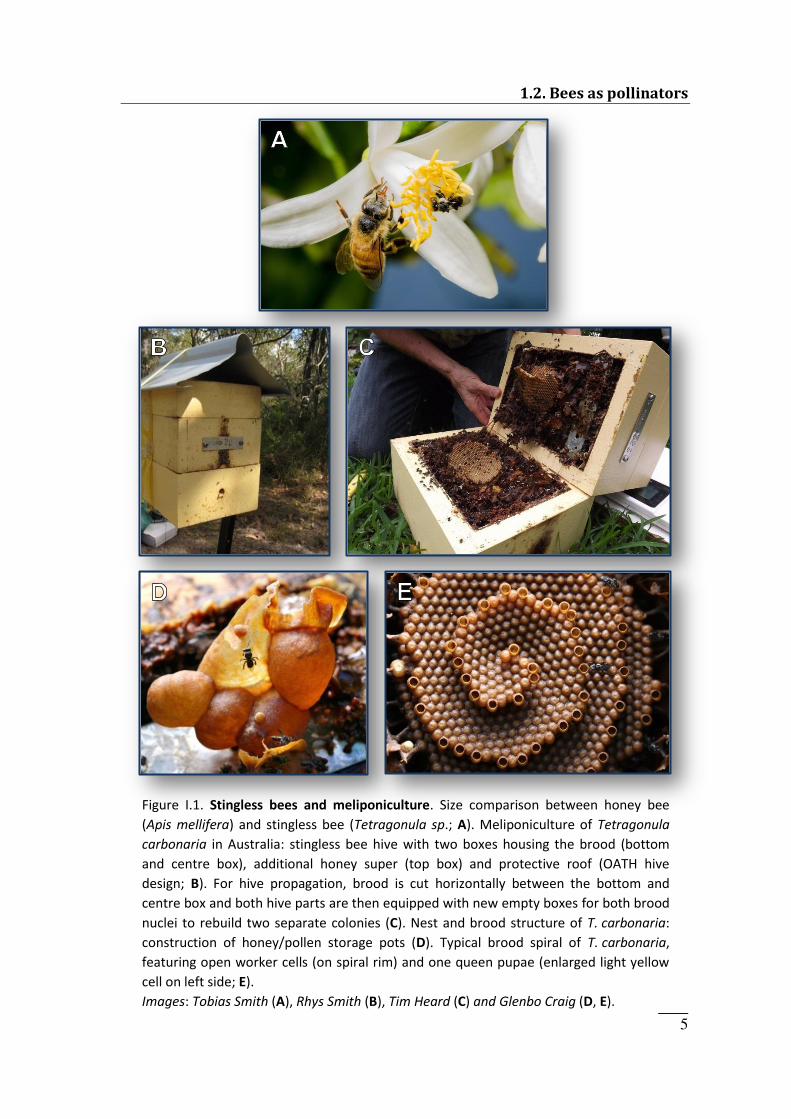
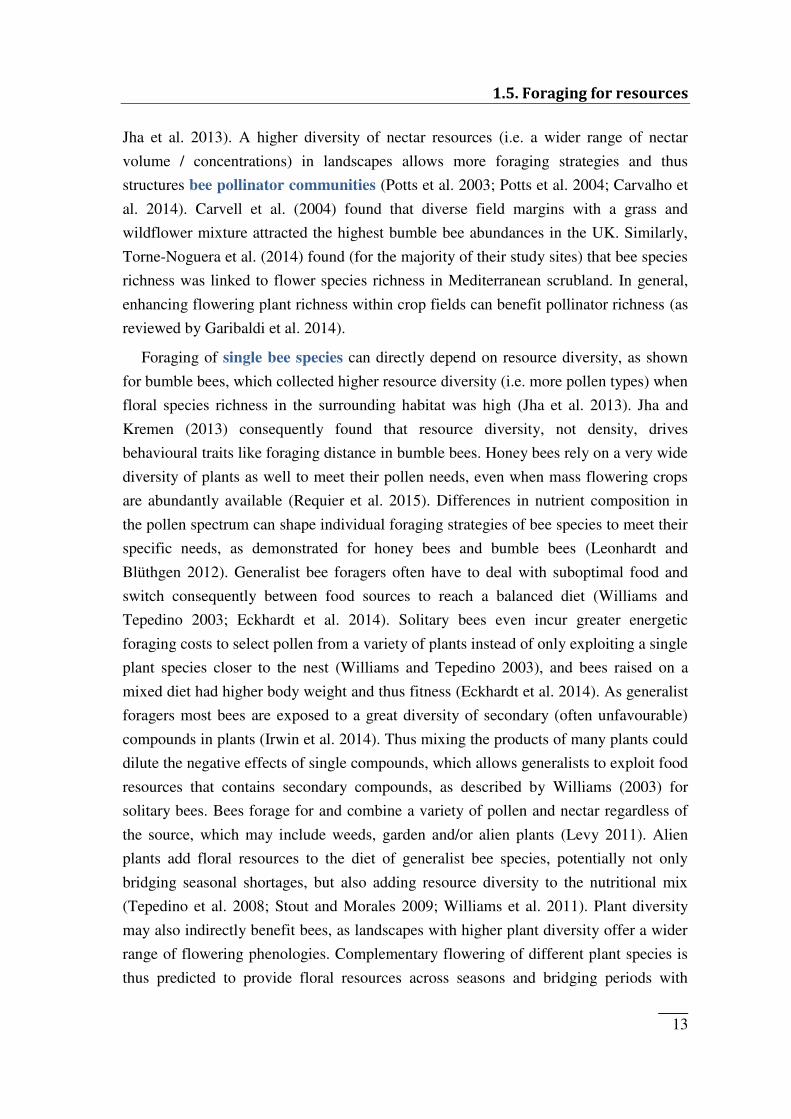
Figure I.1. Stingless bees and meliponiculture. Size comparison between honey bee (Apis mellifera) and stingless bee (Tetragonula sp.; A). Meliponiculture of Tetragonula carbonaria in Australia: stingless bee hive with two boxes housing the brood (bottom and centre box), additional honey super (top box) and protective roof (OATH hive design; B). For hive propagation, brood is cut horizontally between the bottom and centre box and both hive parts are then equipped with new empty boxes for both brood nuclei to rebuild two separate colonies (C). Nest and brood structure of T. carbonaria: construction of honey/pollen storage pots (D). Typical brood spiral of T. carbonaria, featuring open worker cells (on spiral rim) and one queen pupae (enlarged light yellow cell on left side; E). Images: Tobias Smith (A), Rhys Smith (B), Tim Heard (C) and Glenbo Craig (D, E).
I. General introduction
_____ 6
Nests are dug into soil, build in cavities of tree trunks, animal holes or artificial
structures and contain from a few dozen up to several thousand workers (Roubik 1989;
Roubik 2006). Inside the nest, the central brood area is typically surrounded by pots
with stored food resources (honey and pollen, Figure I.1) and is insulated by a layer of
propolis-structure, called batumen (Roubik 2006). Unlike honey bees, bumble bees and
solitary bees of temperate zones, stingless bees form perennial colonies and can
potentially forage in all seasons (Heard 1999; Slaa 2006).
Stingless bees are generalist flower visitors and visit a broad range of plant species
(Ramalho et al. 1990; Biesmeijer et al. 2005; Slaa et al. 2006). Individual foragers tend
to specialize on a single floral species for a certain amount of time, a behavioural trait
commonly referred to as flower constancy, making them valuable pollinators for many
plants (Ramalho et al. 1994; Slaa et al. 2003). As meliponines generally have no sting,
they have been frequently domesticated for honey production and pollination (known as
meliponiculture, Cortopassi-Laurino et al. 2006; Figure I.1). Furthermore, stingless bees
are effective pollinators for at least 18 crops and are a promising option for managed
commercial pollination of field crops and in greenhouses (Heard 1999; Slaa et al. 2006;
Greco et al. 2011). Despite their importance for pollination in natural ecosystems, their
broad distribution and potential use in managed crop pollination, stingless bees and their
role as wild pollinators remain generally under-studied.
1.3. Declines in wild bees Disturbing reports of bee declines in Europe and North America in recent years
received much attention in the media as well as the academic literature, fuelling
environmental and economic concerns that global food security is at risk (Winfree 2010;
Gill et al. 2016). Honey bee population shifts are poorly documented, but even less is
known about recent changes in wild pollinator populations and communities (Potts et al.
2010a). Due to the lack of coordinated monitoring programmes, little is known about
the extent of wild pollinator declines, but studies of bumblebees revealed wide-scale
reductions in range and abundance of several species in North America (Cameron et al.
2011) and shifts from natural bee communities to few dominant bumble bee species in
Sweden (Bommarco et al. 2012a). Curiously, declines of wild bee diversity in Britain
and the Netherlands go hand in hand with declines in plant diversity, highlighting the
importance of plant biodiversity for bees (Biesmeijer et al. 2006). However, most
available data on pollinator declines is from the EU and the USA, but data is scarce for
other parts of the world. It is therefore still debated, whether we face a global pollinator
1.3. Declines in wild bees
_____ 7
decline and thus a global pollination crisis (Ghazoul 2005; Steffan-Dewenter et al.
2005; Ghazoul 2015; Goulson et al. 2015).
Indirect evidence for pollinator declines comes however from studies linking global
anthropogenic landscape changes and bee declines. Winfree et al. (2009) suggests that
agricultural intensification and habitat loss causes widespread declines of pollinator
richness and abundance, which consequently reduces pollination services by wild bees
(Kremen et al. 2002). As most natural landscapes around the world have been
anthropogenically modified, it is likely that pollinator abundance and richness has
declined in many parts of the world (Potts et al. 2010a).
1.3.1. Drivers of wild bee decline Several reviews focused on single or combined stressors of wild pollinators,
presenting a catalogue of potential drivers of pollinator declines. Potts et al. (2010a);
Winfree (2010); and Vanbergen and the Insect Pollinators Initiative (2013) identified
the key drivers of bee decline, which are summed up below. These effects are likely to
interact in ecosystems, and interactions may greatly increase the pressure on pollinators
(González-Varo et al. 2013; Goulson et al. 2015).
CLIMATE CHANGE. Plant and pollinator ranges are shifting, causing changes to
pollinator populations that inhabit the edges of their species‘ climatic range, so they become more susceptible to population declines and even extinction as a result of
climate change (Williams and Osborne 2009; Vanbergen and the Insect Pollinators
Initiative 2013). Climate change may affect plants and pollinators differently, leading to
mismatches between mutualistic partners. Differential migration rates of bees and co-
occurring plants can lead to a spatial dislocation of the pollination process (Schweiger
et al. 2008). Climate driven changes in some bees‘ phenology have been already
observed (Bartomeus et al. 2011) and can lead to a temporal mismatch between bee
emergence and flowering of preferred food plants. Depending on model assumptions,
Memmott et al. (2007) predict phenological changes may lead to up to 17-50 % reduced
floral resources available to all pollinator species.
INTRODUCTION OF ALIEN SPECIES: PLANTS, POLLINATORS. There is empirical evidence
that alien plants are readily integrated into native plant-pollinator networks, and can act
as additional pollen and nectar sources (Tepedino et al. 2008; Stout and Morales 2009;
Potts et al. 2010a; Williams et al. 2011). In Europe, plants introduced as ornamentals
with long flowering seasons, appealing scent or showy flowers may attract native bees
(Potts et al. 2010a; Garbuzov and Ratnieks 2014) or even ensure survival of native bees
I. General introduction
_____ 8
when native nectar resources are scarce (Kleijn and Raemakers 2008). However, several
studies suggest that positive effects might be limited to generalist pollinators (Traveset
and Richardson 2006; Tepedino et al. 2008; Gotlieb et al. 2011), thereby adding to the
list of risk factors for specialists when alien plants replace or outcompete native plants.
Alien pollinators introduced and managed for crop pollination, mainly Apis mellifera,
may impact on native pollinators through competition for resources. Resource overlap
in plant use (up to 90 %) between Apis mellifera and a native Bombus species was
reported from the USA (Thomson 2006), and up to 70 % between one alien and a native
Bombus species in Japan (Matsumura et al. 2004). Aggressive invasive Africanised
honey bees outcompete native stingless bees in Mexico and dominate bee communities,
especially in disturbed habitats (Cairns et al. 2005). However, it remains controversial
whether and to what degree competition actually occurs and impacts native pollinator
communities (Potts et al. 2010a; Winfree 2010).
PESTS AND PATHOGENS. A variety of pathogens affect honey bees, with Varroa
destructor and other parasitic mites being the primary vector for many viruses
(Sammataro et al. 2000; Vanbergen and the Insect Pollinators Initiative 2013).
Translocated managed honey bees may increase the risk of pathogen spread (Stout and
Morales 2009). Although little is known about the inter-specific transfer of pathogens in
bee communities (Woolhouse et al. 2005), there is evidence that the extent and role of
host shifts and shared pathogens has been underestimated, as several studies identified
pathogen transfer within and between populations of managed and wild bee species
(Singh et al. 2010; Cameron et al. 2011). The introduction of pest species (e.g. Varroa
destructor) caused colony declines in wild and managed honey bees in all countries it
has reached (Rosenkranz et al. 2010), but whether and how V. destructor will affect
native wild bee populations in Australia, which is currently free of the parasitic mite,
remains largely unknown (Iwasaki et al. 2015). Other pests (e.g. small hive beetle,
Aethina tumida) posing significant threats to feral and managed honey bees (Neumann
and Elzen 2004) are known to be effectively contained by native bees (Greco et al.
2010).
PESTICIDES. Apis mellifera is used as model in most toxicity studies of pesticides
(Thompson and Maus 2007; Henry et al. 2012), and while growers may avoid spraying
during times of honey bee activity, native bees are often not considered (Winfree 2010).
Pesticides used in agriculture can cause mortality by direct ingestion (Alston et al.
2007), but pesticide exposure may also have sub-lethal effects on honey bees or bumble
bees with implications for foraging, worker mortality, brood development and long term
colony performance (Morandin et al. 2005; Thompson and Maus 2007; Gill et al. 2012).
1.4. Impacts of landscape change on bees
_____ 9
Winfree (2010) expects wild bees to experience less pesticide exposure relative to
honey bees since they do not forage exclusively on agricultural crops. Recent studies
however have shown that wild social bees with smaller colonies are less resilient to
pesticide contamination and that exposure to a combination of pesticides in landscapes
can have dramatic effects on wild bees (Gill et al. 2012).
HABITAT LOSS AND FRAGMENTATION. Habitat loss is considered the leading cause of
species decline (Winfree 2010) and landscape-related declines in wild bees received
much attention in both case studies and reviews (Potts et al. 2010a; Winfree 2010;
Roulston and Goodell 2011; Vanbergen and the Insect Pollinators Initiative 2013) and
shall be discussed in detail in section 1.4.
1.4. Impacts of landscape change on bees Loss of natural habitat is generally thought to be the most important factor driving
bee declines (Potts et al. 2010a; Garibaldi et al. 2014; Vanbergen 2014; Goulson et al.
2015; Gill et al. 2016). A meta-analysis of anthropogenic disturbance in wild bee
communities found overall negative effects of habitat loss and fragmentation,
specifically in systems with very little natural habitat remaining (Winfree et al. 2009;
also see: Winfree et al. 2011). Another meta-analysis of 23 studies of 17 crops in
agricultural landscapes from around the globe found a strongly significant negative
effect of distance from natural habitat (due to habitat loss and/or conversion) on the
richness and abundance of wild bees (Ricketts et al. 2008). Foraging distance and
duration increased with isolation from natural habitat, decreasing breeding success in
solitary bees, specifically impairing smaller species (Greenleaf et al. 2007; Zurbuchen et
al. 2010).
FRAGMENTATION. Natural landscapes are often partially converted to other land uses,
resulting in isolated natural habitat and fragmented landscapes. Access to natural and
biodiverse habitat is critical for wild bees and corridors between patches can improve
habitat quality in homogenous habitats (Williams and Kremen 2007; Winfree et al.
2007a; Viana et al. 2012; Kennedy et al. 2013). Many studies indicate that landscape
fragmentation often leads to declines in diversity and abundance of insect pollinators
(Steffan-Dewenter et al. 2002; Ricketts 2004), but some studies have recorded
exceptions (Donaldson et al. 2002). This variability suggests that response may depend
on life history (e.g solitary, parasitic and/or oligolectic bees; Roulston and Goodell
I. General introduction
_____ 10
2011), bee size (Brosi 2009; Jauker et al. 2013), or on specific characteristics of the
studied landscape (Williams and Kremen 2007). Potts et al. (2010a) however point out
that few studies could show an effect of fragmentation per se, thus addressing habitat
isolation effects independently of habitat area effects. A surprising finding by Winfree
et al. (2007a) was that bee abundance and species richness decreased within continuous
patches of natural forest, but increased in disturbed landscapes.
LOSS OF PLANT BIODIVERSITY. Only very few studies linked loss of plant biodiversity
to bee declines directly (Biesmeijer et al. 2006; Nicholls and Altieri 2013), but observed
parallel declines of pollinators and the diversity of their food plants and highlighted the
role of plant biodiversity in agro-ecosystems for bees. Yet it has been frequently
observed that larger areas of natural or semi-natural habitat support a higher bee
diversity and abundance compared to anthropogenically disturbed landscapes with
lower biodiversity (Söderström et al. 2001; Steffan-Dewenter 2003; Jauker et al. 2012;
Rollin et al. 2013; Woodcock et al. 2013). For example, Woodcock et al. (2013) show
that solitary bee species richness increases with the percentage of semi-natural grassland
and thus a more diverse plant community plant in agricultural dominated landscapes.
Likewise, Rollin et al. (2013) highlight that specifically wild bee abundance depends on
patches of wild flowers (e.g. as weeds in crops or at field margins) or flowering shrubs
in hedgerows around fields. However, many of these studies defined landscape and
habitat categories prior to the study, but did not investigate whether plant diversity
directly influences wild bee richness or abundance. It thus remains unclear, whether
bees can directly benefit from overall greater plant diversity in any landscape type,
which could explain high bee species richness and abundance even in disturbed
landscapes, as observed e.g. by Winfree et al. (2007a).
AGRICULTURE. Anthropogenic agricultural intensification and urbanization are
considered major causes of habitat loss for wild bees, yet they might affect bees
differently (Winfree 2010; Goulson et al. 2015; Gill et al. 2016). Intensified agriculture
generally decreases bee richness and abundance, and negative effects on bees intensified
from organic to conventional farms and from complex to simplified landscape contexts
(Kennedy et al. 2013). While perennial cropping systems may create favourable
landscapes (e.g. orchards with fruit trees), agricultural monocultures with annual
cropping systems (e.g. oilseed rape fields) may only provide a narrow window of
abundant bloom and thus food for bees (Decourtye et al. 2010).
URBANIZATION. The effect of urbanization on bees is however more controversial. A
global review Hernandez et al. (2009) found bee species richness overall to be
negatively affected by urbanization, but cavity-nesters and generalists to benefit in
1.5. Foraging for resources
_____ 11
urban habitats. Increasing urbanization, i.e. greater housing density from suburban areas
to city centres, generally decreases bee diversity and abundance (McKinney 2008; Bates
et al. 2011). Moreover, Ahrné et al. (2009) shows that bumble bee species composition
may change along an urbanization gradient in Sweden, with some bee guilds
disappearing in highly urbanized areas. In contrast, there is some evidence that urban or
suburban gardens can add beneficial landscape elements and provide food resources or
nesting space, which increases bee abundance and density in social and solitary bees
(Gotlieb et al. 2011; Samnegård et al. 2011; Hinners et al. 2012). Only one study so far
demonstrated that bumble bee colony growth is increased in suburbia by greater density
and diversity of floral resources in gardens compared to adjacent farmland (Goulson et
al. 2002).
Most studies investigating urban bees to date are correlative, and Hernandez et al.
(2009) thus point out the need for manipulative studies and incorporation of landscape-
scale assessments in those. There is growing evidence that bee populations are primarily
regulated by food resources in landscapes (Hines and Hendrix 2005; Roulston and
Goodell 2011; Jha and Kremen 2013), but it remains unknown how floral resources
affect foraging patterns and resource intake of bees in urban and agricultural landscapes
compared to natural habitats.
1.5. Foraging for resources While many of the studies mentioned above focus on the overall indirect effect of the
landscape and habitat context, Roulston and Goodell (2011) argue that improving the
knowledge of direct effects will greatly enhance our ability to augment wild bee
population abundance and diversity. Roulston and Goodell (2011) propose that wild bee
populations are regulated by both (a) indirect factors, such as landscape context or
abiotic factors (e.g. see Faria and Gonçalves 2013; Figueiredo-Mecca et al. 2013;
Polatto et al. 2014), and (b) direct factors, like food resources (i.e. pollen and nectar;
Hines and Hendrix 2005; Jha and Kremen 2013), nesting resources (e.g. Ricketts 2004)
and incidental risks. Indirect evidence supporting food resource regulation of bee
populations comes from studies assessing the effect of food resource availability and
diversity on whole bee populations as discussed in sections 1.5.1 and 1.5.2.
I. General introduction
_____ 12
1.5.1. Food resource availability A variety of studies address temporal and spatial availability of floral resources,
reviewed in Decourtye et al. (2010) for agricultural farmland and natural or semi-natural
landscapes. Bumble bee abundance was limited by typical peaks of resource availability
parallel to mass flowering of crops, followed by periods of food limitation in simplified
agricultural landscapes in Sweden (Persson and Smith 2013). A comparable study from
the UK could not identify abundance or diversity effects on bumble bees in field
margins, despite differences in flower resource availability between study sites (Pywell
et al. 2005). On the other hand, solitary bees can benefit from abundant nectar resources
of mass-flowering oilseed rape crops, when this flowering is synchronized with the bees
life-cycle (Jauker et al. 2012). Both bumble bee abundance and diversity were best
predicted by resource availability in grasslands patches in Iowa, USA (Hines and
Hendrix 2005). In an extensive comparison of historical land use change in the UK,
Baude et al. (2016) show that past changes of vegetation and thus nectar resources
concur with trends in pollinator diversity, which explains declines in both in the mid-
twentieth century.
Continuous resource availability over the whole active season is a central driver for
bee populations in temperate forests that provide good springtime floral resources for
bees, but few resources in summertime (Winfree et al. 2007a; Roulston and Goodell
2011). Seasonal gaps in resource supply in late spring to early summer (specifically in
landscapes dominated by intensive agriculture) can strongly disrupt resource foraging of
honey bees and bumble bees and thus impair colony development and reproduction, as
they typically have to build up colonies in this time (Mattila and Otis 2006; Williams et
al. 2012; Requier et al. 2015). Managed honey bees thus use a combination of landscape
elements, ranging from natural or semi-natural forests to artificial crop land and urban
gardens, to forage for a diverse and continuous supply of pollen resources Odoux et al.
(2012). While most studies of food limitations to social bees investigate annual bee
colonies in temperate zones, perennial bee species in the tropics remain less studied, but
Ferreira et al. (2010) showed how seasonally improved food availability in spring and
summer shapes foraging and increases flight activity in perennial bee colonies in the
tropics.
1.5.2. Food resource diversity Bees must find and forage for specific resources in their environment to meet their
nutritional needs, stressing the importance of resource diversity (Jha and Kremen 2013;
1.5. Foraging for resources
_____ 13
Jha et al. 2013). A higher diversity of nectar resources (i.e. a wider range of nectar
volume / concentrations) in landscapes allows more foraging strategies and thus
structures bee pollinator communities (Potts et al. 2003; Potts et al. 2004; Carvalho et
al. 2014). Carvell et al. (2004) found that diverse field margins with a grass and
wildflower mixture attracted the highest bumble bee abundances in the UK. Similarly,
Torne-Noguera et al. (2014) found (for the majority of their study sites) that bee species
richness was linked to flower species richness in Mediterranean scrubland. In general,
enhancing flowering plant richness within crop fields can benefit pollinator richness (as
reviewed by Garibaldi et al. 2014).
Foraging of single bee species can directly depend on resource diversity, as shown
for bumble bees, which collected higher resource diversity (i.e. more pollen types) when
floral species richness in the surrounding habitat was high (Jha et al. 2013). Jha and
Kremen (2013) consequently found that resource diversity, not density, drives
behavioural traits like foraging distance in bumble bees. Honey bees rely on a very wide
diversity of plants as well to meet their pollen needs, even when mass flowering crops
are abundantly available (Requier et al. 2015). Differences in nutrient composition in
the pollen spectrum can shape individual foraging strategies of bee species to meet their
specific needs, as demonstrated for honey bees and bumble bees (Leonhardt and
Blüthgen 2012). Generalist bee foragers often have to deal with suboptimal food and
switch consequently between food sources to reach a balanced diet (Williams and
Tepedino 2003; Eckhardt et al. 2014). Solitary bees even incur greater energetic
foraging costs to select pollen from a variety of plants instead of only exploiting a single
plant species closer to the nest (Williams and Tepedino 2003), and bees raised on a
mixed diet had higher body weight and thus fitness (Eckhardt et al. 2014). As generalist
foragers most bees are exposed to a great diversity of secondary (often unfavourable)
compounds in plants (Irwin et al. 2014). Thus mixing the products of many plants could
dilute the negative effects of single compounds, which allows generalists to exploit food
resources that contains secondary compounds, as described by Williams (2003) for
solitary bees. Bees forage for and combine a variety of pollen and nectar regardless of
the source, which may include weeds, garden and/or alien plants (Levy 2011). Alien
plants add floral resources to the diet of generalist bee species, potentially not only
bridging seasonal shortages, but also adding resource diversity to the nutritional mix
(Tepedino et al. 2008; Stout and Morales 2009; Williams et al. 2011). Plant diversity
may also indirectly benefit bees, as landscapes with higher plant diversity offer a wider
range of flowering phenologies. Complementary flowering of different plant species is
thus predicted to provide floral resources across seasons and bridging periods with
I. General introduction
_____ 14
otherwise low resource availability (Blüthgen and Klein 2011). Experimental studies on
honey bees confirmed that resource diversity of nearby woodland patches provided
continuous resource availability in periods when flowering of field crops ceased (Odoux
et al. 2012; Requier et al. 2015). Thus, bees benefit from a diverse pollen diet, as for
example honey bees reared on a polyfloral diet reared more brood and lived longer
(Höcherl et al. 2012), or lived longer when infected with the microsporidian parasite
Nosema ceranae (Di Pasquale et al. 2013). Polyfloral diets enhance social immunity of
honey bees by increasing glucose oxidase activity, which enables bees to sterilize their
colony and brood food (Alaux et al. 2010). Artificial feeding of bumble bees with
pollen mixtures showed that larval protein efficiency (weight of larvae/protein
consumption) increased (Tasei and Aupinel 2008).
1.5.3. Foraging regulation Besides resource availability and diversity, bee resource foraging is further
influenced and regulated by a multitude of factors, but foraging regulation strongly
depends on the bees‘ specialisation on plant species and life history (Roulston and
Goodell 2011). Here, we focus on eusocial bees (forming colonies with castes of queens
and workers and overlapping adult generations) which are plant generalist (i.e.
polylectic bees foraging and consuming resources from multiple plant species and
families), reviewed in detail in Waser (2006) and Jarau and Hrncir (2009). Resource
collection of bee colonies is not centrally controlled, but foraging decisions of workers
are influenced by internal factors (i.e. on individual level: memory and response
threshold of bees) and external factors, such as colony conditions (i.e. on social level:
colony food storage levels and recruitment) and environmental factors (resource
availability/distribution and abiotic factors. Biesmeijer and de Vries 2001; Slaa et al.
2003; Nieh 2004; Hofstede and Sommeijer 2006; Kitaoka and Nieh 2009; Figueiredo-
Mecca et al. 2013).
FORAGING OF BEE INDIVIDUALS. Individual bees, e.g. novice foragers or scouts, use a
variety of cues during foraging, but predominantly combine visual information (Dyer et
al. 2011; Morawetz and Spaethe 2012) with olfactory cues (Sommerlandt et al. 2014) to
locate resources in environments. Rewarding food sources can trigger associative
learning, and the stimuli experienced before the reward are memorized. Depending on
stimuli combinations, specific regions in the bees‘ brain are activated, which are
associated with short-term or long-term memory (Menzel 1993; Eisenhardt 2014).
Foraging behaviour of individual bees is further modulated by a variety of
1.5. Foraging for resources
_____ 15
neurologically active chemical compounds (Erber et al. 1993), which can increase
learning performance (i.e. octopamine: Scheiner et al. 2006) or impair memory
formation, orientation skills and thus foraging success, as found for neonicotinoid
pesticides (i.e. imidacloprid: Eiri and Nieh 2012; and thiamethoxam: Henry et al. 2012).
SOCIAL REGULATION OF FORAGING. Workers of social bee colonies forage
communally to build up the food reserves of the colony and foragers or scouts are able
to recruit other nest mates to rewarding food patches (von Frisch 1967; Nieh 2004;
Lichtenberg et al. 2010). Bees use scents (e.g. cuticular compounds, trail pheromones),
airborne sounds, mechanical signals (e.g. thoracic vibrations, jostling, waggle dances),
trophallaxis (i.e. food transfer between bees) or a combination of those signals to recruit
nest mates and to generally ensure information flow within the colony (von Frisch 1967;
Crailsheim 1998; Barth et al. 2008; Ayasse and Jarau 2014). Bee colonies can thus
increase recruitment and the total foraging activity as response to low storage levels or
temporary overabundance of resources in the environment (Hofstede and Sommeijer
2006), but often directly enforce specific forager groups, i.e. nectar (Fewell and
Winston 1996) or pollen foragers (Biesmeijer et al. 1999a; Dreller et al. 1999; Fewell
and Bertram 1999).
RESOURCE LOCATION AND HOMING IN LANDSCAPES. Landscape patches differ in
resource quality and quantity, and bees consequently need to locate the most rewarding
food patches. Bees increase foraging rates when encountering high quality resources
and memorize the most profitable resource patches (Cartar 2004; Kitaoka and Nieh
2009). Likewise, finding landscape patches with high resource quantities reduces the
search radius for subsequent foraging trips, thus reducing foraging distances and
duration of foraging trips (Westphal et al. 2006; Danner et al. 2016). To return to the
nest after foraging, bees combine an egocentric and geocentric navigation system, i.e.
they integrate all distances and angles travelled into a home vector and further
memorize landmarks to infer their position in relation to the environment (Menzel et al.
1996; Wehner et al. 1996; Menzel and Greggers 2015). Though the navigational system
of bees is not completely understood, they appear to rely mostly on celestial (i.e.
polarized light in the sky) and terrestrial cues (i.e. landmarks) as navigational vectors to
infer long-range directions and distances (Menzel et al. 1996; Collett and Graham 2015;
Najera et al. 2015). It is therefore still unknown, if landscape structure as such (e.g.
absence of landmarks in uniform agricultural areas) can impair the homing ability of
foragers and thus reduce resource intake of colonies.
ABIOTIC FACTORS. Foraging activity of social bee colonies is strongly influenced by
abiotic factors (e.g. weather conditions) and thus changes depending on daytime (Inoue
I. General introduction
_____ 16
et al. 1985; Heard and Hendrikz 1993; Ferreira et al. 2010; Hilário et al. 2012) or season
(Ferreira et al. 2010; Hilário et al. 2012; Figueiredo-Mecca et al. 2013). Weather
conditions (i.e. temperature, humidity, solar radiation, atmospheric pressure, wind speed
and rainfall) can further influence foraging patterns of bee colonies, thus certain weather
conditions may hinder or facilitate the collection of specific plant resources (Inoue et al.
1985; Oliveira et al. 2012). Response to abiotic variations is often species specific in
tropical bees and thus used to characterize bee communities and ecological niches of
species (Faria and Gonçalves 2013; Polatto et al. 2014). It is however unknown, how
abiotic factors (e.g. temperature, humidity, wind) interact with resource availability in
landscapes in which factor predominantly shapes foraging activity and patterns. To summarize, multiple studies show how bee populations are negatively affected by
decreasing resource availability and diversity in landscapes. Studies investigating whole
bee populations are however typically correlative and provide only indirect evidence.
While foraging of individual bee species can be affected by a variety of factors
(individual forager performance, social foraging regulation, navigation and abiotic
factors) few studies have highlighted the direct influence of resource availability and
diversity on single bee species (e.g. Jha and Kremen 2013; Requier et al. 2015). It has
rarely been shown if individual bee species, under natural conditions, in fact forage on
broader resource diversity and if the collected resource diversity depends on the
landscape type, plant richness or overall resource abundance. Despite known beneficial
effects of polyfloral diets, it is further still unknown if higher resource diversity
collected by bees also leads to higher overall resource quality as well.
1.6. Resource quantity and quality Floral nectar and pollen are the primary food source for most bee species, comprising
both larval and adult diets (Figure I.2). Foraged pollen and nectar are processed (e.g.
into fermented pollen and honey) and stored in the nest by social bees (Brodschneider
and Crailsheim 2010). While nectar is the main energy source for larvae and adult bees,
pollen provides crucial proteins, lipids, vitamins and minerals for brood rearing, but is
scarcely consumed by adult eusocial bees (Brodschneider and Crailsheim 2010;
Nicolson 2011). Resin, although not part of their diet, is collected by honey bees and
tropical stingless bees from tree wounds (Howard 1985; Roubik 1989; Leonhardt and
Blüthgen 2009; Simone-Finstrom and Spivak 2010). Tree resins processed into propolis
1.6. Resource quantity and quality
_____ 17
is used for nest construction and to protect colonies against predators and microbes
(Leonhardt and Blüthgen 2009; Simone-Finstrom and Spivak 2010; Simone-Finstrom
and Spivak 2012; Drescher et al. 2014).
Single consumers often face a trade-off between resource quantity (i.e. amount of
resource) and quality (i.e. functional composition of resource), e.g. nutritional value of
food (grazers: van Beest et al. 2010; nectar foragers: Kim et al. 2011). This is to say,
that consumers need to decide to either forage on larger quantities of poor quality food
resources or pursue higher quality resources, even when their availability is limited.
Bees in particular may have a very specific nutritional target and need to balance protein
and carbohydrate intake to establish a balanced diet (Altaye et al. 2010). In this context,
Höcherl et al. (2012) found that honey bees compensate for the poor quality of a pure
maize diet by consuming a greater quantity of maize pollen. In contrast, solitary bees
opt to improve the quality of their offspring‘s diet and thus their fitness by seeking out
and combining pollen from different plants (Williams 2003; Williams and Tepedino
2003).
1.6.1. Resource quality While resource quantity is usually straightforward to measure, resource quality is
more complex to assess, because bee foraging and fitness can be influenced by a
multitude of quality factors in resources. However, bees often select for specific
resource characteristics, which have been since used by a number of studies to define
quality of pollen, nectar and resin.
POLLEN QUALITY. Bees preferentially forage on pollen with high protein content
(Rasheed and Harder 1997; Robertson et al. 1999; Leonhardt and Blüthgen 2012), and
high amino acid content (Cook et al. 2003; Somme et al. 2015), as shown for honey
bees and multiple bumble bee species. Protein and lipid levels in pollen can vary greatly
between forage plants (Roulston and Cane 2000b; Somerville and Nicol 2006; Somme
et al. 2015), because they depend more on the reproductive traits of a plant species
rather than the plant‘s dependency on animal pollination (Roulston et al. 2000). Pollen
quality of bee collected pollen is thus typically measured as protein content (Génissel et
al. 2002; Tasei and Aupinel 2008; Kitaoka and Nieh 2009), and is overall a good
indicator, as protein content can furthermore positively correlate with contents of other
nutrients (e.g. antioxidants: Di Pasquale et al. 2013; e.g. sterols: Vanderplanck et al.
2014).
I. General introduction
_____ 18
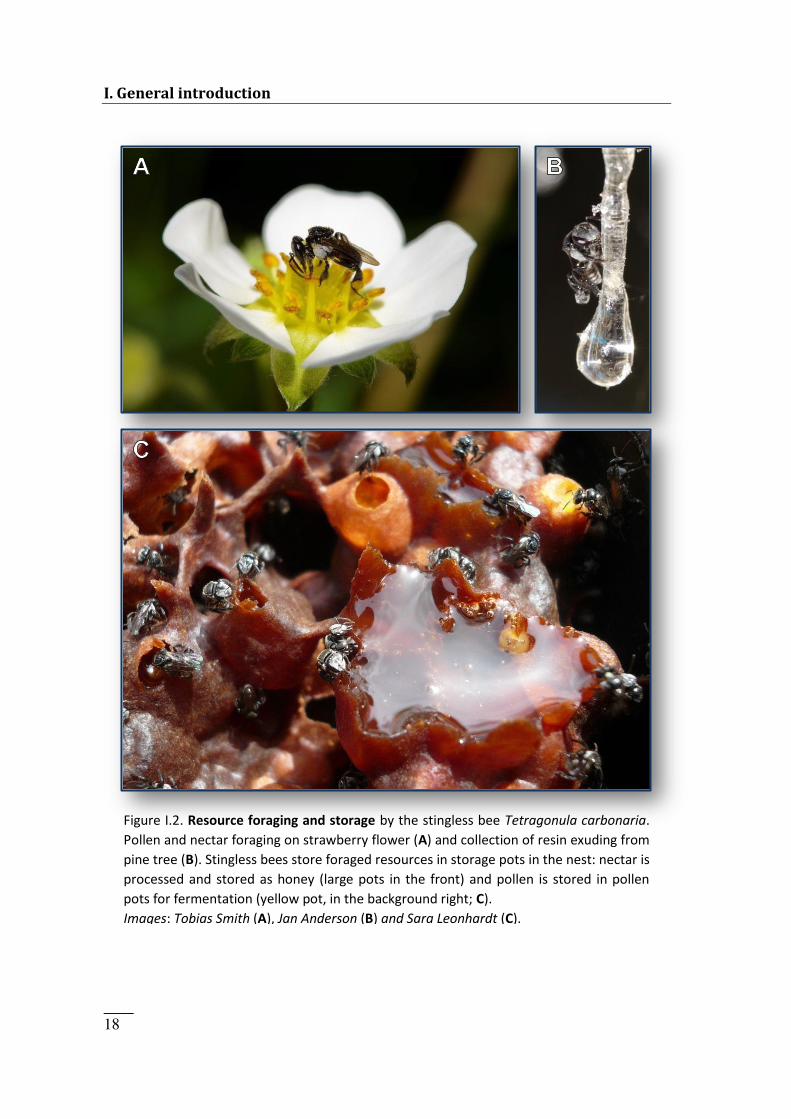
Figure I.2. Resource foraging and storage by the stingless bee Tetragonula carbonaria. Pollen and nectar foraging on strawberry flower (A) and collection of resin exuding from pine tree (B). Stingless bees store foraged resources in storage pots in the nest: nectar is processed and stored as honey (large pots in the front) and pollen is stored in pollen pots for fermentation (yellow pot, in the background right; C). Images: Tobias Smith (A), Jan Anderson (B) and Sara Leonhardt (C).

1.7. Bee fitness
_____ 19
NECTAR QUALITY. Bees can make use of a wide range of nectar concentrations
(Biesmeijer et al. 1999b), but often target a species-specific optimal nectar
concentration, as foraging strategies and handling efficiencies of higher concentrated
nectar differ (Roubik et al. 1995; Kim and Smith 2000). However, highly concentrated
nectar contains more energy and therefore allows bees to maximize energy intake.
Consequently, nectar quality can be evaluated by measuring sugar composition and
concentration (Somme et al. 2015).
RESIN QUALITY. Several bee species collect plant resins, typically from a wide variety
of tree species (Roubik 1989; Bankova et al. 2006; Leonhardt and Blüthgen 2009).
However, stingless bees often show preferences for specific tree species and resin from
these preferred species efficiently repel predators and microbes (Leonhardt and
Blüthgen 2009; Wallace and Lee 2010; Drescher et al. 2014; Massaro et al. 2014).
Though bees use resin for a variety of tasks, the antimicrobial properties of resins are
considered the most important function of resin in bee nests, and measurements of
antimicrobial properties have been consequently used to assess resin quality (Simone-
Finstrom and Spivak 2010; Drescher et al. 2014).
However, of the few studies focusing on the effect of resource quantity and quality of
foraged resources, extremely few linked resource quantity and quality effects to fitness
of single bee species in real ecosystems.
1.7. Bee fitness Like all insects with holometabolic life cycles, the fitness of solitary bees or
individual workers and reproductives of social bees is directly determined by the quality
and quantity of the food resources available during larval development. Solitary bees
complete multiple foraging trips per day and use the resources collected to directly
provision their brood (e.g. Franzen and Larsson 2007). Offspring size (i.e. larval mass)
of solitary bees raised on experimental diets was thus found to directly increase with
protein content in pollen and available sugar in nectar (Roulston and Cane 2000a;
Burkle and Irwin 2009). Social bees however collectively forage and provision brood
and thus exhibit two forms of fitness: first, larvae and workers are affected by the
nutritional quality of food resources (individual fitness), but, in addition, food resources
affect the survival and reproduction of the whole colony as well (colony fitness;
Brodschneider and Crailsheim 2010).
I. General introduction
_____ 20
1.7.1. Individual fitness Very few studies so far have investigated the effect of food resource quality on
fitness of social bee workers, but there is evidence that food resources affect body fat
and size of individual workers. Higher protein content of larval food and, only to a
lesser degree, quantity of provisions increased body weight and size of stingless bees
(Quezada-Euan et al. 2011). Worker size (mass) of social bees is linked to their body fat
(i.e. amount of lipids), as found for bumble bees where smaller bees possess
proportionally more lipids (Couvillon et al. 2011).
Limitations in body fat and size have consequences for foraging and thus the
resource intake of the whole colony. Body size affects flight range in bees, and the
foraging radius of larger bees may be greater, allowing them to exploit resources at
wider ranges (Greenleaf et al. 2007). The relationship between body size and flight
range exists for tropical stingless bees as well (Nagamitsu and Inoue 1998; Araújo et al.
2004). This effect was further observed within single species, where larger individuals
of a colony forage longer distances than their smaller nest mates (Kuhn-Neto et al.
2009). Moreover, variations in body size in stingless bee colonies could be related to
seasonal resource availability and shortages, highlighting that the bees‘ size, and therefore foraging ability, may be affected by their success in maintaining a consistent
diet (Quezada-Euan et al. 2011). Males reared during food shortages have further
smaller bodies and lower sperm counts, directly affecting the colony‘s reproductive capability (Pech-May et al. 2012).
It is however completely unknown, which mechanisms regulate individual fitness of
workers, i.e. resource quantity or resource quality, and if individual fitness of bees is
reduced when the colony faces low resource diversity or abundance conditions.
1.7.2. Colony fitness Studies examining the colony fitness response of bees to resource diversity and
abundance are extremely scarce and all existing knowledge comes from studies of
bumble bees. Wild bumble bee colonies in subalpine meadows in the USA benefited
from greater nectar quantity and produced over twice as many queens when fed with
supplementary nectar (Elliott 2009). In contrast, bumble bee colonies with access to
large amounts of oilseed rape and thus higher resource availability in Germany did not
produce more males or queens (Westphal et al. 2009). In a comparison of bumble bee
nests (placed in conventional farmland, farms with conservation measures and suburban
gardens in the UK), Goulson et al. (2002) found similar numbers of queens and males in
1.7. Bee fitness
_____ 21
nests across landscapes, but greater colony growth rates in gardens due to greater
density and diversity of floral resources. In a large-scale experiment, Williams et al.
(2012) placed bumble bee colonies along a gradient of natural and agricultural
landscapes in the USA and quantified flower densities thus floral resource availability
across seasons. The study showed a positive effect of floral resource availability on the
number of workers and males produced, highlighting the importance of seasonal
resource consistency (Williams et al. 2012). A mechanistic model based on the same
study revealed that queen production increased with floral resources and was higher in
semi-natural areas than in conventional farms (Crone and Williams 2016).
However, all presented studies linking bee fitness to resource availability used
bumble bees as model organisms, which show a specific strongly seasonal life cycle. At
the beginning of spring, new colonies of bumble bees grow by producing cohorts of
workers and accumulate food reserves, until the colonies switch to invest food storages
into the production of males and queens towards the end of the year (Duchateau and
Velthuis 1988; Crone and Williams 2016). This strictly seasonal life cycle makes direct
comparisons between bumble bees and other (tropical) social bees with perennial life
cycles difficult. In contrast, most stingless bee colonies produce gynes (unmated
queens) continuously throughout the year (Roubik 1989; van Veen and Sommeijer
2000; Sommeijer et al. 2003), and mechanisms which trigger or increase queen rearing
in stingless bees are still largely unclear (Tarpy and Gilley 2004). In contrast to bees
with annual life cycles, no study has as yet examined how floral resource diversity and
abundance affect bees with perennial life cycles
Despite the number of studies correlating landscape and bee diversity and
abundance, no study so far has related bee fitness to plant resources available in the
bees‘ habitats and to the quality and quantity of resources collected. Social bees forage
widely for resources, and bee abundance surveys can consequently reflect either true
abundance (population size) or otherwise just forager concentration at rewarding
resource patches (behavioural response; Crone and Williams 2016). Thus, to distinguish
whether higher bee abundances in landscapes actually support stronger populations and
not simply habitat preferences of foraging individuals, we need studies measuring and
comparing the bees‘ fitness response to resource availability and diversity across landscapes. This will allow us to determine driving elements of the pollination crisis, be
it landscape types, plant richness or availability and resource quality or quantity, and
help set a focus for future conservation efforts.
I. General introduction
_____ 22
1.8. Research scope Declines of wild bee populations due to ongoing global habitat loss are raising
concerns about the stability of the free pollination service wild bees provide. Wild bee
populations are known to be strongly regulated by resource availability and diversity in
landscapes. But while wild bee populations thrive in natural and biodiverse landscapes,
it remains largely unclear if positive effects can be attributed to habitat type, plant and
resource diversity, overall resource abundance or constant seasonal resource
availability. Furthermore, it is unknown how resources change (a) foraging patterns and
foraging success of bees, (b) affect foraged resource quantity and quality and (c)
ultimately influence fitness of bee species. It is thus imperative to gain a better
understanding how plant biodiversity, and thus resource diversity and availability, may
affect each single bee species and their fitness.
1.8.1. Model species and study design The eusocial stingless bee Tetragonula carbonaria is a generalist forager and
naturally occurs in North-East Australia. Tetragonula carbonaria is a known seed
disperser of the rainforest tree Corymbia torelliana (Myrtaceae) (Wallace and Trueman
1995; Wallace and Lee 2010) but also an efficient pollinator for macadamia
(Macadamia integrifolia, Proteaceae) (Heard 1994). Since T. carbonaria is (a) present
as native wild bee in the study region, but can (b) also be kept and propagated as a
managed pollinator (Heard and Hendrikz 1993; Heard 2016), it represents an excellent
model species to experimentally test landscape and resource effects on a single native
pollinator.
In this thesis I experimentally placed hives of T. carbonaria in different landscapes,
in their natural habitat (subtropical forests) and two landscapes differently altered by
humans (suburban gardens and macadamia plantations; for detailed description of the
setup see chapter II: sections 2.3.1 & 2.3.2). I monitored foraging patterns and colony
growth across seasons over three years, to understand how resource availability and
diversity in interaction with resource quality and quantity impact on bee fitness.
1.8.2. Research questions Plant diversity, resource diversity and resource availability in landscapes can affect
bee foraging and fitness on many levels. To analyse the complex interactions between
resources, bee foraging and fitness response, I developed a theoretical framework to
1.8. Research scope
_____ 23
predict and test how single factors (e.g. bee foraging patterns) are interlinked, affect
other elements (e.g. quantity and quality of bee collected resources) and ultimately drive
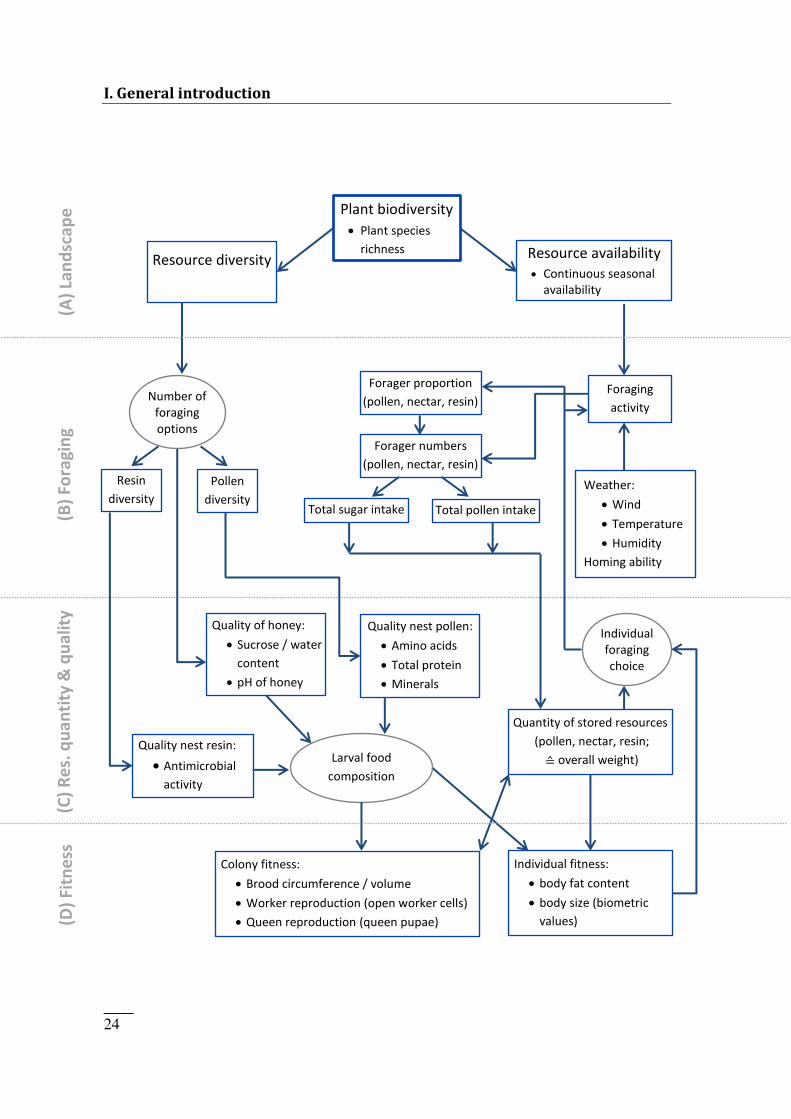
bee fitness. The proposed theoretical framework relates biodiversity variables on (A)
landscape level to (B) foraging patterns of T. carbonaria, to (C) the quality and quantity
of their collected resources and (D) ultimately to colony and individual fitness (Figure
I.3). To step-wise develop a better understanding of the study system, I investigated
different sections of the framework in separate studies (chapter II, IV & V).
In particular I will answer the following research questions:
1. How do different landscapes, anthropogenically altered and natural, influence
foraging patterns, i.e. foraging activity, forager numbers and overall sugar/pollen
resource intake in a generalist social bee?
2. How is bee navigation and homing success (i.e. the proportion of bees returning to
their hive) affected by landscape homogeneity in undisturbed and disturbed
habitats?
3. How does plant richness in different landscapes impact on diversity of collected
resources and does increasing resource diversity positively affect the quality of
collected resources (i.e. pollen and resin)?
4. How do biodiversity factors (landscape patch size, plant resource diversity and
abundance) and quantity or quality of foraged resources affect colony
reproduction and (individual or colony) fitness factors?
I. General introduction
_____ 24
(C) Res
. quantity &
quality
Total sugar intake Forager numbers (pollen, nectar, resin)
Total pollen intake
Forager proportion (pollen, nectar, resin)
Resource diversity Resource availability Continuous seasonal availability
Plant biodiversity Plant species richness
Foraging activity Weather:
Wind Temperature Humidity Homing ability
Individual fitness: body fat content body size (biometric values)
Quantity of stored resources (pollen, nectar, resin; ≙ overall weight)
Individual foraging choice Quality nest pollen: Amino acids Total protein Minerals
Quality of honey: Sucrose / water content pH of honey
Larval food composition
Colony fitness: Brood circumference / volume Worker reproduction (open worker cells) Queen reproduction (queen pupae)
Quality nest resin: Antimicrobial activity
Number of foraging options Pollen diversity Resin diversity
(A) Landscape
(B) For
aging (D) Fit
ness
1.9. Thesis outline
_____ 25
1.9. Thesis outline Chapter II: Urban gardens promote bee foraging over natural habitats and
plantations
In this chapter the overall study design and experimental setup in different
landscapes (plantations, forests and gardens) are described. Foraging patterns of
T. carbonaria colonies were monitored in different seasons over two years. Foraging
activity, the allocation of foragers to different resources (pollen, nectar and resin) and
overall resource intake are compared between landscapes to investigate how landscape
and its interaction with season and weather drive foraging.
Chapter III: Resources or landmarks: which factors drive homing success in
Tetragonula carbonaria foraging in natural and disturbed landscapes?
This chapter investigates how landscape structure and habitat homogeneity can affect
navigation and thus homing success in bees. Bees were marked, released and re-
captured in different landscapes to test whether foraging success is affected by visual
Figure I.3 (previous page). Proposed theoretical framework describing resource use of stingless bees and its effects. Shown are the relationship of landscape, foraging, resource quantity/quality and fitness variables. Elements in squares show variables measured in the experiment, while elements in circles represent theoretical factors, which are assumed to connect measured elements. On landscape level (A), higher plant diversity increases plant resource diversity and provides continuous seasonal resource availability (Blüthgen and Klein 2011; Jha and Kremen 2013). Bee foragers are proposed to collect higher pollen and resin diversity when presented with a higher number of foraging options (B). Foraging activity of colonies is expected to increase with greater resource availability but depend on weather conditions (Ferreira et al. 2010). Foragers respond to both resource availability and the olo ies’ resource needs by targeting pollen, nectar or resin collection, which is reflected in a greater proportion of foragers returning with this resource (Leonhardt et al. 2014). Higher foraging activity, in interaction with forager proportions, results in higher pollen, nectar or resin forager numbers respectively and consequently influences sugar and pollen intake of colonies. Nutritional quality or functionality of resources stored in the hive (pollen, honey and resin) is proposed to increase with the number of available foraging choices or collected pollen/resin diversity (C). Quantity of resources stored in the nest increases with higher resource intake and in turn influences foraging choices (Hofstede and Sommeijer 2006). Higher quality of stored honey, resin and pollen is expected to influence larval food composition and ultimately colony and individual fitness (D). In addition, overall resource quantity is proposed to influence fitness measures of colony and individual fitness.
I. General introduction
_____ 26
landmarks. The proportion of bees and nectar foragers returning to their hives as well as
the earliest time bees and foragers returned are compared between natural forests with
few landmarks but large proportions of vegetation cover, and gardens and plantations as
disturbed landscapes with many landmarks but fragmented vegetation cover.
Chapter IV: Generalist social bees maximize diversity intake in plant species rich
and resource abundant environments
This chapter aims to investigate in a general sense whether and how biodiverse
environments can benefit individual ecosystem members by providing a higher diversity
of resources to choose from. To test whether bee consumers (actively or passively)
maximize resource diversity intake, the diversity of bee collected resources of
T. carbonaria (pollen and resin) was measured in different habitats varying in plant
species richness and associated resource abundance (plantations, forests and gardens).
Secondly, plant species richness, resource abundance and diversity of collected
resources are related to nutritional quality and antimicrobial activity of resources to
learn whether decreased resource diversity impairs resource quality.
Chapter V: Biodiversity drives social bee fitness
This chapter studies how plant resource diversity and abundance can affect fitness of
generalist social bees. Colony growth and fitness of T. carbonaria in relation to plant
species richness and resource abundance as well as to patch sizes of various landscape
types (plantation forests and gardens) was monitored over two years. To elucidate the
mechanisms underlying biodiversity effects on bee fitness, the influence of quantity and
quality of food collected by colonies on colony reproduction, colony fitness (brood
volume, queen- and worker reproduction) and individual fitness (worker fat content and
size) is investigated.
1.10. References
_____ 27
1.10. References Ahrné, K., J. Bengtsson and T. Elmqvist (2009). "Bumble bees (Bombus spp) along a gradient
of increasing urbanization". Plos One, 4(5): e5574.
Aizen, M.A., L.A. Garibaldi, S.A. Cunningham and A.M. Klein (2008). "Long-term global
trends in crop yield and production reveal no current pollination shortage but increasing
pollinator dependency". Current Biology 18: 1572-1575.
Aizen, M.A. and L.D. Harder (2009). "The global stock of domesticated honey bees is growing
slower than agricultural demand for pollination". Current Biology, 19: 915-918.
Alaux, C., F. Ducloz, D. Crauser and Y. Le Conte (2010). "Diet effects on honeybee
immunocompetence". Biology Letters: doi: 10.1098/rsbl.2009.0986.
Alston, D.G., V.J. Tepedino, B.A. Bradley, T.R. Toler, T.L. Griswold and S.M. Messinger
(2007). "Effects of the insecticide phosmet on solitary bee foraging and nesting in
orchards of Capitol Reef National Park, Utah". Environmental Entomology, 36(4): 811-
816.
Altaye, S.Z., C.W.W. Pirk, R.M. Crewe and S.W. Nicolson (2010). "Convergence of
carbohydrate-biased intake targets in caged worker honeybees fed different protein
sources". Journal of Experimental Biology, 213(19): 3311-3318.
Araújo, E.D., M. Costa, J. Chaud-Netto and H.G. Fowler (2004). "Body size and flight distance
in stingless bees (Hymenoptera: Meliponini): inference of flight range and possible
ecological implications". Brazilian Journal of Biology, 64: 563-568.
Ayasse, M. and S. Jarau (2014). "Chemical ecology of bumble bees". Annual Review of
Entomology, 59(1): 299-319.
Balvanera, P., A.B. Pfisterer, N. Buchmann, J.-S. He, T. Nakashizuka, D. Raffaelli and B.
Schmid (2006). "Quantifying the evidence for biodiversity effects on ecosystem
functioning and services". Ecology Letters, 9(10): 1146-1156.
Bankova, V., M. Popova and B. Trusheva (2006). "Plant sources of propolis: an update from a
chemist's point of view". Natural Product Communications, 1(11): 1023-1028.
Barth, F.G., M. Hrncir and S. Jarau (2008). "Signals and cues in the recruitment behavior of
stingless bees (Meliponini)". Journal of Comparative Physiology A, 194(4): 313-327.
Bartomeus, I., J.S. Ascher, D. Wagner, B.N. Danforth, S. Colla, S. Kornbluth and R. Winfree
(2011). "Climate-associated phenological advances in bee pollinators and bee-pollinated
plants". Proceedings of the National Academy of Sciences of the United States of
America, 108(51): 20645-20649.
Bates, A.J., J.P. Sadler, A.J. Fairbrass, S.J. Falk, J.D. Hale and T.J. Matthews (2011).
"Changing bee and hoverfly pollinator assemblages along an urban-rural gradient". Plos
One, 6(8): e23459.
I. General introduction
_____ 28
Baude, M., W.E. Kunin, N.D. Boatman, S. Conyers, N. Davies, M.A.K. Gillespie, (...) J.
Memmott (2016). "Historical nectar assessment reveals the fall and rise of floral
resources in Britain". Nature, 530(7588): 85-88.
Biesmeijer, J.C., M. Born, S. Lukacs and M.J. Sommeijer (1999a). "The response of the
stingless bee Melipona beecheii to experimental pollen stress, worker loss and different
levels of information input". Journal of Apicultural Research, 38(1-2): 33-41.
Biesmeijer, J.C. and H. de Vries (2001). "Exploration and exploitation of food sources by social
insect colonies: a revision of the scout-recruit concept". Behavioral Ecology and
Sociobiology, 49(2-3): 89-99.
Biesmeijer, J.C., S.P.M. Roberts, M. Reemer, R. Ohlemuller, M. Edwards, T. Peeters, (...) W.E.
Kunin (2006). "Parallel declines in pollinators and insect-pollinated plants in Britain
and the Netherlands". Science, 313(5785): 351-354.
Biesmeijer, J.C., E.J. Slaa, M.S.d. Castro, B.F. Viana, A.d.M.P. Kleinert and V.L. Imperatriz-
Fonseca (2005). "Connectance of Brazilian social bee: food plant networks is
influenced by habitat, but not by latitude, altitude or network size". Biota Neotropica, 5:
85-93.
Biesmeijer, J.C., M. Smeets, J.A.P. Richter and M.J. Sommeijer (1999b). "Nectar foraging by
stingless bees in Costa Rica: botanical and climatological influences on sugar
concentration of nectar collected by Melipona". Apidologie, 30(1): 43-55.
Blüthgen, N. and A.M. Klein (2011). "Functional complementarity and specialisation: Why
biodiversity is important in plant-pollinator interactions.". Basic and Applied Ecology,
12: 282-291.
Bommarco, R., O. Lundin, H.G. Smith and M. Rundlöf (2012a). "Drastic historic shifts in
bumble-bee community composition in Sweden". Proceedings of the Royal Society B:
Biological Sciences, 279(1727): 309-315.
Bommarco, R., L. Marini and B.E. Vaissière (2012b). "Insect pollination enhances seed yield,
quality, and market value in oilseed rape". Oecologia, 169(4): 1025-1032.
Bosch, J. and M. Blas (1994). "Foraging behavior and pollinating efficiency of Osmia cornuta
and Apis mellifera on almond (Hymenoptera, Megachilidae and Apidae)". Applied
Entomology and Zoology, 29(1): 1-9.
Brittain, C., C. Kremen and A.M. Klein (2013a). "Biodiversity buffers pollination from changes
in environmental conditions". Global Change Biology, 19(2): 540-547.
Brittain, C., N. Williams, C. Kremen and A.M. Klein (2013b). "Synergistic effects of non-Apis
bees and honey bees for pollination services". Proceedings of the Royal Society B:
Biological Sciences, 280(1754).
Brodschneider, R. and K. Crailsheim (2010). "Nutrition and health in honey bees". Apidologie,
41(3): 278-294.
1.10. References
_____ 29
Brosi, B.J. (2009). "The effects of forest fragmentation on euglossine bee communities
(Hymenoptera: Apidae: Euglossini)". Biological Conservation, 142(2): 414-423.
Burkle, L. and R. Irwin (2009). "Nectar sugar limits larval growth of solitary bees
(Hymenoptera: Megachilidae)". Environmental Entomology, 38(4): 1293-1300.
Cairns, C.E., R. Villanueva-Gutierrez, S. Koptur and D.B. Bray (2005). "Bee populations, forest
disturbance, and africanization in Mexico". Biotropica, 37(4): 686-692.
Cameron, S.A., J.D. Lozier, J.P. Strange, J.B. Koch, N. Cordes, L.F. Solter and T.L. Griswold
(2011). "Patterns of widespread decline in North American bumble bees". Proceedings
of the National Academy of Sciences of the United States of America, 108(2): 662-667.
Cartar, R.V. (2004). "Resource tracking by bumble bees: responses to plant-level differences in
quality". Ecology, 85(10): 2764-2771.
Carvalho, D.M., S.J. Presley and G.M.M. Santos (2014). "Niche overlap and network
specialization of flower-visiting bees in an agricultural system". Neotropical
Entomology, 43(6): 489-499.
Carvell, C., W.R. Meek, R.F. Pywell and M. Nowakowski (2004). "The response of foraging
bumblebees to successional change in newly created arable field margins". Biological
Conservation, 118(3): 327-339.
Collett, Thomas S. and P. Graham (2015). "Insect navigation: do honeybees learn to follow
highways?". Current Biology, 25(6): R240-R242.
Cook, S.M., C.S. Awmack, D.A. Murray and I.H. Williams (2003). "Are honey bees' foraging
preferences affected by pollen amino acid composition?". Ecological Entomology,
28(5): 622-627.
Corlett, R.T. (2004). "Flower visitors and pollination in the Oriental (Indomalayan) region".
Biological Reviews, 79(3): 497-532.
Cortopassi-Laurino, M., V.L. Imperatriz-Fonseca, D.W. Roubik, A. Dollin, T. Heard, I. Aguilar,
(...) P. Nogueira-Neto (2006). "Global meliponiculture: challenges and opportunities".
Apidologie, 37(2): 275.
Couvillon, M.J., J.M. Jandt, J. Bonds, B.R. Helm and A. Dornhaus (2011). "Percent lipid is
associated with body size but not task in the bumble bee Bombus impatiens". Journal of
Comparative Physiology A, 197(11): 1097-1104.
Crailsheim, K. (1998). "Trophallactic interactions in the adult honeybee (Apis mellifera L.)".
Apidologie, 29(1-2): 97-112.
Crone, E.E. and N.M. Williams (2016). "Bumble bee colony dynamics: quantifying the
importance of land use and floral resources for colony growth and queen production".
Ecology Letters, 19(4): 460-468.
I. General introduction
_____ 30
Danner, N., A.M. Molitor, S. Schiele, S. Härtel and I. Steffan-Dewenter (2016). "Season and
landscape composition affect pollen foraging distances and habitat use of honey bees".
Ecological Applications, 26(6): 1920-1929.
Decourtye, A., E. Mader and N. Desneux (2010). "Landscape enhancement of floral resources
for honey bees in agro-ecosystems". Apidologie, 41(3): 264-277.
Di Pasquale, G., M. Salignon, Y. Le Conte, L.P. Belzunces, A. Decourtye, A. Kretzschmar, (...)
C. Alaux (2013). "Influence of pollen nutrition on honey bee health: do pollen quality
and diversity matter?". Plos One, 8(8): e72016.
Dollin, A.E., L.J. Dollin and C. Rasmussen (2015). "Australian and New Guinean stingless bees
of the genus Austroplebeia Moure (Hymenoptera: Apidae)—a revision". Zootaxa,
4047(1): 001-073.
Dollin, A.E., L.J. Dollin and S.F. Sakagami (1997). "Australian stingless bees of the genus
Trigona (Hymenoptera : Apidae)". Invertebrate Taxonomy, 11(6): 861-896.
Donaldson, J., I. Nanni, C. Zachariades, J. Kemper and J.D. Thompson (2002). "Effects of
habitat fragmentation on pollinator diversity and plant reproductive success in
renosterveld shrublands of South Africa". Conservation Biology, 16(5): 1267-1276.
Dreller, C., E.R. Page Jr. and K.M. Fondrk (1999). "Regulation of pollen foraging in honeybee
colonies: effects of young brood, stored pollen, and empty space". Behavioral Ecology
and Sociobiology, 45(3): 227-233.
Drescher, N., H.M. Wallace, M. Katouli, C.F. Massaro and S.D. Leonhardt (2014). "Diversity
matters: how bees benefit from different resin sources". Oecologia, 176(4): 943-953.
Duchateau, M.J. and H.H.W. Velthuis (1988). "Development and reproductive strategies in
Bombus terrestris colonies". Behaviour, 107(3): 186-207.
Duffy, J.E., B.J. Carinale, K.E. France, P.B. McIntyre, E. Thebault and M. Loreau (2007). "The
functional role of biodiversity in ecosystems: incorporating trophic complexity".
Ecology Letters, 10(6): 522-538.
Dyer, A.G., A.C. Paulk and D.H. Reser (2011). "Colour processing in complex environments:
insights from the visual system of bees". Proceedings of the Royal Society B: Biological
Sciences, 278(1707): 952-959.
Eckhardt, M., M. Haider, S. Dorn and A. Muller (2014). "Pollen mixing in pollen generalist
solitary bees: a possible strategy to complement or mitigate unfavourable pollen
properties?". Journal of Animal Ecology, 83(3): 588-597.
Eiri, D.M. and J.C. Nieh (2012). "A nicotinic acetylcholine receptor agonist affects honey bee
sucrose responsiveness and decreases waggle dancing". Journal of Experimental
Biology, 215(12): 2022-2029.
Eisenhardt, D. (2014). "Molecular mechanisms underlying formation of long-term reward
memories and extinction memories in the honeybee (Apis mellifera)". Learning &
Memory, 21(10): 534-542.
1.10. References
_____ 31
Elliott, S.E. (2009). "Surplus nectar available for subalpine bumble bee colony growth".
Environmental Entomology, 38(6): 1680-1689.
Erber, J., P. Kloppenburg and A. Scheidler (1993). "Neuromodulation by serotonin and
octopamine in the honeybee: behaviour, neuroanatomy and electrophysiology".
Experientia, 49(12): 1073-1083.
Faria, L. and R. Gonçalves (2013). "Abiotic correlates of bee diversity and composition along
eastern Neotropics". Apidologie, 44(5): 547-562.
Ferreira, N.T., B. Blochtein and J.F. de Moraes (2010). "Seasonal flight and resource collection
patterns of colonies of the stingless bee Melipona bicolor schencki Gribodo (Apidae,
Meliponini) in an Araucaria forest area in southern Brazil". Revista Brasileira De
Entomologia, 54(4): 630-636.
Fewell, H.J. and M.S. Bertram (1999). "Division of labor in a dynamic environment: response
by honeybees (Apis mellifera) to graded changes in colony pollen stores". Behavioral
Ecology and Sociobiology, 46(3): 171-179.
Fewell, J.H. and M.L. Winston (1996). "Regulation of nectar collection in relation to honey
storage levels by honey bees, Apis mellifera". Behavioral Ecology, 7(3): 286-291.
Figueiredo-Mecca, G., L.R. Bego and F.S. Nascimento (2013). "Foraging behavior of
Scaptotrigona depilis (Hymenoptera, Apidae, Meliponini) and its relationship with
temporal and abiotic Factors". Sociobiology, 60(3): 277-282.
Fisher, B., K. Turner, M. Zylstra, R. Brouwer, R. de Groot, S. Farber, (...) A. Balmford (2008).
"Ecosystem services and economic theory: integration for policy-relevant research".
Ecological Applications, 18(8): 2050-2067.
Franzen, M. and M. Larsson (2007). "Pollen harvesting and reproductive rates in specialized
solitary bees". Annales Zoologici Fennici, 44(6): 405-414.
Gallai, N., J.-M. Salles, J. Settele and B.E. Vaissière (2009). "Economic valuation of the
vulnerability of world agriculture confronted with pollinator decline". Ecological
Economics, 68: 810-812.
Gamfeldt, L., H. Hillebrand and P.R. Jonsson (2005). "Species richness changes across two
trophic levels simultaneously affect prey and consumer biomass". Ecology Letters, 8(7):
696-703.
Garbuzov, M. and F.L.W. Ratnieks (2014). "Quantifying variation among garden plants in
attractiveness to bees and other flower-visiting insects". Functional Ecology, 28(2):
364-374.
Garibaldi, L.A., L.G. Carvalheiro, S.D. Leonhardt, M.A. Aizen, B.R. Blaauw, R. Isaacs, (...) R.
Winfree (2014). "From research to action: enhancing crop yield through wild
pollinators". Frontiers in Ecology and the Environment, 12(8): 439-447.
I. General introduction
_____ 32
Garibaldi, L.A., I. Steffan-Dewenter, C. Kremen, J.M. Morales, R. Bommarco, S.A.
Cunningham, (...) A.M. Klein (2011). "Stability of pollination services decreases with
isolation from natural areas despite honey bee visits". Ecology Letters, 14(10): 1062-
1072.
Garibaldi, L.A., I. Steffan-Dewenter, R. Winfree, M.A. Aizen, R. Bommarco, S.A.
Cunningham, (...) A.M. Klein (2013). "Wild pollinators enhance fruit set of crops
regardless of honey bee abundance". Science, 339(6127): 1608-1611.
Garratt, M.P.D., T.D. Breeze, N. Jenner, C. Polce, J.C. Biesmeijer and S.G. Potts (2014).
"Avoiding a bad apple: Insect pollination enhances fruit quality and economic value".
Agriculture Ecosystems & Environment, 184: 34-40.
Genersch, E. (2010). "Honey bee pathology: current threats to honey bees and beekeeping".
Applied Microbiology and Biotechnology, 87(1): 87-97.
Genersch, E., W. von der Ohe, H. Kaatz, A. Schroeder, C. Otten, R. Büchler, (...) P. Rosenkranz
(2010). "The German bee monitoring project: a long term study to understand
periodically high winter losses of honey bee colonies*". Apidologie, 41(3): 332-352.
Génissel, A., P. Aupinel, C. Bressac, J.N. Tasei and C. Chevrier (2002). "Influence of pollen
origin on performance of Bombus terrestris micro-colonies". Entomologia
Experimentalis et Applicata, 104: 329-336.
Ghazoul, J. (2005). "Buzziness as usual? Questioning the global pollination crisis". Trends in
Ecology and Evolution, 20(7): 367-373.
Ghazoul, J. (2015). "Qualifying pollinator decline evidence". Science, 348(6238): 981-982.
Giannini, T.C., S. Boff, G.D. Cordeiro, E.A. Cartolano, A.K. Veiga, V.L. Imperatriz-Fonseca
and A.M. Saraiva (2014). "Crop pollinators in Brazil: a review of reported interactions".
Apidologie, 46(2): 209-223.
Gill, R.J., K.C.R. Baldock, M.J.F. Brown, J.E. Cresswell, L.V. Dicks, M.T. Fountain, (...) S.G.
Potts (2016). "Chapter Four - Protecting an ecosystem service: approaches to
understanding and mitigating threats to wild insect pollinators".54: pp 135-206.in Guy,
W and AB David, Advances in Ecological Research. Academic Press.
Gill, R.J., O. Ramos-Rodriguez and N.E. Raine (2012). "Combined pesticide exposure severely
affects individual- and colony-level traits in bees". Nature, 491: 105–108.
González-Varo, J.P., J.C. Biesmeijer, R. Bommarco, S.G. Potts, O. Schweiger, H.G. Smith, (...)
M. Vilà (2013). "Combined effects of global change pressures on animal-mediated
pollination". Trends in Ecology and Evolution, 28(9): 524-530.
Gotlieb, A., Y. Hollender and Y. Mandelik (2011). "Gardening in the desert changes bee
communities and pollination network characteristics". Basic and Applied Ecology,
12(4): 310-320.
1.10. References
_____ 33
Goulson, D., W.O.H. Hughes, L.C. Derwent and J.C. Stout (2002). "Colony growth of the
bumblebee, Bombus terrestris, in improved and conventional agricultural and suburban
habitats". Oecologia, 130(2): 267-273.
Goulson, D., E. Nicholls, C. Botías and E.L. Rotheray (2015). "Bee declines driven by
combined stress from parasites, pesticides, and lack of flowers". Science, 347(6229).
Greco, M.K., D. Hoffmann, A. Dollin, M. Duncan, R. Spooner-Hart and P. Neumann (2010).
"The alternative Pharaoh approach: stingless bees mummify beetle parasites alive".
Naturwissenschaften, 97(3): 319-323.
Greco, M.K., R.N. Spooner-Hart, A. Beattie, I. Barchia and P. Holford (2011). "Australian
stingless bees improve greenhouse Capsicum production". Journal of Apicultural
Research, 50(2): 102-115.
Greenleaf, S.S. and C. Kremen (2006). "Wild bees enhance honey bees' pollination of hybrid
sunflower". Proceedings of the National Academy of Sciences of the United States of
America, 103(37): 13890-13895.
Greenleaf, S.S., N.M. Williams, R. Winfree and C. Kremen (2007). "Bee foraging ranges and
their relationship to body size". Oecologia, 153: 589-596.
Heard, T. (1994). "Behaviour and pollinator efficiency of stingless bees and honey bees on
macadamia flowers". Journal of Apicultural Research, 33(4): 191-198.
Heard, T.A. (1999). "The role of stingless bees in crop pollination". Annual Review of
Entomology, 44: 183-206.
Heard, T.A. (2016). "The Australian native bee book. Keeping stingless bee hives for pets,
pollination and sugarbag hone". Sugarbag Bees, Brisbane.
Heard, T.A. and J.K. Hendrikz (1993). "Factors influencing flight activity of colonies of the
stingless bee Trigona carbonaria (Hymenoptera, Apidae)". Australian Journal of
Zoology, 41(4): 343-353.
Henry, M., M. Beguin, F. Requier, O. Rollin, J.F. Odoux, P. Aupinel, (...) A. Decourtye (2012).
"A common pesticide decreases foraging success and survival in honey bees". Science,
336(6079): 348-350.
Hernandez, J.L., G.W. Frankie and R.W. Thorp (2009). "Ecology of urban bees: a review of
current knowledge and directions for future study". Cities and the Environment (CATE),
2(1): 3.
Hilário, S.D., M.d.F. Ribeiro and V.L. Imperatriz-Fonseca (2012). "Can climate shape flight
activity patterns of Plebeia remota (Hymenoptera, Apidae)?". Iheringia. Série Zoologia,
102: 269-276.
Hines, H.M. and S.D. Hendrix (2005). "Bumble bee (Hymenoptera: Apidae) diversity and
abundance in tallgrass prairie patches: effects of local and landscape floral resources".
Environmental Entomology, 34: 1477-1484.
I. General introduction
_____ 34
Hinners, S.J., C.A. Kearns and C.A. Wessman (2012). "Roles of scale, matrix, and native
habitat in supporting a diverse suburban pollinator assemblage". Ecological
Applications, 22(7): 1923-1935.
Höcherl, N., R. Siede, I. Illies, H. Gätschenberger and J. Tautz (2012). "Evaluation of the
nutritive value of maize for honey bees". Journal of Insect Physiology, 58(2): 278-285.
Hofstede, F.E. and M.J. Sommeijer (2006). "Influence of environmental and colony factors on
the initial commodity choice of foragers of the stingless bee Plebeia tobagoensis
(Hymenoptera, Meliponini)". Insectes Sociaux, 53(3): 258-264.
Howard, J.J. (1985). "Observations on resin collecting by six interacting species of stingless
bees (Apidae, Meliponinae)". Journal of the Kansas Entomological Society, 58(2): 337-
345.
Inoue, T., S. Salmah, I. Abbas and E. Yusuf (1985). "Foraging behavior of individual workers
and foraging dynamics of colonies of three Sumatran stingless bees". Researches on
Population Ecology, 27(2): 373-392.
Irwin, R.E., D. Cook, L.L. Richardson, J.S. Manson and D.R. Gardner (2014). "Secondary
compounds in floral rewards of toxic rangeland plants: impacts on pollinators". Journal
of Agricultural and Food Chemistry, 62(30): 7335-7344.
Ives, A.R., B.J. Cardinale and W.E. Snyder (2005). "A synthesis of subdisciplines: predator–prey interactions, and biodiversity and ecosystem functioning". Ecology Letters, 8(1):
102-116.
Iwasaki, J.M., B.I.P. Barratt, J.M. Lord, A.R. Mercer and K.J.M. Dickinson (2015). "The New
Zealand experience of varroa invasion highlights research opportunities for Australia".
Ambio, 44(7): 694-704.
Jarau, S. and M. Hrncir (2009). "Food exploitation by social insects: ecological, behavioral, and
theoretical approaches". CRC Press.
Jauker, B., J. Krauss, F. Jauker and I. Steffan-Dewenter (2013). "Linking life history traits to
pollinator loss in fragmented calcareous grasslands". Landscape Ecology, 28(1): 107-
120.
Jauker, F., F. Peter, V. Wolters and T. Diekötter (2012). "Early reproductive benefits of mass-
flowering crops to the solitary bee Osmia rufa outbalance post-flowering
disadvantages". Basic and Applied Ecology, 13(3): 268-276.
Jha, S. and C. Kremen (2013). "Resource diversity and landscape-level homogeneity drive
native bee foraging". Proceedings of the National Academy of Sciences of the United
States of America, 110(2): 555-558.
Jha, S., L. Stefanovich and C. Kremen (2013). "Bumble bee pollen use and preference across
spatial scales in human-altered landscapes". Ecological Entomology, 38(6): 570-579.
1.10. References
_____ 35
Jha, S. and J.H. Vandermeer (2009). "Contrasting foraging patterns for Africanized honeybees,
native bees and native wasps in a tropical agroforestry landscape". Journal of Tropical
Ecology, 25: 13-22.
Johnson, R.M., J.D. Evans, G.E. Robinson and M.R. Berenbaum (2009). "Changes in transcript
abundance relating to colony collapse disorder in honey bees (Apis mellifera)".
Proceedings of the National Academy of Sciences of the United States of America, 106:
14790-14795.
Kearns, C.A., D.W. Inouye and N.M. Waser (1998). "Endangered mutualisms: The
conservation of plant-pollinator interactions". Annual Review of Ecology and
Systematics, 29: 83-112.
Kennedy, C.M., E. Lonsdorf, M.C. Neel, N.M. Williams, T.H. Ricketts, R. Winfree, (...) C.
Kremen (2013). "A global quantitative synthesis of local and landscape effects on wild
bee pollinators in agroecosystems". Ecology Letters, 16(5): 584-599.
Kim, W., T. Gilet and J.W.M. Bush (2011). "Optimal concentrations in nectar feeding".
Proceedings of the National Academy of Sciences of the United States of America,
108(40): 16618-16621.
Kim, Y.S. and B.H. Smith (2000). "Effect of an amino acid on feeding preferences and learning
behavior in the honey bee, Apis mellifera". Journal of Insect Physiology, 46: 793-801.
Kitaoka, T.K. and J.C. Nieh (2009). "Manuscript in preparation for Behavioral Ecology and
Sociobiology Bumble bee pollen foraging regulation: role of pollen quality, storage
levels, and odor". Behavioral Ecology and Sociobiology, 63(4): 501-510.
Klatt, B.K., A. Holzschuh, C. Westphal, Y. Clough, I. Smit, E. Pawelzik and T. Tscharntke
(2014). "Bee pollination improves crop quality, shelf life and commercial value".
Proceedings of the Royal Society B: Biological Sciences, 281(1775).
Kleijn, D. and I. Raemakers (2008). "A retrospective analysis of pollen host plant use by stable
and declining bumble bee species". Ecology, 89(7): 1811-1823.
Klein, A.-M., I. Steffan-Dewenter and T. Tscharntke (2003). "Fruit set of highland coffee
increases with the diversity of pollinating bees". Proceedings of the Royal Society B:
Biological Sciences, 270: 955-961.
Klein, A.-M., B.E. Vaissiere, J.H. Cane, I. Steffan-Dewenter, S.A. Cunningham, C. Kremen and
T. Tscharntke (2007). "Importance of pollinators in changing landscapes for world
crops". Proceedings of the Royal Society B: Biological Sciences, 274(1608): 303-313.
Kremen, C., N.M. Williams, R.L. Bugg, J.P. Fay and R.W. Thorp (2004). "The area
requirements of an ecosystem service: crop pollination by native bee communities in
California". Ecology Letters, 7(11): 1109-1119.
Kremen, C., N.M. Williams and R.W. Thorp (2002). "Crop pollination from native bees at risk
from agricultural intensification". Proceedings of the National Academy of Sciences of
the United States of America, 99: 16812-16816.
I. General introduction
_____ 36
Kuhn-Neto, B., F.A.L. Contrera, M.S. Castro and J.C. Nieh (2009). "Long distance foraging and
recruitment by a stingless bee, Melipona mandacaia". Apidologie, 40(4): 472-480.
Lautenbach, S., R. Seppelt, J. Liebscher and C.F. Dormann (2012). "Spatial and temporal trends
of global pollination benefit". Plos One, 7(4): e35954.
Leonhardt, S.D. and N. Blüthgen (2009). "A sticky affair: resin collection by Bornean stingless
bees". Biotropica, 41(6): 730-736.
Leonhardt, S.D. and N. Blüthgen (2012). "The same, but different: pollen foraging in honeybee
and bumblebee colonies". Apidologie, 43: 449-464.
Leonhardt, S.D., T.A. Heard and H. Wallace (2014). "Differences in the resource intake of two
sympatric Australian stingless bee species". Apidologie, 45(4): 514-527.
Levy, S. (2011). "What's best for bees". Nature, 479(7372): 164-165.
Lichtenberg, E.M., V.L. Imperatriz-Fonseca and J.C. Nieh (2010). "Behavioral suites mediate
group-level foraging dynamics in communities of tropical stingless bees". Insectes
Sociaux, 57(1): 105-113.
Loreau, M., S. Naeem, P. Inchausti, J. Bengtsson, J.P. Grime, A. Hector, (...) D.A. Wardle
(2001). "Biodiversity and ecosystem functioning: current knowledge and future
challenges". Science, 294(5543): 804-808.
Mallinger, R.E. and C. Gratton (2015). "Species richness of wild bees, but not the use of
managed honeybees, increases fruit set of a pollinator-dependent crop". Journal of
Applied Ecology, 52(2): 323-330.
Massaro, C.F., M. Katouli, T. Grkovic, H. Vu, R.J. Quinn, T.A. Heard, (...) P. Brooks (2014).
"Anti-staphylococcal activity of C-methyl flavanones from propolis of Australian
stingless bees (Tetragonula carbonaria) and fruit resins of Corymbia torelliana
(Myrtaceae)". Fitoterapia, 95: 247-257.
Matsumura, C., J. Yokoyama and I. Washitani (2004). "Invasion status and potential ecological
impacts of an invasive alien bumblebee, Bombus terrestris L.(Hymenoptera: Apidae)
naturalized in Southern Hokkaido, Japan". Global Environmental Research - English
Edition, 8(1): 51-66.
Mattila, H.R. and G.W. Otis (2006). "Influence of pollen diet in spring on development of
honey bee (Hymenoptera: Apidae) colonies". Journal of Economic Entomology, 99(3):
604-613.
McKinney, M.L. (2008). "Effects of urbanization on species richness: A review of plants and
animals". Urban Ecosystems, 11(2): 161-176.
Memmott, J., P.G. Craze, N.M. Waser and M.V. Price (2007). "Global warming and the
disruption of plant-pollinator interactions". Ecology Letters, 10(8): 710-717.
Menzel, R. (1993). "Associative learning in honey bees". Apidologie, 24(3): 157-168.
1.10. References
_____ 37
Menzel, R., K. Geiger, L. Chittka, J. Joerges, J. Kunze and U. Müller (1996). "The knowledge
base of bee navigation". Journal of Experimental Biology, 199(1): 141-146.
Menzel, R. and U. Greggers (2015). "The memory structure of navigation in honeybees".
Journal of Comparative Physiology A, 201(6): 547-561.
Michener, C.D. (2007). "The bees of the world". John Hopkins University Press, Baltimore &
London.
Millennium Ecosystem Assessment (2005). "Ecosystems and Human Well-being: Synthesis".
Island Press, Washington, DC.
Morandin, L.A., M.L. Winston, M.T. Franklin and V.A. Abbott (2005). "Lethal and sub-lethal
effects of spinosad on bumble bees (Bombus impatiens Cresson)". Pest Management
Science, 61(7): 619-626.
Morawetz, L. and J. Spaethe (2012). "Visual attention in a complex search task differs between
honeybees and bumblebees". Journal of Experimental Biology, 215(14): 2515-2523.
Nagamitsu, T. and T. Inoue (1998). "Interspecific morphological variation in stingless bees
(Hymenoptera: Apidae, Meliponinae) associated with floral shape and location in an
Asian tropical rainforest". Entomological Science, 1(2): 189-194.
Najera, D.A., E.L. McCullough and R. Jander (2015). "Honeybees use celestial and/or terrestrial
compass cues for inter-patch navigation". Ethology, 121(1): 94-102.
Nazzi, F. and F. Pennacchio (2014). "Disentangling multiple interactions in the hive
ecosystem". Trends in Parasitology, 30(12): 556-561.
Neumann, P. and P.J. Elzen (2004). "The biology of the small hive beetle (Aethina tumida,
Coleoptera: Nitidulidae): gaps in our knowledge of an invasive species". Apidologie,
35(3): 229-247.
Nicholls, C.I. and M.A. Altieri (2013). "Plant biodiversity enhances bees and other insect
pollinators in agroecosystems. A review". Agronomy for Sustainable Development,
33(2): 257-274.
Nicolson, S.W. (2011). "Bee food: the chemistry and nutritional value of nectar, pollen and
mixtures of the two". African Zoology, 46(2): 197-204.
Nieh, J.C. (2004). "Recruitment communication in stingless bees (Hymenoptera, Apidae,
Meliponini)". Apidologie, 35(2): 159-182.
Odoux, J.F., D. Feuillet, P. Aupinel, Y. Loublier, J.N. Tasei and C. Mateescu (2012).
"Territorial biodiversity and consequences on physico-chemical characteristics of pollen
collected by honey bee colonies". Apidologie, 43(5): 561-575.
Oldroyd, B.P. (2007). "What's killing American honey bees?". Plos Biology, 5(6): e168.
Oliveira, F.L.d., V.H.P. Dias, E.M.d. Costa, M.A. Filgueira and J. Espínola Sobrinho (2012).
"Influência das variações climáticas na atividade de vôo das abelhas jandairas Melipona
subnitida Ducke (Meliponinae)". Revista Ciência Agronômica, 43: 598-603.
I. General introduction
_____ 38
Ollerton, J., R. Winfree and S. Tarrant (2011). "How many flowering plants are pollinated by
animals?". Oikos, 120(3): 321-326.
Pech-May, F.G., L. Medina-Medina, W.D. May-Itza, R.J. Paxton and J.J.G. Quezada-Euan
(2012). "Colony pollen reserves affect body size, sperm production and sexual
development in males of the stingless bee Melipona beecheii". Insectes Sociaux, 59(3):
417-424.
Persson, A.S. and H.G. Smith (2013). "Seasonal persistence of bumblebee populations is
affected by landscape context". Agriculture, Ecosystems & Environment, 165(0): 201-
209.
Polatto, L., J. Chaud-Netto and V. Alves-Junior (2014). "Influence of abiotic factors and floral
resource availability on daily foraging activity of bees". Journal of Insect Behavior,
27(5): 593-612.
Potts, S.G., J.C. Biesmeijer, C. Kremen, P. Neumann, O. Schweiger and W.E. Kunin (2010a).
"Global pollinator declines: trends, impacts and drivers". Trends in Ecology and
Evolution, 25(6): 345-353.
Potts, S.G., S.P.M. Roberts, R. Dean, G. Marris, M. Brown, R. Jones and J. Settele (2010b).
"Declines of managed honeybees and beekeepers in Europe". Journal of Apicultural
Research, 49: 15-22.
Potts, S.G., B. Vulliamy, A. Dafni, G. Ne'eman and P. Willmer (2003). "Linking bees and
flowers: How do floral communities structure pollinator communities?". Ecology,
84(10): 2628-2642.
Potts, S.G., B. Vulliamy, S. Roberts, C. O'Toole, A. Dafni, G. Ne'eman and P.G. Willmer
(2004). "Nectar resource diversity organises flower-visitor community structure".
Entomologia Experimentalis et Applicata, 113(2): 103-107.
Pywell, R.F., E.A. Warman, C. Carvell, T.H. Sparks, L.V. Dicks, D. Bennett, (...) A. Sherwood
(2005). "Providing foraging resources for bumblebees in intensively farmed
landscapes". Biological Conservation, 121(4): 479-494.
Quezada-Euan, J.J.G., A. Lopez-Velasco, J. Perez-Balam, H. Moo-Valle, A. Velazquez-
Madrazo and R.J. Paxton (2011). "Body size differs in workers produced across time
and is associated with variation in the quantity and composition of larval food in
Nannotrigona perilampoides (Hymenoptera, Meliponini)". Insectes Sociaux, 58(1): 31-
38.
Ramalho, M., T.C. Giannini, K.S. Malagodibraga and V.L. Imperatriz-Fonseca (1994). "Pollen
harvest by stingless bee foragers (Hymenoptera, Apidae, Meliponinae)". Grana, 33(4-
5): 239-244.
Ramalho, M., A. Kleinert-Giovannini and V. Imperatriz-Fonseca, L. (1990). "Important bee
plants for stingless bees (Melipona and Trigonini) and Africanized honeybees (Apis
mellifera) in neotropical habitats: a review". Apidologie, 21(5): 469-488.
1.10. References
_____ 39
Rasheed, S.A. and L.D. Harder (1997). "Economic motivation for plant species preferences of
pollen-collecting bumble bees". Ecological Entomology, 22(2): 209-219.
Rasmussen, C. and S.A. Cameron (2010). "Global stingless bee phylogeny supports ancient
divergence, vicariance, and long distance dispersal". Biological Journal of the Linnean
Society, 99: 206-232.
Requier, F., J.-F. Odoux, T. Tamic, N. Moreau, M. Henry, A. Decourtye and V. Bretagnolle
(2015). "Honey bee diet in intensive farmland habitats reveals an unexpectedly high
flower richness and a major role of weeds". Ecological Applications, 25(4): 881-890.
Ricketts, T.H. (2004). "Tropical forest fragments enhance pollinator activity in nearby coffee
crops". Conservation Biology, 18(5): 1262-1271.
Ricketts, T.H., J. Regetz, I. Steffan-Dewenter, S.A. Cunningham, C. Kremen, A. Bogdanski,
(...) B.F. Viana (2008). "Landscape effects on crop pollination services: are there
general patterns?". Ecology Letters, 11(5): 499-515.
Robertson, A.W., C. Mountjoy, B.E. Faulkner, M.V. Roberts and M.R. Macnair (1999).
"Bumble bee selection of Mimulus guttatus flowers: The effects of pollen quality and
reward depletion". Ecology, 80(8): 2594-2606.
Rollin, O., V. Bretagnolle, A. Decourtye, J. Aptel, N. Michel, B.E. Vaissiere and M. Henry
(2013). "Differences of floral resource use between honey bees and wild bees in an
intensive farming system". Agriculture Ecosystems & Environment, 179: 78-86.
Rosenkranz, P., P. Aumeier and B. Ziegelmann (2010). "Biology and control of Varroa
destructor". Journal of Invertebrate Pathology, 103, Supplement: S96-S119.
Roubik, D., W., D. Yanega, M. Aluja, S. Buchmann, L. and D. Inouye, W. (1995). "On optimal
nectar foraging by some tropical bees (Hymenoptera: Apidae)". Apidologie, 26(3): 197-
211.
Roubik, D.W. (1989). "Ecology and natural history of tropical bees". Cambridge University
Press, New York.
Roubik, D.W. (2006). "Stingless bee nesting biology". Apidologie, 37(2): 124-143.
Roulston, T.H. and J.H. Cane (2000a). "The effect of diet breadth and nesting ecology on body
size variation in bees (Apiformes)". Journal of the Kansas Entomological Society,
73(3): 129-142.
Roulston, T.H. and J.H. Cane (2000b). "Pollen nutritional content and digestibility for animals".
Plant Systematics and Evolution, 222(1-4): 187-209.
Roulston, T.H., J.H. Cane and S.L. Buchmann (2000). "What governs protein content of pollen:
Pollinator preferences, pollen-pistil interactions, or phylogeny?". Ecological
Monographs, 70(4): 617-643.
Roulston, T.H. and K. Goodell (2011). "The role of resources and risks in regulating wild bee
populations". Annual Review of Entomology, 56(1): 293-312.
I. General introduction
_____ 40
Sammataro, D., U. Gerson and G. Needham (2000). "Parasitic mites of honey bees: Life history,
implications, and impact". Annual Review of Entomology, 45: 519-548.
Samnegård, U., A.S. Persson and H.G. Smith (2011). "Gardens benefit bees and enhance
pollination in intensively managed farmland". Biological Conservation, 144(11): 2602-
2606.
Scheiner, R., A. Baumann and W. Blenau (2006). "Aminergic control and modulation of
honeybee behaviour". Current Neuropharmacology, 4(4): 259-276.
Schweiger, O., J. Settele, O. Kudrna, S. Klotz and I. Kuhn (2008). "Climate Change can cause
spatial mismatch of trophically interacting species". Ecology, 89(12): 3472-3479.
Simone-Finstrom, M. and M. Spivak (2010). "Propolis and bee health: the natural history and
significance of resin use by honey bees". Apidologie, 41(3): 295-311.
Simone-Finstrom, M.D. and M. Spivak (2012). "Increased resin collection after parasite
challenge: a case of self-medication in honey bees?". Plos One, 7(3): e34601.
Singh, R., A.L. Levitt, E.G. Rajotte, E.C. Holmes, N. Ostiguy, D. Vanengelsdorp, (...) D.L.
Cox-Foster (2010). "RNA Viruses in Hymenopteran Pollinators: Evidence of Inter-Taxa
Virus Transmission via Pollen and Potential Impact on Non-Apis Hymenopteran
Species". Plos One, 5(12).
Slaa, E.J. (2006). "Population dynamics of a stingless bee community in the seasonal dry
lowlands of Costa Rica". Insectes Sociaux, 53(1): 70-79.
Slaa, E.J., L.A. Sanchez Chaves, K.S. Malagodi-Braga and F.E. Hofstede (2006). "Stingless
bees in applied pollination: practice and perspectives". Apidologie, 37(2): 293-315.
Slaa, E.J., A.J.M. Tack and M.J. Sommeijer (2003). "The effect of intrinsic and extrinsic factors
on flower constancy in stingless bees". Apidologie, 34(5): 457-468.
Söderström, B., B. Svensson, K. Vessby and A. Glimskär (2001). "Plants, insects and birds in
semi-natural pastures in relation to local habitat and landscape factors". Biodiversity &
Conservation, 10(11): 1839-1863.
Somerville, D.C. and H.I. Nicol (2006). "Crude protein and amino acid composition of honey
bee-collected pollen pellets from south-east Australia and a note on laboratory
disparity". Australian Journal of Experimental Agriculture, 46(1): 141-149.
Somme, L., M. Vanderplanck, D. Michez, I. Lombaerde, R. Moerman, B. Wathelet, (...) A.L.
Jacquemart (2015). "Pollen and nectar quality drive the major and minor floral choices
of bumble bees". Apidologie, 46(1): 92-106.
Sommeijer, J.M., M.L.L. de Bruijn, J.F.J.A. Meeuwsen and P.E. Martens (2003). "Natural
patterns of caste and sex allocation in the stingless bees Melipona favosa and M.
trinitatis related to worker behaviour". Insectes Sociaux, 50(1): 38-44.
1.10. References
_____ 41
Sommerlandt, F.M.J., W. Huber and J. Spaethe (2014). "Social information in the stingless bee,
Trigona corvina Cockerell (Hymenoptera: Apidae): the use of visual and olfactory cues
at the food site". Sociobiology, 61(4): 401-406.
Steffan-Dewenter, I. (2003). "Importance of habitat area and landscape context for species
richness of bees and wasps in fragmented orchard meadows". Conservation Biology, 17:
1036-1044.
Steffan-Dewenter, I., U. Munzenberg, C. Burger, C. Thies and T. Tscharntke (2002). "Scale-
dependent effects of landscape context on three pollinator guilds". Ecology, 83(5):
1421-1432.
Steffan-Dewenter, I., S.G. Potts and L. Packer (2005). "Pollinator diversity and crop pollination
services are at risk". Trends in Ecology and Evolution, 20(12): 651-652.
Stout, J.C. and C.L. Morales (2009). "Ecological impacts of invasive alien species on bees".
Apidologie, 40(3): 388-409.
Tarpy, D.R. and D.C. Gilley (2004). "Group decision making during queen production in
colonies of highly eusocial bees". Apidologie, 35(2): 207-216.
Tasei, J.N. and P. Aupinel (2008). "Nutritive value of 15 single pollens and pollen mixes tested
on larvae produced by bumblebee workers (Bombus terrestris, Hymenoptera: Apidae)".
Apidologie, 39(4): 397-409.
Tepedino, V., B. Bradley and T. Griswold (2008). "Might flowers of invasive plants increase
native bee carrying capacity? Intimations from Capitol Reef National Park, Utah".
Natural Areas Journal, 28(1): 44-50.
Thompson, H.M. and C. Maus (2007). "The relevance of sublethal effects in honey bee testing
for pesticide risk assessment". Pest Management Science, 63(11): 1058-1061.
Thomson, D.M. (2006). "Detecting the effects of introduced species: a case study of
competition between Apis and Bombus". Oikos, 114(3): 407-418.
Torne-Noguera, A., A. Rodrigo, X. Arnan, S. Osorio, H. Barril-Graells, L.C. da Rocha and J.
Bosch (2014). "Determinants of spatial distribution in a bee community: nesting
resources, flower resources, and body size". Plos One, 9(5).
Traveset, A. and D.M. Richardson (2006). "Biological invasions as disruptors of plant
reproductive mutualisms". Trends in Ecology and Evolution, 21(4): 208-216.
van Beest, F.M., A. Mysterud, L.E. Loe and J.M. Milner (2010). "Forage quantity, quality and
depletion as scale-dependent mechanisms driving habitat selection of a large browsing
herbivore". Journal of Animal Ecology, 79(4): 910-922.
van Veen, W.J. and J.M. Sommeijer (2000). "Colony reproduction in Tetragonisca angustula
(Apidae, Meliponini)". Insectes Sociaux, 47(1): 70-75.
Vanbergen, A.J. (2014). "Landscape alteration and habitat modification: impacts on plant–pollinator systems". Current Opinion in Insect Science, 5: 44-49.
I. General introduction
_____ 42
Vanbergen, A.J. and the Insect Pollinators Initiative (2013). "Threats to an ecosystem service:
pressures on pollinators". Frontiers in Ecology and the Environment, 11(5): 251-259.
Vanderplanck, M., R. Moerman, P. Rasmont, G. Lognay, B. Wathelet, R. Wattiez and D.
Michez (2014). "How does pollen chemistry impact development and feeding behaviour
of polylectic bees?". Plos One, 9(1): e86209.
vanEngelsdorp, D., J.D. Evans, C. Saegerman, C. Mullin, E. Haubruge, B.K. Nguyen, (...) J.S.
Pettis (2009). "Colony collapse disorder: a descriptive study". Plos One, 4(8).
vanEngelsdorp, D. and M.D. Meixner (2010). "A historical review of managed honey bee
populations in Europe and the United States and the factors that may affect them".
Journal of Invertebrate Pathology, 103: S80-S95.
Viana, B.F., D. Boscolo, E.m.g.c. Mariano Neto, L. Lopes, A. Lopes, P. Fereira, (...) L. Primo
(2012). "How well do we understand landscape effects on pollinators and pollination
services?". Journal of Pollination Ecology, 7(5): 31-41.
von Frisch, K. (1967). "The dance language and orientation of bees". Belknap Press of Harvard
University Press, Cambridge.
Wallace, H.M. and D.J. Lee (2010). "Resin-foraging by colonies of Trigona sapiens and T.
hockingsi (Hymenoptera: Apidae, Meliponini) and consequent seed dispersal of
Corymbia torelliana (Myrtaceae)". Apidologie, 41: 428-435.
Wallace, H.M. and S.J. Trueman (1995). "Dispersal of Eucalyptus torelliana seeds by the resin-
collecting stingless bee, Trigona carbonaria". Oecologia, 104(1): 12-16.
Waser, N.M. (2006). "Plant-pollinator interactions: from specialization to generalization".
University of Chicago Press.
Watanabe, M.E. (1994). "Pollination worries rise as honey-bees decline". Science, 265(5176):
1170-1170.
Wehner, R., B. Michel and P. Antonsen (1996). "Visual navigation in insects: coupling of
egocentric and geocentric information". Journal of Experimental Biology, 199(1): 129-
140.
Westphal, C., I. Steffan-Dewenter and T. Tscharntke (2006). "Foraging trip duration of
bumblebees in relation to landscape-wide resource availability". Ecological
Entomology, 31: 389-394.
Westphal, C., I. Steffan-Dewenter and T. Tscharntke (2009). "Mass flowering oilseed rape
improves early colony growth but not sexual reproduction of bumblebees". Journal of
Applied Ecology, 46: 187–193.
Williams, N. (2003). "Use of novel pollen species by specialist and generalist solitary bees
(Hymenoptera: Megachilidae)". Oecologia, 134(2): 228-237.
Williams, N.M., D. Cariveau, R. Winfree and C. Kremen (2011). "Bees in disturbed habitats
use, but do not prefer, alien plants". Basic and Applied Ecology, 12(4): 332-341.
1.10. References
_____ 43
Williams, N.M. and C. Kremen (2007). "Resource distributions among habitats determine
solitary bee offspring production in a mosaic landscape". Ecological Applications, 17:
910-921.
Williams, N.M., J. Regetz and C. Kremen (2012). "Landscape-scale resources promote colony
growth but not reproductive performance of bumble bees". Ecology, 93: 1049–1058.
Williams, N.M. and V.J. Tepedino (2003). "Consistent mixing of near and distant resources in
foraging bouts by the solitary mason bee Osmia lignaria". Behavioral Ecology, 14(1):
141-149.
Williams, P.H. and J.L. Osborne (2009). "Bumblebee vulnerability and conservation world-
wide". Apidologie, 40: 367-387.
Winfree, R. (2010). "The conservation and restoration of wild bees". Year in Ecology and
Conservation Biology 2010, 1195: 169-197.
Winfree, R., R. Aguilar, D.P. Vázquez, G. LeBuhn and M.A. Aizen (2009). "A meta-analysis of
bees' responses to anthropogenic disturbance". Ecology, 90(8): 2068-2076.
Winfree, R., I. Bartomeus and D.P. Cariveau (2011). "Native pollinators in anthropogenic
habitats". Annual Review of Ecology, Evolution, and Systematics, 42(1): 1-22.
Winfree, R., T. Griswold and C. Kremen (2007a). "Effect of human disturbance on bee
communities in a forested ecosystem". Conservation Biology, 21(1): 213-223.
Winfree, R., N.M. Williams, J. Dushoff and C. Kremen (2007b). "Native bees provide insurance
against ongoing honey bee losses". Ecology Letters, 10(11): 1105-1113.
Woodcock, B.A., M. Edwards, J. Redhead, W.R. Meek, P. Nuttall, S. Falk, (...) R.F. Pywell
(2013). "Crop flower visitation by honeybees, bumblebees and solitary bees:
behavioural differences and diversity responses to landscape". Agriculture Ecosystems
& Environment, 171: 1-8.
Woolhouse, M.E.J., D.T. Haydon and R. Antia (2005). "Emerging pathogens: the epidemiology
and evolution of species jumps". Trends in Ecology and Evolution, 20(5): 238-244.
Yachi, S. and M. Loreau (1999). "Biodiversity and ecosystem productivity in a fluctuating
environment: the insurance hypothesis". Proceedings of the National Academy of
Sciences of the United States of America, 96: 1463-1468.
Zurbuchen, A., S. Cheesman, J. Klaiber, A. Müller, S. Hein and S. Dorn (2010). "Long foraging
distances impose high costs on offspring production in solitary bees". Journal of Animal
Ecology, 79: 674-681.

_____ 44
_____ 45
II. URBAN GARDENS PROMOTE BEE FORAGING OVER NATURAL HABITATS AND PLANTATIONS This chapter has been published in: Ecology and Evolution (2016); 6(5): 1304-1316 2.1. Abstract
Increasing human land use for agriculture and housing leads to the loss of natural
habitat and to widespread declines in wild bees. Bee foraging dynamics and fitness
depend on the availability of resources in the surrounding landscape, but how precisely
landscape related resource differences affect bee foraging patterns remains unclear. To
investigate how landscape and its interaction with season and weather drive foraging
and resource intake in social bees, we experimentally compared foraging activity, the
allocation of foragers to different resources (pollen, nectar and resin) and overall
resource intake in the Australian stingless bee Tetragonula carbonaria (Apidae,
Meliponini). Bee colonies were monitored in different seasons over two years. We
compared foraging patterns and resource intake between the bees‘ natural habitat (forests) and two landscapes differently altered by humans (suburban gardens and
agricultural macadamia plantations). We found foraging activity as well as pollen and
nectar forager numbers to be highest in suburban gardens, intermediate in forests and
low in plantations. Foraging patterns further differed between seasons, but seasonal
variations strongly differed between landscapes. Sugar and pollen intake was low in
plantations, but contrary to our predictions, it was even higher in gardens than in forests.
In contrast, resin intake was similar across landscapes. Consequently, differences in
resource availability between natural and altered landscapes strongly affect foraging
patterns and thus resource intake in social bees. While agricultural monocultures largely
reduce foraging success, suburban gardens can increase resource intake well above rates
found in natural habitats of bees, indicating that human activities can both decrease and
increase the availability of resources in a landscape and thus reduce or enhance bee
fitness.
II. Urban gardens promote bee foraging
_____ 46
2.2. Introduction Animal pollination is a key ecosystem function, and modern agriculture benefits
from pollinators, particularly bees, for the production of many crops (Klein et al. 2007;
Garibaldi et al. 2013). Reports of declines in managed and wild bees thus raise concerns
about a global pollination crisis (Allen-Wardell et al. 1998; Winfree 2010). Bee
pollinators are under pressure from human activities (Winfree 2010), and bee decline is
often linked to habitat change and loss (Winfree et al. 2009; Potts et al. 2010;
Vanbergen and the Insect Pollinators Initiative 2013). Many natural habitats have been
destroyed or fragmented by urbanization and agricultural intensification with parallel
declines observed in the diversity and abundance of insect pollinators (Aizen and
Feinsinger 1994; Steffan-Dewenter et al. 2002; Ricketts 2004; Vanbergen and the Insect
Pollinators Initiative 2013). Anthropogenic changes to habitat may confound underlying
and interacting effects that regulate bee populations, such as food resource availability
(Roulston and Goodell 2011). How landscape related differences in resource availability
affect foraging patterns and resource intake of bees has however received little
attention.
Bees typically find a constant supply of floral resources in (semi-)natural habitats,
which provide a high diversity of plants (Cairns et al. 2005; Rundlöf et al. 2008;
Roulston and Goodell 2011; Kennedy et al. 2013). In contrast, in intensively managed
agricultural monocultures, food resources are only abundant during the short flowering
seasons of crops (Decourtye et al. 2010). Subsequent shortages in food resources
throughout the rest of the year have been linked to honey bee colony collapses in
degraded habitats (Naug 2009). Urban areas may, on the other hand, also provide steady
food resources throughout the year due to the presence of many native and exotic plant
species in gardens (Loram et al. 2008; Roulston and Goodell 2011). However, foraging
patterns and resource intake of bees in urban landscapes such as gardens have, to our
knowledge, not yet been studied.
Highly social bees form long-lived colonies and thus need floral resources
throughout the entire season. Foraging activity on the colony level is regulated by (a)
the amount of resources stored within the nest and (b) the availability of resources in the
environment (Biesmeijer et al. 1999; Hofstede and Sommeijer 2006; Altaye et al. 2010).
Foraging activity and patterns of colonies with similar food storages, but located in
different environments, should therefore be mainly determined by the availability of
resources in the respective landscapes.
Bees collect a variety of plant resources, primarily floral nectar and pollen (Michener
2.2. Introduction
_____ 47
2007; Brodschneider and Crailsheim 2010). Nectar is the main energy source for bees
and pollen provides the proteins, lipids, vitamins and minerals crucial for brood rearing,
but is also consumed by adult bees (Nicolson 2011). Highly social bees, such as tropical
stingless bees (Apidae: Meliponini) and honey bees, collect resin as additional plant
resource, predominantly from wounded trees (Roubik 1989). Resin is used for nest
construction and defence against predators or parasites (Leonhardt and Blüthgen 2009;
Greco et al. 2010) and is essential for colony survival. Bees therefore need to divide
their foraging efforts between these different plant resources.
Foraging behaviour and daily flight activity of bees is further influenced by abiotic
factors, such as temperature, humidity, solar radiation and wind (Heard and Hendrikz
1993; Hilário et al. 2012; Oliveira et al. 2012; Polatto et al. 2014). Variations in weather
and resource availability can therefore differentially affect foraging activity depending
on the season (Ferreira et al. 2010; Figueiredo-Mecca et al. 2013). Whether weather
factors or resource availability in a landscape predominately shape the foraging
behaviour of bees is however still unclear.
We compared foraging patterns, i.e. forager allocation and foraging activity, and
resource intake of a common Australian stingless bee species, Tetragonula carbonaria
Smith, between plantations, forests and suburban gardens. Our aim was to better
understand how differently altered human landscapes, i.e. agricultural areas and
gardens, affect resource foraging in highly social bees compared with patterns observed
in their natural habitat.
We specifically addressed the following questions:
1. How do different landscapes, altered and natural, influence foraging patterns, i.e.
foraging activity, forager numbers and proportions of bees collecting different floral
resources, in a generalist social bee?
We predict foraging patterns to be influenced by long periods of food shortages in
agricultural landscapes (Decourtye et al. 2010), resulting in low activity and forager
numbers throughout most of the year except for the short macadamia flowering period.
We further predict foraging activity and numbers to be intermediate in gardens due to a
constant but patchy distribution of resources, and to be highest in natural landscapes due
to year-long availability of abundant resources. Allocation of foragers to different
resources (i.e. forager proportions) is expected to be similar across landscapes and
seasons for pollen and nectar, while the number of unsuccesful foragers should be high
in plantations and low in forests. Due to the higher abundance of trees in forests, we
II. Urban gardens promote bee foraging
_____ 48
expect our colonies to allocate more foragers to resin collection in forests than in
gardens and plantations.
2. How does sugar and pollen intake by social bees differ between different
landscapes?
Overall resource intake is predicted to increase in landscapes comparatively richer in
plant resources, such as forests and gardens, and be highest in their natural habitat
(forests).
3. How do abiotic factors (e.g. temperature, humidity, wind) interact with landscape
in determining foraging activity and patterns?
We predict that abiotic factors contribute to foraging patterns, but that foraging
patterns are mainly determined by landscape.
2.3. Methods 2.3.1. Study species and landscapes
The study was conducted in Queensland, Australia. We chose the Australian
stingless bee Tetragonula carbonaria as a model species to address our research
questions (Dollin et al. 1997; genus change: Rasmussen and Cameron 2007).
Tetragonula carbonaria occurs as a wild bee and native pollinator in the study region,
and can also be kept and propagated in boxes and thus be managed for crop pollination
(Heard and Hendrikz 1993; Heard 2016). This allows colonies to be placed in specific
landscapes and to experimentally test for the effect of habitat and landscape on a
perennial bee species.
Observations were conducted within the native range of the species in Queensland.
The East coast of Queensland is characterized by a subtropical climate with wet summer
and dry winter seasons. To test how colonies of T. carbonaria were influenced by
resource diversity and availability in different landscapes, we selected three landscape
types characteristic of the region to experimentally place hives of T. carbonaria: forests,
plantations and gardens.
Forests ranged from relatively open Banksia heathland to more dense forests with
closed canopy, but were all dominated by an overstory of Eucalyptus and Corymbia
species and thus reflected the variety of habitats commonly used by T. carbonaria
(Dollin et al. 1997). Australian forests have been historically shaped by dynamic
2.3. Methods
_____ 49
processes like anthropogenic fire regimes and are continuously exposed to moderate
disturbance (Bird et al. 2008). Thus, uncleared forests, as selected in this study, can be
considered a natural environment. Before we started our study, we confirmed that wild
colonies of T. carbonaria were present at all forest study sites to ensure that the forest
sites represent valid natural control sites.
Our plantation sites were represented by commercial macadamia plantations
(Macadamia integrifolia Maiden and Betche × M. tetraphylla Johnson). Macadamia are
indigenous rainforest trees grown for their edible nuts, and are known to be pollinated
by T. carbonaria (Vithanage and Ironside 1986; Heard 1994; Heard and Exley 1994).
All plantations were monocultures with at most ten different genotypes as commercial
macadamia varieties are genetic clones.
We additionally placed bee hives in another human altered landscape, suburban
gardens, a habitat which has been successfully used to breed stingless bees by private
bee enthusiasts in Australia (Klumpp 2007). Suburban gardens in the study region
typically include houses, surrounded by gardens of 300-1000 m² with native and exotic
plants. Exotic plants, i.e. introduced alien plant species as well as ornamental cultivars,
commonly made up more than 50 % of all garden plant species in our study (data not
shown). Gardens were mostly situated in suburbs with remnants of uncleared bush
vegetation or small parks with mature Eucalyptus or other native trees.
2.3.2. Experimental setup A total of twelve study sites were established in 2011 in two regions in South East
Queensland, ranging from the Bundaberg region in the north to the Sunshine Coast area
and Brisbane region in the south (Figure II.1, SM II.1; 24°38'-27°30' S, 152°6'-
153°7' E). For each landscape type (plantation, forest and garden) we chose four study
sites as replicates, with replicates of each landscape in the northern and southern region
to avoid spatial autocorrelation. At each study site, we placed four wooden bee hives
containing T. carbonaria. Consequently, a total of 48 T. carbonaria bee hives were set
up at all study sites in 2011.
In gardens, space was limited and hives needed to be distributed among two suitable
private garden locations in close proximity (mean ± SD distance: 706 ± 129 m, except
for one garden site with 16 km between garden locations, Figure II.1). Two hives were
placed on each location and both garden locations together were considered one garden
site. We allowed for a 500 m flight radius of the bees around the hives which is
considered the typical foraging range of bees of this size (Greenleaf et al. 2007,
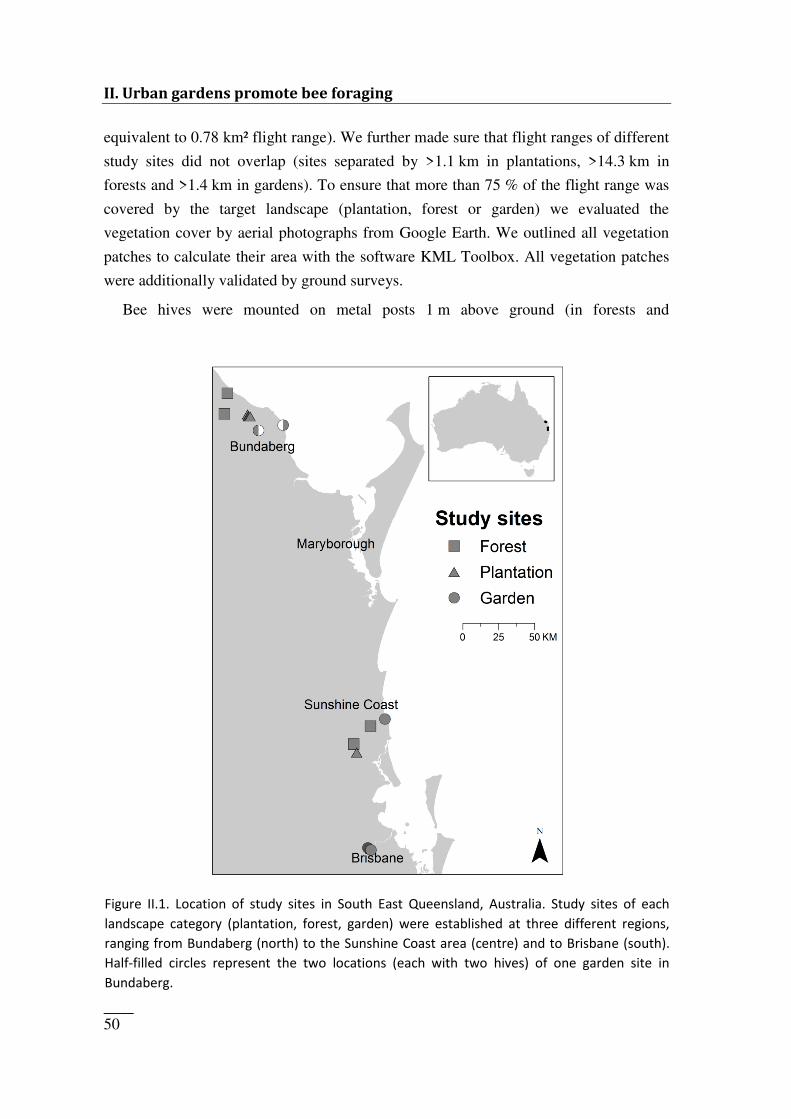
II. Urban gardens promote bee foraging
_____ 50
equivalent to 0.78 km² flight range). We further made sure that flight ranges of different
study sites did not overlap (sites separated by >1.1 km in plantations, >14.3 km in
forests and >1.4 km in gardens). To ensure that more than 75 % of the flight range was
covered by the target landscape (plantation, forest or garden) we evaluated the
vegetation cover by aerial photographs from Google Earth. We outlined all vegetation
patches to calculate their area with the software KML Toolbox. All vegetation patches
were additionally validated by ground surveys.
Bee hives were mounted on metal posts 1 m above ground (in forests and
Figure II.1. Location of study sites in South East Queensland, Australia. Study sites of each landscape category (plantation, forest, garden) were established at three different regions, ranging from Bundaberg (north) to the Sunshine Coast area (centre) and to Brisbane (south). Half-filled circles represent the two locations (each with two hives) of one garden site in Bundaberg.
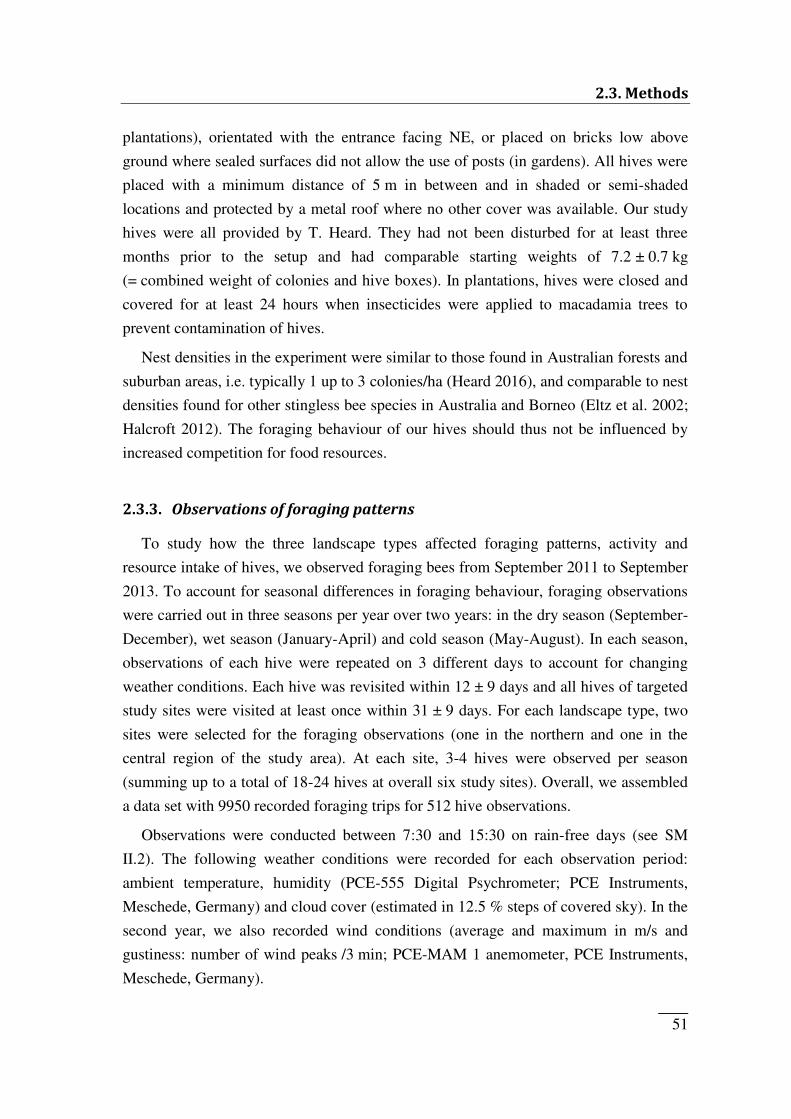
2.3. Methods
_____ 51
plantations), orientated with the entrance facing NE, or placed on bricks low above
ground where sealed surfaces did not allow the use of posts (in gardens). All hives were
placed with a minimum distance of 5 m in between and in shaded or semi-shaded
locations and protected by a metal roof where no other cover was available. Our study
hives were all provided by T. Heard. They had not been disturbed for at least three
months prior to the setup and had comparable starting weights of 7.2 ± 0.7 kg
(= combined weight of colonies and hive boxes). In plantations, hives were closed and
covered for at least 24 hours when insecticides were applied to macadamia trees to
prevent contamination of hives.
Nest densities in the experiment were similar to those found in Australian forests and
suburban areas, i.e. typically 1 up to 3 colonies/ha (Heard 2016), and comparable to nest
densities found for other stingless bee species in Australia and Borneo (Eltz et al. 2002;
Halcroft 2012). The foraging behaviour of our hives should thus not be influenced by
increased competition for food resources.
2.3.3. Observations of foraging patterns To study how the three landscape types affected foraging patterns, activity and
resource intake of hives, we observed foraging bees from September 2011 to September
2013. To account for seasonal differences in foraging behaviour, foraging observations
were carried out in three seasons per year over two years: in the dry season (September-
December), wet season (January-April) and cold season (May-August). In each season,
observations of each hive were repeated on 3 different days to account for changing
weather conditions. Each hive was revisited within 12 ± 9 days and all hives of targeted
study sites were visited at least once within 31 ± 9 days. For each landscape type, two
sites were selected for the foraging observations (one in the northern and one in the
central region of the study area). At each site, 3-4 hives were observed per season
(summing up to a total of 18-24 hives at overall six study sites). Overall, we assembled
a data set with 9950 recorded foraging trips for 512 hive observations.
Observations were conducted between 7:30 and 15:30 on rain-free days (see SM
II.2). The following weather conditions were recorded for each observation period:
ambient temperature, humidity (PCE-555 Digital Psychrometer; PCE Instruments,
Meschede, Germany) and cloud cover (estimated in 12.5 % steps of covered sky). In the
second year, we also recorded wind conditions (average and maximum in m/s and
gustiness: number of wind peaks /3 min; PCE-MAM 1 anemometer, PCE Instruments,
Meschede, Germany).
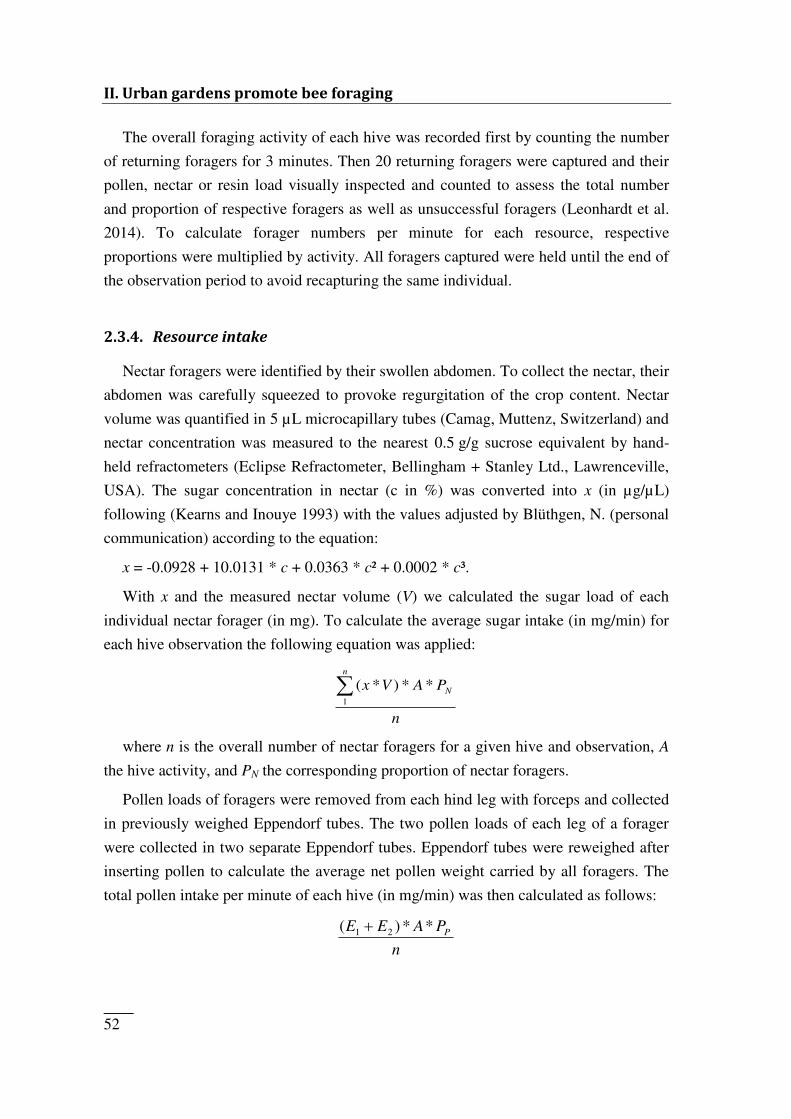
II. Urban gardens promote bee foraging
_____ 52
The overall foraging activity of each hive was recorded first by counting the number
of returning foragers for 3 minutes. Then 20 returning foragers were captured and their
pollen, nectar or resin load visually inspected and counted to assess the total number
and proportion of respective foragers as well as unsuccessful foragers (Leonhardt et al.
2014). To calculate forager numbers per minute for each resource, respective
proportions were multiplied by activity. All foragers captured were held until the end of
the observation period to avoid recapturing the same individual.
2.3.4. Resource intake Nectar foragers were identified by their swollen abdomen. To collect the nectar, their
abdomen was carefully squeezed to provoke regurgitation of the crop content. Nectar
volume was quantified in 5 µL microcapillary tubes (Camag, Muttenz, Switzerland) and
nectar concentration was measured to the nearest 0.5 g/g sucrose equivalent by hand-
held refractometers (Eclipse Refractometer, Bellingham + Stanley Ltd., Lawrenceville,
USA). The sugar concentration in nectar (c in %) was converted into x (in µg/µL)
following (Kearns and Inouye 1993) with the values adjusted by Blüthgen, N. (personal
communication) according to the equation:
x = -0.0928 + 10.0131 * c + 0.0363 * c² + 0.0002 * c³.
With x and the measured nectar volume (V) we calculated the sugar load of each
individual nectar forager (in mg). To calculate the average sugar intake (in mg/min) for
each hive observation the following equation was applied:
n
PAVx N
n
**)*(1
where n is the overall number of nectar foragers for a given hive and observation, A
the hive activity, and PN the corresponding proportion of nectar foragers.
Pollen loads of foragers were removed from each hind leg with forceps and collected
in previously weighed Eppendorf tubes. The two pollen loads of each leg of a forager
were collected in two separate Eppendorf tubes. Eppendorf tubes were reweighed after
inserting pollen to calculate the average net pollen weight carried by all foragers. The
total pollen intake per minute of each hive (in mg/min) was then calculated as follows:
n
PAEE P**)( 21
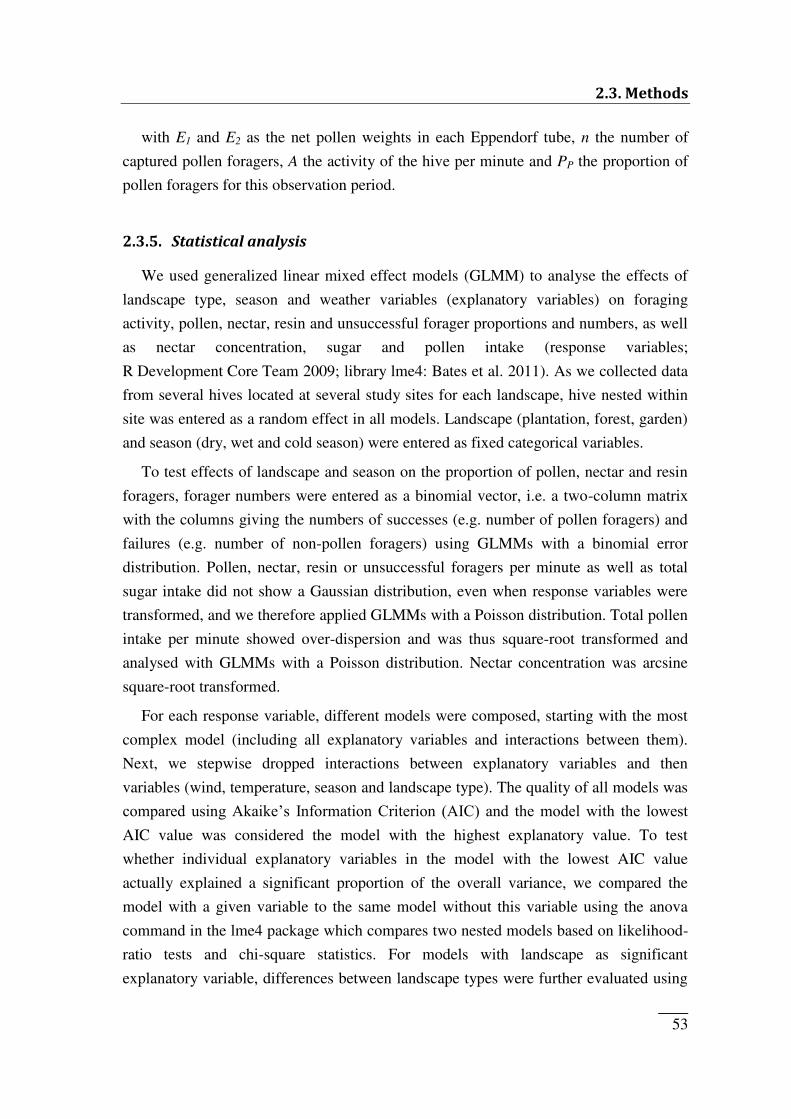
2.3. Methods
_____ 53
with E1 and E2 as the net pollen weights in each Eppendorf tube, n the number of
captured pollen foragers, A the activity of the hive per minute and PP the proportion of
pollen foragers for this observation period.
2.3.5. Statistical analysis We used generalized linear mixed effect models (GLMM) to analyse the effects of
landscape type, season and weather variables (explanatory variables) on foraging
activity, pollen, nectar, resin and unsuccessful forager proportions and numbers, as well
as nectar concentration, sugar and pollen intake (response variables;
R Development Core Team 2009; library lme4: Bates et al. 2011). As we collected data
from several hives located at several study sites for each landscape, hive nested within
site was entered as a random effect in all models. Landscape (plantation, forest, garden)
and season (dry, wet and cold season) were entered as fixed categorical variables.
To test effects of landscape and season on the proportion of pollen, nectar and resin
foragers, forager numbers were entered as a binomial vector, i.e. a two-column matrix
with the columns giving the numbers of successes (e.g. number of pollen foragers) and
failures (e.g. number of non-pollen foragers) using GLMMs with a binomial error
distribution. Pollen, nectar, resin or unsuccessful foragers per minute as well as total
sugar intake did not show a Gaussian distribution, even when response variables were
transformed, and we therefore applied GLMMs with a Poisson distribution. Total pollen
intake per minute showed over-dispersion and was thus square-root transformed and
analysed with GLMMs with a Poisson distribution. Nectar concentration was arcsine
square-root transformed.
For each response variable, different models were composed, starting with the most
complex model (including all explanatory variables and interactions between them).
Next, we stepwise dropped interactions between explanatory variables and then
variables (wind, temperature, season and landscape type). The quality of all models was
compared using Akaike‘s Information Criterion (AIC) and the model with the lowest AIC value was considered the model with the highest explanatory value. To test
whether individual explanatory variables in the model with the lowest AIC value
actually explained a significant proportion of the overall variance, we compared the
model with a given variable to the same model without this variable using the anova
command in the lme4 package which compares two nested models based on likelihood-
ratio tests and chi-square statistics. For models with landscape as significant
explanatory variable, differences between landscape types were further evaluated using
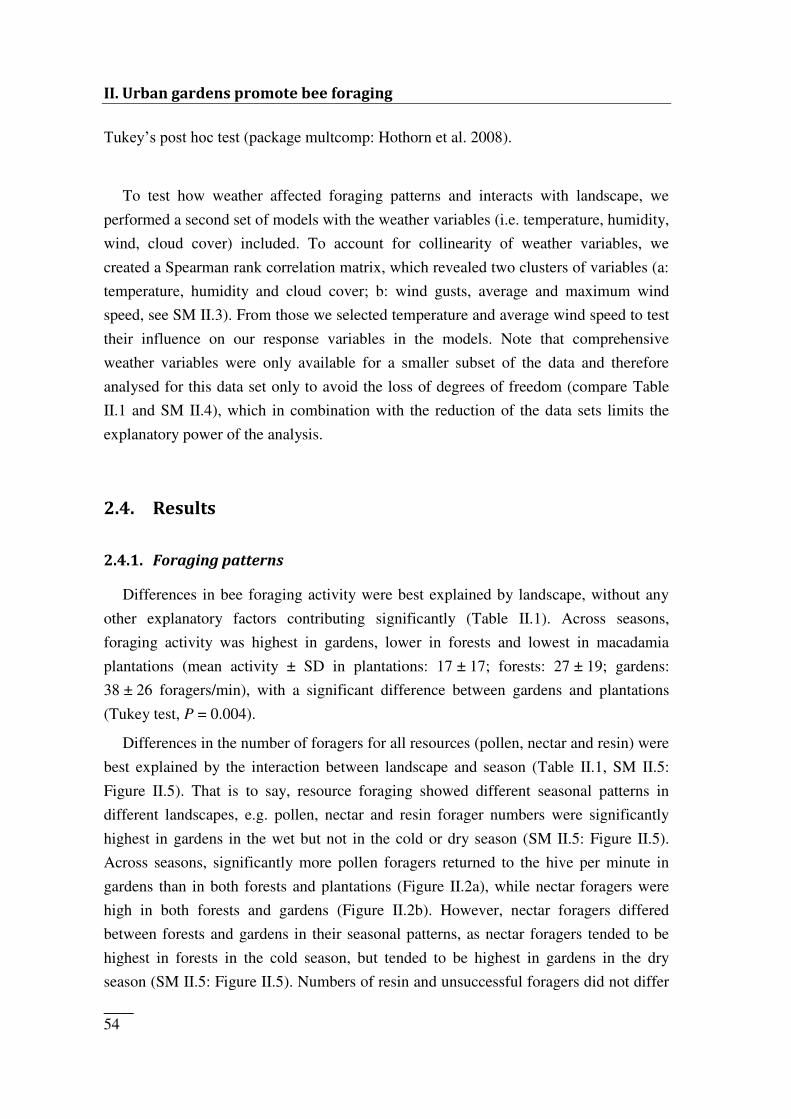
II. Urban gardens promote bee foraging
_____ 54
Tukey‘s post hoc test (package multcomp: Hothorn et al. 2008).
To test how weather affected foraging patterns and interacts with landscape, we
performed a second set of models with the weather variables (i.e. temperature, humidity,
wind, cloud cover) included. To account for collinearity of weather variables, we
created a Spearman rank correlation matrix, which revealed two clusters of variables (a:
temperature, humidity and cloud cover; b: wind gusts, average and maximum wind
speed, see SM II.3). From those we selected temperature and average wind speed to test
their influence on our response variables in the models. Note that comprehensive
weather variables were only available for a smaller subset of the data and therefore
analysed for this data set only to avoid the loss of degrees of freedom (compare Table
II.1 and SM II.4), which in combination with the reduction of the data sets limits the
explanatory power of the analysis.
2.4. Results 2.4.1. Foraging patterns
Differences in bee foraging activity were best explained by landscape, without any
other explanatory factors contributing significantly (Table II.1). Across seasons,
foraging activity was highest in gardens, lower in forests and lowest in macadamia
plantations (mean activity ± SD in plantations: 17 ± 17; forests: 27 ± 19; gardens:
38 ± 26 foragers/min), with a significant difference between gardens and plantations
(Tukey test, P = 0.004).
Differences in the number of foragers for all resources (pollen, nectar and resin) were
best explained by the interaction between landscape and season (Table II.1, SM II.5:
Figure II.5). That is to say, resource foraging showed different seasonal patterns in
different landscapes, e.g. pollen, nectar and resin forager numbers were significantly
highest in gardens in the wet but not in the cold or dry season (SM II.5: Figure II.5).
Across seasons, significantly more pollen foragers returned to the hive per minute in
gardens than in both forests and plantations (Figure II.2a), while nectar foragers were
high in both forests and gardens (Figure II.2b). However, nectar foragers differed
between forests and gardens in their seasonal patterns, as nectar foragers tended to be
highest in forests in the cold season, but tended to be highest in gardens in the dry
season (SM II.5: Figure II.5). Numbers of resin and unsuccessful foragers did not differ
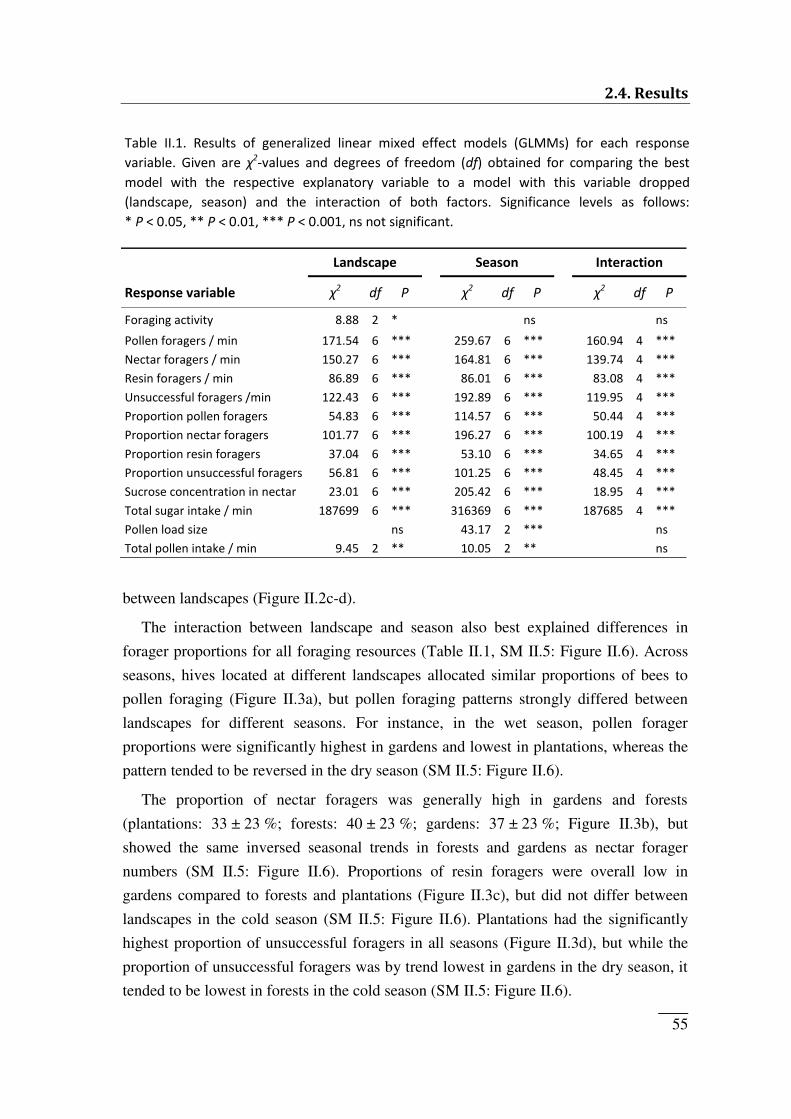
2.4. Results
_____ 55
between landscapes (Figure II.2c-d).
The interaction between landscape and season also best explained differences in
forager proportions for all foraging resources (Table II.1, SM II.5: Figure II.6). Across
seasons, hives located at different landscapes allocated similar proportions of bees to
pollen foraging (Figure II.3a), but pollen foraging patterns strongly differed between
landscapes for different seasons. For instance, in the wet season, pollen forager
proportions were significantly highest in gardens and lowest in plantations, whereas the
pattern tended to be reversed in the dry season (SM II.5: Figure II.6).
The proportion of nectar foragers was generally high in gardens and forests
(plantations: 33 ± 23 %; forests: 40 ± 23 %; gardens: 37 ± 23 %; Figure II.3b), but
showed the same inversed seasonal trends in forests and gardens as nectar forager
numbers (SM II.5: Figure II.6). Proportions of resin foragers were overall low in
gardens compared to forests and plantations (Figure II.3c), but did not differ between
landscapes in the cold season (SM II.5: Figure II.6). Plantations had the significantly
highest proportion of unsuccessful foragers in all seasons (Figure II.3d), but while the
proportion of unsuccessful foragers was by trend lowest in gardens in the dry season, it
tended to be lowest in forests in the cold season (SM II.5: Figure II.6).
Landscape Season Interaction Response variable χ2 df P χ2 df P χ2 df P Foraging activity 8.88 2 * ns ns Pollen foragers / min 171.54 6 *** 259.67 6 *** 160.94 4 *** Nectar foragers / min 150.27 6 *** 164.81 6 *** 139.74 4 *** Resin foragers / min 86.89 6 *** 86.01 6 *** 83.08 4 *** Unsuccessful foragers /min 122.43 6 *** 192.89 6 *** 119.95 4 *** Proportion pollen foragers 54.83 6 *** 114.57 6 *** 50.44 4 *** Proportion nectar foragers 101.77 6 *** 196.27 6 *** 100.19 4 *** Proportion resin foragers 37.04 6 *** 53.10 6 *** 34.65 4 *** Proportion unsuccessful foragers 56.81 6 *** 101.25 6 *** 48.45 4 *** Sucrose concentration in nectar 23.01 6 *** 205.42 6 *** 18.95 4 *** Total sugar intake / min 187699 6 *** 316369 6 *** 187685 4 *** Pollen load size ns 43.17 2 *** ns Total pollen intake / min 9.45 2 ** 10.05 2 ** ns
Table II.1. Results of generalized linear mixed effect models (GLMMs) for each response variable. Given are χ2-values and degrees of freedom (df) obtained for comparing the best model with the respective explanatory variable to a model with this variable dropped (landscape, season) and the interaction of both factors. Significance levels as follows: * P < 0.05, ** P < 0.01, *** P < 0.001, ns not significant.
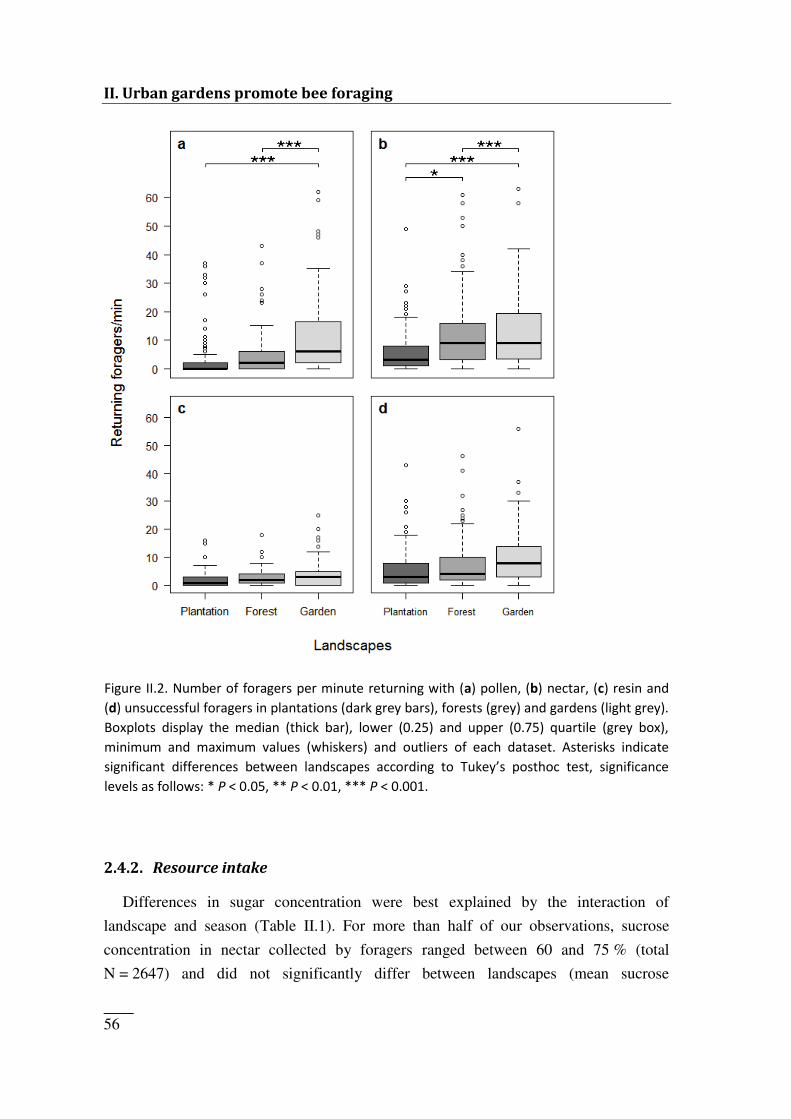
II. Urban gardens promote bee foraging
_____ 56
2.4.2. Resource intake Differences in sugar concentration were best explained by the interaction of
landscape and season (Table II.1). For more than half of our observations, sucrose
concentration in nectar collected by foragers ranged between 60 and 75 % (total
N = 2647) and did not significantly differ between landscapes (mean sucrose
Figure II.2. Number of foragers per minute returning with (a) pollen, (b) nectar, (c) resin and (d) unsuccessful foragers in plantations (dark grey bars), forests (grey) and gardens (light grey). Boxplots display the median (thick bar), lower (0.25) and upper (0.75) quartile (grey box), minimum and maximum values (whiskers) and outliers of each dataset. Asterisks indicate sig ifi a t differe es et ee la ds apes a ordi g to Tuke ’s postho test, sig ifi a e levels as follows: * P < 0.05, ** P < 0.01, *** P < 0.001.
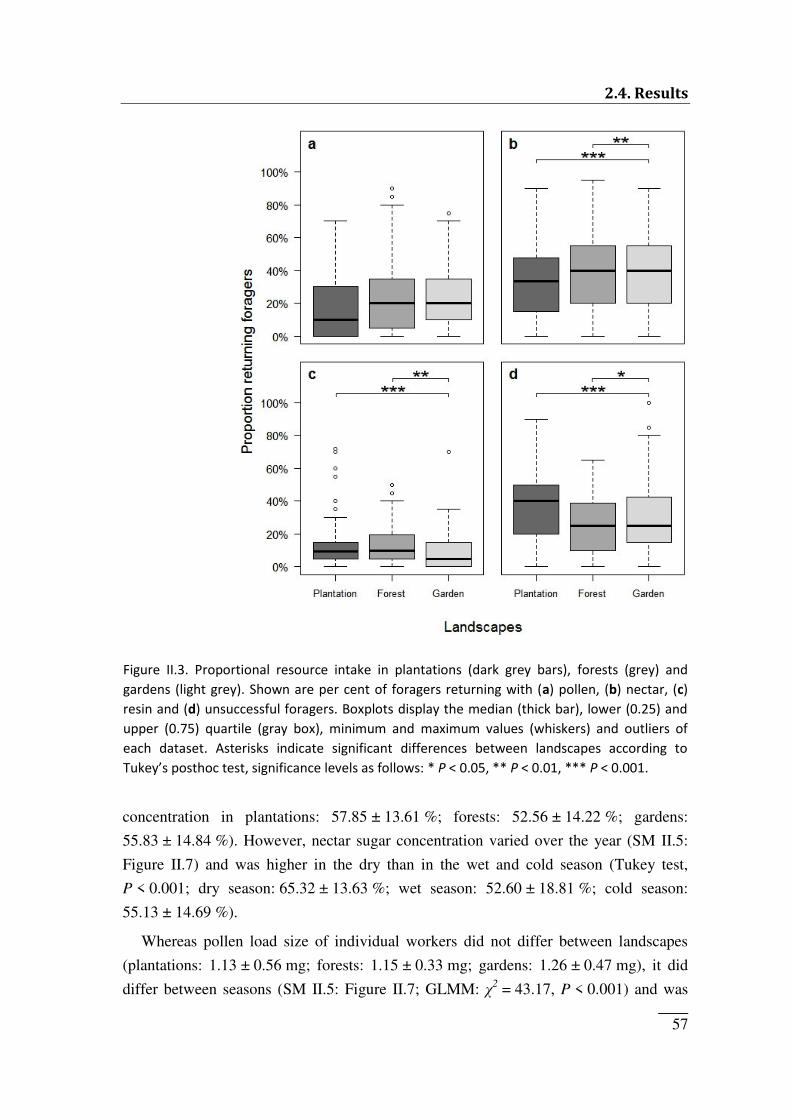
2.4. Results
_____ 57
concentration in plantations: 57.85 ± 13.61 %; forests: 52.56 ± 14.22 %; gardens:
55.83 ± 14.84 %). However, nectar sugar concentration varied over the year (SM II.5:
Figure II.7) and was higher in the dry than in the wet and cold season (Tukey test,
P < 0.001; dry season: 65.32 ± 13.63 %; wet season: 52.60 ± 18.81 %; cold season:
55.13 ± 14.69 %).
Whereas pollen load size of individual workers did not differ between landscapes
(plantations: 1.13 ± 0.56 mg; forests: 1.15 ± 0.33 mg; gardens: 1.26 ± 0.47 mg), it did
differ between seasons (SM II.5: Figure II.7; GLMM: χ2 = 43.17, P < 0.001) and was
Figure II.3. Proportional resource intake in plantations (dark grey bars), forests (grey) and gardens (light grey). Shown are per cent of foragers returning with (a) pollen, (b) nectar, (c) resin and (d) unsuccessful foragers. Boxplots display the median (thick bar), lower (0.25) and upper (0.75) quartile (gray box), minimum and maximum values (whiskers) and outliers of each dataset. Asterisks indicate significant differences between landscapes according to Tuke ’s postho test, sig ifi a e le els as follo s: * P < 0.05, ** P < 0.01, *** P < 0.001.
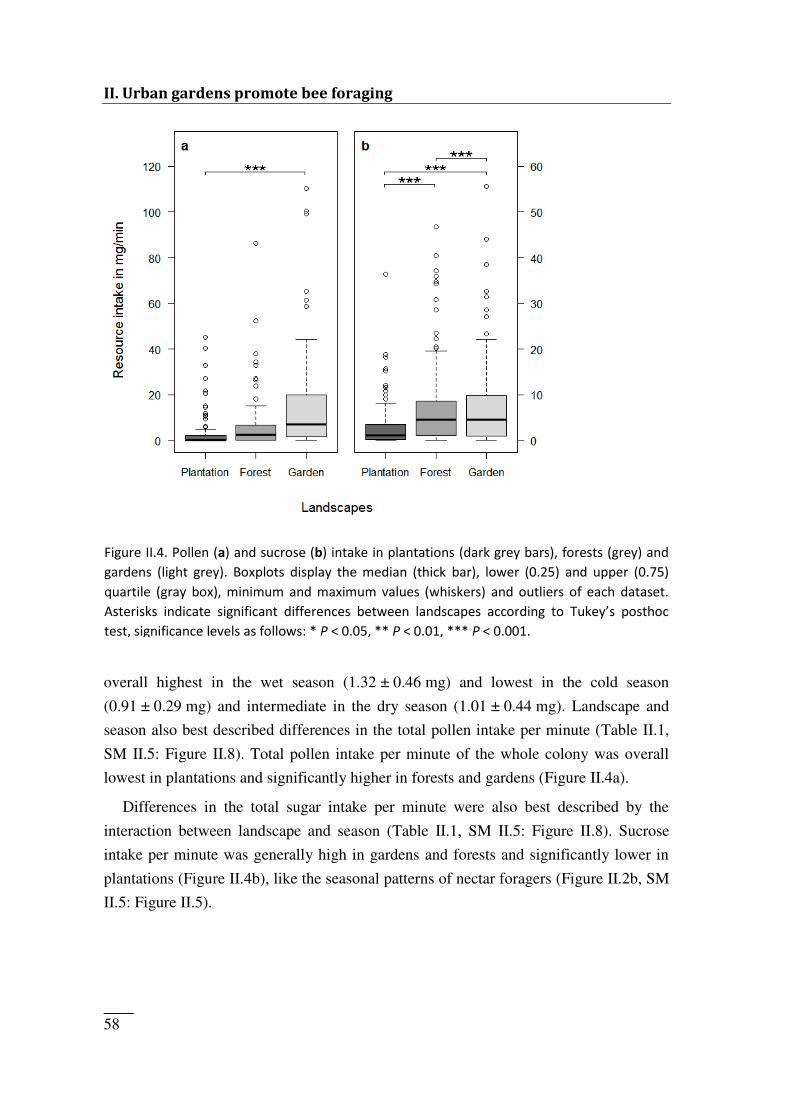
II. Urban gardens promote bee foraging
_____ 58
overall highest in the wet season (1.32 ± 0.46 mg) and lowest in the cold season
(0.91 ± 0.29 mg) and intermediate in the dry season (1.01 ± 0.44 mg). Landscape and
season also best described differences in the total pollen intake per minute (Table II.1,
SM II.5: Figure II.8). Total pollen intake per minute of the whole colony was overall
lowest in plantations and significantly higher in forests and gardens (Figure II.4a).
Differences in the total sugar intake per minute were also best described by the
interaction between landscape and season (Table II.1, SM II.5: Figure II.8). Sucrose
intake per minute was generally high in gardens and forests and significantly lower in
plantations (Figure II.4b), like the seasonal patterns of nectar foragers (Figure II.2b, SM
II.5: Figure II.5).
Figure II.4. Pollen (a) and sucrose (b) intake in plantations (dark grey bars), forests (grey) and gardens (light grey). Boxplots display the median (thick bar), lower (0.25) and upper (0.75) quartile (gray box), minimum and maximum values (whiskers) and outliers of each dataset. Asterisks i di ate sig ifi a t differe es et ee la ds apes a ordi g to Tuke ’s postho test, significance levels as follows: * P < 0.05, ** P < 0.01, *** P < 0.001.
2.5. Discussion
_____ 59
2.4.3. Influence of weather Weather variables, i.e. temperature and average wind speed, significantly affected
our foraging response variables (SM II.4). However, variation in foraging activity and
forager numbers was largely explained by interactions between landscape, season,
temperature and average wind speed (SM II.4). The same was true for proportions of
pollen, nectar and unsuccessful foragers as well as total pollen and sugar intake (SM
II.4). The proportion of resin foragers was not influenced by temperature, and resin
foragers per minute were not influenced by average wind speed (SM II.4).
Consequently, landscape had a strong influence in all models even when weather
variables were included, and the explanatory values of all models significantly
decreased when landscape was dropped (GLMM: P < 0.001 in all cases, SM II.4).
2.5. Discussion Wild bee populations are declining in human altered landscapes likely due to reduced
availability of food resources (Decourtye et al. 2010; Winfree 2010; Roulston and
Goodell 2011). Because plant resource availability and diversity in landscapes drive
foraging dynamics in bees (Decourtye et al. 2010; Jha and Kremen 2013), we
investigated how foraging patterns and resource intake in a highly social bee species are
affected by landscape-related differences in resource availability. Our results clearly
show that foraging patterns strongly differed between different human altered
landscapes and the bees‘ natural habitat depending on season. Contrary to our expectations, pollen and nectar foraging, nectar forager numbers and sugar and pollen
intake were highest in gardens, not in natural forests.
2.5.1. Foraging patterns Foraging activities were highest in gardens across all seasons in both years,
indicating that gardens provide abundant floral resources to forage on compared with
other landscapes. All key resources needed for provison and rearing brood were
abundant and fully utilized by bee hives in gardens. The steady food availability was
most likely due to a mix of native and exotic plants in gardens which produce a
continuous supply of floral resources (Head et al. 2004), known to benefit generalist bee
species (Winfree 2010; Levy 2011). This result agrees with previous findings showing
that urban or suburban gardens represent beneficial landscape elements by providing
plentiful food resources and foraging opportunites for bees which increases bee
II. Urban gardens promote bee foraging
_____ 60
abundance and density in social and solitary bees (Gotlieb et al. 2011; Samnegård et al.
2011; Hinners et al. 2012). Moreover, access to anthropogenically disturbed patches
with additionally planted (flowering) plant species in a homogenous natural landscape
can improve habitat quality, as connected patches of high plant diversity in a mosaic
landscape provide additional foraging opportunities (Williams and Kremen 2007;
Winfree et al. 2007). Human altered, highly heterogenous habitats, such as gardens, can
consequently be of high foraging value. While Hernandez et al. (2009) suggest that this
positive effect of urbanization may be limited to eusocial or generalist bees, Baldock et
al. (2015) found bee richness across taxa to be higher in urban areas than on farms and
to be marginally higher in urban areas than in nature reserves.
Social bee colonies further respond to the spatio-temporal changes of resource
availability in a landscape by adjusting the number of foragers for any target resource
according to their colony needs. We found high proportions of nectar foragers and lower
proportions of resin and unsuccessful foragers in gardens than in other landscapes,
whereas the proportion of pollen foragers did not differ between landscapes. Pollen is a
limited plant resource and is, unlike nectar, not constantly replenished by the plant and
can thus be depleted over the course of a day (Roubik 1989). Bees should thus primarily
collect pollen when available. Periods of high pollen availability occurred at all of our
study sites. Consequently and as predicted, we found a similar proportion of pollen
foragers when comparing landscapes across seasons.
The generally higher proportion of successful foragers in gardens is most likely due
to the very small-scaled and patchy resource landscape with steady flowering across all
seasons, including a variety of bird pollinated native plants with a continuous supply of
nectar (Ford et al. 1979). Contrary to our predictions, resin foraging was not higher in
forests than plantations, even though resin availability was predicted to largely increase
with tree availability (Leonhardt and Blüthgen 2009). In gardens with limited numbers
of resiniferous trees, hives allocated a smaller proportion of foragers, but similar overall
forager numbers to collect resin. Stingless bee workers are known to rarely switch from
or to resin foraging behaviour during the day, which keeps resin forager numbers fairly
steady (Inoue et al. 1985; Wallace and Lee 2010). An overall higher foraging activity in
gardens therefore allows hives to collect more pollen and nectar, while gathering similar
total amounts of resin, compared to hives with lower foraging activities in forests or
plantations. Contrary to our expectations, T. carbonaria thus seemed to have a specific
intake target for resin as we observed similar numbers of returning resin foragers in all
landscapes, which contradicts our prediction and suggests that resin is sufficiently
available in all landscapes.
2.5. Discussion
_____ 61
In contrast to gardens with their continuous pollen supply, pollen collection as well
as overall foraging activity in forests seemed to be largely driven by the main mass
flowering of eucalypts in the dry and cold season (Beardsell et al. 1993). The effect of
mass flowering on a colony‘s pollen intake has also been shown for stingless bee colonies in Borneo which strongly responded to the mass flowering of dipterocarp trees
(Eltz et al. 2001). Mass flowering crops also increase foraging and reproductive success
in honey bees and solitary bees (Jauker et al. 2012; Odoux et al. 2012).
In accordance with our expectations, the number of unsuccessful foragers was high
in plantations and foraging activity generally weak and only peaked during the 5-8 week
period of macadamia mass flowering in the dry season (Heard 1993; Wallace et al.
1996). But even then, it rarely reached as high activity levels as observed in gardens.
Plantation hives may have struggled to build up sufficient numbers of foragers to make
use of the macadamia mass flowering after a long dormant state in the cold season.
Foraging nevertheless continued all year long in plantations, but limited availability of
flowering plants besides macadamia strongly constrained foraging activity of hives.
This finding agrees with previous studies showing that seasonal resource limitation
impacts on bee foraging in landscapes with mass flowering crops dominating
(Decourtye et al. 2010; Williams et al. 2012).
2.5.2. Resource intake Sucrose concentrations between 60-75 %, as often observed in our study, are
unusually high compared to other ecosystems with maximum concentrations of 60 % or
often less than 35 % sugar content of nectar collected by bees (Roubik 1989). Australia
and specifically its arid areas have been proposed to offer plentiful carbohydrate
resources, which in turn favour opportunistic social insects (Morton et al. 2011). We
found highest nectar concentrations in the dry season across landscapes which further
points to the importance of short flowering events of specific nectar plants, e.g.
macadamia or eucalypts, as a driver of nectar foraging dynamics. Although the nectar
collected likely originated from different foraging plant sources in the different
landscapes, nectar of high quality seemed to be available in all landscape types and does
not explain resource related shortcomings.
Sugar intake rates were nevertheless two to three times higher in gardens and forests
than in plantations, with greatest differences between landscapes in the dry season. As
nectar concentration varied little between landscapes and season, sugar intake rates were
predominantly determined by the overall proportion of nectar foragers and hive foraging
II. Urban gardens promote bee foraging
_____ 62
activity.
Pollen intake rates of hives in forests were twice as high as in plantations and five
times higher in gardens than in plantations. Yet the size of pollen loads of single
workers, which corresponds to the efficiency of single foraging trips, did not vary
between landscapes across seasons. Pollen foragers were thus likely able to maximize
their load in all landscapes. Consequently, the higher pollen foraging success in forests
and gardens was again due to higher foraging activity. This finding highlights the role
of hive foraging activity as a response to landscape resource availability in determining
the overall foraging success of social bees.
Unlike social bees, generalist solitary bees cannot equivalently increase their
resource intake in response to increasing resource availability, because they cannot
recruit additional bees to foraging when resources are plentiful. Thus, even if they could
use all plant sources available to social bees, their abundance and fitness would most
likely be more strongly affected by other parameters, such as foraging distances
(Zurbuchen et al. 2010) or climate (Vicens and Bosch 2000), provided they have access
to sufficient nesting opportunities (Zanette et al. 2005; Cane et al. 2006; Hernandez et
al. 2009).
Abiotic factors, like temperature, humidity, wind speed and luminosity, are known to
further strongly influence bee foraging behaviour, especially in tropical stingless bees
(Ferreira et al. 2010; Figueiredo-Mecca et al. 2013) and other bees (Brittain et al. 2013;
Kühsel and Blüthgen 2015). These weather factors also contributed to the activity
patterns observed in our study, but their influence was minor compared to landscape
related patterns of resource foraging.
To summarize, we found that landscape strongly affected foraging patterns and
resource intake in a social bee. Moreover, bees responded differently to different
anthropogenic habitat alterations compared to natural forest habitats, with foraging
activity and thus resource intake being strongly impaired in agricultural monocultures,
but largely improved in flower-rich gardens. While previous studies focused on the
negative effects of plant resource impoverishment in agricultural landscapes on bees
(Decourtye et al. 2010; Lentini et al. 2012; Williams et al. 2012), few studies have
hitherto investigated how gardens affect bee foraging and resource intake (Hennig and
Ghazoul 2012; Wojcik and McBride 2012). Cities worldwide differ in the extent of
remaining green areas, flower resources and nesting space and may thus differentially
2.6. Acknowledgments
_____ 63
affect bees (Hernandez et al. 2009; Matteson et al. 2013; Lowenstein et al. 2014), but
our study shows that gardens can increase resource intake and thus foraging success in
social bees even beyond natural habitats.
2.6. Acknowledgments The authors thank Rhys Smith, Julia Nagler, Manuel Pützstück, Birte Hensen, Nora
Drescher, Mia Kaluza, Marvin Schäfer and Bradley Jeffers for assistance with field
work. We further thank Sahara Farms, Macadamia Farm Management Pty Ltd and
Maroochy Bushland Botanic Gardens, as well as numerous private land and garden
owners who looked after the bee hives. Thanks also go to Henrik von Wehrden and
Alexander Keller for advice on statistics. We further thank Sanjeev Kumar Srivastava
and Jie Zhang for assistance with the GIS map. We are very grateful for the detailed
comments provided by two anonymous reviewers which greatly improved the
manuscript. BFK received funding from the German Academic Exchange Agency
(DAAD). The project was funded by the German Research Foundation (DFG), LE
2750/1-1.
II. Urban gardens promote bee foraging
_____ 64
2.7. References Aizen, M.A. and P. Feinsinger (1994). "Habitat fragmentation, native insect pollinators, and
feral honeybees in Argentine Chaco Serrano". Ecological Applications, 4(2): 378-392.
Allen-Wardell, G., P. Bernhardt, R. Bitner, A. Burquez, S. Buchmann, J. Cane, (...) S. Walker
(1998). "The potential consequences of pollinator declines on the conservation of
biodiversity and stability of food crop yields". Conservation Biology, 12(1): 8-17.
Altaye, S.Z., C.W.W. Pirk, R.M. Crewe and S.W. Nicolson (2010). "Convergence of
carbohydrate-biased intake targets in caged worker honeybees fed different protein
sources". Journal of Experimental Biology, 213(19): 3311-3318.
Baldock, K.C.R., M.A. Goddard, D.M. Hicks, W.E. Kunin, N. Mitschunas, L.M. Osgathorpe,
(...) J. Memmott (2015). "Where is the UK's pollinator biodiversity? The importance of
urban areas for flower-visiting insects". Proceedings of the Royal Society B: Biological
Sciences, 282(1803).
Bates, D., M. Mächler and B. Bolker (2011). "lme4: Linear mixed-effects models using S4
classes". R package version 0.999375-42. Available at: http://CRAN.R-
project.org/package=lme4.
Beardsell, D.V., S.P. O'Brien, E.G. Williams, R.B. Knox and D.M. Calder (1993).
"Reproductive biology of Australian Myrtaceae". Australian Journal of Botany, 41:
511-526.
Biesmeijer, J.C., M. Born, S. Lukacs and M.J. Sommeijer (1999). "The response of the stingless
bee Melipona beecheii to experimental pollen stress, worker loss and different levels of
information input". Journal of Apicultural Research, 38(1-2): 33-41.
Bird, R.B., D.W. Bird, B.F. Codding, C.H. Parker and J.H. Jones (2008). "The "fire stick
farming" hypothesis: Australian Aboriginal foraging strategies, biodiversity, and
anthropogenic fire mosaics". Proceedings of the National Academy of Sciences of the
United States of America, 105(39): 14796-14801.
Brittain, C., C. Kremen and A.M. Klein (2013). "Biodiversity buffers pollination from changes
in environmental conditions". Global Change Biology, 19(2): 540-547.
Brodschneider, R. and K. Crailsheim (2010). "Nutrition and health in honey bees". Apidologie,
41(3): 278-294.
Cairns, C.E., R. Villanueva-Gutierrez, S. Koptur and D.B. Bray (2005). "Bee populations, forest
disturbance, and africanization in Mexico". Biotropica, 37(4): 686-692.
Cane, J.H., R.L. Minckley, L.J. Kervin, T.H. Roulston and N.M. Williams (2006). "Complex
responses within a desert bee guild (Hymenoptera : Apiformes) to urban habitat
fragmentation". Ecological Applications, 16(2): 632-644.
Decourtye, A., E. Mader and N. Desneux (2010). "Landscape enhancement of floral resources
for honey bees in agro-ecosystems". Apidologie, 41(3): 264-277.
2.7. References
_____ 65
Dollin, A.E., L.J. Dollin and S.F. Sakagami (1997). "Australian stingless bees of the genus
Trigona (Hymenoptera : Apidae)". Invertebrate Taxonomy, 11(6): 861-896.
Eltz, T., C.A. Brühl, S.v.d. Kaars and K.E. Linsenmair (2001). "Pollen foraging and resource
partitioning of stingless bees in relation to flowering dynamics in a Southeast Asian
tropical rainforest". Insectes Sociaux, 48: 273-279.
Eltz, T., C.A. Brühl, S.v.d. Kaars and K.E. Linsenmair (2002). "Determinants of stingless bee
nest density in lowland dipterocarp forests of Sabah, Malaysia". Oecologia, 131: 27-34.
Ferreira, N.T., B. Blochtein and J.F. de Moraes (2010). "Seasonal flight and resource collection
patterns of colonies of the stingless bee Melipona bicolor schencki Gribodo (Apidae,
Meliponini) in an Araucaria forest area in southern Brazil". Revista Brasileira De
Entomologia, 54(4): 630-636.
Figueiredo-Mecca, G., L.R. Bego and F.S. Nascimento (2013). "Foraging behavior of
Scaptotrigona depilis (Hymenoptera, Apidae, Meliponini) and its relationship with
temporal and abiotic Factors". Sociobiology, 60(3): 277-282.
Ford, H.A., D.C. Paton and N. Forde (1979). "Birds as pollinators of Australian plants". New
Zealand Journal of Botany, 17(4): 509-519.
Garibaldi, L.A., I. Steffan-Dewenter, R. Winfree, M.A. Aizen, R. Bommarco, S.A.
Cunningham, (...) A.M. Klein (2013). "Wild pollinators enhance fruit set of crops
regardless of honey bee abundance". Science, 339(6127): 1608-1611.
Gotlieb, A., Y. Hollender and Y. Mandelik (2011). "Gardening in the desert changes bee
communities and pollination network characteristics". Basic and Applied Ecology,
12(4): 310-320.
Greco, M.K., D. Hoffmann, A. Dollin, M. Duncan, R. Spooner-Hart and P. Neumann (2010).
"The alternative Pharaoh approach: stingless bees mummify beetle parasites alive".
Naturwissenschaften, 97(3): 319-323.
Greenleaf, S.S., N.M. Williams, R. Winfree and C. Kremen (2007). "Bee foraging ranges and
their relationship to body size". Oecologia, 153: 589-596.
Halcroft, M.T. (2012). "Investigations into the biology, behaviour and phylogeny of a potential
crop pollinator: the Australian stingless bee, Austroplebeia australis" Doctor of
Philosophy thesis, University of Western Sydney, Sydney.
Head, L., P. Muir and E. Hampel (2004). "Australian backyard gardens and the journey of
migration". Geographical Review, 94(3): 326-347.
Heard, T. (1993). "Pollinator requirements and flowering patterns of Macadamia integrifolia".
Australian Journal of Botany, 41(5): 491-497.
Heard, T. (1994). "Behaviour and pollinator efficiency of stingless bees and honey bees on
macadamia flowers". Journal of Apicultural Research, 33(4): 191-198.
II. Urban gardens promote bee foraging
_____ 66
Heard, T.A. (2016). "The Australian native bee book. Keeping stingless bee hives for pets,
pollination and sugarbag hone". Sugarbag Bees, Brisbane.
Heard, T.A. and E.M. Exley (1994). "Diversity, abundance and distribution of insect visitors to
macadamia flowers". Environmental Entomology, 23(1): 91-100.
Heard, T.A. and J.K. Hendrikz (1993). "Factors influencing flight activity of colonies of the
stingless bee Trigona carbonaria (Hymenoptera, Apidae)". Australian Journal of
Zoology, 41(4): 343-353.
Hennig, E.I. and J. Ghazoul (2012). "Pollinating animals in the urban environment". Urban
Ecosystems, 15(1): 149-166.
Hernandez, J.L., G.W. Frankie and R.W. Thorp (2009). "Ecology of urban bees: a review of
current knowledge and directions for future study". Cities and the Environment (CATE),
2(1): 3.
Hilário, S.D., M.d.F. Ribeiro and V.L. Imperatriz-Fonseca (2012). "Can climate shape flight
activity patterns of Plebeia remota (Hymenoptera, Apidae)?". Iheringia. Série Zoologia,
102: 269-276.
Hinners, S.J., C.A. Kearns and C.A. Wessman (2012). "Roles of scale, matrix, and native
habitat in supporting a diverse suburban pollinator assemblage". Ecological
Applications, 22(7): 1923-1935.
Hofstede, F.E. and M.J. Sommeijer (2006). "Influence of environmental and colony factors on
the initial commodity choice of foragers of the stingless bee Plebeia tobagoensis
(Hymenoptera, Meliponini)". Insectes Sociaux, 53(3): 258-264.
Hothorn, T., F. Bretz and P. Westfall (2008). "Simultaneous inference in general parametric
models". Biometrical Journal, 50(3): 346-363.
Inoue, T., S. Salmah, I. Abbas and E. Yusuf (1985). "Foraging behavior of individual workers
and foraging dynamics of colonies of three Sumatran stingless bees". Researches on
Population Ecology, 27(2): 373-392.
Jauker, F., F. Peter, V. Wolters and T. Diekötter (2012). "Early reproductive benefits of mass-
flowering crops to the solitary bee Osmia rufa outbalance post-flowering
disadvantages". Basic and Applied Ecology, 13(3): 268-276.
Jha, S. and C. Kremen (2013). "Resource diversity and landscape-level homogeneity drive
native bee foraging". Proceedings of the National Academy of Sciences of the United
States of America, 110(2): 555-558.
Kearns, C.A. and D.W. Inouye (1993). "Techniques for pollination biologists". University Press
of Colorado, Niwor, Colorado, USA.
Kennedy, C.M., E. Lonsdorf, M.C. Neel, N.M. Williams, T.H. Ricketts, R. Winfree, (...) C.
Kremen (2013). "A global quantitative synthesis of local and landscape effects on wild
bee pollinators in agroecosystems". Ecology Letters, 16(5): 584-599.
2.7. References
_____ 67
Klein, A.-M., B.E. Vaissiere, J.H. Cane, I. Steffan-Dewenter, S.A. Cunningham, C. Kremen and
T. Tscharntke (2007). "Importance of pollinators in changing landscapes for world
crops". Proceedings of the Royal Society B: Biological Sciences, 274(1608): 303-313.
Klumpp, J. (2007). "Australian stingless bees - a guide to sugarbag beekeeping". Earthling
Enterprises, Brisbane, Australia.
Kühsel, S. and N. Blüthgen (2015). "High diversity stabilizes the thermal resilience of pollinator
communities in intensively managed grasslands". Nat Commun, 6.
Lentini, P.E., T.G. Martin, P. Gibbons, J. Fischer and S.A. Cunningham (2012). "Supporting
wild pollinators in a temperate agricultural landscape: maintaining mosaics of natural
features and production". Biological Conservation, 149(1): 84-92.
Leonhardt, S.D. and N. Blüthgen (2009). "A sticky affair: resin collection by Bornean stingless
bees". Biotropica, 41(6): 730-736.
Leonhardt, S.D., T.A. Heard and H. Wallace (2014). "Differences in the resource intake of two
sympatric Australian stingless bee species". Apidologie, 45(4): 514-527.
Levy, S. (2011). "What's best for bees". Nature, 479(7372): 164-165.
Loram, A., K. Thompson, P.H. Warren and K.J. Gaston (2008). "Urban domestic gardens (XII):
The richness and composition of the flora in five UK cities". Journal of Vegetation
Science, 19(3): 321-367.
Lowenstein, D.M., K.C. Matteson, I. Xiao, A.M. Silva and E.S. Minor (2014). "Humans, bees,
and pollination services in the city: the case of Chicago, IL (USA)". Biodiversity and
Conservation, 23(11): 2857-2874.
Matteson, K.C., J.B. Grace and E.S. Minor (2013). "Direct and indirect effects of land use on
floral resources and flower-visiting insects across an urban landscape". Oikos, 122(5):
682-694.
Michener, C.D. (2007). "The bees of the world". John Hopkins University Press, Baltimore &
London.
Morton, S.R., D.M. Stafford Smith, C.R. Dickman, D.L. Dunkerley, M.H. Friedel, R.R.J.
McAllister, (...) M. Westoby (2011). "A fresh framework for the ecology of arid
Australia". Journal of Arid Environments, 75(4): 313-329.
Naug, D. (2009). "Nutritional stress due to habitat loss may explain recent honeybee colony
collapses". Biological Conservation, 142(10): 2369-2372.
Nicolson, S.W. (2011). "Bee food: the chemistry and nutritional value of nectar, pollen and
mixtures of the two". African Zoology, 46(2): 197-204.
Odoux, J.F., D. Feuillet, P. Aupinel, Y. Loublier, J.N. Tasei and C. Mateescu (2012).
"Territorial biodiversity and consequences on physico-chemical characteristics of pollen
collected by honey bee colonies". Apidologie, 43(5): 561-575.
II. Urban gardens promote bee foraging
_____ 68
Oliveira, F.L.d., V.H.P. Dias, E.M.d. Costa, M.A. Filgueira and J. Espínola Sobrinho (2012).
"Influência das variações climáticas na atividade de vôo das abelhas jandairas Melipona
subnitida Ducke (Meliponinae)". Revista Ciência Agronômica, 43: 598-603.
Polatto, L., J. Chaud-Netto and V. Alves-Junior (2014). "Influence of abiotic factors and floral
resource availability on daily foraging activity of bees". Journal of Insect Behavior,
27(5): 593-612.
Potts, S.G., J.C. Biesmeijer, C. Kremen, P. Neumann, O. Schweiger and W.E. Kunin (2010).
"Global pollinator declines: trends, impacts and drivers". Trends in Ecology and
Evolution, 25(6): 345-353.
R Development Core Team (2009). "R: A language and environment for statistical computing"
R Foundation for Statistical Computing, Vienna, Austria. Available at: http://www.R-
project.org.
Rasmussen, C. and S.A. Cameron (2007). "A molecular phylogeny of the Old World stingless
bees (Hymenoptera: Apidae: Meliponini) and the non-monophyly of the large genus
Trigona". Systematic Entomology, 32: 26-39.
Ricketts, T.H. (2004). "Tropical forest fragments enhance pollinator activity in nearby coffee
crops". Conservation Biology, 18(5): 1262-1271.
Roubik, D.W. (1989). "Ecology and natural history of tropical bees". Cambridge University
Press, New York.
Roulston, T.H. and K. Goodell (2011). "The role of resources and risks in regulating wild bee
populations". Annual Review of Entomology, 56(1): 293-312.
Rundlöf, M., H. Nilsson and H.G. Smith (2008). "Interacting effects of farming practice and
landscape context on bumblebees". Biological Conservation, 141(2): 417-426.
Samnegård, U., A.S. Persson and H.G. Smith (2011). "Gardens benefit bees and enhance
pollination in intensively managed farmland". Biological Conservation, 144(11): 2602-
2606.
Steffan-Dewenter, I., U. Munzenberg, C. Burger, C. Thies and T. Tscharntke (2002). "Scale-
dependent effects of landscape context on three pollinator guilds". Ecology, 83(5):
1421-1432.
Vanbergen, A.J. and the Insect Pollinators Initiative (2013). "Threats to an ecosystem service:
pressures on pollinators". Frontiers in Ecology and the Environment, 11(5): 251-259.
Vicens, N. and J. Bosch (2000). "Weather-dependent pollinator activity in an apple orchard,
with special reference to Osmia cornuta and Apis mellifera (Hymenoptera:
Megachilidae and Apidae)". Environmental Entomology, 29(3): 413-420.
Vithanage, V. and D.A. Ironside (1986). "The insect pollinators of macadamia and their relative
importance". Journal of the Australian Institute of Agricultural Science, 52(3): 155-160.
2.7. References
_____ 69
Wallace, H.M. and D.J. Lee (2010). "Resin-foraging by colonies of Trigona sapiens and T.
hockingsi (Hymenoptera: Apidae, Meliponini) and consequent seed dispersal of
Corymbia torelliana (Myrtaceae)". Apidologie, 41: 428-435.
Wallace, H.M., V. Vithanage and E.M. Exley (1996). "The effect of supplementary pollination
on nut set of Macadamia (Proteaceae)". Annals of Botany, 78(6): 765-773.
Williams, N.M. and C. Kremen (2007). "Resource distributions among habitats determine
solitary bee offspring production in a mosaic landscape". Ecological Applications, 17:
910-921.
Williams, N.M., J. Regetz and C. Kremen (2012). "Landscape-scale resources promote colony
growth but not reproductive performance of bumble bees". Ecology, 93: 1049–1058.
Winfree, R. (2010). "The conservation and restoration of wild bees". Year in Ecology and
Conservation Biology 2010, 1195: 169-197.
Winfree, R., R. Aguilar, D.P. Vázquez, G. LeBuhn and M.A. Aizen (2009). "A meta-analysis of
bees' responses to anthropogenic disturbance". Ecology, 90(8): 2068-2076.
Winfree, R., T. Griswold and C. Kremen (2007). "Effect of human disturbance on bee
communities in a forested ecosystem". Conservation Biology, 21(1): 213-223.
Wojcik, V.A. and J.R. McBride (2012). "Common factors influence bee foraging in urban and
wildland landscapes". Urban Ecosystems, 15(3): 581-598.
Zanette, L.R.S., R.P. Martins and S.P. Ribeiro (2005). "Effects of urbanization on Neotropical
wasp and bee assemblages in a Brazilian metropolis". Landscape and Urban Planning,
71(2-4): 105-121.
Zurbuchen, A., S. Cheesman, J. Klaiber, A. Müller, S. Hein and S. Dorn (2010). "Long foraging
distances impose high costs on offspring production in solitary bees". Journal of Animal
Ecology, 79: 674-681.
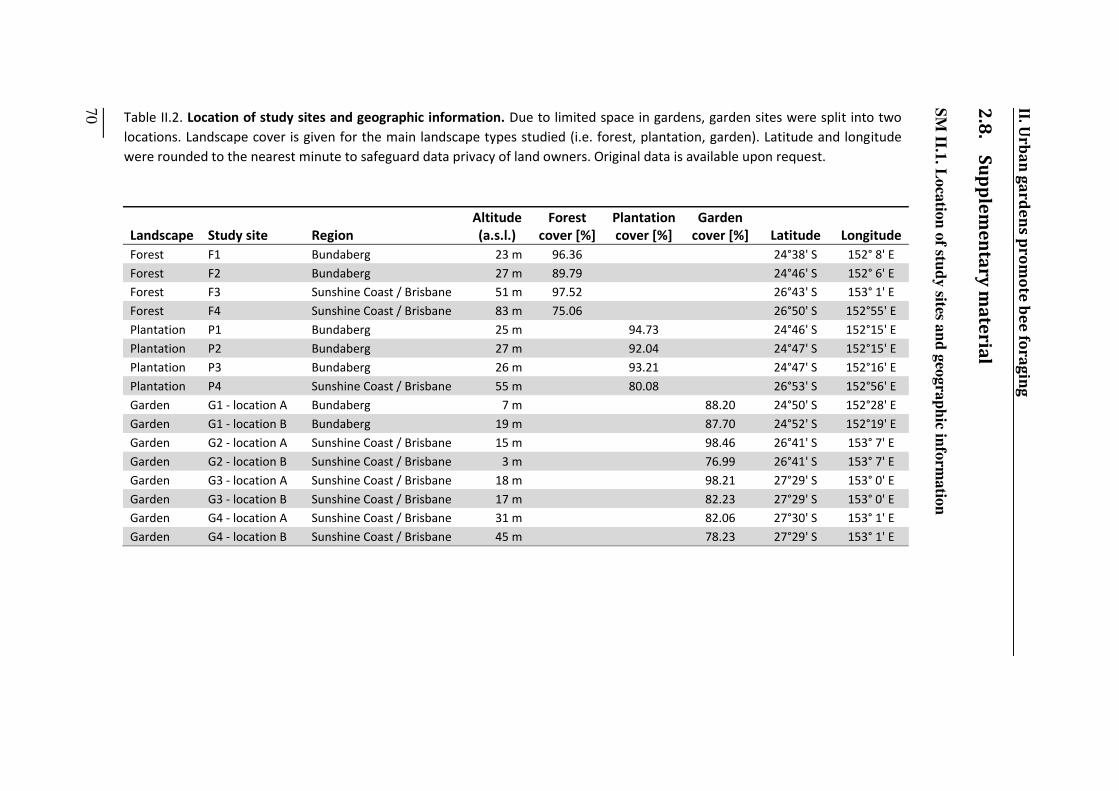
2.8. Supplementary material
Table II.2. Location of study sites and geographic information. Due to limited space in gardens, garden sites were split into two locations. Landscape cover is given for the main landscape types studied (i.e. forest, plantation, garden). Latitude and longitude were rounded to the nearest minute to safeguard data privacy of land owners. Original data is available upon request. Landscape Study site Region Altitude (a.s.l.) Forest cover [%] Plantation cover [%] Garden cover [%] Latitude Longitude Forest F1 Bundaberg 23 m 96.36 24°38' S 152° 8' E Forest F2 Bundaberg 27 m 89.79 24°46' S 152° 6' E Forest F3 Sunshine Coast / Brisbane 51 m 97.52 26°43' S 153° 1' E Forest F4 Sunshine Coast / Brisbane 83 m 75.06 26°50' S 152°55' E Plantation P1 Bundaberg 25 m 94.73 24°46' S 152°15' E Plantation P2 Bundaberg 27 m 92.04 24°47' S 152°15' E Plantation P3 Bundaberg 26 m 93.21 24°47' S 152°16' E Plantation P4 Sunshine Coast / Brisbane 55 m 80.08 26°53' S 152°56' E Garden G1 - location A Bundaberg 7 m 88.20 24°50' S 152°28' E Garden G1 - location B Bundaberg 19 m 87.70 24°52' S 152°19' E Garden G2 - location A Sunshine Coast / Brisbane 15 m 98.46 26°41' S 153° 7' E Garden G2 - location B Sunshine Coast / Brisbane 3 m 76.99 26°41' S 153° 7' E Garden G3 - location A Sunshine Coast / Brisbane 18 m 98.21 27°29' S 153° 0' E Garden G3 - location B Sunshine Coast / Brisbane 17 m 82.23 27°29' S 153° 0' E Garden G4 - location A Sunshine Coast / Brisbane 31 m 82.06 27°30' S 153° 1' E Garden G4 - location B Sunshine Coast / Brisbane 45 m 78.23 27°29' S 153° 1' E
_____ 70
2.8. Supplementary material S
M II.1
. Loca
tion
of stu
dy sites a
nd
geo
gra
ph
ic info
rmatio
n
II. Urban gardens promote bee foraging
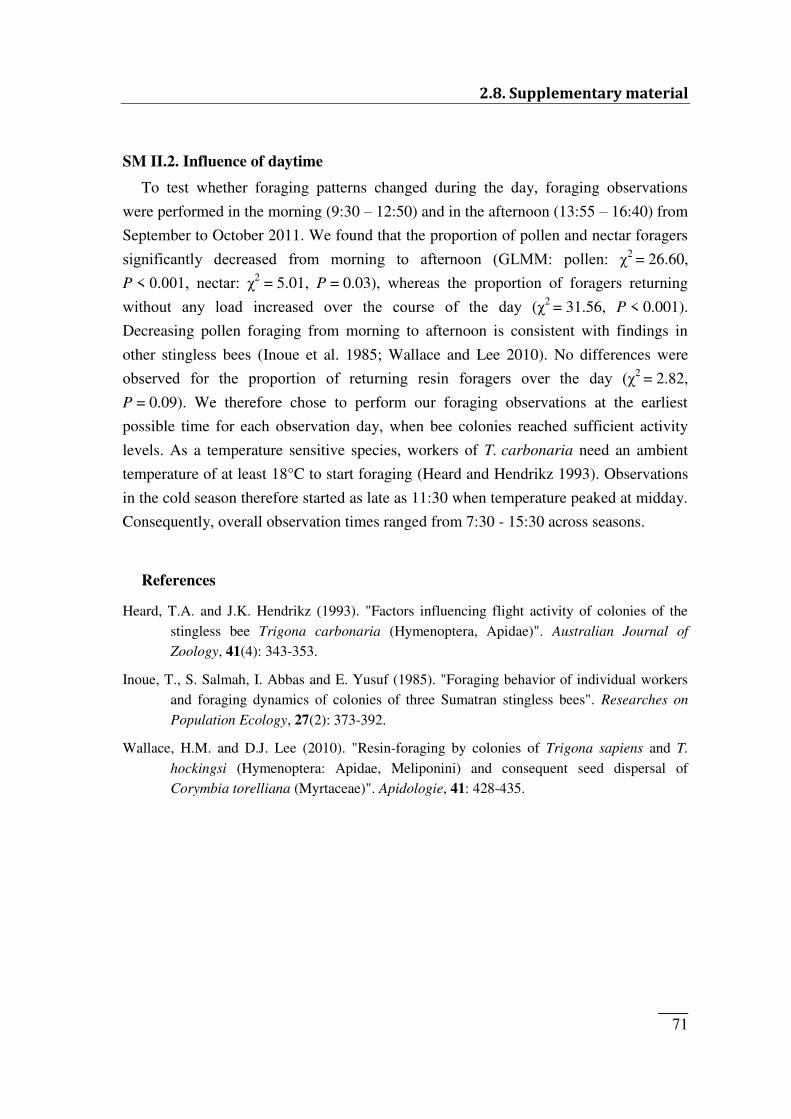
2.8. Supplementary material
_____ 71
SM II.2. Influence of daytime
To test whether foraging patterns changed during the day, foraging observations
were performed in the morning (9:30 – 12:50) and in the afternoon (13:55 – 16:40) from
September to October 2011. We found that the proportion of pollen and nectar foragers
significantly decreased from morning to afternoon (GLMM: pollen: χ2 = 26.60,
P < 0.001, nectar: χ2 = 5.01, P = 0.03), whereas the proportion of foragers returning
without any load increased over the course of the day (χ2 = 31.56, P < 0.001).
Decreasing pollen foraging from morning to afternoon is consistent with findings in
other stingless bees (Inoue et al. 1985; Wallace and Lee 2010). No differences were
observed for the proportion of returning resin foragers over the day (χ2 = 2.82,
P = 0.09). We therefore chose to perform our foraging observations at the earliest
possible time for each observation day, when bee colonies reached sufficient activity
levels. As a temperature sensitive species, workers of T. carbonaria need an ambient
temperature of at least 18°C to start foraging (Heard and Hendrikz 1993). Observations
in the cold season therefore started as late as 11:30 when temperature peaked at midday.
Consequently, overall observation times ranged from 7:30 - 15:30 across seasons.
References
Heard, T.A. and J.K. Hendrikz (1993). "Factors influencing flight activity of colonies of the
stingless bee Trigona carbonaria (Hymenoptera, Apidae)". Australian Journal of
Zoology, 41(4): 343-353.
Inoue, T., S. Salmah, I. Abbas and E. Yusuf (1985). "Foraging behavior of individual workers
and foraging dynamics of colonies of three Sumatran stingless bees". Researches on
Population Ecology, 27(2): 373-392.
Wallace, H.M. and D.J. Lee (2010). "Resin-foraging by colonies of Trigona sapiens and T.
hockingsi (Hymenoptera: Apidae, Meliponini) and consequent seed dispersal of
Corymbia torelliana (Myrtaceae)". Apidologie, 41: 428-435.
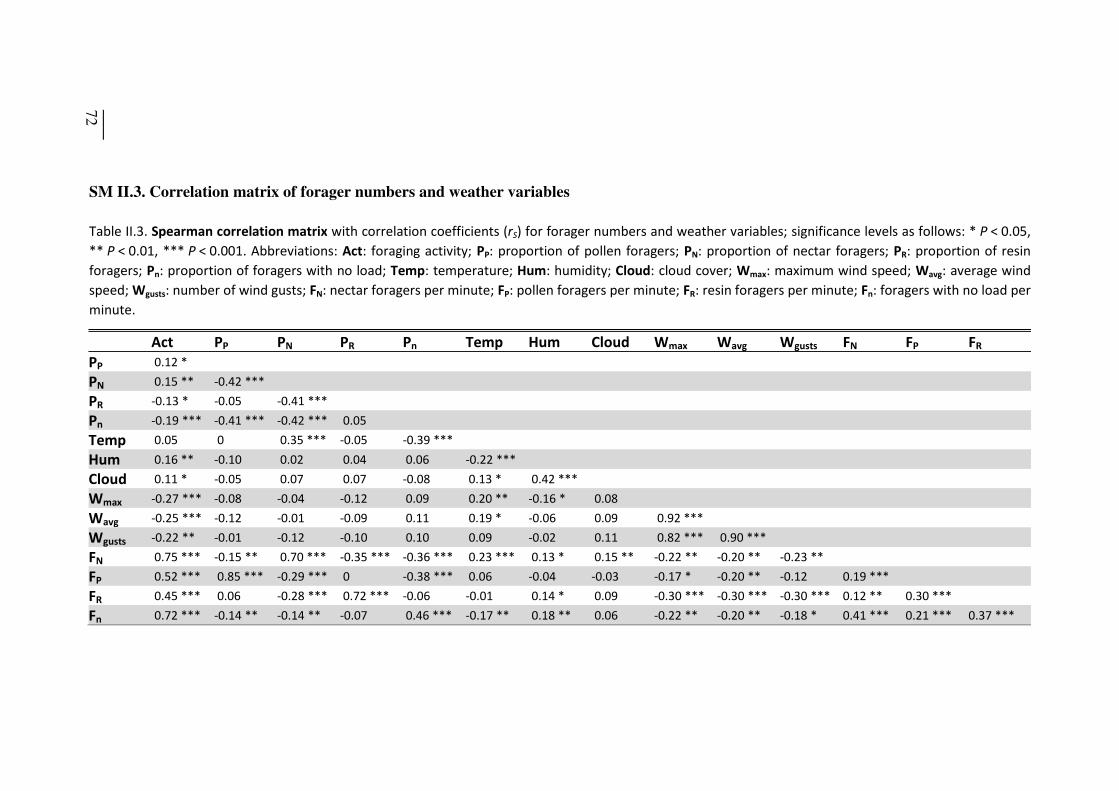
_____ 72
Act PP PN PR Pn Temp Hum Cloud Wmax Wavg Wgusts FN FP FR PP 0.12 * PN 0.15 ** -0.42 *** PR -0.13 * -0.05 -0.41 *** Pn -0.19 *** -0.41 *** -0.42 *** 0.05 Temp 0.05 0 0.35 *** -0.05 -0.39 *** Hum 0.16 ** -0.10 0.02 0.04 0.06 -0.22 *** Cloud 0.11 * -0.05 0.07 0.07 -0.08 0.13 * 0.42 *** Wmax -0.27 *** -0.08 -0.04 -0.12 0.09 0.20 ** -0.16 * 0.08 Wavg -0.25 *** -0.12 -0.01 -0.09 0.11 0.19 * -0.06 0.09 0.92 *** Wgusts -0.22 ** -0.01 -0.12 -0.10 0.10 0.09 -0.02 0.11 0.82 *** 0.90 *** FN 0.75 *** -0.15 ** 0.70 *** -0.35 *** -0.36 *** 0.23 *** 0.13 * 0.15 ** -0.22 ** -0.20 ** -0.23 ** FP 0.52 *** 0.85 *** -0.29 *** 0 -0.38 *** 0.06 -0.04 -0.03 -0.17 * -0.20 ** -0.12 0.19 *** FR 0.45 *** 0.06 -0.28 *** 0.72 *** -0.06 -0.01 0.14 * 0.09 -0.30 *** -0.30 *** -0.30 *** 0.12 ** 0.30 *** Fn 0.72 *** -0.14 ** -0.14 ** -0.07 0.46 *** -0.17 ** 0.18 ** 0.06 -0.22 ** -0.20 ** -0.18 * 0.41 *** 0.21 *** 0.37 ***
SM II.3. Correlation matrix of forager numbers and weather variables Table II.3. Spearman correlation matrix with correlation coefficients (rS) for forager numbers and weather variables; significance levels as follows: * P < 0.05, ** P < 0.01, *** P < 0.001. Abbreviations: Act: foraging activity; PP: proportion of pollen foragers; PN: proportion of nectar foragers; PR: proportion of resin foragers; Pn: proportion of foragers with no load; Temp: temperature; Hum: humidity; Cloud: cloud cover; Wmax: maximum wind speed; Wavg: average wind speed; Wgusts: number of wind gusts; FN: nectar foragers per minute; FP: pollen foragers per minute; FR: resin foragers per minute; Fn: foragers with no load per minute.
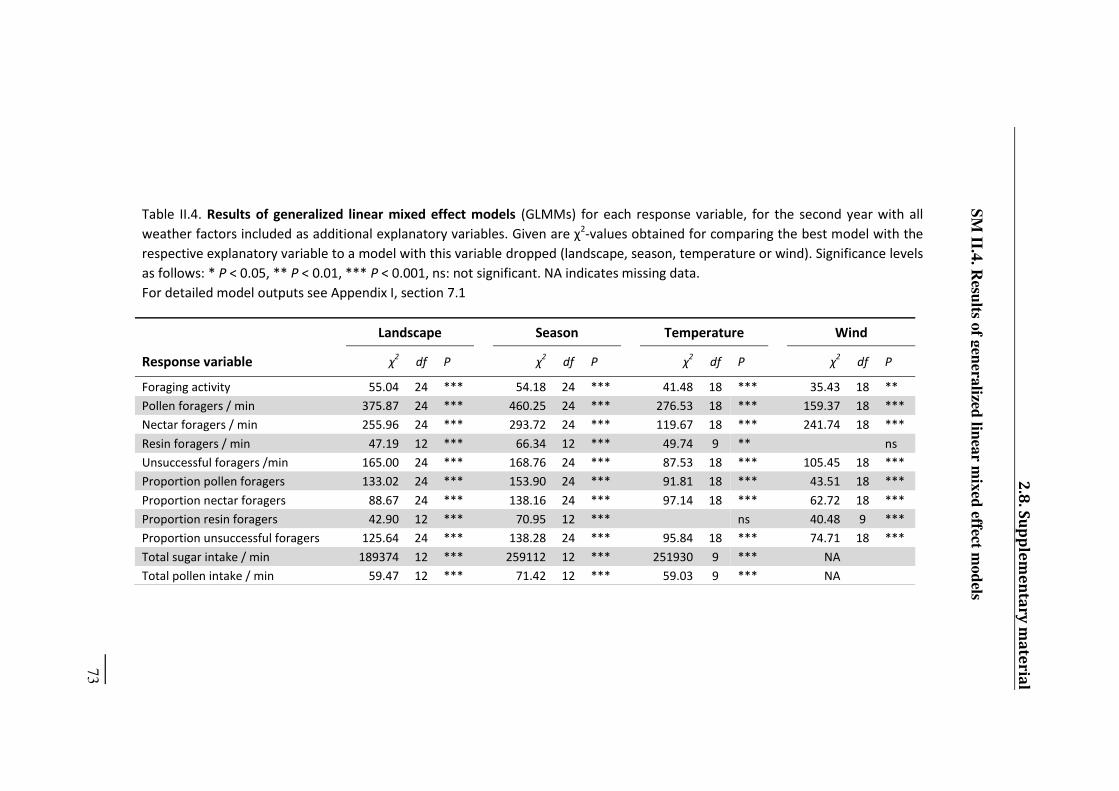
Table II.4. Results of generalized linear mixed effect models (GLMMs) for each response variable, for the second year with all eather fa tors i luded as additio al e pla ator aria les. Gi e are χ2-values obtained for comparing the best model with the respective explanatory variable to a model with this variable dropped (landscape, season, temperature or wind). Significance levels as follows: * P < 0.05, ** P < 0.01, *** P < 0.001, ns: not significant. NA indicates missing data. For detailed model outputs see Appendix I, section 7.1
Landscape Season Temperature Wind Response variable χ2 df P χ2 df P χ2 df P χ2 df P Foraging activity 55.04 24 *** 54.18 24 *** 41.48 18 *** 35.43 18 ** Pollen foragers / min 375.87 24 *** 460.25 24 *** 276.53 18 *** 159.37 18 *** Nectar foragers / min 255.96 24 *** 293.72 24 *** 119.67 18 *** 241.74 18 *** Resin foragers / min 47.19 12 *** 66.34 12 *** 49.74 9 ** ns Unsuccessful foragers /min 165.00 24 *** 168.76 24 *** 87.53 18 *** 105.45 18 *** Proportion pollen foragers 133.02 24 *** 153.90 24 *** 91.81 18 *** 43.51 18 *** Proportion nectar foragers 88.67 24 *** 138.16 24 *** 97.14 18 *** 62.72 18 *** Proportion resin foragers 42.90 12 *** 70.95 12 *** ns 40.48 9 *** Proportion unsuccessful foragers 125.64 24 *** 138.28 24 *** 95.84 18 *** 74.71 18 *** Total sugar intake / min 189374 12 *** 259112 12 *** 251930 9 *** NA Total pollen intake / min 59.47 12 *** 71.42 12 *** 59.03 9 *** NA
2.8. Supplementary material _____ 73
SM
II.4. R
esults o
f gen
eralized
linea
r mix
ed effect m
od
els
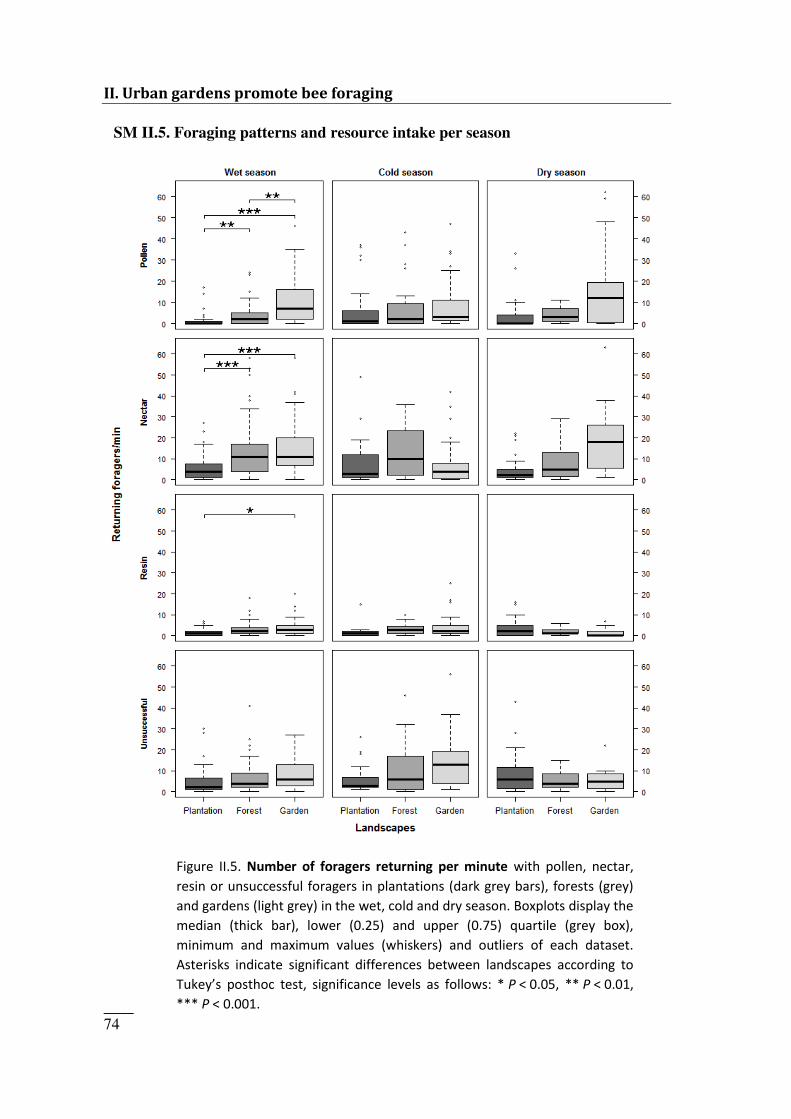
II. Urban gardens promote bee foraging
_____ 74
Figure II.5. Number of foragers returning per minute with pollen, nectar, resin or unsuccessful foragers in plantations (dark grey bars), forests (grey) and gardens (light grey) in the wet, cold and dry season. Boxplots display the median (thick bar), lower (0.25) and upper (0.75) quartile (grey box), minimum and maximum values (whiskers) and outliers of each dataset. Asterisks indicate significant differences between landscapes according to Tuke ’s postho test, sig ifi a e le els as follo s: * P < 0.05, ** P < 0.01, *** P < 0.001.
SM II.5. Foraging patterns and resource intake per season
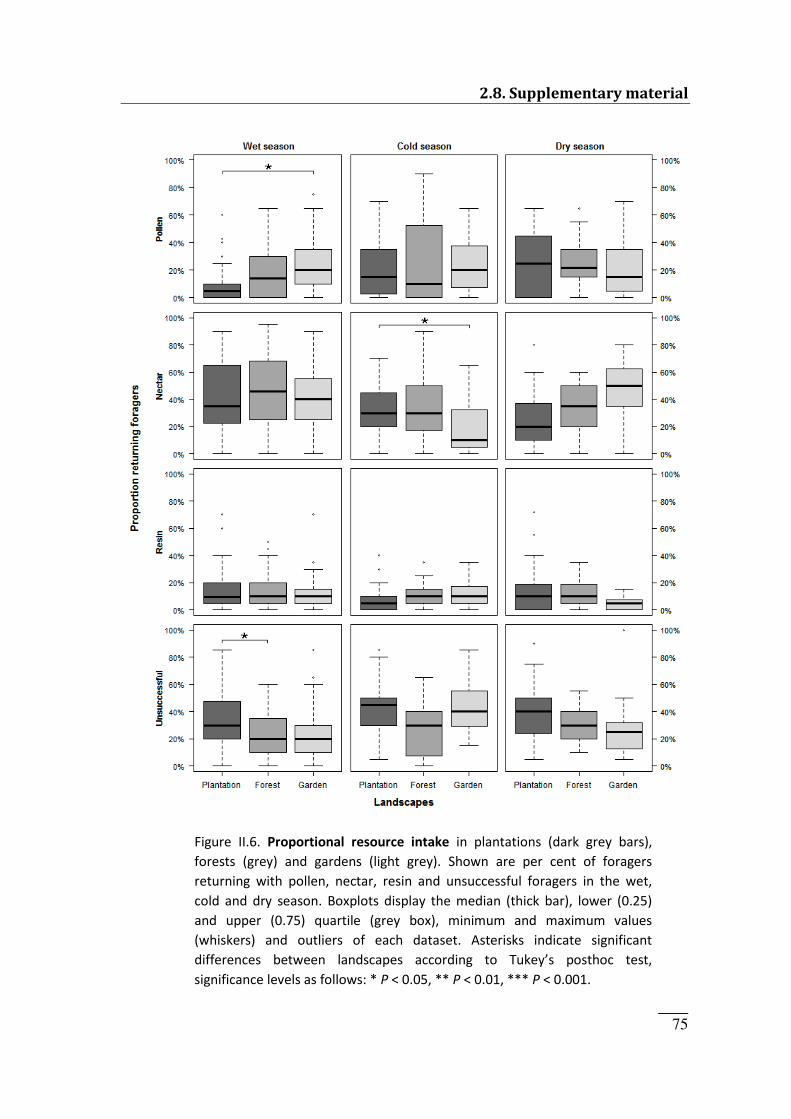
2.8. Supplementary material
_____ 75
Figure II.6. Proportional resource intake in plantations (dark grey bars), forests (grey) and gardens (light grey). Shown are per cent of foragers returning with pollen, nectar, resin and unsuccessful foragers in the wet, cold and dry season. Boxplots display the median (thick bar), lower (0.25) and upper (0.75) quartile (grey box), minimum and maximum values (whiskers) and outliers of each dataset. Asterisks indicate significant differe es et ee la ds apes a ordi g to Tuke ’s postho test, significance levels as follows: * P < 0.05, ** P < 0.01, *** P < 0.001.
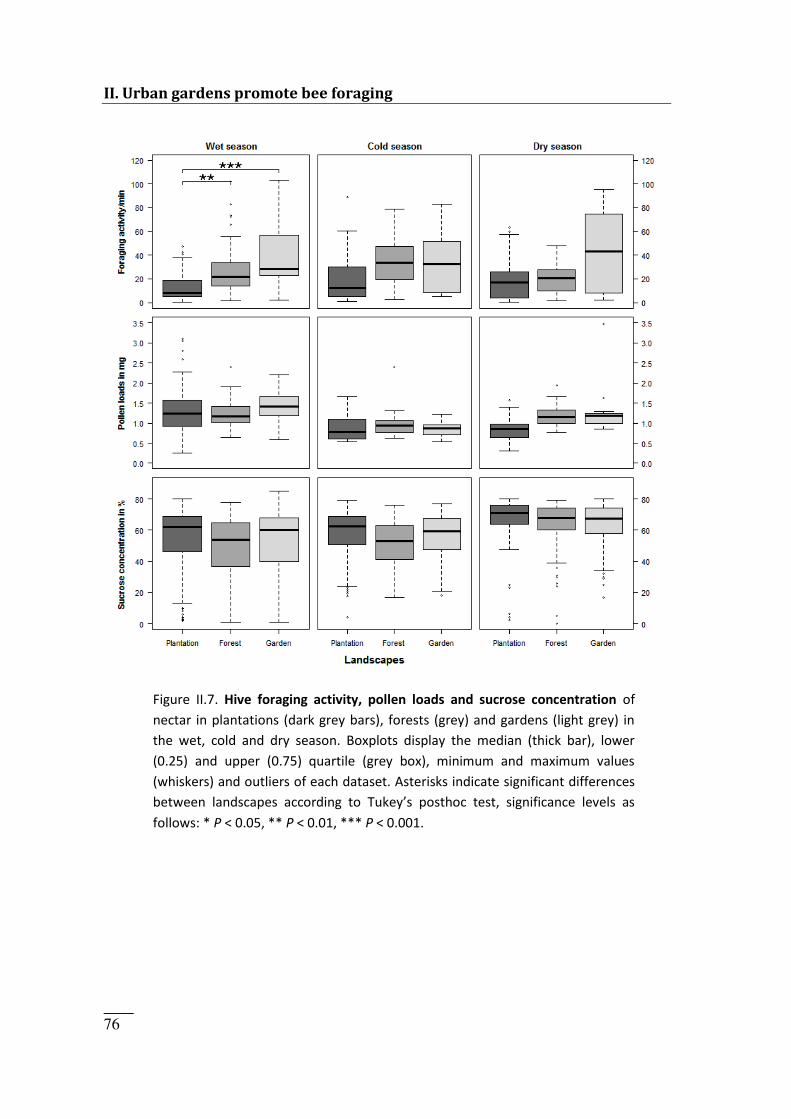
II. Urban gardens promote bee foraging
_____ 76
Figure II.7. Hive foraging activity, pollen loads and sucrose concentration of nectar in plantations (dark grey bars), forests (grey) and gardens (light grey) in the wet, cold and dry season. Boxplots display the median (thick bar), lower (0.25) and upper (0.75) quartile (grey box), minimum and maximum values (whiskers) and outliers of each dataset. Asterisks indicate significant differences et ee la ds apes a ordi g to Tuke ’s postho test, sig ifi a e le els as follows: * P < 0.05, ** P < 0.01, *** P < 0.001.
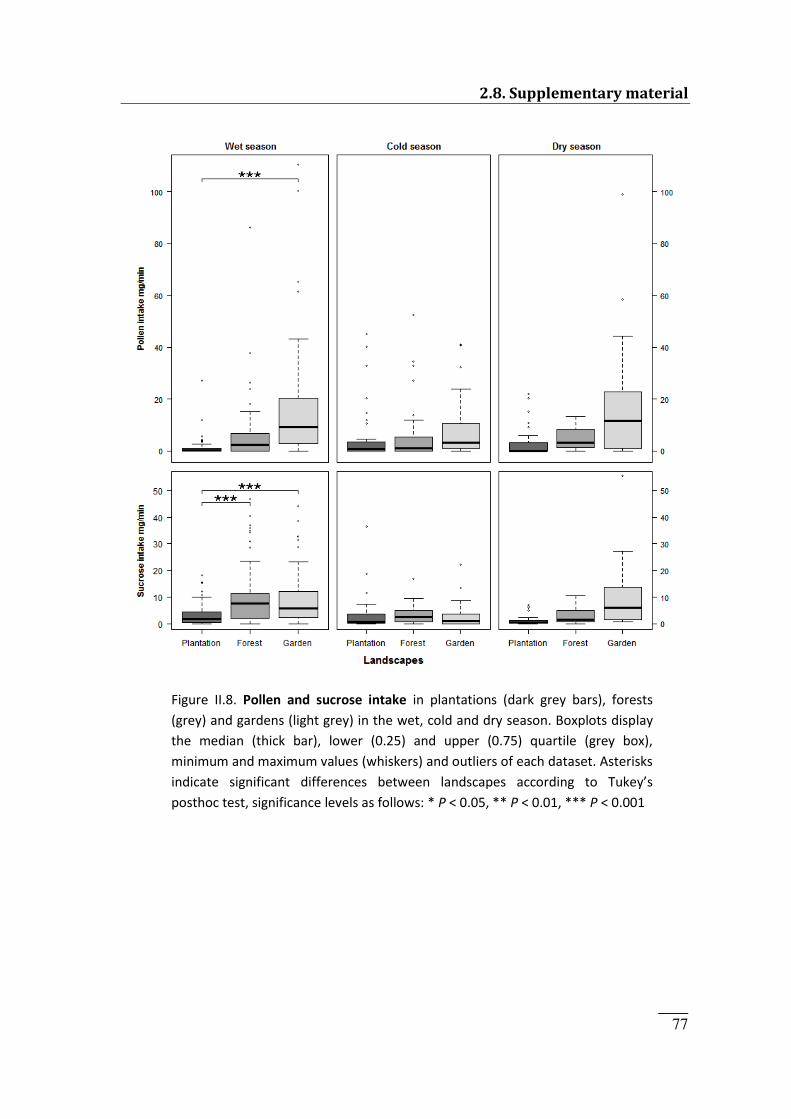
2.8. Supplementary material
_____ 77
Figure II.8. Pollen and sucrose intake in plantations (dark grey bars), forests (grey) and gardens (light grey) in the wet, cold and dry season. Boxplots display the median (thick bar), lower (0.25) and upper (0.75) quartile (grey box), minimum and maximum values (whiskers) and outliers of each dataset. Asterisks i di ate sig ifi a t differe es et ee la ds apes a ordi g to Tuke ’s posthoc test, significance levels as follows: * P < 0.05, ** P < 0.01, *** P < 0.001

_____ 78
_____ 79
III. RESOURCES OR LANDMARKS WHICH FACTORS DRIVE HOMING SUCCESS IN TETRAGONULA CARBONARIA FORAGING IN NATURAL AND DISTURBED LANDSCAPES? This chapter has been published in: Journal of Comparative Physiology A (2016); 202(9): 701-708. 3.1. Abstract
To date, no study has investigated how landscape structural (visual) alterations affect
navigation and thus homing success in stingless bees. We addressed this question in the
Australian stingless bee Tetragonula carbonaria by performing marking, release and re-
capture experiments in landscapes differing in habitat homogeneity (i.e. the proportion
of elongated ground features typically considered prominent visual landmarks). We
investigated how landscape affected the proportion of bees and nectar foragers returning
to their hives as well as the earliest time bees and foragers returned. Undisturbed
landscapes with few landmarks (that are conspicuous to the human eye) and large
proportions of vegetation cover (natural forests) were classified visually/structurally
homogeneous, and disturbed landscapes with many landmarks and fragmented or no
extensive vegetation cover (gardens and plantations) visually/structurally
heterogeneous. We found that proportions of successfully returning nectar foragers and
earliest times first bees and foragers returned did not differ between landscapes.
However, most bees returned in the visually/structurally most (forest) and least (garden)
homogeneous landscape, suggesting that they use other than elongated ground features
for navigation and that return speed is primarily driven by resource availability in a
landscape.
3.2. Introduction Anthropogenic activities can severely affect and alter bee communities by converting
natural habitats into landscapes with reduced resource availability and diversity, and by
increasing exposure to pesticides and non-native pathogens (Winfree et al. 2009; Potts
et al. 2010; Roulston and Goodell 2011; Vanbergen and the Insect Pollinators Initiative
2013; Goulson et al. 2015). Anthropogenic activities can further alter the structure of
the bees‘ foraging landscape with severe consequences for foraging patterns and success
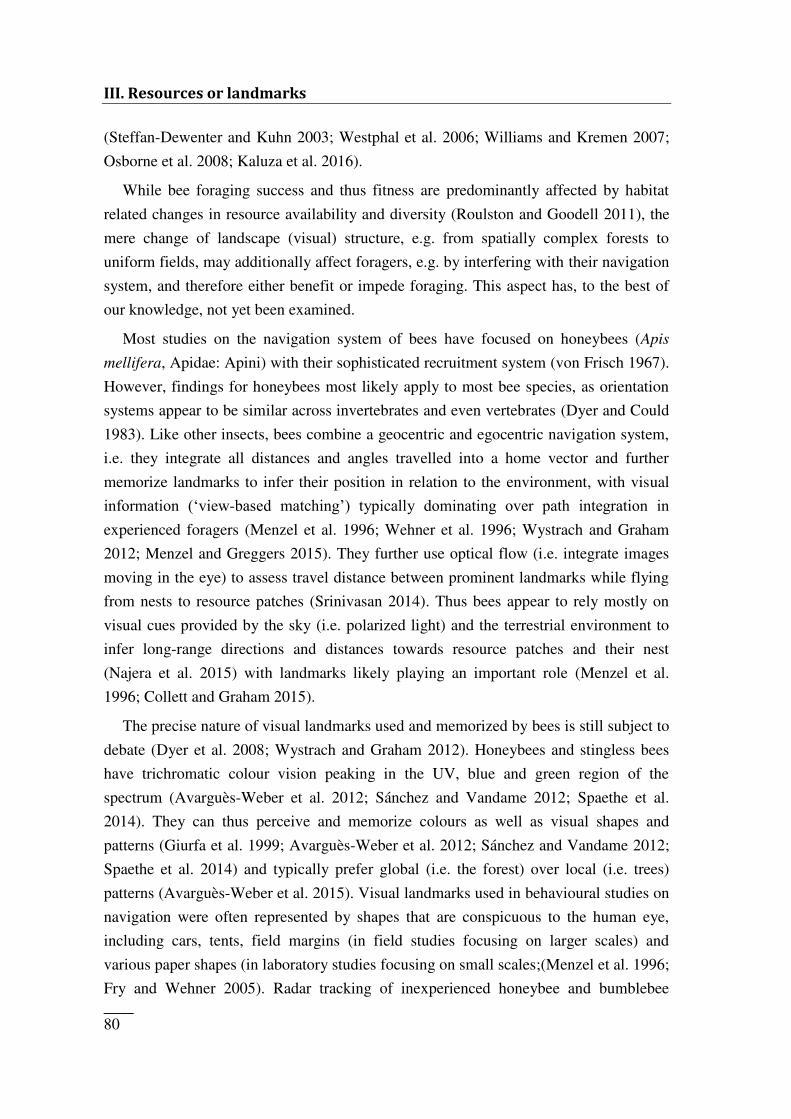
III. Resources or landmarks
_____ 80
(Steffan-Dewenter and Kuhn 2003; Westphal et al. 2006; Williams and Kremen 2007;
Osborne et al. 2008; Kaluza et al. 2016).
While bee foraging success and thus fitness are predominantly affected by habitat
related changes in resource availability and diversity (Roulston and Goodell 2011), the
mere change of landscape (visual) structure, e.g. from spatially complex forests to
uniform fields, may additionally affect foragers, e.g. by interfering with their navigation
system, and therefore either benefit or impede foraging. This aspect has, to the best of
our knowledge, not yet been examined.
Most studies on the navigation system of bees have focused on honeybees (Apis
mellifera, Apidae: Apini) with their sophisticated recruitment system (von Frisch 1967).
However, findings for honeybees most likely apply to most bee species, as orientation
systems appear to be similar across invertebrates and even vertebrates (Dyer and Could
1983). Like other insects, bees combine a geocentric and egocentric navigation system,
i.e. they integrate all distances and angles travelled into a home vector and further
memorize landmarks to infer their position in relation to the environment, with visual
information (‗view-based matching‘) typically dominating over path integration in experienced foragers (Menzel et al. 1996; Wehner et al. 1996; Wystrach and Graham
2012; Menzel and Greggers 2015). They further use optical flow (i.e. integrate images
moving in the eye) to assess travel distance between prominent landmarks while flying
from nests to resource patches (Srinivasan 2014). Thus bees appear to rely mostly on
visual cues provided by the sky (i.e. polarized light) and the terrestrial environment to
infer long-range directions and distances towards resource patches and their nest
(Najera et al. 2015) with landmarks likely playing an important role (Menzel et al.
1996; Collett and Graham 2015).
The precise nature of visual landmarks used and memorized by bees is still subject to
debate (Dyer et al. 2008; Wystrach and Graham 2012). Honeybees and stingless bees
have trichromatic colour vision peaking in the UV, blue and green region of the
spectrum (Avarguès-Weber et al. 2012; Sánchez and Vandame 2012; Spaethe et al.
2014). They can thus perceive and memorize colours as well as visual shapes and
patterns (Giurfa et al. 1999; Avarguès-Weber et al. 2012; Sánchez and Vandame 2012;
Spaethe et al. 2014) and typically prefer global (i.e. the forest) over local (i.e. trees)
patterns (Avarguès-Weber et al. 2015). Visual landmarks used in behavioural studies on
navigation were often represented by shapes that are conspicuous to the human eye,
including cars, tents, field margins (in field studies focusing on larger scales) and
various paper shapes (in laboratory studies focusing on small scales;(Menzel et al. 1996;
Fry and Wehner 2005). Radar tracking of inexperienced honeybee and bumblebee
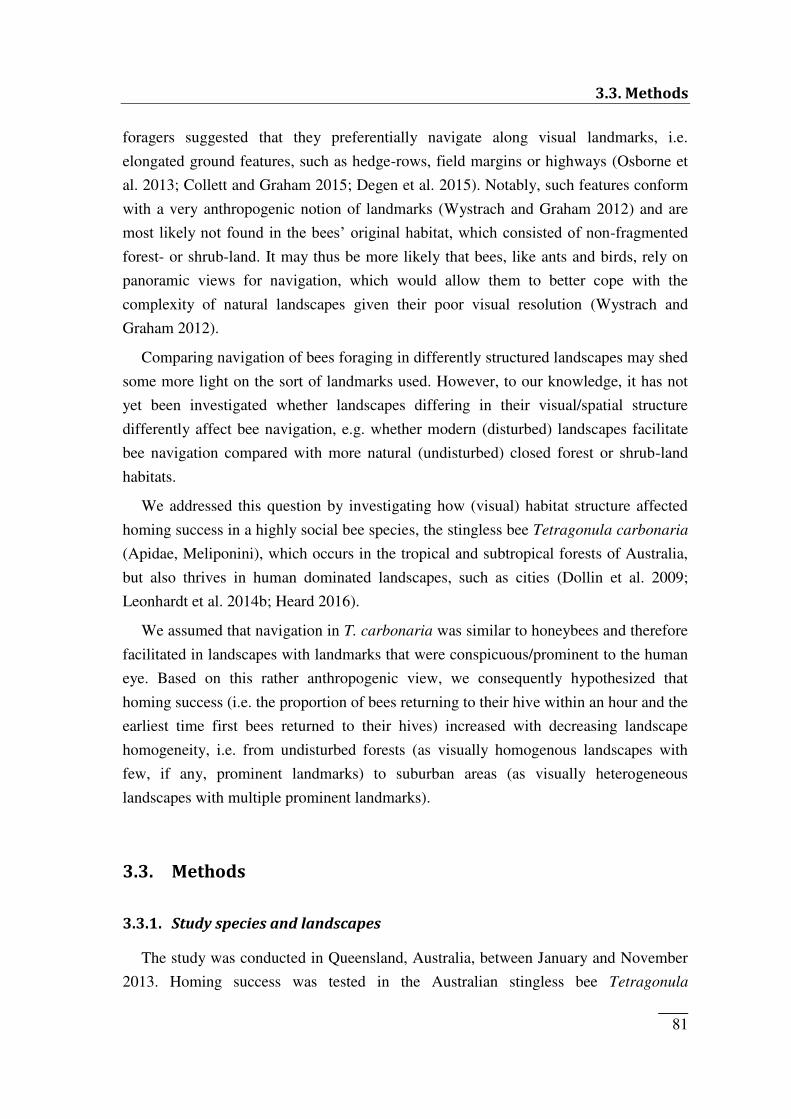
3.3. Methods
_____ 81
foragers suggested that they preferentially navigate along visual landmarks, i.e.
elongated ground features, such as hedge-rows, field margins or highways (Osborne et
al. 2013; Collett and Graham 2015; Degen et al. 2015). Notably, such features conform
with a very anthropogenic notion of landmarks (Wystrach and Graham 2012) and are
most likely not found in the bees‘ original habitat, which consisted of non-fragmented
forest- or shrub-land. It may thus be more likely that bees, like ants and birds, rely on
panoramic views for navigation, which would allow them to better cope with the
complexity of natural landscapes given their poor visual resolution (Wystrach and
Graham 2012).
Comparing navigation of bees foraging in differently structured landscapes may shed
some more light on the sort of landmarks used. However, to our knowledge, it has not
yet been investigated whether landscapes differing in their visual/spatial structure
differently affect bee navigation, e.g. whether modern (disturbed) landscapes facilitate
bee navigation compared with more natural (undisturbed) closed forest or shrub-land
habitats.
We addressed this question by investigating how (visual) habitat structure affected
homing success in a highly social bee species, the stingless bee Tetragonula carbonaria
(Apidae, Meliponini), which occurs in the tropical and subtropical forests of Australia,
but also thrives in human dominated landscapes, such as cities (Dollin et al. 2009;
Leonhardt et al. 2014b; Heard 2016).
We assumed that navigation in T. carbonaria was similar to honeybees and therefore
facilitated in landscapes with landmarks that were conspicuous/prominent to the human
eye. Based on this rather anthropogenic view, we consequently hypothesized that
homing success (i.e. the proportion of bees returning to their hive within an hour and the
earliest time first bees returned to their hives) increased with decreasing landscape
homogeneity, i.e. from undisturbed forests (as visually homogenous landscapes with
few, if any, prominent landmarks) to suburban areas (as visually heterogeneous
landscapes with multiple prominent landmarks).
3.3. Methods 3.3.1. Study species and landscapes
The study was conducted in Queensland, Australia, between January and November
2013. Homing success was tested in the Australian stingless bee Tetragonula
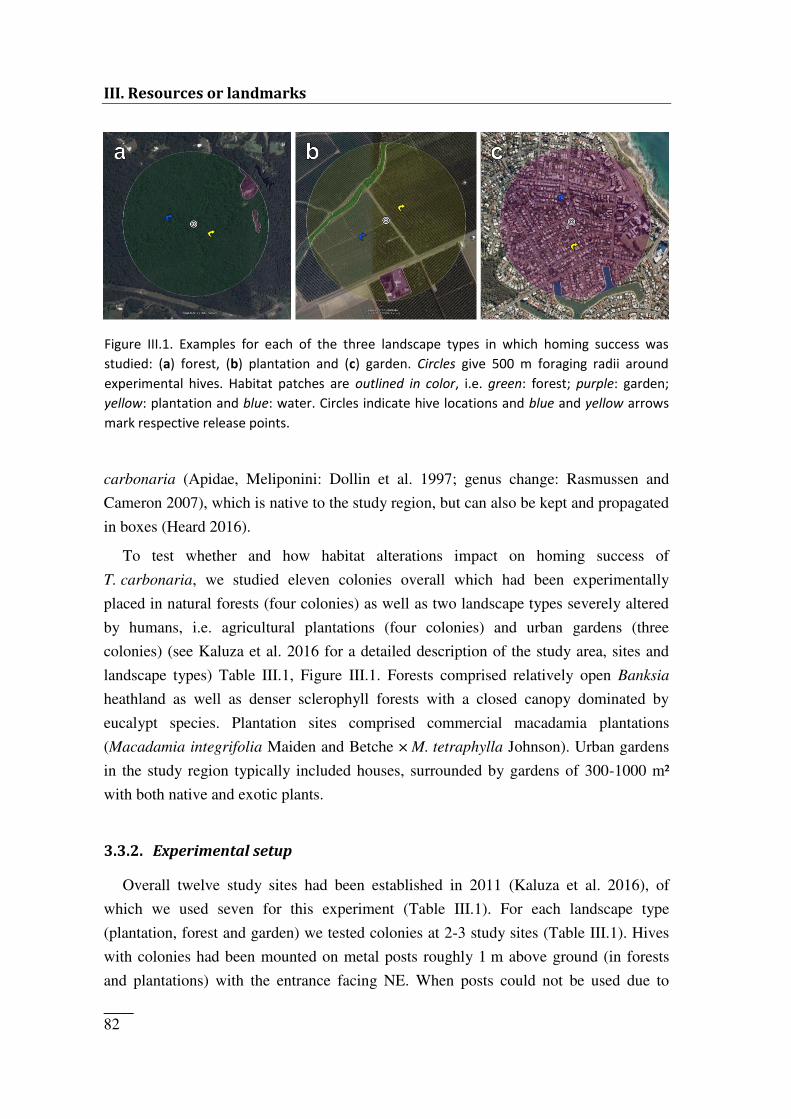
III. Resources or landmarks
_____ 82
carbonaria (Apidae, Meliponini: Dollin et al. 1997; genus change: Rasmussen and
Cameron 2007), which is native to the study region, but can also be kept and propagated
in boxes (Heard 2016).
To test whether and how habitat alterations impact on homing success of
T. carbonaria, we studied eleven colonies overall which had been experimentally
placed in natural forests (four colonies) as well as two landscape types severely altered
by humans, i.e. agricultural plantations (four colonies) and urban gardens (three
colonies) (see Kaluza et al. 2016 for a detailed description of the study area, sites and
landscape types) Table III.1, Figure III.1. Forests comprised relatively open Banksia
heathland as well as denser sclerophyll forests with a closed canopy dominated by
eucalypt species. Plantation sites comprised commercial macadamia plantations
(Macadamia integrifolia Maiden and Betche × M. tetraphylla Johnson). Urban gardens
in the study region typically included houses, surrounded by gardens of 300-1000 m²
with both native and exotic plants.
3.3.2. Experimental setup Overall twelve study sites had been established in 2011 (Kaluza et al. 2016), of
which we used seven for this experiment (Table III.1). For each landscape type
(plantation, forest and garden) we tested colonies at 2-3 study sites (Table III.1). Hives
with colonies had been mounted on metal posts roughly 1 m above ground (in forests
and plantations) with the entrance facing NE. When posts could not be used due to
Figure III.1. Examples for each of the three landscape types in which homing success was studied: (a) forest, (b) plantation and (c) garden. Circles give 500 m foraging radii around experimental hives. Habitat patches are outlined in color, i.e. green: forest; purple: garden; yellow: plantation and blue: water. Circles indicate hive locations and blue and yellow arrows mark respective release points.
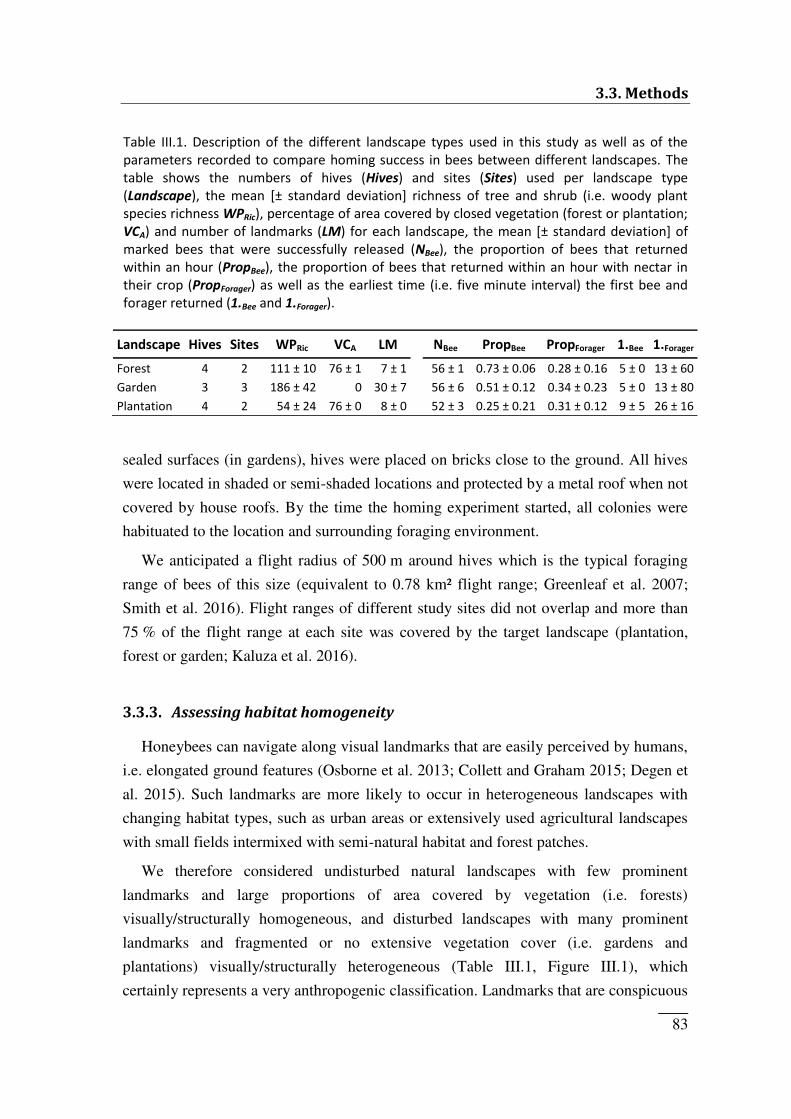
3.3. Methods
_____ 83
sealed surfaces (in gardens), hives were placed on bricks close to the ground. All hives
were located in shaded or semi-shaded locations and protected by a metal roof when not
covered by house roofs. By the time the homing experiment started, all colonies were
habituated to the location and surrounding foraging environment.
We anticipated a flight radius of 500 m around hives which is the typical foraging
range of bees of this size (equivalent to 0.78 km² flight range; Greenleaf et al. 2007;
Smith et al. 2016). Flight ranges of different study sites did not overlap and more than
75 % of the flight range at each site was covered by the target landscape (plantation,
forest or garden; Kaluza et al. 2016).
3.3.3. Assessing habitat homogeneity Honeybees can navigate along visual landmarks that are easily perceived by humans,
i.e. elongated ground features (Osborne et al. 2013; Collett and Graham 2015; Degen et
al. 2015). Such landmarks are more likely to occur in heterogeneous landscapes with
changing habitat types, such as urban areas or extensively used agricultural landscapes
with small fields intermixed with semi-natural habitat and forest patches.
We therefore considered undisturbed natural landscapes with few prominent
landmarks and large proportions of area covered by vegetation (i.e. forests)
visually/structurally homogeneous, and disturbed landscapes with many prominent
landmarks and fragmented or no extensive vegetation cover (i.e. gardens and
plantations) visually/structurally heterogeneous (Table III.1, Figure III.1), which
certainly represents a very anthropogenic classification. Landmarks that are conspicuous
Table III.1. Description of the different landscape types used in this study as well as of the parameters recorded to compare homing success in bees between different landscapes. The table shows the numbers of hives (Hives) and sites (Sites) used per landscape type (Landscape), the mean [± standard deviation] richness of tree and shrub (i.e. woody plant species richness WPRic), percentage of area covered by closed vegetation (forest or plantation; VCA) and number of landmarks (LM) for each landscape, the mean [± standard deviation] of marked bees that were successfully released (NBee), the proportion of bees that returned within an hour (PropBee), the proportion of bees that returned within an hour with nectar in their crop (PropForager) as well as the earliest time (i.e. five minute interval) the first bee and forager returned (1.Bee and 1.Forager). Landscape Hives Sites WPRic VCA LM NBee PropBee PropForager 1.Bee 1.Forager Forest 4 2 111 ± 10 76 ± 1 7 ± 1 56 ± 1 0.73 ± 0.06 0.28 ± 0.16 5 ± 0 13 ± 60 Garden 3 3 186 ± 42 0 30 ± 7 56 ± 6 0.51 ± 0.12 0.34 ± 0.23 5 ± 0 13 ± 80 Plantation 4 2 54 ± 24 76 ± 0 8 ± 0 52 ± 3 0.25 ± 0.21 0.31 ± 0.12 9 ± 5 26 ± 16
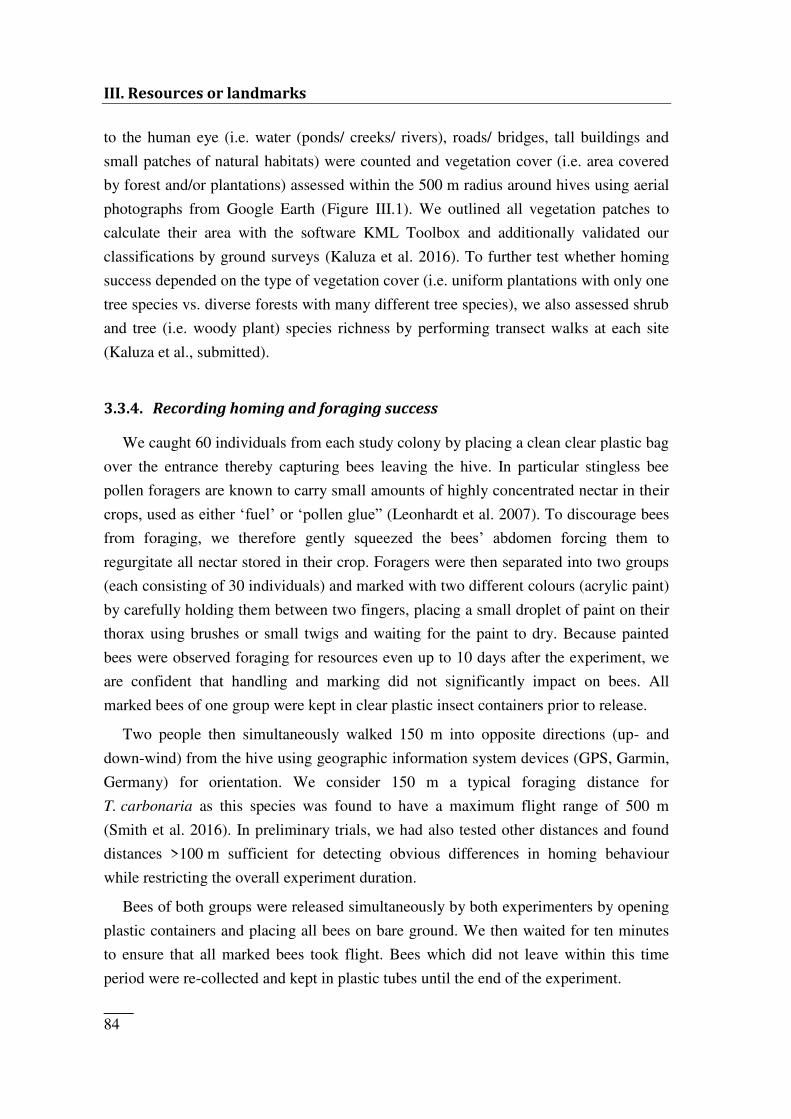
III. Resources or landmarks
_____ 84
to the human eye (i.e. water (ponds/ creeks/ rivers), roads/ bridges, tall buildings and
small patches of natural habitats) were counted and vegetation cover (i.e. area covered
by forest and/or plantations) assessed within the 500 m radius around hives using aerial
photographs from Google Earth (Figure III.1). We outlined all vegetation patches to
calculate their area with the software KML Toolbox and additionally validated our
classifications by ground surveys (Kaluza et al. 2016). To further test whether homing
success depended on the type of vegetation cover (i.e. uniform plantations with only one
tree species vs. diverse forests with many different tree species), we also assessed shrub
and tree (i.e. woody plant) species richness by performing transect walks at each site
(Kaluza et al., submitted).
3.3.4. Recording homing and foraging success We caught 60 individuals from each study colony by placing a clean clear plastic bag
over the entrance thereby capturing bees leaving the hive. In particular stingless bee
pollen foragers are known to carry small amounts of highly concentrated nectar in their
crops, used as either ‗fuel‘ or ‗pollen glue‖ (Leonhardt et al. 2007). To discourage bees
from foraging, we therefore gently squeezed the bees‘ abdomen forcing them to regurgitate all nectar stored in their crop. Foragers were then separated into two groups
(each consisting of 30 individuals) and marked with two different colours (acrylic paint)
by carefully holding them between two fingers, placing a small droplet of paint on their
thorax using brushes or small twigs and waiting for the paint to dry. Because painted
bees were observed foraging for resources even up to 10 days after the experiment, we
are confident that handling and marking did not significantly impact on bees. All
marked bees of one group were kept in clear plastic insect containers prior to release.
Two people then simultaneously walked 150 m into opposite directions (up- and
down-wind) from the hive using geographic information system devices (GPS, Garmin,
Germany) for orientation. We consider 150 m a typical foraging distance for
T. carbonaria as this species was found to have a maximum flight range of 500 m
(Smith et al. 2016). In preliminary trials, we had also tested other distances and found
distances >100 m sufficient for detecting obvious differences in homing behaviour
while restricting the overall experiment duration.
Bees of both groups were released simultaneously by both experimenters by opening
plastic containers and placing all bees on bare ground. We then waited for ten minutes
to ensure that all marked bees took flight. Bees which did not leave within this time
period were re-collected and kept in plastic tubes until the end of the experiment.
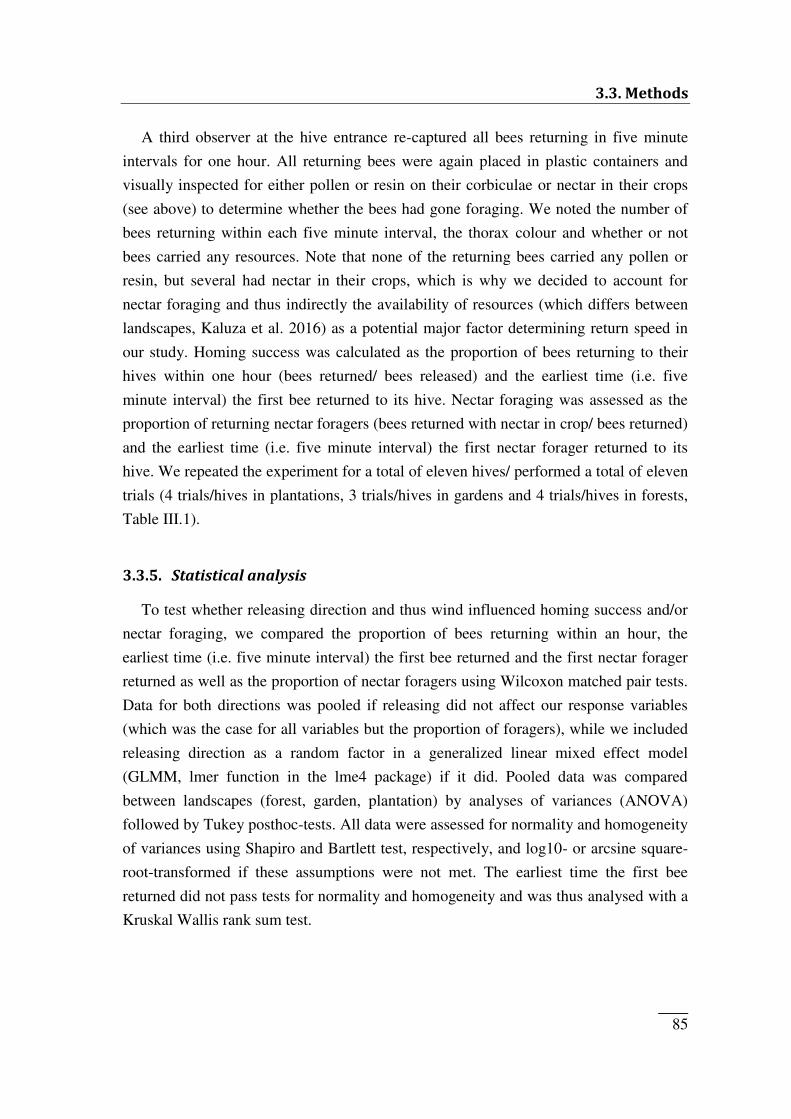
3.3. Methods
_____ 85
A third observer at the hive entrance re-captured all bees returning in five minute
intervals for one hour. All returning bees were again placed in plastic containers and
visually inspected for either pollen or resin on their corbiculae or nectar in their crops
(see above) to determine whether the bees had gone foraging. We noted the number of
bees returning within each five minute interval, the thorax colour and whether or not
bees carried any resources. Note that none of the returning bees carried any pollen or
resin, but several had nectar in their crops, which is why we decided to account for
nectar foraging and thus indirectly the availability of resources (which differs between
landscapes, Kaluza et al. 2016) as a potential major factor determining return speed in
our study. Homing success was calculated as the proportion of bees returning to their
hives within one hour (bees returned/ bees released) and the earliest time (i.e. five
minute interval) the first bee returned to its hive. Nectar foraging was assessed as the
proportion of returning nectar foragers (bees returned with nectar in crop/ bees returned)
and the earliest time (i.e. five minute interval) the first nectar forager returned to its
hive. We repeated the experiment for a total of eleven hives/ performed a total of eleven
trials (4 trials/hives in plantations, 3 trials/hives in gardens and 4 trials/hives in forests,
Table III.1).
3.3.5. Statistical analysis To test whether releasing direction and thus wind influenced homing success and/or
nectar foraging, we compared the proportion of bees returning within an hour, the
earliest time (i.e. five minute interval) the first bee returned and the first nectar forager
returned as well as the proportion of nectar foragers using Wilcoxon matched pair tests.
Data for both directions was pooled if releasing did not affect our response variables
(which was the case for all variables but the proportion of foragers), while we included
releasing direction as a random factor in a generalized linear mixed effect model
(GLMM, lmer function in the lme4 package) if it did. Pooled data was compared
between landscapes (forest, garden, plantation) by analyses of variances (ANOVA)
followed by Tukey posthoc-tests. All data were assessed for normality and homogeneity
of variances using Shapiro and Bartlett test, respectively, and log10- or arcsine square-
root-transformed if these assumptions were not met. The earliest time the first bee
returned did not pass tests for normality and homogeneity and was thus analysed with a
Kruskal Wallis rank sum test.
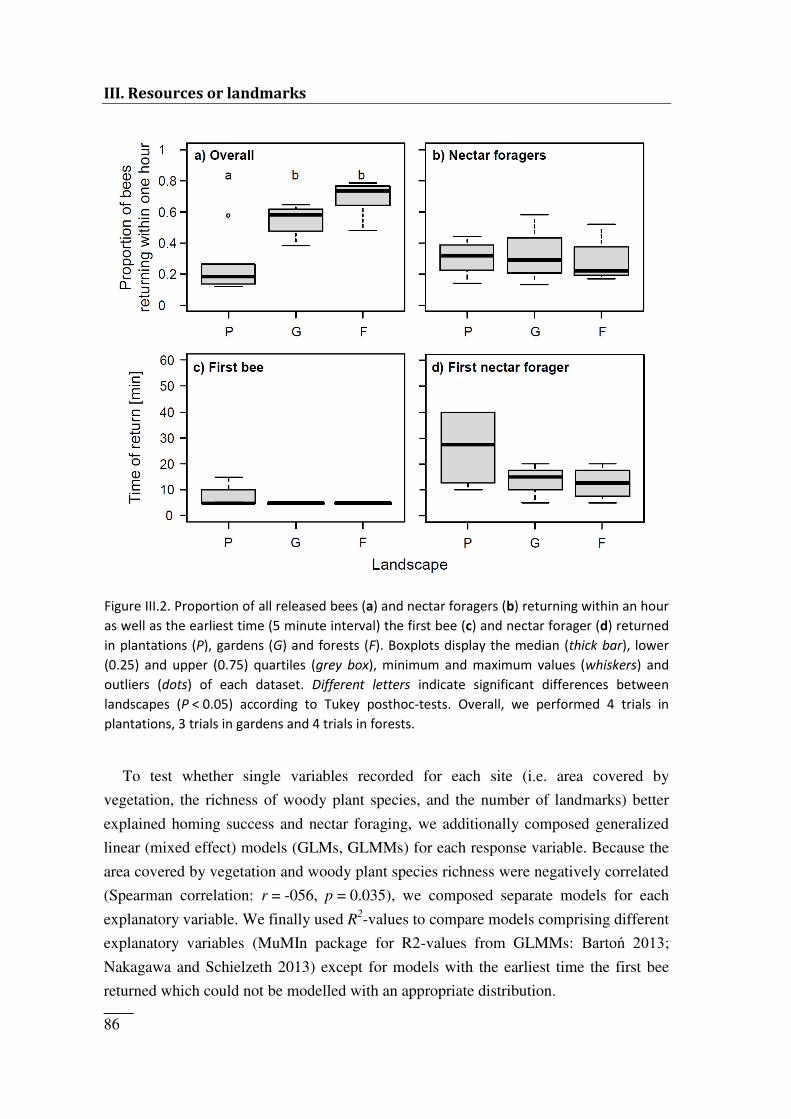
III. Resources or landmarks
_____ 86
To test whether single variables recorded for each site (i.e. area covered by
vegetation, the richness of woody plant species, and the number of landmarks) better
explained homing success and nectar foraging, we additionally composed generalized
linear (mixed effect) models (GLMs, GLMMs) for each response variable. Because the
area covered by vegetation and woody plant species richness were negatively correlated
(Spearman correlation: r = -056, p = 0.035), we composed separate models for each
explanatory variable. We finally used R2-values to compare models comprising different
explanatory variables (MuMIn package for R2-values from GLMMs: Bartoń 2013;
Nakagawa and Schielzeth 2013) except for models with the earliest time the first bee
returned which could not be modelled with an appropriate distribution.
Figure III.2. Proportion of all released bees (a) and nectar foragers (b) returning within an hour as well as the earliest time (5 minute interval) the first bee (c) and nectar forager (d) returned in plantations (P), gardens (G) and forests (F). Boxplots display the median (thick bar), lower (0.25) and upper (0.75) quartiles (grey box), minimum and maximum values (whiskers) and outliers (dots) of each dataset. Different letters indicate significant differences between landscapes (P < 0.05) according to Tukey posthoc-tests. Overall, we performed 4 trials in plantations, 3 trials in gardens and 4 trials in forests.
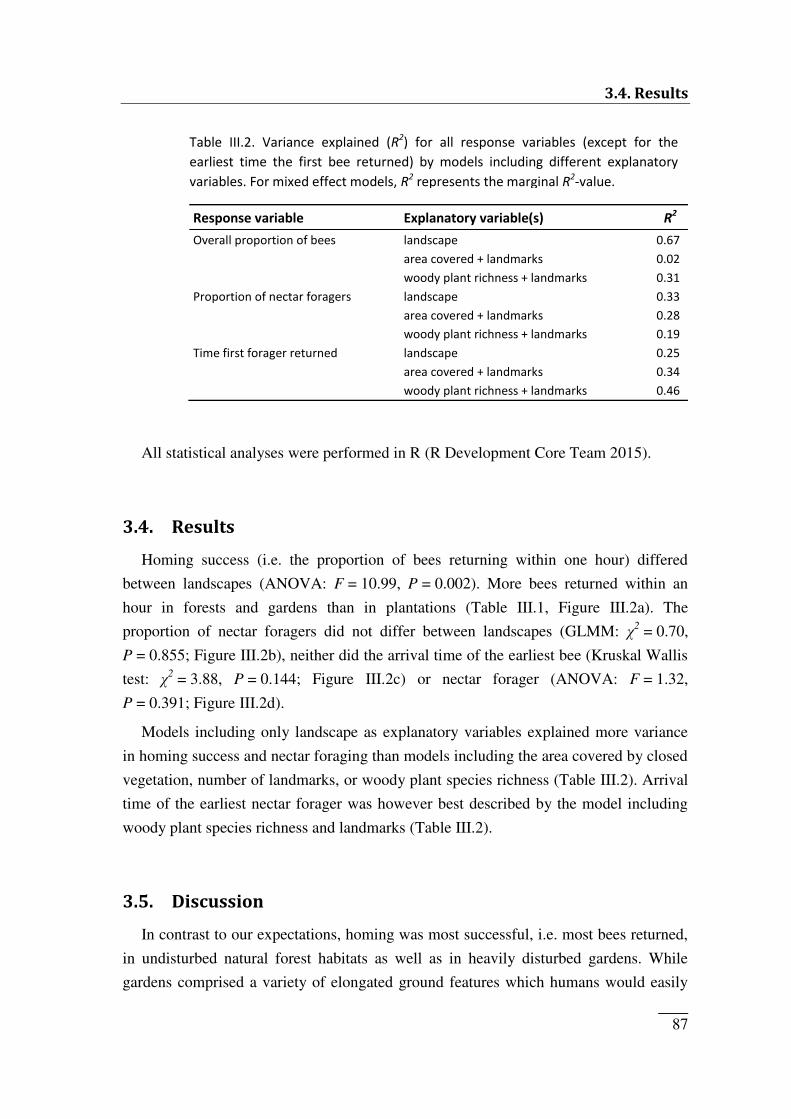
3.4. Results
_____ 87
All statistical analyses were performed in R (R Development Core Team 2015).
3.4. Results Homing success (i.e. the proportion of bees returning within one hour) differed
between landscapes (ANOVA: F = 10.99, P = 0.002). More bees returned within an
hour in forests and gardens than in plantations (Table III.1, Figure III.2a). The
proportion of nectar foragers did not differ between landscapes (GLMM: χ2 = 0.70,
P = 0.855; Figure III.2b), neither did the arrival time of the earliest bee (Kruskal Wallis
test: χ2 = 3.88, P = 0.144; Figure III.2c) or nectar forager (ANOVA: F = 1.32,
P = 0.391; Figure III.2d).
Models including only landscape as explanatory variables explained more variance
in homing success and nectar foraging than models including the area covered by closed
vegetation, number of landmarks, or woody plant species richness (Table III.2). Arrival
time of the earliest nectar forager was however best described by the model including
woody plant species richness and landmarks (Table III.2).
3.5. Discussion In contrast to our expectations, homing was most successful, i.e. most bees returned,
in undisturbed natural forest habitats as well as in heavily disturbed gardens. While
gardens comprised a variety of elongated ground features which humans would easily
Response variable Explanatory variable(s) R2 Overall proportion of bees landscape 0.67 area covered + landmarks 0.02 woody plant richness + landmarks 0.31 Proportion of nectar foragers landscape 0.33 area covered + landmarks 0.28 woody plant richness + landmarks 0.19 Time first forager returned landscape 0.25 area covered + landmarks 0.34 woody plant richness + landmarks 0.46
Table III.2. Variance explained (R2) for all response variables (except for the earliest time the first bee returned) by models including different explanatory variables. For mixed effect models, R2 represents the marginal R2-value.
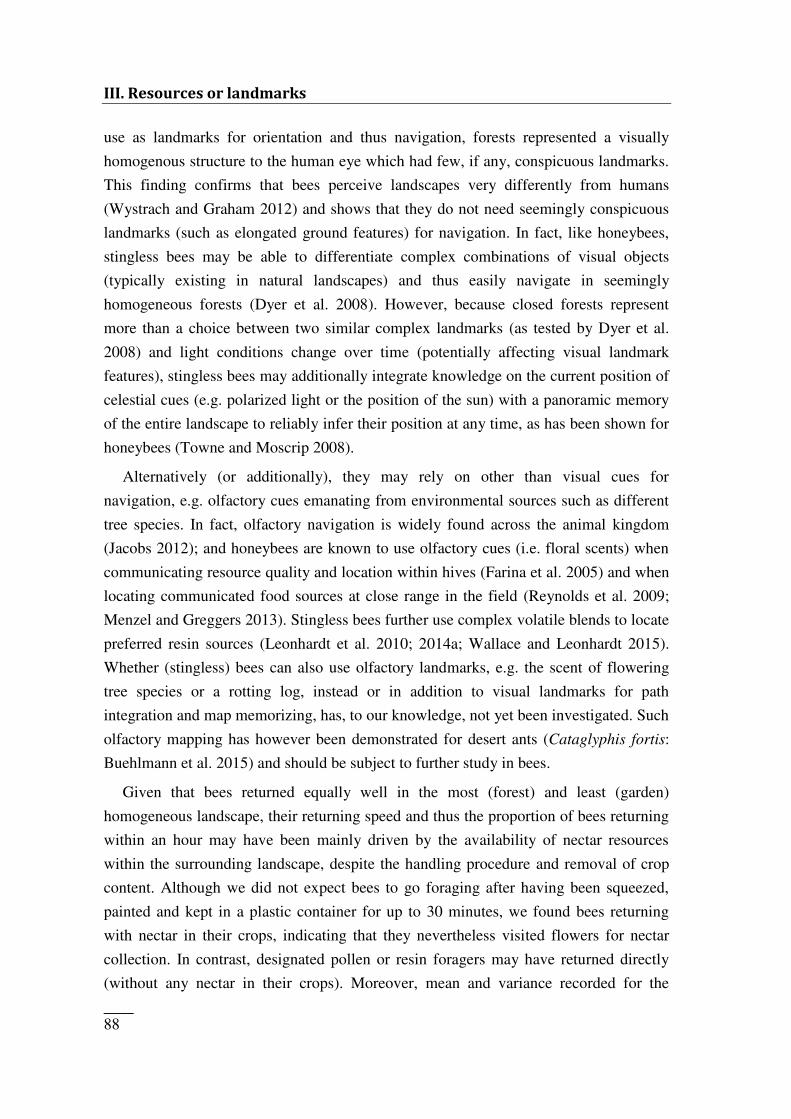
III. Resources or landmarks
_____ 88
use as landmarks for orientation and thus navigation, forests represented a visually
homogenous structure to the human eye which had few, if any, conspicuous landmarks.
This finding confirms that bees perceive landscapes very differently from humans
(Wystrach and Graham 2012) and shows that they do not need seemingly conspicuous
landmarks (such as elongated ground features) for navigation. In fact, like honeybees,
stingless bees may be able to differentiate complex combinations of visual objects
(typically existing in natural landscapes) and thus easily navigate in seemingly
homogeneous forests (Dyer et al. 2008). However, because closed forests represent
more than a choice between two similar complex landmarks (as tested by Dyer et al.
2008) and light conditions change over time (potentially affecting visual landmark
features), stingless bees may additionally integrate knowledge on the current position of
celestial cues (e.g. polarized light or the position of the sun) with a panoramic memory
of the entire landscape to reliably infer their position at any time, as has been shown for
honeybees (Towne and Moscrip 2008).
Alternatively (or additionally), they may rely on other than visual cues for
navigation, e.g. olfactory cues emanating from environmental sources such as different
tree species. In fact, olfactory navigation is widely found across the animal kingdom
(Jacobs 2012); and honeybees are known to use olfactory cues (i.e. floral scents) when
communicating resource quality and location within hives (Farina et al. 2005) and when
locating communicated food sources at close range in the field (Reynolds et al. 2009;
Menzel and Greggers 2013). Stingless bees further use complex volatile blends to locate
preferred resin sources (Leonhardt et al. 2010; 2014a; Wallace and Leonhardt 2015).
Whether (stingless) bees can also use olfactory landmarks, e.g. the scent of flowering
tree species or a rotting log, instead or in addition to visual landmarks for path
integration and map memorizing, has, to our knowledge, not yet been investigated. Such
olfactory mapping has however been demonstrated for desert ants (Cataglyphis fortis:
Buehlmann et al. 2015) and should be subject to further study in bees.
Given that bees returned equally well in the most (forest) and least (garden)
homogeneous landscape, their returning speed and thus the proportion of bees returning
within an hour may have been mainly driven by the availability of nectar resources
within the surrounding landscape, despite the handling procedure and removal of crop
content. Although we did not expect bees to go foraging after having been squeezed,
painted and kept in a plastic container for up to 30 minutes, we found bees returning
with nectar in their crops, indicating that they nevertheless visited flowers for nectar
collection. In contrast, designated pollen or resin foragers may have returned directly
(without any nectar in their crops). Moreover, mean and variance recorded for the
3.5. Discussion
_____ 89
earliest time the first nectar forager returned were highest in plantations (albeit not
significantly different from other landscapes). Plantations provide the least woody plant
species richness (Table III.1) and thus likely the least nectar resources across seasons
(Kaluza et al. 2016). Searching for scattered resources likely increases foraging
durations, as has also been shown for bumblebees in agricultural landscapes (Westphal
et al. 2006). We therefore cannot rule out that reduced homing success in plantations
was not (also) driven by limited resource availability. Moreover, variance in the time
the first forager returned was better captured by a model including woody plant species
richness and landmarks than by the model which included only landscape as
explanatory variable, further stressing the importance of resource availability (i.e. plant
species richness) in determining homing speed of nectar foragers. In contrast, variance
in all other response variables was best described by landscape.
To conclude, our study demonstrates that homing success in bees can be strongly
affected by the surrounding foraging landscape. However, landscape structural/visual
alteration (by disturbance) does not seem to provide more or less visual information
used for navigation than undisturbed natural habitats, as bees returned equally fast and
successfully in natural forests and human altered urban garden areas. This finding
indicates that return speed is primarily driven by resource availability in a landscape and
suggests that elongated ground features are not necessary (as visual landmarks
conspicuous to the human eye) for orientation, at least not for stingless bees. In fact, we
found only few, if any, such landmarks in forests, suggesting that stingless bees visually
assess landscape differently from humans, or use complex combinations of visual
objects or olfactory landmarks in more natural, seemingly homogeneous habitats.
Future studies should thus quantify respective differences between landscapes as seen
from the (stingless) bees‘ perspective.
III. Resources or landmarks
_____ 90
3.6. Acknowledgments The authors thank Julia Nagler, Manuel Pützstück, Birte Hensen, Nora Drescher and
Bradley Jeffers for assistance with field work. We further thank Sahara Farms,
Macadamia Farm Management Pty Ltd and Maroochy Bushland Botanic Gardens, as
well as numerous private land and garden owners to keep our bee hives and let us walk
around their properties. We are further grateful for the comments of two anonymous
reviewers which helped to improve our manuscript. BFK received funding from the
German Academic Exchange Agency (DAAD). The project was funded by the German
Research Foundation (DFG), LE 2750/1-1.
3.7. References Avarguès-Weber, A., A.G. Dyer, N. Ferrah and M. Giurfa (2015). "The forest or the trees:
preference for global over local image processing is reversed by prior experience in
honeybees". Proceedings of the Royal Society B: Biological Sciences, 282(1799).
Avarguès-Weber, A., T. Mota and M. Giurfa (2012). "New vistas on honey bee vision".
Apidologie, 43(3): 244-268.
Bartoń, K. (2013). "MuMIn: Multi-model inference". R package version 1.9.13. Available at:
http://CRAN.R-project.org/package=MuMIn.
Buehlmann, C., P. Graham, B.S. Hansson and M. Knaden (2015). "Desert ants use olfactory
scenes for navigation". Animal Behaviour, 106: 99-105.
Collett, Thomas S. and P. Graham (2015). "Insect navigation: do honeybees learn to follow
highways?". Current Biology, 25(6): R240-R242.
Degen, J., A. Kirbach, L. Reiter, K. Lehmann, P. Norton, M. Storms, (...) R. Menzel (2015).
"Exploratory behaviour of honeybees during orientation flights". Animal Behaviour,
102: 45-57.
Dollin, A., K. Walker and T. Heard (2009). ""Trigona carbonaria" sugarbag bee (Tetragonula
carbonaria)". PaDIL - http://www.padil.gov.au: 2012.
Dollin, A.E., L.J. Dollin and S.F. Sakagami (1997). "Australian stingless bees of the genus
Trigona (Hymenoptera : Apidae)". Invertebrate Taxonomy, 11(6): 861-896.
Dyer, A.G., M.G.P. Rosa and D.H. Reser (2008). "Honeybees can recognise images of complex
natural scenes for use as potential landmarks". Journal of Experimental Biology, 211(8):
1180-1186.
Dyer, F.C. and J.L. Could (1983). "Honey bee navigation: The honey bee's ability to find its
way depends on a hierarchy of sophisticated orientation mechanisms". American
Scientist, 71(6): 587-597.
3.7. References
_____ 91
Farina, W.M., C. Grüter and P.C. Díaz (2005). "Social learning of floral odours inside the
honeybee hive". Proceedings of the Royal Society B: Biological Sciences, 272(1575):
1923-1928.
Fry, S.N. and R. Wehner (2005). "Look and turn: landmark-based goal navigation in honey
bees". Journal of Experimental Biology, 208(20): 3945-3955.
Giurfa, M., M. Hammer, S. Stach, N. Stollhoff, N. Müller-Deisig and C. Mizyrycki (1999).
"Pattern learning by honeybees: conditioning procedure and recognition strategy".
Animal Behaviour, 57(2): 315-324.
Goulson, D., E. Nicholls, C. Botías and E.L. Rotheray (2015). "Bee declines driven by
combined stress from parasites, pesticides, and lack of flowers". Science, 347(6229).
Greenleaf, S.S., N.M. Williams, R. Winfree and C. Kremen (2007). "Bee foraging ranges and
their relationship to body size". Oecologia, 153: 589-596.
Heard, T.A. (2016). "The Australian native bee book. Keeping stingless bee hives for pets,
pollination and sugarbag hone". Sugarbag Bees, Brisbane.
Jacobs, L.F. (2012). "From chemotaxis to the cognitive map: The function of olfaction".
Proceedings of the National Academy of Sciences of the United States of America,
109(Supplement 1): 10693-10700.
Kaluza, B.F., H. Wallace, T.A. Heard, A.-M. Klein and S.D. Leonhardt (2016). "Urban gardens
promote bee foraging over natural habitats and plantations". Ecology and Evolution,
6(5): 1304-1316.
Leonhardt, S.D., A.-M. Baumann, H.M. Wallace, P. Brooks and T. Schmitt (2014a). "The
chemistry of an unusual seed dispersal mutualism: bees use a complex set of olfactory
cues to find their partner". Animal Behaviour, 98: 41-51.
Leonhardt, S.D., K. Dworschak, T. Eltz and N. Blüthgen (2007). "Foraging loads of stingless
bees and utilisation of stored nectar for pollen harvesting". Apidologie, 38: 125-135.
Leonhardt, S.D., T.A. Heard and H. Wallace (2014b). "Differences in the resource intake of two
sympatric Australian stingless bee species". Apidologie, 45(4): 514-527.
Leonhardt, S.D., S. Zeilhofer and T. Schmitt (2010). "Stingless bees use terpenes as olfactory
cues to find resin sources". Chemical Senses, 35: 603-611.
Menzel, R., K. Geiger, L. Chittka, J. Joerges, J. Kunze and U. Müller (1996). "The knowledge
base of bee navigation". Journal of Experimental Biology, 199(1): 141-146.
Menzel, R. and U. Greggers (2013). "Guidance by odors in honeybee navigation". Journal of
Comparative Physiology A, 199(10): 867-873.
Menzel, R. and U. Greggers (2015). "The memory structure of navigation in honeybees".
Journal of Comparative Physiology A, 201(6): 547-561.
Najera, D.A., E.L. McCullough and R. Jander (2015). "Honeybees use celestial and/or terrestrial
compass cues for inter-patch navigation". Ethology, 121(1): 94-102.
III. Resources or landmarks
_____ 92
Nakagawa, S. and H. Schielzeth (2013). "A general and simple method for obtaining R2 from
generalized linear mixed-effects models". Methods in Ecology and Evolution, 4(2): 133-
142.
Osborne, J.L., A.P. Martin, N.L. Carreck, J.L. Swain, M.E. Knight, D. Goulson, (...) R.A.
Sanderson (2008). "Bumblebee flight distances in relation to the forage landscape".
Journal of Animal Ecology, 77(2): 406-415.
Osborne, J.L., A. Smith, S.J. Clark, D.R. Reynolds, M.C. Barron, K.S. Lim and A.M. Reynolds
(2013). "The ontogeny of bumblebee flight trajectories: from naïve explorers to
experienced foragers". Plos One, 8(11): e78681.
Potts, S.G., J.C. Biesmeijer, C. Kremen, P. Neumann, O. Schweiger and W.E. Kunin (2010).
"Global pollinator declines: trends, impacts and drivers". Trends in Ecology and
Evolution, 25(6): 345-353.
R Development Core Team (2015). "R: A language and environment for statistical computing".
Version: 2.15.0. R Foundation for Statistical Computing, Vienna. Available at:
http://www.R-project.org.
Rasmussen, C. and S.A. Cameron (2007). "A molecular phylogeny of the Old World stingless
bees (Hymenoptera: Apidae: Meliponini) and the non-monophyly of the large genus
Trigona". Systematic Entomology, 32: 26-39.
Reynolds, A.M., J.L. Swain, A.D. Smith, A.P. Martin and J.L. Osborne (2009). "Honeybees use
a Lévy flight search strategy and odour-mediated anemotaxis to relocate food sources".
Behavioral Ecology and Sociobiology, 64(1): 115.
Roulston, T.H. and K. Goodell (2011). "The role of resources and risks in regulating wild bee
populations". Annual Review of Entomology, 56(1): 293-312.
Sánchez, D. and R. Vandame (2012). "Color and shape discrimination in the stingless bee
Scaptotrigona mexicana Guérin (Hymenoptera, Apidae)". Neotropical Entomology,
41(3): 171-177.
Smith, J.P., T.A. Heard, M. Beekman and R. Gloag (2016). "Flight range of the Australian
stingless bee Tetragonula carbonaria (Hymenoptera: Apidae)". Austral Entomology.
Spaethe, J., M. Streinzer, J. Eckert, S. May and A.G. Dyer (2014). "Behavioural evidence of
colour vision in free flying stingless bees". Journal of Comparative Physiology A,
200(6): 485-496.
Srinivasan, M.V. (2014). "Going with the flow: a brief history of the study of the honeybee‘s navigational ‗odometer‘". Journal of Comparative Physiology A, 200(6): 563-573.
Steffan-Dewenter, I. and A. Kuhn (2003). "Honeybee foraging in differentially structured
landscapes". Proceedings of the Royal Society B: Biological Sciences, 270(1515): 569-
575.
Towne, W.F. and H. Moscrip (2008). "The connection between landscapes and the solar
ephemeris in honeybees". Journal of Experimental Biology, 211(23): 3729-3736.
3.7. References
_____ 93
Vanbergen, A.J. and the Insect Pollinators Initiative (2013). "Threats to an ecosystem service:
pressures on pollinators". Frontiers in Ecology and the Environment, 11(5): 251-259.
von Frisch, K. (1967). "The dance language and orientation of bees". Belknap Press of Harvard
University Press, Cambridge.
Wallace, H.M. and S.D. Leonhardt (2015). "Do hybrid trees inherit invasive characteristics?
Fruits of Corymbia torelliana X C. citriodora hybrids and potential for seed dispersal
by bees". Plos One, 10(9): e0138868.
Wehner, R., B. Michel and P. Antonsen (1996). "Visual navigation in insects: coupling of
egocentric and geocentric information". Journal of Experimental Biology, 199(1): 129-
140.
Westphal, C., I. Steffan-Dewenter and T. Tscharntke (2006). "Foraging trip duration of
bumblebees in relation to landscape-wide resource availability". Ecological
Entomology, 31: 389-394.
Williams, N.M. and C. Kremen (2007). "Resource distributions among habitats determine
solitary bee offspring production in a mosaic landscape". Ecological Applications, 17:
910-921.
Winfree, R., R. Aguilar, D.P. Vázquez, G. LeBuhn and M.A. Aizen (2009). "A meta-analysis of
bees' responses to anthropogenic disturbance". Ecology, 90(8): 2068-2076.
Wystrach, A. and P. Graham (2012). "What can we learn from studies of insect navigation?".
Animal Behaviour, 84(1): 13-20.

_____ 94
_____ 95
IV. GENERALIST SOCIAL BEES MAXIMIZE DIVERSITY INTAKE IN PLANT SPECIES RICH AND RESOURCE ABUNDANT ENVIRONMENTS 4.1. Abstract
Numerous studies revealed a positive relationship between biodiversity and
ecosystem functioning, suggesting that biodiverse environments may not only enhance
ecosystem processes, but also benefit individual ecosystem members by e.g. providing a
higher diversity of resources. Whether and how the number of available resources
affects resource collection and subsequently consumers (e.g. through impacting
functions associated with resources) has however been little investigated, although a
better understanding of this relationship may help explain why the abundance and
richness of species typically declines with decreasing plant (resource) diversity.
Using a social bee species as model, we investigated how plant species
richness - recorded for study sites located in different habitats - and associated resource
abundance affected the diversity and functional role (here defined as nutritional quality
and antimicrobial activity) of resources (i.e. pollen, nectar and resin) collected by a
generalist herbivorous consumer. The diversity of both pollen and resin collected
strongly increased with increasing plant/tree species richness, while resource abundance
was only positively correlated with resin diversity. These findings suggest that bees
maximize resource diversity intake in (resource) diverse habitats. Collecting more
diverse resources did however not increase resource functionality, which appeared to be
primarily driven by the surrounding (plant) source community in our study. In generalist
herbivores, maximizing resource diversity intake may therefore primarily secure
collection of sufficient amounts of resources across the entire foraging season, but it
also ensures that the allocated resources meet all functional needs. Decreasing available
resource diversity may thus impact consumers primarily by reduced resource
abundance, but also by reduced resource functionality particularly when resources of
high functional quality (e.g. specific forest tree species) become scarce.
IV. Generalist social bees maximize diversity
_____ 96
4.2. Introduction Biodiversity is a critical driver of ecosystem functioning, as it maintains the stability
of ecosystem processes and provides insurance against changing environmental
conditions (Loreau et al. 2001). Diverse ecosystems typically contain more producers
and consumers than less diverse ecosystems (Gamfeldt et al. 2005; Hines and Hendrix
2005), resulting in more interactions within or across trophic levels which can further
stabilize ecosystem services (Ives et al. 2005; Balvanera et al. 2006). The same
ecosystem process can be supported by multiple species or functional groups in diverse
ecosystems which are functionally redundant, thus increasing resilience of the whole
system (Blüthgen and Klein 2011). This increased resilience in ecosystem functioning
due to biodiversity has frequently been demonstrated (Brittain et al. 2013; Garibaldi et
al. 2013). However, whether single organisms in ecosystems also benefit from
increasing biodiversity has received little attention.
Biodiverse systems provide a variety of resources to be exploited by consumers
(Duffy et al. 2007). Higher resource diversity can in theory either benefit consumers by
providing a constant supply of various resources to choose from and to compose ideal
(e.g. nutritionally well balanced) resource mixtures, or negatively affect consumers by
diluting preferred resources (as shown for several specialist insect herbivores:
Yamamura 2002; Otway et al. 2005). Yet we still do not fully understand whether and,
if so, how increased resource diversity affects resource collection in generalist
consumers. They could, in theory, respond to increased available resource diversity in
two ways: (a) by maximizing collected resource diversity (henceforth referred to as
‗diversity maximization‘) or (b) by targeting a specific number of collected resources
sufficient to cover all functional needs, leading to a saturation in collected resource
diversity (henceforth referred to as ‗diversity restriction‘). While ‗diversity restriction‘ will always require the time-consuming active selection of preferred resources in a
resource diverse environment, ‗diversity maximization‘ may be either passive (through foraging on any resource encountered next in diverse habitats) or active (through
seeking for a maximum of different resources). Active maximization should
consequently result in a constantly more even distribution of different resources, while
passive maximization should lead to a more uneven resource distribution (as some plant
sources are typically more abundant in environments than others).
Increasing resource diversity positively correlates with higher health and
performance of (herbivorous) consumers (Alaux et al. 2010; Di Pasquale et al. 2013;
Drescher et al. 2014), e.g. through improving nutritional balance or toxin dilution (in
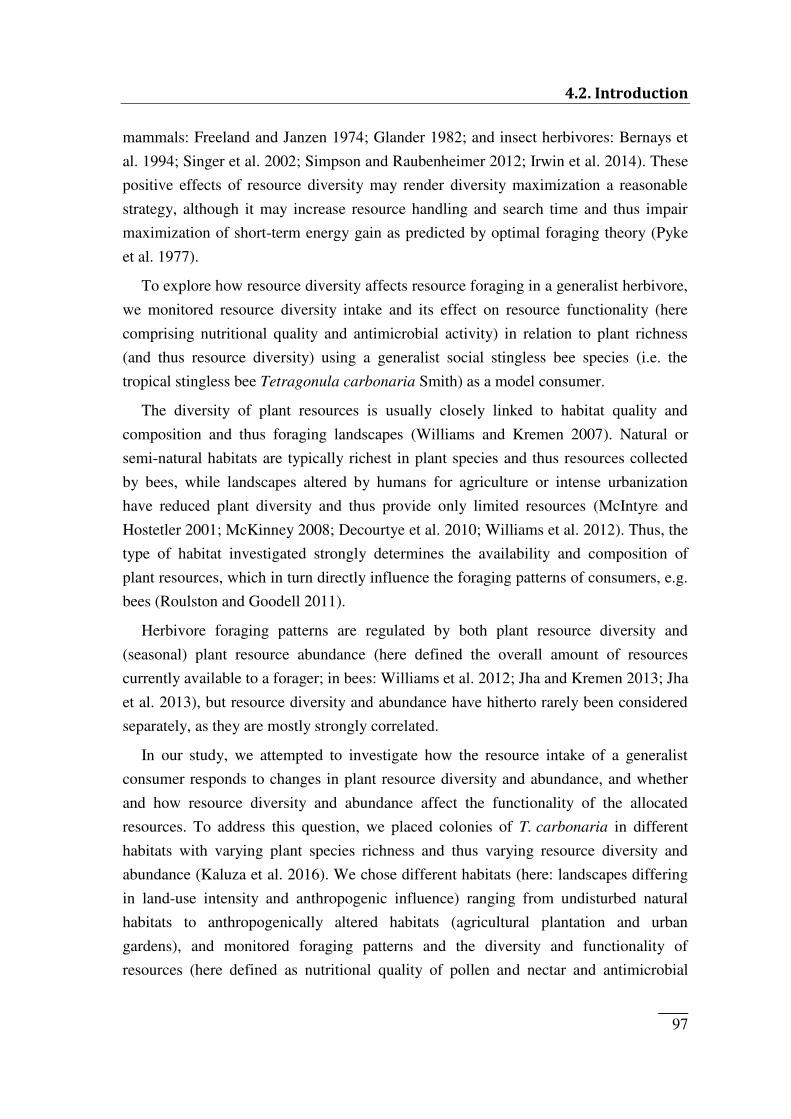
4.2. Introduction
_____ 97
mammals: Freeland and Janzen 1974; Glander 1982; and insect herbivores: Bernays et
al. 1994; Singer et al. 2002; Simpson and Raubenheimer 2012; Irwin et al. 2014). These
positive effects of resource diversity may render diversity maximization a reasonable
strategy, although it may increase resource handling and search time and thus impair
maximization of short-term energy gain as predicted by optimal foraging theory (Pyke
et al. 1977).
To explore how resource diversity affects resource foraging in a generalist herbivore,
we monitored resource diversity intake and its effect on resource functionality (here
comprising nutritional quality and antimicrobial activity) in relation to plant richness
(and thus resource diversity) using a generalist social stingless bee species (i.e. the
tropical stingless bee Tetragonula carbonaria Smith) as a model consumer.
The diversity of plant resources is usually closely linked to habitat quality and
composition and thus foraging landscapes (Williams and Kremen 2007). Natural or
semi-natural habitats are typically richest in plant species and thus resources collected
by bees, while landscapes altered by humans for agriculture or intense urbanization
have reduced plant diversity and thus provide only limited resources (McIntyre and
Hostetler 2001; McKinney 2008; Decourtye et al. 2010; Williams et al. 2012). Thus, the
type of habitat investigated strongly determines the availability and composition of
plant resources, which in turn directly influence the foraging patterns of consumers, e.g.
bees (Roulston and Goodell 2011).
Herbivore foraging patterns are regulated by both plant resource diversity and
(seasonal) plant resource abundance (here defined the overall amount of resources
currently available to a forager; in bees: Williams et al. 2012; Jha and Kremen 2013; Jha
et al. 2013), but resource diversity and abundance have hitherto rarely been considered
separately, as they are mostly strongly correlated.
In our study, we attempted to investigate how the resource intake of a generalist
consumer responds to changes in plant resource diversity and abundance, and whether
and how resource diversity and abundance affect the functionality of the allocated
resources. To address this question, we placed colonies of T. carbonaria in different
habitats with varying plant species richness and thus varying resource diversity and
abundance (Kaluza et al. 2016). We chose different habitats (here: landscapes differing
in land-use intensity and anthropogenic influence) ranging from undisturbed natural
habitats to anthropogenically altered habitats (agricultural plantation and urban
gardens), and monitored foraging patterns and the diversity and functionality of
resources (here defined as nutritional quality of pollen and nectar and antimicrobial
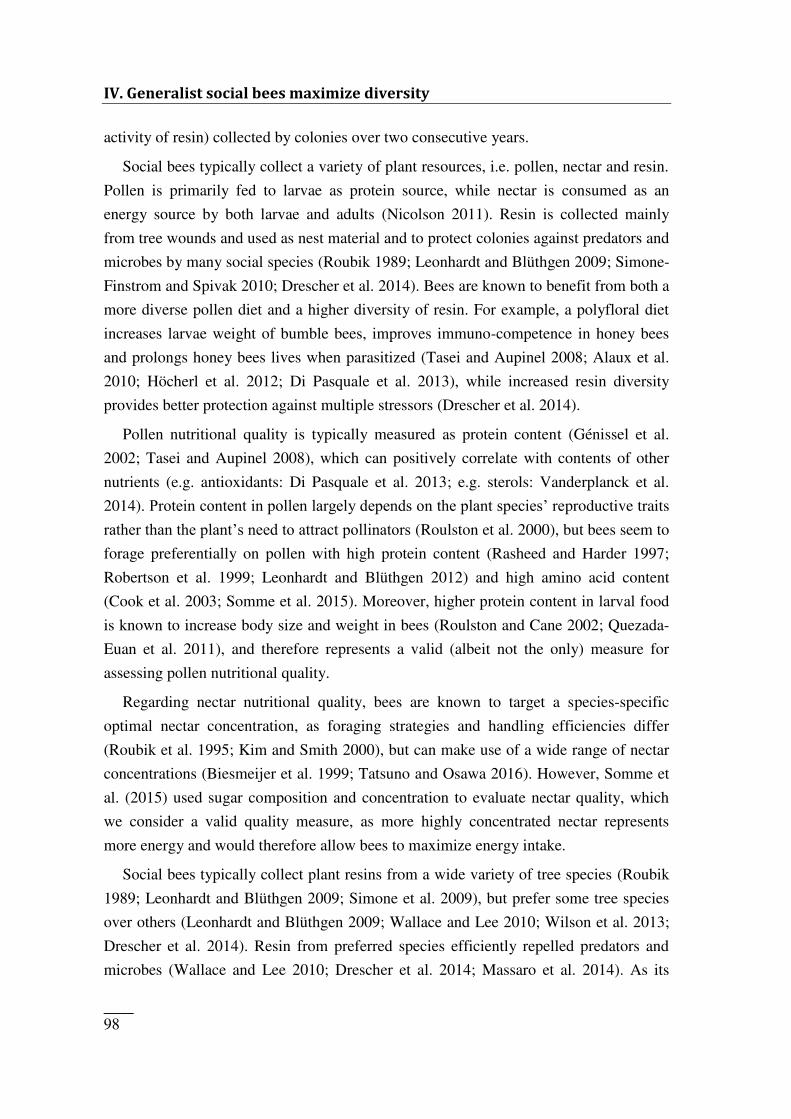
IV. Generalist social bees maximize diversity
_____ 98
activity of resin) collected by colonies over two consecutive years.
Social bees typically collect a variety of plant resources, i.e. pollen, nectar and resin.
Pollen is primarily fed to larvae as protein source, while nectar is consumed as an
energy source by both larvae and adults (Nicolson 2011). Resin is collected mainly
from tree wounds and used as nest material and to protect colonies against predators and
microbes by many social species (Roubik 1989; Leonhardt and Blüthgen 2009; Simone-
Finstrom and Spivak 2010; Drescher et al. 2014). Bees are known to benefit from both a
more diverse pollen diet and a higher diversity of resin. For example, a polyfloral diet
increases larvae weight of bumble bees, improves immuno-competence in honey bees
and prolongs honey bees lives when parasitized (Tasei and Aupinel 2008; Alaux et al.
2010; Höcherl et al. 2012; Di Pasquale et al. 2013), while increased resin diversity
provides better protection against multiple stressors (Drescher et al. 2014).
Pollen nutritional quality is typically measured as protein content (Génissel et al.
2002; Tasei and Aupinel 2008), which can positively correlate with contents of other
nutrients (e.g. antioxidants: Di Pasquale et al. 2013; e.g. sterols: Vanderplanck et al.
2014). Protein content in pollen largely depends on the plant species‘ reproductive traits
rather than the plant‘s need to attract pollinators (Roulston et al. 2000), but bees seem to
forage preferentially on pollen with high protein content (Rasheed and Harder 1997;
Robertson et al. 1999; Leonhardt and Blüthgen 2012) and high amino acid content
(Cook et al. 2003; Somme et al. 2015). Moreover, higher protein content in larval food
is known to increase body size and weight in bees (Roulston and Cane 2002; Quezada-
Euan et al. 2011), and therefore represents a valid (albeit not the only) measure for
assessing pollen nutritional quality.
Regarding nectar nutritional quality, bees are known to target a species-specific
optimal nectar concentration, as foraging strategies and handling efficiencies differ
(Roubik et al. 1995; Kim and Smith 2000), but can make use of a wide range of nectar
concentrations (Biesmeijer et al. 1999; Tatsuno and Osawa 2016). However, Somme et
al. (2015) used sugar composition and concentration to evaluate nectar quality, which
we consider a valid quality measure, as more highly concentrated nectar represents
more energy and would therefore allow bees to maximize energy intake.
Social bees typically collect plant resins from a wide variety of tree species (Roubik
1989; Leonhardt and Blüthgen 2009; Simone et al. 2009), but prefer some tree species
over others (Leonhardt and Blüthgen 2009; Wallace and Lee 2010; Wilson et al. 2013;
Drescher et al. 2014). Resin from preferred species efficiently repelled predators and
microbes (Wallace and Lee 2010; Drescher et al. 2014; Massaro et al. 2014). As its
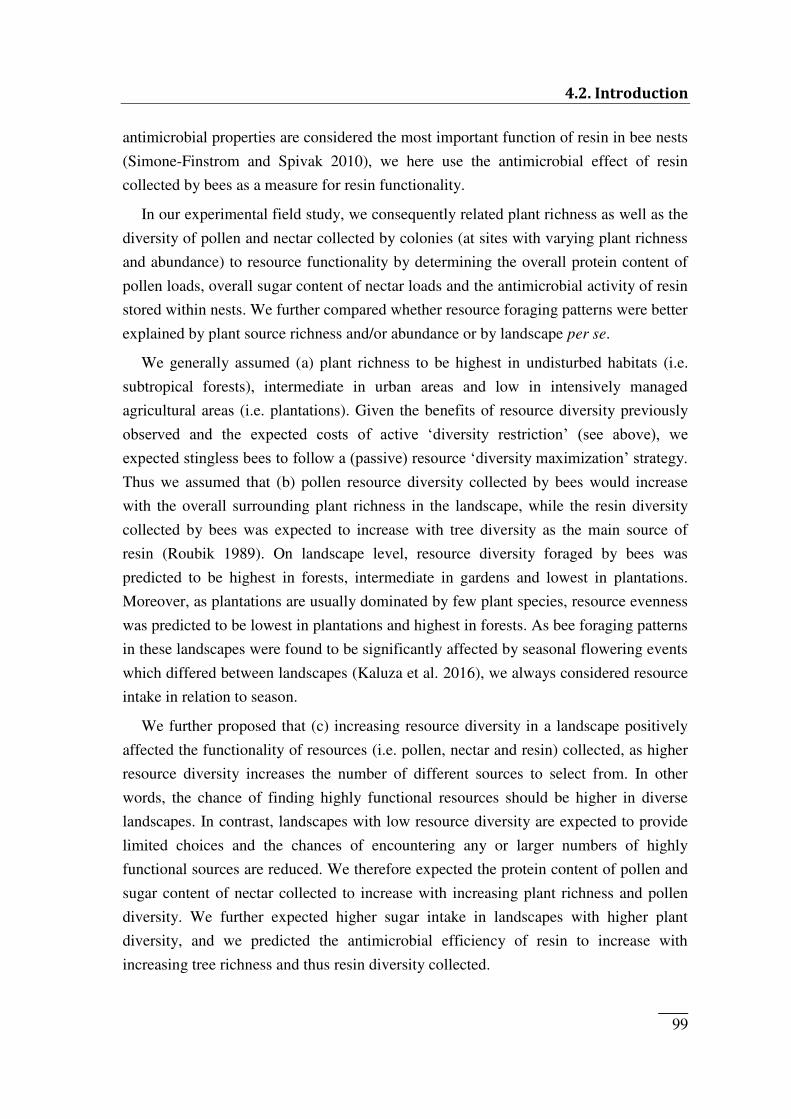
4.2. Introduction
_____ 99
antimicrobial properties are considered the most important function of resin in bee nests
(Simone-Finstrom and Spivak 2010), we here use the antimicrobial effect of resin
collected by bees as a measure for resin functionality.
In our experimental field study, we consequently related plant richness as well as the
diversity of pollen and nectar collected by colonies (at sites with varying plant richness
and abundance) to resource functionality by determining the overall protein content of
pollen loads, overall sugar content of nectar loads and the antimicrobial activity of resin
stored within nests. We further compared whether resource foraging patterns were better
explained by plant source richness and/or abundance or by landscape per se.
We generally assumed (a) plant richness to be highest in undisturbed habitats (i.e.
subtropical forests), intermediate in urban areas and low in intensively managed
agricultural areas (i.e. plantations). Given the benefits of resource diversity previously
observed and the expected costs of active ‗diversity restriction‘ (see above), we expected stingless bees to follow a (passive) resource ‗diversity maximization‘ strategy. Thus we assumed that (b) pollen resource diversity collected by bees would increase
with the overall surrounding plant richness in the landscape, while the resin diversity
collected by bees was expected to increase with tree diversity as the main source of
resin (Roubik 1989). On landscape level, resource diversity foraged by bees was
predicted to be highest in forests, intermediate in gardens and lowest in plantations.
Moreover, as plantations are usually dominated by few plant species, resource evenness
was predicted to be lowest in plantations and highest in forests. As bee foraging patterns
in these landscapes were found to be significantly affected by seasonal flowering events
which differed between landscapes (Kaluza et al. 2016), we always considered resource
intake in relation to season.
We further proposed that (c) increasing resource diversity in a landscape positively
affected the functionality of resources (i.e. pollen, nectar and resin) collected, as higher
resource diversity increases the number of different sources to select from. In other
words, the chance of finding highly functional resources should be higher in diverse
landscapes. In contrast, landscapes with low resource diversity are expected to provide
limited choices and the chances of encountering any or larger numbers of highly
functional sources are reduced. We therefore expected the protein content of pollen and
sugar content of nectar collected to increase with increasing plant richness and pollen
diversity. We further expected higher sugar intake in landscapes with higher plant
diversity, and we predicted the antimicrobial efficiency of resin to increase with
increasing tree richness and thus resin diversity collected.
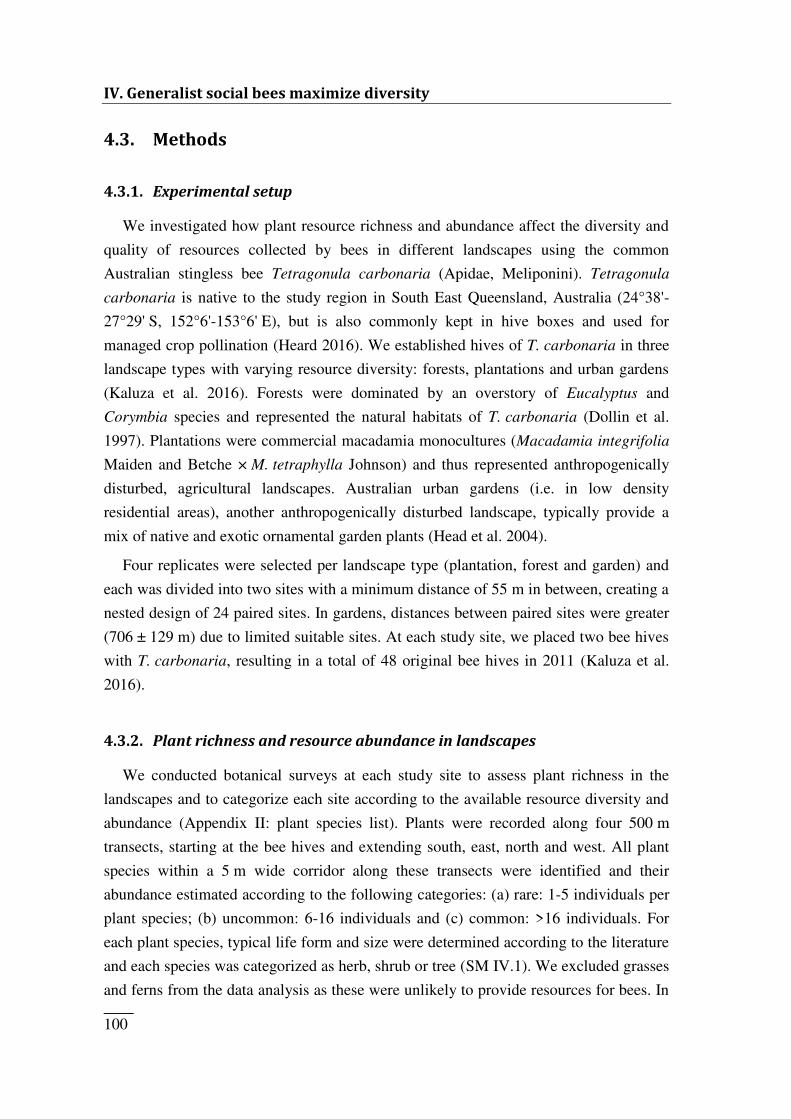
IV. Generalist social bees maximize diversity
_____ 100
4.3. Methods 4.3.1. Experimental setup
We investigated how plant resource richness and abundance affect the diversity and
quality of resources collected by bees in different landscapes using the common
Australian stingless bee Tetragonula carbonaria (Apidae, Meliponini). Tetragonula
carbonaria is native to the study region in South East Queensland, Australia (24°38'-
27°29' S, 152°6'-153°6' E), but is also commonly kept in hive boxes and used for
managed crop pollination (Heard 2016). We established hives of T. carbonaria in three
landscape types with varying resource diversity: forests, plantations and urban gardens
(Kaluza et al. 2016). Forests were dominated by an overstory of Eucalyptus and
Corymbia species and represented the natural habitats of T. carbonaria (Dollin et al.
1997). Plantations were commercial macadamia monocultures (Macadamia integrifolia
Maiden and Betche × M. tetraphylla Johnson) and thus represented anthropogenically
disturbed, agricultural landscapes. Australian urban gardens (i.e. in low density
residential areas), another anthropogenically disturbed landscape, typically provide a
mix of native and exotic ornamental garden plants (Head et al. 2004).
Four replicates were selected per landscape type (plantation, forest and garden) and
each was divided into two sites with a minimum distance of 55 m in between, creating a
nested design of 24 paired sites. In gardens, distances between paired sites were greater
(706 ± 129 m) due to limited suitable sites. At each study site, we placed two bee hives
with T. carbonaria, resulting in a total of 48 original bee hives in 2011 (Kaluza et al.
2016).
4.3.2. Plant richness and resource abundance in landscapes We conducted botanical surveys at each study site to assess plant richness in the
landscapes and to categorize each site according to the available resource diversity and
abundance (Appendix II: plant species list). Plants were recorded along four 500 m
transects, starting at the bee hives and extending south, east, north and west. All plant
species within a 5 m wide corridor along these transects were identified and their
abundance estimated according to the following categories: (a) rare: 1-5 individuals per
plant species; (b) uncommon: 6-16 individuals and (c) common: >16 individuals. For
each plant species, typical life form and size were determined according to the literature
and each species was categorized as herb, shrub or tree (SM IV.1). We excluded grasses
and ferns from the data analysis as these were unlikely to provide resources for bees. In
4.3. Methods
_____ 101
plantations and forests, paired study sites were in close proximity and had identical
plant assemblages. We thus used the same survey data for plant richness and abundance
for both respective paired sites, but performed separate transect walks for all (paired)
garden sites.
We then estimated plant resource abundance available to bees using a maximum
likelihood search to determine the most appropriate numerical values to replace our
abundance categories (rare, uncommon and common) and life form categories (herb,
shrub and tree) as described below. We used mean foraging activity as a response
variable to estimate these values, as foraging activity is strongly related to resource
abundance in landscapes (see Kaluza et al. 2016). Values were optimized for a
generalized linear model (GLM) consisting of the interacting explanatory variables
plant abundance and log of plant richness. In this model, randomly created values were
repeatedly tested until a set of values was determined which best explained the model
variance for foraging activity (optimized for R², see Nakagawa and Schielzeth 2013;
R Development Core Team 2013). This optimization process was restricted by fixing
herb < shrub < tree, and rare < uncommon < common, which resulted in a factor matrix
for rare, uncommon, common × herb, shrub and tree (SM IV.1). In a corresponding
frequency matrix for each study site, the relative frequency of each category (e.g. rare
herb) was calculated by dividing the number of plant species in this category by the
total number of plant species at this study site (SM IV.1). The obtained factor matrix
was then multiplied with the frequency matrix for each study site, and the sum of all
values in the resulting matrix was used as plant resource abundance value for the
respective study site (SM IV.1).
Resin diversity and quality was expected to be influenced by tree richness and
abundance. Tree resource abundance was therefore calculated using the same process
and the same values obtained from the likelihood optimization, but restricted to tree
abundances in the factor and frequency matrix, thereby emphasizing differences
between tree resource abundance categories (rare, uncommon and common).
4.3.3. Resource diversity collected by bees Observations of bee foraging and resource intake were conducted from September
2011 to September 2013, for three seasons per year, i.e. the dry season (September-
December), wet season (January-April) and cold season (May-August). In each season,
selected bee hives were visited on three rain-free days within 31 ± 9 days (see Kaluza et
al. 2016). For the wet season 2012, hive observations were conducted for all hives at all
IV. Generalist social bees maximize diversity
_____ 102
sites. Observations were then restricted to a subsample of 6-8 bee hives located at 3-4
sites for each landscape type in the remaining seasons to enable a reasonable sampling
effort and were re-visited in all following seasons.
Observations were performed when hives had sufficient activity, i.e. from 7:30-15:30
in the dry season and 10:00-15:00 in the cold season. During each observation, 20
returning foragers were caught at the hive entrance and their load (nectar, pollen or
resin) identified. Individuals were removed for the duration of the experiment to avoid
recapturing.
Pollen and resin types were categorized by colour (pollen) or colour, texture and
smell (resins). Colour diversity of pollen or resin loads can be used as a proxy for the
diversity of plant species visited by bees (resin: Leonhardt et al. 2011; pollen:
Leonhardt and Blüthgen 2012; Leonhardt et al. 2014). Moreover, different eucalypt (i.e.
Myrtaceae) species typically have pollen that cannot be distinguished with
palynological methods because of their parasyncolpate and tricolpate shape and similar
size (Thornhill et al. 2012), rendering assessment by colour or costly DNA meta-
barcoding a more appropriate approach for comparative analyses. We additionally
assessed pollen diversity by (a) palynological analysis via pollen microscopy (see SM
IV.2) and (b) pollen DNA meta-barcoding (SM 4, Keller et al. 2015; Sickel et al. 2015)
for a subset of our samples (SM IV.3). These additional analyses revealed that the
diversity of pollen colours (exponent of Shannon diversity, eH’) was positively
correlated with the diversity of pollen morphospecies types (as assessed by
palynological analysis: r = 0.81, P < 0.001, SM IV.2), but that assessment by pollen
colours generally underestimated actual taxon diversity (i.e. pollen colour diversity was
0.7 times lower than diversity of DNA meta-barcoding, SM IV.3) and therefore
provides a valid, but rather conservative diversity estimate. Pollen microscopy was
further used to check the purity of pollen loads and confirmed that bees rarely mixed
pollen types on single foraging trips (overall 4 % polyfloral samples). Categorization of
resin loads was validated by comparing the chemical profiles of samples obtained by
gas chromatography mass spectrometry (GCMS) analysis as described in Leonhardt et
al. (2011).
Pollen loads of each pollen forager were removed from hind legs, weighed and
stored in Eppendorf tubes for subsequent analyses. Likewise, resin loads were removed
and stored in hexane for control analyses. The numbers of pollen and resin categories
were then pooled per site and day to assess pollen and resin diversity per site. Note that
we only used pollen and resin samples which were collected by different hives at the
same site on one observation day to estimate diversity, to avoid overestimating resource
4.3. Methods
_____ 103
diversity due to mismatching pollen and resin types across days.
We focused on pollen and resin diversity for observations, as nectar diversity cannot
easily be assessed in the field, because sugar composition or sucrose concentration vary
greatly within single plant species depending on flower age or time of day (Nicolson
and Van Wyk 1998; Torres and Galetto 1998) and do therefore not allow for assessing
nectar diversity based on foraged loads.
4.3.4. Resource functionality PROTEIN CONTENT OF POLLEN. The amino acid content of pollen collected from all
pollen foragers at each observation was analysed by ion exchange chromatography
(IEC: Biotronik, amino acid analyser LC 3000) as described in Leonhardt and Blüthgen
(2012). Pollen was first weighed, then mixed with 200 μL of 6 N HCl, heated for 4 h at
100 °C, cooled down to room temperature and centrifuged (10 min). The supernatant
was transferred into a fresh Eppendorf tube and water content reduced at 100 °C. The
sample was re-dissolved in 200 μL of purified water and centrifuged again for 10 min.
Then, 100 μL of the supernatant was mixed with 20 μL of 12.5 % sulphosalicylic acid,
extracted in the refrigerator (30 min), mixed and centrifuged (10 min). Finally, 100 μL of the supernatant was mixed with 100 μL sample rarefaction buffer in a fresh micro centrifuge tube, filtered and centrifuged (5 min), before the sample was transferred into
a fresh micro centrifuge tube for further rarefaction with buffer (1:5) and analysis by
IEC.
The resulting amino acid concentration (c in μMol/g) was used to calculate the average protein intake (FP in μg) per foraging trip for (a) all amino acids and (b) only
the essential amino acids for each hive observation:
P
n
P
PN
Mcm
F
1
***2
where mP (in g) is the pollen weight (pooled for all pollen foragers caught) * 2 (as we
chemically analysed pollen from only one hind leg), M is the molar mass of the
respective amino acid (n) and NP the number of foragers whose pollen loads were
analysed. We considered methionine, arginine, tryptophan, lysine, isoleucine, leucine,
phenylalanine, histidine, valine and threonine essential for bees and included proline
due to its importance in the flight muscle metabolism in adult bees (de Groot 1953;
Micheu et al. 2000).
IV. Generalist social bees maximize diversity
_____ 104
SUGAR CONTENT OF NECTAR. Nectar foragers were carefully squeezed to provoke
regurgitation of the crop content. Nectar quantity was measured in 5 µL microcapillary
tubes (Camag, Muttenz, Switzerland) and nectar concentration determined with hand-
held refractometers (Eclipse Refractometer, Bellingham + Stanley Ltd., Lawrenceville,
USA). To obtain a measure for the quality of overall sugar intake we calculated sucrose
loads of individual nectar foragers by converting sugar concentration (c in %) into x (in
µg/µL) following Kearns and Inouye (1993); (see Leonhardt et al. 2014; Kaluza et al.
2016) according to the equation:
x = -0.0928 + 10.0131 * c + 0.0363 * c² + 0.0002 * c³.
ANTIMICROBIAL ACTIVITY OF RESIN. Resin samples were collected in 2012 from resin
stores of 2-3 hives for 6 sites in each landscape. Resin stores typically contain soft,
reusable resin collected by foragers across all seasons and provide resin in sufficient
quantities for microbial assays. Resin samples of all hives on both paired sites were
mixed (resulting in 3 samples per landscape type) and microbial assays were repeated 5
times per resin mix to determine the antimicrobial activity of the overall resin diversity
available at landscape level (N = 45 per microorganism).
Microbial assays were performed following Drescher et al. (2014). For each mixed
resin sample, 0.6 g resin was extracted in 20 mL of 70 % ethanol (3 % w/v) and filtered
twice. Microbial growth inhibition was determined using the agar well diffusion
technique on a 64-well plate (27.9*27.9*1 cm). Three type-culture strains of
microorganisms were tested: Bacillus cereus (ATCC 11788, Gram-positive bacterium),
Salmonella Typhimurium (ATCC 13311, Gram-negative bacterium) and Candida
albicans (laboratory strain of unicellular fungus). Mueller-Hinton agar (growth media)
was liquefied and inoculated with microbial suspension to a final concentration of
3*107 CFU/ml. Agar with bacteria was poured onto plates to solidify before punching in
holes as test wells. Wells were filled with 150 μL of resin extracts (effective resin amount: 4.5 mg/well) and plates then incubated at 36.5 °C for 20 h. Antimicrobial
activity was quantified as the mean zone of growth inhibition.
For each microorganism, the growth inhibition of each sample was divided by the
mean growth inhibition. The standardized results were then pooled across
microorganisms as relative growth inhibition.
4.3.5. Statistical analysis Generalized linear mixed effect models (GLMM) were used to analyse the effect of
landscape or plant richness and resource abundance, and season (fixed explanatory
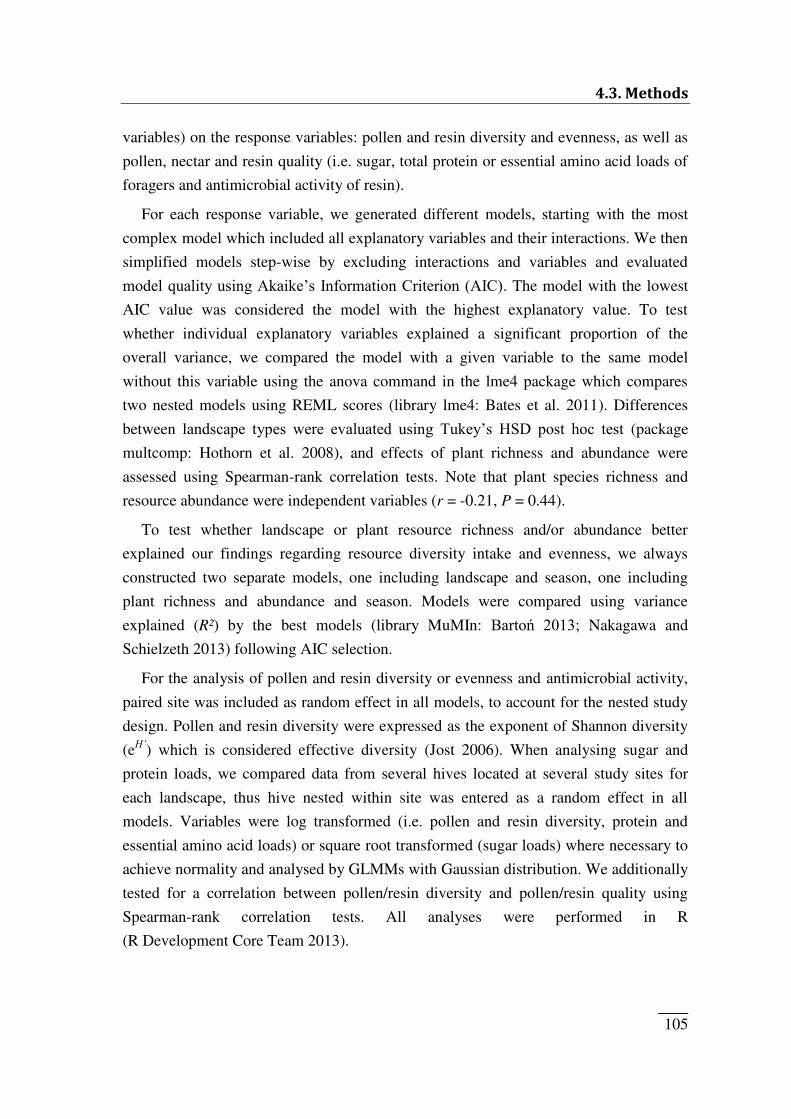
4.3. Methods
_____ 105
variables) on the response variables: pollen and resin diversity and evenness, as well as
pollen, nectar and resin quality (i.e. sugar, total protein or essential amino acid loads of
foragers and antimicrobial activity of resin).
For each response variable, we generated different models, starting with the most
complex model which included all explanatory variables and their interactions. We then
simplified models step-wise by excluding interactions and variables and evaluated
model quality using Akaike‘s Information Criterion (AIC). The model with the lowest
AIC value was considered the model with the highest explanatory value. To test
whether individual explanatory variables explained a significant proportion of the
overall variance, we compared the model with a given variable to the same model
without this variable using the anova command in the lme4 package which compares
two nested models using REML scores (library lme4: Bates et al. 2011). Differences
between landscape types were evaluated using Tukey‘s HSD post hoc test (package
multcomp: Hothorn et al. 2008), and effects of plant richness and abundance were
assessed using Spearman-rank correlation tests. Note that plant species richness and
resource abundance were independent variables (r = -0.21, P = 0.44).
To test whether landscape or plant resource richness and/or abundance better
explained our findings regarding resource diversity intake and evenness, we always
constructed two separate models, one including landscape and season, one including
plant richness and abundance and season. Models were compared using variance
explained (R²) by the best models (library MuMIn: Bartoń 2013; Nakagawa and
Schielzeth 2013) following AIC selection.
For the analysis of pollen and resin diversity or evenness and antimicrobial activity,
paired site was included as random effect in all models, to account for the nested study
design. Pollen and resin diversity were expressed as the exponent of Shannon diversity
(eH’) which is considered effective diversity (Jost 2006). When analysing sugar and
protein loads, we compared data from several hives located at several study sites for
each landscape, thus hive nested within site was entered as a random effect in all
models. Variables were log transformed (i.e. pollen and resin diversity, protein and
essential amino acid loads) or square root transformed (sugar loads) where necessary to
achieve normality and analysed by GLMMs with Gaussian distribution. We additionally
tested for a correlation between pollen/resin diversity and pollen/resin quality using
Spearman-rank correlation tests. All analyses were performed in R
(R Development Core Team 2013).
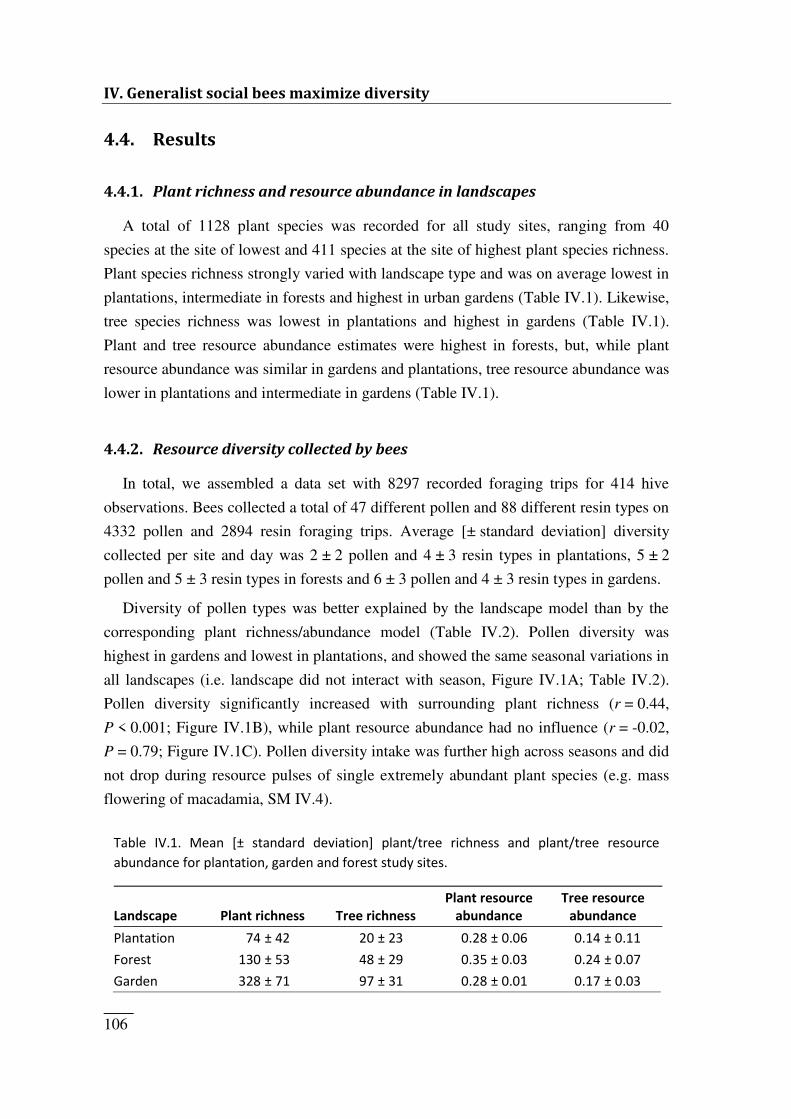
IV. Generalist social bees maximize diversity
_____ 106
4.4. Results 4.4.1. Plant richness and resource abundance in landscapes
A total of 1128 plant species was recorded for all study sites, ranging from 40
species at the site of lowest and 411 species at the site of highest plant species richness.
Plant species richness strongly varied with landscape type and was on average lowest in
plantations, intermediate in forests and highest in urban gardens (Table IV.1). Likewise,
tree species richness was lowest in plantations and highest in gardens (Table IV.1).
Plant and tree resource abundance estimates were highest in forests, but, while plant
resource abundance was similar in gardens and plantations, tree resource abundance was
lower in plantations and intermediate in gardens (Table IV.1).
4.4.2. Resource diversity collected by bees In total, we assembled a data set with 8297 recorded foraging trips for 414 hive
observations. Bees collected a total of 47 different pollen and 88 different resin types on
4332 pollen and 2894 resin foraging trips. Average [± standard deviation] diversity
collected per site and day was 2 ± 2 pollen and 4 ± 3 resin types in plantations, 5 ± 2
pollen and 5 ± 3 resin types in forests and 6 ± 3 pollen and 4 ± 3 resin types in gardens.
Diversity of pollen types was better explained by the landscape model than by the
corresponding plant richness/abundance model (Table IV.2). Pollen diversity was
highest in gardens and lowest in plantations, and showed the same seasonal variations in
all landscapes (i.e. landscape did not interact with season, Figure IV.1A; Table IV.2).
Pollen diversity significantly increased with surrounding plant richness (r = 0.44,
P < 0.001; Figure IV.1B), while plant resource abundance had no influence (r = -0.02,
P = 0.79; Figure IV.1C). Pollen diversity intake was further high across seasons and did
not drop during resource pulses of single extremely abundant plant species (e.g. mass
flowering of macadamia, SM IV.4).
Table IV.1. Mean [± standard deviation] plant/tree richness and plant/tree resource abundance for plantation, garden and forest study sites. Landscape Plant richness Tree richness Plant resource abundance Tree resource abundance Plantation 74 ± 42 20 ± 23 0.28 ± 0.06 0.14 ± 0.11 Forest 130 ± 53 48 ± 29 0.35 ± 0.03 0.24 ± 0.07 Garden 328 ± 71 97 ± 31 0.28 ± 0.01 0.17 ± 0.03
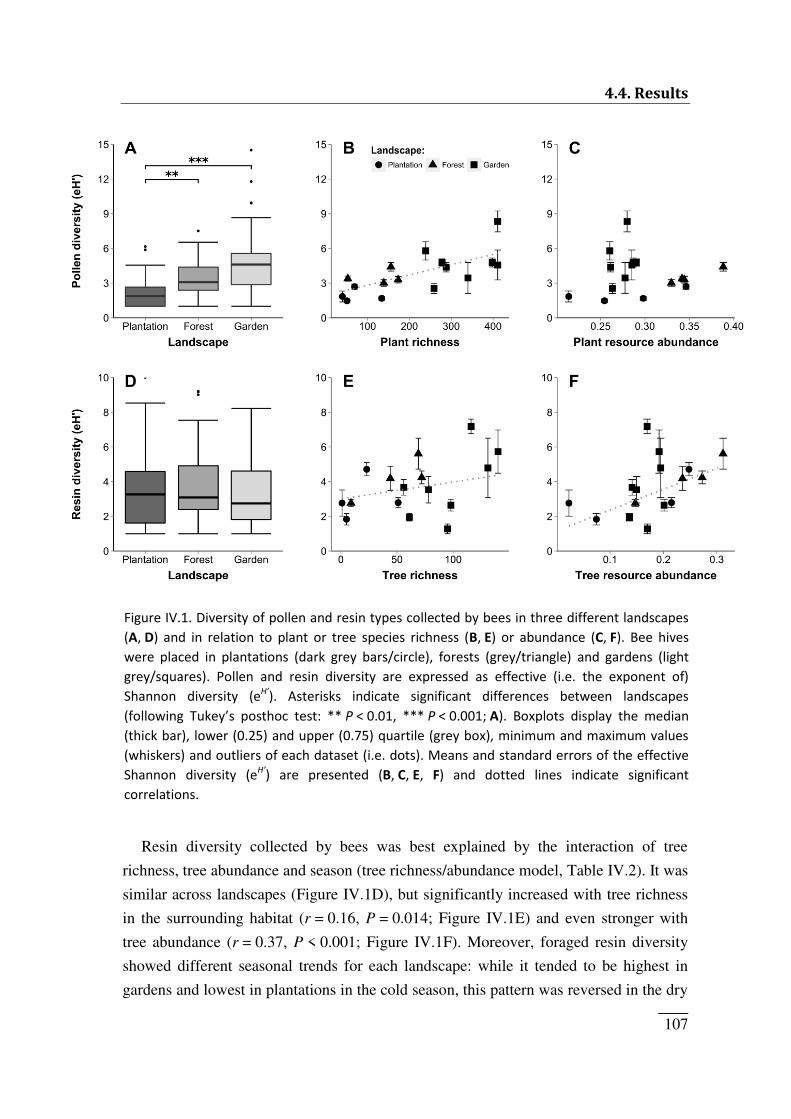
4.4. Results
_____ 107
Resin diversity collected by bees was best explained by the interaction of tree
richness, tree abundance and season (tree richness/abundance model, Table IV.2). It was
similar across landscapes (Figure IV.1D), but significantly increased with tree richness
in the surrounding habitat (r = 0.16, P = 0.014; Figure IV.1E) and even stronger with
tree abundance (r = 0.37, P < 0.001; Figure IV.1F). Moreover, foraged resin diversity
showed different seasonal trends for each landscape: while it tended to be highest in
gardens and lowest in plantations in the cold season, this pattern was reversed in the dry
Figure IV.1. Diversity of pollen and resin types collected by bees in three different landscapes (A, D) and in relation to plant or tree species richness (B, E) or abundance (C, F). Bee hives were placed in plantations (dark grey bars/circle), forests (grey/triangle) and gardens (light grey/squares). Pollen and resin diversity are expressed as effective (i.e. the exponent of) Shannon diversity (eH’). Asterisks indicate significant differences between landscapes (follo i g Tuke ’s postho test: ** P < 0.01, *** P < 0.001; A). Boxplots display the median (thick bar), lower (0.25) and upper (0.75) quartile (grey box), minimum and maximum values (whiskers) and outliers of each dataset (i.e. dots). Means and standard errors of the effective Shannon diversity (eH’) are presented (B, C, E, F) and dotted lines indicate significant correlations.
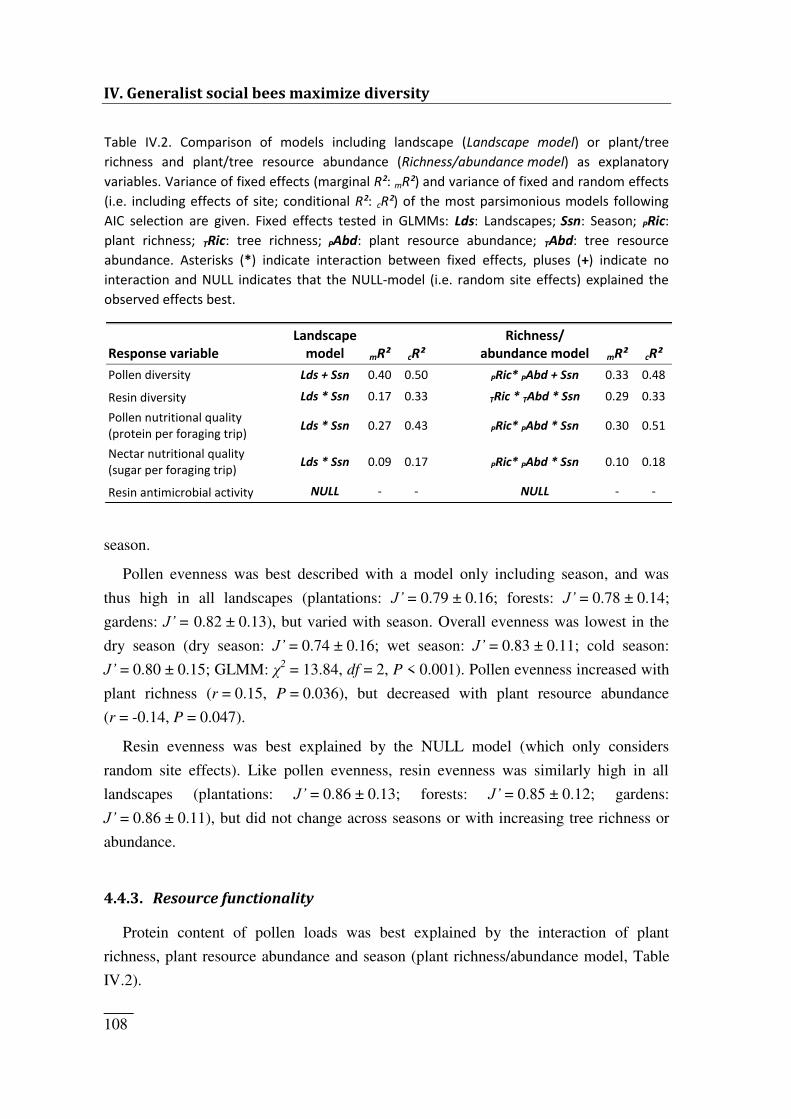
IV. Generalist social bees maximize diversity
_____ 108
season.
Pollen evenness was best described with a model only including season, and was
thus high in all landscapes (plantations: J’ = 0.79 ± 0.16; forests: J’ = 0.78 ± 0.14;
gardens: J’ = 0.82 ± 0.13), but varied with season. Overall evenness was lowest in the
dry season (dry season: J’ = 0.74 ± 0.16; wet season: J’ = 0.83 ± 0.11; cold season:
J’ = 0.80 ± 0.15; GLMM: χ2 = 13.84, df = 2, P < 0.001). Pollen evenness increased with
plant richness (r = 0.15, P = 0.036), but decreased with plant resource abundance
(r = -0.14, P = 0.047).
Resin evenness was best explained by the NULL model (which only considers
random site effects). Like pollen evenness, resin evenness was similarly high in all
landscapes (plantations: J’ = 0.86 ± 0.13; forests: J’ = 0.85 ± 0.12; gardens:
J’ = 0.86 ± 0.11), but did not change across seasons or with increasing tree richness or
abundance.
4.4.3. Resource functionality Protein content of pollen loads was best explained by the interaction of plant
richness, plant resource abundance and season (plant richness/abundance model, Table
IV.2).
Response variable Landscape model mR² cR² Richness/ abundance model mR² cR² Pollen diversity Lds + Ssn 0.40 0.50 PRic* PAbd + Ssn 0.33 0.48 Resin diversity Lds * Ssn 0.17 0.33 TRic * TAbd * Ssn 0.29 0.33 Pollen nutritional quality (protein per foraging trip) Lds * Ssn 0.27 0.43 PRic* PAbd * Ssn 0.30 0.51 Nectar nutritional quality (sugar per foraging trip) Lds * Ssn 0.09 0.17 PRic* PAbd * Ssn 0.10 0.18 Resin antimicrobial activity NULL - - NULL - -
Table IV.2. Comparison of models including landscape (Landscape model) or plant/tree richness and plant/tree resource abundance (Richness/abundance model) as explanatory variables. Variance of fixed effects (marginal R²: mR²) and variance of fixed and random effects (i.e. including effects of site; conditional R²: cR²) of the most parsimonious models following AIC selection are given. Fixed effects tested in GLMMs: Lds: Landscapes; Ssn: Season; PRic: plant richness; TRic: tree richness; PAbd: plant resource abundance; TAbd: tree resource abundance. Asterisks (*) indicate interaction between fixed effects, pluses (+) indicate no interaction and NULL indicates that the NULL-model (i.e. random site effects) explained the observed effects best.
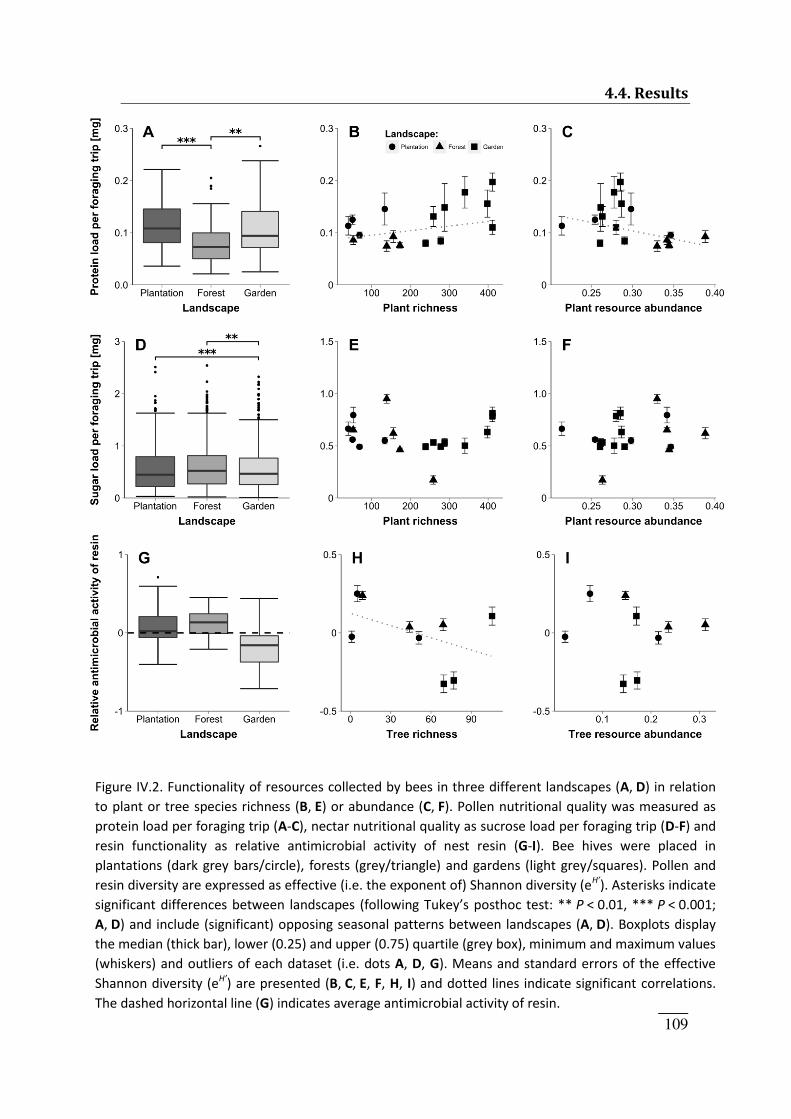
4.4. Results
_____ 109
Figure IV.2. Functionality of resources collected by bees in three different landscapes (A, D) in relation to plant or tree species richness (B, E) or abundance (C, F). Pollen nutritional quality was measured as protein load per foraging trip (A-C), nectar nutritional quality as sucrose load per foraging trip (D-F) and resin functionality as relative antimicrobial activity of nest resin (G-I). Bee hives were placed in plantations (dark grey bars/circle), forests (grey/triangle) and gardens (light grey/squares). Pollen and resin diversity are expressed as effective (i.e. the exponent of) Shannon diversity (eH’). Asterisks indicate sig ifi a t differe es et ee la ds apes (follo i g Tuke ’s postho test: ** P < 0.01, *** P < 0.001; A, D) and include (significant) opposing seasonal patterns between landscapes (A, D). Boxplots display the median (thick bar), lower (0.25) and upper (0.75) quartile (grey box), minimum and maximum values (whiskers) and outliers of each dataset (i.e. dots A, D, G). Means and standard errors of the effective Shannon diversity (eH’) are presented (B, C, E, F, H, I) and dotted lines indicate significant correlations. The dashed horizontal line (G) indicates average antimicrobial activity of resin.
IV. Generalist social bees maximize diversity
_____ 110
Protein content increased with surrounding plant richness (r = 0.20, P = 0.004,
Figure IV.2B), but decreased with higher plant resource abundance (r = -0.28,
P < 0.001, Figure IV.2C).However, protein loads per foraging trip showed no direct
relationship with the diversity of pollen collected (r = -0.05, P = 0.50). Protein loads
were overall significantly lower in forests compared to gardens and plantations (Figure
IV.2A), but varied across seasons (i.e. protein content in forests tended to be low in the
wet and dry season, but high in the cold season).
Likewise, protein loads of essential amino acids per pollen foraging trip were best
described in the plant richness/abundance model and increased with surrounding plant
richness (r = 0.18, P = 0.007), decreased with plant resource abundance (r = -0.27,
P < 0.001) and were lowest in forests (plantations: 55.79 ± 22.84 μg; forests: 40.56 ± 20.24 μg; gardens: 55.83 ± 27.54 μg; GLMM: χ2 = 38.08, df = 6, P < 0.001).
Sucrose content of nectar per foraging trip was best explained by the interaction of
plant richness, plant resource abundance and season (plant richness/abundance model).
However, sucrose content was highly variable, and all composed models explained only
little variance (Table IV.2). As sucrose intake patterns varied across seasons in different
landscapes (i.e. effects of landscape interact with strong seasonal effects), model
differences between landscapes (Figure IV.2D) mainly reflected different seasonal
patterns. Sugar loads did not correlate with plant richness or plant resource abundance
alone (plant richness: r = 0.002, P = 0.92; plant resource abundance: r = 0.002,
P = 0.92; Figure IV.2E, F).
Relative antimicrobial activity of resin was best explained by the NULL model
(which only considered random site effects). It was not correlated with foraged resin
diversity (r = -0.22, P = 0.56) and even decreased with increasing tree richness
(r = -0.35, P < 0.001; Figure IV.2H). Antimicrobial activity did also not significantly
differ between landscapes when combining all microbes (Figure IV.2G). However, for
B. cereus alone, mean growth inhibition was significantly higher in forests than in
gardens (SM IV.5).
4.5. Discussion Generalist consumers living in biodiverse ecosystems may benefit from the
surrounding biodiversity through enhanced abundance and diversity of resources. We
used a social bee species as model for a generalist herbivorous consumer (which
entirely depends on plants for obtaining all resources required for nutrition and nesting)
4.5. Discussion
_____ 111
to experimentally investigate how plant species richness and/or plant resource
abundance associated with different landscapes/habitats influenced resource intake and
corresponding resource functionality. We found that plant species richness and resource
abundance better explained the bees‘ resource intake than landscape categories (except for pollen diversity). We should therefore be more cautious when solely taking into
account the effect of different landscape or habitat categories on bee foraging behaviour
and resource intake.
In agreement with our hypothesis, we found that the diversity of resources collected
by bees continuously increased with increasing plant/tree species richness, suggesting
that bees maximize resource diversity intake where possible. However, increased
resource diversity did not result in increased resource functionality, as nutritional
quality and antimicrobial activity were only slightly, if at all, affected by plant/tree
species richness or resource abundance.
4.5.1. Plant richness and resource abundance in landscapes Plant richness was closely linked to landscape and varied strongly with habitat type,
thereby providing an adequate plant species richness gradient for assessing diversity
effects. However, contrary to our expectations, our garden sites had an on average 2-3
times higher richness of plant species than natural forest or plantation sites, which has
so far not been shown for a (sub)tropical region. Urban gardens typically comprise a
diverse mix of native and exotic plants, which create a diverse and continuous supply of
floral resources (Australia: Head et al. 2004; Europe: Loram et al. 2008). Generalist bee
foragers are known to utilize both native and exotic flowering plants (Tepedino et al.
2008; Stout and Morales 2009; Williams et al. 2011; Threlfall et al. 2015) and in some
cases even prefer horticultural plant hybrids over wild-types in gardens (Garbuzov and
Ratnieks 2014), which renders urban areas with parks and gardens a very suitable
foraging habitat for generalist bees. Our garden sites were further often close to patches
of remnant vegetation, providing a mixture of habitats with a variety of native plants
and trees. This combination of patches with diverse native and exotic plant species most
likely explains why we found the greatest plant species richness and high resource
abundance around urban sites in subtropical Australia.
Also in contrast to our expectations, plant richness around our forest sites varied
between high richness to unexpectedly low richness. Low plant richness was found
primarily in mature forested landscapes (heathland dominated by Banksia spp.), with
dominant tree species well adapted to local climate and fire cycles (Bird et al. 2008). On
IV. Generalist social bees maximize diversity
_____ 112
the other hand, forests with high plant richness were comprised of species-rich
ecotones, like forest edges or transitions from rainforest to wet sclerophyll vegetation.
Such moderately disturbed forests are known to have higher plant species richness and
to support higher bee diversity than mature forests (Liow et al. 2001; Winfree et al.
2007).
As expected, we found plant richness to be lowest in macadamia plantations.
However, some plantation sites had unexpectedly high plant diversity. Yet many of
these plants were ground covering exotic weeds (51-65 %), which were persistently
managed with mowing and herbicides and did not actually provide any floral resources
for bees.
4.5.2. Resource diversity and evenness As predicted, the diversity of pollen types collected by bees increased with
increasing plant richness, but not plant abundance, and was thus highest in gardens,
intermediate in forest and lowest in plantations. Average pollen diversity per hive at our
forest sites was very similar to nest pollen diversity as reported for other bees in tropical
forests (Ramirez Arriaga and Martinez Hernandez 1998; Vossler et al. 2010), yet pollen
diversity collected in gardens exceeded the reported maximum diversity by 1.2 to 1.3
(plantations: H’ = 0.77 ± 0.12, forests: H’ = 1.04 ± 0.24 and gardens: H’ = 1.30 ± 0.31).
Generalist social bees, such as honeybees and stingless bees are known to forage
pollen from a diverse spectrum of plant species (Ramirez Arriaga and Martinez
Hernandez 1998; Odoux et al. 2012; Smith et al. 2012). Our study further showed that
pollen diversity collected by T. carbonaria continuously increased with increasing plant
species richness. Besides pollen, bees also maximized resin diversity intake in tree
species rich environments, indicating that T. carbonaria generally follows a resource
‗diversity maximization‘ strategy. A similar ‗diversity maximization‘ strategy was found in saki monkeys (Palminteri et al. 2016), but has, to our knowledge, not been
described in other animal species. However, many animal species, and in particular
herbivores, are known to perform better on diets composed of diverse resources rather
than only one resource type, as dietary mixing either improves nutritional balance or
dilutes toxins (Glander 1982; Hägele and Rowell-Rahier 1999; Unsicker et al. 2008;
Groendahl and Fink 2016; Palminteri et al. 2016).
As generalist (social) bees typically combine pollen from a variety of plant species at
the colony level, pollen diversity likewise ensures composing a nutritionally balanced
diet and the dilution of toxic plant compounds (Eckhardt et al. 2014; Irwin et al. 2014).
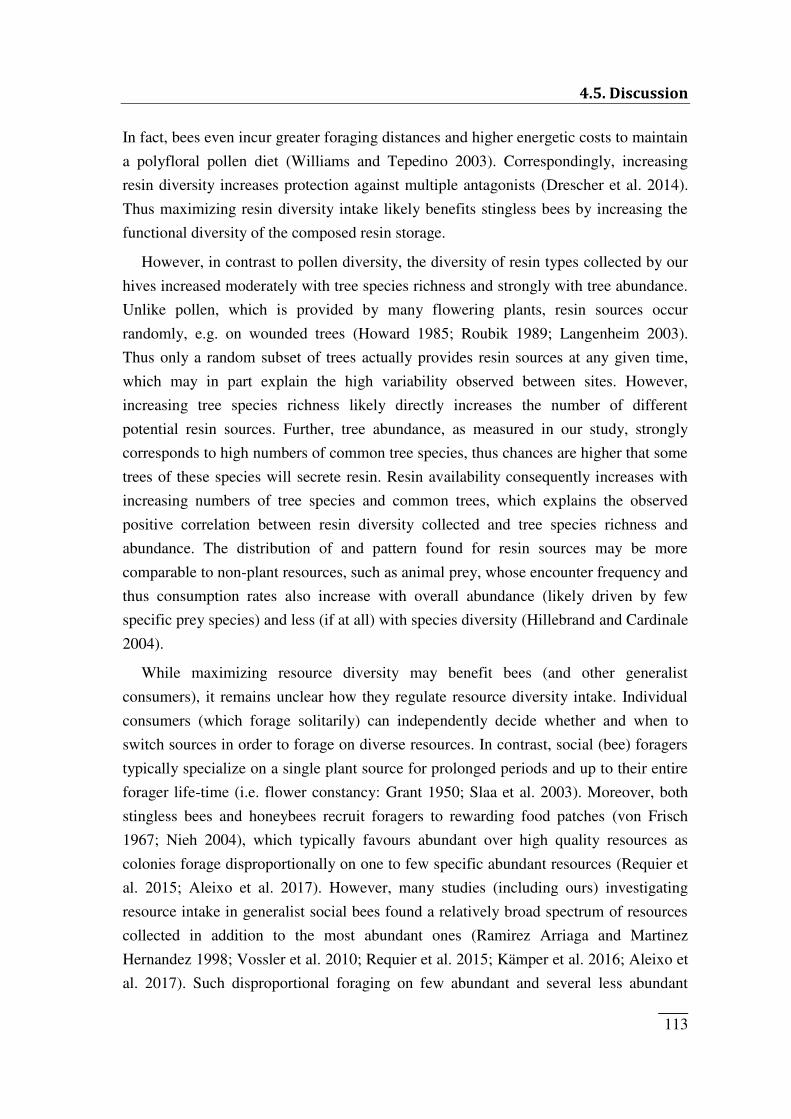
4.5. Discussion
_____ 113
In fact, bees even incur greater foraging distances and higher energetic costs to maintain
a polyfloral pollen diet (Williams and Tepedino 2003). Correspondingly, increasing
resin diversity increases protection against multiple antagonists (Drescher et al. 2014).
Thus maximizing resin diversity intake likely benefits stingless bees by increasing the
functional diversity of the composed resin storage.
However, in contrast to pollen diversity, the diversity of resin types collected by our
hives increased moderately with tree species richness and strongly with tree abundance.
Unlike pollen, which is provided by many flowering plants, resin sources occur
randomly, e.g. on wounded trees (Howard 1985; Roubik 1989; Langenheim 2003).
Thus only a random subset of trees actually provides resin sources at any given time,
which may in part explain the high variability observed between sites. However,
increasing tree species richness likely directly increases the number of different
potential resin sources. Further, tree abundance, as measured in our study, strongly
corresponds to high numbers of common tree species, thus chances are higher that some
trees of these species will secrete resin. Resin availability consequently increases with
increasing numbers of tree species and common trees, which explains the observed
positive correlation between resin diversity collected and tree species richness and
abundance. The distribution of and pattern found for resin sources may be more
comparable to non-plant resources, such as animal prey, whose encounter frequency and
thus consumption rates also increase with overall abundance (likely driven by few
specific prey species) and less (if at all) with species diversity (Hillebrand and Cardinale
2004).
While maximizing resource diversity may benefit bees (and other generalist
consumers), it remains unclear how they regulate resource diversity intake. Individual
consumers (which forage solitarily) can independently decide whether and when to
switch sources in order to forage on diverse resources. In contrast, social (bee) foragers
typically specialize on a single plant source for prolonged periods and up to their entire
forager life-time (i.e. flower constancy: Grant 1950; Slaa et al. 2003). Moreover, both
stingless bees and honeybees recruit foragers to rewarding food patches (von Frisch
1967; Nieh 2004), which typically favours abundant over high quality resources as
colonies forage disproportionally on one to few specific abundant resources (Requier et
al. 2015; Aleixo et al. 2017). However, many studies (including ours) investigating
resource intake in generalist social bees found a relatively broad spectrum of resources
collected in addition to the most abundant ones (Ramirez Arriaga and Martinez
Hernandez 1998; Vossler et al. 2010; Requier et al. 2015; Kämper et al. 2016; Aleixo et
al. 2017). Such disproportional foraging on few abundant and several less abundant
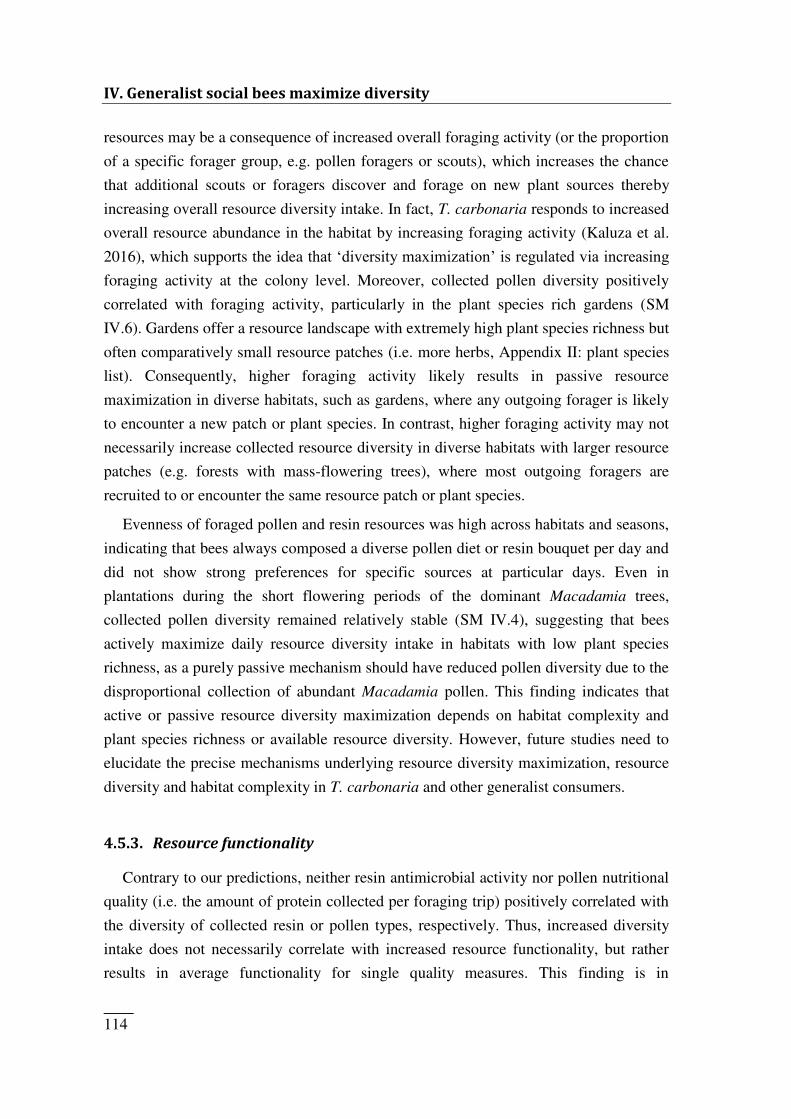
IV. Generalist social bees maximize diversity
_____ 114
resources may be a consequence of increased overall foraging activity (or the proportion
of a specific forager group, e.g. pollen foragers or scouts), which increases the chance
that additional scouts or foragers discover and forage on new plant sources thereby
increasing overall resource diversity intake. In fact, T. carbonaria responds to increased
overall resource abundance in the habitat by increasing foraging activity (Kaluza et al.
2016), which supports the idea that ‗diversity maximization‘ is regulated via increasing foraging activity at the colony level. Moreover, collected pollen diversity positively
correlated with foraging activity, particularly in the plant species rich gardens (SM
IV.6). Gardens offer a resource landscape with extremely high plant species richness but
often comparatively small resource patches (i.e. more herbs, Appendix II: plant species
list). Consequently, higher foraging activity likely results in passive resource
maximization in diverse habitats, such as gardens, where any outgoing forager is likely
to encounter a new patch or plant species. In contrast, higher foraging activity may not
necessarily increase collected resource diversity in diverse habitats with larger resource
patches (e.g. forests with mass-flowering trees), where most outgoing foragers are
recruited to or encounter the same resource patch or plant species.
Evenness of foraged pollen and resin resources was high across habitats and seasons,
indicating that bees always composed a diverse pollen diet or resin bouquet per day and
did not show strong preferences for specific sources at particular days. Even in
plantations during the short flowering periods of the dominant Macadamia trees,
collected pollen diversity remained relatively stable (SM IV.4), suggesting that bees
actively maximize daily resource diversity intake in habitats with low plant species
richness, as a purely passive mechanism should have reduced pollen diversity due to the
disproportional collection of abundant Macadamia pollen. This finding indicates that
active or passive resource diversity maximization depends on habitat complexity and
plant species richness or available resource diversity. However, future studies need to
elucidate the precise mechanisms underlying resource diversity maximization, resource
diversity and habitat complexity in T. carbonaria and other generalist consumers.
4.5.3. Resource functionality Contrary to our predictions, neither resin antimicrobial activity nor pollen nutritional
quality (i.e. the amount of protein collected per foraging trip) positively correlated with
the diversity of collected resin or pollen types, respectively. Thus, increased diversity
intake does not necessarily correlate with increased resource functionality, but rather
results in average functionality for single quality measures. This finding is in
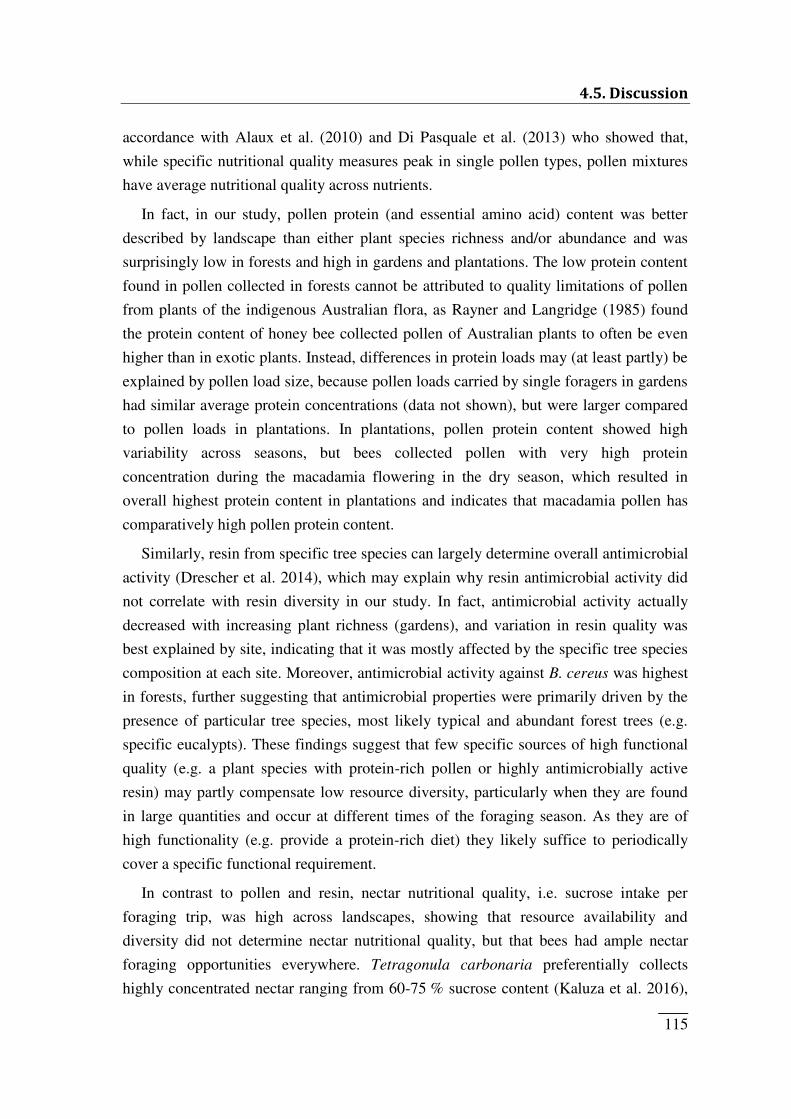
4.5. Discussion
_____ 115
accordance with Alaux et al. (2010) and Di Pasquale et al. (2013) who showed that,
while specific nutritional quality measures peak in single pollen types, pollen mixtures
have average nutritional quality across nutrients.
In fact, in our study, pollen protein (and essential amino acid) content was better
described by landscape than either plant species richness and/or abundance and was
surprisingly low in forests and high in gardens and plantations. The low protein content
found in pollen collected in forests cannot be attributed to quality limitations of pollen
from plants of the indigenous Australian flora, as Rayner and Langridge (1985) found
the protein content of honey bee collected pollen of Australian plants to often be even
higher than in exotic plants. Instead, differences in protein loads may (at least partly) be
explained by pollen load size, because pollen loads carried by single foragers in gardens
had similar average protein concentrations (data not shown), but were larger compared
to pollen loads in plantations. In plantations, pollen protein content showed high
variability across seasons, but bees collected pollen with very high protein
concentration during the macadamia flowering in the dry season, which resulted in
overall highest protein content in plantations and indicates that macadamia pollen has
comparatively high pollen protein content.
Similarly, resin from specific tree species can largely determine overall antimicrobial
activity (Drescher et al. 2014), which may explain why resin antimicrobial activity did
not correlate with resin diversity in our study. In fact, antimicrobial activity actually
decreased with increasing plant richness (gardens), and variation in resin quality was
best explained by site, indicating that it was mostly affected by the specific tree species
composition at each site. Moreover, antimicrobial activity against B. cereus was highest
in forests, further suggesting that antimicrobial properties were primarily driven by the
presence of particular tree species, most likely typical and abundant forest trees (e.g.
specific eucalypts). These findings suggest that few specific sources of high functional
quality (e.g. a plant species with protein-rich pollen or highly antimicrobially active
resin) may partly compensate low resource diversity, particularly when they are found
in large quantities and occur at different times of the foraging season. As they are of
high functionality (e.g. provide a protein-rich diet) they likely suffice to periodically
cover a specific functional requirement.
In contrast to pollen and resin, nectar nutritional quality, i.e. sucrose intake per
foraging trip, was high across landscapes, showing that resource availability and
diversity did not determine nectar nutritional quality, but that bees had ample nectar
foraging opportunities everywhere. Tetragonula carbonaria preferentially collects
highly concentrated nectar ranging from 60-75 % sucrose content (Kaluza et al. 2016),
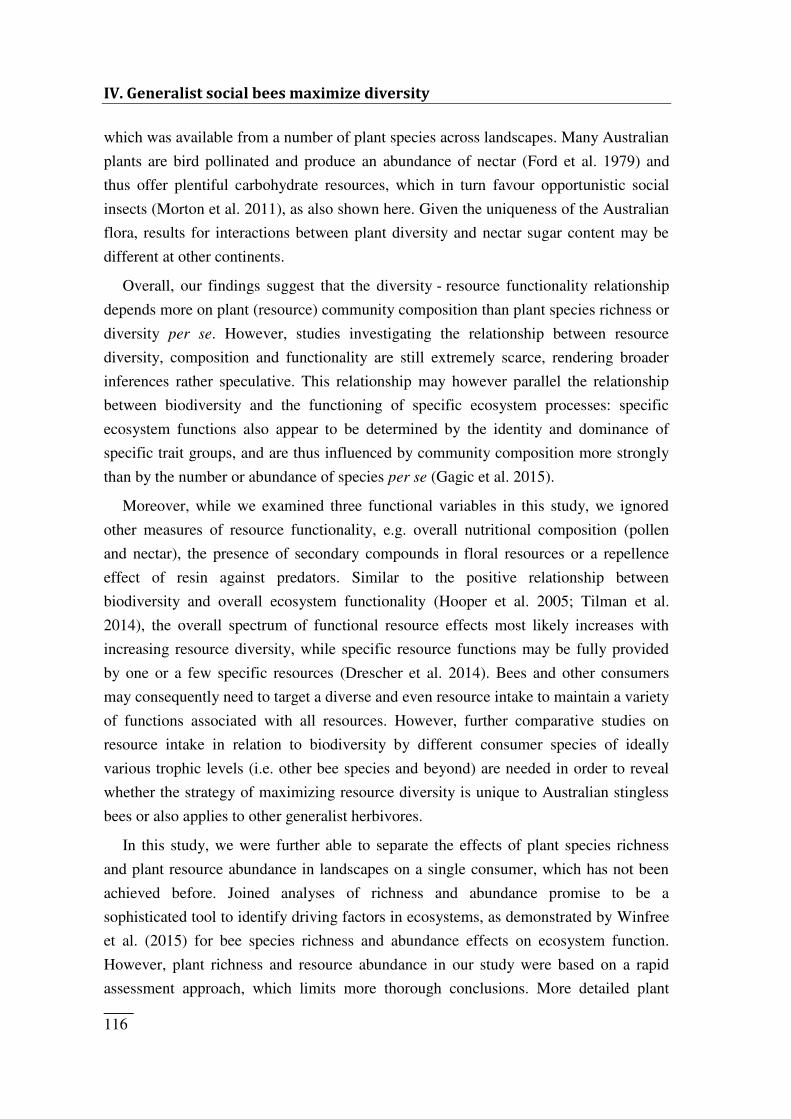
IV. Generalist social bees maximize diversity
_____ 116
which was available from a number of plant species across landscapes. Many Australian
plants are bird pollinated and produce an abundance of nectar (Ford et al. 1979) and
thus offer plentiful carbohydrate resources, which in turn favour opportunistic social
insects (Morton et al. 2011), as also shown here. Given the uniqueness of the Australian
flora, results for interactions between plant diversity and nectar sugar content may be
different at other continents.
Overall, our findings suggest that the diversity - resource functionality relationship
depends more on plant (resource) community composition than plant species richness or
diversity per se. However, studies investigating the relationship between resource
diversity, composition and functionality are still extremely scarce, rendering broader
inferences rather speculative. This relationship may however parallel the relationship
between biodiversity and the functioning of specific ecosystem processes: specific
ecosystem functions also appear to be determined by the identity and dominance of
specific trait groups, and are thus influenced by community composition more strongly
than by the number or abundance of species per se (Gagic et al. 2015).
Moreover, while we examined three functional variables in this study, we ignored
other measures of resource functionality, e.g. overall nutritional composition (pollen
and nectar), the presence of secondary compounds in floral resources or a repellence
effect of resin against predators. Similar to the positive relationship between
biodiversity and overall ecosystem functionality (Hooper et al. 2005; Tilman et al.
2014), the overall spectrum of functional resource effects most likely increases with
increasing resource diversity, while specific resource functions may be fully provided
by one or a few specific resources (Drescher et al. 2014). Bees and other consumers
may consequently need to target a diverse and even resource intake to maintain a variety
of functions associated with all resources. However, further comparative studies on
resource intake in relation to biodiversity by different consumer species of ideally
various trophic levels (i.e. other bee species and beyond) are needed in order to reveal
whether the strategy of maximizing resource diversity is unique to Australian stingless
bees or also applies to other generalist herbivores.
In this study, we were further able to separate the effects of plant species richness
and plant resource abundance in landscapes on a single consumer, which has not been
achieved before. Joined analyses of richness and abundance promise to be a
sophisticated tool to identify driving factors in ecosystems, as demonstrated by Winfree
et al. (2015) for bee species richness and abundance effects on ecosystem function.
However, plant richness and resource abundance in our study were based on a rapid
assessment approach, which limits more thorough conclusions. More detailed plant
4.5. Discussion
_____ 117
data, e.g. on plant coverage (Hines and Hendrix 2005) or seasonal availability (Williams
et al. 2012) would clearly improve deductions. A more comprehensive assessment of
functions and resource effects would further be needed to entirely capture the quality
and functionality of resources in relation to resource diversity.
4.5.4. Conclusion Using bees as a model consumer, we found that this floral generalist attempts, where
possible, to maximize the number of sources to collect from (resource ‗diversity maximization‘ strategy). This resource use strategy has also been observed in primates
(Palminteri et al. 2016) and agrees with the positive effects of resource mixing observed
in herbivores (see above). It suggests that, at least for generalist consumers foraging on
plants, resources need to fulfil a multitude of functions which may best be met by a
multitude of resources (e.g. nutritional balance, toxin dilution), while specific functions
(e.g. high pollen protein content, strong antimicrobial activity of resin) may be provided
by one or a few resources. Depending on the surrounding plant (or prey) community,
the functionality of resources may (e.g. pollen protein content, resin antimicrobial
activity) or may not (e.g. nectar sugar content) be driven by the occurrence of specific
plant sources. Single resources can thus cover specific functional needs even in
impoverished landscapes (e.g. agricultural macadamia plantations). However, higher
resource diversity safeguards a variety of functions by bolstering multiple aspects of
resource functionality and providing insurance in spatiotemporally dynamic resource
landscapes (Williams et al. 2012), which may ultimately determine a consumer‘s fitness and thus vulnerability.
While time and handling constraints may limit the number of different resources
collected by solitary organisms or consumers of higher trophic levels (e.g. predators),
resource diversity maximization may be facilitated by the social structure of insect
colonies. Here, each forager can be highly specialized on and thus efficiently exploit
one or a few resources, while the colony as a whole can increase overall resource
diversity intake simply through increasing foraging activity. This unique way of
partitioning resource collection renders social insects a very interesting study organism
for further investigating the relationship between resource intake strategies and resource
functionality in relation to available resource diversity.
IV. Generalist social bees maximize diversity
_____ 118
4.6. Acknowledgements The authors thank Rhys Smith, Julia Nagler, Manuel Pützstück, Birte Hensen, Mia
Kaluza and Marvin Schäfer for assistance with field work. Sahara Farms, Macadamia
Farm Management Pty Ltd and Maroochy Bushland Botanic Gardens, as well as
numerous private land and garden owners hosted our bee hives, for which we are very
grateful. We thank Andrea Hilpert for analysing the amino acid content of pollen. We
further much appreciate the comments of two anonymous reviewers which greatly
helped to improve the manuscript.
BFK received funding from the German Academic Exchange Agency (DAAD).
Funding was provided by the Deutsche Forschungs-Gemeinschaft (DFG project: LE
2750/1-1).
4.7. References Alaux, C., F. Ducloz, D. Crauser and Y. Le Conte (2010). "Diet effects on honeybee
immunocompetence". Biology Letters: doi: 10.1098/rsbl.2009.0986.
Aleixo, K.P., C. Menezes, V.L. Imperatriz Fonseca and C.I. da Silva (2017). "Seasonal
availability of floral resources and ambient temperature shape stingless bee foraging
behavior (Scaptotrigona aff. depilis)". Apidologie, 48(1): 117-127.
Balvanera, P., A.B. Pfisterer, N. Buchmann, J.-S. He, T. Nakashizuka, D. Raffaelli and B.
Schmid (2006). "Quantifying the evidence for biodiversity effects on ecosystem
functioning and services". Ecology Letters, 9(10): 1146-1156.
Bartoń, K. (2013). "MuMIn: Multi-model inference". R package version 1.9.13. Available at:
http://CRAN.R-project.org/package=MuMIn.
Bates, D., M. Mächler and B. Bolker (2011). "lme4: Linear mixed-effects models using S4
classes". R package version 0.999375-42. Available at: http://CRAN.R-
project.org/package=lme4.
Bernays, E.A., K.L. Bright, N. Gonzalez and J. Angel (1994). "Dietary mixing in a generalist
herbivore: tests of two hypotheses". Ecology, 75(7): 1997-2006.
Biesmeijer, J.C., M. Smeets, J.A.P. Richter and M.J. Sommeijer (1999). "Nectar foraging by
stingless bees in Costa Rica: botanical and climatological influences on sugar
concentration of nectar collected by Melipona". Apidologie, 30(1): 43-55.
4.7. References
_____ 119
Bird, R.B., D.W. Bird, B.F. Codding, C.H. Parker and J.H. Jones (2008). "The "fire stick
farming" hypothesis: Australian Aboriginal foraging strategies, biodiversity, and
anthropogenic fire mosaics". Proceedings of the National Academy of Sciences of the
United States of America, 105(39): 14796-14801.
Blüthgen, N. and A.M. Klein (2011). "Functional complementarity and specialisation: Why
biodiversity is important in plant-pollinator interactions.". Basic and Applied Ecology,
12: 282-291.
Brittain, C., C. Kremen and A.M. Klein (2013). "Biodiversity buffers pollination from changes
in environmental conditions". Global Change Biology, 19(2): 540-547.
Cook, S.M., C.S. Awmack, D.A. Murray and I.H. Williams (2003). "Are honey bees' foraging
preferences affected by pollen amino acid composition?". Ecological Entomology,
28(5): 622-627.
de Groot, A.P. (1953). "Protein and amino acid requirements of the honey bee (Apis mellifera
L.)". Physiologia Comparata et Oecologia, 3(2/3): 197-285.
Decourtye, A., E. Mader and N. Desneux (2010). "Landscape enhancement of floral resources
for honey bees in agro-ecosystems". Apidologie, 41(3): 264-277.
Di Pasquale, G., M. Salignon, Y. Le Conte, L.P. Belzunces, A. Decourtye, A. Kretzschmar, (...)
C. Alaux (2013). "Influence of pollen nutrition on honey bee health: do pollen quality
and diversity matter?". Plos One, 8(8): e72016.
Dollin, A.E., L.J. Dollin and S.F. Sakagami (1997). "Australian stingless bees of the genus
Trigona (Hymenoptera : Apidae)". Invertebrate Taxonomy, 11(6): 861-896.
Drescher, N., H.M. Wallace, M. Katouli, C.F. Massaro and S.D. Leonhardt (2014). "Diversity
matters: how bees benefit from different resin sources". Oecologia, 176(4): 943-953.
Duffy, J.E., B.J. Carinale, K.E. France, P.B. McIntyre, E. Thebault and M. Loreau (2007). "The
functional role of biodiversity in ecosystems: incorporating trophic complexity".
Ecology Letters, 10(6): 522-538.
Eckhardt, M., M. Haider, S. Dorn and A. Muller (2014). "Pollen mixing in pollen generalist
solitary bees: a possible strategy to complement or mitigate unfavourable pollen
properties?". Journal of Animal Ecology, 83(3): 588-597.
Ford, H.A., D.C. Paton and N. Forde (1979). "Birds as pollinators of Australian plants". New
Zealand Journal of Botany, 17(4): 509-519.
Freeland, W.J. and D.H. Janzen (1974). "Strategies in herbivory by mammals: the role of plant
secondary compounds". American Naturalist, 108(961): 269-289.
Gagic, V., I. Bartomeus, T. Jonsson, A. Taylor, C. Winqvist, C. Fischer, (...) R. Bommarco
(2015). "Functional identity and diversity of animals predict ecosystem functioning
better than species-based indices". Proceedings of the Royal Society B: Biological
Sciences, 282(1801).
IV. Generalist social bees maximize diversity
_____ 120
Gamfeldt, L., H. Hillebrand and P.R. Jonsson (2005). "Species richness changes across two
trophic levels simultaneously affect prey and consumer biomass". Ecology Letters, 8(7):
696-703.
Garbuzov, M. and F.L.W. Ratnieks (2014). "Quantifying variation among garden plants in
attractiveness to bees and other flower-visiting insects". Functional Ecology, 28(2):
364-374.
Garibaldi, L.A., I. Steffan-Dewenter, R. Winfree, M.A. Aizen, R. Bommarco, S.A.
Cunningham, (...) A.M. Klein (2013). "Wild pollinators enhance fruit set of crops
regardless of honey bee abundance". Science, 339(6127): 1608-1611.
Génissel, A., P. Aupinel, C. Bressac, J.N. Tasei and C. Chevrier (2002). "Influence of pollen
origin on performance of Bombus terrestris micro-colonies". Entomologia
Experimentalis et Applicata, 104: 329-336.
Glander, K.E. (1982). "The impact of plant secondary compounds on primate feeding behavior".
American Journal of Physical Anthropology, 25(S3): 1-18.
Grant, V. (1950). "The flower constancy of bees". The Botanical Review, 16(7): 379-398.
Groendahl, S. and P. Fink (2016). "The effect of diet mixing on a nonselective herbivore". Plos
One, 11(7): e0158924.
Hägele, F.B. and M. Rowell-Rahier (1999). "Dietary mixing in three generalist herbivores:
nutrient complementation or toxin dilution?". Oecologia, 119(4): 521-533.
Head, L., P. Muir and E. Hampel (2004). "Australian backyard gardens and the journey of
migration". Geographical Review, 94(3): 326-347.
Heard, T.A. (2016). "The Australian native bee book. Keeping stingless bee hives for pets,
pollination and sugarbag hone". Sugarbag Bees, Brisbane.
Hillebrand, H. and B.J. Cardinale (2004). "Consumer effects decline with prey diversity".
Ecology Letters, 7(3): 192-201.
Hines, H.M. and S.D. Hendrix (2005). "Bumble bee (Hymenoptera: Apidae) diversity and
abundance in tallgrass prairie patches: effects of local and landscape floral resources".
Environmental Entomology, 34: 1477-1484.
Höcherl, N., R. Siede, I. Illies, H. Gätschenberger and J. Tautz (2012). "Evaluation of the
nutritive value of maize for honey bees". Journal of Insect Physiology, 58(2): 278-285.
Hooper, D.U., F.S. Chapin, J.J. Ewel, A. Hector, P. Inchausti, S. Lavorel, (...) D.A. Wardle
(2005). "Effects of biodiversity on ecosystem functioning: A consensus of current
knowledge". Ecological Monographs, 75: 3-35.
Hothorn, T., F. Bretz and P. Westfall (2008). "Simultaneous inference in general parametric
models". Biometrical Journal, 50(3): 346-363.
4.7. References
_____ 121
Howard, J.J. (1985). "Observations on resin collecting by six interacting species of stingless
bees (Apidae, Meliponinae)". Journal of the Kansas Entomological Society, 58(2): 337-
345.
Irwin, R.E., D. Cook, L.L. Richardson, J.S. Manson and D.R. Gardner (2014). "Secondary
compounds in floral rewards of toxic rangeland plants: impacts on pollinators". Journal
of Agricultural and Food Chemistry, 62(30): 7335-7344.
Ives, A.R., B.J. Cardinale and W.E. Snyder (2005). "A synthesis of subdisciplines: predator–prey interactions, and biodiversity and ecosystem functioning". Ecology Letters, 8(1):
102-116.
Jha, S. and C. Kremen (2013). "Resource diversity and landscape-level homogeneity drive
native bee foraging". Proceedings of the National Academy of Sciences of the United
States of America, 110(2): 555-558.
Jha, S., L. Stefanovich and C. Kremen (2013). "Bumble bee pollen use and preference across
spatial scales in human-altered landscapes". Ecological Entomology, 38(6): 570-579.
Jost, L. (2006). "Entropy and diversity". Oikos, 113(2): 363-375.
Kaluza, B.F., H. Wallace, T.A. Heard, A.-M. Klein and S.D. Leonhardt (2016). "Urban gardens
promote bee foraging over natural habitats and plantations". Ecology and Evolution,
6(5): 1304-1316.
Kämper, W., P.K. Werner, A. Hilpert, C. Westphal, N. Blüthgen, T. Eltz and S.D. Leonhardt
(2016). "How landscape, pollen intake and pollen quality affect colony growth in
Bombus terrestris". Landscape Ecology, 31(10): 2245-2258.
Kearns, C.A. and D.W. Inouye (1993). "Techniques for pollination biologists". University Press
of Colorado, Niwor, Colorado, USA.
Keller, A., N. Danner, G. Grimmer, M. Ankenbrand, K. von der Ohe, W. von der Ohe, (...) I.
Steffan-Dewenter (2015). "Evaluating multiplexed next-generation sequencing as a
method in palynology for mixed pollen samples". Plant Biology, 17(2): 558-566.
Kim, Y.S. and B.H. Smith (2000). "Effect of an amino acid on feeding preferences and learning
behavior in the honey bee, Apis mellifera". Journal of Insect Physiology, 46: 793-801.
Langenheim, J.H. (2003). "Plant resins: chemistry, evolution, ecology and ethnobotany".
Timber Press, Portland, Oregon.
Leonhardt, S.D. and N. Blüthgen (2009). "A sticky affair: resin collection by Bornean stingless
bees". Biotropica, 41(6): 730-736.
Leonhardt, S.D. and N. Blüthgen (2012). "The same, but different: pollen foraging in honeybee
and bumblebee colonies". Apidologie, 43: 449-464.
Leonhardt, S.D., T.A. Heard and H. Wallace (2014). "Differences in the resource intake of two
sympatric Australian stingless bee species". Apidologie, 45(4): 514-527.
IV. Generalist social bees maximize diversity
_____ 122
Leonhardt, S.D., T. Schmitt and N. Blüthgen (2011). "Tree resin composition, collection
behavior and selective filters shape chemical profiles of tropical bees (Apidae:
Meliponini)". Plos One, 6(8): e23445.
Liow, L.H., N.S. Sodhi and T. Elmqvist (2001). "Bee diversity along a disturbance gradient in
tropical lowland forests of south-east Asia". Journal of Applied Ecology, 38(1): 180-
192.
Loram, A., K. Thompson, P.H. Warren and K.J. Gaston (2008). "Urban domestic gardens (XII):
The richness and composition of the flora in five UK cities". Journal of Vegetation
Science, 19(3): 321-367.
Loreau, M., S. Naeem, P. Inchausti, J. Bengtsson, J.P. Grime, A. Hector, (...) D.A. Wardle
(2001). "Biodiversity and ecosystem functioning: current knowledge and future
challenges". Science, 294(5543): 804-808.
Massaro, C.F., M. Katouli, T. Grkovic, H. Vu, R.J. Quinn, T.A. Heard, (...) P. Brooks (2014).
"Anti-staphylococcal activity of C-methyl flavanones from propolis of Australian
stingless bees (Tetragonula carbonaria) and fruit resins of Corymbia torelliana
(Myrtaceae)". Fitoterapia, 95: 247-257.
McIntyre, N.E. and M.E. Hostetler (2001). "Effects of urban land use on pollinator
(Hymenoptera: Apoidea) communities in a desert metropolis". Basic and Applied
Ecology, 2(3): 209-218.
McKinney, M.L. (2008). "Effects of urbanization on species richness: A review of plants and
animals". Urban Ecosystems, 11(2): 161-176.
Micheu, S., K. Crailsheim and B. Leonhard (2000). "Importance of proline and other amino
acids during honeybee flight". Amino Acids, 18(2): 157-175.
Morton, S.R., D.M. Stafford Smith, C.R. Dickman, D.L. Dunkerley, M.H. Friedel, R.R.J.
McAllister, (...) M. Westoby (2011). "A fresh framework for the ecology of arid
Australia". Journal of Arid Environments, 75(4): 313-329.
Nakagawa, S. and H. Schielzeth (2013). "A general and simple method for obtaining R2 from
generalized linear mixed-effects models". Methods in Ecology and Evolution, 4(2): 133-
142.
Nicolson, S.W. (2011). "Bee food: the chemistry and nutritional value of nectar, pollen and
mixtures of the two". African Zoology, 46(2): 197-204.
Nicolson, S.W. and B.-E. Van Wyk (1998). "Nectar sugars in Proteaceae: patterns and
processes". Australian Journal of Botany, 46(4): 489-504.
Nieh, J.C. (2004). "Recruitment communication in stingless bees (Hymenoptera, Apidae,
Meliponini)". Apidologie, 35(2): 159-182.
Odoux, J.F., D. Feuillet, P. Aupinel, Y. Loublier, J.N. Tasei and C. Mateescu (2012).
"Territorial biodiversity and consequences on physico-chemical characteristics of pollen
collected by honey bee colonies". Apidologie, 43(5): 561-575.
4.7. References
_____ 123
Otway, S.J., A. Hector and J.H. Lawton (2005). "Resource dilution effects on specialist insect
herbivores in a grassland biodiversity experiment". Journal of Animal Ecology, 74(2):
234-240.
Palminteri, S., G.V.N. Powell and C.A. Peres (2016). "Determinants of spatial behavior of a
tropical forest seed predator: The roles of optimal foraging, dietary diversification, and
home range defense". American Journal of Primatology, 78(5): 523-533.
Pyke, G.H., H.R. Pulliam and E.L. Charnov (1977). "Optimal foraging: a selective review of
theory and tests". The Quarterly Review of Biology, 52(2): 137-154.
Quezada-Euan, J.J.G., A. Lopez-Velasco, J. Perez-Balam, H. Moo-Valle, A. Velazquez-
Madrazo and R.J. Paxton (2011). "Body size differs in workers produced across time
and is associated with variation in the quantity and composition of larval food in
Nannotrigona perilampoides (Hymenoptera, Meliponini)". Insectes Sociaux, 58(1): 31-
38.
R Development Core Team (2013). "R: A language and environment for statistical computing".
Version: 2.15.0. R Foundation for Statistical Computing, Vienna. Available at:
http://www.R-project.org.
Ramirez Arriaga, E. and E. Martinez Hernandez (1998). "Resources foraged by Euglossa
atroveneta (Apidae: Euglossinae) at Union Juarez, Chiapas, Mexico: A palynological
studying of larval feeding". Apidologie, 29(4): 347-359.
Rasheed, S.A. and L.D. Harder (1997). "Economic motivation for plant species preferences of
pollen-collecting bumble bees". Ecological Entomology, 22(2): 209-219.
Rayner, C. and D. Langridge (1985). "Amino acids in bee-collected pollens from Australian
indigenous and exotic plants". Animal Production Science, 25(3): 722-726.
Requier, F., J.-F. Odoux, T. Tamic, N. Moreau, M. Henry, A. Decourtye and V. Bretagnolle
(2015). "Honey bee diet in intensive farmland habitats reveals an unexpectedly high
flower richness and a major role of weeds". Ecological Applications, 25(4): 881-890.
Robertson, A.W., C. Mountjoy, B.E. Faulkner, M.V. Roberts and M.R. Macnair (1999).
"Bumble bee selection of Mimulus guttatus flowers: The effects of pollen quality and
reward depletion". Ecology, 80(8): 2594-2606.
Roubik, D., W., D. Yanega, M. Aluja, S. Buchmann, L. and D. Inouye, W. (1995). "On optimal
nectar foraging by some tropical bees (Hymenoptera: Apidae)". Apidologie, 26(3): 197-
211.
Roubik, D.W. (1989). "Ecology and natural history of tropical bees". Cambridge University
Press, New York.
Roulston, T.H. and J.H. Cane (2002). "The effect of pollen protein concentration on body size in
the sweat bee Lasioglossum zephyrum (Hymenoptera: Apiformes)". Evolutionary
Ecology, 16(1): 49-65.
IV. Generalist social bees maximize diversity
_____ 124
Roulston, T.H., J.H. Cane and S.L. Buchmann (2000). "What governs protein content of pollen:
Pollinator preferences, pollen-pistil interactions, or phylogeny?". Ecological
Monographs, 70(4): 617-643.
Roulston, T.H. and K. Goodell (2011). "The role of resources and risks in regulating wild bee
populations". Annual Review of Entomology, 56(1): 293-312.
Sickel, W., M.J. Ankenbrand, G. Grimmer, A. Holzschuh, S. Härtel, J. Lanzen, (...) A. Keller
(2015). "Increased efficiency in identifying mixed pollen samples by meta-barcoding
with a dual-indexing approach". BMC Ecology, 15(1): 20.
Simone-Finstrom, M. and M. Spivak (2010). "Propolis and bee health: the natural history and
significance of resin use by honey bees". Apidologie, 41(3): 295-311.
Simone, M., J.D. Evans and M. Spivak (2009). "Resin collection and social immunity in honey
bees". Evolution, 63(11): 3016-3022.
Simpson, S.J. and D. Raubenheimer (2012). "The nature of nutrition: a unifying framework
from animal adaptation to human obesity". Princeton University Press, Princton, USA.
Singer, M.S., E.A. Bernays and Y. Carrière (2002). "The interplay between nutrient balancing
and toxin dilution in foraging by a generalist insect herbivore". Animal Behaviour,
64(4): 629-643.
Slaa, E.J., A.J.M. Tack and M.J. Sommeijer (2003). "The effect of intrinsic and extrinsic factors
on flower constancy in stingless bees". Apidologie, 34(5): 457-468.
Smith, A.R., I.J.L. Quintero, J.E.M. Patino, D.W. Roubik and W.T. Wcislo (2012). "Pollen use
by Megalopta sweat bees in relation to resource availability in a tropical forest".
Ecological Entomology, 37(4): 309-317.
Somme, L., M. Vanderplanck, D. Michez, I. Lombaerde, R. Moerman, B. Wathelet, (...) A.L.
Jacquemart (2015). "Pollen and nectar quality drive the major and minor floral choices
of bumble bees". Apidologie, 46(1): 92-106.
Stout, J.C. and C.L. Morales (2009). "Ecological impacts of invasive alien species on bees".
Apidologie, 40(3): 388-409.
Tasei, J.N. and P. Aupinel (2008). "Nutritive value of 15 single pollens and pollen mixes tested
on larvae produced by bumblebee workers (Bombus terrestris, Hymenoptera: Apidae)".
Apidologie, 39(4): 397-409.
Tatsuno, M. and N. Osawa (2016). "Flower visitation patterns of the coexisting honey bees Apis
cerana japonica and Apis mellifera (Hymenoptera: Apidae)". Entomological Science,
19(3): 255-267.
Tepedino, V., B. Bradley and T. Griswold (2008). "Might flowers of invasive plants increase
native bee carrying capacity? Intimations from Capitol Reef National Park, Utah".
Natural Areas Journal, 28(1): 44-50.
4.7. References
_____ 125
Thornhill, A.H., G.S. Hope, L.A. Craven and M.D. Crisp (2012). "Pollen morphology of the
Myrtaceae. Part 1: tribes Eucalypteae, Lophostemoneae, Syncarpieae, Xanthostemoneae
and subfamily Psiloxyloideae". Australian Journal of Botany, 60(3): 165-199.
Threlfall, C.G., K. Walker, N.S.G. Williams, A.K. Hahs, L. Mata, N. Stork and S.J. Livesley
(2015). "The conservation value of urban green space habitats for Australian native bee
communities". Biological Conservation, 187: 240-248.
Tilman, D., F. Isbell and J.M. Cowles (2014). "Biodiversity and Ecosystem Functioning".
Annual Review of Ecology, Evolution, and Systematics, 45(1): 471-493.
Torres, C. and L. Galetto (1998). "Patterns and implications of floral nectar secretion, chemical
composition, removal effects and standing crop in Mandevilla pentlandiana
(Apocynaceae)". Botanical Journal of the Linnean Society, 127(3): 207-223.
Unsicker, S.B., A. Oswald, G. Köhler and W.W. Weisser (2008). "Complementarity effects
through dietary mixing enhance the performance of a generalist insect herbivore".
Oecologia, 156(2): 313-324.
Vanderplanck, M., R. Moerman, P. Rasmont, G. Lognay, B. Wathelet, R. Wattiez and D.
Michez (2014). "How does pollen chemistry impact development and feeding behaviour
of polylectic bees?". Plos One, 9(1): e86209.
von Frisch, K. (1967). "The dance language and orientation of bees". Belknap Press of Harvard
University Press, Cambridge.
Vossler, F.G., M.C. Telleria and M. Cunningham (2010). "Floral resources foraged by
Geotrigona argentina (Apidae, Meliponini) in the Argentine Dry Chaco forest". Grana,
49(2): 142-153.
Wallace, H.M. and D.J. Lee (2010). "Resin-foraging by colonies of Trigona sapiens and T.
hockingsi (Hymenoptera: Apidae, Meliponini) and consequent seed dispersal of
Corymbia torelliana (Myrtaceae)". Apidologie, 41: 428-435.
Williams, N.M., D. Cariveau, R. Winfree and C. Kremen (2011). "Bees in disturbed habitats
use, but do not prefer, alien plants". Basic and Applied Ecology, 12(4): 332-341.
Williams, N.M. and C. Kremen (2007). "Resource distributions among habitats determine
solitary bee offspring production in a mosaic landscape". Ecological Applications, 17:
910-921.
Williams, N.M., J. Regetz and C. Kremen (2012). "Landscape-scale resources promote colony
growth but not reproductive performance of bumble bees". Ecology, 93: 1049–1058.
Williams, N.M. and V.J. Tepedino (2003). "Consistent mixing of near and distant resources in
foraging bouts by the solitary mason bee Osmia lignaria". Behavioral Ecology, 14(1):
141-149.
Wilson, M.B., M. Spivak, A.D. Hegeman, A. Rendahl and J.D. Cohen (2013). "Metabolomics
reveals the origins of antimicrobial plant resins collected by honey bees". Plos One,
8(10): e77512.
IV. Generalist social bees maximize diversity
_____ 126
Winfree, R., T. Griswold and C. Kremen (2007). "Effect of human disturbance on bee
communities in a forested ecosystem". Conservation Biology, 21(1): 213-223.
Winfree, R., J. W. Fox, N.M. Williams, J.R. Reilly and D.P. Cariveau (2015). "Abundance of
common species, not species richness, drives delivery of a real-world ecosystem
service". Ecology Letters, 18(7): 626-635.
Yamamura, K. (2002). "Biodiversity and stability of herbivore populations: influences of the
spatial sparseness of food plants". Population Ecology, 44(1): 33-40.
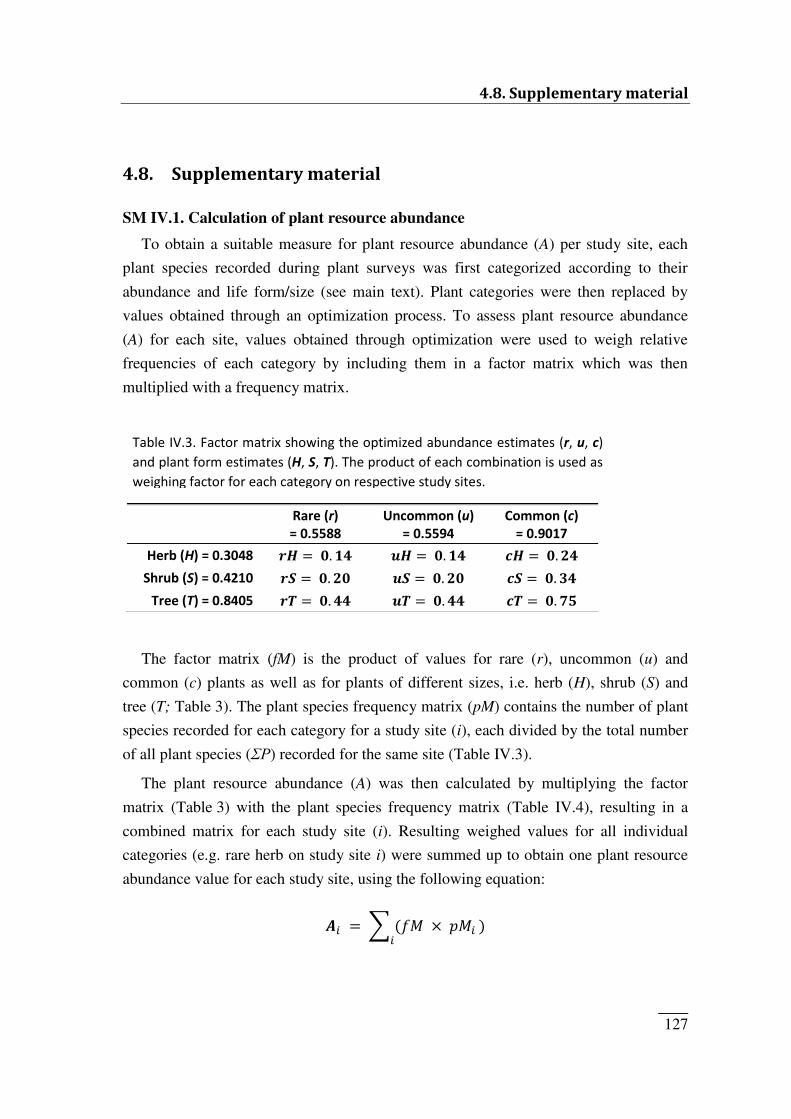
4.8. Supplementary material
_____ 127
4.8. Supplementary material SM IV.1. Calculation of plant resource abundance
To obtain a suitable measure for plant resource abundance (A) per study site, each
plant species recorded during plant surveys was first categorized according to their
abundance and life form/size (see main text). Plant categories were then replaced by
values obtained through an optimization process. To assess plant resource abundance
(A) for each site, values obtained through optimization were used to weigh relative
frequencies of each category by including them in a factor matrix which was then
multiplied with a frequency matrix.
The factor matrix (fM) is the product of values for rare (r), uncommon (u) and
common (c) plants as well as for plants of different sizes, i.e. herb (H), shrub (S) and
tree (T; Table 3). The plant species frequency matrix (pM) contains the number of plant
species recorded for each category for a study site (i), each divided by the total number
of all plant species (ΣP) recorded for the same site (Table IV.3).
The plant resource abundance (A) was then calculated by multiplying the factor
matrix (Table 3) with the plant species frequency matrix (Table IV.4), resulting in a
combined matrix for each study site (i). Resulting weighed values for all individual
categories (e.g. rare herb on study site i) were summed up to obtain one plant resource
abundance value for each study site, using the following equation:
∑
Rare (r) = 0.5588 Uncommon (u) = 0.5594 Common (c) = 0.9017 Herb (H) = 0.3048 𝒓𝑯 . 𝒖𝑯 . 𝒄𝑯 . Shrub (S) = 0.4210 𝒓 . 𝒖 . 𝒄 . Tree (T) = 0.8405 𝒓 . 𝒖 . 𝒄 .𝟕
Table IV.3. Factor matrix showing the optimized abundance estimates (r, u, c) and plant form estimates (H, S, T). The product of each combination is used as weighing factor for each category on respective study sites.
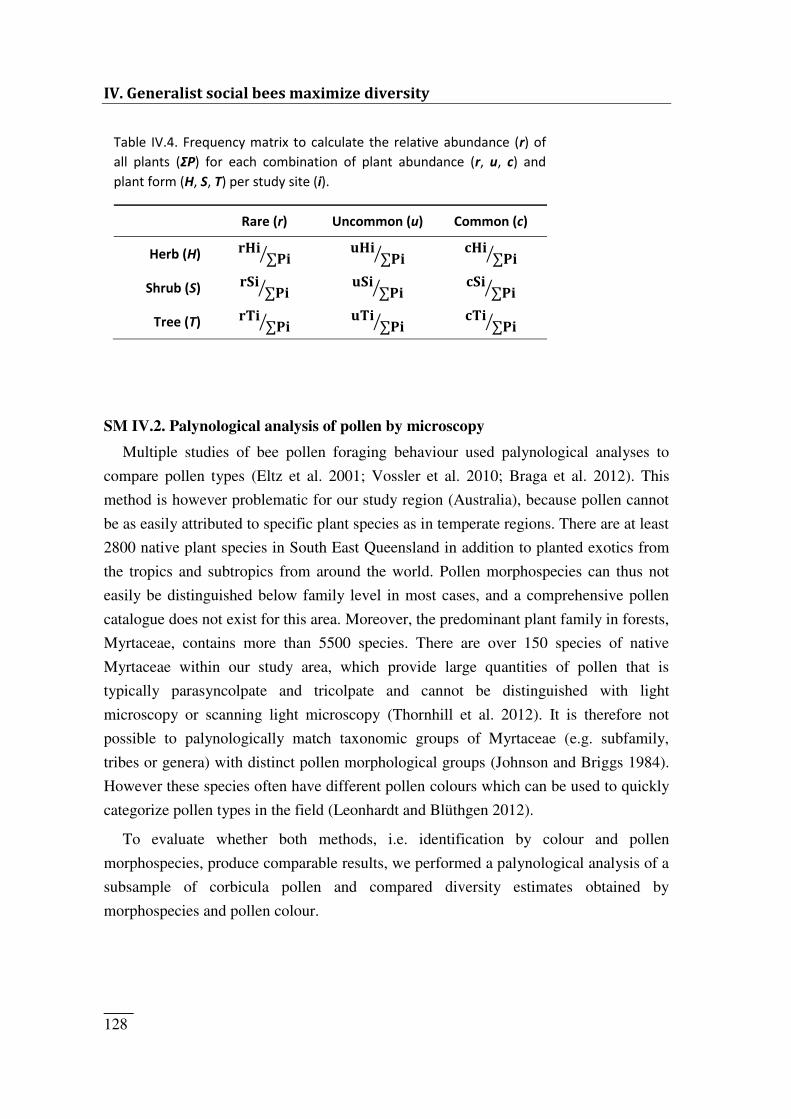
IV. Generalist social bees maximize diversity
_____ 128
SM IV.2. Palynological analysis of pollen by microscopy
Multiple studies of bee pollen foraging behaviour used palynological analyses to
compare pollen types (Eltz et al. 2001; Vossler et al. 2010; Braga et al. 2012). This
method is however problematic for our study region (Australia), because pollen cannot
be as easily attributed to specific plant species as in temperate regions. There are at least
2800 native plant species in South East Queensland in addition to planted exotics from
the tropics and subtropics from around the world. Pollen morphospecies can thus not
easily be distinguished below family level in most cases, and a comprehensive pollen
catalogue does not exist for this area. Moreover, the predominant plant family in forests,
Myrtaceae, contains more than 5500 species. There are over 150 species of native
Myrtaceae within our study area, which provide large quantities of pollen that is
typically parasyncolpate and tricolpate and cannot be distinguished with light
microscopy or scanning light microscopy (Thornhill et al. 2012). It is therefore not
possible to palynologically match taxonomic groups of Myrtaceae (e.g. subfamily,
tribes or genera) with distinct pollen morphological groups (Johnson and Briggs 1984).
However these species often have different pollen colours which can be used to quickly
categorize pollen types in the field (Leonhardt and Blüthgen 2012).
To evaluate whether both methods, i.e. identification by colour and pollen
morphospecies, produce comparable results, we performed a palynological analysis of a
subsample of corbicula pollen and compared diversity estimates obtained by
morphospecies and pollen colour.
Table IV.4. Frequency matrix to calculate the relative abundance (r) of all plants (ΣP) for each combination of plant abundance (r, u, c) and plant form (H, S, T) per study site (i). Rare (r) Uncommon (u) Common (c) Herb (H) 𝐫𝐇𝐢 ∑𝐏𝐢 𝐮𝐇𝐢 ∑𝐏𝐢 𝐜𝐇𝐢 ∑𝐏𝐢 Shrub (S) 𝐫 𝐢 ∑𝐏𝐢 𝐮 𝐢 ∑𝐏𝐢 𝐜 𝐢 ∑𝐏𝐢 Tree (T) 𝐫 𝐢 ∑𝐏𝐢 𝐮 𝐢 ∑𝐏𝐢 𝐜 𝐢 ∑𝐏𝐢
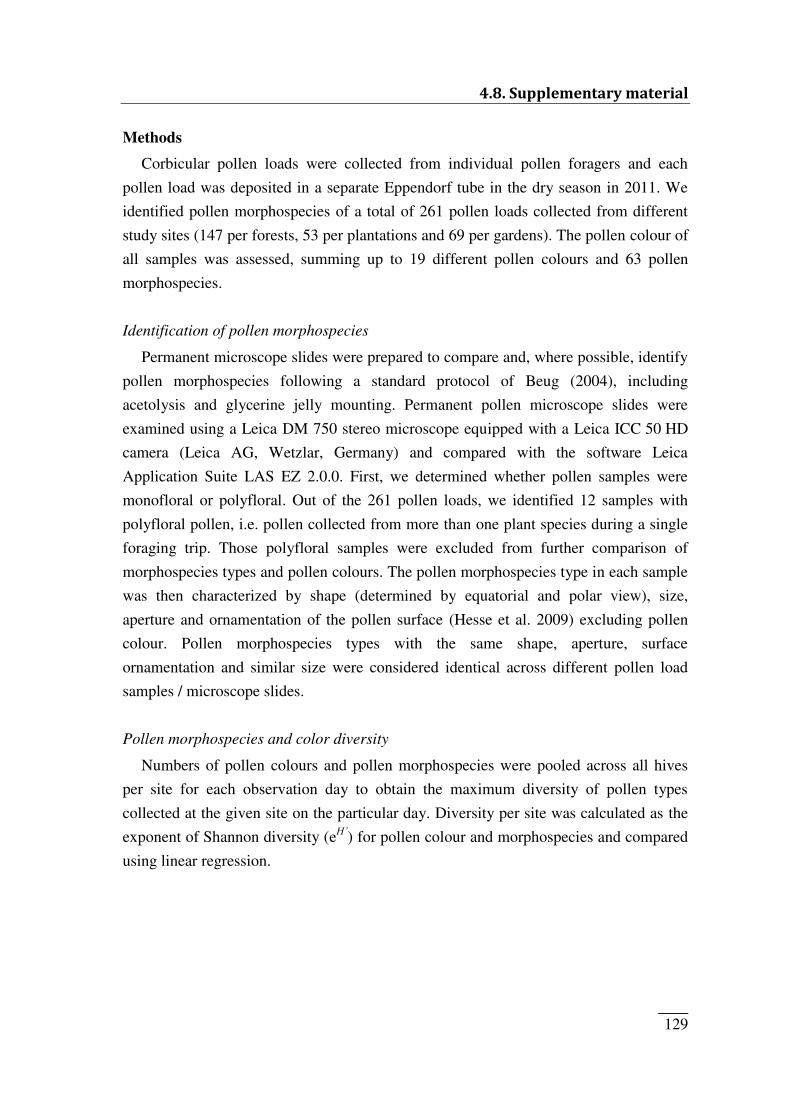
4.8. Supplementary material
_____ 129
Methods
Corbicular pollen loads were collected from individual pollen foragers and each
pollen load was deposited in a separate Eppendorf tube in the dry season in 2011. We
identified pollen morphospecies of a total of 261 pollen loads collected from different
study sites (147 per forests, 53 per plantations and 69 per gardens). The pollen colour of
all samples was assessed, summing up to 19 different pollen colours and 63 pollen
morphospecies.
Identification of pollen morphospecies
Permanent microscope slides were prepared to compare and, where possible, identify
pollen morphospecies following a standard protocol of Beug (2004), including
acetolysis and glycerine jelly mounting. Permanent pollen microscope slides were
examined using a Leica DM 750 stereo microscope equipped with a Leica ICC 50 HD
camera (Leica AG, Wetzlar, Germany) and compared with the software Leica
Application Suite LAS EZ 2.0.0. First, we determined whether pollen samples were
monofloral or polyfloral. Out of the 261 pollen loads, we identified 12 samples with
polyfloral pollen, i.e. pollen collected from more than one plant species during a single
foraging trip. Those polyfloral samples were excluded from further comparison of
morphospecies types and pollen colours. The pollen morphospecies type in each sample
was then characterized by shape (determined by equatorial and polar view), size,
aperture and ornamentation of the pollen surface (Hesse et al. 2009) excluding pollen
colour. Pollen morphospecies types with the same shape, aperture, surface
ornamentation and similar size were considered identical across different pollen load
samples / microscope slides.
Pollen morphospecies and color diversity
Numbers of pollen colours and pollen morphospecies were pooled across all hives
per site for each observation day to obtain the maximum diversity of pollen types
collected at the given site on the particular day. Diversity per site was calculated as the
exponent of Shannon diversity (eH’) for pollen colour and morphospecies and compared
using linear regression.
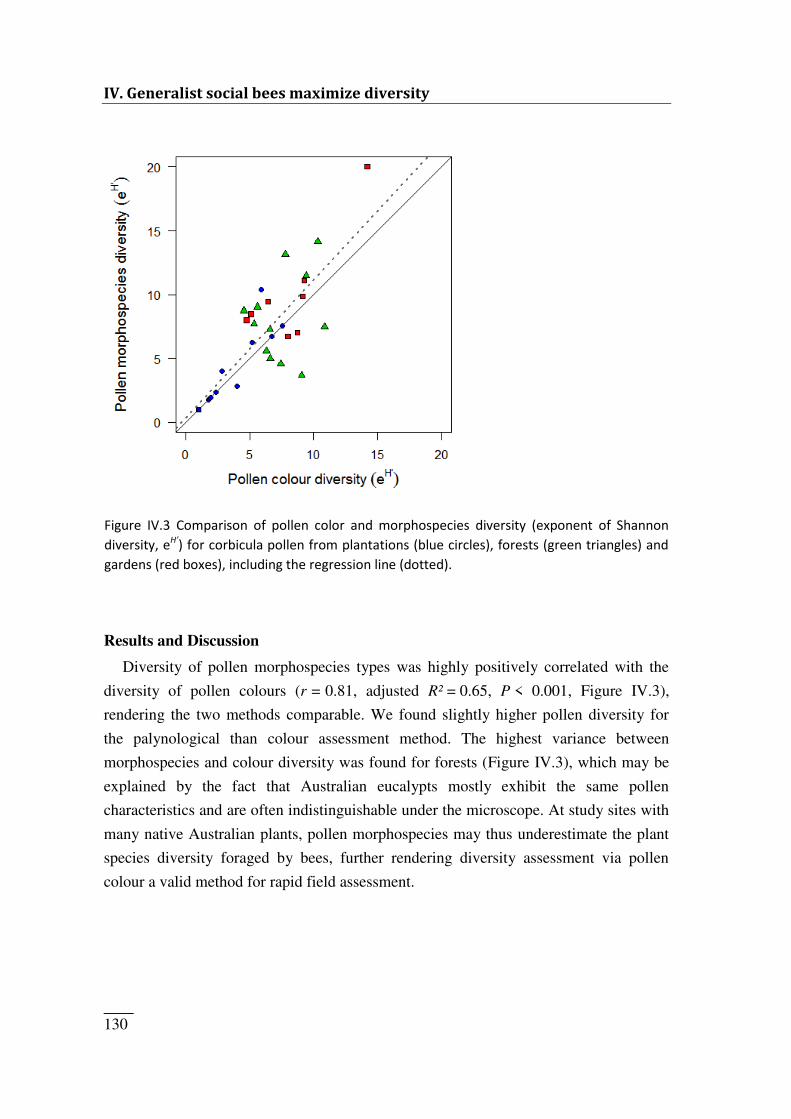
IV. Generalist social bees maximize diversity
_____ 130
Results and Discussion
Diversity of pollen morphospecies types was highly positively correlated with the
diversity of pollen colours (r = 0.81, adjusted R² = 0.65, P < 0.001, Figure IV.3),
rendering the two methods comparable. We found slightly higher pollen diversity for
the palynological than colour assessment method. The highest variance between
morphospecies and colour diversity was found for forests (Figure IV.3), which may be
explained by the fact that Australian eucalypts mostly exhibit the same pollen
characteristics and are often indistinguishable under the microscope. At study sites with
many native Australian plants, pollen morphospecies may thus underestimate the plant
species diversity foraged by bees, further rendering diversity assessment via pollen
colour a valid method for rapid field assessment.
Figure IV.3 Comparison of pollen color and morphospecies diversity (exponent of Shannon diversity, eH’) for corbicula pollen from plantations (blue circles), forests (green triangles) and gardens (red boxes), including the regression line (dotted).
4.8. Supplementary material
_____ 131
SM IV.3. Pollen DNA meta-barcoding
Pollen identification by DNA meta-barcoding has been shown to be more effective in
identifying higher taxon richness than palynological methods without requiring expert
knowledge (Keller et al. 2015). We therefore additionally validated our rapid colour
assessment approach by analysing additional samples by DNA meta-barcoding and
comparing colour and genetic diversity.
Methods
We collected 1330 corbicula pollen loads of returning foragers on 3 days for 8 study
sites (521 loads in 3 gardens, 353 loads in 3 plantations and 456 loads in 2 forests) in
the wet season in 2013. All forager loads of single garden sites and of paired forest and
plantation sites were pooled across days, as paired forest and plantation sites had almost
identical plant assemblages (according to our surveys), resulting in 8 samples for pollen
meta-barcoding.
DNA from pollen grains was isolated as described by (Keller et al. 2015) using the
Macherey-Nagel Food Kit (Düren, Germany) strictly according to the vendor's
supplementary protocol for pollen preparation. Library preparation was performed
according to the method described by (Sickel et al. 2015). As amplifying primers we
used the well-established combination of plant barcoding primers ITS-S2F (White et al.
1990; Chen et al. 2010) with an Illumina specific scaffold design (Sickel et al. 2015).
Each sample was assigned a different forward/reverse index combination for sample-
specific labelling to multiplex samples on the same sequencing chip. For this study, we
used 2 forward index sequences (SA507 – SB508) and 12 reverse indices (SA701 – SA712). These were processed together with 360 samples from other projects with
other unique indices.
PCR was performed in three separate 10 µL reactions in order to avoid PCR bias
(Sickel et al. 2015). Each reaction contained 5 µL 2x Phusion Master Mix (New
England Biolabs, Ipswich, MA, USA), 0.33 µM each of the forward and reverse
primers, 3.34 µL PCR grade water and 1 µL DNA template. PCR conditions were as
follows: initial denaturation at 95 °C for 4 min, 37 cycles of denaturation at 95 °C for
40 sec, annealing at 49 °C for 40 sec and elongation at 72 °C for 40 sec; followed by a
final extension step at 72 °C for 5 min. Triplicate reactions of each sample were
combined after PCR and further processed as described in Sickel et al. (2015), including
the required normalization, pooling and dilution steps. Quality of the library was
controlled using a Bioanalyzer High Sensitivity DNA Chip (Agilent Technologies,
Santa Clara, CA, USA) and quantified with the dsDNA High Sensitivity Assay (Life
IV. Generalist social bees maximize diversity
_____ 132
Technologies GmbH, Darmstadt, Germany). 5 % Phix Control Kit v3 (Illumina Inc.,
San Diego, CA, USA) was added according to the Sample Preparation Guide (llumina
Inc. 2013). Sequencing was performed on the Illumina MiSeq using 2x250 cycles v2
chemistry (Illumina Inc., San Diego, CA, USA).
Data was quality controlled, cleaned, taxonomically classified and prepared
according to the scripts available at https://github.com/iimog/meta-barcoding-dual-
indexing. Resulting files are directly importable into common statistical software, as
e.g. R v.3.1.2 (R Development Core Team 2013) using the package phyloseq v.1.6.1
(McMurdie and Holmes 2013). To assess sufficiency of the sequencing depth, we
created species accumulation curves for each sample using the vegan package v2.2-0
(Dixon 2003) in R v.3.1.2 (R Development Core Team 2013), excluding taxa
accounting for less than 0.1 % of reads. Due to a more comprehensive taxon data base,
identification efficiency is likely to be higher for exotic taxa than for Australian native
plant species, though this does not affect the total number of identified taxa. The
number of reads in each sample was used as abundance value for each taxon to calculate
the exponent Shannon diversity per study site.
According to the colour categorization method, identical pollen colours are
considered to be from the same source, but only when collected at the same site on the
same day. Samples for DNA meta-barcoding however were pooled per site for all 3
observation days to minimize costs. We thus calculated the exponent Shannon diversity
for single days for respective sites and took the mean of the 3 observation days, to
compare the pollen colour diversity with the diversity measured by DNA meta-
barcoding of respectively pooled samples.
Results and Discussion
Using DNA barcoding, we identified 294 plant taxa in 1330 single corbicula pollen
loads, representing 31 colours. Thus, pollen colour diversity was generally lower than
diversity estimated on molecular data except for one forest site (r = 0.21, P = 0.60,
Figure IV.4). This demonstrates that pollen colour assessment generally underestimates
the actual diversity of plants visited by bees for pollen foraging. In contrast, pollen
colour assessment slightly overestimated evenness compared to molecular evenness
(r = 0.67, P = 0.06, Figure IV.4). Pollen colour can thus be considered a conservative
estimate of the bees‘ utilization of pollen diversity.
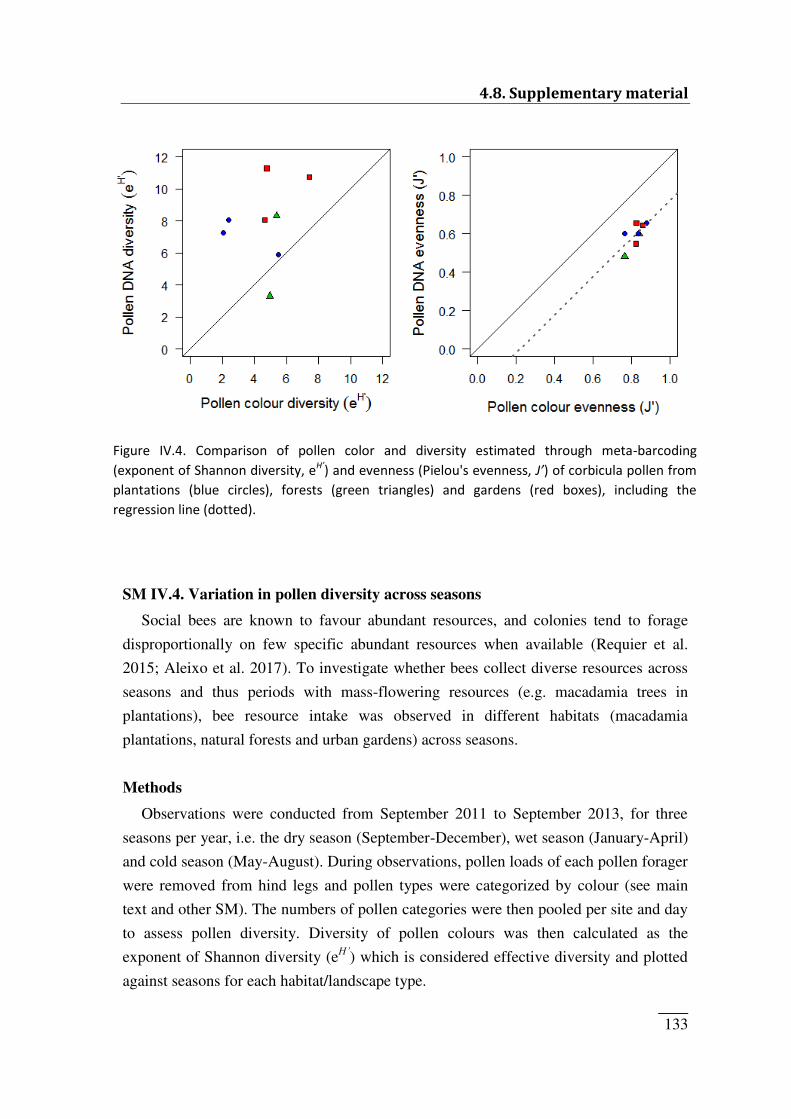
4.8. Supplementary material
_____ 133
SM IV.4. Variation in pollen diversity across seasons
Social bees are known to favour abundant resources, and colonies tend to forage
disproportionally on few specific abundant resources when available (Requier et al.
2015; Aleixo et al. 2017). To investigate whether bees collect diverse resources across
seasons and thus periods with mass-flowering resources (e.g. macadamia trees in
plantations), bee resource intake was observed in different habitats (macadamia
plantations, natural forests and urban gardens) across seasons.
Methods
Observations were conducted from September 2011 to September 2013, for three
seasons per year, i.e. the dry season (September-December), wet season (January-April)
and cold season (May-August). During observations, pollen loads of each pollen forager
were removed from hind legs and pollen types were categorized by colour (see main
text and other SM). The numbers of pollen categories were then pooled per site and day
to assess pollen diversity. Diversity of pollen colours was then calculated as the
exponent of Shannon diversity (eH’) which is considered effective diversity and plotted
against seasons for each habitat/landscape type.
Figure IV.4. Comparison of pollen color and diversity estimated through meta-barcoding (exponent of Shannon diversity, eH’) and evenness (Pielou's evenness, J’) of corbicula pollen from plantations (blue circles), forests (green triangles) and gardens (red boxes), including the regression line (dotted).
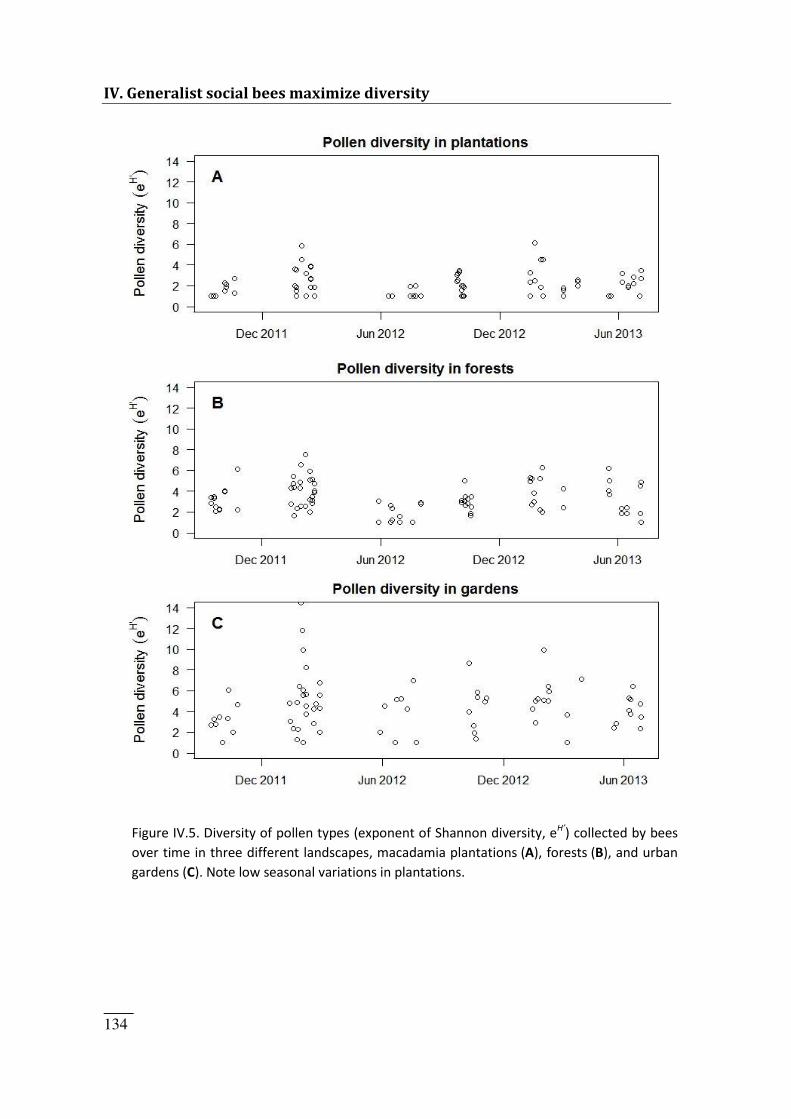
IV. Generalist social bees maximize diversity
_____ 134
Figure IV.5. Diversity of pollen types (exponent of Shannon diversity, eH’) collected by bees over time in three different landscapes, macadamia plantations (A), forests (B), and urban gardens (C). Note low seasonal variations in plantations.
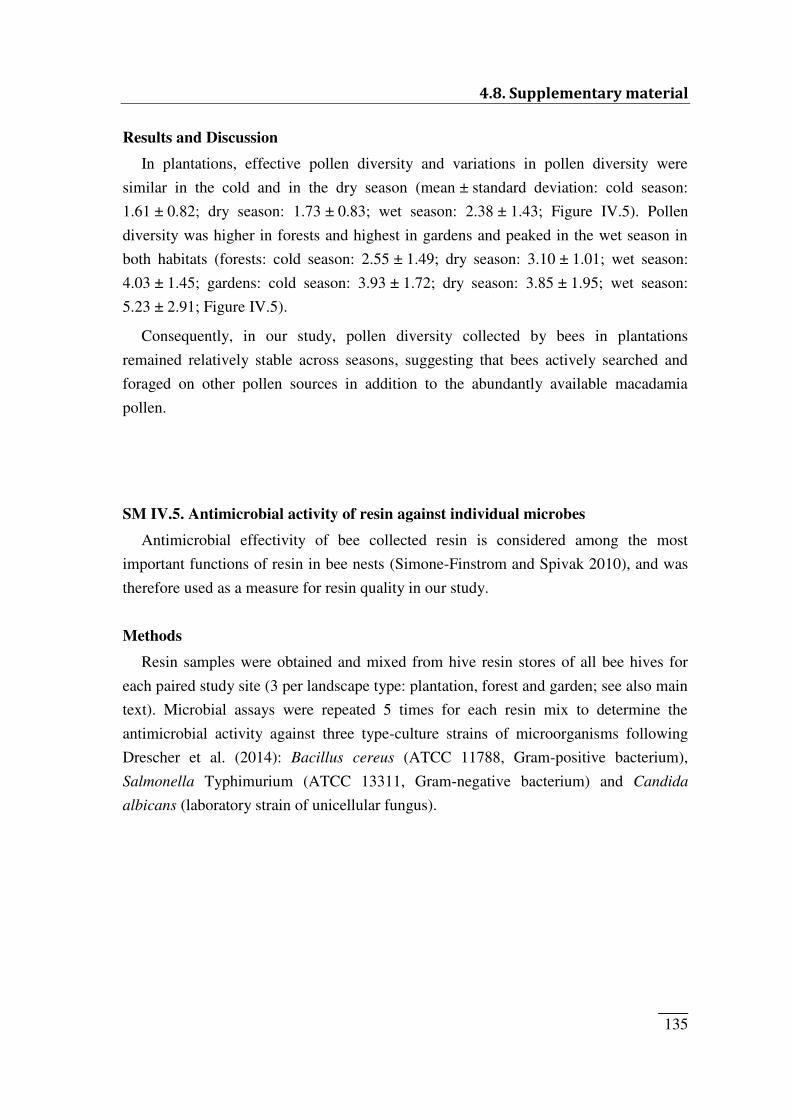
4.8. Supplementary material
_____ 135
Results and Discussion
In plantations, effective pollen diversity and variations in pollen diversity were
similar in the cold and in the dry season (mean ± standard deviation: cold season:
1.61 ± 0.82; dry season: 1.73 ± 0.83; wet season: 2.38 ± 1.43; Figure IV.5). Pollen
diversity was higher in forests and highest in gardens and peaked in the wet season in
both habitats (forests: cold season: 2.55 ± 1.49; dry season: 3.10 ± 1.01; wet season:
4.03 ± 1.45; gardens: cold season: 3.93 ± 1.72; dry season: 3.85 ± 1.95; wet season:
5.23 ± 2.91; Figure IV.5).
Consequently, in our study, pollen diversity collected by bees in plantations
remained relatively stable across seasons, suggesting that bees actively searched and
foraged on other pollen sources in addition to the abundantly available macadamia
pollen.
SM IV.5. Antimicrobial activity of resin against individual microbes
Antimicrobial effectivity of bee collected resin is considered among the most
important functions of resin in bee nests (Simone-Finstrom and Spivak 2010), and was
therefore used as a measure for resin quality in our study.
Methods
Resin samples were obtained and mixed from hive resin stores of all bee hives for
each paired study site (3 per landscape type: plantation, forest and garden; see also main
text). Microbial assays were repeated 5 times for each resin mix to determine the
antimicrobial activity against three type-culture strains of microorganisms following
Drescher et al. (2014): Bacillus cereus (ATCC 11788, Gram-positive bacterium),
Salmonella Typhimurium (ATCC 13311, Gram-negative bacterium) and Candida
albicans (laboratory strain of unicellular fungus).
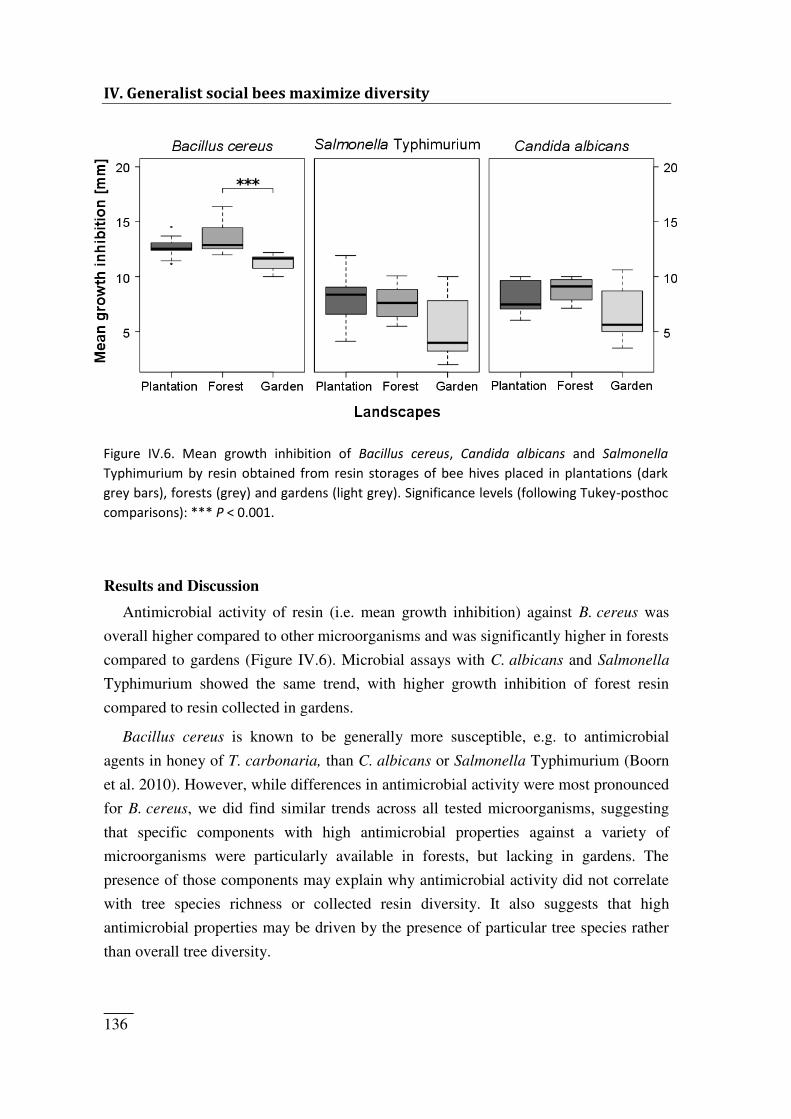
IV. Generalist social bees maximize diversity
_____ 136
Results and Discussion
Antimicrobial activity of resin (i.e. mean growth inhibition) against B. cereus was
overall higher compared to other microorganisms and was significantly higher in forests
compared to gardens (Figure IV.6). Microbial assays with C. albicans and Salmonella
Typhimurium showed the same trend, with higher growth inhibition of forest resin
compared to resin collected in gardens.
Bacillus cereus is known to be generally more susceptible, e.g. to antimicrobial
agents in honey of T. carbonaria, than C. albicans or Salmonella Typhimurium (Boorn
et al. 2010). However, while differences in antimicrobial activity were most pronounced
for B. cereus, we did find similar trends across all tested microorganisms, suggesting
that specific components with high antimicrobial properties against a variety of
microorganisms were particularly available in forests, but lacking in gardens. The
presence of those components may explain why antimicrobial activity did not correlate
with tree species richness or collected resin diversity. It also suggests that high
antimicrobial properties may be driven by the presence of particular tree species rather
than overall tree diversity.
Figure IV.6. Mean growth inhibition of Bacillus cereus, Candida albicans and Salmonella Typhimurium by resin obtained from resin storages of bee hives placed in plantations (dark grey bars), forests (grey) and gardens (light grey). Significance levels (following Tukey-posthoc comparisons): *** P < 0.001.
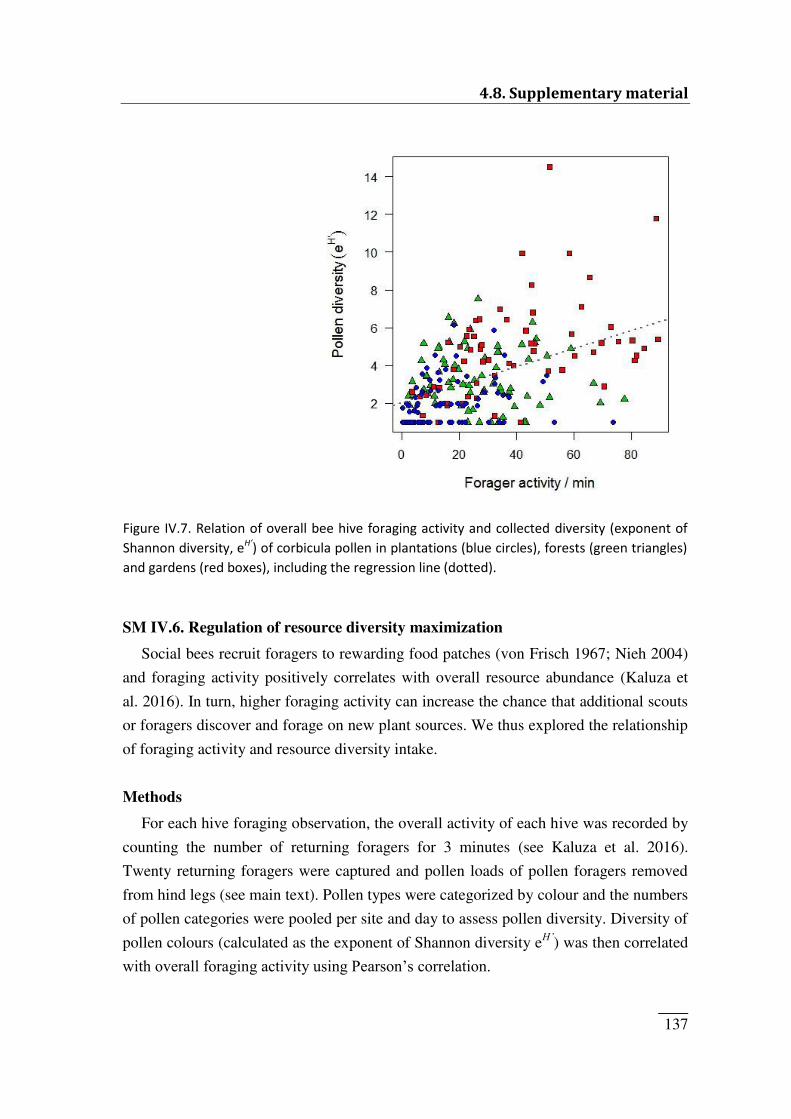
4.8. Supplementary material
_____ 137
SM IV.6. Regulation of resource diversity maximization
Social bees recruit foragers to rewarding food patches (von Frisch 1967; Nieh 2004)
and foraging activity positively correlates with overall resource abundance (Kaluza et
al. 2016). In turn, higher foraging activity can increase the chance that additional scouts
or foragers discover and forage on new plant sources. We thus explored the relationship
of foraging activity and resource diversity intake.
Methods
For each hive foraging observation, the overall activity of each hive was recorded by
counting the number of returning foragers for 3 minutes (see Kaluza et al. 2016).
Twenty returning foragers were captured and pollen loads of pollen foragers removed
from hind legs (see main text). Pollen types were categorized by colour and the numbers
of pollen categories were pooled per site and day to assess pollen diversity. Diversity of
pollen colours (calculated as the exponent of Shannon diversity eH’) was then correlated
with overall foraging activity using Pearson‘s correlation.
Figure IV.7. Relation of overall bee hive foraging activity and collected diversity (exponent of Shannon diversity, eH’) of corbicula pollen in plantations (blue circles), forests (green triangles) and gardens (red boxes), including the regression line (dotted).
IV. Generalist social bees maximize diversity
_____ 138
Results and Discussion
Pollen diversity increased with overall foraging activity of colonies (Pearson‘s correlation: r = 0.46, P < 0.001, Figure IV.7), but varied with habitat type: whereas
diversity of pollen types increased with foraging activity in plantations and gardens,
foraging activity did not correlate with pollen diversity in forests (plantations: r = 0.25,
P = 0.03; gardens: r = 0.48, P < 0.001; forests: r = -0.04, P = 0.71). This finding
suggests that the relationship between foraging activity and resource diversity depends
on the surrounding environment and thus structure of foraging habitat (e.g. the size and
distribution of resource patches).
References
Aleixo, K.P., C. Menezes, V.L. Imperatriz Fonseca and C.I. da Silva (2017). "Seasonal
availability of floral resources and ambient temperature shape stingless bee foraging
behavior (Scaptotrigona aff. depilis)". Apidologie, 48(1): 117-127.
Beug, H.-J. (2004). "Leitfaden der Pollenbestimmung: für Mitteleuropa und angrenzende
Gebiete". Friedrich Pfeil, München, Germany.
Boorn, K.L., Y.Y. Khor, E. Sweetman, F. Tan, T.A. Heard and K.A. Hammer (2010).
"Antimicrobial activity of honey from the stingless bee Trigona carbonaria determined
by agar diffusion, agar dilution, broth microdilution and time-kill methodology".
Journal of Applied Microbiology, 108(5): 1534-1543.
Braga, J.A., E.O. Sales, J.S. Neto, M.M. Conde, O.M. Barth and M.C. Lorenzon (2012). "Floral
sources to Tetragonisca angustula (Hymenoptera: Apidae) and their pollen morphology
in a Southeastern Brazilian Atlantic Forest". Revista de Biologia Tropical, 60(4): 1491-
1501.
Chen, S., H. Yao, J. Han, C. Liu, J. Song, L. Shi, (...) C. Leon (2010). "Validation of the ITS2
region as a novel DNA barcode for identifying medicinal plant species". Plos One, 5(1):
e8613.
Dixon, P. (2003). "VEGAN, a package of R functions for community ecology". Journal of
Vegetation Science, 14(6): 927-930.
Drescher, N., H.M. Wallace, M. Katouli, C.F. Massaro and S.D. Leonhardt (2014). "Diversity
matters: how bees benefit from different resin sources". Oecologia, 176(4): 943-953.
Eltz, T., C.A. Brühl, S.v.d. Kaars and K.E. Linsenmair (2001). "Pollen foraging and resource
partitioning of stingless bees in relation to flowering dynamics in a Southeast Asian
tropical rainforest". Insectes Sociaux, 48: 273-279.
Hesse, M., H. Halbritter, M. Weber, R. Buchner, A. Frosch-Radivo and S. Ulrich (2009).
"Pollen terminology: an illustrated handbook". Springer Science & Business Media,
Wien, Austria.
4.8. Supplementary material
_____ 139
Johnson, L. and B. Briggs (1984). "Myrtales and Myrtaceae-a phylogenetic analysis". Annals of
the Missouri Botanical Garden: 700-756.
Kaluza, B.F., H. Wallace, T.A. Heard, A.-M. Klein and S.D. Leonhardt (2016). "Urban gardens
promote bee foraging over natural habitats and plantations". Ecology and Evolution,
6(5): 1304-1316.
Keller, A., N. Danner, G. Grimmer, M. Ankenbrand, K. von der Ohe, W. von der Ohe, (...) I.
Steffan-Dewenter (2015). "Evaluating multiplexed next-generation sequencing as a
method in palynology for mixed pollen samples". Plant Biology, 17(2): 558-566.
Leonhardt, S.D. and N. Blüthgen (2012). "The same, but different: pollen foraging in honeybee
and bumblebee colonies". Apidologie, 43: 449-464.
McMurdie, P.J. and S. Holmes (2013). "phyloseq: an R package for reproducible interactive
analysis and graphics of microbiome census data". Plos One, 8(4): e61217.
Nieh, J.C. (2004). "Recruitment communication in stingless bees (Hymenoptera, Apidae,
Meliponini)". Apidologie, 35(2): 159-182.
R Development Core Team (2013). "R: A language and environment for statistical computing".
Version: 2.15.0. R Foundation for Statistical Computing, Vienna. Available at:
http://www.R-project.org.
Requier, F., J.-F. Odoux, T. Tamic, N. Moreau, M. Henry, A. Decourtye and V. Bretagnolle
(2015). "Honey bee diet in intensive farmland habitats reveals an unexpectedly high
flower richness and a major role of weeds". Ecological Applications, 25(4): 881-890.
Sickel, W., M.J. Ankenbrand, G. Grimmer, A. Holzschuh, S. Härtel, J. Lanzen, (...) A. Keller
(2015). "Increased efficiency in identifying mixed pollen samples by meta-barcoding
with a dual-indexing approach". BMC Ecology, 15(1): 20.
Simone-Finstrom, M. and M. Spivak (2010). "Propolis and bee health: the natural history and
significance of resin use by honey bees". Apidologie, 41(3): 295-311.
Thornhill, A.H., G.S. Hope, L.A. Craven and M.D. Crisp (2012). "Pollen morphology of the
Myrtaceae. Part 1: tribes Eucalypteae, Lophostemoneae, Syncarpieae, Xanthostemoneae
and subfamily Psiloxyloideae". Australian Journal of Botany, 60(3): 165-199.
von Frisch, K. (1967). "The dance language and orientation of bees". Belknap Press of Harvard
University Press, Cambridge.
Vossler, F.G., M.C. Telleria and M. Cunningham (2010). "Floral resources foraged by
Geotrigona argentina (Apidae, Meliponini) in the Argentine Dry Chaco forest". Grana,
49(2): 142-153.
White, T.J., T. Bruns, S. Lee and J. Taylor (1990). "Amplification and direct sequencing of
fungal ribosomal RNA genes for phylogenetics": pp 315-322.in Innis, MA, DH
Gelfand, JJ Sninsky and TJ White, PCR protocols: a guide to methods and
applications. Academic press, New York.

_____ 140
_____ 141
V. BIODIVERSITY DRIVES SOCIAL BEE FITNESS 5.1. Abstract
Widespread bee declines are likely driven by loss of plant biodiversity, as bee
population dynamics directly depend on floral resource diversity and availability. While
habitat biodiversity generally has a positive effect on bee fitness, no study has ever
investigated how plant resource diversity and abundance as well as resulting changes of
resource quantity and nutrient quality affect the fitness of the most important
pollinators: the highly social bees.
In order to determine whether and how highly social bees depend on plant
biodiversity, we monitored colony growth and fitness of a highly social bee species,
Tetragonula carbonaria Smith, in relation to plant species richness and resource
abundance as well as to patch sizes of various landscape types, ranging from natural
habitats (forests) to anthropogenically altered habitats (agricultural plantations and
suburban gardens). Colony reproduction and (colony and individual) fitness was further
compared with the quantity and quality of food collected by colonies over two and a
half years to elucidate the mechanisms underlying biodiversity effects on bee fitness.
Our extensive monitoring revealed that colony fitness (brood volume, hive-, queen-
and worker reproduction) increased with increasing plant species richness and resource
quantity (colony food stores), with highest plant species richness and consequently
colony fitness in gardens. Interestingly, individual worker fitness was not affected by
available resource diversity and abundance, showing that colonies do not increase the
nutritional investment in single workers, but in overall worker population size.
Moreover, resource nutrient quality and functionality also increased with plant species
richness, but did not limit colony fitness.
Our study proves that high plant species richness provides continuous resource
supply and thus promotes resource foraging and increases colony fitness. Biodiversity is
therefore a key driver of (social) bee fitness by providing more foraging resources, even
when only small, but florally diverse patches remain.
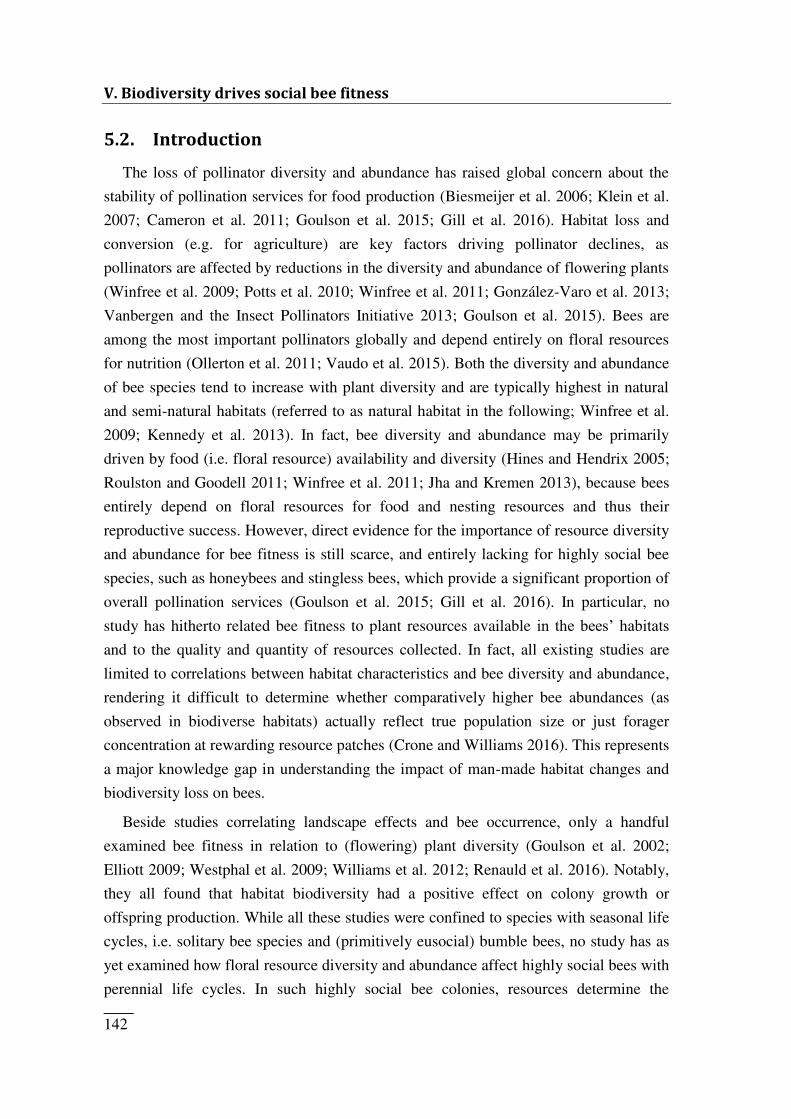
V. Biodiversity drives social bee fitness
_____ 142
5.2. Introduction The loss of pollinator diversity and abundance has raised global concern about the
stability of pollination services for food production (Biesmeijer et al. 2006; Klein et al.
2007; Cameron et al. 2011; Goulson et al. 2015; Gill et al. 2016). Habitat loss and
conversion (e.g. for agriculture) are key factors driving pollinator declines, as
pollinators are affected by reductions in the diversity and abundance of flowering plants
(Winfree et al. 2009; Potts et al. 2010; Winfree et al. 2011; González-Varo et al. 2013;
Vanbergen and the Insect Pollinators Initiative 2013; Goulson et al. 2015). Bees are
among the most important pollinators globally and depend entirely on floral resources
for nutrition (Ollerton et al. 2011; Vaudo et al. 2015). Both the diversity and abundance
of bee species tend to increase with plant diversity and are typically highest in natural
and semi-natural habitats (referred to as natural habitat in the following; Winfree et al.
2009; Kennedy et al. 2013). In fact, bee diversity and abundance may be primarily
driven by food (i.e. floral resource) availability and diversity (Hines and Hendrix 2005;
Roulston and Goodell 2011; Winfree et al. 2011; Jha and Kremen 2013), because bees
entirely depend on floral resources for food and nesting resources and thus their
reproductive success. However, direct evidence for the importance of resource diversity
and abundance for bee fitness is still scarce, and entirely lacking for highly social bee
species, such as honeybees and stingless bees, which provide a significant proportion of
overall pollination services (Goulson et al. 2015; Gill et al. 2016). In particular, no
study has hitherto related bee fitness to plant resources available in the bees‘ habitats and to the quality and quantity of resources collected. In fact, all existing studies are
limited to correlations between habitat characteristics and bee diversity and abundance,
rendering it difficult to determine whether comparatively higher bee abundances (as
observed in biodiverse habitats) actually reflect true population size or just forager
concentration at rewarding resource patches (Crone and Williams 2016). This represents
a major knowledge gap in understanding the impact of man-made habitat changes and
biodiversity loss on bees.
Beside studies correlating landscape effects and bee occurrence, only a handful
examined bee fitness in relation to (flowering) plant diversity (Goulson et al. 2002;
Elliott 2009; Westphal et al. 2009; Williams et al. 2012; Renauld et al. 2016). Notably,
they all found that habitat biodiversity had a positive effect on colony growth or
offspring production. While all these studies were confined to species with seasonal life
cycles, i.e. solitary bee species and (primitively eusocial) bumble bees, no study has as
yet examined how floral resource diversity and abundance affect highly social bees with
perennial life cycles. In such highly social bee colonies, resources determine the
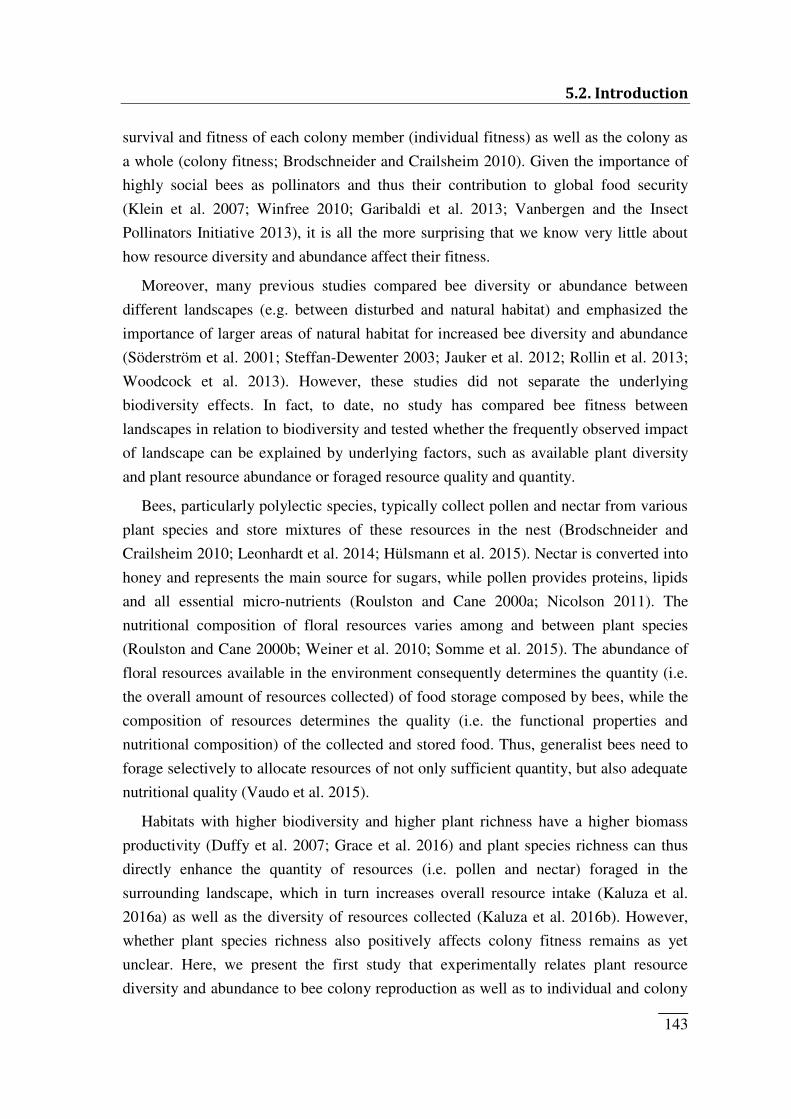
5.2. Introduction
_____ 143
survival and fitness of each colony member (individual fitness) as well as the colony as
a whole (colony fitness; Brodschneider and Crailsheim 2010). Given the importance of
highly social bees as pollinators and thus their contribution to global food security
(Klein et al. 2007; Winfree 2010; Garibaldi et al. 2013; Vanbergen and the Insect
Pollinators Initiative 2013), it is all the more surprising that we know very little about
how resource diversity and abundance affect their fitness.
Moreover, many previous studies compared bee diversity or abundance between
different landscapes (e.g. between disturbed and natural habitat) and emphasized the
importance of larger areas of natural habitat for increased bee diversity and abundance
(Söderström et al. 2001; Steffan-Dewenter 2003; Jauker et al. 2012; Rollin et al. 2013;
Woodcock et al. 2013). However, these studies did not separate the underlying
biodiversity effects. In fact, to date, no study has compared bee fitness between
landscapes in relation to biodiversity and tested whether the frequently observed impact
of landscape can be explained by underlying factors, such as available plant diversity
and plant resource abundance or foraged resource quality and quantity.
Bees, particularly polylectic species, typically collect pollen and nectar from various
plant species and store mixtures of these resources in the nest (Brodschneider and
Crailsheim 2010; Leonhardt et al. 2014; Hülsmann et al. 2015). Nectar is converted into
honey and represents the main source for sugars, while pollen provides proteins, lipids
and all essential micro-nutrients (Roulston and Cane 2000a; Nicolson 2011). The
nutritional composition of floral resources varies among and between plant species
(Roulston and Cane 2000b; Weiner et al. 2010; Somme et al. 2015). The abundance of
floral resources available in the environment consequently determines the quantity (i.e.
the overall amount of resources collected) of food storage composed by bees, while the
composition of resources determines the quality (i.e. the functional properties and
nutritional composition) of the collected and stored food. Thus, generalist bees need to
forage selectively to allocate resources of not only sufficient quantity, but also adequate
nutritional quality (Vaudo et al. 2015).
Habitats with higher biodiversity and higher plant richness have a higher biomass
productivity (Duffy et al. 2007; Grace et al. 2016) and plant species richness can thus
directly enhance the quantity of resources (i.e. pollen and nectar) foraged in the
surrounding landscape, which in turn increases overall resource intake (Kaluza et al.
2016a) as well as the diversity of resources collected (Kaluza et al. 2016b). However,
whether plant species richness also positively affects colony fitness remains as yet
unclear. Here, we present the first study that experimentally relates plant resource
diversity and abundance to bee colony reproduction as well as to individual and colony
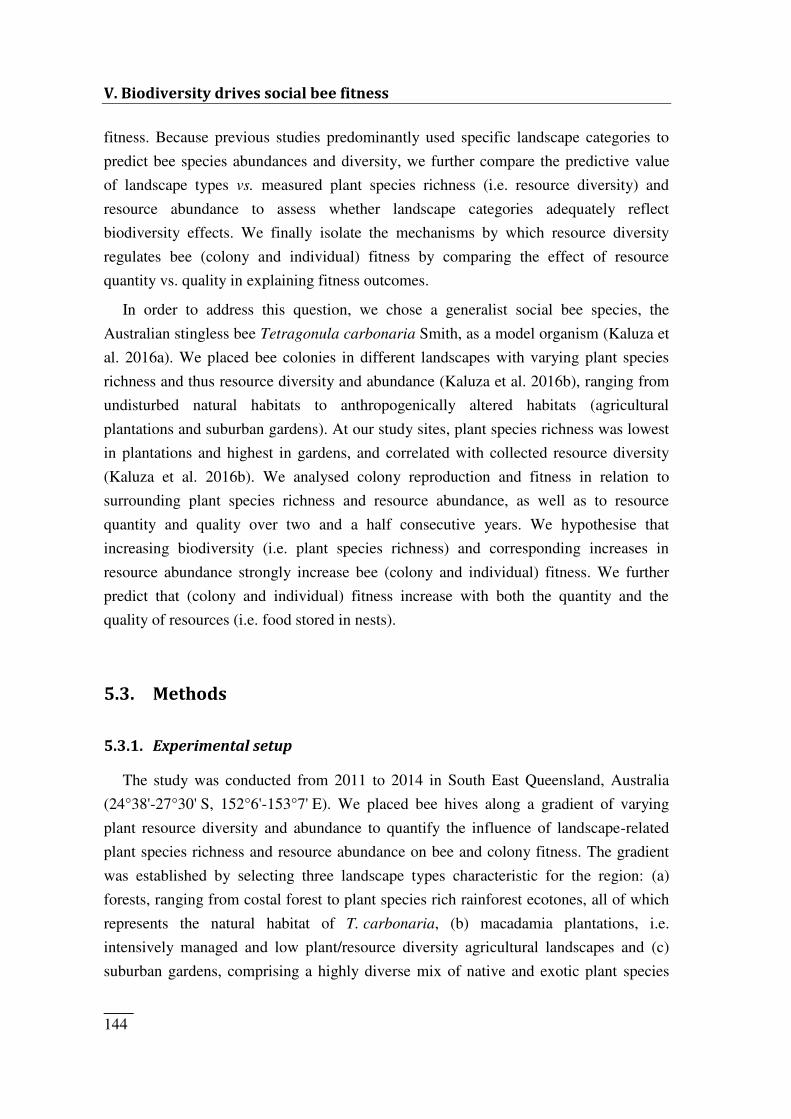
V. Biodiversity drives social bee fitness
_____ 144
fitness. Because previous studies predominantly used specific landscape categories to
predict bee species abundances and diversity, we further compare the predictive value
of landscape types vs. measured plant species richness (i.e. resource diversity) and
resource abundance to assess whether landscape categories adequately reflect
biodiversity effects. We finally isolate the mechanisms by which resource diversity
regulates bee (colony and individual) fitness by comparing the effect of resource
quantity vs. quality in explaining fitness outcomes.
In order to address this question, we chose a generalist social bee species, the
Australian stingless bee Tetragonula carbonaria Smith, as a model organism (Kaluza et
al. 2016a). We placed bee colonies in different landscapes with varying plant species
richness and thus resource diversity and abundance (Kaluza et al. 2016b), ranging from
undisturbed natural habitats to anthropogenically altered habitats (agricultural
plantations and suburban gardens). At our study sites, plant species richness was lowest
in plantations and highest in gardens, and correlated with collected resource diversity
(Kaluza et al. 2016b). We analysed colony reproduction and fitness in relation to
surrounding plant species richness and resource abundance, as well as to resource
quantity and quality over two and a half consecutive years. We hypothesise that
increasing biodiversity (i.e. plant species richness) and corresponding increases in
resource abundance strongly increase bee (colony and individual) fitness. We further
predict that (colony and individual) fitness increase with both the quantity and the
quality of resources (i.e. food stored in nests).
5.3. Methods 5.3.1. Experimental setup
The study was conducted from 2011 to 2014 in South East Queensland, Australia
(24°38'-27°30' S, 152°6'-153°7' E). We placed bee hives along a gradient of varying
plant resource diversity and abundance to quantify the influence of landscape-related
plant species richness and resource abundance on bee and colony fitness. The gradient
was established by selecting three landscape types characteristic for the region: (a)
forests, ranging from costal forest to plant species rich rainforest ecotones, all of which
represents the natural habitat of T. carbonaria, (b) macadamia plantations, i.e.
intensively managed and low plant/resource diversity agricultural landscapes and (c)
suburban gardens, comprising a highly diverse mix of native and exotic plant species
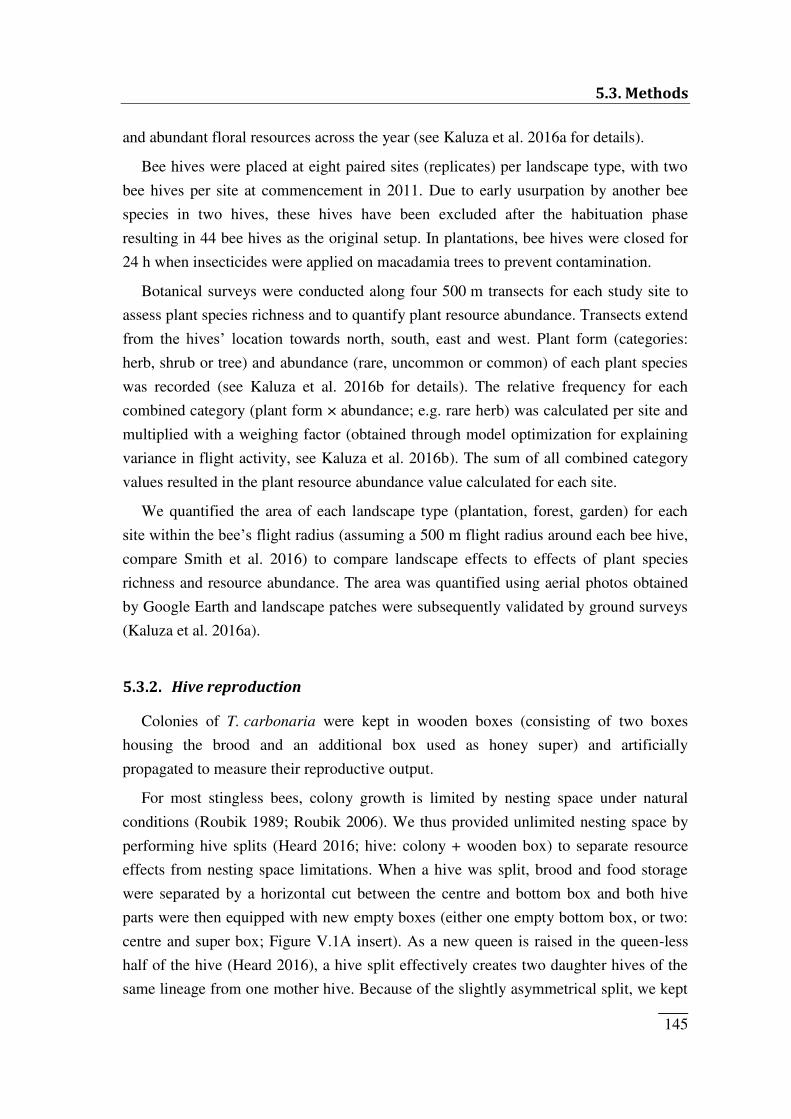
5.3. Methods
_____ 145
and abundant floral resources across the year (see Kaluza et al. 2016a for details).
Bee hives were placed at eight paired sites (replicates) per landscape type, with two
bee hives per site at commencement in 2011. Due to early usurpation by another bee
species in two hives, these hives have been excluded after the habituation phase
resulting in 44 bee hives as the original setup. In plantations, bee hives were closed for
24 h when insecticides were applied on macadamia trees to prevent contamination.
Botanical surveys were conducted along four 500 m transects for each study site to
assess plant species richness and to quantify plant resource abundance. Transects extend
from the hives‘ location towards north, south, east and west. Plant form (categories:
herb, shrub or tree) and abundance (rare, uncommon or common) of each plant species
was recorded (see Kaluza et al. 2016b for details). The relative frequency for each
combined category (plant form × abundance; e.g. rare herb) was calculated per site and
multiplied with a weighing factor (obtained through model optimization for explaining
variance in flight activity, see Kaluza et al. 2016b). The sum of all combined category
values resulted in the plant resource abundance value calculated for each site.
We quantified the area of each landscape type (plantation, forest, garden) for each
site within the bee‘s flight radius (assuming a 500 m flight radius around each bee hive,
compare Smith et al. 2016) to compare landscape effects to effects of plant species
richness and resource abundance. The area was quantified using aerial photos obtained
by Google Earth and landscape patches were subsequently validated by ground surveys
(Kaluza et al. 2016a).
5.3.2. Hive reproduction Colonies of T. carbonaria were kept in wooden boxes (consisting of two boxes
housing the brood and an additional box used as honey super) and artificially
propagated to measure their reproductive output.
For most stingless bees, colony growth is limited by nesting space under natural
conditions (Roubik 1989; Roubik 2006). We thus provided unlimited nesting space by
performing hive splits (Heard 2016; hive: colony + wooden box) to separate resource
effects from nesting space limitations. When a hive was split, brood and food storage
were separated by a horizontal cut between the centre and bottom box and both hive
parts were then equipped with new empty boxes (either one empty bottom box, or two:
centre and super box; Figure V.1A insert). As a new queen is raised in the queen-less
half of the hive (Heard 2016), a hive split effectively creates two daughter hives of the
same lineage from one mother hive. Because of the slightly asymmetrical split, we kept
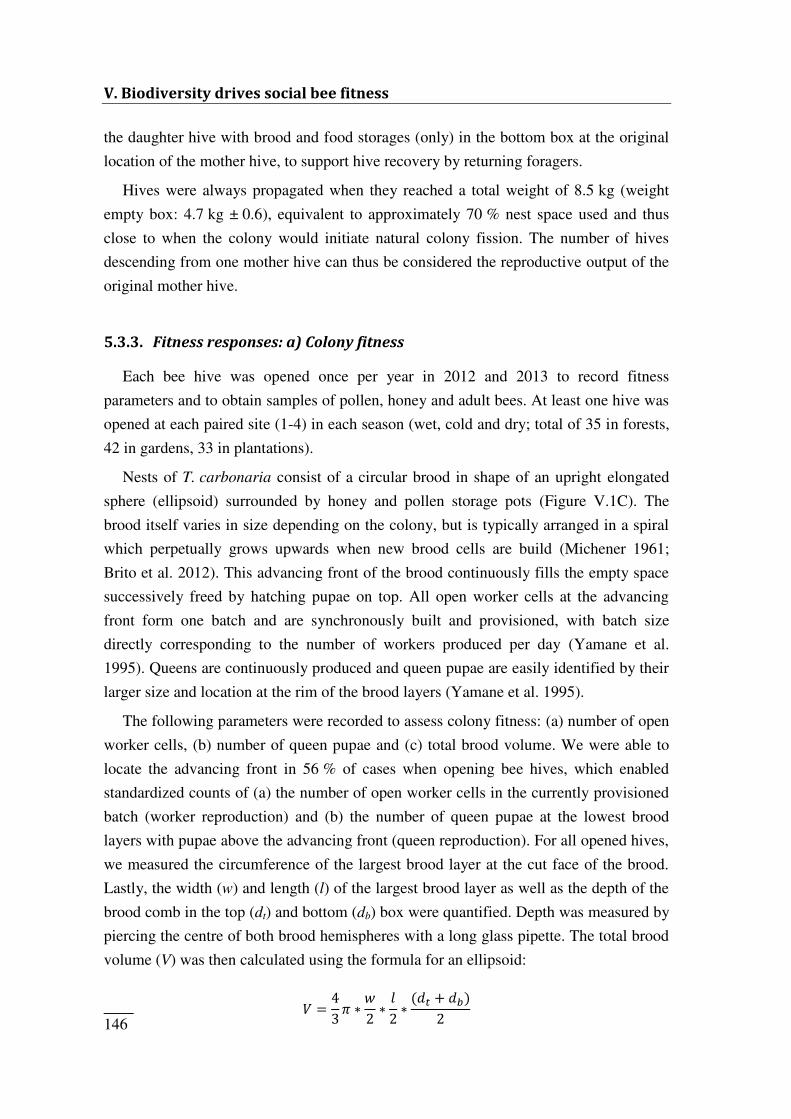
V. Biodiversity drives social bee fitness
_____ 146
the daughter hive with brood and food storages (only) in the bottom box at the original
location of the mother hive, to support hive recovery by returning foragers.
Hives were always propagated when they reached a total weight of 8.5 kg (weight
empty box: 4.7 kg ± 0.6), equivalent to approximately 70 % nest space used and thus
close to when the colony would initiate natural colony fission. The number of hives
descending from one mother hive can thus be considered the reproductive output of the
original mother hive.
5.3.3. Fitness responses: a) Colony fitness Each bee hive was opened once per year in 2012 and 2013 to record fitness
parameters and to obtain samples of pollen, honey and adult bees. At least one hive was
opened at each paired site (1-4) in each season (wet, cold and dry; total of 35 in forests,
42 in gardens, 33 in plantations).
Nests of T. carbonaria consist of a circular brood in shape of an upright elongated
sphere (ellipsoid) surrounded by honey and pollen storage pots (Figure V.1C). The
brood itself varies in size depending on the colony, but is typically arranged in a spiral
which perpetually grows upwards when new brood cells are build (Michener 1961;
Brito et al. 2012). This advancing front of the brood continuously fills the empty space
successively freed by hatching pupae on top. All open worker cells at the advancing
front form one batch and are synchronously built and provisioned, with batch size
directly corresponding to the number of workers produced per day (Yamane et al.
1995). Queens are continuously produced and queen pupae are easily identified by their
larger size and location at the rim of the brood layers (Yamane et al. 1995).
The following parameters were recorded to assess colony fitness: (a) number of open
worker cells, (b) number of queen pupae and (c) total brood volume. We were able to
locate the advancing front in 56 % of cases when opening bee hives, which enabled
standardized counts of (a) the number of open worker cells in the currently provisioned
batch (worker reproduction) and (b) the number of queen pupae at the lowest brood
layers with pupae above the advancing front (queen reproduction). For all opened hives,
we measured the circumference of the largest brood layer at the cut face of the brood.
Lastly, the width (w) and length (l) of the largest brood layer as well as the depth of the
brood comb in the top (dt) and bottom (db) box were quantified. Depth was measured by
piercing the centre of both brood hemispheres with a long glass pipette. The total brood
volume (V) was then calculated using the formula for an ellipsoid:
𝑉 𝜋 ∗ 𝑤 ∗ 𝑙 ∗ 𝑑𝑡 + 𝑑𝑏
5.3. Methods
_____ 147
5.3.4. Fitness responses: b) Individual fitness We assessed the fitness of individual bees based on body size and body fat, which is
known to correlate with the feeding status of insects (Roulston and Cane 2002;
Quezada-Euan et al. 2011).
Bee body fat was measured using a protocol adapted from Cook et al. (2010). Before
hives were opened to obtain samples (see above), we captured departing adult bees by
placing a clean clear plastic bag over the entrance hole. Captured bees were killed by
freezing and dried for 24 h at 50 °C to evaporate water and melt wax residuals. We then
pooled 15 individuals per colony and weighed and extracted the bulk sample in
chloroform for 24 h. Chloroform and dissolved lipids were removed and discarded. The
procedure was repeated three times and remaining chloroform was evaporated in a
heating cabinet for 48 h at 30 °C. The bulk sample was finally weighed again to
determine weight loss (equivalent to the weight of lipids extracted from bees).
Bee body size was assessed in November 2012 for adult bees caught within a single
season to ensure that differences in body size were related to site and not season. Ten
bees per hive (for 13 hives at plantation, 15 at forest and 12 at garden sites) were
dissected under a stereo microscope (Kyowa model SZM, Kyowa Optical Co. Ltd,
Sagamihara, Japan) and individual body parts were mounted on clay. Head length and
width, mesonotum length and width, upper and lower interocular distance as well as
intertegular distance were measured (in mm) as biometric parameters (Cane 1987;
Nagamitsu and Inoue 1998; Quezada-Euan et al. 2011). A principal component analysis
(PCA) was performed on all biometric parameters and the first axis (explaining 61 % of
the variance across samples) was determined as a single parameter describing body size.
5.3.5. Food quantity and quality We quantified total food stored in hives and recorded quality measures to understand
how colony and individual fitness was related to the amount and quality of resources
collected by the workers per hive. The total quantity of food available within hives was
estimated by weighing the whole hive, as overall colony weight is largely determined
by food storage (about 80 % of total weight; Heard 2016). Tetragonula carbonaria
stores honey and pollen in separate pots (Michener 1961), which allowed us to collect
and mix honey and pollen samples from 1-10 pots of varying age per hive to reflect
average food quality.
Honey samples were analysed for their sucrose and water content using hand-held
V. Biodiversity drives social bee fitness
_____ 148
refractometers (sucrose: Eclipse Refractometer, Bellingham + Stanley Ltd.,
Lawrenceville, USA; water: HHR-2N Honey Refractometer, ATAGO Co. Ltd., Tokyo,
Japan). Acidity of the honey was measured using standard pH-test strips.
Amino acid content in pollen samples was analysed by ion exchange
chromatography (IEC: Biotronik, amino acid analyser LC 3000) as described in Kaluza
et al. (2016b) and Leonhardt and Blüthgen (2012). The amino acid concentration (mg/g)
was calculated using the molar mass of respective amino acids. Methionine, arginine,
lysine, isoleucine, leucine, phenylalanine, histidine, valine and threonine were
considered essential amino acids for bees. We additionally included proline in our
analysis because of its importance for the flight muscle metabolism in adult bees (de
Groot 1953; Micheu et al. 2000). A PCA was performed on all detected single amino
acids and the first axis (explaining 80 % of the variance across samples) implemented in
further statistical analysis (see SM V.1). We additionally used the sum of total protein
(mg/g) and the sum of essential amino acids (mg/g) as response variables in the
statistical analysis, as bees appear to be primarily affected by overall protein content
rather than amino acid composition of pollen (reviewed by Ruedenauer et al. 2015).
We further performed a stoichiometric analysis on pollen following Minden and
Kleyer (2014). All pollen material was milled at 300–400 revolutions (‗pulverisette 7‘; Fritsch, Idar-Oberstein, Germany) and dried at 70 °C for 4–5 h. In order to analyse
carbon and nitrogen (C and N) 2–3 mg of material was placed in tin tubes (0.1 mg
precision balance CP 225 D; Sartorius, Göttingen, Germany) and analysed using a
CHNS Analyser Flash EA (Thermo Electron Corp., Waltham, MA, USA). All other
elements (K, S, Mg, Ca, Na, P, Fe, B, Cu) were analysed using optical emission
spectrometry with inductively coupled plasma (iCAP 6000, Thermo Scientific), for
which 8-10 mg material was processed with nitric acid and hydrogen peroxide and
subsequently measured following Murphy and Riley (1962). Micro-nutrients were also
analysed as one combined factor, i.e. the first axis of a PCA (explaining 87 % of the
variance across samples) comprising all elements except P, N and C, which were
entered as separate factors in subsequent analyses (see SM V.1).
5.3.6. Statistical analysis We composed a correlation matrix to identify correlations between all recorded
variables, for explanatory variables (related to (a) biodiversity and (b) food resource
quantity and quality) and response variables (related to (c) colony and (d) individual
fitness; SM V.2). We performed separate models for plant species richness and
5.3. Methods
_____ 149
landscape areas to determine which variable provided more explanatory power in
describing hive reproduction (SM V.3), because plant species richness was positively
correlated with garden area, and negatively correlated with forest and plantation area
(SM V.2). Plant species richness explained the observed variance best and was therefore
tested in all subsequent analyses.
We used generalized linear mixed effect models (GLMM) to analyse the effect of
fixed explanatory variables and random effects on colony fitness (i.e. hive reproduction,
brood volume, queen reproduction, and worker reproduction) and individual fitness (i.e.
worker body fat and worker body size). Because of co-variation between explanatory
variables, we again performed separate analyses for biodiversity and resource related
variables (SM V.2). In a first step, the effect of biodiversity-related explanatory
variables (i.e. landscape types, plant species richness and resource abundance) on fitness
response variables was tested (biodiversity models). In a second step, the effect of
explanatory variables related to food resource quantity and quality (i.e. weight of pollen
and honey storage, total protein in pollen and sucrose concentration in honey) was
tested on the same fitness variables when recorded for the same day (i.e. brood volume,
queen reproduction, worker reproduction and worker body fat).
We always started with the most complex model which included all explanatory
variables and their interactions, followed by step-wise simplification of models by
excluding interactions and variables. Model quality was evaluated using Akaike‘s Information Criterion (AIC), and the model with the lowest AIC value was considered
the model with the highest explanatory value. Model selection was further confirmed by
testing whether individual explanatory variables (remaining in the most parsimonious
models) explained a significant proportion of the overall variance by comparing the
model with a given explanatory variable to the same model without this variable (anova
command in the lme4 package which compares two nested models using REML scores;
library lme4: Bates et al. 2011). In order to compare effects of different explanatory
variables on specific response variables, the explained variance (R²) of the best model
following AIC selection was calculated as described by Nakagawa and Schielzeth
(2013), and compared between models (library MuMIn: Bartoń 2013).
Hive reproduction and queen reproduction were entered in GLMMs using a Poisson
distribution. All other response variables (brood volume, worker reproduction, worker
body fat and size) were analysed by GLMMs with Gaussian distribution. Variables were
square root transformed where necessary (brood volume) to achieve normality. Hive
was nested within site and entered as a random effect in all models (with the exception
of hive reproduction: only site) to account for the nested study design. Variation
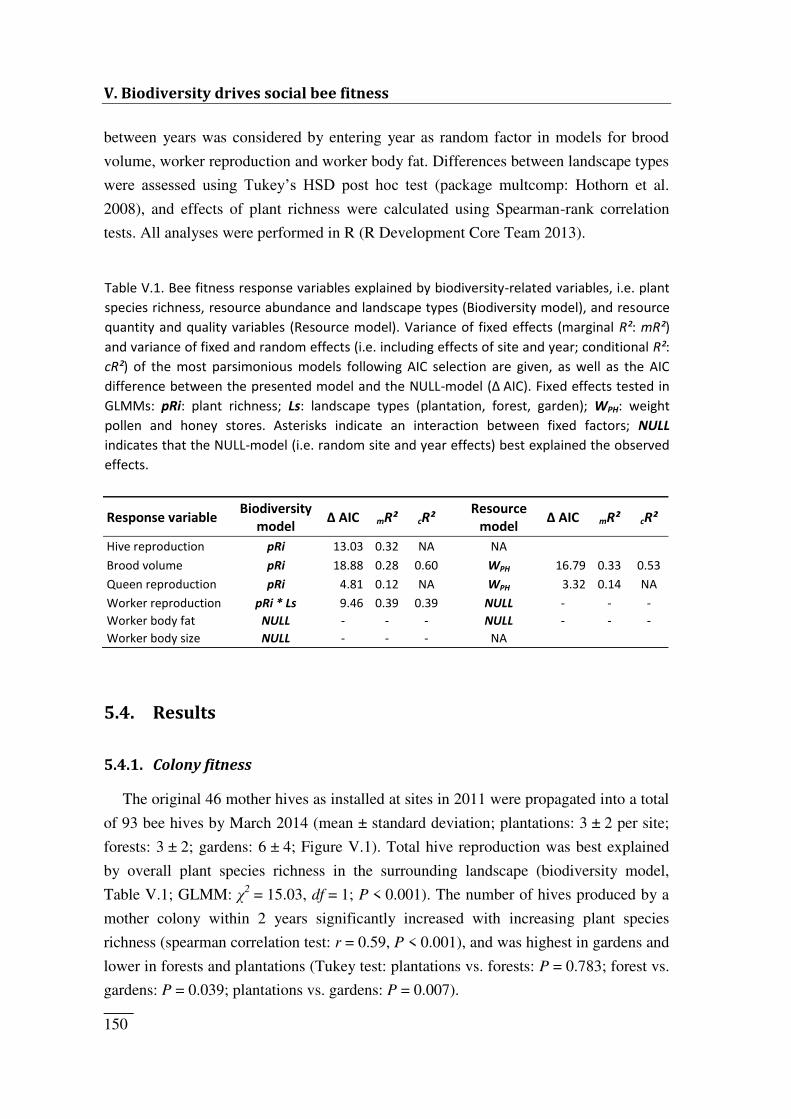
V. Biodiversity drives social bee fitness
_____ 150
between years was considered by entering year as random factor in models for brood
volume, worker reproduction and worker body fat. Differences between landscape types
were assessed using Tukey‘s HSD post hoc test (package multcomp: Hothorn et al.
2008), and effects of plant richness were calculated using Spearman-rank correlation
tests. All analyses were performed in R (R Development Core Team 2013).
5.4. Results 5.4.1. Colony fitness
The original 46 mother hives as installed at sites in 2011 were propagated into a total
of 93 bee hives by March 2014 (mean ± standard deviation; plantations: 3 ± 2 per site;
forests: 3 ± 2; gardens: 6 ± 4; Figure V.1). Total hive reproduction was best explained
by overall plant species richness in the surrounding landscape (biodiversity model,
Table V.1; GLMM: χ2 = 15.03, df = 1; P < 0.001). The number of hives produced by a
mother colony within 2 years significantly increased with increasing plant species
richness (spearman correlation test: r = 0.59, P < 0.001), and was highest in gardens and
lower in forests and plantations (Tukey test: plantations vs. forests: P = 0.783; forest vs.
gardens: P = 0.039; plantations vs. gardens: P = 0.007).
Table V.1. Bee fitness response variables explained by biodiversity-related variables, i.e. plant species richness, resource abundance and landscape types (Biodiversity model), and resource quantity and quality variables (Resource model). Variance of fixed effects (marginal R²: mR²) and variance of fixed and random effects (i.e. including effects of site and year; conditional R²: cR²) of the most parsimonious models following AIC selection are given, as well as the AIC difference between the presented model and the NULL- odel (Δ AIC). Fixed effects tested in GLMMs: pRi: plant richness; Ls: landscape types (plantation, forest, garden); WPH: weight pollen and honey stores. Asterisks indicate an interaction between fixed factors; NULL indicates that the NULL-model (i.e. random site and year effects) best explained the observed effects. Response variable Biodiversity model Δ AIC mR² cR² Resource model Δ AIC mR² cR² Hive reproduction pRi 13.03 0.32 NA NA Brood volume pRi 18.88 0.28 0.60 WPH 16.79 0.33 0.53 Queen reproduction pRi 4.81 0.12 NA WPH 3.32 0.14 NA Worker reproduction pRi * Ls 9.46 0.39 0.39 NULL - - - Worker body fat NULL - - - NULL - - - Worker body size NULL - - - NA
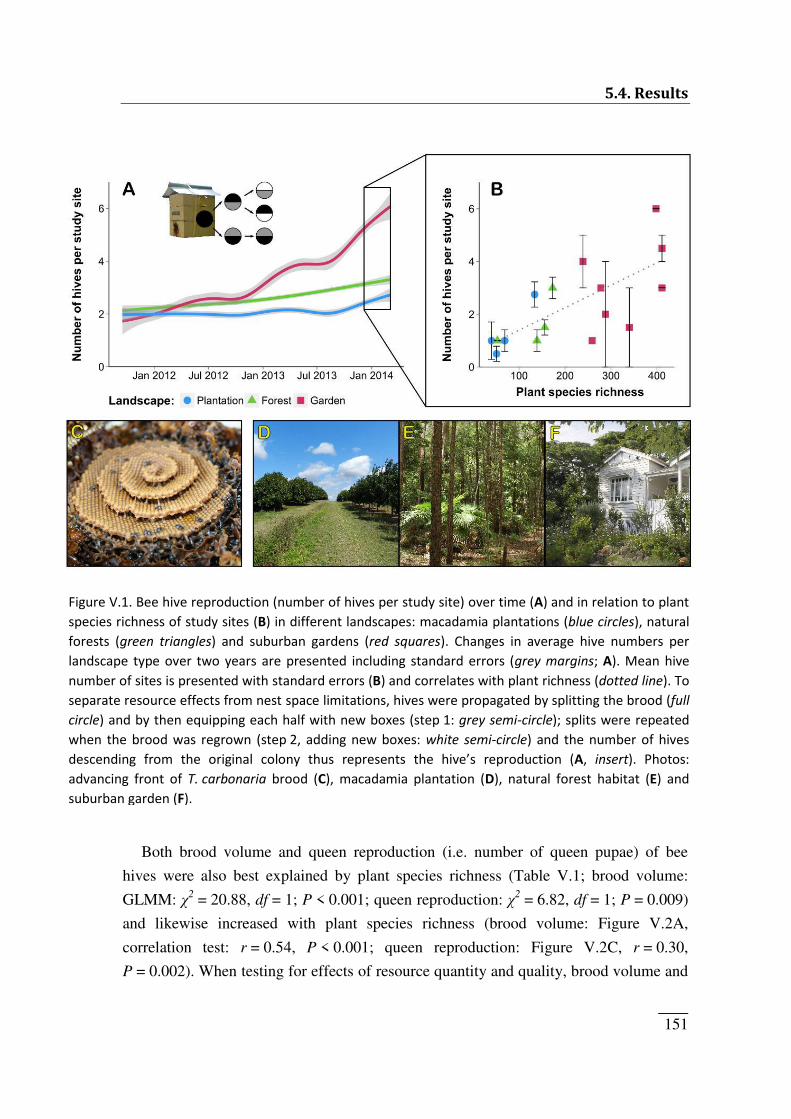
5.4. Results
_____ 151
Both brood volume and queen reproduction (i.e. number of queen pupae) of bee
hives were also best explained by plant species richness (Table V.1; brood volume:
GLMM: χ2 = 20.88, df = 1; P < 0.001; queen reproduction: χ2 = 6.82, df = 1; P = 0.009)
and likewise increased with plant species richness (brood volume: Figure V.2A,
correlation test: r = 0.54, P < 0.001; queen reproduction: Figure V.2C, r = 0.30,
P = 0.002). When testing for effects of resource quantity and quality, brood volume and
Figure V.1. Bee hive reproduction (number of hives per study site) over time (A) and in relation to plant species richness of study sites (B) in different landscapes: macadamia plantations (blue circles), natural forests (green triangles) and suburban gardens (red squares). Changes in average hive numbers per landscape type over two years are presented including standard errors (grey margins; A). Mean hive number of sites is presented with standard errors (B) and correlates with plant richness (dotted line). To separate resource effects from nest space limitations, hives were propagated by splitting the brood (full circle) and by then equipping each half with new boxes (step 1: grey semi-circle); splits were repeated when the brood was regrown (step 2, adding new boxes: white semi-circle) and the number of hives des e di g fro the origi al olo thus represe ts the hi e’s reprodu tio (A, insert). Photos: advancing front of T. carbonaria brood (C), macadamia plantation (D), natural forest habitat (E) and suburban garden (F).
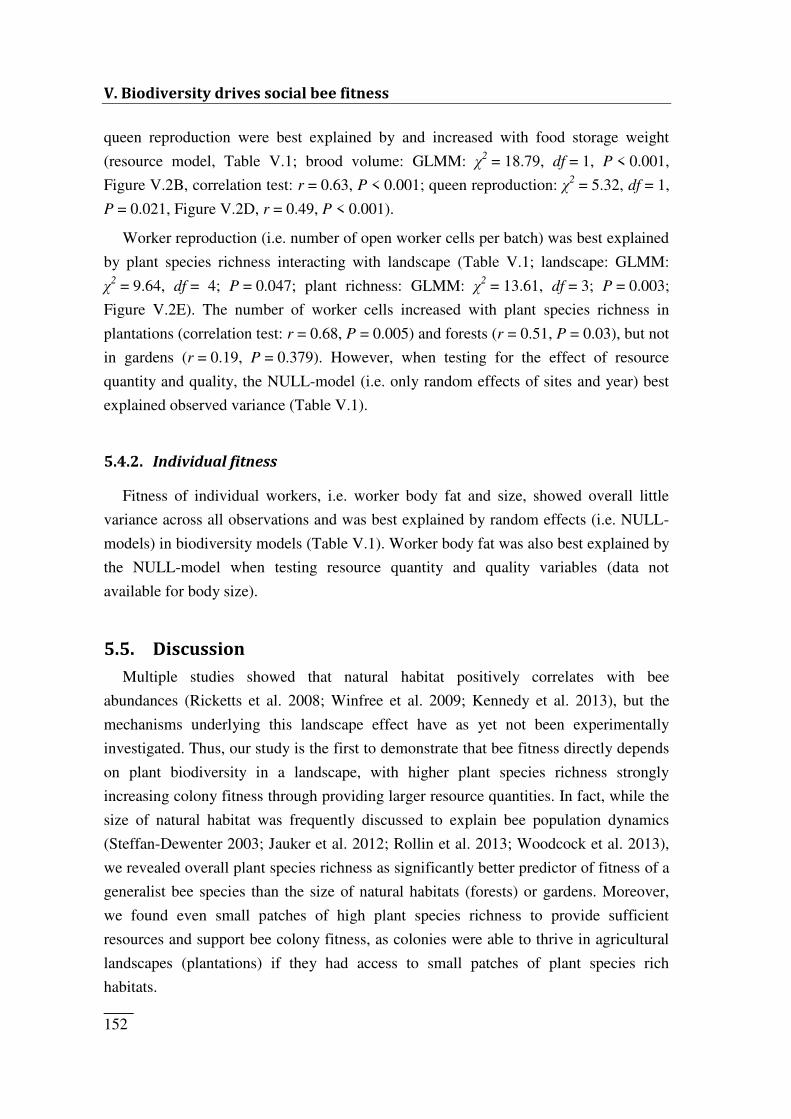
V. Biodiversity drives social bee fitness
_____ 152
queen reproduction were best explained by and increased with food storage weight
(resource model, Table V.1; brood volume: GLMM: χ2 = 18.79, df = 1, P < 0.001,
Figure V.2B, correlation test: r = 0.63, P < 0.001; queen reproduction: χ2 = 5.32, df = 1,
P = 0.021, Figure V.2D, r = 0.49, P < 0.001).
Worker reproduction (i.e. number of open worker cells per batch) was best explained
by plant species richness interacting with landscape (Table V.1; landscape: GLMM:
χ2 = 9.64, df = 4; P = 0.047; plant richness: GLMM: χ2 = 13.61, df = 3; P = 0.003;
Figure V.2E). The number of worker cells increased with plant species richness in
plantations (correlation test: r = 0.68, P = 0.005) and forests (r = 0.51, P = 0.03), but not
in gardens (r = 0.19, P = 0.379). However, when testing for the effect of resource
quantity and quality, the NULL-model (i.e. only random effects of sites and year) best
explained observed variance (Table V.1).
5.4.2. Individual fitness Fitness of individual workers, i.e. worker body fat and size, showed overall little
variance across all observations and was best explained by random effects (i.e. NULL-
models) in biodiversity models (Table V.1). Worker body fat was also best explained by
the NULL-model when testing resource quantity and quality variables (data not
available for body size).
5.5. Discussion Multiple studies showed that natural habitat positively correlates with bee
abundances (Ricketts et al. 2008; Winfree et al. 2009; Kennedy et al. 2013), but the
mechanisms underlying this landscape effect have as yet not been experimentally
investigated. Thus, our study is the first to demonstrate that bee fitness directly depends
on plant biodiversity in a landscape, with higher plant species richness strongly
increasing colony fitness through providing larger resource quantities. In fact, while the
size of natural habitat was frequently discussed to explain bee population dynamics
(Steffan-Dewenter 2003; Jauker et al. 2012; Rollin et al. 2013; Woodcock et al. 2013),
we revealed overall plant species richness as significantly better predictor of fitness of a
generalist bee species than the size of natural habitats (forests) or gardens. Moreover,
we found even small patches of high plant species richness to provide sufficient
resources and support bee colony fitness, as colonies were able to thrive in agricultural
landscapes (plantations) if they had access to small patches of plant species rich
habitats.
5.4. Results
_____ 153
Figure V.2. Bee colony fitness parameters in relation to plant species richness (A, C, E) and total food quantity (B, D, F) in landscapes (plantation, forests and gardens). For plant species richness, means and standard errors are given per study site for all observations made during a two year period. Colony response variables were total brood volume, queen reproduction (number of queen pupae per hive observation) and worker reproduction (number of provisioned worker cells per hive observation). Dotted lines indicate significant correlations according to Spearman correlation tests.
V. Biodiversity drives social bee fitness
_____ 154
5.5.1. Colony fitness Colony reproduction of T. carbonaria increased with plant species richness, and
colony growth rates over time were almost exponential in landscapes with highest plant
species richness (gardens). Likewise, brood volume increased with plant species
richness, i.e. bee hives developed a larger forager population in landscapes with high
plant species richness. Such a positive effect of plant species diversity on social bee
colony growth (particularly in gardens) has also been shown for bumble bees in
temperate climates (Goulson et al. 2002). Higher plant species richness, i.e. plant
biodiversity, typically provides a broader spectrum of foraging resources, particularly in
anthropogenically changed landscapes (e.g. gardens), because generalist bee foragers
utilize resources from both native and exotic flowering plants (Tepedino et al. 2008;
Stout and Morales 2009; Williams et al. 2011). High levels of plant diversity (as
typically found in diverse environments) offer more foraging choices which are
exploited by generalist bee species (Jha et al. 2013; Requier et al. 2015; Kaluza et al.
2016b). This allows bees to dilute toxic plant compounds or combine pollen from a
variety of plants to maintain a nutritionally balanced diet (Williams and Tepedino 2003;
Eckhardt et al. 2014; Irwin et al. 2014), which facilitates bee health (Alaux et al. 2010;
Höcherl et al. 2012). Plant diversity may further indirectly benefit bees, because higher
plant diversity positively correlates with a habitat‘s biomass and thus flower production
(Duffy et al. 2007). Landscapes with higher plant diversity can also offer a wider range
of flowering phenologies, thus providing a continuous floral resource supply across
seasons which can bridge periods with otherwise low resource availability (Blüthgen
and Klein 2011; Williams et al. 2012).
In contrast to plant species richness, resource abundance had a much weaker effect
on bee fitness. Resource abundance in the surrounding landscape can directly limit
foraging and reproduction of solitary and social bee species (Biesmeijer et al. 1999;
Mattila and Otis 2006; Larsson and Franzén 2007; Westphal et al. 2009). However, note
that the resource abundance measure used in our study estimates total resource
abundance over the year and is independent of plant species richness. It strongly weighs
abundant and large plant species over rare or herbaceous plants, thereby rating forests
higher than gardens (Kaluza et al. 2016b). Thus, resource abundance can be high at sites
with comparatively low plant species richness and high resource supply and bee colony
resource intake may consequently be confined to specific time periods or seasons (e.g.
macadamia flowering in the dry season; Kaluza et al. 2016a). The strong influence of
plant species richness, but not resource abundance, as found in this study, consequently
reveals that a continuous resource supply (as typically provided in biodiverse habitats)
5.4. Results
_____ 155
is more important than overall food resource abundance.
In fact, Kaluza et al. (2016a) showed that T. carbonaria doubled its resource intake
in highly diverse habitats (e.g. gardens) by increasing the hive‘s foraging activity compared to their natural environment (forests). This positive relationship between
continuous resource supply and continuous resource intake in diverse landscapes most
likely explains why brood volume was strongly determined by food quantity, which was
also observed by Greco et al. (2011) for T. carbonaria. It shows that increased food
storages allow colonies to rear and maintain a larger population, which in turn enhances
foraging success (Figure V.3).
Moreover, like brood volume, queen reproduction also increased with plant species
richness and the amount of food storage. Hitherto, most studies investigating colony
fitness and associated queen reproduction focused on bumble bees (Goulson et al. 2002;
Elliott 2009; Westphal et al. 2009; Williams et al. 2012), which show a specific
seasonal life cycle. Bumble bees colonies grow by first producing cohorts of workers,
until they switch to invest food storages into the production of males and queens
towards the end of the flowering season (Crone and Williams 2016), which renders
direct comparisons between bumble bees to other (tropical) social bees difficult. In
contrast, most stingless bee colonies produce gynes (unmated queens) continuously
throughout the year (Roubik 1989; van Veen and Sommeijer 2000; Sommeijer et al.
2003), and mechanisms which trigger or increase queen rearing in stingless bees are still
largely unclear (Tarpy and Gilley 2004). Moo-Valle et al. (2001) showed that colonies
which were artificially deprived of food reserves produced fewer queens, while
increasing food reserves had no (positive) influence. Our study shows for the first time,
that, under natural conditions, queen reproduction is indeed linked to food quantity in
the nest, as suggested by Tarpy and Gilley (2004), indicating that stingless bee colonies
significantly increase the number of the most costly and most important reproductives
(likely in preparation of colony fission) in response to greater food storages in resource
rich environments.
Interestingly, worker reproduction also increased with increasing plant species
richness in plantations and forests, but did not increase further with higher plant species
richness in gardens and was overall independent of resource quantity or quality. Worker
reproduction is likely limited by batch size which may in turn be limited by brood
architecture (i.e. form of the brood comb), as worker reproduction was positively
correlated with brood circumference, but not with total brood volume. It thus seems
likely that, when a given batch size is reached, T. carbonaria cannot further increase
batch size in highly resource rich locations (e.g. gardens), but switches to provision
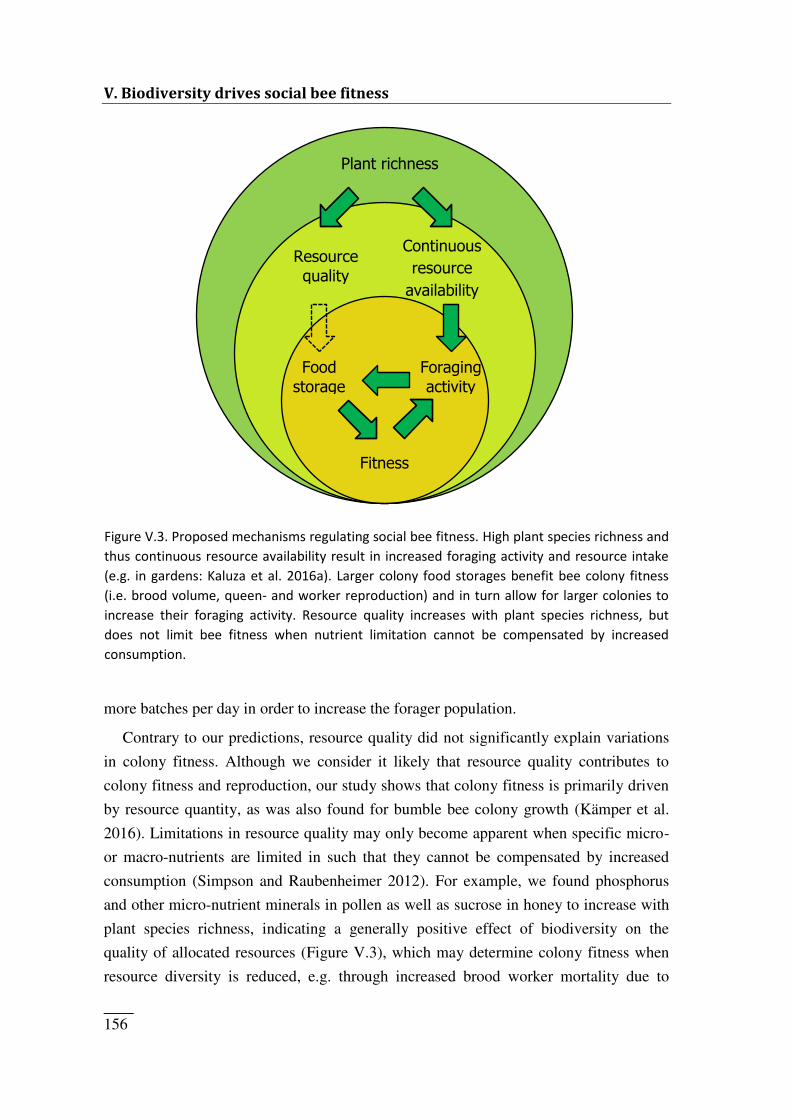
V. Biodiversity drives social bee fitness
_____ 156
more batches per day in order to increase the forager population.
Contrary to our predictions, resource quality did not significantly explain variations
in colony fitness. Although we consider it likely that resource quality contributes to
colony fitness and reproduction, our study shows that colony fitness is primarily driven
by resource quantity, as was also found for bumble bee colony growth (Kämper et al.
2016). Limitations in resource quality may only become apparent when specific micro-
or macro-nutrients are limited in such that they cannot be compensated by increased
consumption (Simpson and Raubenheimer 2012). For example, we found phosphorus
and other micro-nutrient minerals in pollen as well as sucrose in honey to increase with
plant species richness, indicating a generally positive effect of biodiversity on the
quality of allocated resources (Figure V.3), which may determine colony fitness when
resource diversity is reduced, e.g. through increased brood worker mortality due to
Figure V.3. Proposed mechanisms regulating social bee fitness. High plant species richness and thus continuous resource availability result in increased foraging activity and resource intake (e.g. in gardens: Kaluza et al. 2016a). Larger colony food storages benefit bee colony fitness (i.e. brood volume, queen- and worker reproduction) and in turn allow for larger colonies to increase their foraging activity. Resource quality increases with plant species richness, but does not limit bee fitness when nutrient limitation cannot be compensated by increased consumption.
Resource quality Continuous resource availability
Plant richness
Food storage Foraging activity Fitness
5.4. Results
_____ 157
nutritionally unbalanced cell provisions. Moreover, while we covered several quality
measures for pollen and honey, we may have overlooked other important indicators of
resource quality (e.g. antioxidants: Di Pasquale et al. 2013; sterols: Vanderplanck et al.
2014) or the effect of other non-food resources (e.g. resin: Drescher et al. 2014).
5.5.2. Individual fitness Despite known positive effects of resource quantity and quality on worker body size,
we found no effect of plant species richness and food storage on body size. Higher
protein content and, to a lesser degree, increased pollen quantities (consumed by bee
larvae) can increase offspring size in solitary bees and determine body weight and size
in stingless bee workers (Roulston and Cane 2002; Quezada-Euan et al. 2011; Pech-
May et al. 2012), which in turn increases the foraging range of workers (Araújo et al.
2004; Kuhn-Neto et al. 2009). Body fat can vary largely across workers, but was found
to be inversely linked to worker size (mass) in bumble bees, where smaller bees possess
proportionally more lipids (Couvillon et al. 2011). However in our study, body size was
highly conserved across sites and thus landscapes with varying resource diversity.
Likewise, worker body fat content was similar across sites over the entire year, and did
not depend on resource quantity or quality.
Stingless bees, unlike honey bees or bumble bees, do not progressively feed brood,
but mass provision cells and then seal them for the duration of the larval development
(Michener 2007). Moreover, in honey bees, larval food is mainly of glandular origin,
which may explain the relatively uniform size of adult honey bee workers compared to
other bee taxa (Huang and Otis 1991; Roulston and Cane 2002). In contrast, stingless
bees provision brood cells with honey and pollen directly, and food resources may thus
influence worker size more strongly (Quezada-Euan et al. 2011). It is however
unknown, whether stingless bees are able to assess the nutritional quality of larval food
or target a fixed food volume per brood cell to determine the amount of food per cell
necessary to rear a healthy bee. While we observed only minor variations in worker
body fat and size with changing resource quantity and quality, overall colony brood
volume increased with overall food storage levels. We therefore propose that
T. carbonaria, and maybe other social bee species, do not adjust food quality or
quantity per cell when facing resource limitations, but rather regulate the overall amount
of brood produced.

V. Biodiversity drives social bee fitness
_____ 158
5.5.3. Conclusions This study is the first to experimentally demonstrate that social bee colony fitness is
driven by biodiversity, i.e. plant species richness, in the surrounding habitat. Even small
patches with high plant species richness (e.g. in gardens or plantations) provide a
continuous supply in floral resources, to which bees respond with increasing resource
intake and growing colony food storages, leading to increased queen-, worker- and
ultimately hive reproduction. Though bee fitness was not limited by resource quality in
this study, quality of food storage also increased with plant species richness. Fitness of
individual workers was not affected by resource quality and quantity, and we propose
that T. carbonaria (and potentially other social bees) do not alter the investment per
brood cell, but rather regulate the overall amount of brood produced when food is
limited. This highlights the importance of biodiversity as a key driver of (social) bee
fitness through providing more and continuous foraging resources.
5.6. Acknowledgments The authors thank Rhys Smith, Julia Nagler, Manuel Pützstück, Birte Hensen, Mia
Kaluza and Marvin Schäfer for assistance with field work and Andrea Hilpert for
analysing pollen amino acid profiles. We thank Sahara Farms, Macadamia Farm
Management Pty Ltd and Maroochy Bushland Botanic Gardens, as well as numerous
private land and garden owners who hosted our bee hives. Photos with courtesy of Brad
Jeffers, Manuel Pützstück and Marvin Schäfer. BFK received funding from the German
Academic Exchange Agency (DAAD). Funding was provided by the Deutsche
Forschungs-Gemeinschaft (DFG project: LE 2750/1-1).
5.7. References
_____ 159
5.7. References Alaux, C., F. Ducloz, D. Crauser and Y. Le Conte (2010). "Diet effects on honeybee
immunocompetence". Biology Letters: doi: 10.1098/rsbl.2009.0986.
Araújo, E.D., M. Costa, J. Chaud-Netto and H.G. Fowler (2004). "Body size and flight distance
in stingless bees (Hymenoptera: Meliponini): inference of flight range and possible
ecological implications". Brazilian Journal of Biology, 64: 563-568.
Bartoń, K. (2013). "MuMIn: Multi-model inference". R package version 1.9.13. Available at:
http://CRAN.R-project.org/package=MuMIn.
Bates, D., M. Mächler and B. Bolker (2011). "lme4: Linear mixed-effects models using S4
classes". R package version 0.999375-42. Available at: http://CRAN.R-
project.org/package=lme4.
Biesmeijer, J.C., M. Born, S. Lukacs and M.J. Sommeijer (1999). "The response of the stingless
bee Melipona beecheii to experimental pollen stress, worker loss and different levels of
information input". Journal of Apicultural Research, 38(1-2): 33-41.
Biesmeijer, J.C., S.P.M. Roberts, M. Reemer, R. Ohlemuller, M. Edwards, T. Peeters, (...) W.E.
Kunin (2006). "Parallel declines in pollinators and insect-pollinated plants in Britain
and the Netherlands". Science, 313(5785): 351-354.
Blüthgen, N. and A.M. Klein (2011). "Functional complementarity and specialisation: Why
biodiversity is important in plant-pollinator interactions.". Basic and Applied Ecology,
12: 282-291.
Brito, R.M., T.M. Schaerf, M.R. Myerscough, T.A. Heard and B.P. Oldroyd (2012). "Brood
comb construction by the stingless bees Tetragonula hockingsi and Tetragonula
carbonaria". Swarm Intelligence, 6(2): 151-176.
Brodschneider, R. and K. Crailsheim (2010). "Nutrition and health in honey bees". Apidologie,
41(3): 278-294.
Cameron, S.A., J.D. Lozier, J.P. Strange, J.B. Koch, N. Cordes, L.F. Solter and T.L. Griswold
(2011). "Patterns of widespread decline in North American bumble bees". Proceedings
of the National Academy of Sciences of the United States of America, 108(2): 662-667.
Cane, J.H. (1987). "Estimation of bee size using intertegular span (Apoidea)". Journal of the
Kansas Entomological Society, 60(1): 145-147.
Cook, S.C., M.D. Eubanks, R.E. Gold and S.T. Behmer (2010). "Colony-level macronutrient
regulation in ants: mechanisms, hoarding and associated costs". Animal Behaviour,
79(2): 429-437.
Couvillon, M.J., J.M. Jandt, J. Bonds, B.R. Helm and A. Dornhaus (2011). "Percent lipid is
associated with body size but not task in the bumble bee Bombus impatiens". Journal of
Comparative Physiology A, 197(11): 1097-1104.
V. Biodiversity drives social bee fitness
_____ 160
Crone, E.E. and N.M. Williams (2016). "Bumble bee colony dynamics: quantifying the
importance of land use and floral resources for colony growth and queen production".
Ecology Letters, 19(4): 460-468.
de Groot, A.P. (1953). "Protein and amino acid requirements of the honey bee (Apis mellifera
L.)". Physiologia Comparata et Oecologia, 3(2/3): 197-285.
Di Pasquale, G., M. Salignon, Y. Le Conte, L.P. Belzunces, A. Decourtye, A. Kretzschmar, (...)
C. Alaux (2013). "Influence of pollen nutrition on honey bee health: do pollen quality
and diversity matter?". Plos One, 8(8): e72016.
Drescher, N., H.M. Wallace, M. Katouli, C.F. Massaro and S.D. Leonhardt (2014). "Diversity
matters: how bees benefit from different resin sources". Oecologia, 176(4): 943-953.
Duffy, J.E., B.J. Carinale, K.E. France, P.B. McIntyre, E. Thebault and M. Loreau (2007). "The
functional role of biodiversity in ecosystems: incorporating trophic complexity".
Ecology Letters, 10(6): 522-538.
Eckhardt, M., M. Haider, S. Dorn and A. Muller (2014). "Pollen mixing in pollen generalist
solitary bees: a possible strategy to complement or mitigate unfavourable pollen
properties?". Journal of Animal Ecology, 83(3): 588-597.
Elliott, S.E. (2009). "Surplus nectar available for subalpine bumble bee colony growth".
Environmental Entomology, 38(6): 1680-1689.
Garibaldi, L.A., I. Steffan-Dewenter, R. Winfree, M.A. Aizen, R. Bommarco, S.A.
Cunningham, (...) A.M. Klein (2013). "Wild pollinators enhance fruit set of crops
regardless of honey bee abundance". Science, 339(6127): 1608-1611.
Gill, R.J., K.C.R. Baldock, M.J.F. Brown, J.E. Cresswell, L.V. Dicks, M.T. Fountain, (...) S.G.
Potts (2016). "Chapter Four - Protecting an ecosystem service: approaches to
understanding and mitigating threats to wild insect pollinators".54: pp 135-206.in Guy,
W and AB David, Advances in Ecological Research. Academic Press.
González-Varo, J.P., J.C. Biesmeijer, R. Bommarco, S.G. Potts, O. Schweiger, H.G. Smith, (...)
M. Vilà (2013). "Combined effects of global change pressures on animal-mediated
pollination". Trends in Ecology and Evolution, 28(9): 524-530.
Goulson, D., W.O.H. Hughes, L.C. Derwent and J.C. Stout (2002). "Colony growth of the
bumblebee, Bombus terrestris, in improved and conventional agricultural and suburban
habitats". Oecologia, 130(2): 267-273.
Goulson, D., E. Nicholls, C. Botías and E.L. Rotheray (2015). "Bee declines driven by
combined stress from parasites, pesticides, and lack of flowers". Science, 347(6229).
Grace, J.B., T.M. Anderson, E.W. Seabloom, E.T. Borer, P.B. Adler, W.S. Harpole, (...) M.D.
Smith (2016). "Integrative modelling reveals mechanisms linking productivity and plant
species richness". Nature, 529(7586): 390-393.
5.7. References
_____ 161
Greco, M.K., R.N. Spooner-Hart, A. Beattie, I. Barchia and P. Holford (2011). "Australian
stingless bees improve greenhouse Capsicum production". Journal of Apicultural
Research, 50(2): 102-115.
Heard, T.A. (2016). "The Australian native bee book. Keeping stingless bee hives for pets,
pollination and sugarbag hone". Sugarbag Bees, Brisbane.
Hines, H.M. and S.D. Hendrix (2005). "Bumble bee (Hymenoptera: Apidae) diversity and
abundance in tallgrass prairie patches: effects of local and landscape floral resources".
Environmental Entomology, 34: 1477-1484.
Höcherl, N., R. Siede, I. Illies, H. Gätschenberger and J. Tautz (2012). "Evaluation of the
nutritive value of maize for honey bees". Journal of Insect Physiology, 58(2): 278-285.
Hothorn, T., F. Bretz and P. Westfall (2008). "Simultaneous inference in general parametric
models". Biometrical Journal, 50(3): 346-363.
Huang, Z.-Y. and G.W. Otis (1991). "Inspection and feeding of larvae by worker honey bees
(Hymenoptera: Apidae): Effect of starvation and food quantity". Journal of Insect
Behavior, 4(3): 305-317.
Hülsmann, M., H. von Wehrden, A.-M. Klein and S. Leonhardt (2015). "Plant diversity and
composition compensate for negative effects of urbanization on foraging bumble bees".
Apidologie: 1-11.
Irwin, R.E., D. Cook, L.L. Richardson, J.S. Manson and D.R. Gardner (2014). "Secondary
compounds in floral rewards of toxic rangeland plants: impacts on pollinators". Journal
of Agricultural and Food Chemistry, 62(30): 7335-7344.
Jauker, F., F. Peter, V. Wolters and T. Diekötter (2012). "Early reproductive benefits of mass-
flowering crops to the solitary bee Osmia rufa outbalance post-flowering
disadvantages". Basic and Applied Ecology, 13(3): 268-276.
Jha, S. and C. Kremen (2013). "Resource diversity and landscape-level homogeneity drive
native bee foraging". Proceedings of the National Academy of Sciences of the United
States of America, 110(2): 555-558.
Jha, S., L. Stefanovich and C. Kremen (2013). "Bumble bee pollen use and preference across
spatial scales in human-altered landscapes". Ecological Entomology, 38(6): 570-579.
Kaluza, B.F., H. Wallace, T.A. Heard, A.-M. Klein and S.D. Leonhardt (2016a). "Urban
gardens promote bee foraging over natural habitats and plantations". Ecology and
Evolution, 6(5): 1304-1316.
Kaluza, B.F., H. Wallace, A. Keller, T.A. Heard, B. Jeffers, N. Drescher, (...) S.D. Leonhardt
(2016b). "Generalist social bees maximize diversity intake in plant species-rich and
resource-abundant environments". Ecosphere, (in press).
Kämper, W., P.K. Werner, A. Hilpert, C. Westphal, N. Blüthgen, T. Eltz and S.D. Leonhardt
(2016). "How landscape, pollen intake and pollen quality affect colony growth in
Bombus terrestris". Landscape Ecology, 31(10): 2245-2258.
V. Biodiversity drives social bee fitness
_____ 162
Kennedy, C.M., E. Lonsdorf, M.C. Neel, N.M. Williams, T.H. Ricketts, R. Winfree, (...) C.
Kremen (2013). "A global quantitative synthesis of local and landscape effects on wild
bee pollinators in agroecosystems". Ecology Letters, 16(5): 584-599.
Klein, A.-M., B.E. Vaissiere, J.H. Cane, I. Steffan-Dewenter, S.A. Cunningham, C. Kremen and
T. Tscharntke (2007). "Importance of pollinators in changing landscapes for world
crops". Proceedings of the Royal Society B: Biological Sciences, 274(1608): 303-313.
Kuhn-Neto, B., F.A.L. Contrera, M.S. Castro and J.C. Nieh (2009). "Long distance foraging and
recruitment by a stingless bee, Melipona mandacaia". Apidologie, 40(4): 472-480.
Larsson, M. and M. Franzén (2007). "Critical resource levels of pollen for the declining bee
Andrena hattorfiana (Hymenoptera, Andrenidae)". Biological Conservation, 134(3):
405-414.
Leonhardt, S.D. and N. Blüthgen (2012). "The same, but different: pollen foraging in honeybee
and bumblebee colonies". Apidologie, 43: 449-464.
Leonhardt, S.D., T.A. Heard and H. Wallace (2014). "Differences in the resource intake of two
sympatric Australian stingless bee species". Apidologie, 45(4): 514-527.
Mattila, H.R. and G.W. Otis (2006). "Influence of pollen diet in spring on development of
honey bee (Hymenoptera: Apidae) colonies". Journal of Economic Entomology, 99(3):
604-613.
Michener, C.D. (1961). "Observations on the nests and behavior of Trigona in Australia and
New Guinea (Hymenoptera, Apidae)". American Museum Novitates, 2026: 1-46.
Michener, C.D. (2007). "The bees of the world". John Hopkins University Press, Baltimore &
London.
Micheu, S., K. Crailsheim and B. Leonhard (2000). "Importance of proline and other amino
acids during honeybee flight". Amino Acids, 18(2): 157-175.
Minden, V. and M. Kleyer (2014). "Internal and external regulation of plant organ
stoichiometry". Plant Biology, 16(5): 897-907.
Moo-Valle, H., G.J.J. Quezada-Euán and T. Wenseleers (2001). "The effect of food reserves on
the production of sexual offspring in the stingless bee Melipona beecheii (Apidae,
Meliponini)". Insectes Sociaux, 48(4): 398-403.
Murphy, J. and J.P. Riley (1962). "A modified single solution method for the determination of
phosphate in natural waters". Analytica Chimica Acta, 27: 31-36.
Nagamitsu, T. and T. Inoue (1998). "Interspecific morphological variation in stingless bees
(Hymenoptera: Apidae, Meliponinae) associated with floral shape and location in an
Asian tropical rainforest". Entomological Science, 1(2): 189-194.
Nakagawa, S. and H. Schielzeth (2013). "A general and simple method for obtaining R2 from
generalized linear mixed-effects models". Methods in Ecology and Evolution, 4(2): 133-
142.
5.7. References
_____ 163
Nicolson, S.W. (2011). "Bee food: the chemistry and nutritional value of nectar, pollen and
mixtures of the two". African Zoology, 46(2): 197-204.
Ollerton, J., R. Winfree and S. Tarrant (2011). "How many flowering plants are pollinated by
animals?". Oikos, 120(3): 321-326.
Pech-May, F.G., L. Medina-Medina, W.D. May-Itza, R.J. Paxton and J.J.G. Quezada-Euan
(2012). "Colony pollen reserves affect body size, sperm production and sexual
development in males of the stingless bee Melipona beecheii". Insectes Sociaux, 59(3):
417-424.
Potts, S.G., J.C. Biesmeijer, C. Kremen, P. Neumann, O. Schweiger and W.E. Kunin (2010).
"Global pollinator declines: trends, impacts and drivers". Trends in Ecology and
Evolution, 25(6): 345-353.
Quezada-Euan, J.J.G., A. Lopez-Velasco, J. Perez-Balam, H. Moo-Valle, A. Velazquez-
Madrazo and R.J. Paxton (2011). "Body size differs in workers produced across time
and is associated with variation in the quantity and composition of larval food in
Nannotrigona perilampoides (Hymenoptera, Meliponini)". Insectes Sociaux, 58(1): 31-
38.
R Development Core Team (2013). "R: A language and environment for statistical computing".
Version: 2.15.0. R Foundation for Statistical Computing, Vienna. Available at:
http://www.R-project.org.
Renauld, M., A. Hutchinson, G. Loeb, K. Poveda and H. Connelly (2016). "Landscape
simplification constrains adult size in a native ground-nesting bee". Plos One, 11(3):
e0150946.
Requier, F., J.-F. Odoux, T. Tamic, N. Moreau, M. Henry, A. Decourtye and V. Bretagnolle
(2015). "Honey bee diet in intensive farmland habitats reveals an unexpectedly high
flower richness and a major role of weeds". Ecological Applications, 25(4): 881-890.
Ricketts, T.H., J. Regetz, I. Steffan-Dewenter, S.A. Cunningham, C. Kremen, A. Bogdanski,
(...) B.F. Viana (2008). "Landscape effects on crop pollination services: are there
general patterns?". Ecology Letters, 11(5): 499-515.
Rollin, O., V. Bretagnolle, A. Decourtye, J. Aptel, N. Michel, B.E. Vaissiere and M. Henry
(2013). "Differences of floral resource use between honey bees and wild bees in an
intensive farming system". Agriculture Ecosystems & Environment, 179: 78-86.
Roubik, D.W. (1989). "Ecology and natural history of tropical bees". Cambridge University
Press, New York.
Roubik, D.W. (2006). "Stingless bee nesting biology". Apidologie, 37(2): 124-143.
Roulston, T.H. and J.H. Cane (2000a). "The effect of diet breadth and nesting ecology on body
size variation in bees (Apiformes)". Journal of the Kansas Entomological Society,
73(3): 129-142.
V. Biodiversity drives social bee fitness
_____ 164
Roulston, T.H. and J.H. Cane (2000b). "Pollen nutritional content and digestibility for animals".
Plant Systematics and Evolution, 222(1-4): 187-209.
Roulston, T.H. and J.H. Cane (2002). "The effect of pollen protein concentration on body size in
the sweat bee Lasioglossum zephyrum (Hymenoptera: Apiformes)". Evolutionary
Ecology, 16(1): 49-65.
Roulston, T.H. and K. Goodell (2011). "The role of resources and risks in regulating wild bee
populations". Annual Review of Entomology, 56(1): 293-312.
Ruedenauer, F.A., J. Spaethe and S.D. Leonhardt (2015). "How to know which food is good for
you: bumblebees use taste to discriminate between different concentrations of food
differing in nutrient content". Journal of Experimental Biology, 218(14): 2233-2240.
Simpson, S.J. and D. Raubenheimer (2012). "The nature of nutrition: a unifying framework
from animal adaptation to human obesity". Princeton University Press, Princton, USA.
Smith, J.P., T.A. Heard, M. Beekman and R. Gloag (2016). "Flight range of the Australian
stingless bee Tetragonula carbonaria (Hymenoptera: Apidae)". Austral Entomology.
Söderström, B., B. Svensson, K. Vessby and A. Glimskär (2001). "Plants, insects and birds in
semi-natural pastures in relation to local habitat and landscape factors". Biodiversity &
Conservation, 10(11): 1839-1863.
Somme, L., M. Vanderplanck, D. Michez, I. Lombaerde, R. Moerman, B. Wathelet, (...) A.L.
Jacquemart (2015). "Pollen and nectar quality drive the major and minor floral choices
of bumble bees". Apidologie, 46(1): 92-106.
Sommeijer, J.M., M.L.L. de Bruijn, J.F.J.A. Meeuwsen and P.E. Martens (2003). "Natural
patterns of caste and sex allocation in the stingless bees Melipona favosa and M.
trinitatis related to worker behaviour". Insectes Sociaux, 50(1): 38-44.
Steffan-Dewenter, I. (2003). "Importance of habitat area and landscape context for species
richness of bees and wasps in fragmented orchard meadows". Conservation Biology, 17:
1036-1044.
Stout, J.C. and C.L. Morales (2009). "Ecological impacts of invasive alien species on bees".
Apidologie, 40(3): 388-409.
Tarpy, D.R. and D.C. Gilley (2004). "Group decision making during queen production in
colonies of highly eusocial bees". Apidologie, 35(2): 207-216.
Tepedino, V., B. Bradley and T. Griswold (2008). "Might flowers of invasive plants increase
native bee carrying capacity? Intimations from Capitol Reef National Park, Utah".
Natural Areas Journal, 28(1): 44-50.
van Veen, W.J. and J.M. Sommeijer (2000). "Colony reproduction in Tetragonisca angustula
(Apidae, Meliponini)". Insectes Sociaux, 47(1): 70-75.
Vanbergen, A.J. and the Insect Pollinators Initiative (2013). "Threats to an ecosystem service:
pressures on pollinators". Frontiers in Ecology and the Environment, 11(5): 251-259.
5.7. References
_____ 165
Vanderplanck, M., R. Moerman, P. Rasmont, G. Lognay, B. Wathelet, R. Wattiez and D.
Michez (2014). "How does pollen chemistry impact development and feeding behaviour
of polylectic bees?". Plos One, 9(1): e86209.
Vaudo, A.D., J.F. Tooker, C.M. Grozinger and H.M. Patch (2015). "Bee nutrition and floral
resource restoration". Current Opinion in Insect Science, 10: 133-141.
Weiner, C.N., A. Hilpert, M. Werner, K.E. Linsenmair and N. Blüthgen (2010). "Pollen amino
acids and flower specialisation in solitary bees". Apidologie, 41: 476-487.
Westphal, C., I. Steffan-Dewenter and T. Tscharntke (2009). "Mass flowering oilseed rape
improves early colony growth but not sexual reproduction of bumblebees". Journal of
Applied Ecology, 46: 187–193.
Williams, N.M., D. Cariveau, R. Winfree and C. Kremen (2011). "Bees in disturbed habitats
use, but do not prefer, alien plants". Basic and Applied Ecology, 12(4): 332-341.
Williams, N.M., J. Regetz and C. Kremen (2012). "Landscape-scale resources promote colony
growth but not reproductive performance of bumble bees". Ecology, 93: 1049–1058.
Williams, N.M. and V.J. Tepedino (2003). "Consistent mixing of near and distant resources in
foraging bouts by the solitary mason bee Osmia lignaria". Behavioral Ecology, 14(1):
141-149.
Winfree, R. (2010). "The conservation and restoration of wild bees". Year in Ecology and
Conservation Biology 2010, 1195: 169-197.
Winfree, R., R. Aguilar, D.P. Vázquez, G. LeBuhn and M.A. Aizen (2009). "A meta-analysis of
bees' responses to anthropogenic disturbance". Ecology, 90(8): 2068-2076.
Winfree, R., I. Bartomeus and D.P. Cariveau (2011). "Native pollinators in anthropogenic
habitats". Annual Review of Ecology, Evolution, and Systematics, 42(1): 1-22.
Woodcock, B.A., M. Edwards, J. Redhead, W.R. Meek, P. Nuttall, S. Falk, (...) R.F. Pywell
(2013). "Crop flower visitation by honeybees, bumblebees and solitary bees:
behavioural differences and diversity responses to landscape". Agriculture Ecosystems
& Environment, 171: 1-8.
Yamane, S., T.A. Heard and S.F. Sakagami (1995). "Oviposition Behavior of the Stingless Bees
(Apidae, Meliponinae) XVI. Trigona (Tetragonula) carbonaria Endemic to Australia,
with a Highly Integrated Oviposition Process". Japanese Journal of Entomology, 63(2):
275-296.
V. Biodiversity drives social bee fitness
_____ 166
5.8. Supplementary material SM V.1. Amino acids, macro- and micro-elements in nest pollen
Concentration of amino acids in nest pollen was determined as described in the main
text. Methionine, arginine, lysine, isoleucine, leucine, phenylalanine, histidine, valine
and threonine were considered essential amino acids for bees (Table V.2). We
additionally included proline in our analysis because of its importance for the flight
muscle metabolism in adult bees (de Groot 1953; Micheu et al. 2000). A principal
component analysis (PCA) was performed on all detected single amino and the first axis
(explaining 80 % of the variance across samples) implemented in further statistical
analysis. We additionally used the sum of total protein (mg/g) as well as the sum of
essential amino acids (mg/g) as response variable in the statistical analysis, as bees
appear to be primarily affected by pollen overall protein content rather than amino acid
composition (reviewed by Ruedenauer et al. 2015).
Stoichiometric analysis of elements were performed as described in the main text for
nest pollen of each study site and boron, calcium, copper, iron, potassium, magnesium,
manganese, sodium, sulphur and zinc were considered micro-nutrients (Table V.3). A
principal component analysis was performed on all micro-elements, and the first axis of
the PCA (explaining 87 % of the variance across samples) was used for further
analyses. Phosphorus, nitrogen and carbon were entered as separate factors in
subsequent analyses.
References
de Groot, A.P. (1953). "Protein and amino acid requirements of the honey bee (Apis mellifera
L.)". Physiologia Comparata et Oecologia, 3(2/3): 197-285.
Micheu, S., K. Crailsheim and B. Leonhard (2000). "Importance of proline and other amino
acids during honeybee flight". Amino Acids, 18(2): 157-175.
Ruedenauer, F.A., J. Spaethe and S.D. Leonhardt (2015). "How to know which food is good for
you: bumblebees use taste to discriminate between different concentrations of food
differing in nutrient content". Journal of Experimental Biology, 218(14): 2233-2240.
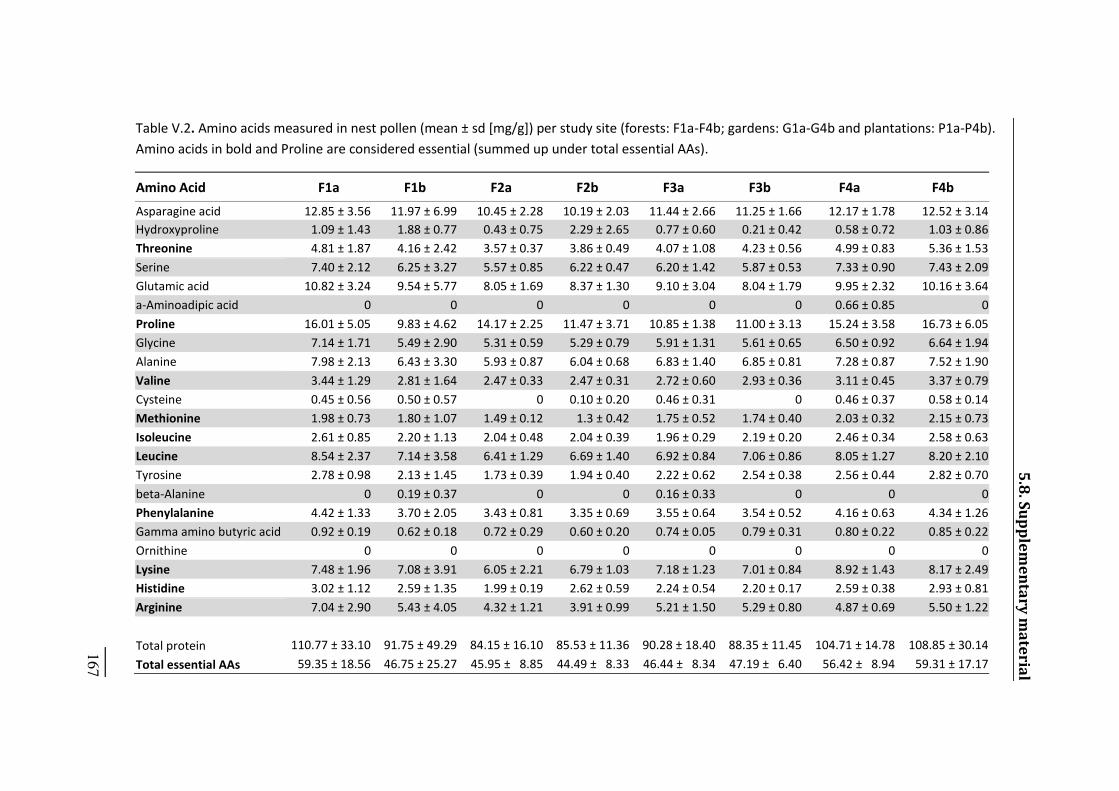
_____ 167
5.8. Supplementary material Table V.2. Amino acids measured in nest pollen (mean ± sd [mg/g]) per study site (forests: F1a-F4b; gardens: G1a-G4b and plantations: P1a-P4b). Amino acids in bold and Proline are considered essential (summed up under total essential AAs). Amino Acid F1a F1b F2a F2b F3a F3b F4a F4b Asparagine acid 12.85 ± 3.56 11.97 ± 6.99 10.45 ± 2.28 10.19 ± 2.03 11.44 ± 2.66 11.25 ± 1.66 12.17 ± 1.78 12.52 ± 3.14 Hydroxyproline 1.09 ± 1.43 1.88 ± 0.77 0.43 ± 0.75 2.29 ± 2.65 0.77 ± 0.60 0.21 ± 0.42 0.58 ± 0.72 1.03 ± 0.86 Threonine 4.81 ± 1.87 4.16 ± 2.42 3.57 ± 0.37 3.86 ± 0.49 4.07 ± 1.08 4.23 ± 0.56 4.99 ± 0.83 5.36 ± 1.53 Serine 7.40 ± 2.12 6.25 ± 3.27 5.57 ± 0.85 6.22 ± 0.47 6.20 ± 1.42 5.87 ± 0.53 7.33 ± 0.90 7.43 ± 2.09 Glutamic acid 10.82 ± 3.24 9.54 ± 5.77 8.05 ± 1.69 8.37 ± 1.30 9.10 ± 3.04 8.04 ± 1.79 9.95 ± 2.32 10.16 ± 3.64 a-Aminoadipic acid 0 0 0 0 0 0 0.66 ± 0.85 0 Proline 16.01 ± 5.05 9.83 ± 4.62 14.17 ± 2.25 11.47 ± 3.71 10.85 ± 1.38 11.00 ± 3.13 15.24 ± 3.58 16.73 ± 6.05 Glycine 7.14 ± 1.71 5.49 ± 2.90 5.31 ± 0.59 5.29 ± 0.79 5.91 ± 1.31 5.61 ± 0.65 6.50 ± 0.92 6.64 ± 1.94 Alanine 7.98 ± 2.13 6.43 ± 3.30 5.93 ± 0.87 6.04 ± 0.68 6.83 ± 1.40 6.85 ± 0.81 7.28 ± 0.87 7.52 ± 1.90 Valine 3.44 ± 1.29 2.81 ± 1.64 2.47 ± 0.33 2.47 ± 0.31 2.72 ± 0.60 2.93 ± 0.36 3.11 ± 0.45 3.37 ± 0.79 Cysteine 0.45 ± 0.56 0.50 ± 0.57 0 0.10 ± 0.20 0.46 ± 0.31 0 0.46 ± 0.37 0.58 ± 0.14 Methionine 1.98 ± 0.73 1.80 ± 1.07 1.49 ± 0.12 1.3 ± 0.42 1.75 ± 0.52 1.74 ± 0.40 2.03 ± 0.32 2.15 ± 0.73 Isoleucine 2.61 ± 0.85 2.20 ± 1.13 2.04 ± 0.48 2.04 ± 0.39 1.96 ± 0.29 2.19 ± 0.20 2.46 ± 0.34 2.58 ± 0.63 Leucine 8.54 ± 2.37 7.14 ± 3.58 6.41 ± 1.29 6.69 ± 1.40 6.92 ± 0.84 7.06 ± 0.86 8.05 ± 1.27 8.20 ± 2.10 Tyrosine 2.78 ± 0.98 2.13 ± 1.45 1.73 ± 0.39 1.94 ± 0.40 2.22 ± 0.62 2.54 ± 0.38 2.56 ± 0.44 2.82 ± 0.70 beta-Alanine 0 0.19 ± 0.37 0 0 0.16 ± 0.33 0 0 0 Phenylalanine 4.42 ± 1.33 3.70 ± 2.05 3.43 ± 0.81 3.35 ± 0.69 3.55 ± 0.64 3.54 ± 0.52 4.16 ± 0.63 4.34 ± 1.26 Gamma amino butyric acid 0.92 ± 0.19 0.62 ± 0.18 0.72 ± 0.29 0.60 ± 0.20 0.74 ± 0.05 0.79 ± 0.31 0.80 ± 0.22 0.85 ± 0.22 Ornithine 0 0 0 0 0 0 0 0 Lysine 7.48 ± 1.96 7.08 ± 3.91 6.05 ± 2.21 6.79 ± 1.03 7.18 ± 1.23 7.01 ± 0.84 8.92 ± 1.43 8.17 ± 2.49 Histidine 3.02 ± 1.12 2.59 ± 1.35 1.99 ± 0.19 2.62 ± 0.59 2.24 ± 0.54 2.20 ± 0.17 2.59 ± 0.38 2.93 ± 0.81 Arginine 7.04 ± 2.90 5.43 ± 4.05 4.32 ± 1.21 3.91 ± 0.99 5.21 ± 1.50 5.29 ± 0.80 4.87 ± 0.69 5.50 ± 1.22 Total protein 110.77 ± 33.10 91.75 ± 49.29 84.15 ± 16.10 85.53 ± 11.36 90.28 ± 18.40 88.35 ± 11.45 104.71 ± 14.78 108.85 ± 30.14 Total essential AAs 59.35 ± 18.56 46.75 ± 25.27 45.95 ± 8.85 44.49 ± 8.33 46.44 ± 8.34 47.19 ± 6.40 56.42 ± 8.94 59.31 ± 17.17
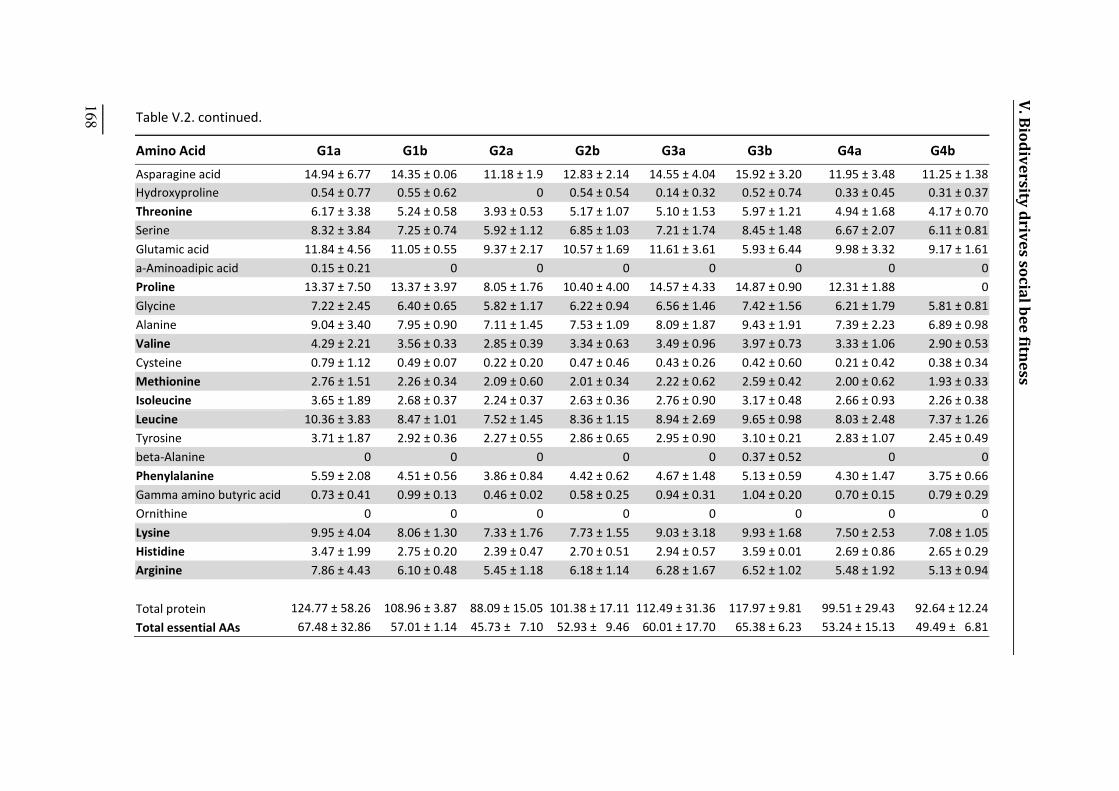
Table V.2. continued. Amino Acid G1a G1b G2a G2b G3a G3b G4a G4b Asparagine acid 14.94 ± 6.77 14.35 ± 0.06 11.18 ± 1.9 12.83 ± 2.14 14.55 ± 4.04 15.92 ± 3.20 11.95 ± 3.48 11.25 ± 1.38 Hydroxyproline 0.54 ± 0.77 0.55 ± 0.62 0 0.54 ± 0.54 0.14 ± 0.32 0.52 ± 0.74 0.33 ± 0.45 0.31 ± 0.37 Threonine 6.17 ± 3.38 5.24 ± 0.58 3.93 ± 0.53 5.17 ± 1.07 5.10 ± 1.53 5.97 ± 1.21 4.94 ± 1.68 4.17 ± 0.70 Serine 8.32 ± 3.84 7.25 ± 0.74 5.92 ± 1.12 6.85 ± 1.03 7.21 ± 1.74 8.45 ± 1.48 6.67 ± 2.07 6.11 ± 0.81 Glutamic acid 11.84 ± 4.56 11.05 ± 0.55 9.37 ± 2.17 10.57 ± 1.69 11.61 ± 3.61 5.93 ± 6.44 9.98 ± 3.32 9.17 ± 1.61 a-Aminoadipic acid 0.15 ± 0.21 0 0 0 0 0 0 0 Proline 13.37 ± 7.50 13.37 ± 3.97 8.05 ± 1.76 10.40 ± 4.00 14.57 ± 4.33 14.87 ± 0.90 12.31 ± 1.88 0 Glycine 7.22 ± 2.45 6.40 ± 0.65 5.82 ± 1.17 6.22 ± 0.94 6.56 ± 1.46 7.42 ± 1.56 6.21 ± 1.79 5.81 ± 0.81 Alanine 9.04 ± 3.40 7.95 ± 0.90 7.11 ± 1.45 7.53 ± 1.09 8.09 ± 1.87 9.43 ± 1.91 7.39 ± 2.23 6.89 ± 0.98 Valine 4.29 ± 2.21 3.56 ± 0.33 2.85 ± 0.39 3.34 ± 0.63 3.49 ± 0.96 3.97 ± 0.73 3.33 ± 1.06 2.90 ± 0.53 Cysteine 0.79 ± 1.12 0.49 ± 0.07 0.22 ± 0.20 0.47 ± 0.46 0.43 ± 0.26 0.42 ± 0.60 0.21 ± 0.42 0.38 ± 0.34 Methionine 2.76 ± 1.51 2.26 ± 0.34 2.09 ± 0.60 2.01 ± 0.34 2.22 ± 0.62 2.59 ± 0.42 2.00 ± 0.62 1.93 ± 0.33 Isoleucine 3.65 ± 1.89 2.68 ± 0.37 2.24 ± 0.37 2.63 ± 0.36 2.76 ± 0.90 3.17 ± 0.48 2.66 ± 0.93 2.26 ± 0.38 Leucine 10.36 ± 3.83 8.47 ± 1.01 7.52 ± 1.45 8.36 ± 1.15 8.94 ± 2.69 9.65 ± 0.98 8.03 ± 2.48 7.37 ± 1.26 Tyrosine 3.71 ± 1.87 2.92 ± 0.36 2.27 ± 0.55 2.86 ± 0.65 2.95 ± 0.90 3.10 ± 0.21 2.83 ± 1.07 2.45 ± 0.49 beta-Alanine 0 0 0 0 0 0.37 ± 0.52 0 0 Phenylalanine 5.59 ± 2.08 4.51 ± 0.56 3.86 ± 0.84 4.42 ± 0.62 4.67 ± 1.48 5.13 ± 0.59 4.30 ± 1.47 3.75 ± 0.66 Gamma amino butyric acid 0.73 ± 0.41 0.99 ± 0.13 0.46 ± 0.02 0.58 ± 0.25 0.94 ± 0.31 1.04 ± 0.20 0.70 ± 0.15 0.79 ± 0.29 Ornithine 0 0 0 0 0 0 0 0 Lysine 9.95 ± 4.04 8.06 ± 1.30 7.33 ± 1.76 7.73 ± 1.55 9.03 ± 3.18 9.93 ± 1.68 7.50 ± 2.53 7.08 ± 1.05 Histidine 3.47 ± 1.99 2.75 ± 0.20 2.39 ± 0.47 2.70 ± 0.51 2.94 ± 0.57 3.59 ± 0.01 2.69 ± 0.86 2.65 ± 0.29 Arginine 7.86 ± 4.43 6.10 ± 0.48 5.45 ± 1.18 6.18 ± 1.14 6.28 ± 1.67 6.52 ± 1.02 5.48 ± 1.92 5.13 ± 0.94 Total protein 124.77 ± 58.26 108.96 ± 3.87 88.09 ± 15.05 101.38 ± 17.11 112.49 ± 31.36 117.97 ± 9.81 99.51 ± 29.43 92.64 ± 12.24 Total essential AAs 67.48 ± 32.86 57.01 ± 1.14 45.73 ± 7.10 52.93 ± 9.46 60.01 ± 17.70 65.38 ± 6.23 53.24 ± 15.13 49.49 ± 6.81
_____ 168
V. Biodiversity drives social bee fitness
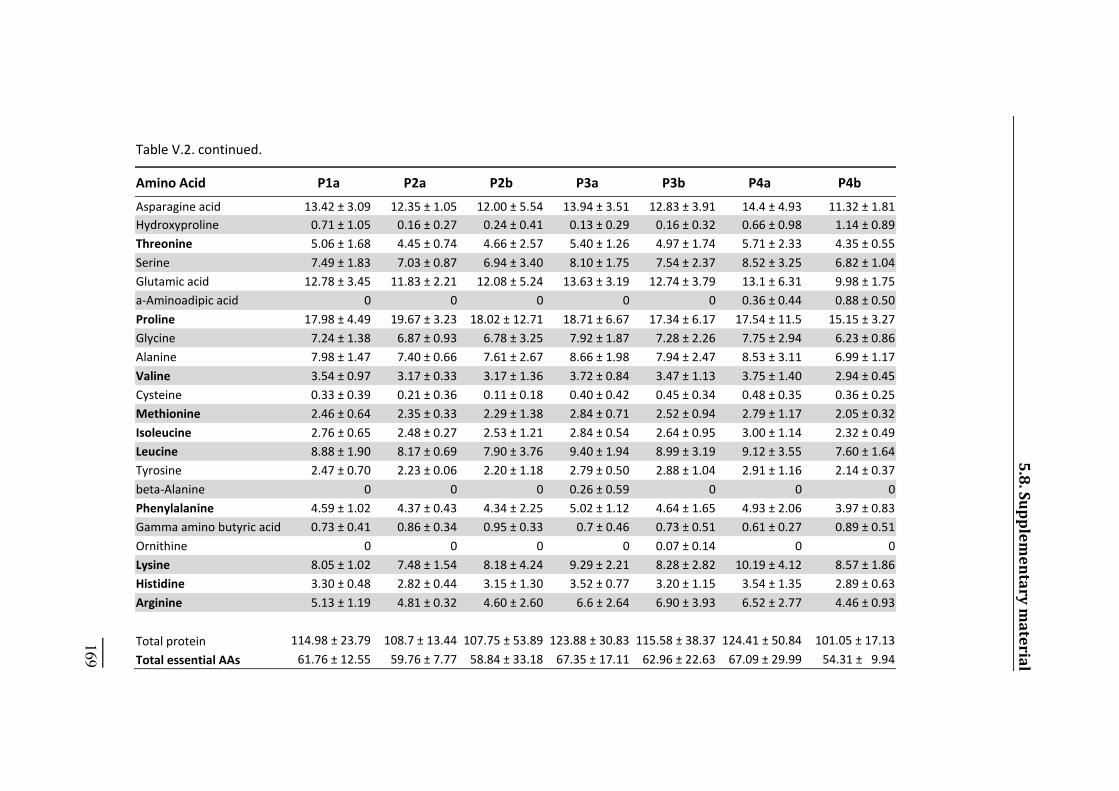
Table V.2. continued. Amino Acid P1a P2a P2b P3a P3b P4a P4b Asparagine acid 13.42 ± 3.09 12.35 ± 1.05 12.00 ± 5.54 13.94 ± 3.51 12.83 ± 3.91 14.4 ± 4.93 11.32 ± 1.81 Hydroxyproline 0.71 ± 1.05 0.16 ± 0.27 0.24 ± 0.41 0.13 ± 0.29 0.16 ± 0.32 0.66 ± 0.98 1.14 ± 0.89 Threonine 5.06 ± 1.68 4.45 ± 0.74 4.66 ± 2.57 5.40 ± 1.26 4.97 ± 1.74 5.71 ± 2.33 4.35 ± 0.55 Serine 7.49 ± 1.83 7.03 ± 0.87 6.94 ± 3.40 8.10 ± 1.75 7.54 ± 2.37 8.52 ± 3.25 6.82 ± 1.04 Glutamic acid 12.78 ± 3.45 11.83 ± 2.21 12.08 ± 5.24 13.63 ± 3.19 12.74 ± 3.79 13.1 ± 6.31 9.98 ± 1.75 a-Aminoadipic acid 0 0 0 0 0 0.36 ± 0.44 0.88 ± 0.50 Proline 17.98 ± 4.49 19.67 ± 3.23 18.02 ± 12.71 18.71 ± 6.67 17.34 ± 6.17 17.54 ± 11.5 15.15 ± 3.27 Glycine 7.24 ± 1.38 6.87 ± 0.93 6.78 ± 3.25 7.92 ± 1.87 7.28 ± 2.26 7.75 ± 2.94 6.23 ± 0.86 Alanine 7.98 ± 1.47 7.40 ± 0.66 7.61 ± 2.67 8.66 ± 1.98 7.94 ± 2.47 8.53 ± 3.11 6.99 ± 1.17 Valine 3.54 ± 0.97 3.17 ± 0.33 3.17 ± 1.36 3.72 ± 0.84 3.47 ± 1.13 3.75 ± 1.40 2.94 ± 0.45 Cysteine 0.33 ± 0.39 0.21 ± 0.36 0.11 ± 0.18 0.40 ± 0.42 0.45 ± 0.34 0.48 ± 0.35 0.36 ± 0.25 Methionine 2.46 ± 0.64 2.35 ± 0.33 2.29 ± 1.38 2.84 ± 0.71 2.52 ± 0.94 2.79 ± 1.17 2.05 ± 0.32 Isoleucine 2.76 ± 0.65 2.48 ± 0.27 2.53 ± 1.21 2.84 ± 0.54 2.64 ± 0.95 3.00 ± 1.14 2.32 ± 0.49 Leucine 8.88 ± 1.90 8.17 ± 0.69 7.90 ± 3.76 9.40 ± 1.94 8.99 ± 3.19 9.12 ± 3.55 7.60 ± 1.64 Tyrosine 2.47 ± 0.70 2.23 ± 0.06 2.20 ± 1.18 2.79 ± 0.50 2.88 ± 1.04 2.91 ± 1.16 2.14 ± 0.37 beta-Alanine 0 0 0 0.26 ± 0.59 0 0 0 Phenylalanine 4.59 ± 1.02 4.37 ± 0.43 4.34 ± 2.25 5.02 ± 1.12 4.64 ± 1.65 4.93 ± 2.06 3.97 ± 0.83 Gamma amino butyric acid 0.73 ± 0.41 0.86 ± 0.34 0.95 ± 0.33 0.7 ± 0.46 0.73 ± 0.51 0.61 ± 0.27 0.89 ± 0.51 Ornithine 0 0 0 0 0.07 ± 0.14 0 0 Lysine 8.05 ± 1.02 7.48 ± 1.54 8.18 ± 4.24 9.29 ± 2.21 8.28 ± 2.82 10.19 ± 4.12 8.57 ± 1.86 Histidine 3.30 ± 0.48 2.82 ± 0.44 3.15 ± 1.30 3.52 ± 0.77 3.20 ± 1.15 3.54 ± 1.35 2.89 ± 0.63 Arginine 5.13 ± 1.19 4.81 ± 0.32 4.60 ± 2.60 6.6 ± 2.64 6.90 ± 3.93 6.52 ± 2.77 4.46 ± 0.93 Total protein 114.98 ± 23.79 108.7 ± 13.44 107.75 ± 53.89 123.88 ± 30.83 115.58 ± 38.37 124.41 ± 50.84 101.05 ± 17.13 Total essential AAs 61.76 ± 12.55 59.76 ± 7.77 58.84 ± 33.18 67.35 ± 17.11 62.96 ± 22.63 67.09 ± 29.99 54.31 ± 9.94
5.8. Supplementary material _____ 169
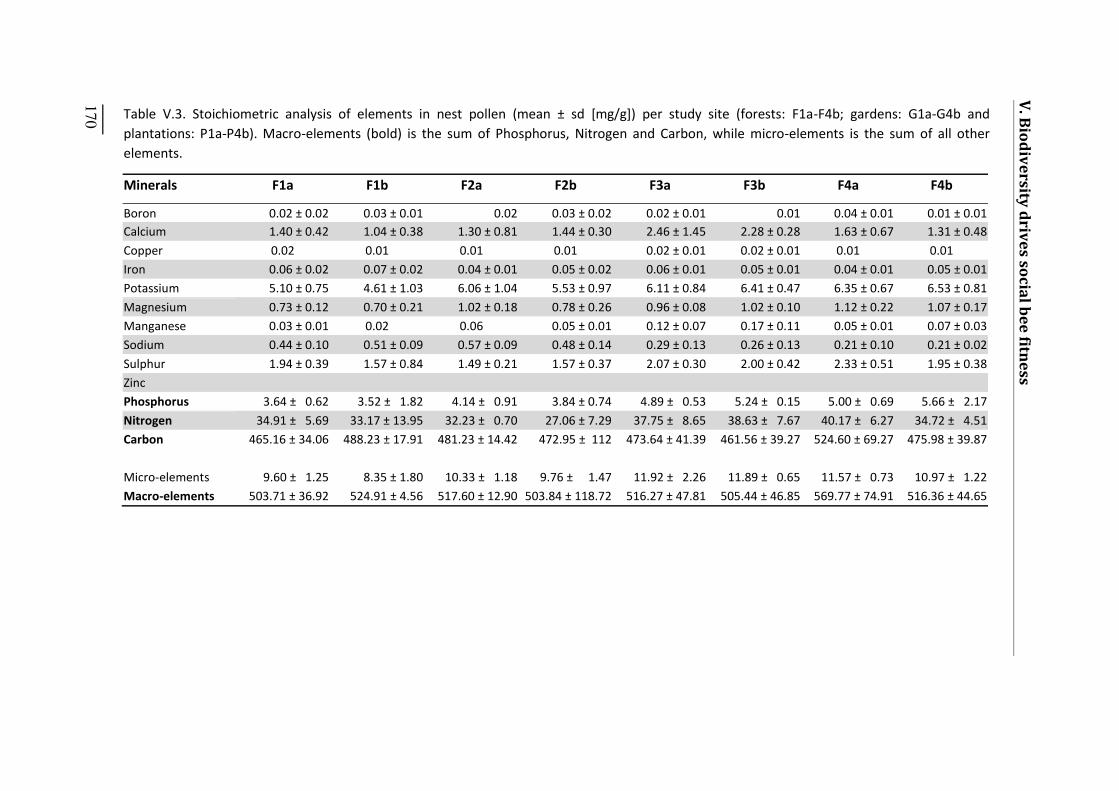
Minerals F1a F1b F2a F2b F3a F3b F4a F4b Boron 0.02 ± 0.02 0.03 ± 0.01 0.02 0.03 ± 0.02 0.02 ± 0.01 0.01 0.04 ± 0.01 0.01 ± 0.01 Calcium 1.40 ± 0.42 1.04 ± 0.38 1.30 ± 0.81 1.44 ± 0.30 2.46 ± 1.45 2.28 ± 0.28 1.63 ± 0.67 1.31 ± 0.48 Copper 0.02 0.01 0.01 0.01 0.02 ± 0.01 0.02 ± 0.01 0.01 0.01 Iron 0.06 ± 0.02 0.07 ± 0.02 0.04 ± 0.01 0.05 ± 0.02 0.06 ± 0.01 0.05 ± 0.01 0.04 ± 0.01 0.05 ± 0.01 Potassium 5.10 ± 0.75 4.61 ± 1.03 6.06 ± 1.04 5.53 ± 0.97 6.11 ± 0.84 6.41 ± 0.47 6.35 ± 0.67 6.53 ± 0.81 Magnesium 0.73 ± 0.12 0.70 ± 0.21 1.02 ± 0.18 0.78 ± 0.26 0.96 ± 0.08 1.02 ± 0.10 1.12 ± 0.22 1.07 ± 0.17 Manganese 0.03 ± 0.01 0.02 0.06 0.05 ± 0.01 0.12 ± 0.07 0.17 ± 0.11 0.05 ± 0.01 0.07 ± 0.03 Sodium 0.44 ± 0.10 0.51 ± 0.09 0.57 ± 0.09 0.48 ± 0.14 0.29 ± 0.13 0.26 ± 0.13 0.21 ± 0.10 0.21 ± 0.02 Sulphur 1.94 ± 0.39 1.57 ± 0.84 1.49 ± 0.21 1.57 ± 0.37 2.07 ± 0.30 2.00 ± 0.42 2.33 ± 0.51 1.95 ± 0.38 Zinc Phosphorus 3.64 ± 0.62 3.52 ± 1.82 4.14 ± 0.91 3.84 ± 0.74 4.89 ± 0.53 5.24 ± 0.15 5.00 ± 0.69 5.66 ± 2.17 Nitrogen 34.91 ± 5.69 33.17 ± 13.95 32.23 ± 0.70 27.06 ± 7.29 37.75 ± 8.65 38.63 ± 7.67 40.17 ± 6.27 34.72 ± 4.51 Carbon 465.16 ± 34.06 488.23 ± 17.91 481.23 ± 14.42 472.95 ± 112 473.64 ± 41.39 461.56 ± 39.27 524.60 ± 69.27 475.98 ± 39.87 Micro-elements 9.60 ± 1.25 8.35 ± 1.80 10.33 ± 1.18 9.76 ± 1.47 11.92 ± 2.26 11.89 ± 0.65 11.57 ± 0.73 10.97 ± 1.22 Macro-elements 503.71 ± 36.92 524.91 ± 4.56 517.60 ± 12.90 503.84 ± 118.72 516.27 ± 47.81 505.44 ± 46.85 569.77 ± 74.91 516.36 ± 44.65
Table V.3. Stoichiometric analysis of elements in nest pollen (mean ± sd [mg/g]) per study site (forests: F1a-F4b; gardens: G1a-G4b and plantations: P1a-P4b). Macro-elements (bold) is the sum of Phosphorus, Nitrogen and Carbon, while micro-elements is the sum of all other elements.
_____ 170
V. Biodiversity drives social bee fitness
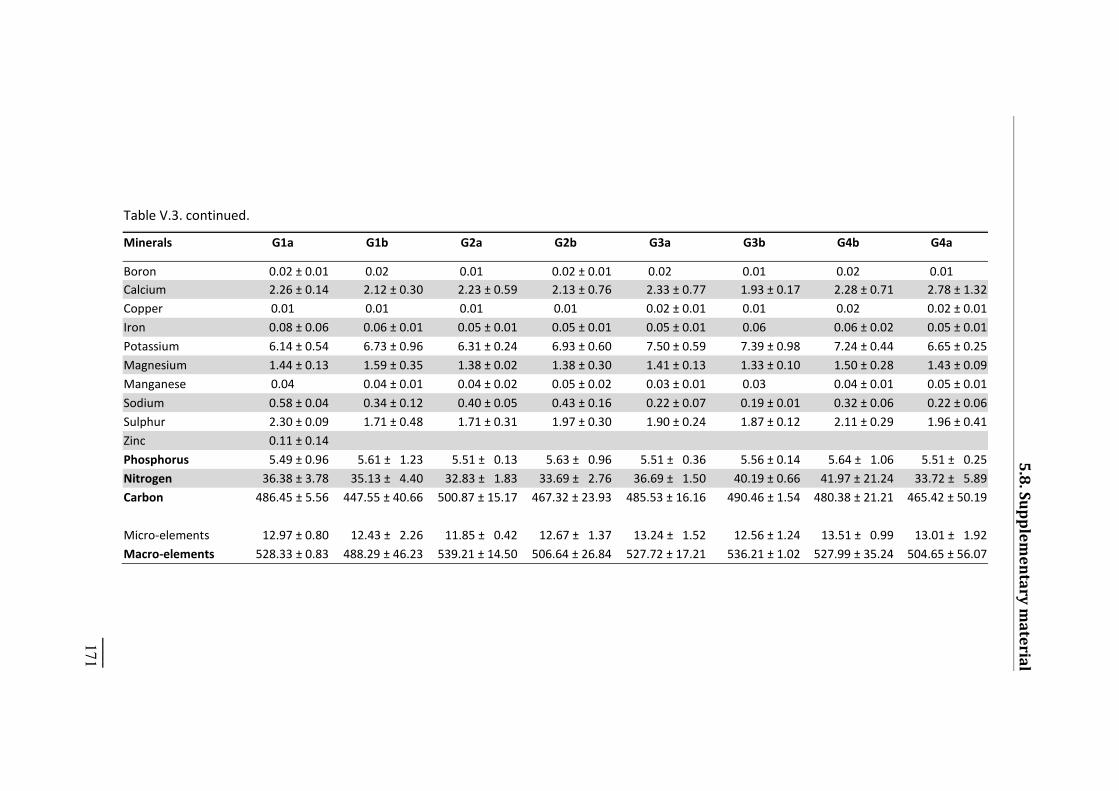
Table V.3. continued. Minerals G1a G1b G2a G2b G3a G3b G4b G4a Boron 0.02 ± 0.01 0.02 0.01 0.02 ± 0.01 0.02 0.01 0.02 0.01 Calcium 2.26 ± 0.14 2.12 ± 0.30 2.23 ± 0.59 2.13 ± 0.76 2.33 ± 0.77 1.93 ± 0.17 2.28 ± 0.71 2.78 ± 1.32 Copper 0.01 0.01 0.01 0.01 0.02 ± 0.01 0.01 0.02 0.02 ± 0.01 Iron 0.08 ± 0.06 0.06 ± 0.01 0.05 ± 0.01 0.05 ± 0.01 0.05 ± 0.01 0.06 0.06 ± 0.02 0.05 ± 0.01 Potassium 6.14 ± 0.54 6.73 ± 0.96 6.31 ± 0.24 6.93 ± 0.60 7.50 ± 0.59 7.39 ± 0.98 7.24 ± 0.44 6.65 ± 0.25 Magnesium 1.44 ± 0.13 1.59 ± 0.35 1.38 ± 0.02 1.38 ± 0.30 1.41 ± 0.13 1.33 ± 0.10 1.50 ± 0.28 1.43 ± 0.09 Manganese 0.04 0.04 ± 0.01 0.04 ± 0.02 0.05 ± 0.02 0.03 ± 0.01 0.03 0.04 ± 0.01 0.05 ± 0.01 Sodium 0.58 ± 0.04 0.34 ± 0.12 0.40 ± 0.05 0.43 ± 0.16 0.22 ± 0.07 0.19 ± 0.01 0.32 ± 0.06 0.22 ± 0.06 Sulphur 2.30 ± 0.09 1.71 ± 0.48 1.71 ± 0.31 1.97 ± 0.30 1.90 ± 0.24 1.87 ± 0.12 2.11 ± 0.29 1.96 ± 0.41 Zinc 0.11 ± 0.14 Phosphorus 5.49 ± 0.96 5.61 ± 1.23 5.51 ± 0.13 5.63 ± 0.96 5.51 ± 0.36 5.56 ± 0.14 5.64 ± 1.06 5.51 ± 0.25 Nitrogen 36.38 ± 3.78 35.13 ± 4.40 32.83 ± 1.83 33.69 ± 2.76 36.69 ± 1.50 40.19 ± 0.66 41.97 ± 21.24 33.72 ± 5.89 Carbon 486.45 ± 5.56 447.55 ± 40.66 500.87 ± 15.17 467.32 ± 23.93 485.53 ± 16.16 490.46 ± 1.54 480.38 ± 21.21 465.42 ± 50.19 Micro-elements 12.97 ± 0.80 12.43 ± 2.26 11.85 ± 0.42 12.67 ± 1.37 13.24 ± 1.52 12.56 ± 1.24 13.51 ± 0.99 13.01 ± 1.92 Macro-elements 528.33 ± 0.83 488.29 ± 46.23 539.21 ± 14.50 506.64 ± 26.84 527.72 ± 17.21 536.21 ± 1.02 527.99 ± 35.24 504.65 ± 56.07
_____ 171
5.8. Supplementary material
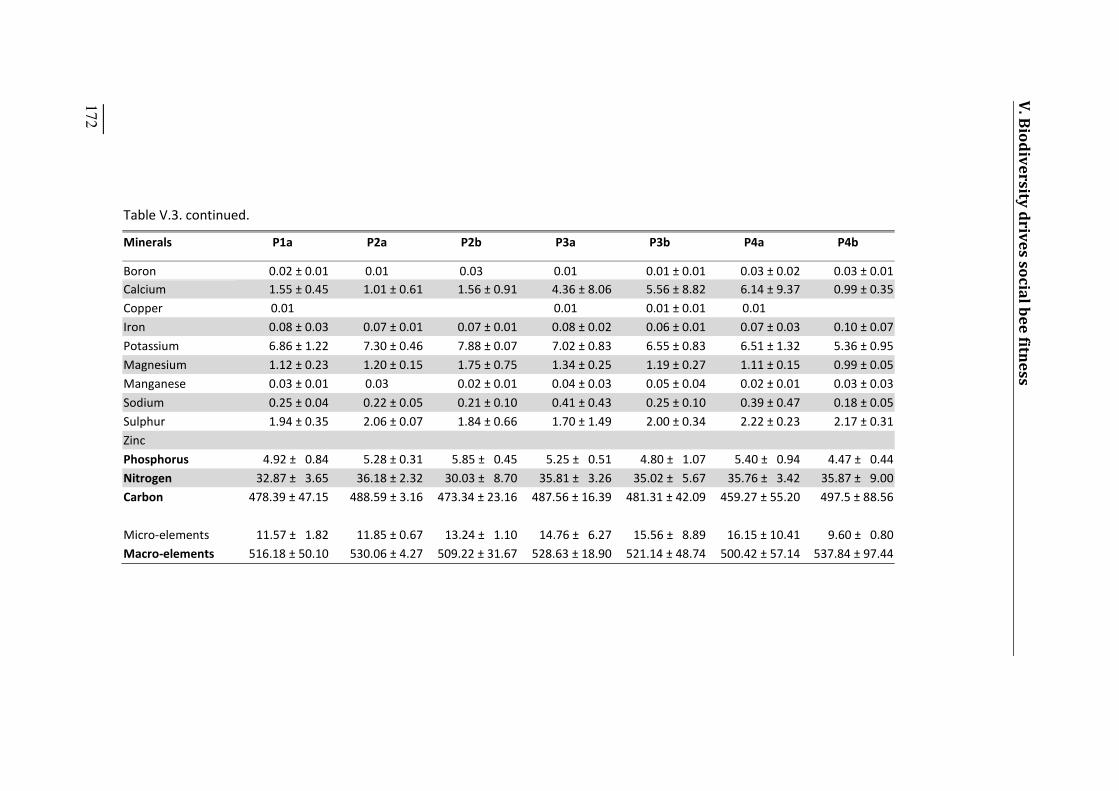
_____ 172
Table V.3. continued. Minerals P1a P2a P2b P3a P3b P4a P4b Boron 0.02 ± 0.01 0.01 0.03 0.01 0.01 ± 0.01 0.03 ± 0.02 0.03 ± 0.01 Calcium 1.55 ± 0.45 1.01 ± 0.61 1.56 ± 0.91 4.36 ± 8.06 5.56 ± 8.82 6.14 ± 9.37 0.99 ± 0.35 Copper 0.01 0.01 0.01 ± 0.01 0.01 Iron 0.08 ± 0.03 0.07 ± 0.01 0.07 ± 0.01 0.08 ± 0.02 0.06 ± 0.01 0.07 ± 0.03 0.10 ± 0.07 Potassium 6.86 ± 1.22 7.30 ± 0.46 7.88 ± 0.07 7.02 ± 0.83 6.55 ± 0.83 6.51 ± 1.32 5.36 ± 0.95 Magnesium 1.12 ± 0.23 1.20 ± 0.15 1.75 ± 0.75 1.34 ± 0.25 1.19 ± 0.27 1.11 ± 0.15 0.99 ± 0.05 Manganese 0.03 ± 0.01 0.03 0.02 ± 0.01 0.04 ± 0.03 0.05 ± 0.04 0.02 ± 0.01 0.03 ± 0.03 Sodium 0.25 ± 0.04 0.22 ± 0.05 0.21 ± 0.10 0.41 ± 0.43 0.25 ± 0.10 0.39 ± 0.47 0.18 ± 0.05 Sulphur 1.94 ± 0.35 2.06 ± 0.07 1.84 ± 0.66 1.70 ± 1.49 2.00 ± 0.34 2.22 ± 0.23 2.17 ± 0.31 Zinc Phosphorus 4.92 ± 0.84 5.28 ± 0.31 5.85 ± 0.45 5.25 ± 0.51 4.80 ± 1.07 5.40 ± 0.94 4.47 ± 0.44 Nitrogen 32.87 ± 3.65 36.18 ± 2.32 30.03 ± 8.70 35.81 ± 3.26 35.02 ± 5.67 35.76 ± 3.42 35.87 ± 9.00 Carbon 478.39 ± 47.15 488.59 ± 3.16 473.34 ± 23.16 487.56 ± 16.39 481.31 ± 42.09 459.27 ± 55.20 497.5 ± 88.56 Micro-elements 11.57 ± 1.82 11.85 ± 0.67 13.24 ± 1.10 14.76 ± 6.27 15.56 ± 8.89 16.15 ± 10.41 9.60 ± 0.80 Macro-elements 516.18 ± 50.10 530.06 ± 4.27 509.22 ± 31.67 528.63 ± 18.90 521.14 ± 48.74 500.42 ± 57.14 537.84 ± 97.44
V. Biodiversity drives social bee fitness
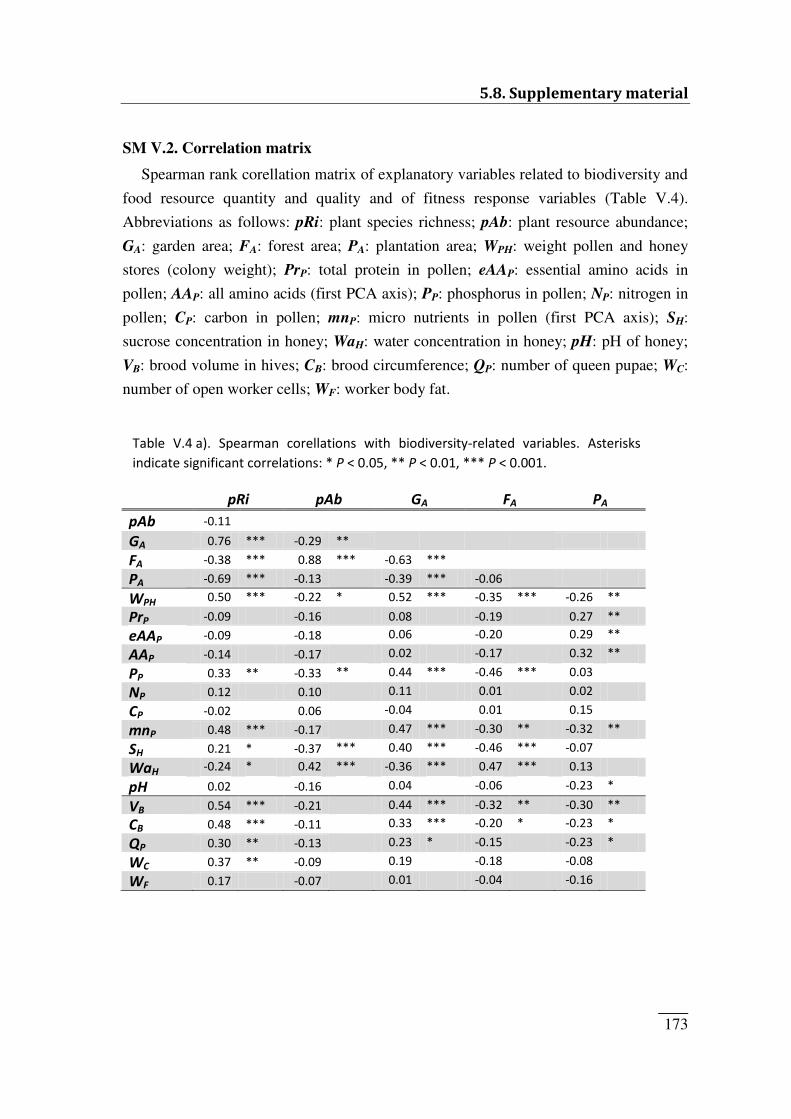
5.8. Supplementary material
_____ 173
SM V.2. Correlation matrix
Spearman rank corellation matrix of explanatory variables related to biodiversity and
food resource quantity and quality and of fitness response variables (Table V.4).
Abbreviations as follows: pRi: plant species richness; pAb: plant resource abundance;
GA: garden area; FA: forest area; PA: plantation area; WPH: weight pollen and honey
stores (colony weight); PrP: total protein in pollen; eAAP: essential amino acids in
pollen; AAP: all amino acids (first PCA axis); PP: phosphorus in pollen; NP: nitrogen in
pollen; CP: carbon in pollen; mnP: micro nutrients in pollen (first PCA axis); SH:
sucrose concentration in honey; WaH: water concentration in honey; pH: pH of honey;
VB: brood volume in hives; CB: brood circumference; QP: number of queen pupae; WC:
number of open worker cells; WF: worker body fat.
pRi pAb GA FA PA pAb -0.11 GA 0.76 *** -0.29 ** FA -0.38 *** 0.88 *** -0.63 *** PA -0.69 *** -0.13 -0.39 *** -0.06 WPH 0.50 *** -0.22 * 0.52 *** -0.35 *** -0.26 ** PrP -0.09 -0.16 0.08 -0.19 0.27 ** eAAP -0.09 -0.18 0.06 -0.20 0.29 ** AAP -0.14 -0.17 0.02 -0.17 0.32 ** PP 0.33 ** -0.33 ** 0.44 *** -0.46 *** 0.03 NP 0.12 0.10 0.11 0.01 0.02 CP -0.02 0.06 -0.04 0.01 0.15 mnP 0.48 *** -0.17 0.47 *** -0.30 ** -0.32 ** SH 0.21 * -0.37 *** 0.40 *** -0.46 *** -0.07 WaH -0.24 * 0.42 *** -0.36 *** 0.47 *** 0.13 pH 0.02 -0.16 0.04 -0.06 -0.23 * VB 0.54 *** -0.21 0.44 *** -0.32 ** -0.30 ** CB 0.48 *** -0.11 0.33 *** -0.20 * -0.23 * QP 0.30 ** -0.13 0.23 * -0.15 -0.23 * WC 0.37 ** -0.09 0.19 -0.18 -0.08 WF 0.17 -0.07 0.01 -0.04 -0.16
Table V.4 a). Spearman corellations with biodiversity-related variables. Asterisks indicate significant correlations: * P < 0.05, ** P < 0.01, *** P < 0.001.
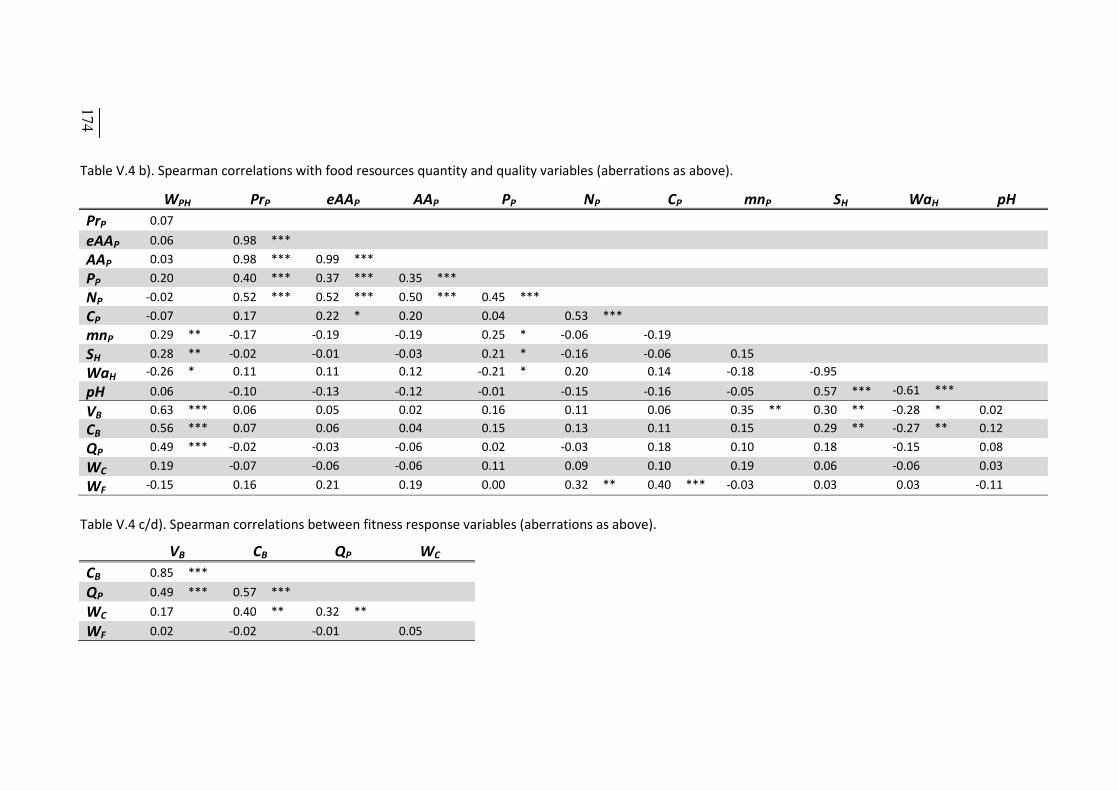
Table V.4 b). Spearman correlations with food resources quantity and quality variables (aberrations as above). WPH PrP eAAP AAP PP NP CP mnP SH WaH pH PrP 0.07 eAAP 0.06 0.98 *** AAP 0.03 0.98 *** 0.99 *** PP 0.20 0.40 *** 0.37 *** 0.35 *** NP -0.02 0.52 *** 0.52 *** 0.50 *** 0.45 *** CP -0.07 0.17 0.22 * 0.20 0.04 0.53 *** mnP 0.29 ** -0.17 -0.19 -0.19 0.25 * -0.06 -0.19 SH 0.28 ** -0.02 -0.01 -0.03 0.21 * -0.16 -0.06 0.15 WaH -0.26 * 0.11 0.11 0.12 -0.21 * 0.20 0.14 -0.18 -0.95 pH 0.06 -0.10 -0.13 -0.12 -0.01 -0.15 -0.16 -0.05 0.57 *** -0.61 *** VB 0.63 *** 0.06 0.05 0.02 0.16 0.11 0.06 0.35 ** 0.30 ** -0.28 * 0.02 CB 0.56 *** 0.07 0.06 0.04 0.15 0.13 0.11 0.15 0.29 ** -0.27 ** 0.12 QP 0.49 *** -0.02 -0.03 -0.06 0.02 -0.03 0.18 0.10 0.18 -0.15 0.08 WC 0.19 -0.07 -0.06 -0.06 0.11 0.09 0.10 0.19 0.06 -0.06 0.03 WF -0.15 0.16 0.21 0.19 0.00 0.32 ** 0.40 *** -0.03 0.03 0.03 -0.11 Table V.4 c/d). Spearman correlations between fitness response variables (aberrations as above). VB CB QP WC CB 0.85 *** QP 0.49 *** 0.57 *** WC 0.17 0.40 ** 0.32 ** WF 0.02 -0.02 -0.01 0.05
_____ 174
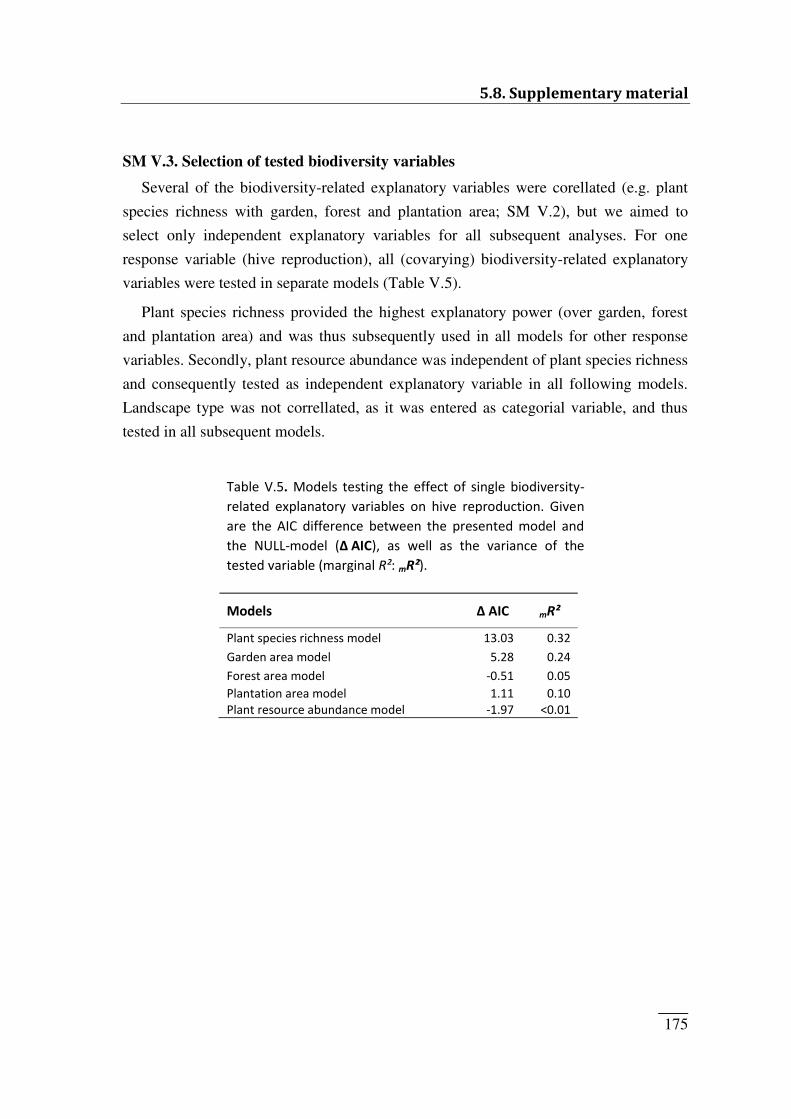
5.8. Supplementary material
_____ 175
SM V.3. Selection of tested biodiversity variables
Several of the biodiversity-related explanatory variables were corellated (e.g. plant
species richness with garden, forest and plantation area; SM V.2), but we aimed to
select only independent explanatory variables for all subsequent analyses. For one
response variable (hive reproduction), all (covarying) biodiversity-related explanatory
variables were tested in separate models (Table V.5).
Plant species richness provided the highest explanatory power (over garden, forest
and plantation area) and was thus subsequently used in all models for other response
variables. Secondly, plant resource abundance was independent of plant species richness
and consequently tested as independent explanatory variable in all following models.
Landscape type was not correllated, as it was entered as categorial variable, and thus
tested in all subsequent models.
Table V.5. Models testing the effect of single biodiversity-related explanatory variables on hive reproduction. Given are the AIC difference between the presented model and the NULL-model (Δ AIC), as well as the variance of the tested variable (marginal R²: mR²). Models Δ AIC mR² Plant species richness model 13.03 0.32 Garden area model 5.28 0.24 Forest area model -0.51 0.05 Plantation area model 1.11 0.10 Plant resource abundance model -1.97 <0.01

_____ 176
_____ 177
VI. SYNOPSIS
In the synopsis of this thesis I summarize the results of the presented studies and
discuss broader implications of the findings. First, I will give an overview of the results
of individual studies in relation to the proposed theoretical framework (Chapter I:
Figure I.3). The thesis aimed to investigate how factors of landscape, foraging, resource
quality/quantity and fitness influence each other, and I describe in the first section
whether the observed links between these factors match the predictions of the
theoretical framework (section 6.1).
Furthermore, I discuss implications of our research on social bee resource foraging
and fitness in the two anthropogenically formed landscapes targeted in our study design:
macadamia plantations and urban gardens. Section 6.2 focuses on the applied aspects of
the presented research in agri- and meliponiculture, and highlights findings which can
help improve the use of stingless bees for macadamia pollination. Next, I embed our
research into the current knowledge of urban areas as bee habitat and identify
knowledge gaps for future research (section 6.3).
Finally, I demonstrate and discuss the outstanding role of plant biodiversity on bee
resource foraging and fitness and how this thesis advances our understanding of a key
factor driving bee declines (section 6.4).
6.1. Summary of findings SUMMARY OF FINDINGS IN RELATION TO PREDICTIONS OF THE THEORETICAL FRAMEWORK Across all presented studies, we step-wise investigated the relationships of plant
biodiversity, foraging patterns, foraging/homing success, foraged resource
quantity/quality and lastly individual/colony fitness of Tetragonula carbonaria as
outlined in the presented theoretical framework (Chapter I: Figure I.3). First, we
explored the relationship between resource availability, seasonality, foraging patterns
and foraging success (Figure I.3A & B: right pathway; Chapter II). Additionally, we
investigated whether landscape structure, habitat homogeneity or resource availability
affects homing and thus foraging success (Figure I.3B; Chapter III). Next, we
investigated how plant resource diversity influences diversity of foraged resources and
whether it impacts on resource functionality and nutritional quality (Figure I.3A-C: left
VI. Synopsis
_____ 178
pathway; Chapter IV). In a last step, we combined previous findings to explore how of
plant biodiversity, resource quantity and quality impact on bee reproduction and
individual or colony fitness (Figure I.3A-D; Chapter V).
In the first study, we investigated how forager numbers, foraging patterns and
resource intake change between natural habitats (forests) and two landscapes modified
by anthropogenic activities (plantations and gardens) and in response to landscape-scale
seasonal availability of resources (Chapter II). We accounted for seasonal and weather
influences (compare Figure I.3 A & B) and identified diverging seasonal foraging
patterns between landscape types, but, beyond seasonal patterns, we found significant
differences in the total resource intake over the whole year between landscapes.
Foraging activity as well as pollen and nectar forager numbers were found to be low
in plantations, intermediate in forests and highest in suburban gardens. Likewise, sugar
and pollen intake per minute was low in plantations, but contrary to our predictions, it
was even higher in gardens than in forests. In contrast, resin intake was similar across
landscapes, suggesting that bees maximize intake of food resources, but have a specific
intake target for resin as nest material.
In summary, total resource availability and its seasonal changes in natural or altered
landscapes can strongly impact on foraging patterns and thus resource intake of social
bees, but bees respond differently to anthropogenic habitat alterations. Depending on
the landscapes‘ resource availability, anthropogenic habitat can consequently either
largely reduce foraging activity and success, as in agricultural monocultures, or increase
resource intake well above rates found in natural habitats, as observed in suburban
gardens.
The second study tested whether landscape structure (i.e. visual landmarks) and
habitat homogeneity (homogenous or fragmented vegetation cover) can affect
navigation and thus homing success in bees (Chapter III). Homing success and return
speed was compared for both returning bees and nectar foragers between natural forests,
with few landmarks but large proportions of vegetation cover, and anthropogenically
modified landscapes (gardens and plantations), with many landmarks but fragmented
vegetation cover.
Proportions of successfully returning nectar foragers and fastest return speed of both
bees and foragers did however not differ between landscapes. In contrast, overall
homing success (i.e. the proportion of bees returning within one hour) was highest in
6.1. Summary of findings
_____ 179
both the visually/structurally most (forest) and least (garden) homogeneous landscape.
These results indicate that landscape visual/structural alteration in disturbed landscapes
may not provide more or less visual landmarks relevant to the bees‘ navigation than in undisturbed natural habitats. Instead, return speed may be primarily driven by resource
availability in landscapes, which questions the importance of visual landmarks (i.e.
elongated ground features) as suggested in previous studies.
The third study aims to improve our general understanding of whether and how
biodiverse environments may benefit individual consumers by providing a higher
diversity of resources to choose from (Chapter IV). We measured the diversity of bee
collected resources of T. carbonaria (pollen and resin) in relation to plant species
richness and plant resource abundance in different habitats (plantations, forests and
gardens), observed whether bee consumers (actively or passively) maximize resource
diversity intake and how collected resource diversity affects resource functionality and
nutritional quality.
The diversity of foraged resources (pollen and resin) strongly increased with plant
species richness and thus resource diversity as predicted by our theoretical framework
(Figure I.3B), showing that bees maximize their resource diversity intake. Specifically
in impoverished habitats (plantations), bees actively increased the diversity of foraged
pollen resources (i.e. actively search for additional resources to maintain a diverse
pollen diet), even when one resource was available in great abundance during
macadamia flowering. Nevertheless, in habitats with highest plant species richness but
comparatively small resource patches (gardens), foraged resource diversity continued to
increase with highest foraging activity. Here, high resource diversity is available across
seasons and higher foraging activity may thus result in passive resource maximization,
where any outgoing forager is likely to encounter a new patch or plant species.
In contrast, resource nutritional quality (sucrose content of honey and total protein,
amino acids or minerals in pollen) and functionality (antimicrobial activity of resin) did
not increase with the diversity of collected resources as hypothesized (compare Figure
I.3C). Instead, resource quality and functionality appeared to be primarily driven by the
surrounding plant community composition and by the presence of specific plants/trees
providing high quality pollen or resin. In generalist consumers, maximizing resource
diversity intake may therefore primarily secure collection of sufficient amounts of
resources across the entire foraging season, but it also increases chances that the
allocated resources meet all functional needs.
VI. Synopsis
_____ 180
In order to study plant resource effects on bee fitness, we monitored colony growth
and fitness of T. carbonaria in relation to plant species richness, resource abundance
and to patch sizes of various landscape types (plantations, forests and gardens;
Chapter V). In a second step, we investigated the influence of quantity and quality of
colony stored resources on bee fitness.
Our extensive monitoring revealed that colony reproduction and fitness (brood
volume, hive-, queen- and worker reproduction) is primarily driven by plant species
richness, with highest plant species richness resulting in highest fitness and
reproduction in gardens. In contrast, resource abundance and landscape type played a
minor role and thus even small patches with high plant species richness provided a
sufficient and continuous supply in floral resources for bees to maintain high colony
fitness. Furthermore, higher plant richness ensures continuous resource availability, to
which bees respond with increasing resource intake and growing colony food storages,
leading to increased colony reproduction and fitness as hypothesized (Figure I.3C/D).
However, while resource nutrient quality and functionality also increased with plant
species richness, it did not limit colony fitness. Contrary to our hypothesis, individual
worker fitness was not affected by available resource diversity and abundance,
indicating that colonies do not increase the nutritional investment in single workers, but
increase overall worker population size instead (compare Figure I.3).
Our study demonstrates that high plant species richness can provide continuous
resource supply, promote resource foraging and increases colony fitness. Biodiversity is
therefore a key driver of (social) bee fitness by providing more foraging resources, even
when only small, but florally diverse patches remain.
6.2. Stingless bees in macadamia plantations APPLIED ASPECTS OF THE RESEARCH: STINGLESS BEE KEEPING FOR MACADAMIA POLLINATION The stingless bee Tetragonula carbonaria is an effective pollinator of macadamia
(Macadamia integrifolia Maiden and Betche × M. tetraphylla Johnson), an Australian
indigenous rainforest tree, which is commercially grown for its edible nuts (Vithanage
and Ironside 1986; Heard 1994; Heard and Exley 1994; Wallace et al. 1996). Stingless
bee keeping in Australia, by bee enthusiasts as well as for crop pollination, has
dramatically increased in recent years (Heard 2016). Macadamia pollination by T.
carbonaria has thus not reached is full potential yet and a variety of findings in the
6.2. Stingless bees in macadamia plantations
_____ 181
presented thesis can help developing a more efficient application of stingless bees in the
macadamia industry.
This thesis investigated stingless bee fitness and reproduction in macadamia
monocultures, thus looking at plantations from a bees‘ perspective. The presented findings can therefore help improve placement of stingless bee hives in plantations,
protect the investment in hives and give recommendations for pollinator friendly layouts
of (planned) macadamia plantations.
In general, bee hives in macadamia orchards showed a broad spectrum of fitness
responses during our consecutive survey, from hive starvation to steady hive
reproduction, even matching reproduction rates in natural forest habitats under best
conditions (Chapter V). This highlights that bee hives are able to thrive in macadamia
orchards when basic needs are met and that year-long placement of stingless bee hives
in orchards is generally possible. Pollen and nectar resources are sufficiently available
during macadamia flowering and nutritional quality of available pollen seems meet the
bees‘ requirements (Chapter II & V). Analyses of protein content, amino acid
composition and micro-nutrients provide indirect evidence that macadamia pollen may
be of high nutritional value for bees (Chapter V). It is unclear, whether macadamia
generally provides pollen of high nutritional quality or if high protein concentrations of
bee-collected pollen are due to fertilizer usage in plantations, i.e. higher nitrogen
deposition. Nitrogen deposition was found by Hoover et al. (2012) to affect plant traits
and bee fitness, as nitrogen deposition changed nectar composition of pumpkin, which
increased the nectar attractiveness for bee foragers, but reduced forager longevity.
However, nutritional quality of macadamia pollen and nectar in comparison to other
Australian plants, as well as the effect of nitrogen deposition on stingless bee foraging
behaviour remain unknown and would require further research.
Our studies showed that, averaged over seasons, bee foraging activity, resource
intake, foraged pollen diversity, bee fitness as well as hive reproduction in plantations
stayed well below the controls in natural habitats (Chapter II, IV & V). The main reason
for this was that foraging activity and resource intake dropped quickly and remained
low outside macadamia flowering times (dry season; Chapter II). Bee hives in
plantations consequently commanded smaller food storages which limited their fitness
and reproduction (Chapter V). Resource availability across seasons is thus the critical
limitation for bee keeping in macadamia plantations.
Fortunately, several positive findings from gardens are directly transferrable to
VI. Synopsis
_____ 182
macadamia plantations. Plant species richness was a key driver in sustaining floral
resource availability across seasons, and consequently allowed bees to maintain a larger
forager population and collect greater food quantities (Chapter V). Thus, bee hives in
plantations seem to need access to habitats with higher biodiversity within their 500m
foraging range (compare to Smith et al. 2016), where plants with complementary
flowering periods provide floral resources outside the dry season. In our study setup,
these habitat patches were either remaining bush patches with mature eucalypts or
gardens of neighbouring residents. In fact, over the range of our plantation study sites,
we observed hives on one study site to persistently forage at one small, but very diverse
garden in close proximity, which alone was sufficient to greatly boost hive reproduction
at this site. Consequently, we found that plant richness, but not the size of forest or
garden area determines hive reproduction (Chapter V). Thus even small patches of
higher plant diversity should be able to sustain bee hives in macadamia plantations.
As a result of positive experience of stingless bee keeping in suburban gardens
(Heard 2016), some macadamia growers started to remove stingless bee hives after the
macadamia flowering into garden areas for recovery and rapid propagation. This thesis
however supports that artificially enhancing plant diversity in remaining vegetation
patches in and around the plantation could be sufficient to provide sufficient foraging
opportunities throughout the year. Planting additional herbs with staggered flowering
can thus be a cost efficient technique to attract wild pollinators and safeguard bees hives
from food shortages (Nicholls and Altieri 2013; Williams et al. 2015).
The uniform layout of plantations was found to impair forager orientation and
homing ability, as plantations lack visual landmarks and olfactory cues (e.g. different
scents from various tree species) which are apparently necessary for foragers to quickly
and successfully return to the hive. As a consequence, foragers returned later to the hive
in macadamia plantations and resource intake was further reduced (Chapter III).
Differences between macadamia trees are extremely small, as each tree row in
macadamia orchards typically only contains macadamia plants that are genetic clones.
Macadamia is predominantly insect pollinated but partially self-incompatible, and fruit
set consequently increases through cross-pollination by insects between varieties, i.e.
between tree lines (Trueman 2013). Bees (predominantly honey bees) are however
known to mainly forage on and thus pollinate trees consecutively within one tree row in
nut orchards, unless their foraging pattern is disrupted (Brittain et al. 2013). Thus
breaking this foraging pattern to encourage bees to alternate between tree rows could
potentially increase their pollination efficiency. Consequently, landmarks, gaps in tree
6.3. Urban habitat for bees
_____ 183
lines or small patches with other plant species (e.g. wind breaks or remnant vegetation)
could increase the bees foraging speed and pollination efficiency.
6.3. Urban habitat for bees Suburban and urban garden sites in our studies had, to our surprise, highest plant
species richness and average plant species richness in gardens was two and a half times
higher than at forest sites, thus even exceeding plant richness of diverse natural forests
featuring tall eucalypt sclerophyll with very diverse rainforest understory
(Chapter II & IV). Bee hives in gardens had highest numbers of pollen and nectar
foragers, highest foraging activity, highest sucrose and pollen intake rates and
consequently largest reserves of stored food (Chapter II & V). Similar to hives in
natural forests, bees collected great pollen diversity and returned quickly from foraging
trips (Chapter III & IV). Nutritional quality of pollen (micro/macro elements, amino
acids and total protein) and nectar/honey (sucrose), as well as resource functionality
(antimicrobial activity of resin) was not limited in gardens (Chapter IV & V). As a
consequence, colony fitness (queen reproduction, brood volume) of bee hives in gardens
was generally high and reproduction followed an almost exponential growth, as it would
typically be expected under ideal environmental conditions (Chapter V).
Only one previous study in a temperate climate revealed surprisingly high bee fitness
in suburban gardens, where bumble bee colony growth was higher in gardens compared
to improved farmland (Goulson et al. 2002). Goulson et al. (2002) however provided
first evidence that improved plant resource availability and diversity in gardens may in
fact support high bee abundances, as frequently observed in urban and suburban gardens
in temperate zones (Eremeeva and Sushchev 2005; Hisamatsu and Yamane 2006;
Fetridge et al. 2008; Matteson et al. 2008; Samnegård et al. 2011; Lowenstein et al.
2014; Baldock et al. 2015), though some studies noted exceptions (McKinney 2008;
Bates et al. 2011). Higher bee abundances and visitation rates in urban habitats can lead
to higher fruit and seed set in gardens and can thus directly affect human food
production (Lowenstein et al. 2015; Theodorou et al. 2016). Surveys of bee abundances
are however rare for subtropical urban environments (McIntyre and Hostetler 2001;
Cane et al. 2006; Gotlieb et al. 2011; Wojcik and McBride 2012; Threlfall et al. 2015)
and even fewer studied bees in tropical urban habitat (Zanette et al. 2005; Nemésio and
Silveira 2007). Understanding the link of bee fitness, bee abundance and pollination
service may however be specifically important in tropical environments, because
dependency on bee pollinators increases towards the tropics (Winfree 2010; Ollerton et
VI. Synopsis
_____ 184
al. 2011) and with generally higher biodiversity in tropical habitats, loss of natural
habitat due to urbanization has even more devastating effects (Bradshaw et al. 2009;
Seto et al. 2012). Ultimately, the global situation of bees in urban gardens remains
unclear to date, but by providing the first bee fitness data for subtropical bees in urban
habitat, this thesis contributes new insights and an incentive to find more generalized
conclusions.
Furthermore, cities across the globe differ greatly in access to natural habitat, the
availability of green space and total plant diversity. Even within cities, bee assemblages
differ between neighbourhoods (Matteson et al. 2013; Lowenstein et al. 2014) or along
urbanization gradients (McKinney 2008; Ahrné et al. 2009), and the value of urban bee
habitat thus changes with socio-economic context or amount of sealed surfaces.
Therefore, there is no unified definition of suburban or urban garden habitat.
Consequently, studies can show seemingly conflicting evidence when using habitat
categories, e.g. when comparing ‗gardens‘ to ‗rural habitats‘ (Bates et al. 2011; Baldock
et al. 2015). It is therefore of great importance to identify the underlying key factors
driving bee foraging and fitness in gardens, e.g. resource abundance and plant richness
(Chapter IV & V).
It has been recently suggested to classify the current geological epoch as the
‘Anthropocene‘, to acknowledge how human activities permanently reshaped the planet, as future geologists will find the dawn of the Anthropocene marked in ice and soil
layers by ash, fertilizer, pesticides and plastic (Carey 2016). Human impacts are now at
least as important as natural processes in ecosystems, adding new significant selection
pressures on organisms, but also offering novel ecosystems for species to inhabit
(Corlett 2015). The primary human habitats, cities, are predicted to expand massively in
the next decades, with urban land cover increasing by 1.2 million km² until 2030, thus
nearly tripling the global urban land area compared to 2000 (Seto et al. 2012). As a
result, planning decisions for urban infrastructure made today will have vast impacts on
how coming generations will live and if other species will be able to co-inhabit our
urban environments. Urban planners are thus calling on ecologists to take a proactive
role and help design better urban environments to achieve conservation goals (Chapin
and Fernandez 2013; Felson et al. 2013). To understand whether and how species (e.g.
bees) can actually adapt to urban habitat, comparative studies measuring fitness benefits
of novel traits in urban environments will become increasingly relevant (Donihue and
Lambert 2015).
6.4. Effects of plant biodiversity on social bees
_____ 185
Biodiversity trends in the Anthropocene depend on spatial scale, but while current
knowledge is still patchy, it has been suggested that global plant diversity could actually
increase due to hybridization of plants with introduced species (Thomas 2013; McGill
et al. 2015). In urban habitats, plant richness was often found to increase with moderate
urbanization due to high richness of introduced plants (McKinney 2008; Baldock et al.
2015), as garden owners often plant a diverse mix of native and exotic plants to feature
flowers in multiple seasons (Head et al. 2004; Loram et al. 2008; Shwartz et al. 2014).
While this is often done purely for aesthetical reasons, high plant richness and season-
long flowering also provides a continuous supply of floral resources for many
pollinators and can thus support larger bee populations (Antonini and Martins 2003;
Hülsmann et al. 2015).
Our studies revealed that increased resource foraging and fitness of bees in urban
gardens is directly driven by plant species richness (Chapter II-V). We thus found that
bees can clearly benefit from increasing plant richness and utilize native and exotic
plants alike. Our findings are however likely limited to generalist social bees, as some
bee species may depend on (specific) native plants more strongly and will consequently
be absent in urban habitats (Pardee and Philpott 2014; Harrison and Winfree 2015). Our
results highlight that, while overall plant diversity is of critical importance for generalist
social bees, plant richness can be natural or artificial and can be provided by native as
well as exotic plants and by maintaining plant diversity in cities we may be able to
create a nurturing environment for humans as well as other species. Social bees show a
great potential to thrive in urban habitats, yet whether they can actually adapt to man-
made habitats beyond mere co-existence remains to be investigated.
6.4. Effects of plant biodiversity on social bees While it has been long observed that biodiverse natural and semi-natural habitats
support highest bee species richness and abundance (Winfree et al. 2009; Kennedy et al.
2013), the mechanisms, how biodiversity may benefit bee species, remained unknown.
Conversely, studies occasionally found surprisingly high bee abundance and diversity in
disturbed or otherwise anthropogenically formed habitat, such as gardens (Winfree et al.
2007; Fetridge et al. 2008; Gotlieb et al. 2011; Hinners et al. 2012), but plant
biodiversity as underlying concept driving bee fitness and consequently bee populations
has not yet been systematically investigated.
We predicted two main conceptual paths of how higher biodiversity may affect bee
VI. Synopsis
_____ 186
foraging and ultimately bee fitness (Chapter I: Figure I.3A & B): (a) via higher plant
species richness and thus greater resource diversity and (b) via continuous plant
resource availability across seasons. First, we found that bees can greatly utilize high
resource diversity in diverse habitats and even maximize the diversity of collected plant
resources (Chapter IV). Second, we found that bees are able to maintain high or highest
foraging activity and thus resource intake across all seasons in landscapes with highest
plant biodiversity (i.e. gardens in our study; Chapter II).
Of the predicted second tier effects of biodiversity, namely on resource quality and
quantity (Figure I.3C), we found clear evidence that foraged resource quantity (overall
food stores in the nest) is highest in the habitats with highest plant richness (Chapter V).
In contrast, quality of resources collected by foragers and in nest storage pots were
typically independent of overall plant species richness (amount of pollen protein, amino
acids, sugar concentration of nectar or honey, antimicrobial activity of resin), but some
measurements of resource quality were found to increase with plant richness
(phosphorus and other micro nutrients in pollen, Chapter V). Instead, the presence of
specific plant species providing high quality resources (e.g. protein-rich macadamia
pollen) or resource compounds (as contained in resins of some eucalypt trees) seem to
be more relevant to maintain resource quality and functionality (Chapter IV). Single
resources can thus even be found in high quality in impoverished landscapes (e.g.
macadamia plantations). However, as nutritional bottlenecks or dependencies on
particular plant species (or specific plant resources) are often unknown for bee species,
higher plant biodiversity can clearly safeguard for resource quality limitations as well.
Overall, bee hive reproduction benefits from greater plant species richness, as high
plant species richness supports a continuous resource supply and, in total, greater
colony food storages (Figure I.3D). Both the overall colony population (brood volume)
and the number of reproductive animals (queens) increase with plant richness and
resource quantity (i.e. colony food stores, Chapter V). In contrast, fitness of individual
workers was not linked to plant biodiversity, i.e. plant species richness. While fitness of
individuals can be impaired by reduced resource quantity or quality (Quezada-Euan et
al. 2011; Pech-May et al. 2012), the colonies in our study seem to primarily reduce the
total number of workers produced when facing resource scarcities, instead of producing
workers with lower fitness (Chapter V).
Theoretical predictions and integrative models highlight that habitats with higher
biodiversity and higher plant richness have a higher biomass productivity (Duffy et al.
2007; Grace et al. 2016) and thus produce a greater total abundance of plant resources to
be exploited by consumers. In our studies, we quantified the total plant resource
6.4. Effects of plant biodiversity on social bees
_____ 187
abundance available per plot per year. Our measurement of plant resource abundance
strongly weighs common species over rare ones and flowering trees over herbs, thereby
rating forests higher than gardens. However, we found total plant resource abundance
(summed up over the whole year) to be weaker predictor of bee foraging and fitness
than plant species richness per se. While both plant richness and overall plant resource
abundance affected the diversity of foraged resources, only plant richness directly
affected bee fitness (Chapter IV & V).
Higher plant biodiversity in landscapes can also offer a wider range of flowering
phenologies (i.e. flowers might be available in different months), and phenological
complementarity is predicted to provide more continuous resource availability across
seasons (Blüthgen and Klein 2011). In fact, continuously high floral resource
availability in landscapes was shown to improve bee fitness and increase overall
diversity and abundance of bee species (Hines and Hendrix 2005; Williams et al. 2012).
These findings are in accordance with our studies, as we observed continuously high
foraging rates (and consequently larger food stores) in habitats with highest plant
species richness (i.e. gardens; Chapter II). By investigating total plant resource
abundance and plant richness effects separately, our results further support that (at least
generalist social) bee species foraging and fitness seem to be more directly limited by
continuous resource availability, which we attribute to lower plant species richness
(Chapter V). Thus food resources do not only need to be available in sufficient
abundance, they need to be dependably available over long periods for bee colonies to
successively build up the colony population, including foragers and reproductives. This
limitation gains even more importance when the total foraging and reproduction period
is shorter, e.g. in temperate zones (Williams et al. 2012; Requier et al. 2015). While
social bee colonies can respond to a temporal overabundance of food resources by
increasing foraging activity (Chapter II), a colony needs to have a large enough
population to recruit for foraging. A small bee colony may benefit only little from
pulsed mass flowering, as they first need to invest the freshly foraged resources into
new worker reproduction. New workers of these colonies may thus hatch too late to
utilize abundant, but short-lived resources, resulting in comparatively lower food intake
for weak colonies (e.g. in plantations, Chapter II & V). In contrast, colonies maintaining
greater food stores and a larger worker population may be quicker to respond and with
greater reward to pulsed floral resources, but face higher costs to maintain the larger
population. These costs can however be met when food resources are continuously
available and colonies command larger food reserves (e.g. in gardens, Chapter II & V).
Forests had on average a higher number of flowering trees and thus greater plant
VI. Synopsis
_____ 188
resource abundance than gardens, yet gardens provided higher plant richness and thus a
continuous resource availability, allowing colonies to maintain larger food storages in
nests and consequently promoted higher fitness and colony reproduction
(Chapter IV & V). Social bee fitness thus thrives in biodiverse habitats, as they provide
continuous resource availability which in turn helps maintain greater colony resource
reserves. Our studies therefore illustrate the mechanisms, how plant biodiversity can
affect social bee fitness. While we identified multiple complex interactions between the
studied factors, the study system seems to be less complex than anticipated, as
important fitness factors were strongly driven by plant species richness (Figure V.3).
Consequently, this thesis highlights the outstanding role of plant biodiversity on bee
resource foraging and fitness.
Studying bee fitness in response to resource availability and diversity in landscapes
greatly improves our understanding of the relationship between plant biodiversity and
bee populations (Crone and Williams 2016), as it helps separating true bee population
size effects from short term behavioural responses to resource abundance (Chapter I).
National scale assessments showed that bee abundance is typically limited by plant
abundance and thus plant resources (Biesmeijer et al. 2006; Baude et al. 2016), but
existing large scale studies are limited to temperate climate zones. Generalist social bees
are of even greater importance in (sub-) tropical climate zones, as they often dominate
tropical bee communities (Klein et al. 2007; Winfree 2010). As bee population trends in
subtropical and tropical systems however remain critically understudied (Goulson et al.
2015), this thesis adds an important perspective, underlining that findings investigating
the plant resource - bee abundance relationship may be in fact universal across climate
zones. Moreover, while some studies previously showed the positive influence of plant
species richness on bee abundance (Antonini and Martins 2003; Hülsmann et al. 2015),
our work provides a mechanistic framework (at least for generalist social bees) and
identifies how biodiversity can drive bee abundance.
Expanded to a general scope, plant biodiversity, regardless whether it is provided by
native or exotic plants, seems to be of critical importance to protect food security for
bees and to ensure not only short term survival, but indeed reproduction of bees.
Habitats with greater biodiversity can thus support greater bee abundances, safeguard
bee population survival and increase the resilience of the whole system. Human food
production widely benefits from wild bees for their free pollination services, and human
food security is consequently affected by biodiversity as well. It thus remains
imperative to maintain or create biodiverse landscapes to create refuges for both humans
and wild bees.
6.5. References
_____ 189
6.5. References Ahrné, K., J. Bengtsson and T. Elmqvist (2009). "Bumble bees (Bombus spp) along a gradient
of increasing urbanization". Plos One, 4(5): e5574.
Antonini, Y. and R.P. Martins (2003). "The flowering-visiting bees at the ecological station of
the Universidade Federal de Minas Gerais, Belo Horizonte, MG, Brazil". Neotropical
Entomology, 32: 565-575.
Baldock, K.C.R., M.A. Goddard, D.M. Hicks, W.E. Kunin, N. Mitschunas, L.M. Osgathorpe,
(...) J. Memmott (2015). "Where is the UK's pollinator biodiversity? The importance of
urban areas for flower-visiting insects". Proceedings of the Royal Society B: Biological
Sciences, 282(1803).
Bates, A.J., J.P. Sadler, A.J. Fairbrass, S.J. Falk, J.D. Hale and T.J. Matthews (2011).
"Changing bee and hoverfly pollinator assemblages along an urban-rural gradient". Plos
One, 6(8): e23459.
Baude, M., W.E. Kunin, N.D. Boatman, S. Conyers, N. Davies, M.A.K. Gillespie, (...) J.
Memmott (2016). "Historical nectar assessment reveals the fall and rise of floral
resources in Britain". Nature, 530(7588): 85-88.
Biesmeijer, J.C., S.P.M. Roberts, M. Reemer, R. Ohlemuller, M. Edwards, T. Peeters, (...) W.E.
Kunin (2006). "Parallel declines in pollinators and insect-pollinated plants in Britain
and the Netherlands". Science, 313(5785): 351-354.
Blüthgen, N. and A.M. Klein (2011). "Functional complementarity and specialisation: Why
biodiversity is important in plant-pollinator interactions.". Basic and Applied Ecology,
12: 282-291.
Bradshaw, C.J.A., N.S. Sodhi and B.W. Brook (2009). "Tropical turmoil: a biodiversity tragedy
in progress". Frontiers in Ecology and the Environment, 7(2): 79-87.
Brittain, C., N. Williams, C. Kremen and A.M. Klein (2013). "Synergistic effects of non-Apis
bees and honey bees for pollination services". Proceedings of the Royal Society B:
Biological Sciences, 280(1754).
Cane, J.H., R.L. Minckley, L.J. Kervin, T.H. Roulston and N.M. Williams (2006). "Complex
responses within a desert bee guild (Hymenoptera : Apiformes) to urban habitat
fragmentation". Ecological Applications, 16(2): 632-644.
Carey, J. (2016). "Core Concept: Are we in the ―Anthropocene‖?". Proceedings of the National
Academy of Sciences of the United States of America, 113(15): 3908-3909.
Chapin, F.S.I. and E. Fernandez (2013). "Proactive ecology for the Anthropocene". Elementa:
Science of the Anthropocene, 1(1): 000013.
Corlett, R.T. (2015). "The Anthropocene concept in ecology and conservation". Trends in
Ecology and Evolution, 30(1): 36-41.
VI. Synopsis
_____ 190
Crone, E.E. and N.M. Williams (2016). "Bumble bee colony dynamics: quantifying the
importance of land use and floral resources for colony growth and queen production".
Ecology Letters, 19(4): 460-468.
Donihue, C.M. and M.R. Lambert (2015). "Adaptive evolution in urban ecosystems". Ambio,
44(3): 194-203.
Duffy, J.E., B.J. Carinale, K.E. France, P.B. McIntyre, E. Thebault and M. Loreau (2007). "The
functional role of biodiversity in ecosystems: incorporating trophic complexity".
Ecology Letters, 10(6): 522-538.
Eremeeva, N.I. and D.V. Sushchev (2005). "Structural changes in the fauna of pollinating
insects in urban landscapes". Russian Journal of Ecology, 36(4): 259-265.
Felson, A.J., E.E. Oldfield and M.A. Bradford (2013). "Involving ecologists in shaping large-
scale green infrastructure projects". Bioscience, 63(11): 882-890.
Fetridge, E.D., J.S. Ascher and G.A. Langellotto (2008). "The bee fauna of residential gardens
in a suburb of New York City (Hymenoptera: Apoidea)". Annals of the Entomological
Society of America, 101(6): 1067-1077.
Gotlieb, A., Y. Hollender and Y. Mandelik (2011). "Gardening in the desert changes bee
communities and pollination network characteristics". Basic and Applied Ecology,
12(4): 310-320.
Goulson, D., W.O.H. Hughes, L.C. Derwent and J.C. Stout (2002). "Colony growth of the
bumblebee, Bombus terrestris, in improved and conventional agricultural and suburban
habitats". Oecologia, 130(2): 267-273.
Goulson, D., E. Nicholls, C. Botías and E.L. Rotheray (2015). "Bee declines driven by
combined stress from parasites, pesticides, and lack of flowers". Science, 347(6229).
Grace, J.B., T.M. Anderson, E.W. Seabloom, E.T. Borer, P.B. Adler, W.S. Harpole, (...) M.D.
Smith (2016). "Integrative modelling reveals mechanisms linking productivity and plant
species richness". Nature, 529(7586): 390-393.
Harrison, T. and R. Winfree (2015). "Urban drivers of plant-pollinator interactions". Functional
Ecology, 29(7): 879-888.
Head, L., P. Muir and E. Hampel (2004). "Australian backyard gardens and the journey of
migration". Geographical Review, 94(3): 326-347.
Heard, T. (1994). "Behaviour and pollinator efficiency of stingless bees and honey bees on
macadamia flowers". Journal of Apicultural Research, 33(4): 191-198.
Heard, T.A. (2016). "The Australian native bee book. Keeping stingless bee hives for pets,
pollination and sugarbag hone". Sugarbag Bees, Brisbane.
Heard, T.A. and E.M. Exley (1994). "Diversity, abundance and distribution of insect visitors to
macadamia flowers". Environmental Entomology, 23(1): 91-100.
6.5. References
_____ 191
Hines, H.M. and S.D. Hendrix (2005). "Bumble bee (Hymenoptera: Apidae) diversity and
abundance in tallgrass prairie patches: effects of local and landscape floral resources".
Environmental Entomology, 34: 1477-1484.
Hinners, S.J., C.A. Kearns and C.A. Wessman (2012). "Roles of scale, matrix, and native
habitat in supporting a diverse suburban pollinator assemblage". Ecological
Applications, 22(7): 1923-1935.
Hisamatsu, M. and S. Yamane (2006). "Faunal makeup of wild bees and their flower utilization
in a semi-urbanized area in central Japan". Entomological Science, 9(2): 137-145.
Hoover, S.E.R., J.J. Ladley, A.A. Shchepetkina, M. Tisch, S.P. Gieseg and J.M. Tylianakis
(2012). "Warming, CO2, and nitrogen deposition interactively affect a plant-pollinator
mutualism". Ecology Letters, 15(3): 227-234.
Hülsmann, M., H. von Wehrden, A.-M. Klein and S. Leonhardt (2015). "Plant diversity and
composition compensate for negative effects of urbanization on foraging bumble bees".
Apidologie: 1-11.
Kennedy, C.M., E. Lonsdorf, M.C. Neel, N.M. Williams, T.H. Ricketts, R. Winfree, (...) C.
Kremen (2013). "A global quantitative synthesis of local and landscape effects on wild
bee pollinators in agroecosystems". Ecology Letters, 16(5): 584-599.
Klein, A.-M., B.E. Vaissiere, J.H. Cane, I. Steffan-Dewenter, S.A. Cunningham, C. Kremen and
T. Tscharntke (2007). "Importance of pollinators in changing landscapes for world
crops". Proceedings of the Royal Society B: Biological Sciences, 274(1608): 303-313.
Loram, A., K. Thompson, P.H. Warren and K.J. Gaston (2008). "Urban domestic gardens (XII):
The richness and composition of the flora in five UK cities". Journal of Vegetation
Science, 19(3): 321-367.
Lowenstein, D.M., K.C. Matteson and E.S. Minor (2015). "Diversity of wild bees supports
pollination services in an urbanized landscape". Oecologia, 179(3): 811-821.
Lowenstein, D.M., K.C. Matteson, I. Xiao, A.M. Silva and E.S. Minor (2014). "Humans, bees,
and pollination services in the city: the case of Chicago, IL (USA)". Biodiversity and
Conservation, 23(11): 2857-2874.
Matteson, K.C., J.S. Ascher and G.A. Langellotto (2008). "Bee richness and abundance in New
York City urban gardens". Annals of the Entomological Society of America, 101(1):
140-150.
Matteson, K.C., J.B. Grace and E.S. Minor (2013). "Direct and indirect effects of land use on
floral resources and flower-visiting insects across an urban landscape". Oikos, 122(5):
682-694.
McGill, B.J., M. Dornelas, N.J. Gotelli and A.E. Magurran (2015). "Fifteen forms of
biodiversity trend in the Anthropocene". Trends in Ecology and Evolution, 30(2): 104-
113.
VI. Synopsis
_____ 192
McIntyre, N.E. and M.E. Hostetler (2001). "Effects of urban land use on pollinator
(Hymenoptera: Apoidea) communities in a desert metropolis". Basic and Applied
Ecology, 2(3): 209-218.
McKinney, M.L. (2008). "Effects of urbanization on species richness: A review of plants and
animals". Urban Ecosystems, 11(2): 161-176.
Nemésio, A. and F.A. Silveira (2007). "Orchid bee fauna (Hymenoptera: Apidae: Euglossina) of
Atlantic Forest fragments inside an urban area in southeastern Brazil". Neotropical
Entomology, 36: 186-191.
Nicholls, C.I. and M.A. Altieri (2013). "Plant biodiversity enhances bees and other insect
pollinators in agroecosystems. A review". Agronomy for Sustainable Development,
33(2): 257-274.
Ollerton, J., R. Winfree and S. Tarrant (2011). "How many flowering plants are pollinated by
animals?". Oikos, 120(3): 321-326.
Pardee, G.L. and S.M. Philpott (2014). "Native plants are the bee‘s knees: local and landscape predictors of bee richness and abundance in backyard gardens". Urban Ecosystems,
17(3): 641-659.
Pech-May, F.G., L. Medina-Medina, W.D. May-Itza, R.J. Paxton and J.J.G. Quezada-Euan
(2012). "Colony pollen reserves affect body size, sperm production and sexual
development in males of the stingless bee Melipona beecheii". Insectes Sociaux, 59(3):
417-424.
Quezada-Euan, J.J.G., A. Lopez-Velasco, J. Perez-Balam, H. Moo-Valle, A. Velazquez-
Madrazo and R.J. Paxton (2011). "Body size differs in workers produced across time
and is associated with variation in the quantity and composition of larval food in
Nannotrigona perilampoides (Hymenoptera, Meliponini)". Insectes Sociaux, 58(1): 31-
38.
Requier, F., J.-F. Odoux, T. Tamic, N. Moreau, M. Henry, A. Decourtye and V. Bretagnolle
(2015). "Honey bee diet in intensive farmland habitats reveals an unexpectedly high
flower richness and a major role of weeds". Ecological Applications, 25(4): 881-890.
Samnegård, U., A.S. Persson and H.G. Smith (2011). "Gardens benefit bees and enhance
pollination in intensively managed farmland". Biological Conservation, 144(11): 2602-
2606.
Seto, K.C., B. Güneralp and L.R. Hutyra (2012). "Global forecasts of urban expansion to 2030
and direct impacts on biodiversity and carbon pools". Proceedings of the National
Academy of Sciences of the United States of America, 109(40): 16083-16088.
Shwartz, A., A. Turbe, L. Simon and R. Julliard (2014). "Enhancing urban biodiversity and its
influence on city-dwellers: An experiment". Biological Conservation, 171: 82-90.
Smith, J.P., T.A. Heard, M. Beekman and R. Gloag (2016). "Flight range of the Australian
stingless bee Tetragonula carbonaria (Hymenoptera: Apidae)". Austral Entomology.
6.5. References
_____ 193
Theodorou, P., R. Radzevičiūtė, J. Settele, O. Schweiger, T.E. Murray and R.J. Paxton (2016). "Pollination services enhanced with urbanization despite increasing pollinator
parasitism". Proceedings of the Royal Society B: Biological Sciences, 283(1833).
Thomas, C.D. (2013). "The Anthropocene could raise biological diversity". Nature, 502(7469):
7.
Threlfall, C.G., K. Walker, N.S.G. Williams, A.K. Hahs, L. Mata, N. Stork and S.J. Livesley
(2015). "The conservation value of urban green space habitats for Australian native bee
communities". Biological Conservation, 187: 240-248.
Trueman, S.J. (2013). "The reproductive biology of macadamia". Scientia Horticulturae, 150:
354-359.
Vithanage, V. and D.A. Ironside (1986). "The insect pollinators of macadamia and their relative
importance". Journal of the Australian Institute of Agricultural Science, 52(3): 155-160.
Wallace, H.M., V. Vithanage and E.M. Exley (1996). "The effect of supplementary pollination
on nut set of Macadamia (Proteaceae)". Annals of Botany, 78(6): 765-773.
Williams, N.M., J. Regetz and C. Kremen (2012). "Landscape-scale resources promote colony
growth but not reproductive performance of bumble bees". Ecology, 93: 1049–1058.
Williams, N.M., K.L. Ward, N. Pope, R. Isaacs, J. Wilson, E.A. May, (...) J. Peters (2015).
"Native wildflower plantings support wild bee abundance and diversity in agricultural
landscapes across the United States". Ecological Applications, 25(8): 2119-2131.
Winfree, R. (2010). "The conservation and restoration of wild bees". Year in Ecology and
Conservation Biology 2010, 1195: 169-197.
Winfree, R., R. Aguilar, D.P. Vázquez, G. LeBuhn and M.A. Aizen (2009). "A meta-analysis of
bees' responses to anthropogenic disturbance". Ecology, 90(8): 2068-2076.
Winfree, R., T. Griswold and C. Kremen (2007). "Effect of human disturbance on bee
communities in a forested ecosystem". Conservation Biology, 21(1): 213-223.
Wojcik, V.A. and J.R. McBride (2012). "Common factors influence bee foraging in urban and
wildland landscapes". Urban Ecosystems, 15(3): 581-598.
Zanette, L.R.S., R.P. Martins and S.P. Ribeiro (2005). "Effects of urbanization on Neotropical
wasp and bee assemblages in a Brazilian metropolis". Landscape and Urban Planning,
71(2-4): 105-121.
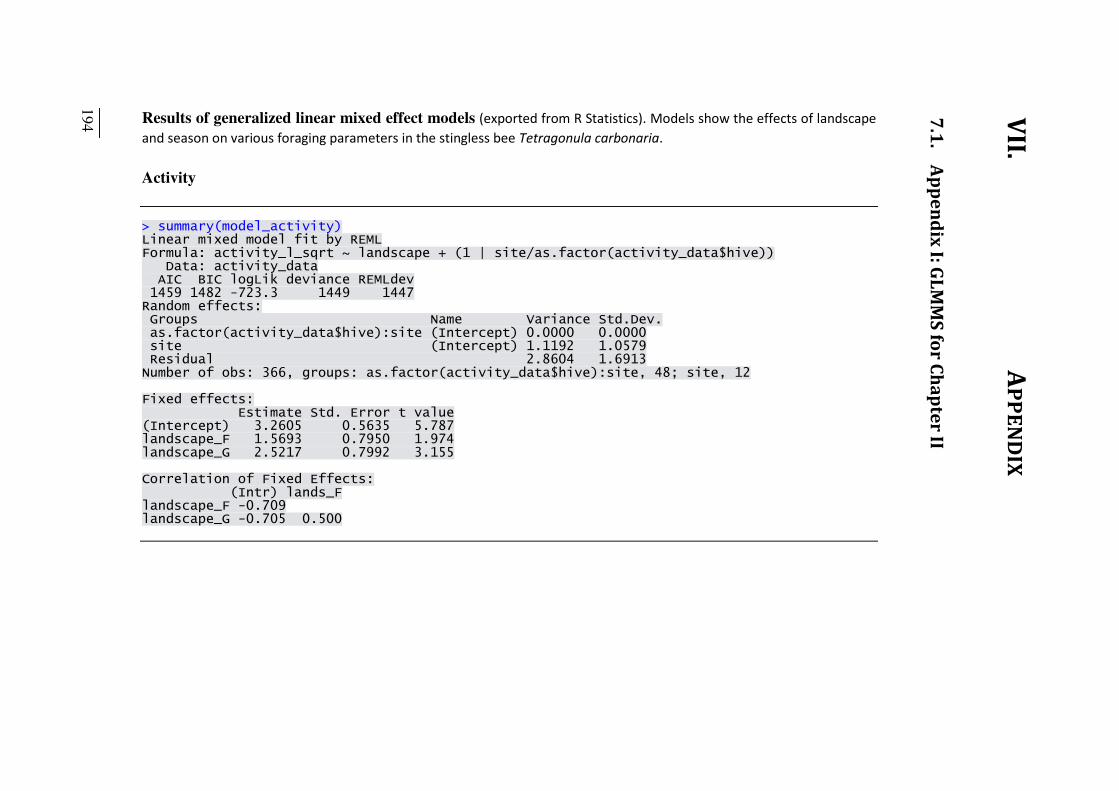
VII. APPENDIX 7.1. Appendix I: GLMMS for Chapter II
VII. APPENDIX
7.1. Appendix I: GLMMS for Chapter II Results of generalized linear mixed effect models (exported from R Statistics). Models show the effects of landscape and season on various foraging parameters in the stingless bee Tetragonula carbonaria.
Activity > summary(model_activity) Linear mixed model fit by REML Formula: activity_l_sqrt ~ landscape + (1 | site/as.factor(activity_data$hive)) Data: activity_data AIC BIC logLik deviance REMLdev 1459 1482 -723.3 1449 1447 Random effects: Groups Name Variance Std.Dev. as.factor(activity_data$hive):site (Intercept) 0.0000 0.0000 site (Intercept) 1.1192 1.0579 Residual 2.8604 1.6913 Number of obs: 366, groups: as.factor(activity_data$hive):site, 48; site, 12 Fixed effects: Estimate Std. Error t value (Intercept) 3.2605 0.5635 5.787 landscape_F 1.5693 0.7950 1.974 landscape_G 2.5217 0.7992 3.155 Correlation of Fixed Effects: (Intr) lands_F landscape_F -0.709 landscape_G -0.705 0.500
_____ 194
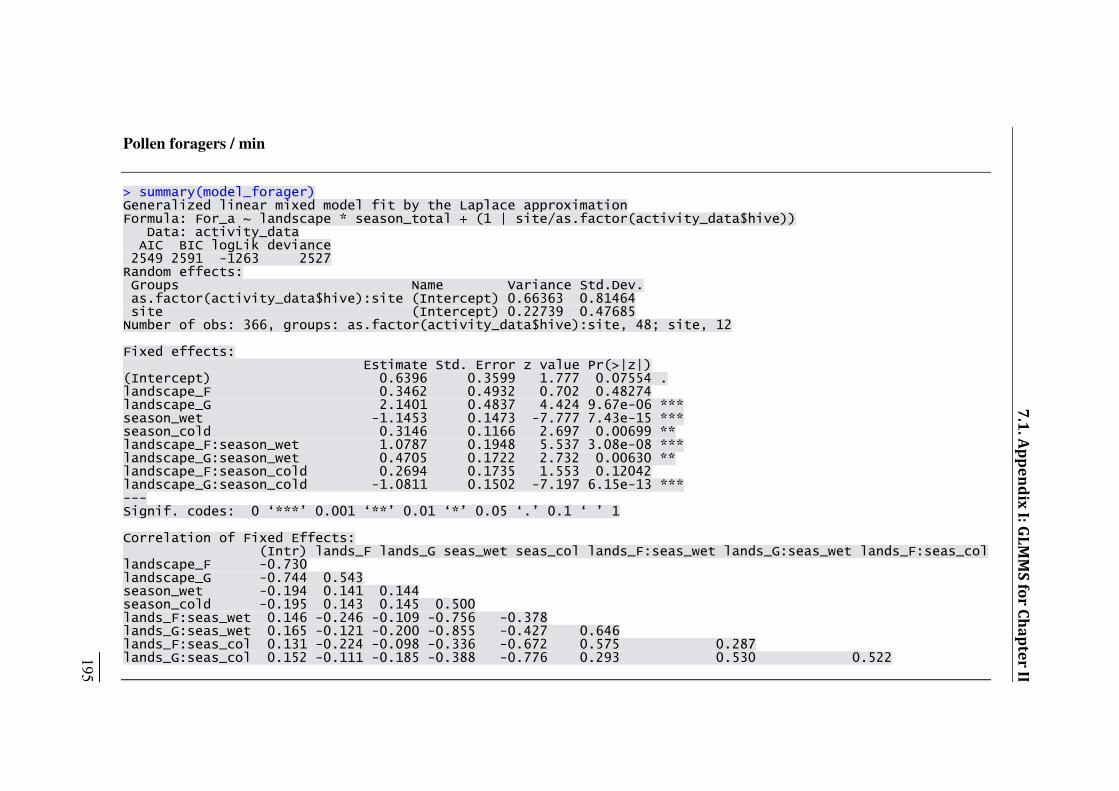
7.1. Appendix I: GLMMS for Chapter II _____ 195
Pollen foragers / min
> summary(model_forager) Generalized linear mixed model fit by the Laplace approximation Formula: For_a ~ landscape * season_total + (1 | site/as.factor(activity_data$hive)) Data: activity_data AIC BIC logLik deviance 2549 2591 -1263 2527 Random effects: Groups Name Variance Std.Dev. as.factor(activity_data$hive):site (Intercept) 0.66363 0.81464 site (Intercept) 0.22739 0.47685 Number of obs: 366, groups: as.factor(activity_data$hive):site, 48; site, 12 Fixed effects: Estimate Std. Error z value Pr(>|z|) (Intercept) 0.6396 0.3599 1.777 0.07554 . landscape_F 0.3462 0.4932 0.702 0.48274 landscape_G 2.1401 0.4837 4.424 9.67e-06 *** season_wet -1.1453 0.1473 -7.777 7.43e-15 *** season_cold 0.3146 0.1166 2.697 0.00699 ** landscape_F:season_wet 1.0787 0.1948 5.537 3.08e-08 *** landscape_G:season_wet 0.4705 0.1722 2.732 0.00630 ** landscape_F:season_cold 0.2694 0.1735 1.553 0.12042 landscape_G:season_cold -1.0811 0.1502 -7.197 6.15e-13 *** --- Signif. codes: 0 ‘***’ 0.001 ‘**’ 0.01 ‘*’ 0.05 ‘.’ 0.1 ‘ ’ 1 Correlation of Fixed Effects: (Intr) lands_F lands_G seas_wet seas_col lands_F:seas_wet lands_G:seas_wet lands_F:seas_col landscape_F -0.730 landscape_G -0.744 0.543 season_wet -0.194 0.141 0.144 season_cold -0.195 0.143 0.145 0.500 lands_F:seas_wet 0.146 -0.246 -0.109 -0.756 -0.378 lands_G:seas_wet 0.165 -0.121 -0.200 -0.855 -0.427 0.646 lands_F:seas_col 0.131 -0.224 -0.098 -0.336 -0.672 0.575 0.287 lands_G:seas_col 0.152 -0.111 -0.185 -0.388 -0.776 0.293 0.530 0.522
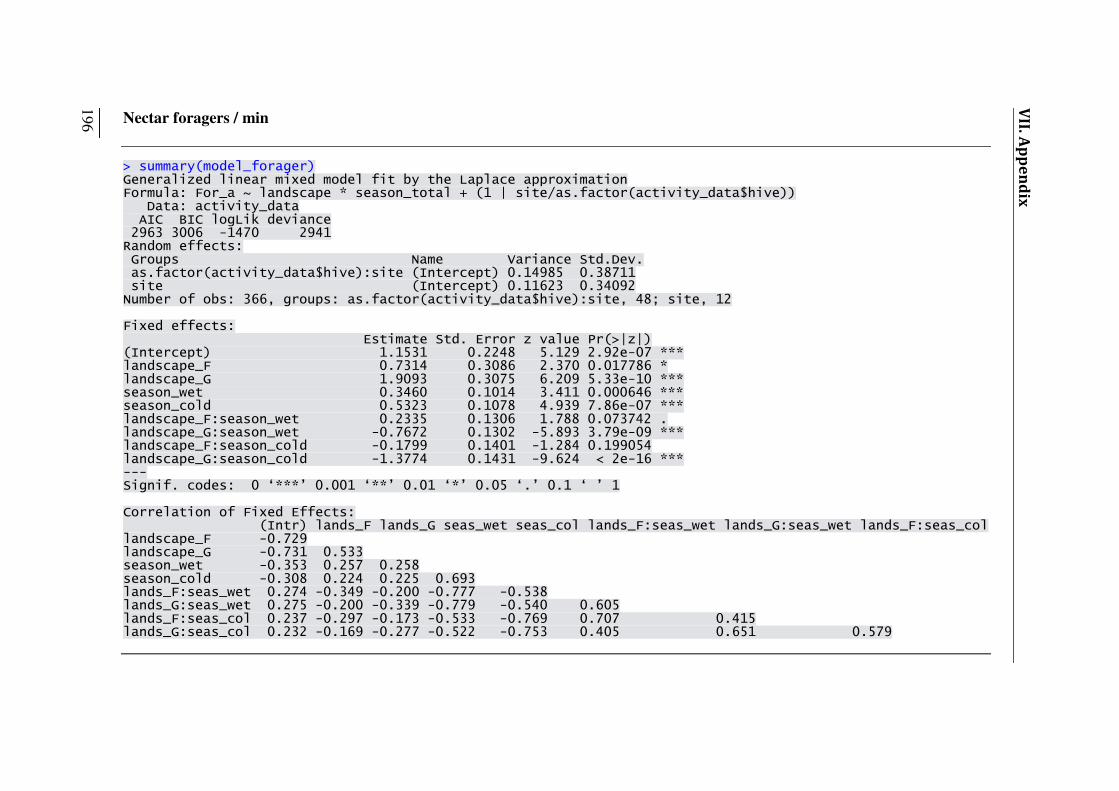
Nectar foragers / min
> summary(model_forager) Generalized linear mixed model fit by the Laplace approximation Formula: For_a ~ landscape * season_total + (1 | site/as.factor(activity_data$hive)) Data: activity_data AIC BIC logLik deviance 2963 3006 -1470 2941 Random effects: Groups Name Variance Std.Dev. as.factor(activity_data$hive):site (Intercept) 0.14985 0.38711 site (Intercept) 0.11623 0.34092 Number of obs: 366, groups: as.factor(activity_data$hive):site, 48; site, 12 Fixed effects: Estimate Std. Error z value Pr(>|z|) (Intercept) 1.1531 0.2248 5.129 2.92e-07 *** landscape_F 0.7314 0.3086 2.370 0.017786 * landscape_G 1.9093 0.3075 6.209 5.33e-10 *** season_wet 0.3460 0.1014 3.411 0.000646 *** season_cold 0.5323 0.1078 4.939 7.86e-07 *** landscape_F:season_wet 0.2335 0.1306 1.788 0.073742 . landscape_G:season_wet -0.7672 0.1302 -5.893 3.79e-09 *** landscape_F:season_cold -0.1799 0.1401 -1.284 0.199054 landscape_G:season_cold -1.3774 0.1431 -9.624 < 2e-16 *** --- Signif. codes: 0 ‘***’ 0.001 ‘**’ 0.01 ‘*’ 0.05 ‘.’ 0.1 ‘ ’ 1 Correlation of Fixed Effects: (Intr) lands_F lands_G seas_wet seas_col lands_F:seas_wet lands_G:seas_wet lands_F:seas_col landscape_F -0.729 landscape_G -0.731 0.533 season_wet -0.353 0.257 0.258 season_cold -0.308 0.224 0.225 0.693 lands_F:seas_wet 0.274 -0.349 -0.200 -0.777 -0.538 lands_G:seas_wet 0.275 -0.200 -0.339 -0.779 -0.540 0.605 lands_F:seas_col 0.237 -0.297 -0.173 -0.533 -0.769 0.707 0.415 lands_G:seas_col 0.232 -0.169 -0.277 -0.522 -0.753 0.405 0.651 0.579
VII. Appendix
_____ 196
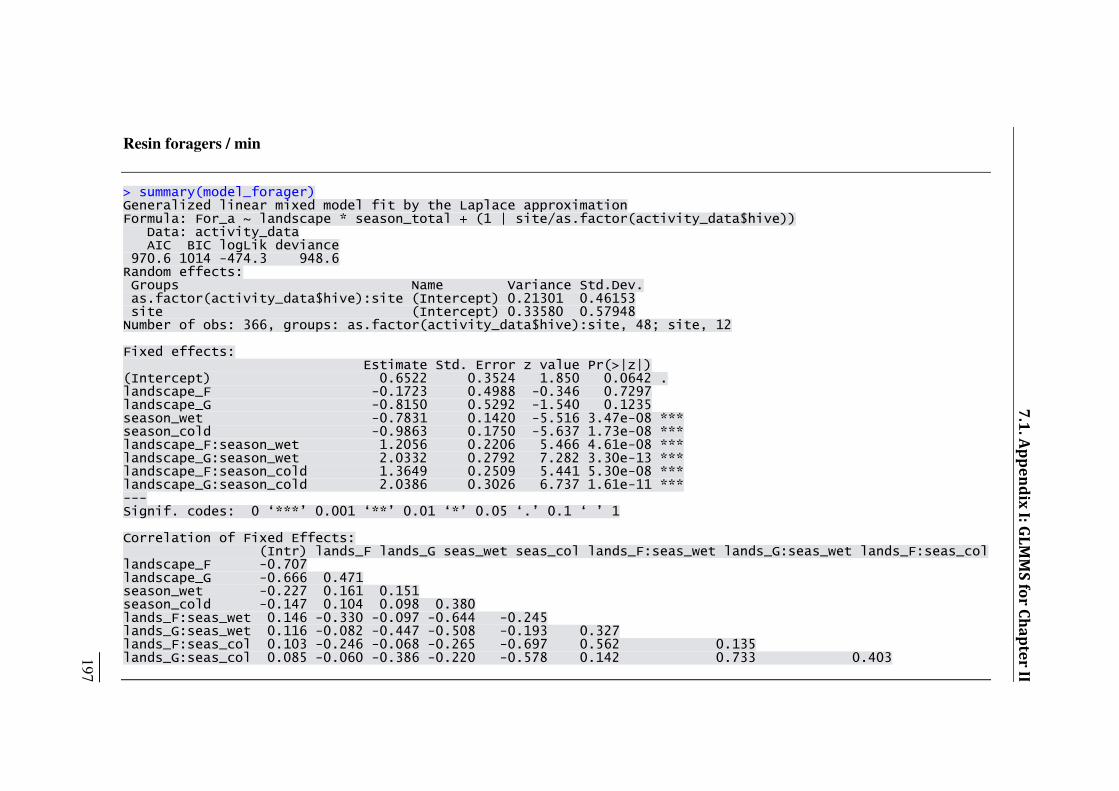
Resin foragers / min
> summary(model_forager) Generalized linear mixed model fit by the Laplace approximation Formula: For_a ~ landscape * season_total + (1 | site/as.factor(activity_data$hive)) Data: activity_data AIC BIC logLik deviance 970.6 1014 -474.3 948.6 Random effects: Groups Name Variance Std.Dev. as.factor(activity_data$hive):site (Intercept) 0.21301 0.46153 site (Intercept) 0.33580 0.57948 Number of obs: 366, groups: as.factor(activity_data$hive):site, 48; site, 12 Fixed effects: Estimate Std. Error z value Pr(>|z|) (Intercept) 0.6522 0.3524 1.850 0.0642 . landscape_F -0.1723 0.4988 -0.346 0.7297 landscape_G -0.8150 0.5292 -1.540 0.1235 season_wet -0.7831 0.1420 -5.516 3.47e-08 *** season_cold -0.9863 0.1750 -5.637 1.73e-08 *** landscape_F:season_wet 1.2056 0.2206 5.466 4.61e-08 *** landscape_G:season_wet 2.0332 0.2792 7.282 3.30e-13 *** landscape_F:season_cold 1.3649 0.2509 5.441 5.30e-08 *** landscape_G:season_cold 2.0386 0.3026 6.737 1.61e-11 *** --- Signif. codes: 0 ‘***’ 0.001 ‘**’ 0.01 ‘*’ 0.05 ‘.’ 0.1 ‘ ’ 1 Correlation of Fixed Effects: (Intr) lands_F lands_G seas_wet seas_col lands_F:seas_wet lands_G:seas_wet lands_F:seas_col landscape_F -0.707 landscape_G -0.666 0.471 season_wet -0.227 0.161 0.151 season_cold -0.147 0.104 0.098 0.380 lands_F:seas_wet 0.146 -0.330 -0.097 -0.644 -0.245 lands_G:seas_wet 0.116 -0.082 -0.447 -0.508 -0.193 0.327 lands_F:seas_col 0.103 -0.246 -0.068 -0.265 -0.697 0.562 0.135 lands_G:seas_col 0.085 -0.060 -0.386 -0.220 -0.578 0.142 0.733 0.403
_____ 197
7.1. Appendix I: GLMMS for Chapter II
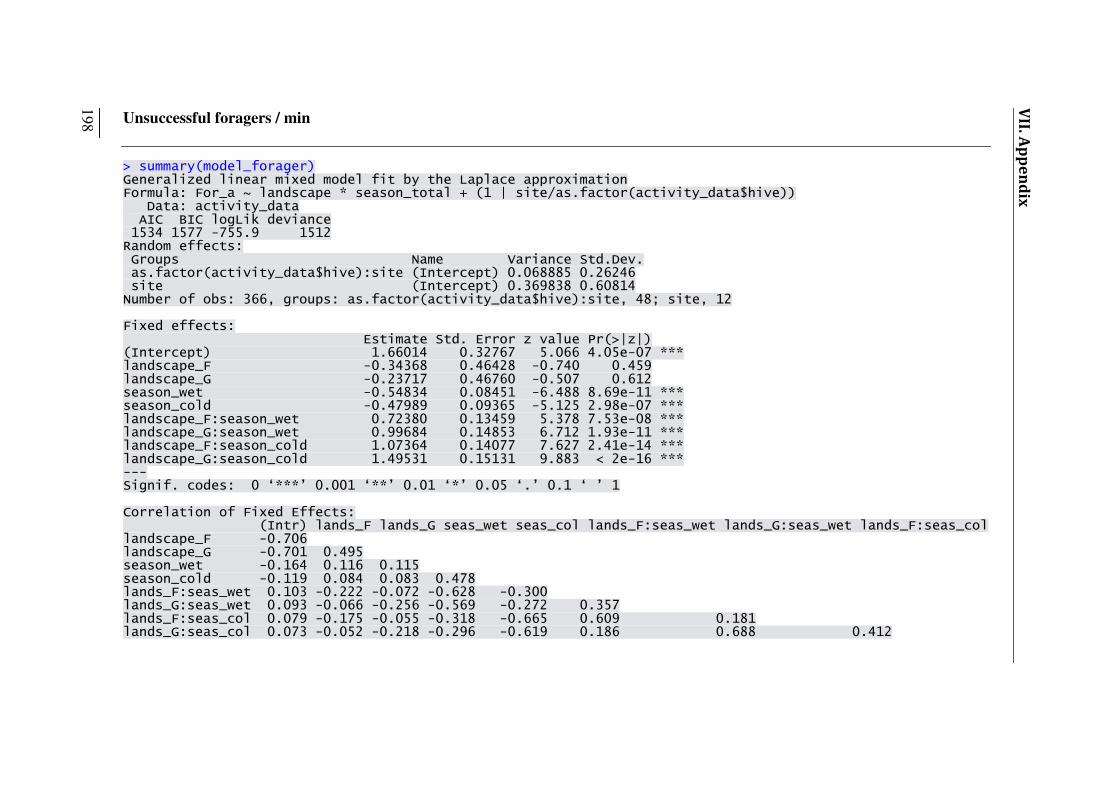
Unsuccessful foragers / min
> summary(model_forager) Generalized linear mixed model fit by the Laplace approximation Formula: For_a ~ landscape * season_total + (1 | site/as.factor(activity_data$hive)) Data: activity_data AIC BIC logLik deviance 1534 1577 -755.9 1512 Random effects: Groups Name Variance Std.Dev. as.factor(activity_data$hive):site (Intercept) 0.068885 0.26246 site (Intercept) 0.369838 0.60814 Number of obs: 366, groups: as.factor(activity_data$hive):site, 48; site, 12 Fixed effects: Estimate Std. Error z value Pr(>|z|) (Intercept) 1.66014 0.32767 5.066 4.05e-07 *** landscape_F -0.34368 0.46428 -0.740 0.459 landscape_G -0.23717 0.46760 -0.507 0.612 season_wet -0.54834 0.08451 -6.488 8.69e-11 *** season_cold -0.47989 0.09365 -5.125 2.98e-07 *** landscape_F:season_wet 0.72380 0.13459 5.378 7.53e-08 *** landscape_G:season_wet 0.99684 0.14853 6.712 1.93e-11 *** landscape_F:season_cold 1.07364 0.14077 7.627 2.41e-14 *** landscape_G:season_cold 1.49531 0.15131 9.883 < 2e-16 *** --- Signif. codes: 0 ‘***’ 0.001 ‘**’ 0.01 ‘*’ 0.05 ‘.’ 0.1 ‘ ’ 1 Correlation of Fixed Effects: (Intr) lands_F lands_G seas_wet seas_col lands_F:seas_wet lands_G:seas_wet lands_F:seas_col landscape_F -0.706 landscape_G -0.701 0.495 season_wet -0.164 0.116 0.115 season_cold -0.119 0.084 0.083 0.478 lands_F:seas_wet 0.103 -0.222 -0.072 -0.628 -0.300 lands_G:seas_wet 0.093 -0.066 -0.256 -0.569 -0.272 0.357 lands_F:seas_col 0.079 -0.175 -0.055 -0.318 -0.665 0.609 0.181 lands_G:seas_col 0.073 -0.052 -0.218 -0.296 -0.619 0.186 0.688 0.412
_____ 198
VII. Appendix

Proportion of pollen foragers
> summary(model_prop) Generalized linear mixed model fit by the Laplace approximation Formula: prop ~ landscape * season_total + (1 | site/as.factor(proportion$hive)) Data: proportion AIC BIC logLik deviance 1696 1740 -836.8 1674 Random effects: Groups Name Variance Std.Dev. as.factor(proportion$hive):site (Intercept) 0.481790 0.69411 site (Intercept) 0.093858 0.30636 Number of obs: 414, groups: as.factor(proportion$hive):site, 49; site, 12 Fixed effects: Estimate Std. Error z value Pr(>|z|) (Intercept) -1.40694 0.26392 -5.331 9.77e-08 *** landscape_F -0.03722 0.36537 -0.102 0.918862 landscape_G 0.32456 0.37454 0.867 0.386179 season_wet -1.06527 0.12499 -8.523 < 2e-16 *** season_cold -0.19096 0.12293 -1.553 0.120329 landscape_F:season_wet 0.75939 0.17611 4.312 1.62e-05 *** landscape_G:season_wet 0.93296 0.19393 4.811 1.50e-06 *** landscape_F:season_cold 0.59049 0.17869 3.305 0.000951 *** landscape_G:season_cold -0.02848 0.19942 -0.143 0.886436 --- Signif. codes: 0 ‘***’ 0.001 ‘**’ 0.01 ‘*’ 0.05 ‘.’ 0.1 ‘ ’ 1 Correlation of Fixed Effects: (Intr) lands_F lands_G seas_wet seas_col lands_F:seas_wet lands_G:seas_wet lands_F:seas_col landscape_F -0.722 landscape_G -0.705 0.509 season_wet -0.228 0.165 0.161 season_cold -0.182 0.132 0.128 0.393 lands_F:seas_wet 0.162 -0.287 -0.114 -0.710 -0.279 lands_G:seas_wet 0.147 -0.106 -0.341 -0.645 -0.253 0.457 lands_F:seas_col 0.125 -0.204 -0.088 -0.271 -0.688 0.429 0.174 lands_G:seas_col 0.112 -0.081 -0.274 -0.242 -0.616 0.172 0.527 0.424
_____ 199
7.1. Appendix I: GLMMS for Chapter II

Proportion of nectar foragers
> summary(model_prop) Generalized linear mixed model fit by the Laplace approximation Formula: prop ~ landscape * season_total + (1 | site/as.factor(proportion$hive)) Data: proportion AIC BIC logLik deviance 1768 1812 -872.9 1746 Random effects: Groups Name Variance Std.Dev. as.factor(proportion$hive):site (Intercept) 0.154868 0.39353 site (Intercept) 0.060565 0.24610 Number of obs: 414, groups: as.factor(proportion$hive):site, 49; site, 12 Fixed effects: Estimate Std. Error z value Pr(>|z|) (Intercept) -1.18047 0.18419 -6.409 1.47e-10 *** landscape_F 0.52127 0.25790 2.021 0.04326 * landscape_G 1.36665 0.26666 5.125 2.97e-07 *** season_wet 0.82250 0.09733 8.450 < 2e-16 *** season_cold 0.35407 0.11360 3.117 0.00183 ** landscape_F:season_wet -0.32605 0.14019 -2.326 0.02003 * landscape_G:season_wet -1.36592 0.15745 -8.675 < 2e-16 *** landscape_F:season_cold -0.50418 0.16141 -3.124 0.00179 ** landscape_G:season_cold -1.57039 0.18151 -8.652 < 2e-16 *** --- Signif. codes: 0 ‘***’ 0.001 ‘**’ 0.01 ‘*’ 0.05 ‘.’ 0.1 ‘ ’ 1 Correlation of Fixed Effects: (Intr) lands_F lands_G seas_wet seas_col lands_F:seas_wet lands_G:seas_wet lands_F:seas_col landscape_F -0.714 landscape_G -0.691 0.493 season_wet -0.367 0.262 0.253 season_cold -0.277 0.198 0.192 0.532 lands_F:seas_wet 0.255 -0.395 -0.176 -0.694 -0.369 lands_G:seas_wet 0.227 -0.162 -0.440 -0.618 -0.329 0.429 lands_F:seas_col 0.195 -0.277 -0.135 -0.375 -0.704 0.521 0.232 lands_G:seas_col 0.174 -0.124 -0.323 -0.333 -0.626 0.231 0.536 0.440
VII. Appendix
_____ 200
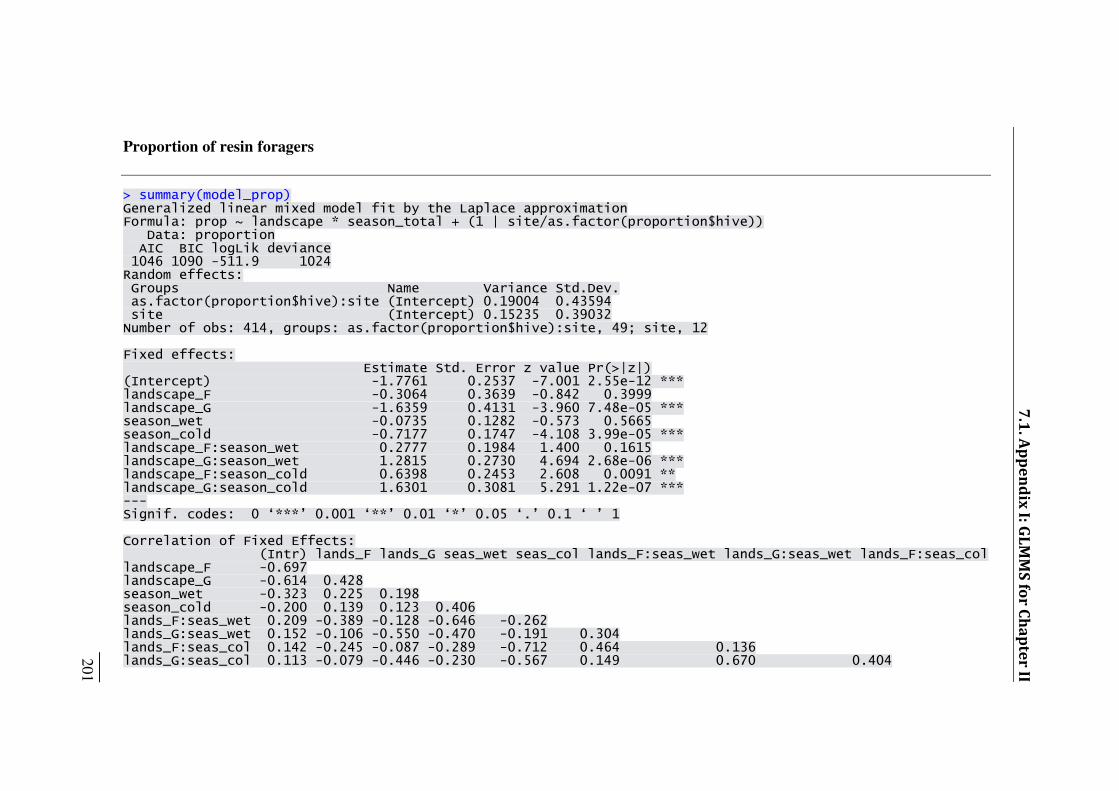
Proportion of resin foragers
> summary(model_prop) Generalized linear mixed model fit by the Laplace approximation Formula: prop ~ landscape * season_total + (1 | site/as.factor(proportion$hive)) Data: proportion AIC BIC logLik deviance 1046 1090 -511.9 1024 Random effects: Groups Name Variance Std.Dev. as.factor(proportion$hive):site (Intercept) 0.19004 0.43594 site (Intercept) 0.15235 0.39032 Number of obs: 414, groups: as.factor(proportion$hive):site, 49; site, 12 Fixed effects: Estimate Std. Error z value Pr(>|z|) (Intercept) -1.7761 0.2537 -7.001 2.55e-12 *** landscape_F -0.3064 0.3639 -0.842 0.3999 landscape_G -1.6359 0.4131 -3.960 7.48e-05 *** season_wet -0.0735 0.1282 -0.573 0.5665 season_cold -0.7177 0.1747 -4.108 3.99e-05 *** landscape_F:season_wet 0.2777 0.1984 1.400 0.1615 landscape_G:season_wet 1.2815 0.2730 4.694 2.68e-06 *** landscape_F:season_cold 0.6398 0.2453 2.608 0.0091 ** landscape_G:season_cold 1.6301 0.3081 5.291 1.22e-07 *** --- Signif. codes: 0 ‘***’ 0.001 ‘**’ 0.01 ‘*’ 0.05 ‘.’ 0.1 ‘ ’ 1 Correlation of Fixed Effects: (Intr) lands_F lands_G seas_wet seas_col lands_F:seas_wet lands_G:seas_wet lands_F:seas_col landscape_F -0.697 landscape_G -0.614 0.428 season_wet -0.323 0.225 0.198 season_cold -0.200 0.139 0.123 0.406 lands_F:seas_wet 0.209 -0.389 -0.128 -0.646 -0.262 lands_G:seas_wet 0.152 -0.106 -0.550 -0.470 -0.191 0.304 lands_F:seas_col 0.142 -0.245 -0.087 -0.289 -0.712 0.464 0.136 lands_G:seas_col 0.113 -0.079 -0.446 -0.230 -0.567 0.149 0.670 0.404 _____ 201
7.1. Appendix I: GLMMS for Chapter II
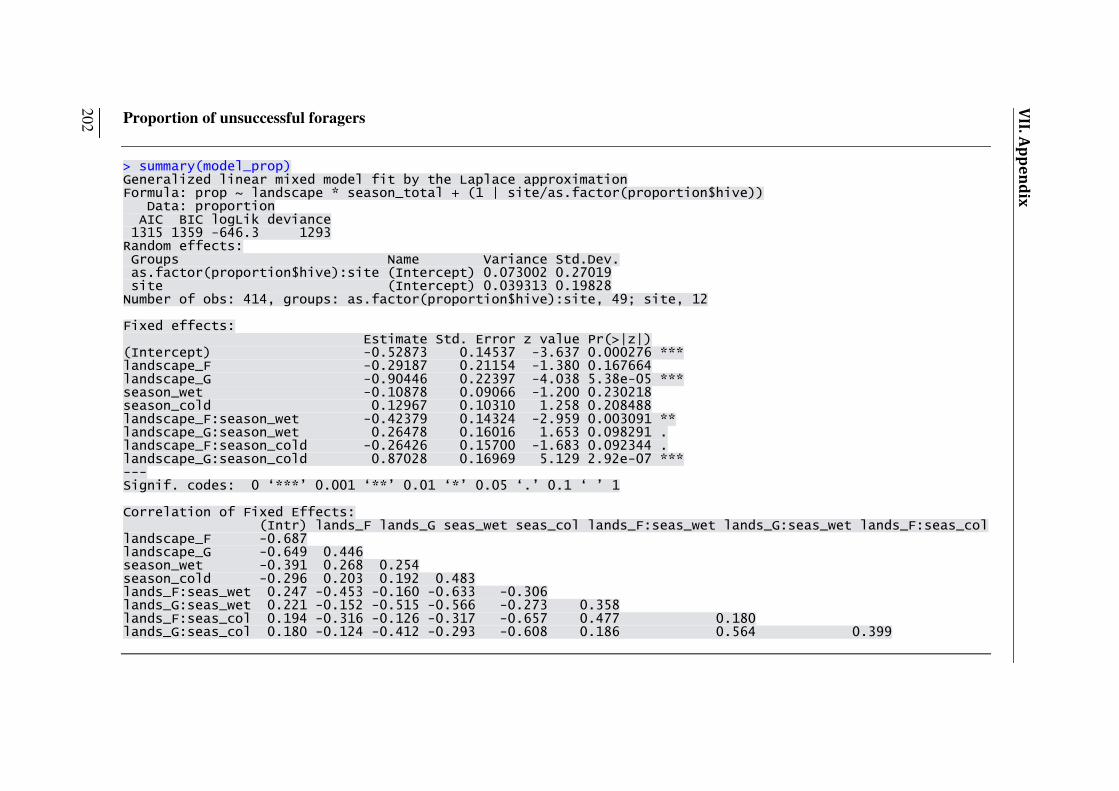
Proportion of unsuccessful foragers
> summary(model_prop) Generalized linear mixed model fit by the Laplace approximation Formula: prop ~ landscape * season_total + (1 | site/as.factor(proportion$hive)) Data: proportion AIC BIC logLik deviance 1315 1359 -646.3 1293 Random effects: Groups Name Variance Std.Dev. as.factor(proportion$hive):site (Intercept) 0.073002 0.27019 site (Intercept) 0.039313 0.19828 Number of obs: 414, groups: as.factor(proportion$hive):site, 49; site, 12 Fixed effects: Estimate Std. Error z value Pr(>|z|) (Intercept) -0.52873 0.14537 -3.637 0.000276 *** landscape_F -0.29187 0.21154 -1.380 0.167664 landscape_G -0.90446 0.22397 -4.038 5.38e-05 *** season_wet -0.10878 0.09066 -1.200 0.230218 season_cold 0.12967 0.10310 1.258 0.208488 landscape_F:season_wet -0.42379 0.14324 -2.959 0.003091 ** landscape_G:season_wet 0.26478 0.16016 1.653 0.098291 . landscape_F:season_cold -0.26426 0.15700 -1.683 0.092344 . landscape_G:season_cold 0.87028 0.16969 5.129 2.92e-07 *** --- Signif. codes: 0 ‘***’ 0.001 ‘**’ 0.01 ‘*’ 0.05 ‘.’ 0.1 ‘ ’ 1 Correlation of Fixed Effects: (Intr) lands_F lands_G seas_wet seas_col lands_F:seas_wet lands_G:seas_wet lands_F:seas_col landscape_F -0.687 landscape_G -0.649 0.446 season_wet -0.391 0.268 0.254 season_cold -0.296 0.203 0.192 0.483 lands_F:seas_wet 0.247 -0.453 -0.160 -0.633 -0.306 lands_G:seas_wet 0.221 -0.152 -0.515 -0.566 -0.273 0.358 lands_F:seas_col 0.194 -0.316 -0.126 -0.317 -0.657 0.477 0.180 lands_G:seas_col 0.180 -0.124 -0.412 -0.293 -0.608 0.186 0.564 0.399
_____ 202
VII. Appendix
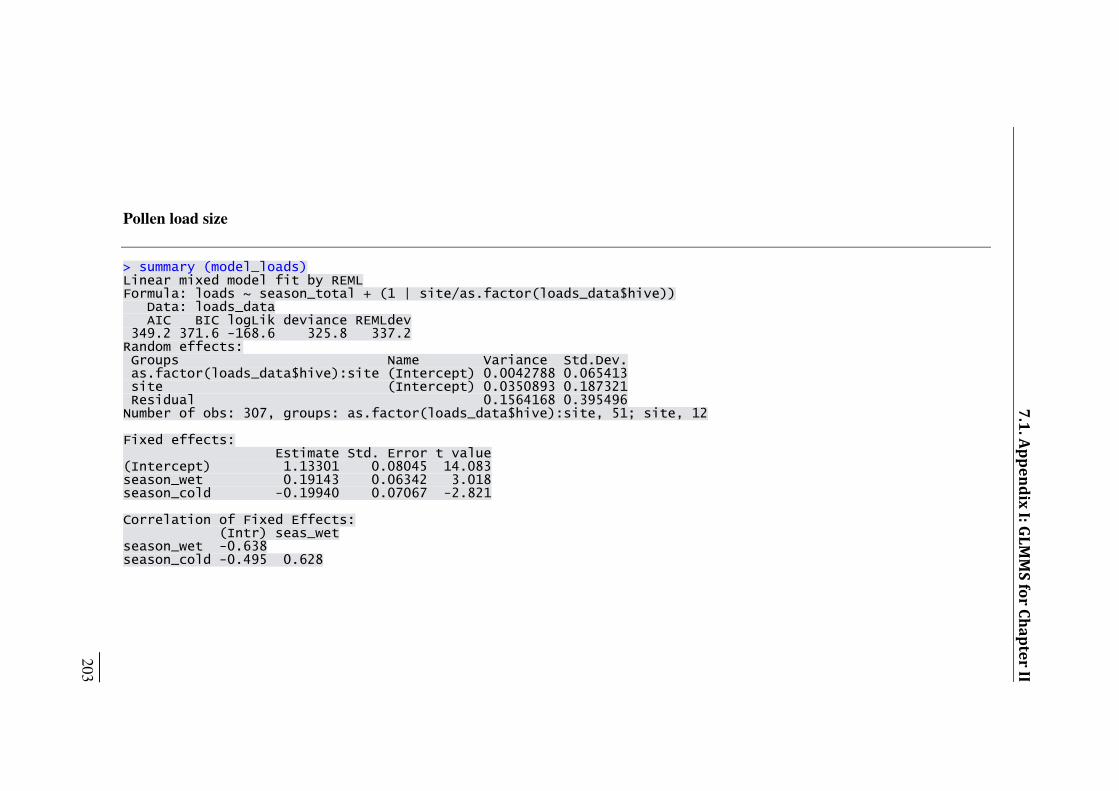
Pollen load size
> summary (model_loads) Linear mixed model fit by REML Formula: loads ~ season_total + (1 | site/as.factor(loads_data$hive)) Data: loads_data AIC BIC logLik deviance REMLdev 349.2 371.6 -168.6 325.8 337.2 Random effects: Groups Name Variance Std.Dev. as.factor(loads_data$hive):site (Intercept) 0.0042788 0.065413 site (Intercept) 0.0350893 0.187321 Residual 0.1564168 0.395496 Number of obs: 307, groups: as.factor(loads_data$hive):site, 51; site, 12 Fixed effects: Estimate Std. Error t value (Intercept) 1.13301 0.08045 14.083 season_wet 0.19143 0.06342 3.018 season_cold -0.19940 0.07067 -2.821 Correlation of Fixed Effects: (Intr) seas_wet season_wet -0.638 season_cold -0.495 0.628
_____ 203
7.1. Appendix I: GLMMS for Chapter II
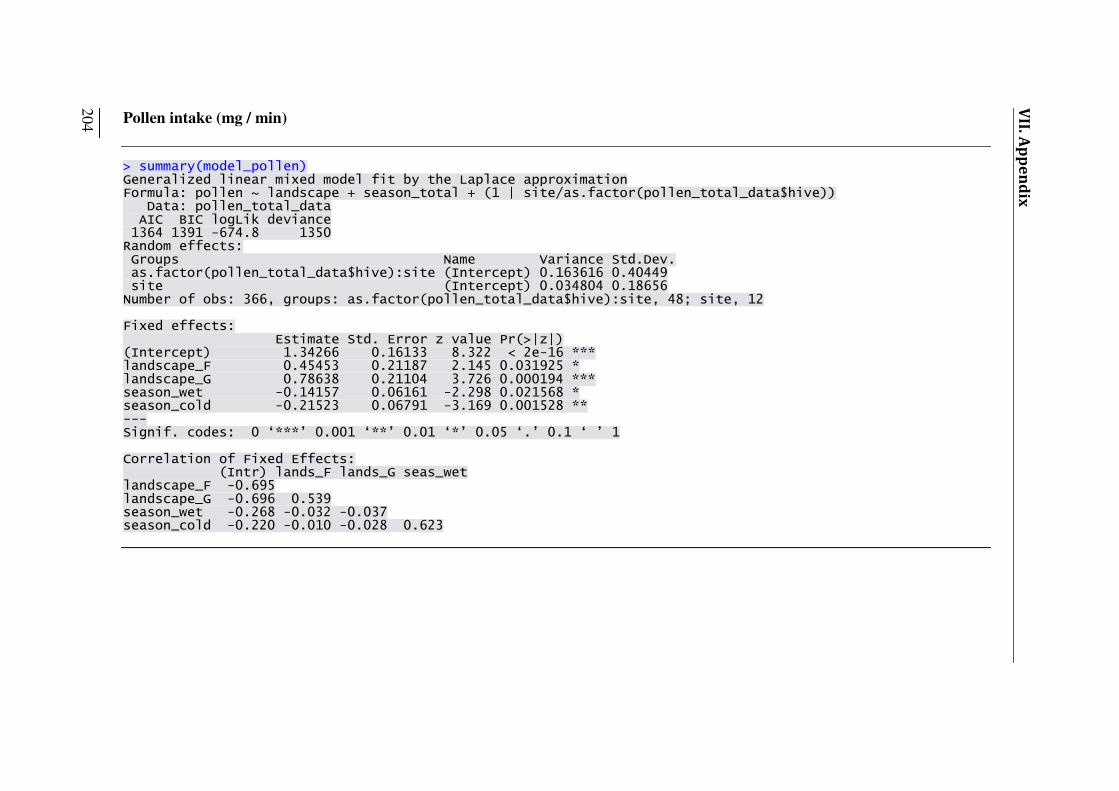
Pollen intake (mg / min)
> summary(model_pollen) Generalized linear mixed model fit by the Laplace approximation Formula: pollen ~ landscape + season_total + (1 | site/as.factor(pollen_total_data$hive)) Data: pollen_total_data AIC BIC logLik deviance 1364 1391 -674.8 1350 Random effects: Groups Name Variance Std.Dev. as.factor(pollen_total_data$hive):site (Intercept) 0.163616 0.40449 site (Intercept) 0.034804 0.18656 Number of obs: 366, groups: as.factor(pollen_total_data$hive):site, 48; site, 12 Fixed effects: Estimate Std. Error z value Pr(>|z|) (Intercept) 1.34266 0.16133 8.322 < 2e-16 *** landscape_F 0.45453 0.21187 2.145 0.031925 * landscape_G 0.78638 0.21104 3.726 0.000194 *** season_wet -0.14157 0.06161 -2.298 0.021568 * season_cold -0.21523 0.06791 -3.169 0.001528 ** --- Signif. codes: 0 ‘***’ 0.001 ‘**’ 0.01 ‘*’ 0.05 ‘.’ 0.1 ‘ ’ 1 Correlation of Fixed Effects: (Intr) lands_F lands_G seas_wet landscape_F -0.695 landscape_G -0.696 0.539 season_wet -0.268 -0.032 -0.037 season_cold -0.220 -0.010 -0.028 0.623
_____ 204
VII. Appendix
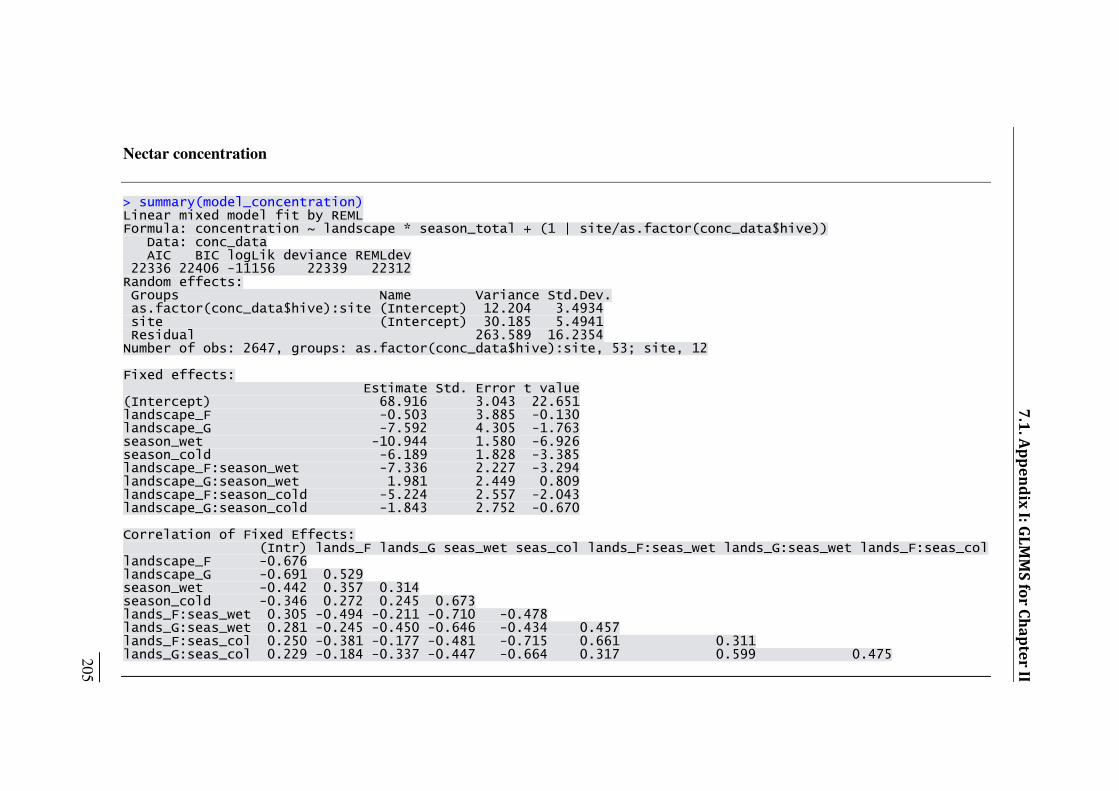
Nectar concentration
> summary(model_concentration) Linear mixed model fit by REML Formula: concentration ~ landscape * season_total + (1 | site/as.factor(conc_data$hive)) Data: conc_data AIC BIC logLik deviance REMLdev 22336 22406 -11156 22339 22312 Random effects: Groups Name Variance Std.Dev. as.factor(conc_data$hive):site (Intercept) 12.204 3.4934 site (Intercept) 30.185 5.4941 Residual 263.589 16.2354 Number of obs: 2647, groups: as.factor(conc_data$hive):site, 53; site, 12 Fixed effects: Estimate Std. Error t value (Intercept) 68.916 3.043 22.651 landscape_F -0.503 3.885 -0.130 landscape_G -7.592 4.305 -1.763 season_wet -10.944 1.580 -6.926 season_cold -6.189 1.828 -3.385 landscape_F:season_wet -7.336 2.227 -3.294 landscape_G:season_wet 1.981 2.449 0.809 landscape_F:season_cold -5.224 2.557 -2.043 landscape_G:season_cold -1.843 2.752 -0.670 Correlation of Fixed Effects: (Intr) lands_F lands_G seas_wet seas_col lands_F:seas_wet lands_G:seas_wet lands_F:seas_col landscape_F -0.676 landscape_G -0.691 0.529 season_wet -0.442 0.357 0.314 season_cold -0.346 0.272 0.245 0.673 lands_F:seas_wet 0.305 -0.494 -0.211 -0.710 -0.478 lands_G:seas_wet 0.281 -0.245 -0.450 -0.646 -0.434 0.457 lands_F:seas_col 0.250 -0.381 -0.177 -0.481 -0.715 0.661 0.311 lands_G:seas_col 0.229 -0.184 -0.337 -0.447 -0.664 0.317 0.599 0.475
_____ 205
7.1. Appendix I: GLMMS for Chapter II
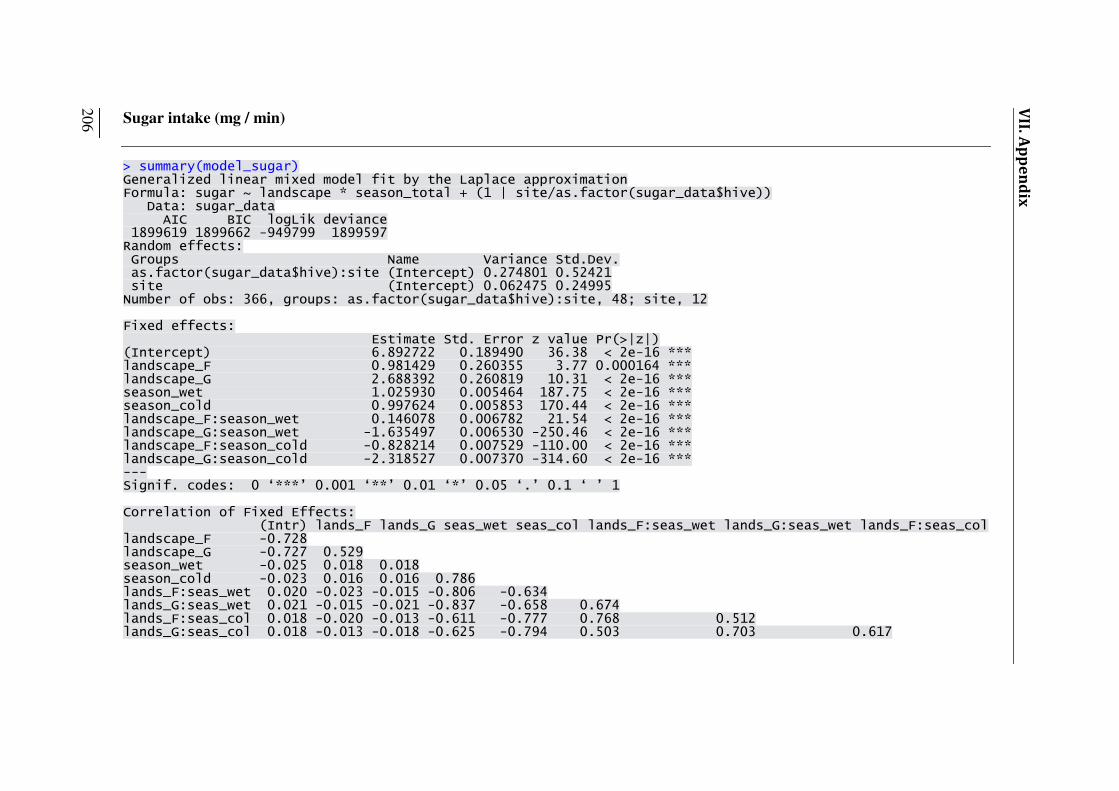
Sugar intake (mg / min)
> summary(model_sugar) Generalized linear mixed model fit by the Laplace approximation Formula: sugar ~ landscape * season_total + (1 | site/as.factor(sugar_data$hive)) Data: sugar_data AIC BIC logLik deviance 1899619 1899662 -949799 1899597 Random effects: Groups Name Variance Std.Dev. as.factor(sugar_data$hive):site (Intercept) 0.274801 0.52421 site (Intercept) 0.062475 0.24995 Number of obs: 366, groups: as.factor(sugar_data$hive):site, 48; site, 12 Fixed effects: Estimate Std. Error z value Pr(>|z|) (Intercept) 6.892722 0.189490 36.38 < 2e-16 *** landscape_F 0.981429 0.260355 3.77 0.000164 *** landscape_G 2.688392 0.260819 10.31 < 2e-16 *** season_wet 1.025930 0.005464 187.75 < 2e-16 *** season_cold 0.997624 0.005853 170.44 < 2e-16 *** landscape_F:season_wet 0.146078 0.006782 21.54 < 2e-16 *** landscape_G:season_wet -1.635497 0.006530 -250.46 < 2e-16 *** landscape_F:season_cold -0.828214 0.007529 -110.00 < 2e-16 *** landscape_G:season_cold -2.318527 0.007370 -314.60 < 2e-16 *** --- Signif. codes: 0 ‘***’ 0.001 ‘**’ 0.01 ‘*’ 0.05 ‘.’ 0.1 ‘ ’ 1 Correlation of Fixed Effects: (Intr) lands_F lands_G seas_wet seas_col lands_F:seas_wet lands_G:seas_wet lands_F:seas_col landscape_F -0.728 landscape_G -0.727 0.529 season_wet -0.025 0.018 0.018 season_cold -0.023 0.016 0.016 0.786 lands_F:seas_wet 0.020 -0.023 -0.015 -0.806 -0.634 lands_G:seas_wet 0.021 -0.015 -0.021 -0.837 -0.658 0.674 lands_F:seas_col 0.018 -0.020 -0.013 -0.611 -0.777 0.768 0.512 lands_G:seas_col 0.018 -0.013 -0.018 -0.625 -0.794 0.503 0.703 0.617
_____ 206
VII. Appendix
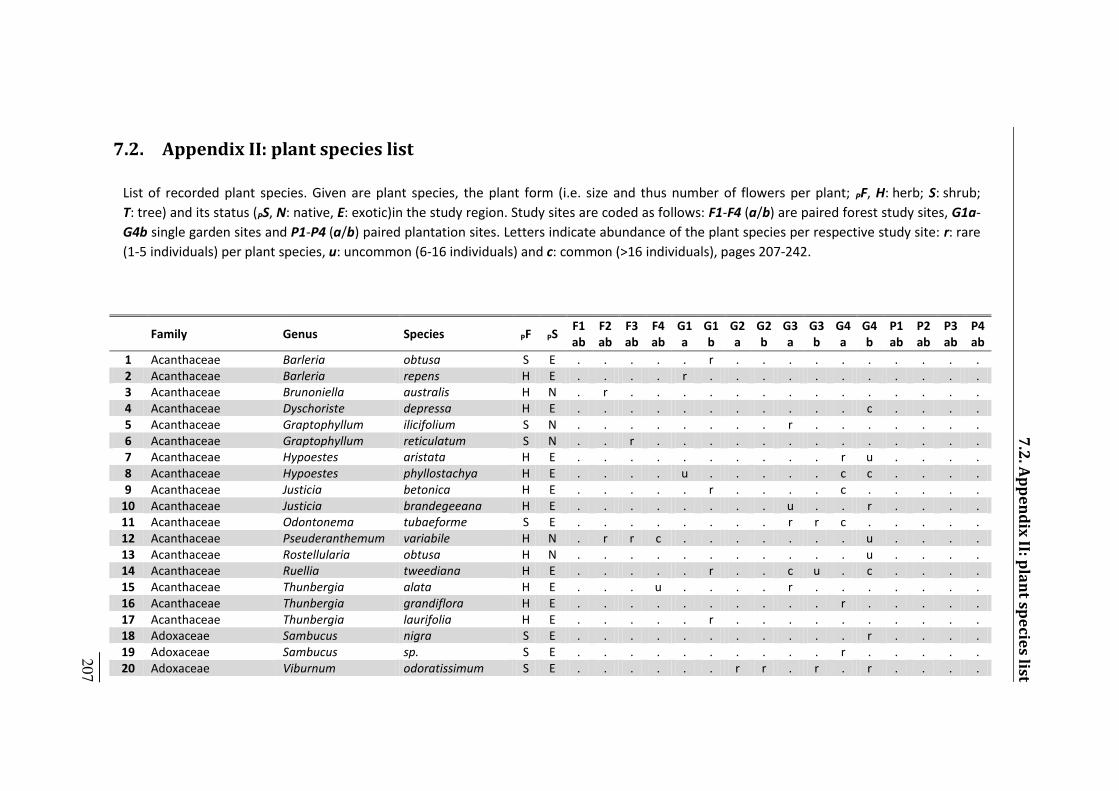
7.2. Appendix II: plant species list
Family Genus Species PF PS F1 ab F2 ab F3 ab F4 ab G1 a G1 b G2 a G2 b G3 a G3 b G4 a G4 b P1 ab P2 ab P3 ab P4 ab 1 Acanthaceae Barleria obtusa S E . . . . . r . . . . . . . . . . 2 Acanthaceae Barleria repens H E . . . . r . . . . . . . . . . . 3 Acanthaceae Brunoniella australis H N . r . . . . . . . . . . . . . . 4 Acanthaceae Dyschoriste depressa H E . . . . . . . . . . . c . . . . 5 Acanthaceae Graptophyllum ilicifolium S N . . . . . . . . r . . . . . . . 6 Acanthaceae Graptophyllum reticulatum S N . . r . . . . . . . . . . . . . 7 Acanthaceae Hypoestes aristata H E . . . . . . . . . . r u . . . . 8 Acanthaceae Hypoestes phyllostachya H E . . . . u . . . . . c c . . . . 9 Acanthaceae Justicia betonica H E . . . . . r . . . . c . . . . . 10 Acanthaceae Justicia brandegeeana H E . . . . . . . . u . . r . . . . 11 Acanthaceae Odontonema tubaeforme S E . . . . . . . . r r c . . . . . 12 Acanthaceae Pseuderanthemum variabile H N . r r c . . . . . . . u . . . . 13 Acanthaceae Rostellularia obtusa H N . . . . . . . . . . . u . . . . 14 Acanthaceae Ruellia tweediana H E . . . . . r . . c u . c . . . . 15 Acanthaceae Thunbergia alata H E . . . u . . . . r . . . . . . . 16 Acanthaceae Thunbergia grandiflora H E . . . . . . . . . . r . . . . . 17 Acanthaceae Thunbergia laurifolia H E . . . . . r . . . . . . . . . . 18 Adoxaceae Sambucus nigra S E . . . . . . . . . . . r . . . . 19 Adoxaceae Sambucus sp. S E . . . . . . . . . . r . . . . . 20 Adoxaceae Viburnum odoratissimum S E . . . . . . r r . r . r . . . .
List of recorded plant species. Given are plant species, the plant form (i.e. size and thus number of flowers per plant; PF, H: herb; S: shrub; T: tree) and its status (PS, N: native, E: exotic)in the study region. Study sites are coded as follows: F1-F4 (a/b) are paired forest study sites, G1a-G4b single garden sites and P1-P4 (a/b) paired plantation sites. Letters indicate abundance of the plant species per respective study site: r: rare (1-5 individuals) per plant species, u: uncommon (6-16 individuals) and c: common (>16 individuals), pages 207-242.
7.2. Appendix II: plant species list _____ 207
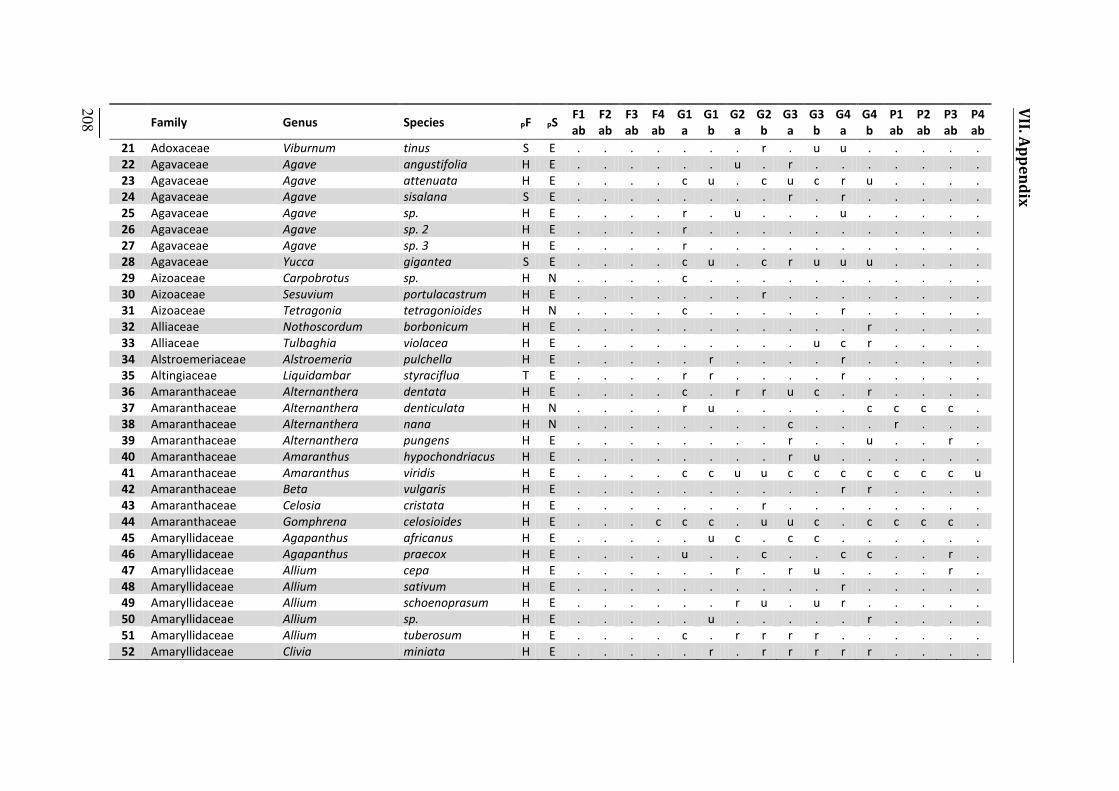
VII. Appendix
_____ 208
Family Genus Species PF PS F1 ab F2 ab F3 ab F4 ab G1 a G1 b G2 a G2 b G3 a G3 b G4 a G4 b P1 ab P2 ab P3 ab P4 ab 21 Adoxaceae Viburnum tinus S E . . . . . . . r . u u . . . . . 22 Agavaceae Agave angustifolia H E . . . . . . u . r . . . . . . . 23 Agavaceae Agave attenuata H E . . . . c u . c u c r u . . . . 24 Agavaceae Agave sisalana S E . . . . . . . . r . r . . . . . 25 Agavaceae Agave sp. H E . . . . r . u . . . u . . . . . 26 Agavaceae Agave sp. 2 H E . . . . r . . . . . . . . . . . 27 Agavaceae Agave sp. 3 H E . . . . r . . . . . . . . . . . 28 Agavaceae Yucca gigantea S E . . . . c u . c r u u u . . . . 29 Aizoaceae Carpobrotus sp. H N . . . . c . . . . . . . . . . . 30 Aizoaceae Sesuvium portulacastrum H E . . . . . . . r . . . . . . . . 31 Aizoaceae Tetragonia tetragonioides H N . . . . c . . . . . r . . . . . 32 Alliaceae Nothoscordum borbonicum H E . . . . . . . . . . . r . . . . 33 Alliaceae Tulbaghia violacea H E . . . . . . . . . u c r . . . . 34 Alstroemeriaceae Alstroemeria pulchella H E . . . . . r . . . . r . . . . . 35 Altingiaceae Liquidambar styraciflua T E . . . . r r . . . . r . . . . . 36 Amaranthaceae Alternanthera dentata H E . . . . c . r r u c . r . . . . 37 Amaranthaceae Alternanthera denticulata H N . . . . r u . . . . . c c c c . 38 Amaranthaceae Alternanthera nana H N . . . . . . . . c . . . r . . . 39 Amaranthaceae Alternanthera pungens H E . . . . . . . . r . . u . . r . 40 Amaranthaceae Amaranthus hypochondriacus H E . . . . . . . . r u . . . . . . 41 Amaranthaceae Amaranthus viridis H E . . . . c c u u c c c c c c c u 42 Amaranthaceae Beta vulgaris H E . . . . . . . . . . r r . . . . 43 Amaranthaceae Celosia cristata H E . . . . . . . r . . . . . . . . 44 Amaranthaceae Gomphrena celosioides H E . . . c c c . u u c . c c c c . 45 Amaryllidaceae Agapanthus africanus H E . . . . . u c . c c . . . . . . 46 Amaryllidaceae Agapanthus praecox H E . . . . u . . c . . c c . . r . 47 Amaryllidaceae Allium cepa H E . . . . . . r . r u . . . . r . 48 Amaryllidaceae Allium sativum H E . . . . . . . . . . r . . . . . 49 Amaryllidaceae Allium schoenoprasum H E . . . . . . r u . u r . . . . . 50 Amaryllidaceae Allium sp. H E . . . . . u . . . . . r . . . . 51 Amaryllidaceae Allium tuberosum H E . . . . c . r r r r . . . . . . 52 Amaryllidaceae Clivia miniata H E . . . . . r . r r r r r . . . .
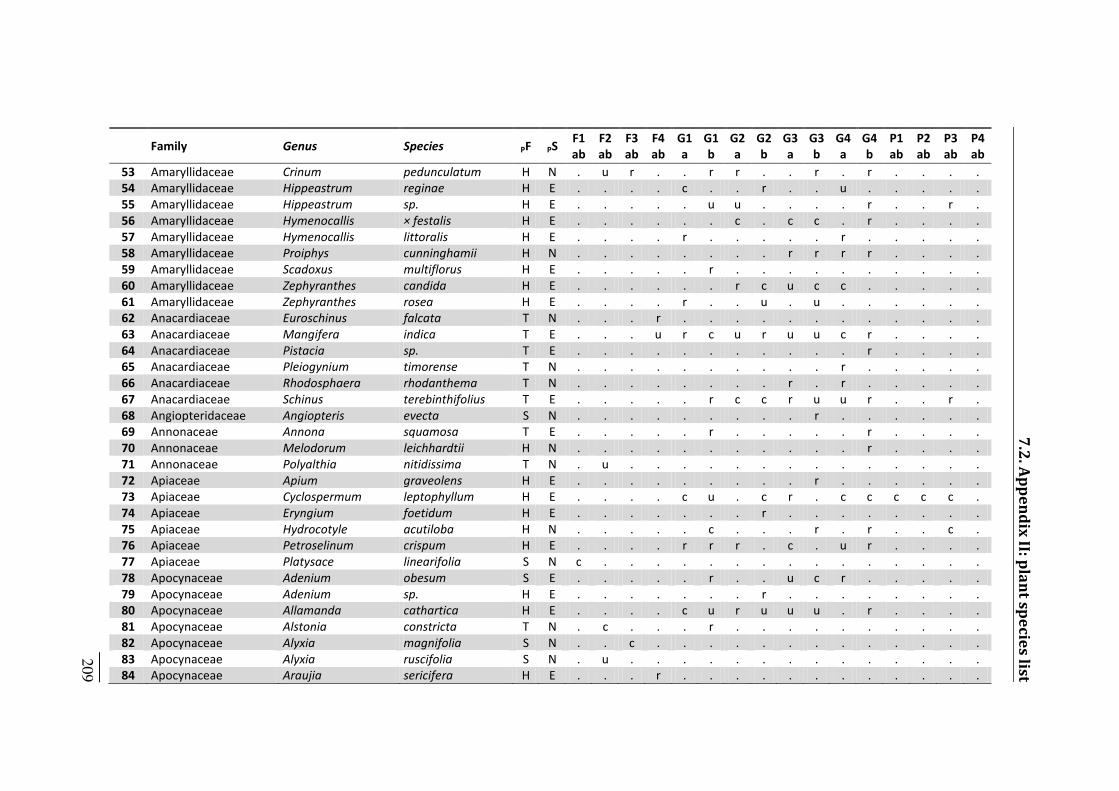
Family Genus Species PF PS F1 ab F2 ab F3 ab F4 ab G1 a G1 b G2 a G2 b G3 a G3 b G4 a G4 b P1 ab P2 ab P3 ab P4 ab 53 Amaryllidaceae Crinum pedunculatum H N . u r . . r r . . r . r . . . . 54 Amaryllidaceae Hippeastrum reginae H E . . . . c . . r . . u . . . . . 55 Amaryllidaceae Hippeastrum sp. H E . . . . . u u . . . . r . . r . 56 Amaryllidaceae Hymenocallis × festalis H E . . . . . . c . c c . r . . . . 57 Amaryllidaceae Hymenocallis littoralis H E . . . . r . . . . . r . . . . . 58 Amaryllidaceae Proiphys cunninghamii H N . . . . . . . . r r r r . . . . 59 Amaryllidaceae Scadoxus multiflorus H E . . . . . r . . . . . . . . . . 60 Amaryllidaceae Zephyranthes candida H E . . . . . . r c u c c . . . . . 61 Amaryllidaceae Zephyranthes rosea H E . . . . r . . u . u . . . . . . 62 Anacardiaceae Euroschinus falcata T N . . . r . . . . . . . . . . . . 63 Anacardiaceae Mangifera indica T E . . . u r c u r u u c r . . . . 64 Anacardiaceae Pistacia sp. T E . . . . . . . . . . . r . . . . 65 Anacardiaceae Pleiogynium timorense T N . . . . . . . . . . r . . . . . 66 Anacardiaceae Rhodosphaera rhodanthema T N . . . . . . . . r . r . . . . . 67 Anacardiaceae Schinus terebinthifolius T E . . . . . r c c r u u r . . r . 68 Angiopteridaceae Angiopteris evecta S N . . . . . . . . . r . . . . . . 69 Annonaceae Annona squamosa T E . . . . . r . . . . . r . . . . 70 Annonaceae Melodorum leichhardtii H N . . . . . . . . . . . r . . . . 71 Annonaceae Polyalthia nitidissima T N . u . . . . . . . . . . . . . . 72 Apiaceae Apium graveolens H E . . . . . . . . . r . . . . . . 73 Apiaceae Cyclospermum leptophyllum H E . . . . c u . c r . c c c c c . 74 Apiaceae Eryngium foetidum H E . . . . . . . r . . . . . . . . 75 Apiaceae Hydrocotyle acutiloba H N . . . . . c . . . r . r . . c . 76 Apiaceae Petroselinum crispum H E . . . . r r r . c . u r . . . . 77 Apiaceae Platysace linearifolia S N c . . . . . . . . . . . . . . . 78 Apocynaceae Adenium obesum S E . . . . . r . . u c r . . . . . 79 Apocynaceae Adenium sp. H E . . . . . . . r . . . . . . . . 80 Apocynaceae Allamanda cathartica H E . . . . c u r u u u . r . . . . 81 Apocynaceae Alstonia constricta T N . c . . . r . . . . . . . . . . 82 Apocynaceae Alyxia magnifolia S N . . c . . . . . . . . . . . . . 83 Apocynaceae Alyxia ruscifolia S N . u . . . . . . . . . . . . . . 84 Apocynaceae Araujia sericifera H E . . . r . . . . . . . . . . . . _____ 209
7.2. Appendix II: plant species list
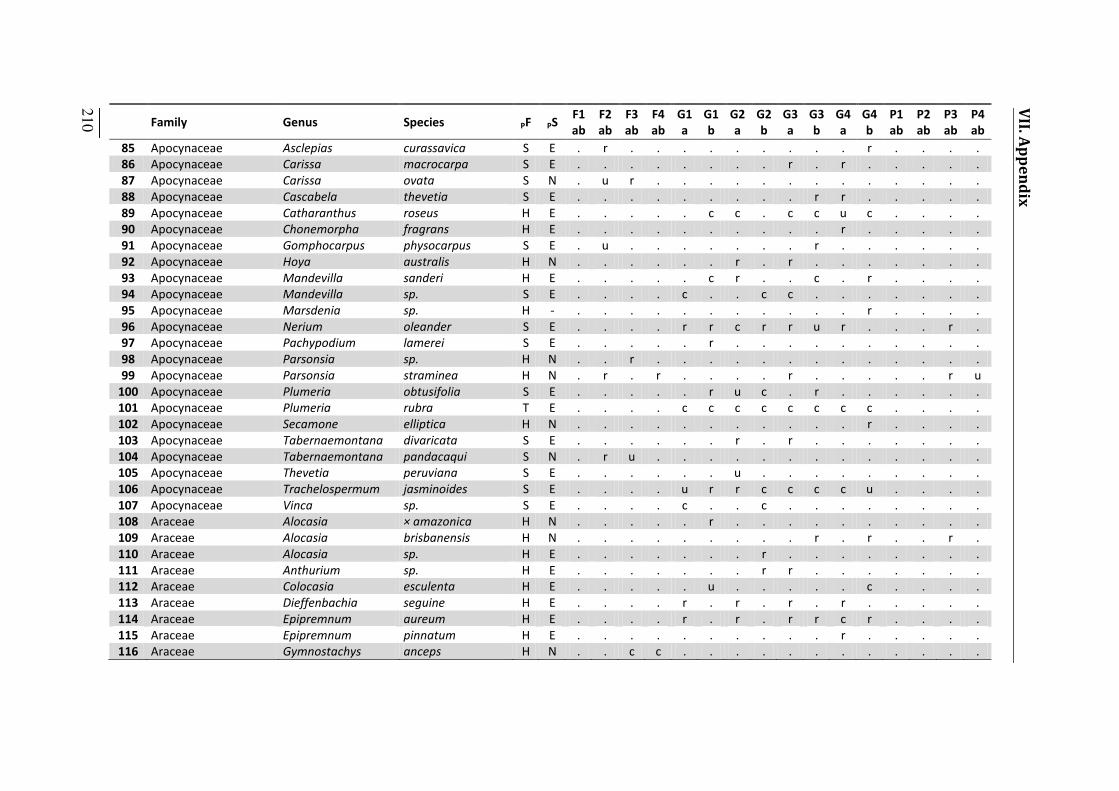
VII. Appendix
_____ 210 Family Genus Species PF PS F1 ab F2 ab F3 ab F4 ab G1 a G1 b G2 a G2 b G3 a G3 b G4 a G4 b P1 ab P2 ab P3 ab P4 ab 85 Apocynaceae Asclepias curassavica S E . r . . . . . . . . . r . . . . 86 Apocynaceae Carissa macrocarpa S E . . . . . . . . r . r . . . . . 87 Apocynaceae Carissa ovata S N . u r . . . . . . . . . . . . . 88 Apocynaceae Cascabela thevetia S E . . . . . . . . . r r . . . . . 89 Apocynaceae Catharanthus roseus H E . . . . . c c . c c u c . . . . 90 Apocynaceae Chonemorpha fragrans H E . . . . . . . . . . r . . . . . 91 Apocynaceae Gomphocarpus physocarpus S E . u . . . . . . . r . . . . . . 92 Apocynaceae Hoya australis H N . . . . . . r . r . . . . . . . 93 Apocynaceae Mandevilla sanderi H E . . . . . c r . . c . r . . . . 94 Apocynaceae Mandevilla sp. S E . . . . c . . c c . . . . . . . 95 Apocynaceae Marsdenia sp. H - . . . . . . . . . . . r . . . . 96 Apocynaceae Nerium oleander S E . . . . r r c r r u r . . . r . 97 Apocynaceae Pachypodium lamerei S E . . . . . r . . . . . . . . . . 98 Apocynaceae Parsonsia sp. H N . . r . . . . . . . . . . . . . 99 Apocynaceae Parsonsia straminea H N . r . r . . . . r . . . . . r u 100 Apocynaceae Plumeria obtusifolia S E . . . . . r u c . r . . . . . . 101 Apocynaceae Plumeria rubra T E . . . . c c c c c c c c . . . . 102 Apocynaceae Secamone elliptica H N . . . . . . . . . . . r . . . . 103 Apocynaceae Tabernaemontana divaricata S E . . . . . . r . r . . . . . . . 104 Apocynaceae Tabernaemontana pandacaqui S N . r u . . . . . . . . . . . . . 105 Apocynaceae Thevetia peruviana S E . . . . . . u . . . . . . . . . 106 Apocynaceae Trachelospermum jasminoides S E . . . . u r r c c c c u . . . . 107 Apocynaceae Vinca sp. S E . . . . c . . c . . . . . . . . 108 Araceae Alocasia × amazonica H N . . . . . r . . . . . . . . . . 109 Araceae Alocasia brisbanensis H N . . . . . . . . . r . r . . r . 110 Araceae Alocasia sp. H E . . . . . . . r . . . . . . . . 111 Araceae Anthurium sp. H E . . . . . . . r r . . . . . . . 112 Araceae Colocasia esculenta H E . . . . . u . . . . . c . . . . 113 Araceae Dieffenbachia seguine H E . . . . r . r . r . r . . . . . 114 Araceae Epipremnum aureum H E . . . . r . r . r r c r . . . . 115 Araceae Epipremnum pinnatum H E . . . . . . . . . . r . . . . . 116 Araceae Gymnostachys anceps H N . . c c . . . . . . . . . . . .
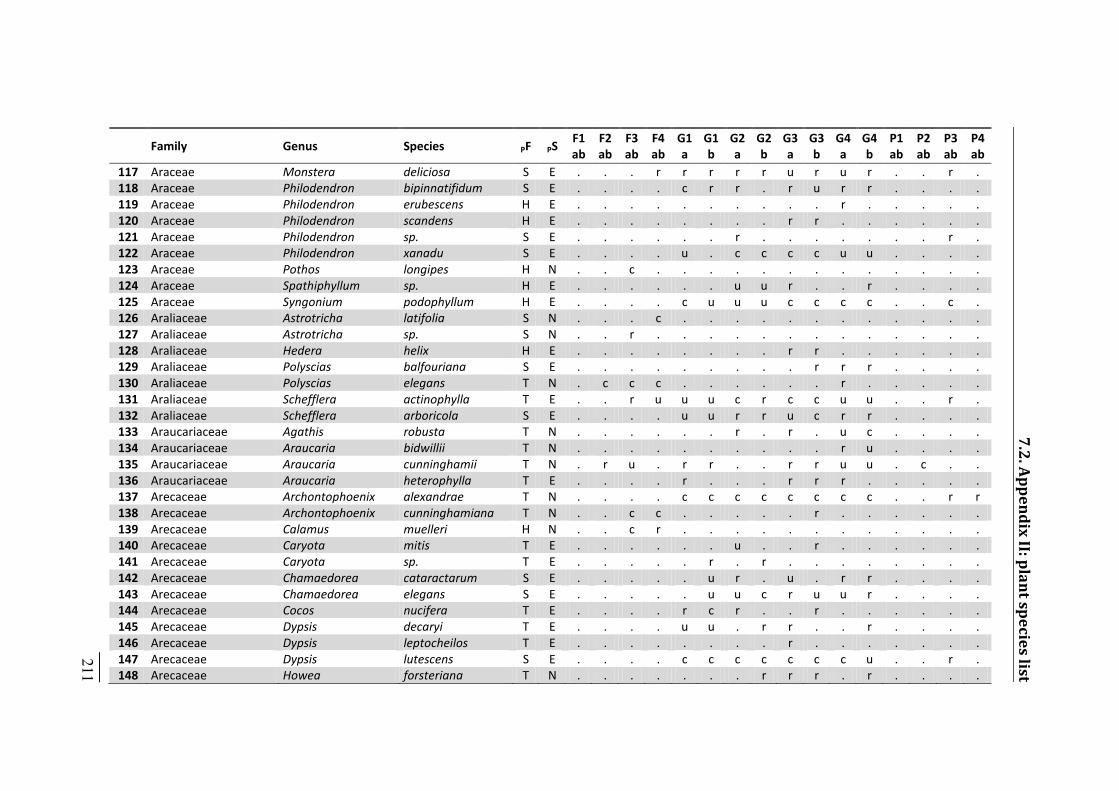
Family Genus Species PF PS F1 ab F2 ab F3 ab F4 ab G1 a G1 b G2 a G2 b G3 a G3 b G4 a G4 b P1 ab P2 ab P3 ab P4 ab 117 Araceae Monstera deliciosa S E . . . r r r r r u r u r . . r . 118 Araceae Philodendron bipinnatifidum S E . . . . c r r . r u r r . . . . 119 Araceae Philodendron erubescens H E . . . . . . . . . . r . . . . . 120 Araceae Philodendron scandens H E . . . . . . . . r r . . . . . . 121 Araceae Philodendron sp. S E . . . . . . r . . . . . . . r . 122 Araceae Philodendron xanadu S E . . . . u . c c c c u u . . . . 123 Araceae Pothos longipes H N . . c . . . . . . . . . . . . . 124 Araceae Spathiphyllum sp. H E . . . . . . u u r . . r . . . . 125 Araceae Syngonium podophyllum H E . . . . c u u u c c c c . . c . 126 Araliaceae Astrotricha latifolia S N . . . c . . . . . . . . . . . . 127 Araliaceae Astrotricha sp. S N . . r . . . . . . . . . . . . . 128 Araliaceae Hedera helix H E . . . . . . . . r r . . . . . . 129 Araliaceae Polyscias balfouriana S E . . . . . . . . . r r r . . . . 130 Araliaceae Polyscias elegans T N . c c c . . . . . . r . . . . . 131 Araliaceae Schefflera actinophylla T E . . r u u u c r c c u u . . r . 132 Araliaceae Schefflera arboricola S E . . . . u u r r u c r r . . . . 133 Araucariaceae Agathis robusta T N . . . . . . r . r . u c . . . . 134 Araucariaceae Araucaria bidwillii T N . . . . . . . . . . r u . . . . 135 Araucariaceae Araucaria cunninghamii T N . r u . r r . . r r u u . c . . 136 Araucariaceae Araucaria heterophylla T E . . . . r . . . r r r . . . . . 137 Arecaceae Archontophoenix alexandrae T N . . . . c c c c c c c c . . r r 138 Arecaceae Archontophoenix cunninghamiana T N . . c c . . . . . r . . . . . . 139 Arecaceae Calamus muelleri H N . . c r . . . . . . . . . . . . 140 Arecaceae Caryota mitis T E . . . . . . u . . r . . . . . . 141 Arecaceae Caryota sp. T E . . . . . r . r . . . . . . . . 142 Arecaceae Chamaedorea cataractarum S E . . . . . u r . u . r r . . . . 143 Arecaceae Chamaedorea elegans S E . . . . . u u c r u u r . . . . 144 Arecaceae Cocos nucifera T E . . . . r c r . . r . . . . . . 145 Arecaceae Dypsis decaryi T E . . . . u u . r r . . r . . . . 146 Arecaceae Dypsis leptocheilos T E . . . . . . . . r . . . . . . . 147 Arecaceae Dypsis lutescens S E . . . . c c c c c c c u . . r . 148 Arecaceae Howea forsteriana T N . . . . . . . r r r . r . . . .
7.2. Appendix II: plant species list _____ 211
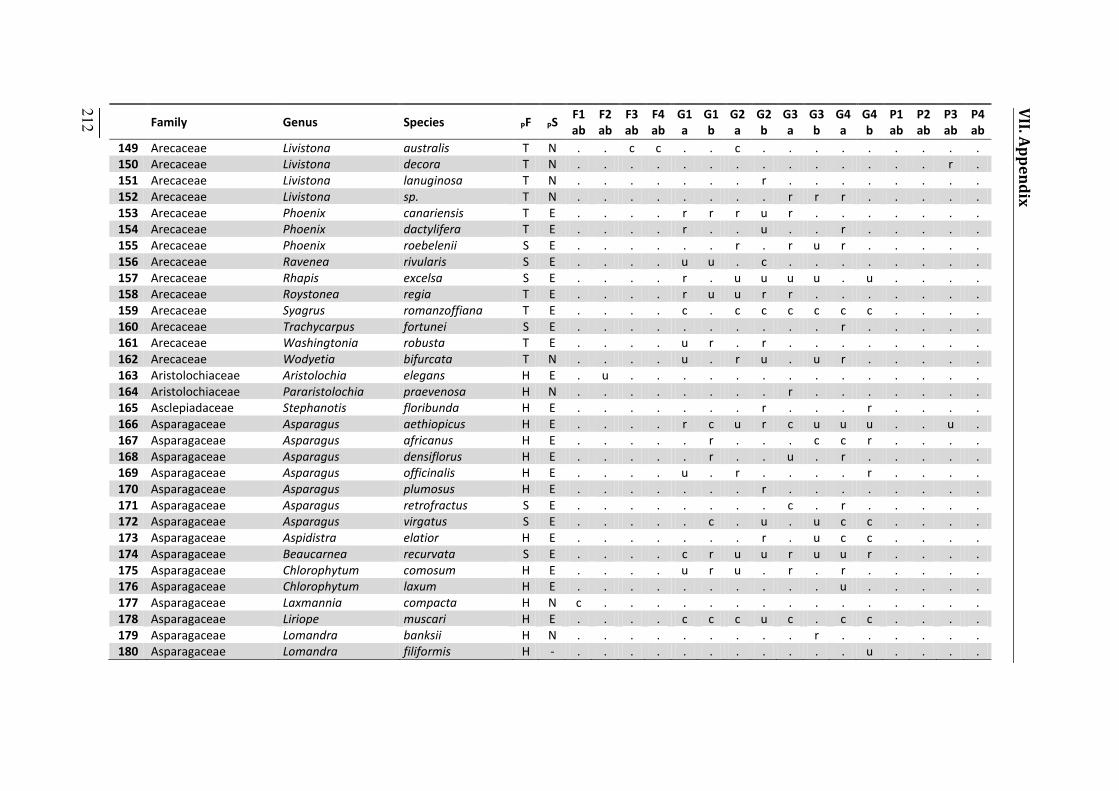
_____ 212
VII. Appendix
Family Genus Species PF PS F1 ab F2 ab F3 ab F4 ab G1 a G1 b G2 a G2 b G3 a G3 b G4 a G4 b P1 ab P2 ab P3 ab P4 ab 149 Arecaceae Livistona australis T N . . c c . . c . . . . . . . . . 150 Arecaceae Livistona decora T N . . . . . . . . . . . . . . r . 151 Arecaceae Livistona lanuginosa T N . . . . . . . r . . . . . . . . 152 Arecaceae Livistona sp. T N . . . . . . . . r r r . . . . . 153 Arecaceae Phoenix canariensis T E . . . . r r r u r . . . . . . . 154 Arecaceae Phoenix dactylifera T E . . . . r . . u . . r . . . . . 155 Arecaceae Phoenix roebelenii S E . . . . . . r . r u r . . . . . 156 Arecaceae Ravenea rivularis S E . . . . u u . c . . . . . . . . 157 Arecaceae Rhapis excelsa S E . . . . r . u u u u . u . . . . 158 Arecaceae Roystonea regia T E . . . . r u u r r . . . . . . . 159 Arecaceae Syagrus romanzoffiana T E . . . . c . c c c c c c . . . . 160 Arecaceae Trachycarpus fortunei S E . . . . . . . . . . r . . . . . 161 Arecaceae Washingtonia robusta T E . . . . u r . r . . . . . . . . 162 Arecaceae Wodyetia bifurcata T N . . . . u . r u . u r . . . . . 163 Aristolochiaceae Aristolochia elegans H E . u . . . . . . . . . . . . . . 164 Aristolochiaceae Pararistolochia praevenosa H N . . . . . . . . r . . . . . . . 165 Asclepiadaceae Stephanotis floribunda H E . . . . . . . r . . . r . . . . 166 Asparagaceae Asparagus aethiopicus H E . . . . r c u r c u u u . . u . 167 Asparagaceae Asparagus africanus H E . . . . . r . . . c c r . . . . 168 Asparagaceae Asparagus densiflorus H E . . . . . r . . u . r . . . . . 169 Asparagaceae Asparagus officinalis H E . . . . u . r . . . . r . . . . 170 Asparagaceae Asparagus plumosus H E . . . . . . . r . . . . . . . . 171 Asparagaceae Asparagus retrofractus S E . . . . . . . . c . r . . . . . 172 Asparagaceae Asparagus virgatus S E . . . . . c . u . u c c . . . . 173 Asparagaceae Aspidistra elatior H E . . . . . . . r . u c c . . . . 174 Asparagaceae Beaucarnea recurvata S E . . . . c r u u r u u r . . . . 175 Asparagaceae Chlorophytum comosum H E . . . . u r u . r . r . . . . . 176 Asparagaceae Chlorophytum laxum H E . . . . . . . . . . u . . . . . 177 Asparagaceae Laxmannia compacta H N c . . . . . . . . . . . . . . . 178 Asparagaceae Liriope muscari H E . . . . c c c u c . c c . . . . 179 Asparagaceae Lomandra banksii H N . . . . . . . . . r . . . . . . 180 Asparagaceae Lomandra filiformis H - . . . . . . . . . . . u . . . .

Family Genus Species PF PS F1 ab F2 ab F3 ab F4 ab G1 a G1 b G2 a G2 b G3 a G3 b G4 a G4 b P1 ab P2 ab P3 ab P4 ab 181 Asparagaceae Lomandra glauca H N . . . . . . . r . . . . . . . . 182 Asparagaceae Lomandra hystrix H N . c c . . . . . c . . c . . . . 183 Asparagaceae Lomandra laxa H N r . u . . . . . . . . . . . . . 184 Asparagaceae Lomandra longifolia H N . c c c r . c c . c c c . . . . 185 Asparagaceae Lomandra multiflora H N . u . c . . . . . . . . . . . . 186 Asparagaceae Ophiopogon japonicus H E . . . . c u r c c c c c . . . . 187 Asparagaceae Polygonatum odoratum H E . . . . . . . r . . . . . . . . 188 Asteraceae Ageratina riparia H E . . . u . . . . . . . . . . . . 189 Asteraceae Ageratum houstonianum H E . c . c . c u . c r c c c c c c 190 Asteraceae Ambrosia artemisiifolia H E . . . . . . . . u u . . . . . . 191 Asteraceae Argyranthemum frutescens H E . . . . . . . . r r . r . . . . 192 Asteraceae Artemisia absinthium H E . . . . . . . . r . . . . . . . 193 Asteraceae Artemisia ludoviciana H E . . . . . . . . r . . . . . . . 194 Asteraceae Aster sp. H E . . . . . . . . r r . . . . . . 195 Asteraceae Aster subulatus H E . . . . r u . r . . . r u c r . 196 Asteraceae Baccharis halimifolia S E . . . . . . r . . . . r . . . r 197 Asteraceae Bidens bipinnata H E . . . . r . . . . . . . . . . . 198 Asteraceae Bidens pilosa H E . c . c . c c u c c c c c c c c 199 Asteraceae Centaurea sp. H E . . . . . . . . . . r . . . . . 200 Asteraceae Centipeda minima H N . u . . . . . . . . . . . . . . 201 Asteraceae Centratherum punctatum H E . r . . . . . . . . . . . . . . 202 Asteraceae Chrysanthemum × morifolium H E . . . . . . . . r r . . . . . . 203 Asteraceae Chrysanthemum pacificum H E . . . . r . . . . . . . . . . . 204 Asteraceae Chrysanthemum paludosum H E . . . . . . . . . . r . . . . . 205 Asteraceae Chrysanthemum sp. H E . . . . . r u . . . . . . . . . 206 Asteraceae Chrysocephalum apiculatum H N . c . . . . . . . c . . . . . . 207 Asteraceae Cirsium vulgare H E . . . . . . . . u . . r u . . . 208 Asteraceae Conyza bonariensis H E . c . c . . . . . c c c c . . . 209 Asteraceae Conyza sp. H E . . . . c c c c c . . . . c c . 210 Asteraceae Coreopsis lanceolata H E . . . . . c . . . . . . . . . . 211 Asteraceae Cosmos sp. H E . . . . . . . r u r . . . . . . 212 Asteraceae Crassocephalum crepidioides H E . c . c . . r . . . u u u . . c _____ 213
7.2. Appendix II: plant species list

_____ 214
VII. Appendix
Family Genus Species PF PS F1 ab F2 ab F3 ab F4 ab G1 a G1 b G2 a G2 b G3 a G3 b G4 a G4 b P1 ab P2 ab P3 ab P4 ab 213 Asteraceae Cyanthillium cinereum S N . c c c . . . . . . . . r . r . 214 Asteraceae Dahlia sp. H E . . . . r . . . . . . . . . . . 215 Asteraceae Eclipta prostrata H N . r . . u . . . . . . . . r . . 216 Asteraceae Emilia sonchifolia H E . c . c c . c c c . u c c c . c 217 Asteraceae Epaltes australis H N . c . . . . . . . . . . . . . . 218 Asteraceae Erigeron glaucus H E . . . . r . . . . . . . . . . . 219 Asteraceae Erigeron karvinskianus H E . . . . . . . u r r r r . . . . 220 Asteraceae Euchiton involucratus H N . . . . . . . . . . . . c u c . 221 Asteraceae Euryops chrysanthemoides S E . . . . . . . . . r . . . . . . 222 Asteraceae Galinsoga parviflora H E . . . . . . . . . . . c . . c c 223 Asteraceae Gamochaeta coarctata H E . . . . . . . r c . c u . . . . 224 Asteraceae Gazania rigens H E . . . . . . c . u . . c . . . . 225 Asteraceae Gazania sp. H E . . . . c c . c . r . u . . . . 226 Asteraceae Gerbera sp. H E . . . . u u . r u u . . . . . . 227 Asteraceae Glossocardia bidens H N . u . . . . . . . . . . . . . . 228 Asteraceae Helianthus annuus H E . . . . r . r . . r . r . . . . 229 Asteraceae Helichrysum italicum H E . . . . . . . . . r . . . . . . 230 Asteraceae Hypochaeris alba H E . . . . c c . . c . . . c c c . 231 Asteraceae Hypochaeris albiflora H E . . . . . . . . . u . . . . . . 232 Asteraceae Hypochaeris glabra H E . . . . . . . r . . . c . . c . 233 Asteraceae Hypochaeris microcephala H E . . . c . . u . . . . . . . . . 234 Asteraceae Hypochaeris radicata H E . . . c . . . . . . . . . . . c 235 Asteraceae Jacobaea maritima H E . . . . . . . r r . u . . . . . 236 Asteraceae Lactuca sativa H E . . . . . u . . . c c r . . . . 237 Asteraceae Lactuca serriola H E . . . . . . . . c . . r . . . . 238 Asteraceae Leucanthemum × superbum H E . . . . . r . . . u r . . . . . 239 Asteraceae Montanoa hibiscifolia S E . . . . . . . . . . r r . . . . 240 Asteraceae Osteospermum fruticosum H E . . . . . r r r r r . r . . r . 241 Asteraceae Ozothamnus diosmifolius S N . . . . . . . . r . r . . . . . 242 Asteraceae Picris angustifolia H N . r . . . . . . . . . . . . . . 243 Asteraceae Praxelis clematidea H E u c . . . . . . . . . . . . . . 244 Asteraceae Pterocaulon redolens H N . c . . . . . . . . . . . . . .
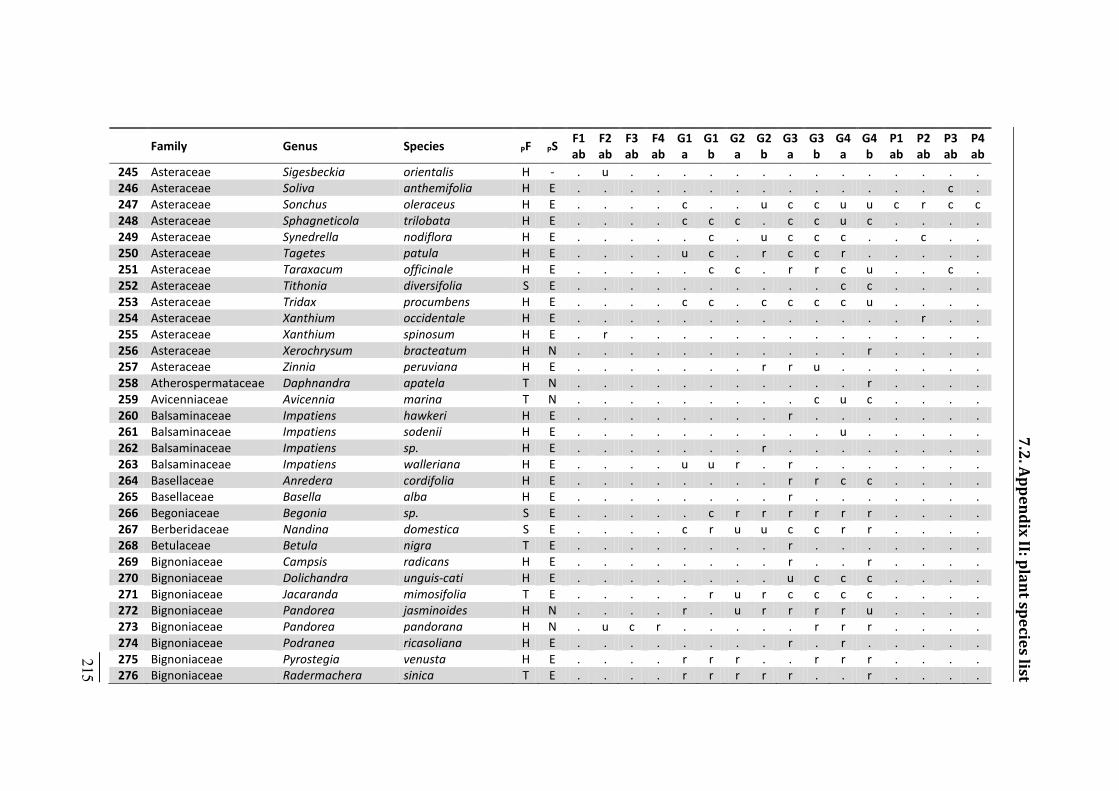
Family Genus Species PF PS F1 ab F2 ab F3 ab F4 ab G1 a G1 b G2 a G2 b G3 a G3 b G4 a G4 b P1 ab P2 ab P3 ab P4 ab 245 Asteraceae Sigesbeckia orientalis H - . u . . . . . . . . . . . . . . 246 Asteraceae Soliva anthemifolia H E . . . . . . . . . . . . . . c . 247 Asteraceae Sonchus oleraceus H E . . . . c . . u c c u u c r c c 248 Asteraceae Sphagneticola trilobata H E . . . . c c c . c c u c . . . . 249 Asteraceae Synedrella nodiflora H E . . . . . c . u c c c . . c . . 250 Asteraceae Tagetes patula H E . . . . u c . r c c r . . . . . 251 Asteraceae Taraxacum officinale H E . . . . . c c . r r c u . . c . 252 Asteraceae Tithonia diversifolia S E . . . . . . . . . . c c . . . . 253 Asteraceae Tridax procumbens H E . . . . c c . c c c c u . . . . 254 Asteraceae Xanthium occidentale H E . . . . . . . . . . . . . r . . 255 Asteraceae Xanthium spinosum H E . r . . . . . . . . . . . . . . 256 Asteraceae Xerochrysum bracteatum H N . . . . . . . . . . . r . . . . 257 Asteraceae Zinnia peruviana H E . . . . . . . r r u . . . . . . 258 Atherospermataceae Daphnandra apatela T N . . . . . . . . . . . r . . . . 259 Avicenniaceae Avicennia marina T N . . . . . . . . . c u c . . . . 260 Balsaminaceae Impatiens hawkeri H E . . . . . . . . r . . . . . . . 261 Balsaminaceae Impatiens sodenii H E . . . . . . . . . . u . . . . . 262 Balsaminaceae Impatiens sp. H E . . . . . . . r . . . . . . . . 263 Balsaminaceae Impatiens walleriana H E . . . . u u r . r . . . . . . . 264 Basellaceae Anredera cordifolia H E . . . . . . . . r r c c . . . . 265 Basellaceae Basella alba H E . . . . . . . . r . . . . . . . 266 Begoniaceae Begonia sp. S E . . . . . c r r r r r r . . . . 267 Berberidaceae Nandina domestica S E . . . . c r u u c c r r . . . . 268 Betulaceae Betula nigra T E . . . . . . . . r . . . . . . . 269 Bignoniaceae Campsis radicans H E . . . . . . . . r . . r . . . . 270 Bignoniaceae Dolichandra unguis-cati H E . . . . . . . . u c c c . . . . 271 Bignoniaceae Jacaranda mimosifolia T E . . . . . r u r c c c c . . . . 272 Bignoniaceae Pandorea jasminoides H N . . . . r . u r r r r u . . . . 273 Bignoniaceae Pandorea pandorana H N . u c r . . . . . r r r . . . . 274 Bignoniaceae Podranea ricasoliana H E . . . . . . . . r . r . . . . . 275 Bignoniaceae Pyrostegia venusta H E . . . . r r r . . r r r . . . . 276 Bignoniaceae Radermachera sinica T E . . . . r r r r r . . r . . . . _____ 215
7.2. Appendix II: plant species list
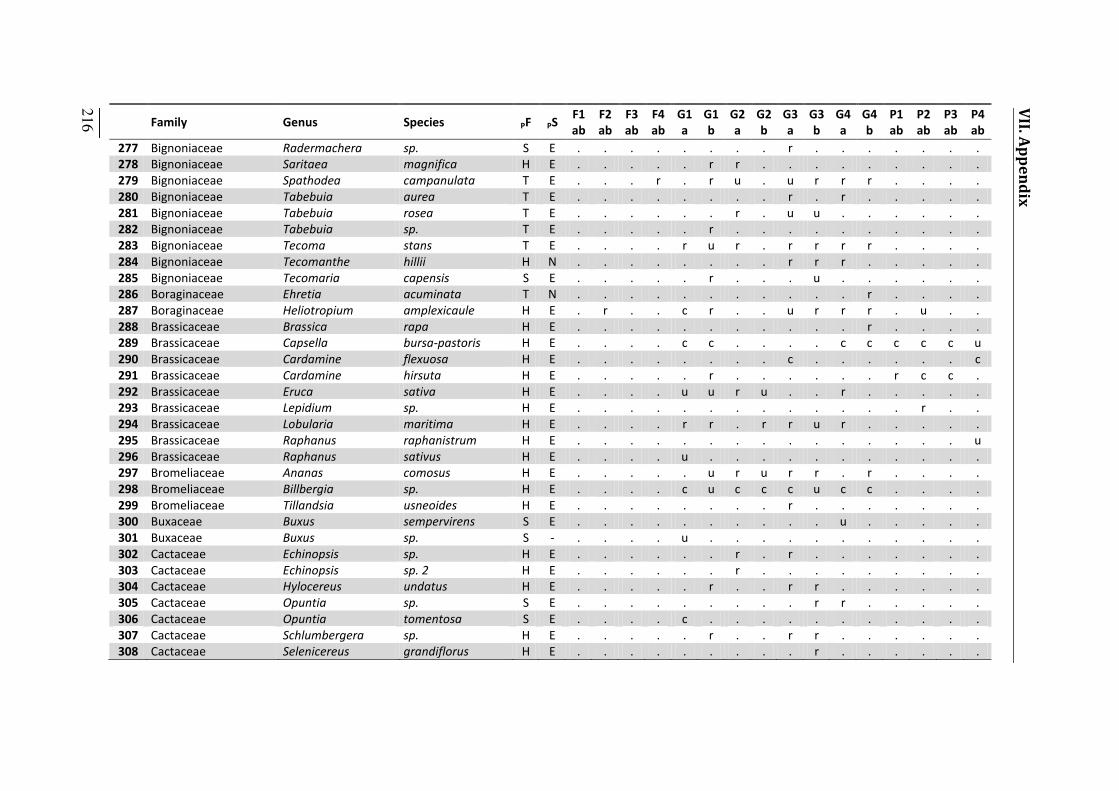
VII. Appendix
_____ 216 Family Genus Species PF PS F1 ab F2 ab F3 ab F4 ab G1 a G1 b G2 a G2 b G3 a G3 b G4 a G4 b P1 ab P2 ab P3 ab P4 ab 277 Bignoniaceae Radermachera sp. S E . . . . . . . . r . . . . . . . 278 Bignoniaceae Saritaea magnifica H E . . . . . r r . . . . . . . . . 279 Bignoniaceae Spathodea campanulata T E . . . r . r u . u r r r . . . . 280 Bignoniaceae Tabebuia aurea T E . . . . . . . . r . r . . . . . 281 Bignoniaceae Tabebuia rosea T E . . . . . . r . u u . . . . . . 282 Bignoniaceae Tabebuia sp. T E . . . . . r . . . . . . . . . . 283 Bignoniaceae Tecoma stans T E . . . . r u r . r r r r . . . . 284 Bignoniaceae Tecomanthe hillii H N . . . . . . . . r r r . . . . . 285 Bignoniaceae Tecomaria capensis S E . . . . . r . . . u . . . . . . 286 Boraginaceae Ehretia acuminata T N . . . . . . . . . . . r . . . . 287 Boraginaceae Heliotropium amplexicaule H E . r . . c r . . u r r r . u . . 288 Brassicaceae Brassica rapa H E . . . . . . . . . . . r . . . . 289 Brassicaceae Capsella bursa-pastoris H E . . . . c c . . . . c c c c c u 290 Brassicaceae Cardamine flexuosa H E . . . . . . . . c . . . . . . c 291 Brassicaceae Cardamine hirsuta H E . . . . . r . . . . . . r c c . 292 Brassicaceae Eruca sativa H E . . . . u u r u . . r . . . . . 293 Brassicaceae Lepidium sp. H E . . . . . . . . . . . . . r . . 294 Brassicaceae Lobularia maritima H E . . . . r r . r r u r . . . . . 295 Brassicaceae Raphanus raphanistrum H E . . . . . . . . . . . . . . . u 296 Brassicaceae Raphanus sativus H E . . . . u . . . . . . . . . . . 297 Bromeliaceae Ananas comosus H E . . . . . u r u r r . r . . . . 298 Bromeliaceae Billbergia sp. H E . . . . c u c c c u c c . . . . 299 Bromeliaceae Tillandsia usneoides H E . . . . . . . . r . . . . . . . 300 Buxaceae Buxus sempervirens S E . . . . . . . . . . u . . . . . 301 Buxaceae Buxus sp. S - . . . . u . . . . . . . . . . . 302 Cactaceae Echinopsis sp. H E . . . . . . r . r . . . . . . . 303 Cactaceae Echinopsis sp. 2 H E . . . . . . r . . . . . . . . . 304 Cactaceae Hylocereus undatus H E . . . . . r . . r r . . . . . . 305 Cactaceae Opuntia sp. S E . . . . . . . . . r r . . . . . 306 Cactaceae Opuntia tomentosa S E . . . . c . . . . . . . . . . . 307 Cactaceae Schlumbergera sp. H E . . . . . r . . r r . . . . . . 308 Cactaceae Selenicereus grandiflorus H E . . . . . . . . . r . . . . . .
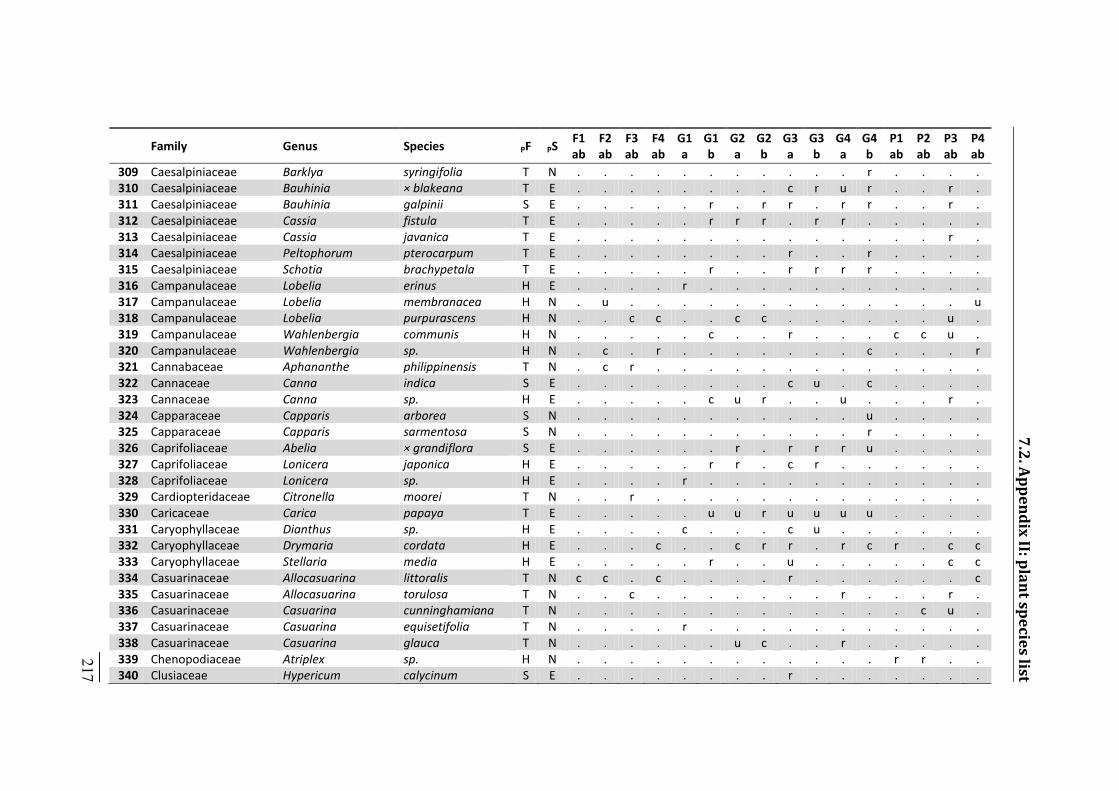
Family Genus Species PF PS F1 ab F2 ab F3 ab F4 ab G1 a G1 b G2 a G2 b G3 a G3 b G4 a G4 b P1 ab P2 ab P3 ab P4 ab 309 Caesalpiniaceae Barklya syringifolia T N . . . . . . . . . . . r . . . . 310 Caesalpiniaceae Bauhinia × blakeana T E . . . . . . . . c r u r . . r . 311 Caesalpiniaceae Bauhinia galpinii S E . . . . . r . r r . r r . . r . 312 Caesalpiniaceae Cassia fistula T E . . . . . r r r . r r . . . . . 313 Caesalpiniaceae Cassia javanica T E . . . . . . . . . . . . . . r . 314 Caesalpiniaceae Peltophorum pterocarpum T E . . . . . . . . r . . r . . . . 315 Caesalpiniaceae Schotia brachypetala T E . . . . . r . . r r r r . . . . 316 Campanulaceae Lobelia erinus H E . . . . r . . . . . . . . . . . 317 Campanulaceae Lobelia membranacea H N . u . . . . . . . . . . . . . u 318 Campanulaceae Lobelia purpurascens H N . . c c . . c c . . . . . . u . 319 Campanulaceae Wahlenbergia communis H N . . . . . c . . r . . . c c u . 320 Campanulaceae Wahlenbergia sp. H N . c . r . . . . . . . c . . . r 321 Cannabaceae Aphananthe philippinensis T N . c r . . . . . . . . . . . . . 322 Cannaceae Canna indica S E . . . . . . . . c u . c . . . . 323 Cannaceae Canna sp. H E . . . . . c u r . . u . . . r . 324 Capparaceae Capparis arborea S N . . . . . . . . . . . u . . . . 325 Capparaceae Capparis sarmentosa S N . . . . . . . . . . . r . . . . 326 Caprifoliaceae Abelia × grandiflora S E . . . . . . r . r r r u . . . . 327 Caprifoliaceae Lonicera japonica H E . . . . . r r . c r . . . . . . 328 Caprifoliaceae Lonicera sp. H E . . . . r . . . . . . . . . . . 329 Cardiopteridaceae Citronella moorei T N . . r . . . . . . . . . . . . . 330 Caricaceae Carica papaya T E . . . . . u u r u u u u . . . . 331 Caryophyllaceae Dianthus sp. H E . . . . c . . . c u . . . . . . 332 Caryophyllaceae Drymaria cordata H E . . . c . . c r r . r c r . c c 333 Caryophyllaceae Stellaria media H E . . . . . r . . u . . . . . c c 334 Casuarinaceae Allocasuarina littoralis T N c c . c . . . . r . . . . . . c 335 Casuarinaceae Allocasuarina torulosa T N . . c . . . . . . . r . . . r . 336 Casuarinaceae Casuarina cunninghamiana T N . . . . . . . . . . . . . c u . 337 Casuarinaceae Casuarina equisetifolia T N . . . . r . . . . . . . . . . . 338 Casuarinaceae Casuarina glauca T N . . . . . . u c . . r . . . . . 339 Chenopodiaceae Atriplex sp. H N . . . . . . . . . . . . r r . . 340 Clusiaceae Hypericum calycinum S E . . . . . . . . r . . . . . . . _____ 217
7.2. Appendix II: plant species list
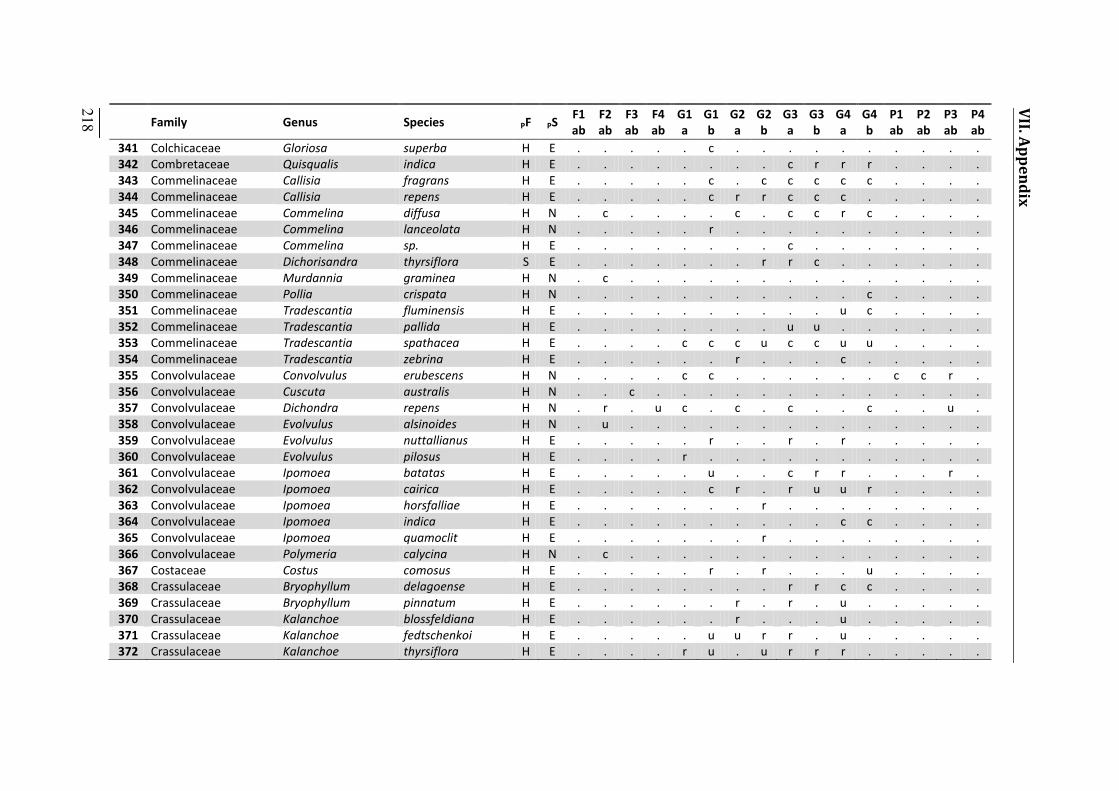
_____ 218
VII. Appendix
Family Genus Species PF PS F1 ab F2 ab F3 ab F4 ab G1 a G1 b G2 a G2 b G3 a G3 b G4 a G4 b P1 ab P2 ab P3 ab P4 ab 341 Colchicaceae Gloriosa superba H E . . . . . c . . . . . . . . . . 342 Combretaceae Quisqualis indica H E . . . . . . . . c r r r . . . . 343 Commelinaceae Callisia fragrans H E . . . . . c . c c c c c . . . . 344 Commelinaceae Callisia repens H E . . . . . c r r c c c . . . . . 345 Commelinaceae Commelina diffusa H N . c . . . . c . c c r c . . . . 346 Commelinaceae Commelina lanceolata H N . . . . . r . . . . . . . . . . 347 Commelinaceae Commelina sp. H E . . . . . . . . c . . . . . . . 348 Commelinaceae Dichorisandra thyrsiflora S E . . . . . . . r r c . . . . . . 349 Commelinaceae Murdannia graminea H N . c . . . . . . . . . . . . . . 350 Commelinaceae Pollia crispata H N . . . . . . . . . . . c . . . . 351 Commelinaceae Tradescantia fluminensis H E . . . . . . . . . . u c . . . . 352 Commelinaceae Tradescantia pallida H E . . . . . . . . u u . . . . . . 353 Commelinaceae Tradescantia spathacea H E . . . . c c c u c c u u . . . . 354 Commelinaceae Tradescantia zebrina H E . . . . . . r . . . c . . . . . 355 Convolvulaceae Convolvulus erubescens H N . . . . c c . . . . . . c c r . 356 Convolvulaceae Cuscuta australis H N . . c . . . . . . . . . . . . . 357 Convolvulaceae Dichondra repens H N . r . u c . c . c . . c . . u . 358 Convolvulaceae Evolvulus alsinoides H N . u . . . . . . . . . . . . . . 359 Convolvulaceae Evolvulus nuttallianus H E . . . . . r . . r . r . . . . . 360 Convolvulaceae Evolvulus pilosus H E . . . . r . . . . . . . . . . . 361 Convolvulaceae Ipomoea batatas H E . . . . . u . . c r r . . . r . 362 Convolvulaceae Ipomoea cairica H E . . . . . c r . r u u r . . . . 363 Convolvulaceae Ipomoea horsfalliae H E . . . . . . . r . . . . . . . . 364 Convolvulaceae Ipomoea indica H E . . . . . . . . . . c c . . . . 365 Convolvulaceae Ipomoea quamoclit H E . . . . . . . r . . . . . . . . 366 Convolvulaceae Polymeria calycina H N . c . . . . . . . . . . . . . . 367 Costaceae Costus comosus H E . . . . . r . r . . . u . . . . 368 Crassulaceae Bryophyllum delagoense H E . . . . . . . . r r c c . . . . 369 Crassulaceae Bryophyllum pinnatum H E . . . . . . r . r . u . . . . . 370 Crassulaceae Kalanchoe blossfeldiana H E . . . . . . r . . . u . . . . . 371 Crassulaceae Kalanchoe fedtschenkoi H E . . . . . u u r r . u . . . . . 372 Crassulaceae Kalanchoe thyrsiflora H E . . . . r u . u r r r . . . . .
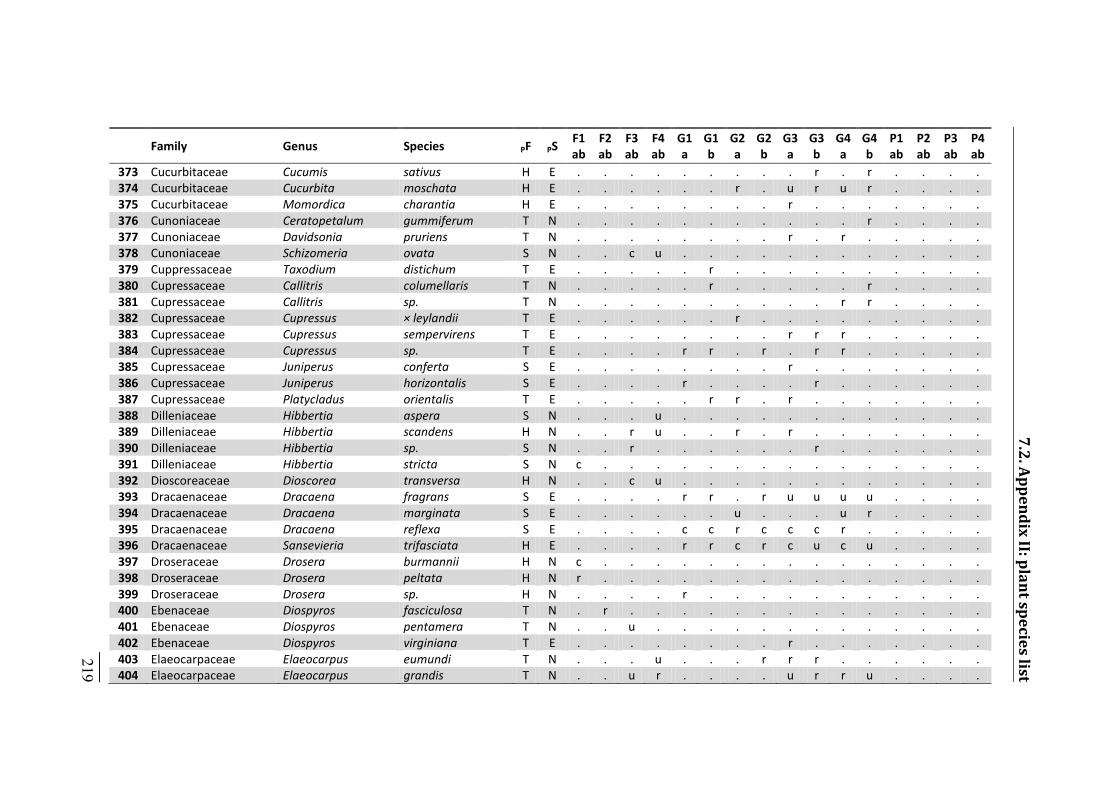
Family Genus Species PF PS F1 ab F2 ab F3 ab F4 ab G1 a G1 b G2 a G2 b G3 a G3 b G4 a G4 b P1 ab P2 ab P3 ab P4 ab 373 Cucurbitaceae Cucumis sativus H E . . . . . . . . . r . r . . . . 374 Cucurbitaceae Cucurbita moschata H E . . . . . . r . u r u r . . . . 375 Cucurbitaceae Momordica charantia H E . . . . . . . . r . . . . . . . 376 Cunoniaceae Ceratopetalum gummiferum T N . . . . . . . . . . . r . . . . 377 Cunoniaceae Davidsonia pruriens T N . . . . . . . . r . r . . . . . 378 Cunoniaceae Schizomeria ovata S N . . c u . . . . . . . . . . . . 379 Cuppressaceae Taxodium distichum T E . . . . . r . . . . . . . . . . 380 Cupressaceae Callitris columellaris T N . . . . . r . . . . . r . . . . 381 Cupressaceae Callitris sp. T N . . . . . . . . . . r r . . . . 382 Cupressaceae Cupressus × leylandii T E . . . . . . r . . . . . . . . . 383 Cupressaceae Cupressus sempervirens T E . . . . . . . . r r r . . . . . 384 Cupressaceae Cupressus sp. T E . . . . r r . r . r r . . . . . 385 Cupressaceae Juniperus conferta S E . . . . . . . . r . . . . . . . 386 Cupressaceae Juniperus horizontalis S E . . . . r . . . . r . . . . . . 387 Cupressaceae Platycladus orientalis T E . . . . . r r . r . . . . . . . 388 Dilleniaceae Hibbertia aspera S N . . . u . . . . . . . . . . . . 389 Dilleniaceae Hibbertia scandens H N . . r u . . r . r . . . . . . . 390 Dilleniaceae Hibbertia sp. S N . . r . . . . . . r . . . . . . 391 Dilleniaceae Hibbertia stricta S N c . . . . . . . . . . . . . . . 392 Dioscoreaceae Dioscorea transversa H N . . c u . . . . . . . . . . . . 393 Dracaenaceae Dracaena fragrans S E . . . . r r . r u u u u . . . . 394 Dracaenaceae Dracaena marginata S E . . . . . . u . . . u r . . . . 395 Dracaenaceae Dracaena reflexa S E . . . . c c r c c c r . . . . . 396 Dracaenaceae Sansevieria trifasciata H E . . . . r r c r c u c u . . . . 397 Droseraceae Drosera burmannii H N c . . . . . . . . . . . . . . . 398 Droseraceae Drosera peltata H N r . . . . . . . . . . . . . . . 399 Droseraceae Drosera sp. H N . . . . r . . . . . . . . . . . 400 Ebenaceae Diospyros fasciculosa T N . r . . . . . . . . . . . . . . 401 Ebenaceae Diospyros pentamera T N . . u . . . . . . . . . . . . . 402 Ebenaceae Diospyros virginiana T E . . . . . . . . r . . . . . . . 403 Elaeocarpaceae Elaeocarpus eumundi T N . . . u . . . r r r . . . . . . 404 Elaeocarpaceae Elaeocarpus grandis T N . . u r . . . . u r r u . . . .
7.2. Appendix II: plant species list _____ 219
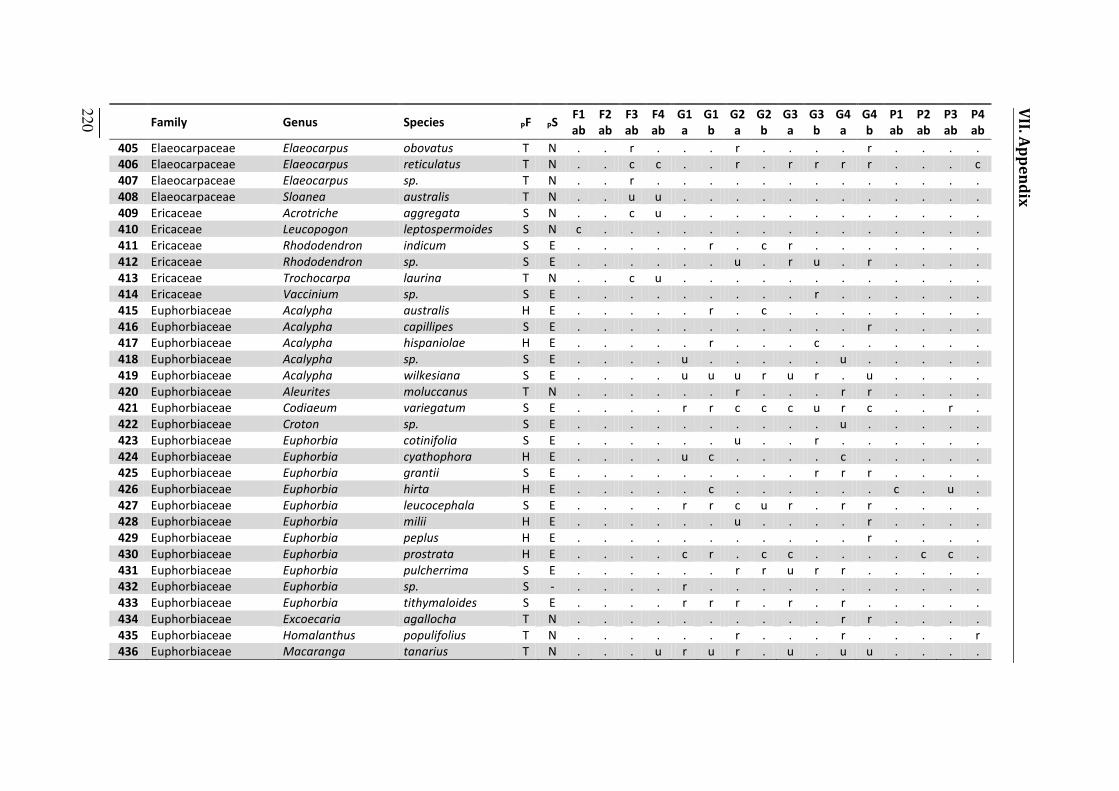
_____ 220
VII. Appendix
Family Genus Species PF PS F1 ab F2 ab F3 ab F4 ab G1 a G1 b G2 a G2 b G3 a G3 b G4 a G4 b P1 ab P2 ab P3 ab P4 ab 405 Elaeocarpaceae Elaeocarpus obovatus T N . . r . . . r . . . . r . . . . 406 Elaeocarpaceae Elaeocarpus reticulatus T N . . c c . . r . r r r r . . . c 407 Elaeocarpaceae Elaeocarpus sp. T N . . r . . . . . . . . . . . . . 408 Elaeocarpaceae Sloanea australis T N . . u u . . . . . . . . . . . . 409 Ericaceae Acrotriche aggregata S N . . c u . . . . . . . . . . . . 410 Ericaceae Leucopogon leptospermoides S N c . . . . . . . . . . . . . . . 411 Ericaceae Rhododendron indicum S E . . . . . r . c r . . . . . . . 412 Ericaceae Rhododendron sp. S E . . . . . . u . r u . r . . . . 413 Ericaceae Trochocarpa laurina T N . . c u . . . . . . . . . . . . 414 Ericaceae Vaccinium sp. S E . . . . . . . . . r . . . . . . 415 Euphorbiaceae Acalypha australis H E . . . . . r . c . . . . . . . . 416 Euphorbiaceae Acalypha capillipes S E . . . . . . . . . . . r . . . . 417 Euphorbiaceae Acalypha hispaniolae H E . . . . . r . . . c . . . . . . 418 Euphorbiaceae Acalypha sp. S E . . . . u . . . . . u . . . . . 419 Euphorbiaceae Acalypha wilkesiana S E . . . . u u u r u r . u . . . . 420 Euphorbiaceae Aleurites moluccanus T N . . . . . . r . . . r r . . . . 421 Euphorbiaceae Codiaeum variegatum S E . . . . r r c c c u r c . . r . 422 Euphorbiaceae Croton sp. S E . . . . . . . . . . u . . . . . 423 Euphorbiaceae Euphorbia cotinifolia S E . . . . . . u . . r . . . . . . 424 Euphorbiaceae Euphorbia cyathophora H E . . . . u c . . . . c . . . . . 425 Euphorbiaceae Euphorbia grantii S E . . . . . . . . . r r r . . . . 426 Euphorbiaceae Euphorbia hirta H E . . . . . c . . . . . . c . u . 427 Euphorbiaceae Euphorbia leucocephala S E . . . . r r c u r . r r . . . . 428 Euphorbiaceae Euphorbia milii H E . . . . . . u . . . . r . . . . 429 Euphorbiaceae Euphorbia peplus H E . . . . . . . . . . . r . . . . 430 Euphorbiaceae Euphorbia prostrata H E . . . . c r . c c . . . . c c . 431 Euphorbiaceae Euphorbia pulcherrima S E . . . . . . r r u r r . . . . . 432 Euphorbiaceae Euphorbia sp. S - . . . . r . . . . . . . . . . . 433 Euphorbiaceae Euphorbia tithymaloides S E . . . . r r r . r . r . . . . . 434 Euphorbiaceae Excoecaria agallocha T N . . . . . . . . . . r r . . . . 435 Euphorbiaceae Homalanthus populifolius T N . . . . . . r . . . r . . . . r 436 Euphorbiaceae Macaranga tanarius T N . . . u r u r . u . u u . . . .

Family Genus Species PF PS F1 ab F2 ab F3 ab F4 ab G1 a G1 b G2 a G2 b G3 a G3 b G4 a G4 b P1 ab P2 ab P3 ab P4 ab 437 Euphorbiaceae Mallotus claoxyloides T N . . . . . . . . . . . r . . . . 438 Euphorbiaceae Mallotus discolor T N . . . . . . . . . . r . . . . . 439 Euphorbiaceae Mallotus philippensis T N . r . u . . . . r . u r . . . . 440 Euphorbiaceae Manihot esculenta S E . . . . . c . . . u . . . . . . 441 Euphorbiaceae Petalostigma pubescens S N . r . . . . . . . . . . . . . . 442 Euphorbiaceae Ricinocarpos pinifolius S N c . . . . . . . . . . . . . . . 443 Euphorbiaceae Ricinus communis S E . . . . . c . . r . . . . . . . 444 Eupomatiaceae Eupomatia bennettii S N . . r r . . . . . . . r . . . . 445 Eupomatiaceae Eupomatia laurina S N . . c u . . . . . . . . . . . . 446 Fabaceae Abrus precatorius H E . . . . . . . . . . . r . . . . 447 Fabaceae Acacia amblygona S - . . . r . . . . . . . . . . . . 448 Fabaceae Acacia attenuata S - c . . . . . . . . . . . . . . . 449 Fabaceae Acacia concurrens T N . . . . . . . r . . . . . . . . 450 Fabaceae Acacia disparrima T N c c r c . . r . r . u c . . r c 451 Fabaceae Acacia fimbriata T N . . . . . . . . r r u r . . . . 452 Fabaceae Acacia flavescens S N c u . . . . . . . . . . . . . . 453 Fabaceae Acacia juncifolia S N r . . . . . . . . . . . . . . . 454 Fabaceae Acacia leiocalyx T N . c . . . . r . . . . . . . c . 455 Fabaceae Acacia leptocarpa T N c . . . . . . . . . . . . . . . 456 Fabaceae Acacia longissima T N . . r . . . . . . . . . . . . . 457 Fabaceae Acacia maidenii T N . r . . . . . . . r . . . . . . 458 Fabaceae Acacia melanoxylon T N . . r u . . r r . . r . . . . u 459 Fabaceae Acacia oshanesii T N . . c c . . . . . . . . . . . . 460 Fabaceae Acacia podalyriifolia T N . . . . . . . . . r r . . . . . 461 Fabaceae Acacia suaveolens S N c . . . . . . . . . . . . . . . 462 Fabaceae Acacia ulicifolia S N c . . . . . . . . . . . . . . . 463 Fabaceae Albizia lebbeck T N . . . . . r . . . . . r . . . . 464 Fabaceae Aotus lanigera S - c . . . . . . . . . . . . . . . 465 Fabaceae Archidendron sp. T N . . r r . . . . . . . . . . . . 466 Fabaceae Austrosteenisia blackii H - . u . r . . . . . . . . . . . . 467 Fabaceae Caesalpinia ferrea T E . . . . r r r . u c r c . . r . 468 Fabaceae Caesalpinia pulcherrima S E . . . . . r . . . . . . . . . . _____ 221
7.2. Appendix II: plant species list
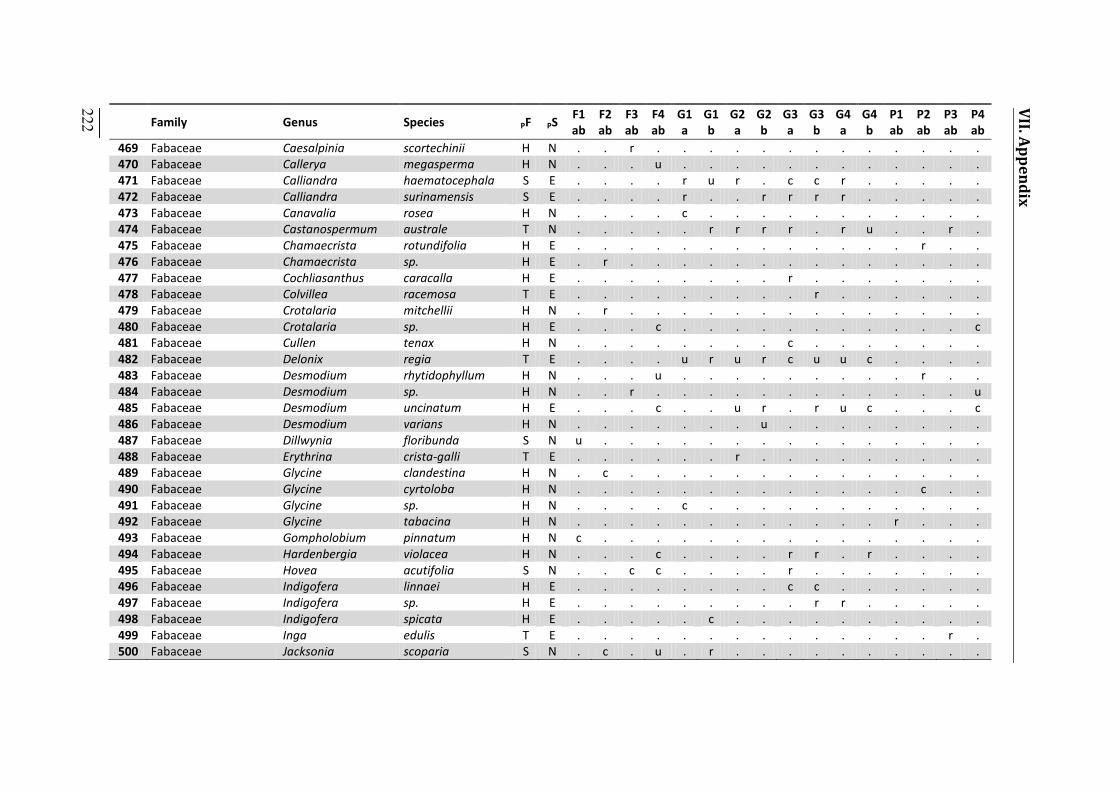
_____ 222
VII. Appendix
Family Genus Species PF PS F1 ab F2 ab F3 ab F4 ab G1 a G1 b G2 a G2 b G3 a G3 b G4 a G4 b P1 ab P2 ab P3 ab P4 ab 469 Fabaceae Caesalpinia scortechinii H N . . r . . . . . . . . . . . . . 470 Fabaceae Callerya megasperma H N . . . u . . . . . . . . . . . . 471 Fabaceae Calliandra haematocephala S E . . . . r u r . c c r . . . . . 472 Fabaceae Calliandra surinamensis S E . . . . r . . r r r r . . . . . 473 Fabaceae Canavalia rosea H N . . . . c . . . . . . . . . . . 474 Fabaceae Castanospermum australe T N . . . . . r r r r . r u . . r . 475 Fabaceae Chamaecrista rotundifolia H E . . . . . . . . . . . . . r . . 476 Fabaceae Chamaecrista sp. H E . r . . . . . . . . . . . . . . 477 Fabaceae Cochliasanthus caracalla H E . . . . . . . . r . . . . . . . 478 Fabaceae Colvillea racemosa T E . . . . . . . . . r . . . . . . 479 Fabaceae Crotalaria mitchellii H N . r . . . . . . . . . . . . . . 480 Fabaceae Crotalaria sp. H E . . . c . . . . . . . . . . . c 481 Fabaceae Cullen tenax H N . . . . . . . . c . . . . . . . 482 Fabaceae Delonix regia T E . . . . u r u r c u u c . . . . 483 Fabaceae Desmodium rhytidophyllum H N . . . u . . . . . . . . . r . . 484 Fabaceae Desmodium sp. H N . . r . . . . . . . . . . . . u 485 Fabaceae Desmodium uncinatum H E . . . c . . u r . r u c . . . c 486 Fabaceae Desmodium varians H N . . . . . . . u . . . . . . . . 487 Fabaceae Dillwynia floribunda S N u . . . . . . . . . . . . . . . 488 Fabaceae Erythrina crista-galli T E . . . . . . r . . . . . . . . . 489 Fabaceae Glycine clandestina H N . c . . . . . . . . . . . . . . 490 Fabaceae Glycine cyrtoloba H N . . . . . . . . . . . . . c . . 491 Fabaceae Glycine sp. H N . . . . c . . . . . . . . . . . 492 Fabaceae Glycine tabacina H N . . . . . . . . . . . . r . . . 493 Fabaceae Gompholobium pinnatum H N c . . . . . . . . . . . . . . . 494 Fabaceae Hardenbergia violacea H N . . . c . . . . r r . r . . . . 495 Fabaceae Hovea acutifolia S N . . c c . . . . r . . . . . . . 496 Fabaceae Indigofera linnaei H E . . . . . . . . c c . . . . . . 497 Fabaceae Indigofera sp. H E . . . . . . . . . r r . . . . . 498 Fabaceae Indigofera spicata H E . . . . . c . . . . . . . . . . 499 Fabaceae Inga edulis T E . . . . . . . . . . . . . . r . 500 Fabaceae Jacksonia scoparia S N . c . u . r . . . . . . . . . .
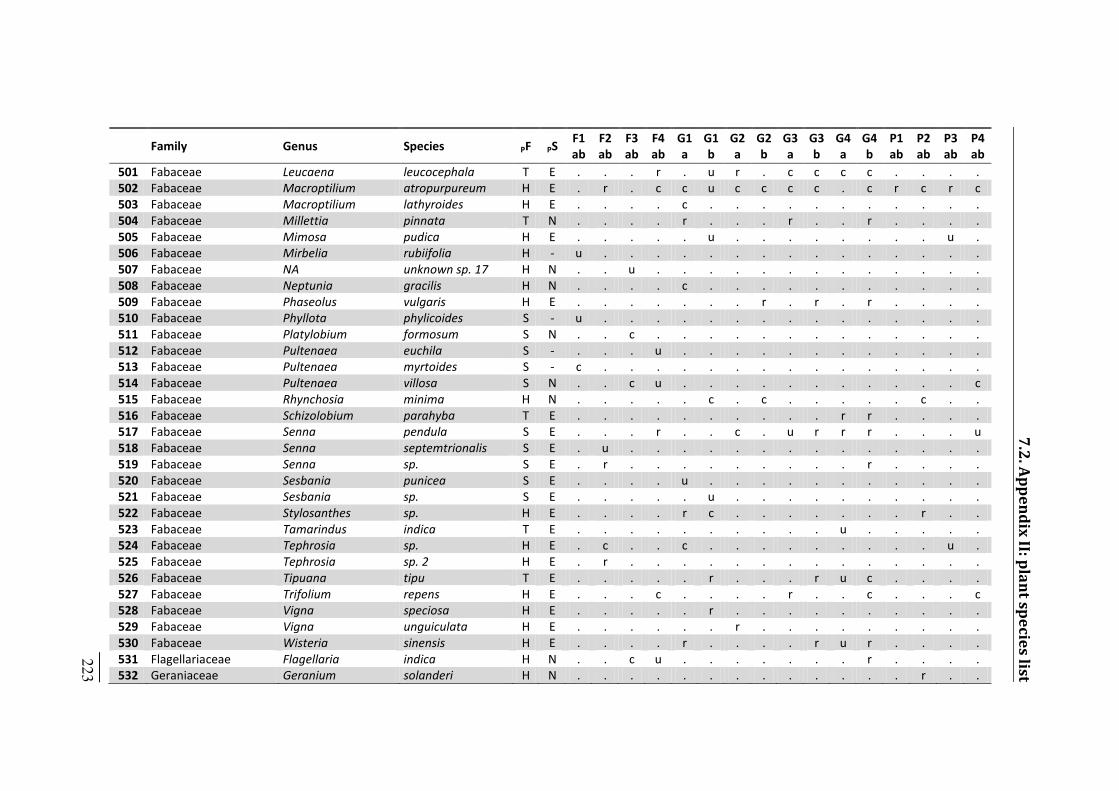
Family Genus Species PF PS F1 ab F2 ab F3 ab F4 ab G1 a G1 b G2 a G2 b G3 a G3 b G4 a G4 b P1 ab P2 ab P3 ab P4 ab 501 Fabaceae Leucaena leucocephala T E . . . r . u r . c c c c . . . . 502 Fabaceae Macroptilium atropurpureum H E . r . c c u c c c c . c r c r c 503 Fabaceae Macroptilium lathyroides H E . . . . c . . . . . . . . . . . 504 Fabaceae Millettia pinnata T N . . . . r . . . r . . r . . . . 505 Fabaceae Mimosa pudica H E . . . . . u . . . . . . . . u . 506 Fabaceae Mirbelia rubiifolia H - u . . . . . . . . . . . . . . . 507 Fabaceae NA unknown sp. 17 H N . . u . . . . . . . . . . . . . 508 Fabaceae Neptunia gracilis H N . . . . c . . . . . . . . . . . 509 Fabaceae Phaseolus vulgaris H E . . . . . . . r . r . r . . . . 510 Fabaceae Phyllota phylicoides S - u . . . . . . . . . . . . . . . 511 Fabaceae Platylobium formosum S N . . c . . . . . . . . . . . . . 512 Fabaceae Pultenaea euchila S - . . . u . . . . . . . . . . . . 513 Fabaceae Pultenaea myrtoides S - c . . . . . . . . . . . . . . . 514 Fabaceae Pultenaea villosa S N . . c u . . . . . . . . . . . c 515 Fabaceae Rhynchosia minima H N . . . . . c . c . . . . . c . . 516 Fabaceae Schizolobium parahyba T E . . . . . . . . . . r r . . . . 517 Fabaceae Senna pendula S E . . . r . . c . u r r r . . . u 518 Fabaceae Senna septemtrionalis S E . u . . . . . . . . . . . . . . 519 Fabaceae Senna sp. S E . r . . . . . . . . . r . . . . 520 Fabaceae Sesbania punicea S E . . . . u . . . . . . . . . . . 521 Fabaceae Sesbania sp. S E . . . . . u . . . . . . . . . . 522 Fabaceae Stylosanthes sp. H E . . . . r c . . . . . . . r . . 523 Fabaceae Tamarindus indica T E . . . . . . . . . . u . . . . . 524 Fabaceae Tephrosia sp. H E . c . . c . . . . . . . . . u . 525 Fabaceae Tephrosia sp. 2 H E . r . . . . . . . . . . . . . . 526 Fabaceae Tipuana tipu T E . . . . . r . . . r u c . . . . 527 Fabaceae Trifolium repens H E . . . c . . . . r . . c . . . c 528 Fabaceae Vigna speciosa H E . . . . . r . . . . . . . . . . 529 Fabaceae Vigna unguiculata H E . . . . . . r . . . . . . . . . 530 Fabaceae Wisteria sinensis H E . . . . r . . . . r u r . . . . 531 Flagellariaceae Flagellaria indica H N . . c u . . . . . . . r . . . . 532 Geraniaceae Geranium solanderi H N . . . . . . . . . . . . . r . . _____ 223
7.2. Appendix II: plant species list
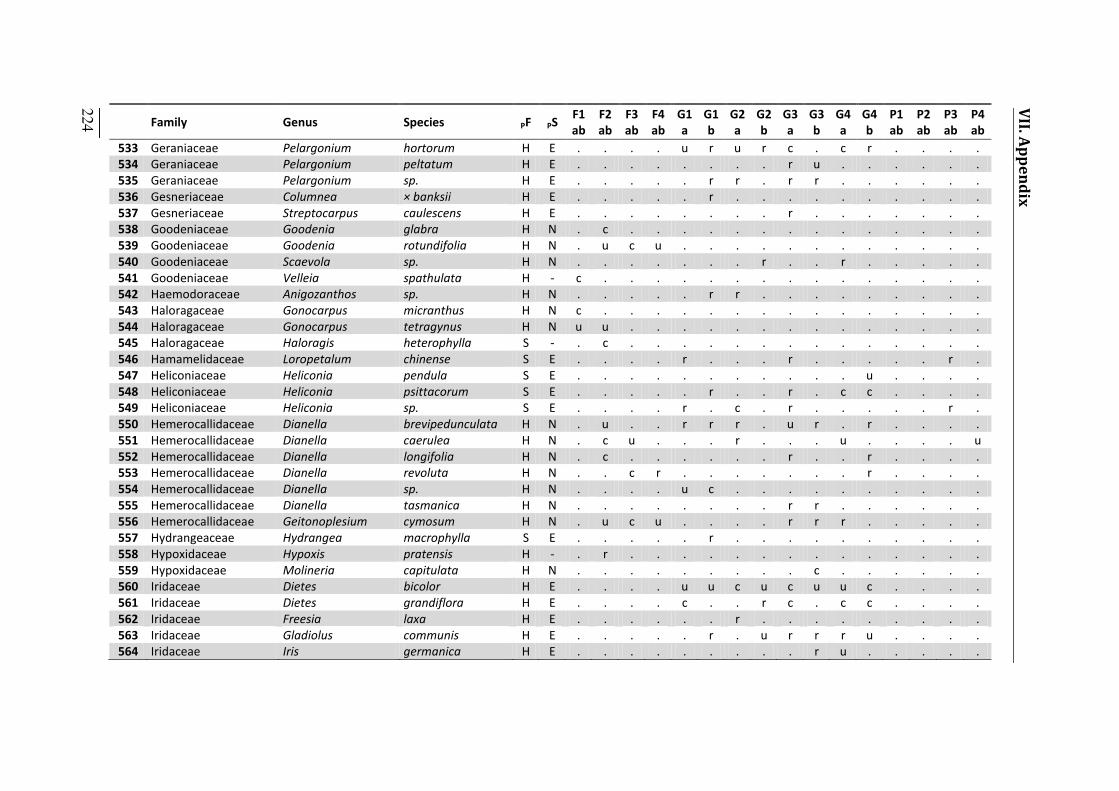
VII. Appendix
_____ 224 Family Genus Species PF PS F1 ab F2 ab F3 ab F4 ab G1 a G1 b G2 a G2 b G3 a G3 b G4 a G4 b P1 ab P2 ab P3 ab P4 ab 533 Geraniaceae Pelargonium hortorum H E . . . . u r u r c . c r . . . . 534 Geraniaceae Pelargonium peltatum H E . . . . . . . . r u . . . . . . 535 Geraniaceae Pelargonium sp. H E . . . . . r r . r r . . . . . . 536 Gesneriaceae Columnea × banksii H E . . . . . r . . . . . . . . . . 537 Gesneriaceae Streptocarpus caulescens H E . . . . . . . . r . . . . . . . 538 Goodeniaceae Goodenia glabra H N . c . . . . . . . . . . . . . . 539 Goodeniaceae Goodenia rotundifolia H N . u c u . . . . . . . . . . . . 540 Goodeniaceae Scaevola sp. H N . . . . . . . r . . r . . . . . 541 Goodeniaceae Velleia spathulata H - c . . . . . . . . . . . . . . . 542 Haemodoraceae Anigozanthos sp. H N . . . . . r r . . . . . . . . . 543 Haloragaceae Gonocarpus micranthus H N c . . . . . . . . . . . . . . . 544 Haloragaceae Gonocarpus tetragynus H N u u . . . . . . . . . . . . . . 545 Haloragaceae Haloragis heterophylla S - . c . . . . . . . . . . . . . . 546 Hamamelidaceae Loropetalum chinense S E . . . . r . . . r . . . . . r . 547 Heliconiaceae Heliconia pendula S E . . . . . . . . . . . u . . . . 548 Heliconiaceae Heliconia psittacorum S E . . . . . r . . r . c c . . . . 549 Heliconiaceae Heliconia sp. S E . . . . r . c . r . . . . . r . 550 Hemerocallidaceae Dianella brevipedunculata H N . u . . r r r . u r . r . . . . 551 Hemerocallidaceae Dianella caerulea H N . c u . . . r . . . u . . . . u 552 Hemerocallidaceae Dianella longifolia H N . c . . . . . . r . . r . . . . 553 Hemerocallidaceae Dianella revoluta H N . . c r . . . . . . . r . . . . 554 Hemerocallidaceae Dianella sp. H N . . . . u c . . . . . . . . . . 555 Hemerocallidaceae Dianella tasmanica H N . . . . . . . . r r . . . . . . 556 Hemerocallidaceae Geitonoplesium cymosum H N . u c u . . . . r r r . . . . . 557 Hydrangeaceae Hydrangea macrophylla S E . . . . . r . . . . . . . . . . 558 Hypoxidaceae Hypoxis pratensis H - . r . . . . . . . . . . . . . . 559 Hypoxidaceae Molineria capitulata H N . . . . . . . . . c . . . . . . 560 Iridaceae Dietes bicolor H E . . . . u u c u c u u c . . . . 561 Iridaceae Dietes grandiflora H E . . . . c . . r c . c c . . . . 562 Iridaceae Freesia laxa H E . . . . . . r . . . . . . . . . 563 Iridaceae Gladiolus communis H E . . . . . r . u r r r u . . . . 564 Iridaceae Iris germanica H E . . . . . . . . . r u . . . . .
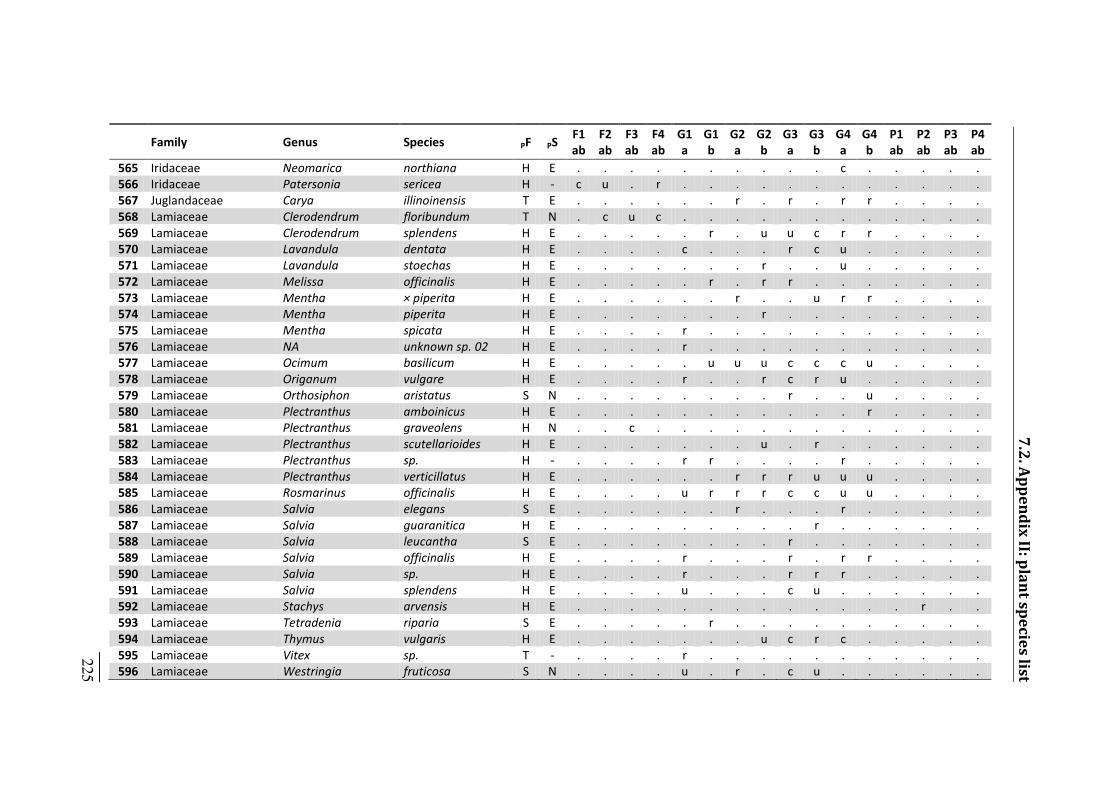
Family Genus Species PF PS F1 ab F2 ab F3 ab F4 ab G1 a G1 b G2 a G2 b G3 a G3 b G4 a G4 b P1 ab P2 ab P3 ab P4 ab 565 Iridaceae Neomarica northiana H E . . . . . . . . . . c . . . . . 566 Iridaceae Patersonia sericea H - c u . r . . . . . . . . . . . . 567 Juglandaceae Carya illinoinensis T E . . . . . . r . r . r r . . . . 568 Lamiaceae Clerodendrum floribundum T N . c u c . . . . . . . . . . . . 569 Lamiaceae Clerodendrum splendens H E . . . . . r . u u c r r . . . . 570 Lamiaceae Lavandula dentata H E . . . . c . . . r c u . . . . . 571 Lamiaceae Lavandula stoechas H E . . . . . . . r . . u . . . . . 572 Lamiaceae Melissa officinalis H E . . . . . r . r r . . . . . . . 573 Lamiaceae Mentha × piperita H E . . . . . . r . . u r r . . . . 574 Lamiaceae Mentha piperita H E . . . . . . . r . . . . . . . . 575 Lamiaceae Mentha spicata H E . . . . r . . . . . . . . . . . 576 Lamiaceae NA unknown sp. 02 H E . . . . r . . . . . . . . . . . 577 Lamiaceae Ocimum basilicum H E . . . . . u u u c c c u . . . . 578 Lamiaceae Origanum vulgare H E . . . . r . . r c r u . . . . . 579 Lamiaceae Orthosiphon aristatus S N . . . . . . . . r . . u . . . . 580 Lamiaceae Plectranthus amboinicus H E . . . . . . . . . . . r . . . . 581 Lamiaceae Plectranthus graveolens H N . . c . . . . . . . . . . . . . 582 Lamiaceae Plectranthus scutellarioides H E . . . . . . . u . r . . . . . . 583 Lamiaceae Plectranthus sp. H - . . . . r r . . . . r . . . . . 584 Lamiaceae Plectranthus verticillatus H E . . . . . . r r r u u u . . . . 585 Lamiaceae Rosmarinus officinalis H E . . . . u r r r c c u u . . . . 586 Lamiaceae Salvia elegans S E . . . . . . r . . . r . . . . . 587 Lamiaceae Salvia guaranitica H E . . . . . . . . . r . . . . . . 588 Lamiaceae Salvia leucantha S E . . . . . . . . r . . . . . . . 589 Lamiaceae Salvia officinalis H E . . . . r . . . r . r r . . . . 590 Lamiaceae Salvia sp. H E . . . . r . . . r r r . . . . . 591 Lamiaceae Salvia splendens H E . . . . u . . . c u . . . . . . 592 Lamiaceae Stachys arvensis H E . . . . . . . . . . . . . r . . 593 Lamiaceae Tetradenia riparia S E . . . . . r . . . . . . . . . . 594 Lamiaceae Thymus vulgaris H E . . . . . . . u c r c . . . . . 595 Lamiaceae Vitex sp. T - . . . . r . . . . . . . . . . . 596 Lamiaceae Westringia fruticosa S N . . . . u . r . c u . . . . . . _____ 225
7.2. Appendix II: plant species list
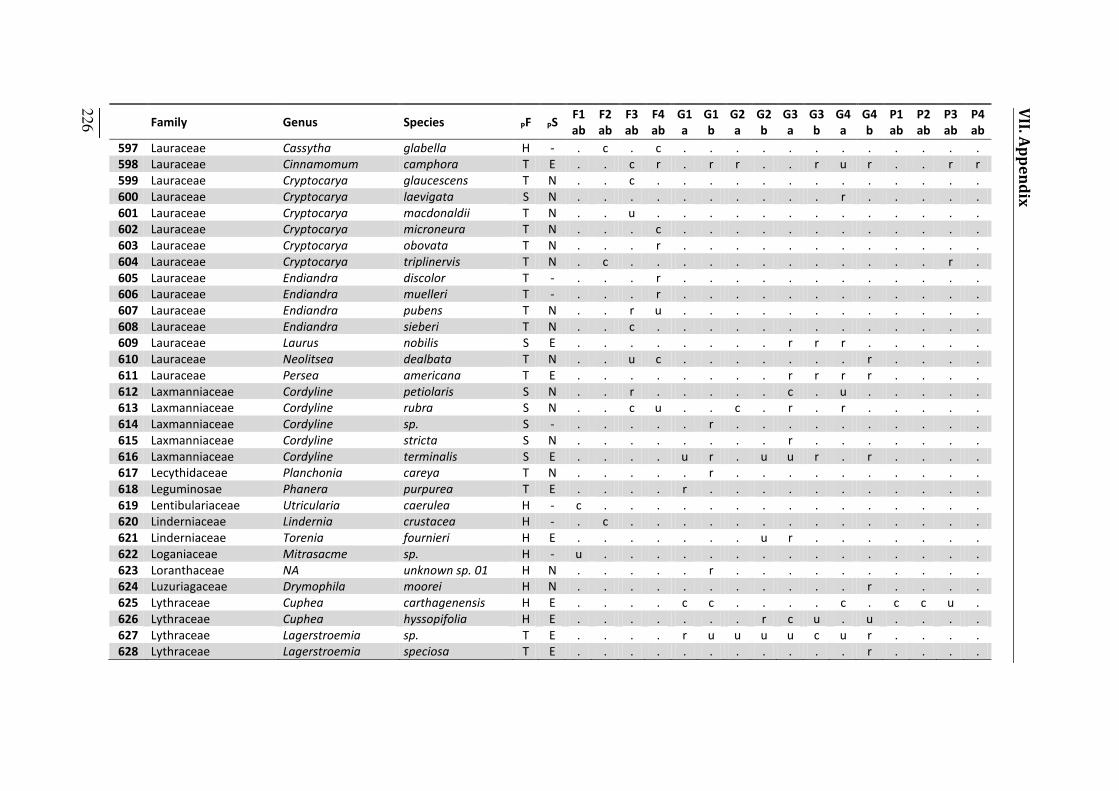
_____ 226
VII. Appendix
Family Genus Species PF PS F1 ab F2 ab F3 ab F4 ab G1 a G1 b G2 a G2 b G3 a G3 b G4 a G4 b P1 ab P2 ab P3 ab P4 ab 597 Lauraceae Cassytha glabella H - . c . c . . . . . . . . . . . . 598 Lauraceae Cinnamomum camphora T E . . c r . r r . . r u r . . r r 599 Lauraceae Cryptocarya glaucescens T N . . c . . . . . . . . . . . . . 600 Lauraceae Cryptocarya laevigata S N . . . . . . . . . . r . . . . . 601 Lauraceae Cryptocarya macdonaldii T N . . u . . . . . . . . . . . . . 602 Lauraceae Cryptocarya microneura T N . . . c . . . . . . . . . . . . 603 Lauraceae Cryptocarya obovata T N . . . r . . . . . . . . . . . . 604 Lauraceae Cryptocarya triplinervis T N . c . . . . . . . . . . . . r . 605 Lauraceae Endiandra discolor T - . . . r . . . . . . . . . . . . 606 Lauraceae Endiandra muelleri T - . . . r . . . . . . . . . . . . 607 Lauraceae Endiandra pubens T N . . r u . . . . . . . . . . . . 608 Lauraceae Endiandra sieberi T N . . c . . . . . . . . . . . . . 609 Lauraceae Laurus nobilis S E . . . . . . . . r r r . . . . . 610 Lauraceae Neolitsea dealbata T N . . u c . . . . . . . r . . . . 611 Lauraceae Persea americana T E . . . . . . . . r r r r . . . . 612 Laxmanniaceae Cordyline petiolaris S N . . r . . . . . c . u . . . . . 613 Laxmanniaceae Cordyline rubra S N . . c u . . c . r . r . . . . . 614 Laxmanniaceae Cordyline sp. S - . . . . . r . . . . . . . . . . 615 Laxmanniaceae Cordyline stricta S N . . . . . . . . r . . . . . . . 616 Laxmanniaceae Cordyline terminalis S E . . . . u r . u u r . r . . . . 617 Lecythidaceae Planchonia careya T N . . . . . r . . . . . . . . . . 618 Leguminosae Phanera purpurea T E . . . . r . . . . . . . . . . . 619 Lentibulariaceae Utricularia caerulea H - c . . . . . . . . . . . . . . . 620 Linderniaceae Lindernia crustacea H - . c . . . . . . . . . . . . . . 621 Linderniaceae Torenia fournieri H E . . . . . . . u r . . . . . . . 622 Loganiaceae Mitrasacme sp. H - u . . . . . . . . . . . . . . . 623 Loranthaceae NA unknown sp. 01 H N . . . . . r . . . . . . . . . . 624 Luzuriagaceae Drymophila moorei H N . . . . . . . . . . . r . . . . 625 Lythraceae Cuphea carthagenensis H E . . . . c c . . . . c . c c u . 626 Lythraceae Cuphea hyssopifolia H E . . . . . . . r c u . u . . . . 627 Lythraceae Lagerstroemia sp. T E . . . . r u u u u c u r . . . . 628 Lythraceae Lagerstroemia speciosa T E . . . . . . . . . . . r . . . .
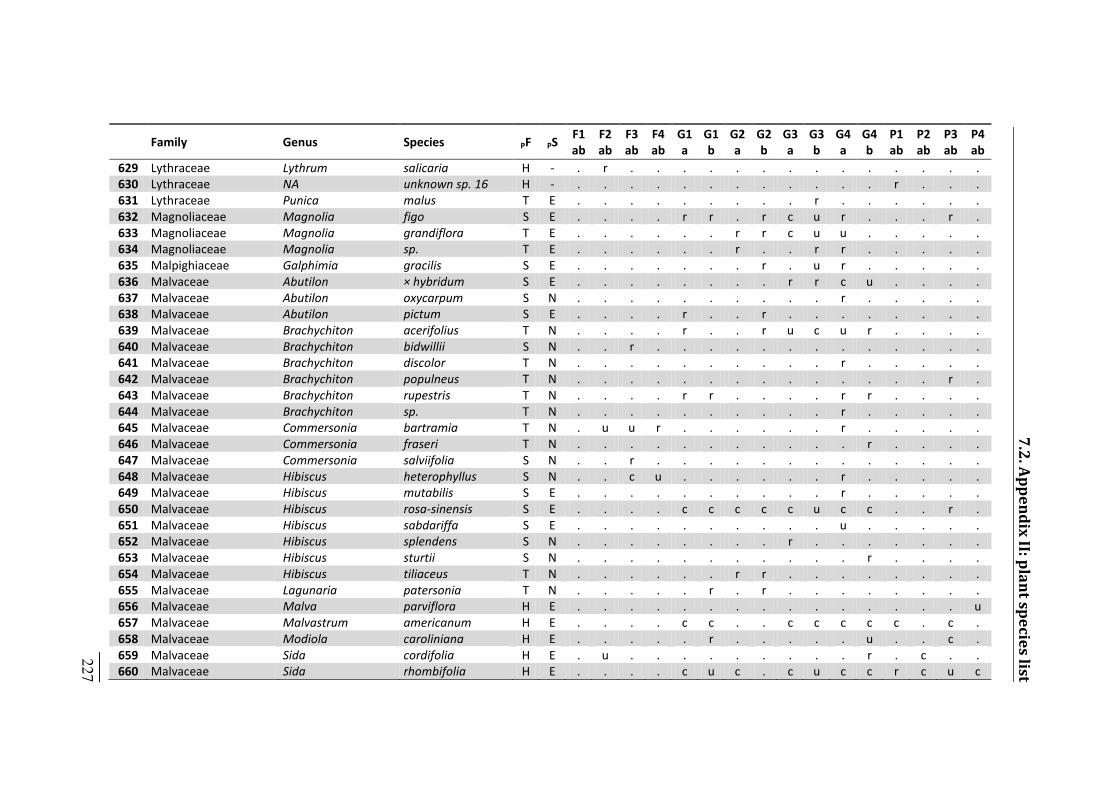
Family Genus Species PF PS F1 ab F2 ab F3 ab F4 ab G1 a G1 b G2 a G2 b G3 a G3 b G4 a G4 b P1 ab P2 ab P3 ab P4 ab 629 Lythraceae Lythrum salicaria H - . r . . . . . . . . . . . . . . 630 Lythraceae NA unknown sp. 16 H - . . . . . . . . . . . . r . . . 631 Lythraceae Punica malus T E . . . . . . . . . r . . . . . . 632 Magnoliaceae Magnolia figo S E . . . . r r . r c u r . . . r . 633 Magnoliaceae Magnolia grandiflora T E . . . . . . r r c u u . . . . . 634 Magnoliaceae Magnolia sp. T E . . . . . . r . . r r . . . . . 635 Malpighiaceae Galphimia gracilis S E . . . . . . . r . u r . . . . . 636 Malvaceae Abutilon × hybridum S E . . . . . . . . r r c u . . . . 637 Malvaceae Abutilon oxycarpum S N . . . . . . . . . . r . . . . . 638 Malvaceae Abutilon pictum S E . . . . r . . r . . . . . . . . 639 Malvaceae Brachychiton acerifolius T N . . . . r . . r u c u r . . . . 640 Malvaceae Brachychiton bidwillii S N . . r . . . . . . . . . . . . . 641 Malvaceae Brachychiton discolor T N . . . . . . . . . . r . . . . . 642 Malvaceae Brachychiton populneus T N . . . . . . . . . . . . . . r . 643 Malvaceae Brachychiton rupestris T N . . . . r r . . . . r r . . . . 644 Malvaceae Brachychiton sp. T N . . . . . . . . . . r . . . . . 645 Malvaceae Commersonia bartramia T N . u u r . . . . . . r . . . . . 646 Malvaceae Commersonia fraseri T N . . . . . . . . . . . r . . . . 647 Malvaceae Commersonia salviifolia S N . . r . . . . . . . . . . . . . 648 Malvaceae Hibiscus heterophyllus S N . . c u . . . . . . r . . . . . 649 Malvaceae Hibiscus mutabilis S E . . . . . . . . . . r . . . . . 650 Malvaceae Hibiscus rosa-sinensis S E . . . . c c c c c u c c . . r . 651 Malvaceae Hibiscus sabdariffa S E . . . . . . . . . . u . . . . . 652 Malvaceae Hibiscus splendens S N . . . . . . . . r . . . . . . . 653 Malvaceae Hibiscus sturtii S N . . . . . . . . . . . r . . . . 654 Malvaceae Hibiscus tiliaceus T N . . . . . . r r . . . . . . . . 655 Malvaceae Lagunaria patersonia T N . . . . . r . r . . . . . . . . 656 Malvaceae Malva parviflora H E . . . . . . . . . . . . . . . u 657 Malvaceae Malvastrum americanum H E . . . . c c . . c c c c c . c . 658 Malvaceae Modiola caroliniana H E . . . . . r . . . . . u . . c . 659 Malvaceae Sida cordifolia H E . u . . . . . . . . . r . c . . 660 Malvaceae Sida rhombifolia H E . . . . c u c . c u c c r c u c _____ 227
7.2. Appendix II: plant species list
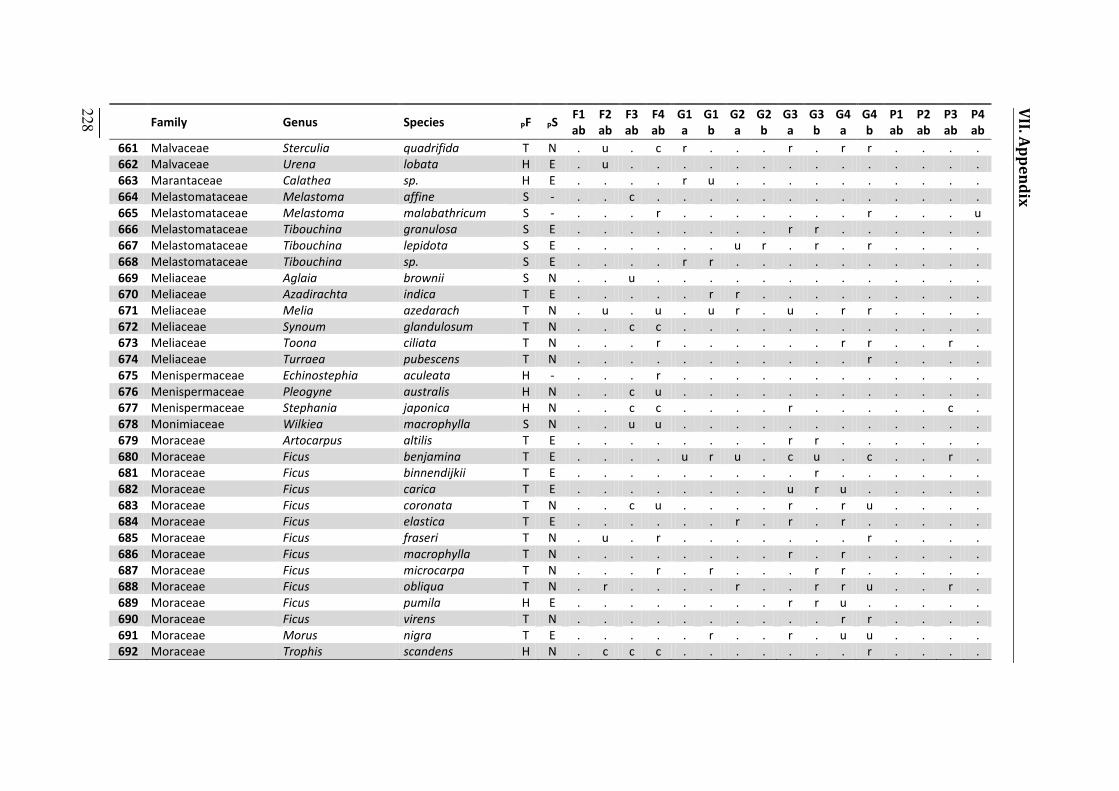
_____ 228
VII. Appendix
Family Genus Species PF PS F1 ab F2 ab F3 ab F4 ab G1 a G1 b G2 a G2 b G3 a G3 b G4 a G4 b P1 ab P2 ab P3 ab P4 ab 661 Malvaceae Sterculia quadrifida T N . u . c r . . . r . r r . . . . 662 Malvaceae Urena lobata H E . u . . . . . . . . . . . . . . 663 Marantaceae Calathea sp. H E . . . . r u . . . . . . . . . . 664 Melastomataceae Melastoma affine S - . . c . . . . . . . . . . . . . 665 Melastomataceae Melastoma malabathricum S - . . . r . . . . . . . r . . . u 666 Melastomataceae Tibouchina granulosa S E . . . . . . . . r r . . . . . . 667 Melastomataceae Tibouchina lepidota S E . . . . . . u r . r . r . . . . 668 Melastomataceae Tibouchina sp. S E . . . . r r . . . . . . . . . . 669 Meliaceae Aglaia brownii S N . . u . . . . . . . . . . . . . 670 Meliaceae Azadirachta indica T E . . . . . r r . . . . . . . . . 671 Meliaceae Melia azedarach T N . u . u . u r . u . r r . . . . 672 Meliaceae Synoum glandulosum T N . . c c . . . . . . . . . . . . 673 Meliaceae Toona ciliata T N . . . r . . . . . . r r . . r . 674 Meliaceae Turraea pubescens T N . . . . . . . . . . . r . . . . 675 Menispermaceae Echinostephia aculeata H - . . . r . . . . . . . . . . . . 676 Menispermaceae Pleogyne australis H N . . c u . . . . . . . . . . . . 677 Menispermaceae Stephania japonica H N . . c c . . . . r . . . . . c . 678 Monimiaceae Wilkiea macrophylla S N . . u u . . . . . . . . . . . . 679 Moraceae Artocarpus altilis T E . . . . . . . . r r . . . . . . 680 Moraceae Ficus benjamina T E . . . . u r u . c u . c . . r . 681 Moraceae Ficus binnendijkii T E . . . . . . . . . r . . . . . . 682 Moraceae Ficus carica T E . . . . . . . . u r u . . . . . 683 Moraceae Ficus coronata T N . . c u . . . . r . r u . . . . 684 Moraceae Ficus elastica T E . . . . . . r . r . r . . . . . 685 Moraceae Ficus fraseri T N . u . r . . . . . . . r . . . . 686 Moraceae Ficus macrophylla T N . . . . . . . . r . r . . . . . 687 Moraceae Ficus microcarpa T N . . . r . r . . . r r . . . . . 688 Moraceae Ficus obliqua T N . r . . . . r . . r r u . . r . 689 Moraceae Ficus pumila H E . . . . . . . . r r u . . . . . 690 Moraceae Ficus virens T N . . . . . . . . . . r r . . . . 691 Moraceae Morus nigra T E . . . . . r . . r . u u . . . . 692 Moraceae Trophis scandens H N . c c c . . . . . . . r . . . .
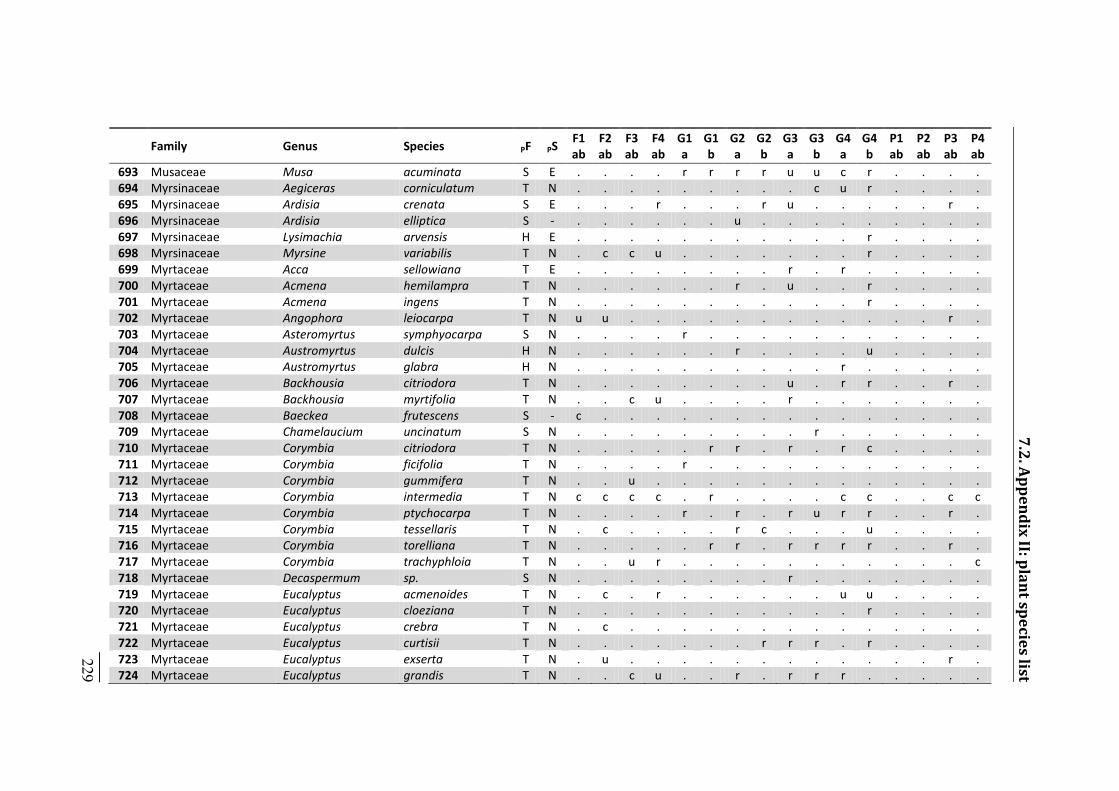
Family Genus Species PF PS F1 ab F2 ab F3 ab F4 ab G1 a G1 b G2 a G2 b G3 a G3 b G4 a G4 b P1 ab P2 ab P3 ab P4 ab 693 Musaceae Musa acuminata S E . . . . r r r r u u c r . . . . 694 Myrsinaceae Aegiceras corniculatum T N . . . . . . . . . c u r . . . . 695 Myrsinaceae Ardisia crenata S E . . . r . . . r u . . . . . r . 696 Myrsinaceae Ardisia elliptica S - . . . . . . u . . . . . . . . . 697 Myrsinaceae Lysimachia arvensis H E . . . . . . . . . . . r . . . . 698 Myrsinaceae Myrsine variabilis T N . c c u . . . . . . . r . . . . 699 Myrtaceae Acca sellowiana T E . . . . . . . . r . r . . . . . 700 Myrtaceae Acmena hemilampra T N . . . . . . r . u . . r . . . . 701 Myrtaceae Acmena ingens T N . . . . . . . . . . . r . . . . 702 Myrtaceae Angophora leiocarpa T N u u . . . . . . . . . . . . r . 703 Myrtaceae Asteromyrtus symphyocarpa S N . . . . r . . . . . . . . . . . 704 Myrtaceae Austromyrtus dulcis H N . . . . . . r . . . . u . . . . 705 Myrtaceae Austromyrtus glabra H N . . . . . . . . . . r . . . . . 706 Myrtaceae Backhousia citriodora T N . . . . . . . . u . r r . . r . 707 Myrtaceae Backhousia myrtifolia T N . . c u . . . . r . . . . . . . 708 Myrtaceae Baeckea frutescens S - c . . . . . . . . . . . . . . . 709 Myrtaceae Chamelaucium uncinatum S N . . . . . . . . . r . . . . . . 710 Myrtaceae Corymbia citriodora T N . . . . . r r . r . r c . . . . 711 Myrtaceae Corymbia ficifolia T N . . . . r . . . . . . . . . . . 712 Myrtaceae Corymbia gummifera T N . . u . . . . . . . . . . . . . 713 Myrtaceae Corymbia intermedia T N c c c c . r . . . . c c . . c c 714 Myrtaceae Corymbia ptychocarpa T N . . . . r . r . r u r r . . r . 715 Myrtaceae Corymbia tessellaris T N . c . . . . r c . . . u . . . . 716 Myrtaceae Corymbia torelliana T N . . . . . r r . r r r r . . r . 717 Myrtaceae Corymbia trachyphloia T N . . u r . . . . . . . . . . . c 718 Myrtaceae Decaspermum sp. S N . . . . . . . . r . . . . . . . 719 Myrtaceae Eucalyptus acmenoides T N . c . r . . . . . . u u . . . . 720 Myrtaceae Eucalyptus cloeziana T N . . . . . . . . . . . r . . . . 721 Myrtaceae Eucalyptus crebra T N . c . . . . . . . . . . . . . . 722 Myrtaceae Eucalyptus curtisii T N . . . . . . . r r r . r . . . . 723 Myrtaceae Eucalyptus exserta T N . u . . . . . . . . . . . . r . 724 Myrtaceae Eucalyptus grandis T N . . c u . . r . r r r . . . . . _____ 229
7.2. Appendix II: plant species list
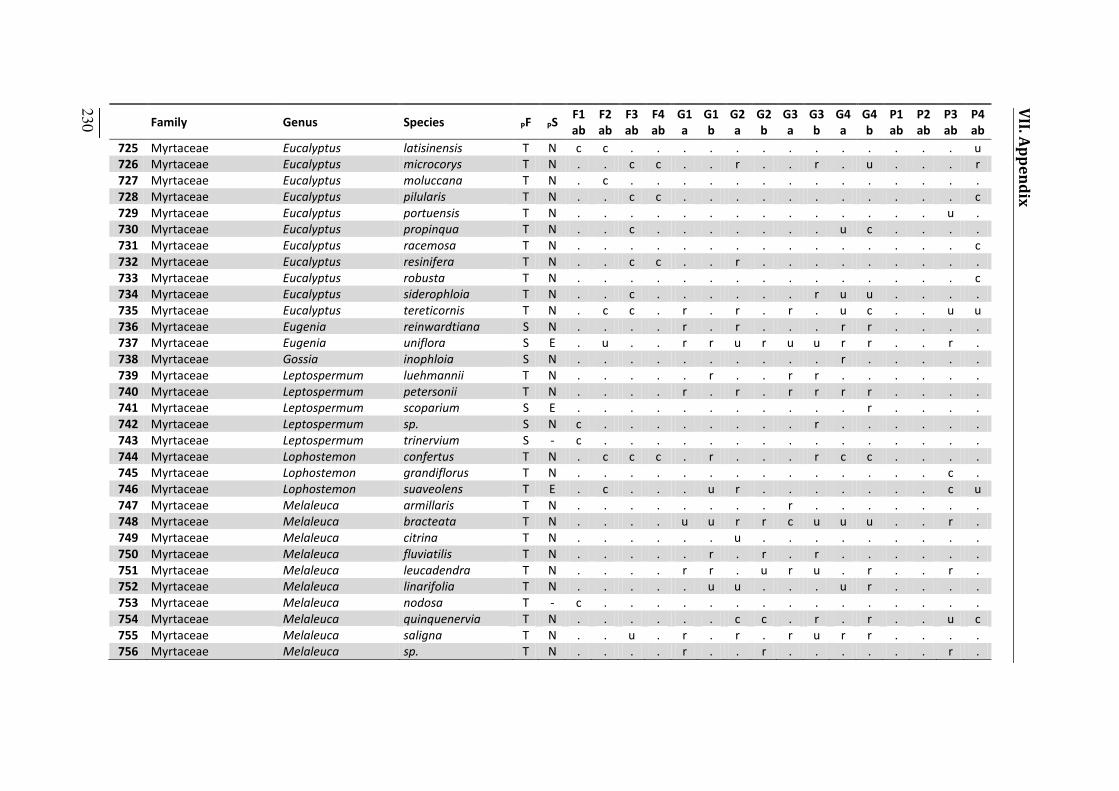
VII. Appendix
_____ 230 Family Genus Species PF PS F1 ab F2 ab F3 ab F4 ab G1 a G1 b G2 a G2 b G3 a G3 b G4 a G4 b P1 ab P2 ab P3 ab P4 ab 725 Myrtaceae Eucalyptus latisinensis T N c c . . . . . . . . . . . . . u 726 Myrtaceae Eucalyptus microcorys T N . . c c . . r . . r . u . . . r 727 Myrtaceae Eucalyptus moluccana T N . c . . . . . . . . . . . . . . 728 Myrtaceae Eucalyptus pilularis T N . . c c . . . . . . . . . . . c 729 Myrtaceae Eucalyptus portuensis T N . . . . . . . . . . . . . . u . 730 Myrtaceae Eucalyptus propinqua T N . . c . . . . . . . u c . . . . 731 Myrtaceae Eucalyptus racemosa T N . . . . . . . . . . . . . . . c 732 Myrtaceae Eucalyptus resinifera T N . . c c . . r . . . . . . . . . 733 Myrtaceae Eucalyptus robusta T N . . . . . . . . . . . . . . . c 734 Myrtaceae Eucalyptus siderophloia T N . . c . . . . . . r u u . . . . 735 Myrtaceae Eucalyptus tereticornis T N . c c . r . r . r . u c . . u u 736 Myrtaceae Eugenia reinwardtiana S N . . . . r . r . . . r r . . . . 737 Myrtaceae Eugenia uniflora S E . u . . r r u r u u r r . . r . 738 Myrtaceae Gossia inophloia S N . . . . . . . . . . r . . . . . 739 Myrtaceae Leptospermum luehmannii T N . . . . . r . . r r . . . . . . 740 Myrtaceae Leptospermum petersonii T N . . . . r . r . r r r r . . . . 741 Myrtaceae Leptospermum scoparium S E . . . . . . . . . . . r . . . . 742 Myrtaceae Leptospermum sp. S N c . . . . . . . . r . . . . . . 743 Myrtaceae Leptospermum trinervium S - c . . . . . . . . . . . . . . . 744 Myrtaceae Lophostemon confertus T N . c c c . r . . . r c c . . . . 745 Myrtaceae Lophostemon grandiflorus T N . . . . . . . . . . . . . . c . 746 Myrtaceae Lophostemon suaveolens T E . c . . . u r . . . . . . . c u 747 Myrtaceae Melaleuca armillaris T N . . . . . . . . r . . . . . . . 748 Myrtaceae Melaleuca bracteata T N . . . . u u r r c u u u . . r . 749 Myrtaceae Melaleuca citrina T N . . . . . . u . . . . . . . . . 750 Myrtaceae Melaleuca fluviatilis T N . . . . . r . r . r . . . . . . 751 Myrtaceae Melaleuca leucadendra T N . . . . r r . u r u . r . . r . 752 Myrtaceae Melaleuca linarifolia T N . . . . . u u . . . u r . . . . 753 Myrtaceae Melaleuca nodosa T - c . . . . . . . . . . . . . . . 754 Myrtaceae Melaleuca quinquenervia T N . . . . . . c c . r . r . . u c 755 Myrtaceae Melaleuca saligna T N . . u . r . r . r u r r . . . . 756 Myrtaceae Melaleuca sp. T N . . . . r . . r . . . . . . r .
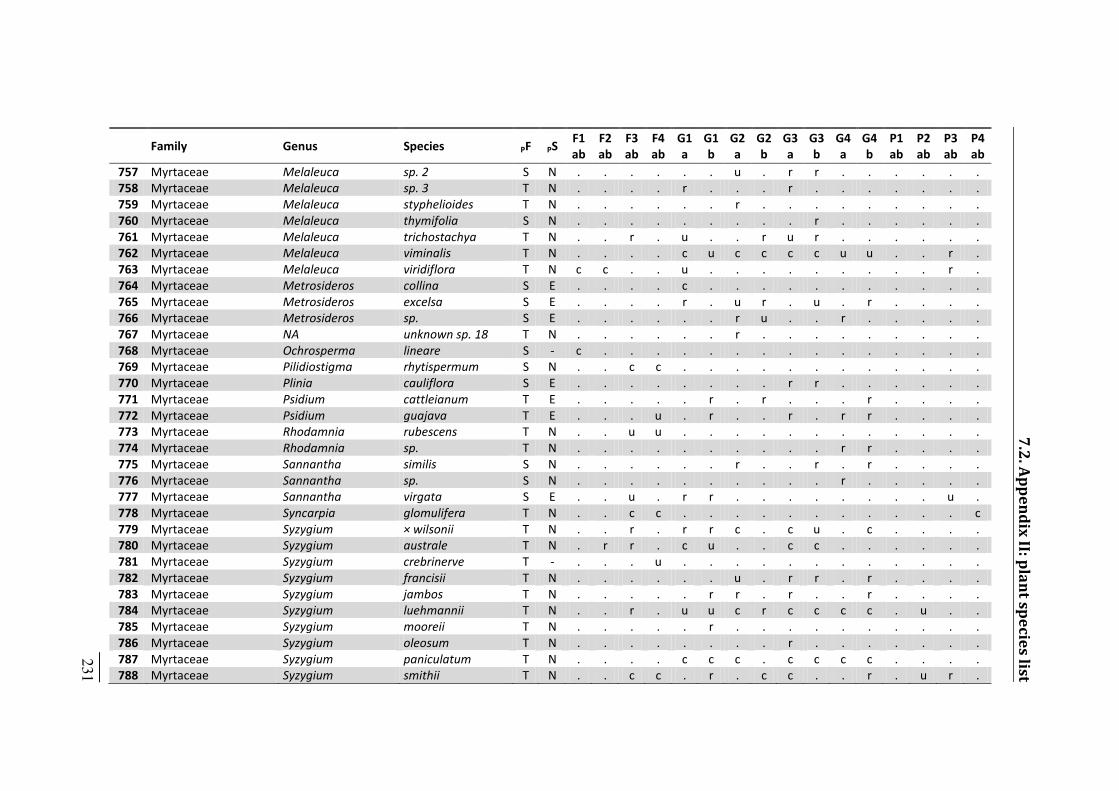
Family Genus Species PF PS F1 ab F2 ab F3 ab F4 ab G1 a G1 b G2 a G2 b G3 a G3 b G4 a G4 b P1 ab P2 ab P3 ab P4 ab 757 Myrtaceae Melaleuca sp. 2 S N . . . . . . u . r r . . . . . . 758 Myrtaceae Melaleuca sp. 3 T N . . . . r . . . r . . . . . . . 759 Myrtaceae Melaleuca styphelioides T N . . . . . . r . . . . . . . . . 760 Myrtaceae Melaleuca thymifolia S N . . . . . . . . . r . . . . . . 761 Myrtaceae Melaleuca trichostachya T N . . r . u . . r u r . . . . . . 762 Myrtaceae Melaleuca viminalis T N . . . . c u c c c c u u . . r . 763 Myrtaceae Melaleuca viridiflora T N c c . . u . . . . . . . . . r . 764 Myrtaceae Metrosideros collina S E . . . . c . . . . . . . . . . . 765 Myrtaceae Metrosideros excelsa S E . . . . r . u r . u . r . . . . 766 Myrtaceae Metrosideros sp. S E . . . . . . r u . . r . . . . . 767 Myrtaceae NA unknown sp. 18 T N . . . . . . r . . . . . . . . . 768 Myrtaceae Ochrosperma lineare S - c . . . . . . . . . . . . . . . 769 Myrtaceae Pilidiostigma rhytispermum S N . . c c . . . . . . . . . . . . 770 Myrtaceae Plinia cauliflora S E . . . . . . . . r r . . . . . . 771 Myrtaceae Psidium cattleianum T E . . . . . r . r . . . r . . . . 772 Myrtaceae Psidium guajava T E . . . u . r . . r . r r . . . . 773 Myrtaceae Rhodamnia rubescens T N . . u u . . . . . . . . . . . . 774 Myrtaceae Rhodamnia sp. T N . . . . . . . . . . r r . . . . 775 Myrtaceae Sannantha similis S N . . . . . . r . . r . r . . . . 776 Myrtaceae Sannantha sp. S N . . . . . . . . . . r . . . . . 777 Myrtaceae Sannantha virgata S E . . u . r r . . . . . . . . u . 778 Myrtaceae Syncarpia glomulifera T N . . c c . . . . . . . . . . . c 779 Myrtaceae Syzygium × wilsonii T N . . r . r r c . c u . c . . . . 780 Myrtaceae Syzygium australe T N . r r . c u . . c c . . . . . . 781 Myrtaceae Syzygium crebrinerve T - . . . u . . . . . . . . . . . . 782 Myrtaceae Syzygium francisii T N . . . . . . u . r r . r . . . . 783 Myrtaceae Syzygium jambos T N . . . . . r r . r . . r . . . . 784 Myrtaceae Syzygium luehmannii T N . . r . u u c r c c c c . u . . 785 Myrtaceae Syzygium mooreii T N . . . . . r . . . . . . . . . . 786 Myrtaceae Syzygium oleosum T N . . . . . . . . r . . . . . . . 787 Myrtaceae Syzygium paniculatum T N . . . . c c c . c c c c . . . . 788 Myrtaceae Syzygium smithii T N . . c c . r . c c . . r . u r . _____ 231
7.2. Appendix II: plant species list
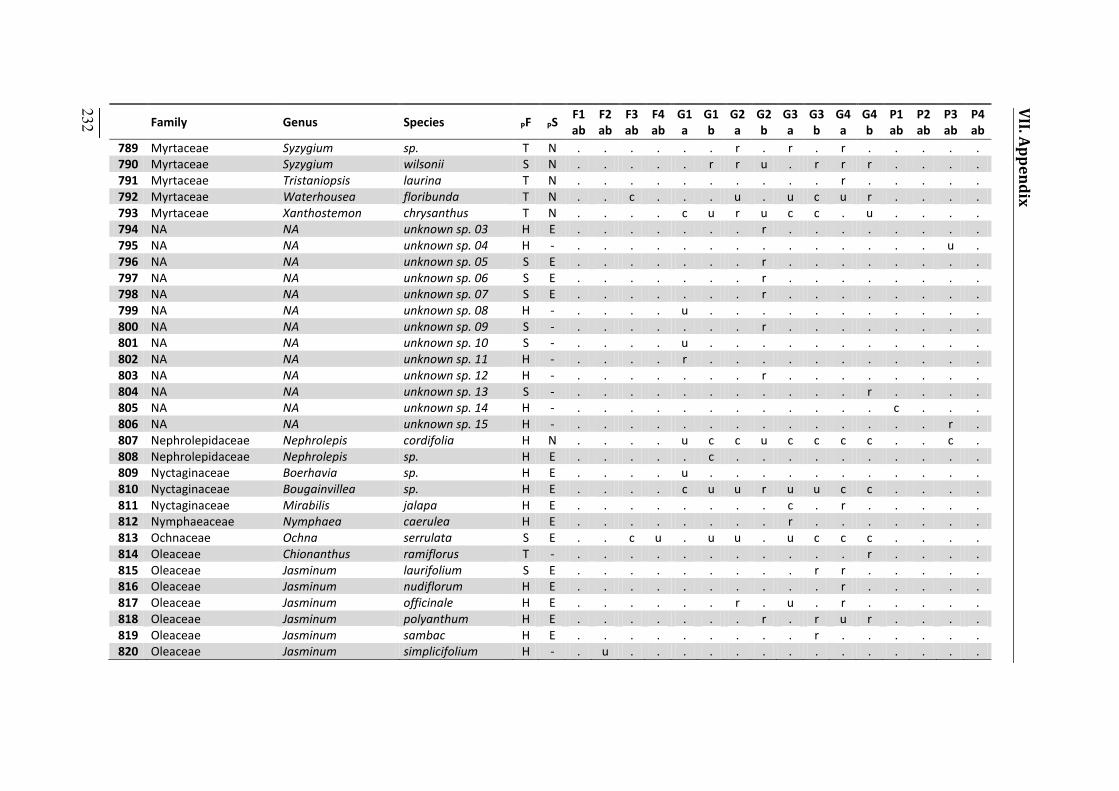
_____ 232
VII. Appendix
Family Genus Species PF PS F1 ab F2 ab F3 ab F4 ab G1 a G1 b G2 a G2 b G3 a G3 b G4 a G4 b P1 ab P2 ab P3 ab P4 ab 789 Myrtaceae Syzygium sp. T N . . . . . . r . r . r . . . . . 790 Myrtaceae Syzygium wilsonii S N . . . . . r r u . r r r . . . . 791 Myrtaceae Tristaniopsis laurina T N . . . . . . . . . . r . . . . . 792 Myrtaceae Waterhousea floribunda T N . . c . . . u . u c u r . . . . 793 Myrtaceae Xanthostemon chrysanthus T N . . . . c u r u c c . u . . . . 794 NA NA unknown sp. 03 H E . . . . . . . r . . . . . . . . 795 NA NA unknown sp. 04 H - . . . . . . . . . . . . . . u . 796 NA NA unknown sp. 05 S E . . . . . . . r . . . . . . . . 797 NA NA unknown sp. 06 S E . . . . . . . r . . . . . . . . 798 NA NA unknown sp. 07 S E . . . . . . . r . . . . . . . . 799 NA NA unknown sp. 08 H - . . . . u . . . . . . . . . . . 800 NA NA unknown sp. 09 S - . . . . . . . r . . . . . . . . 801 NA NA unknown sp. 10 S - . . . . u . . . . . . . . . . . 802 NA NA unknown sp. 11 H - . . . . r . . . . . . . . . . . 803 NA NA unknown sp. 12 H - . . . . . . . r . . . . . . . . 804 NA NA unknown sp. 13 S - . . . . . . . . . . . r . . . . 805 NA NA unknown sp. 14 H - . . . . . . . . . . . . c . . . 806 NA NA unknown sp. 15 H - . . . . . . . . . . . . . . r . 807 Nephrolepidaceae Nephrolepis cordifolia H N . . . . u c c u c c c c . . c . 808 Nephrolepidaceae Nephrolepis sp. H E . . . . . c . . . . . . . . . . 809 Nyctaginaceae Boerhavia sp. H E . . . . u . . . . . . . . . . . 810 Nyctaginaceae Bougainvillea sp. H E . . . . c u u r u u c c . . . . 811 Nyctaginaceae Mirabilis jalapa H E . . . . . . . . c . r . . . . . 812 Nymphaeaceae Nymphaea caerulea H E . . . . . . . . r . . . . . . . 813 Ochnaceae Ochna serrulata S E . . c u . u u . u c c c . . . . 814 Oleaceae Chionanthus ramiflorus T - . . . . . . . . . . . r . . . . 815 Oleaceae Jasminum laurifolium S E . . . . . . . . . r r . . . . . 816 Oleaceae Jasminum nudiflorum H E . . . . . . . . . . r . . . . . 817 Oleaceae Jasminum officinale H E . . . . . . r . u . r . . . . . 818 Oleaceae Jasminum polyanthum H E . . . . . . . r . r u r . . . . 819 Oleaceae Jasminum sambac H E . . . . . . . . . r . . . . . . 820 Oleaceae Jasminum simplicifolium H - . u . . . . . . . . . . . . . .
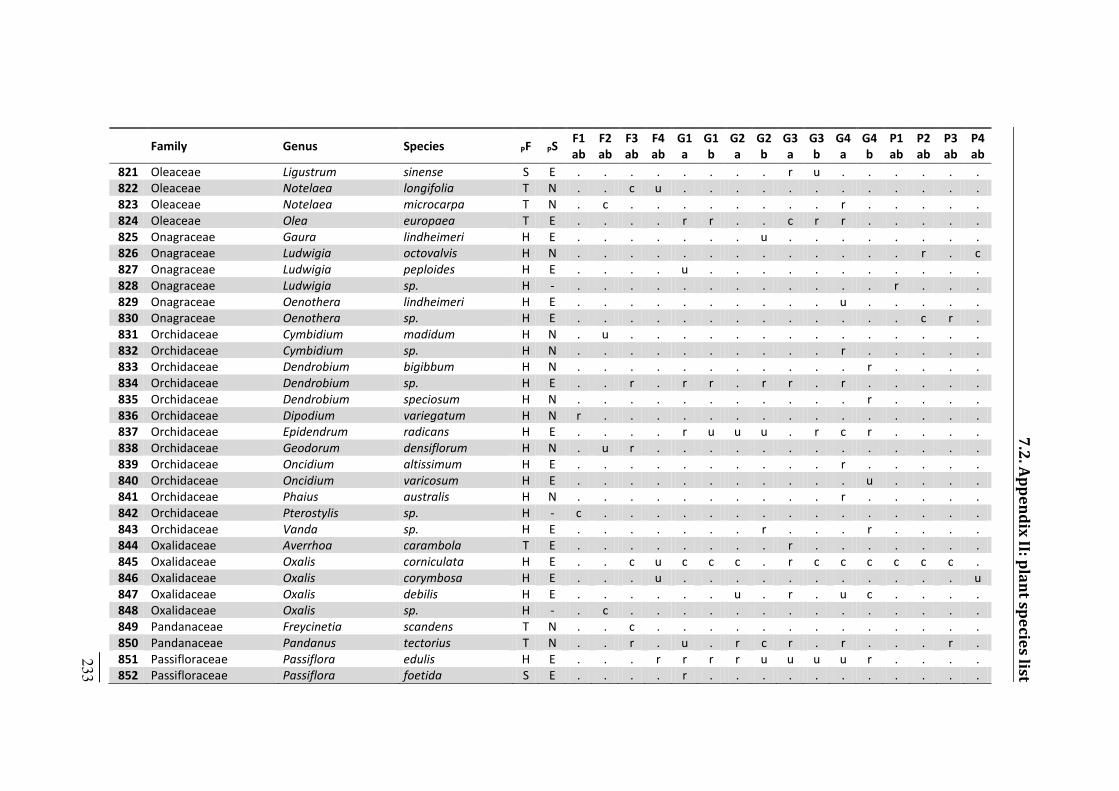
Family Genus Species PF PS F1 ab F2 ab F3 ab F4 ab G1 a G1 b G2 a G2 b G3 a G3 b G4 a G4 b P1 ab P2 ab P3 ab P4 ab 821 Oleaceae Ligustrum sinense S E . . . . . . . . r u . . . . . . 822 Oleaceae Notelaea longifolia T N . . c u . . . . . . . . . . . . 823 Oleaceae Notelaea microcarpa T N . c . . . . . . . . r . . . . . 824 Oleaceae Olea europaea T E . . . . r r . . c r r . . . . . 825 Onagraceae Gaura lindheimeri H E . . . . . . . u . . . . . . . . 826 Onagraceae Ludwigia octovalvis H N . . . . . . . . . . . . . r . c 827 Onagraceae Ludwigia peploides H E . . . . u . . . . . . . . . . . 828 Onagraceae Ludwigia sp. H - . . . . . . . . . . . . r . . . 829 Onagraceae Oenothera lindheimeri H E . . . . . . . . . . u . . . . . 830 Onagraceae Oenothera sp. H E . . . . . . . . . . . . . c r . 831 Orchidaceae Cymbidium madidum H N . u . . . . . . . . . . . . . . 832 Orchidaceae Cymbidium sp. H N . . . . . . . . . . r . . . . . 833 Orchidaceae Dendrobium bigibbum H N . . . . . . . . . . . r . . . . 834 Orchidaceae Dendrobium sp. H E . . r . r r . r r . r . . . . . 835 Orchidaceae Dendrobium speciosum H N . . . . . . . . . . . r . . . . 836 Orchidaceae Dipodium variegatum H N r . . . . . . . . . . . . . . . 837 Orchidaceae Epidendrum radicans H E . . . . r u u u . r c r . . . . 838 Orchidaceae Geodorum densiflorum H N . u r . . . . . . . . . . . . . 839 Orchidaceae Oncidium altissimum H E . . . . . . . . . . r . . . . . 840 Orchidaceae Oncidium varicosum H E . . . . . . . . . . . u . . . . 841 Orchidaceae Phaius australis H N . . . . . . . . . . r . . . . . 842 Orchidaceae Pterostylis sp. H - c . . . . . . . . . . . . . . . 843 Orchidaceae Vanda sp. H E . . . . . . . r . . . r . . . . 844 Oxalidaceae Averrhoa carambola T E . . . . . . . . r . . . . . . . 845 Oxalidaceae Oxalis corniculata H E . . c u c c c . r c c c c c c . 846 Oxalidaceae Oxalis corymbosa H E . . . u . . . . . . . . . . . u 847 Oxalidaceae Oxalis debilis H E . . . . . . u . r . u c . . . . 848 Oxalidaceae Oxalis sp. H - . c . . . . . . . . . . . . . . 849 Pandanaceae Freycinetia scandens T N . . c . . . . . . . . . . . . . 850 Pandanaceae Pandanus tectorius T N . . r . u . r c r . r . . . r . 851 Passifloraceae Passiflora edulis H E . . . r r r r u u u u r . . . . 852 Passifloraceae Passiflora foetida S E . . . . r . . . . . . . . . . . _____ 233
7.2. Appendix II: plant species list
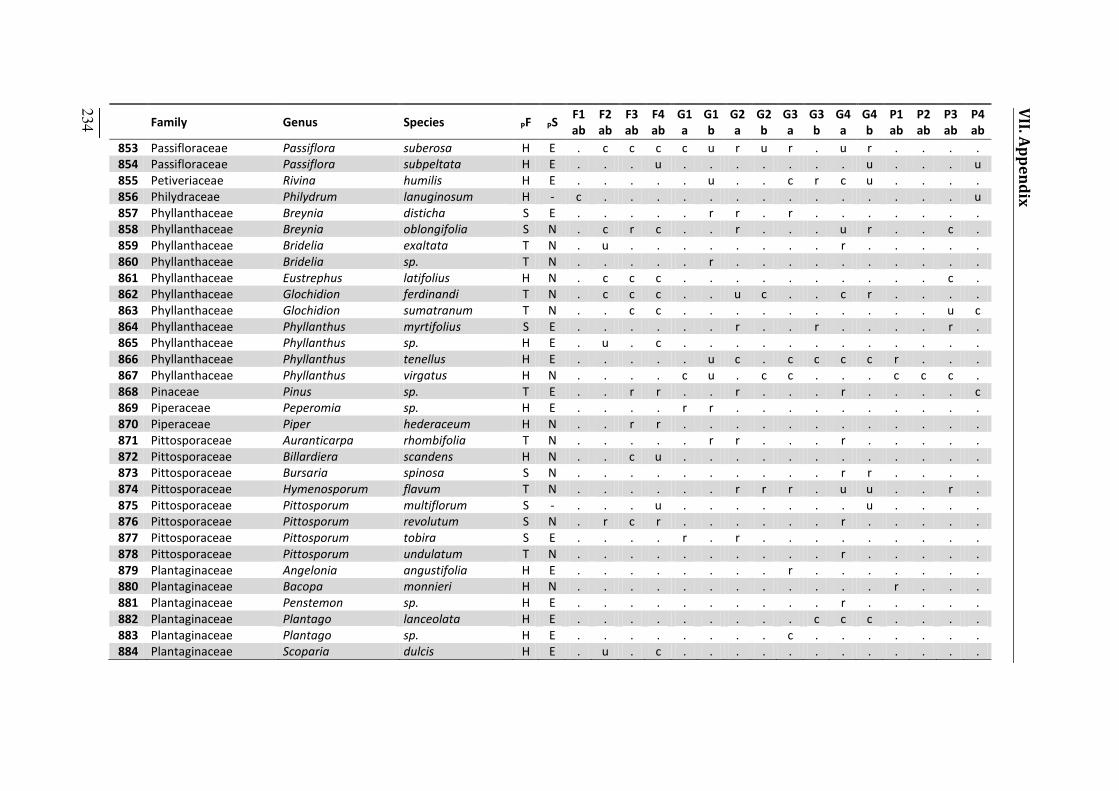
_____ 234
VII. Appendix
Family Genus Species PF PS F1 ab F2 ab F3 ab F4 ab G1 a G1 b G2 a G2 b G3 a G3 b G4 a G4 b P1 ab P2 ab P3 ab P4 ab 853 Passifloraceae Passiflora suberosa H E . c c c c u r u r . u r . . . . 854 Passifloraceae Passiflora subpeltata H E . . . u . . . . . . . u . . . u 855 Petiveriaceae Rivina humilis H E . . . . . u . . c r c u . . . . 856 Philydraceae Philydrum lanuginosum H - c . . . . . . . . . . . . . . u 857 Phyllanthaceae Breynia disticha S E . . . . . r r . r . . . . . . . 858 Phyllanthaceae Breynia oblongifolia S N . c r c . . r . . . u r . . c . 859 Phyllanthaceae Bridelia exaltata T N . u . . . . . . . . r . . . . . 860 Phyllanthaceae Bridelia sp. T N . . . . . r . . . . . . . . . . 861 Phyllanthaceae Eustrephus latifolius H N . c c c . . . . . . . . . . c . 862 Phyllanthaceae Glochidion ferdinandi T N . c c c . . u c . . c r . . . . 863 Phyllanthaceae Glochidion sumatranum T N . . c c . . . . . . . . . . u c 864 Phyllanthaceae Phyllanthus myrtifolius S E . . . . . . r . . r . . . . r . 865 Phyllanthaceae Phyllanthus sp. H E . u . c . . . . . . . . . . . . 866 Phyllanthaceae Phyllanthus tenellus H E . . . . . u c . c c c c r . . . 867 Phyllanthaceae Phyllanthus virgatus H N . . . . c u . c c . . . c c c . 868 Pinaceae Pinus sp. T E . . r r . . r . . . r . . . . c 869 Piperaceae Peperomia sp. H E . . . . r r . . . . . . . . . . 870 Piperaceae Piper hederaceum H N . . r r . . . . . . . . . . . . 871 Pittosporaceae Auranticarpa rhombifolia T N . . . . . r r . . . r . . . . . 872 Pittosporaceae Billardiera scandens H N . . c u . . . . . . . . . . . . 873 Pittosporaceae Bursaria spinosa S N . . . . . . . . . . r r . . . . 874 Pittosporaceae Hymenosporum flavum T N . . . . . . r r r . u u . . r . 875 Pittosporaceae Pittosporum multiflorum S - . . . u . . . . . . . u . . . . 876 Pittosporaceae Pittosporum revolutum S N . r c r . . . . . . r . . . . . 877 Pittosporaceae Pittosporum tobira S E . . . . r . r . . . . . . . . . 878 Pittosporaceae Pittosporum undulatum T N . . . . . . . . . . r . . . . . 879 Plantaginaceae Angelonia angustifolia H E . . . . . . . . r . . . . . . . 880 Plantaginaceae Bacopa monnieri H N . . . . . . . . . . . . r . . . 881 Plantaginaceae Penstemon sp. H E . . . . . . . . . . r . . . . . 882 Plantaginaceae Plantago lanceolata H E . . . . . . . . . c c c . . . . 883 Plantaginaceae Plantago sp. H E . . . . . . . . c . . . . . . . 884 Plantaginaceae Scoparia dulcis H E . u . c . . . . . . . . . . . .
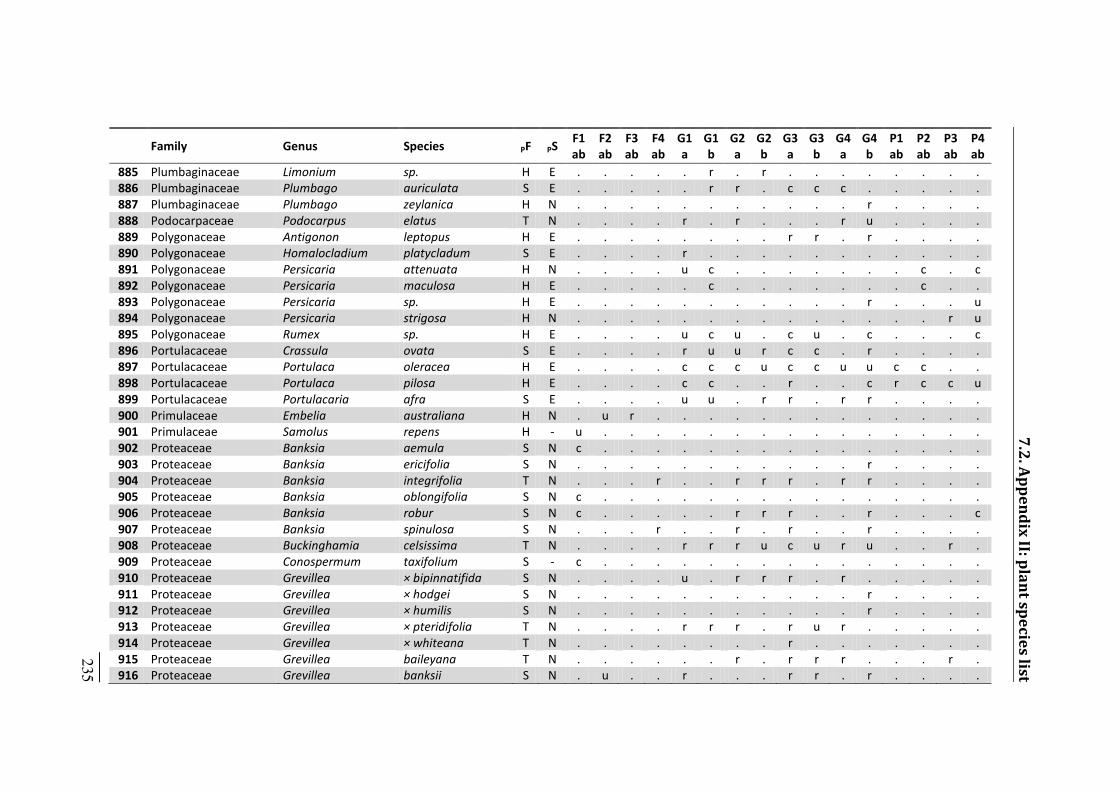
Family Genus Species PF PS F1 ab F2 ab F3 ab F4 ab G1 a G1 b G2 a G2 b G3 a G3 b G4 a G4 b P1 ab P2 ab P3 ab P4 ab 885 Plumbaginaceae Limonium sp. H E . . . . . r . r . . . . . . . . 886 Plumbaginaceae Plumbago auriculata S E . . . . . r r . c c c . . . . . 887 Plumbaginaceae Plumbago zeylanica H N . . . . . . . . . . . r . . . . 888 Podocarpaceae Podocarpus elatus T N . . . . r . r . . . r u . . . . 889 Polygonaceae Antigonon leptopus H E . . . . . . . . r r . r . . . . 890 Polygonaceae Homalocladium platycladum S E . . . . r . . . . . . . . . . . 891 Polygonaceae Persicaria attenuata H N . . . . u c . . . . . . . c . c 892 Polygonaceae Persicaria maculosa H E . . . . . c . . . . . . . c . . 893 Polygonaceae Persicaria sp. H E . . . . . . . . . . . r . . . u 894 Polygonaceae Persicaria strigosa H N . . . . . . . . . . . . . . r u 895 Polygonaceae Rumex sp. H E . . . . u c u . c u . c . . . c 896 Portulacaceae Crassula ovata S E . . . . r u u r c c . r . . . . 897 Portulacaceae Portulaca oleracea H E . . . . c c c u c c u u c c . . 898 Portulacaceae Portulaca pilosa H E . . . . c c . . r . . c r c c u 899 Portulacaceae Portulacaria afra S E . . . . u u . r r . r r . . . . 900 Primulaceae Embelia australiana H N . u r . . . . . . . . . . . . . 901 Primulaceae Samolus repens H - u . . . . . . . . . . . . . . . 902 Proteaceae Banksia aemula S N c . . . . . . . . . . . . . . . 903 Proteaceae Banksia ericifolia S N . . . . . . . . . . . r . . . . 904 Proteaceae Banksia integrifolia T N . . . r . . r r r . r r . . . . 905 Proteaceae Banksia oblongifolia S N c . . . . . . . . . . . . . . . 906 Proteaceae Banksia robur S N c . . . . . r r r . . r . . . c 907 Proteaceae Banksia spinulosa S N . . . r . . r . r . . r . . . . 908 Proteaceae Buckinghamia celsissima T N . . . . r r r u c u r u . . r . 909 Proteaceae Conospermum taxifolium S - c . . . . . . . . . . . . . . . 910 Proteaceae Grevillea × bipinnatifida S N . . . . u . r r r . r . . . . . 911 Proteaceae Grevillea × hodgei S N . . . . . . . . . . . r . . . . 912 Proteaceae Grevillea × humilis S N . . . . . . . . . . . r . . . . 913 Proteaceae Grevillea × pteridifolia T N . . . . r r r . r u r . . . . . 914 Proteaceae Grevillea × whiteana T N . . . . . . . . r . . . . . . . 915 Proteaceae Grevillea baileyana T N . . . . . . r . r r r . . . r . 916 Proteaceae Grevillea banksii S N . u . . r . . . r r . r . . . . _____ 235
7.2. Appendix II: plant species list
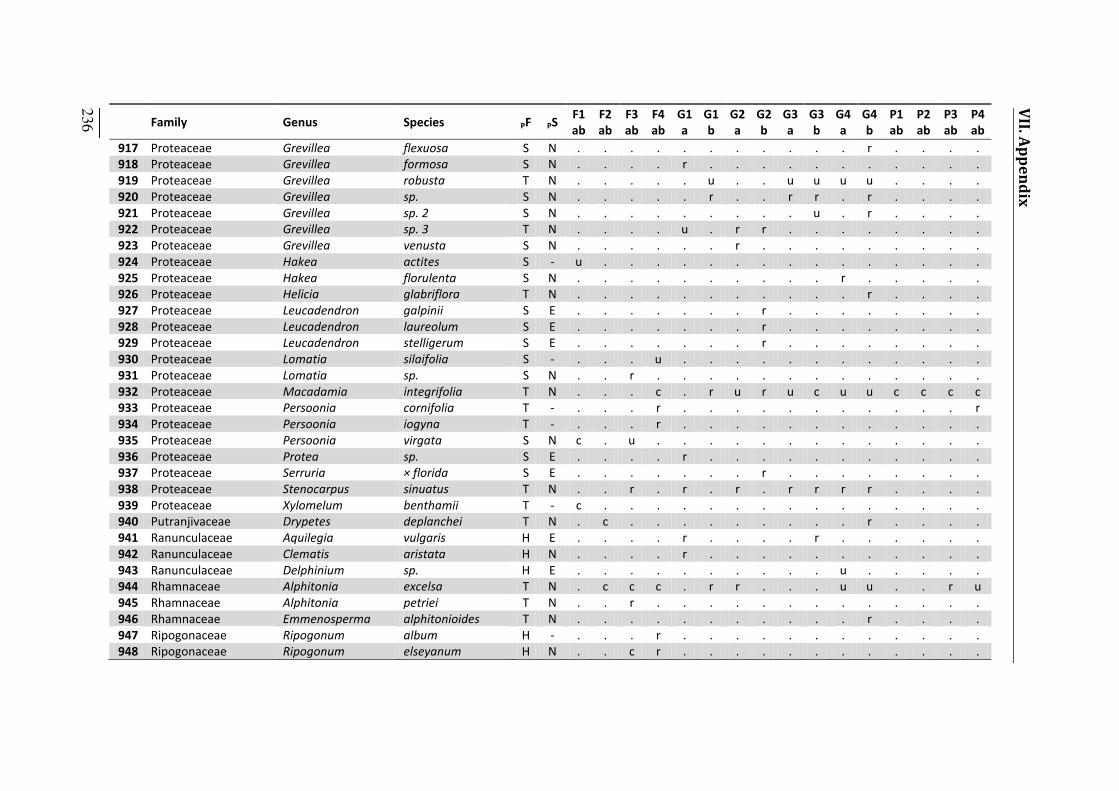
_____ 236
VII. Appendix
Family Genus Species PF PS F1 ab F2 ab F3 ab F4 ab G1 a G1 b G2 a G2 b G3 a G3 b G4 a G4 b P1 ab P2 ab P3 ab P4 ab 917 Proteaceae Grevillea flexuosa S N . . . . . . . . . . . r . . . . 918 Proteaceae Grevillea formosa S N . . . . r . . . . . . . . . . . 919 Proteaceae Grevillea robusta T N . . . . . u . . u u u u . . . . 920 Proteaceae Grevillea sp. S N . . . . . r . . r r . r . . . . 921 Proteaceae Grevillea sp. 2 S N . . . . . . . . . u . r . . . . 922 Proteaceae Grevillea sp. 3 T N . . . . u . r r . . . . . . . . 923 Proteaceae Grevillea venusta S N . . . . . . r . . . . . . . . . 924 Proteaceae Hakea actites S - u . . . . . . . . . . . . . . . 925 Proteaceae Hakea florulenta S N . . . . . . . . . . r . . . . . 926 Proteaceae Helicia glabriflora T N . . . . . . . . . . . r . . . . 927 Proteaceae Leucadendron galpinii S E . . . . . . . r . . . . . . . . 928 Proteaceae Leucadendron laureolum S E . . . . . . . r . . . . . . . . 929 Proteaceae Leucadendron stelligerum S E . . . . . . . r . . . . . . . . 930 Proteaceae Lomatia silaifolia S - . . . u . . . . . . . . . . . . 931 Proteaceae Lomatia sp. S N . . r . . . . . . . . . . . . . 932 Proteaceae Macadamia integrifolia T N . . . c . r u r u c u u c c c c 933 Proteaceae Persoonia cornifolia T - . . . r . . . . . . . . . . . r 934 Proteaceae Persoonia iogyna T - . . . r . . . . . . . . . . . . 935 Proteaceae Persoonia virgata S N c . u . . . . . . . . . . . . . 936 Proteaceae Protea sp. S E . . . . r . . . . . . . . . . . 937 Proteaceae Serruria × florida S E . . . . . . . r . . . . . . . . 938 Proteaceae Stenocarpus sinuatus T N . . r . r . r . r r r r . . . . 939 Proteaceae Xylomelum benthamii T - c . . . . . . . . . . . . . . . 940 Putranjivaceae Drypetes deplanchei T N . c . . . . . . . . . r . . . . 941 Ranunculaceae Aquilegia vulgaris H E . . . . r . . . . r . . . . . . 942 Ranunculaceae Clematis aristata H N . . . . r . . . . . . . . . . . 943 Ranunculaceae Delphinium sp. H E . . . . . . . . . . u . . . . . 944 Rhamnaceae Alphitonia excelsa T N . c c c . r r . . . u u . . r u 945 Rhamnaceae Alphitonia petriei T N . . r . . . . . . . . . . . . . 946 Rhamnaceae Emmenosperma alphitonioides T N . . . . . . . . . . . r . . . . 947 Ripogonaceae Ripogonum album H - . . . r . . . . . . . . . . . . 948 Ripogonaceae Ripogonum elseyanum H N . . c r . . . . . . . . . . . .
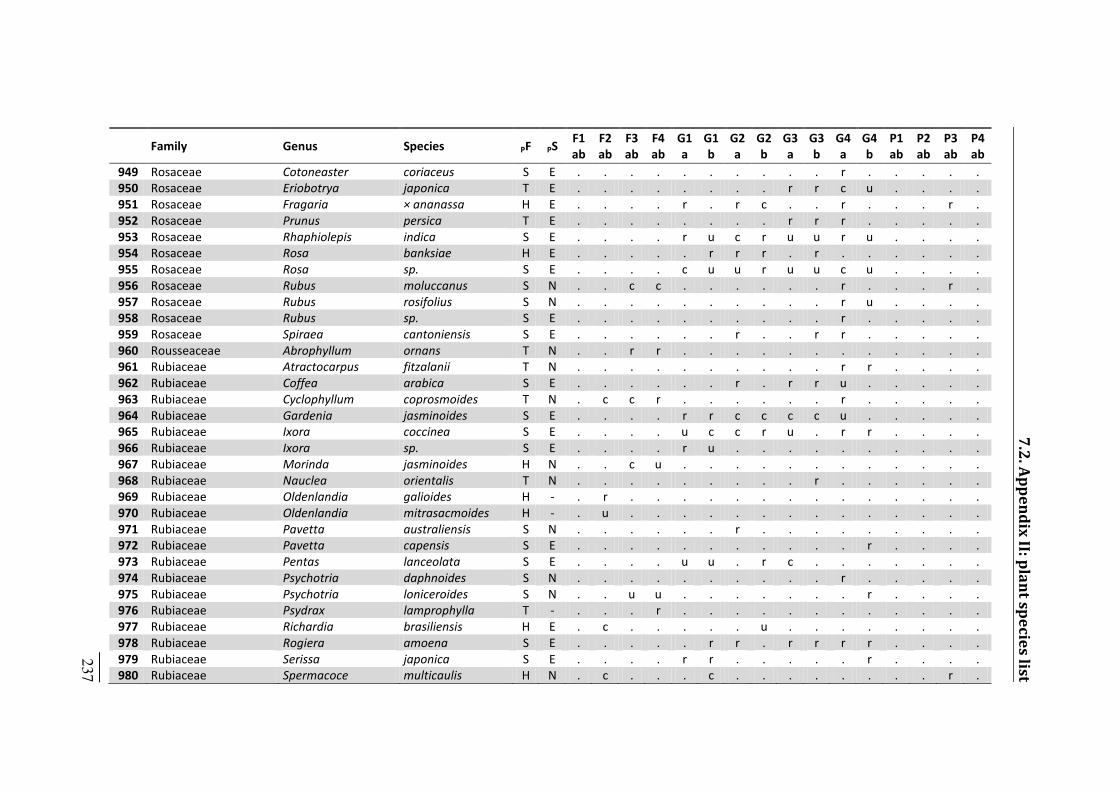
Family Genus Species PF PS F1 ab F2 ab F3 ab F4 ab G1 a G1 b G2 a G2 b G3 a G3 b G4 a G4 b P1 ab P2 ab P3 ab P4 ab 949 Rosaceae Cotoneaster coriaceus S E . . . . . . . . . . r . . . . . 950 Rosaceae Eriobotrya japonica T E . . . . . . . . r r c u . . . . 951 Rosaceae Fragaria × ananassa H E . . . . r . r c . . r . . . r . 952 Rosaceae Prunus persica T E . . . . . . . . r r r . . . . . 953 Rosaceae Rhaphiolepis indica S E . . . . r u c r u u r u . . . . 954 Rosaceae Rosa banksiae H E . . . . . r r r . r . . . . . . 955 Rosaceae Rosa sp. S E . . . . c u u r u u c u . . . . 956 Rosaceae Rubus moluccanus S N . . c c . . . . . . r . . . r . 957 Rosaceae Rubus rosifolius S N . . . . . . . . . . r u . . . . 958 Rosaceae Rubus sp. S E . . . . . . . . . . r . . . . . 959 Rosaceae Spiraea cantoniensis S E . . . . . . r . . r r . . . . . 960 Rousseaceae Abrophyllum ornans T N . . r r . . . . . . . . . . . . 961 Rubiaceae Atractocarpus fitzalanii T N . . . . . . . . . . r r . . . . 962 Rubiaceae Coffea arabica S E . . . . . . r . r r u . . . . . 963 Rubiaceae Cyclophyllum coprosmoides T N . c c r . . . . . . r . . . . . 964 Rubiaceae Gardenia jasminoides S E . . . . r r c c c c u . . . . . 965 Rubiaceae Ixora coccinea S E . . . . u c c r u . r r . . . . 966 Rubiaceae Ixora sp. S E . . . . r u . . . . . . . . . . 967 Rubiaceae Morinda jasminoides H N . . c u . . . . . . . . . . . . 968 Rubiaceae Nauclea orientalis T N . . . . . . . . . r . . . . . . 969 Rubiaceae Oldenlandia galioides H - . r . . . . . . . . . . . . . . 970 Rubiaceae Oldenlandia mitrasacmoides H - . u . . . . . . . . . . . . . . 971 Rubiaceae Pavetta australiensis S N . . . . . . r . . . . . . . . . 972 Rubiaceae Pavetta capensis S E . . . . . . . . . . . r . . . . 973 Rubiaceae Pentas lanceolata S E . . . . u u . r c . . . . . . . 974 Rubiaceae Psychotria daphnoides S N . . . . . . . . . . r . . . . . 975 Rubiaceae Psychotria loniceroides S N . . u u . . . . . . . r . . . . 976 Rubiaceae Psydrax lamprophylla T - . . . r . . . . . . . . . . . . 977 Rubiaceae Richardia brasiliensis H E . c . . . . . u . . . . . . . . 978 Rubiaceae Rogiera amoena S E . . . . . r r . r r r r . . . . 979 Rubiaceae Serissa japonica S E . . . . r r . . . . . r . . . . 980 Rubiaceae Spermacoce multicaulis H N . c . . . c . . . . . . . . r . _____ 237
7.2. Appendix II: plant species list
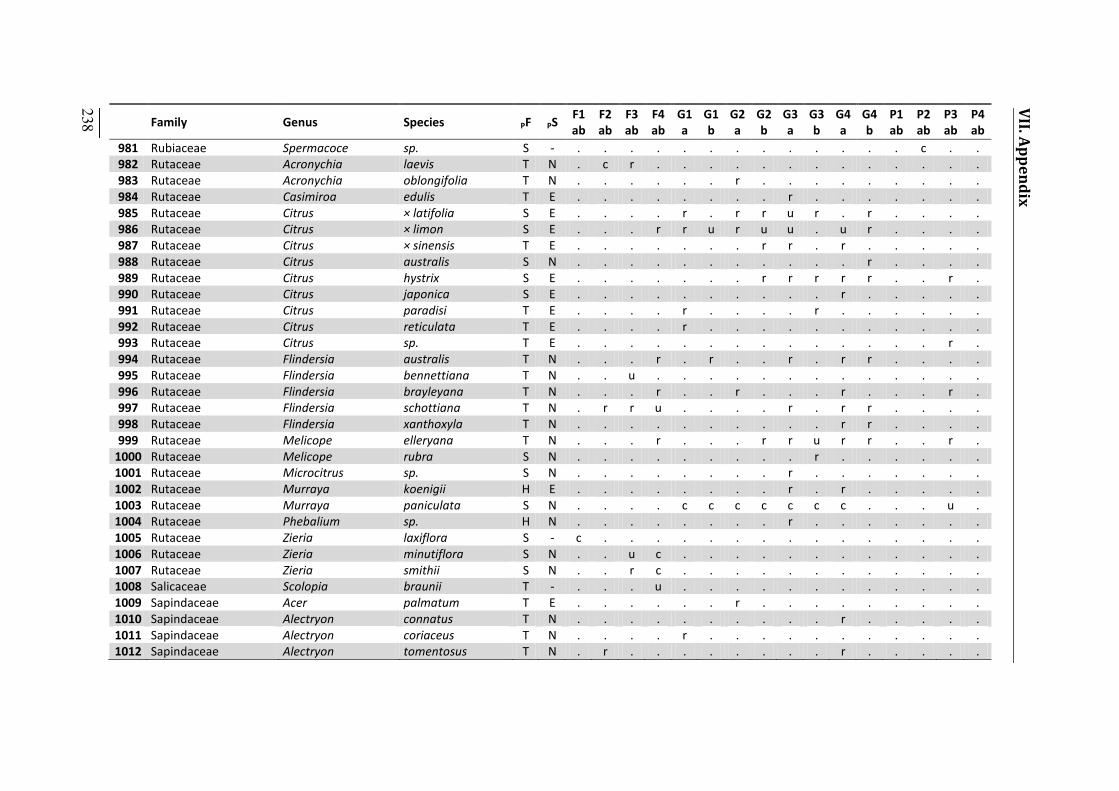
_____ 238
VII. Appendix
Family Genus Species PF PS F1 ab F2 ab F3 ab F4 ab G1 a G1 b G2 a G2 b G3 a G3 b G4 a G4 b P1 ab P2 ab P3 ab P4 ab 981 Rubiaceae Spermacoce sp. S - . . . . . . . . . . . . . c . . 982 Rutaceae Acronychia laevis T N . c r . . . . . . . . . . . . . 983 Rutaceae Acronychia oblongifolia T N . . . . . . r . . . . . . . . . 984 Rutaceae Casimiroa edulis T E . . . . . . . . r . . . . . . . 985 Rutaceae Citrus × latifolia S E . . . . r . r r u r . r . . . . 986 Rutaceae Citrus × limon S E . . . r r u r u u . u r . . . . 987 Rutaceae Citrus × sinensis T E . . . . . . . r r . r . . . . . 988 Rutaceae Citrus australis S N . . . . . . . . . . . r . . . . 989 Rutaceae Citrus hystrix S E . . . . . . . r r r r r . . r . 990 Rutaceae Citrus japonica S E . . . . . . . . . . r . . . . . 991 Rutaceae Citrus paradisi T E . . . . r . . . . r . . . . . . 992 Rutaceae Citrus reticulata T E . . . . r . . . . . . . . . . . 993 Rutaceae Citrus sp. T E . . . . . . . . . . . . . . r . 994 Rutaceae Flindersia australis T N . . . r . r . . r . r r . . . . 995 Rutaceae Flindersia bennettiana T N . . u . . . . . . . . . . . . . 996 Rutaceae Flindersia brayleyana T N . . . r . . r . . . r . . . r . 997 Rutaceae Flindersia schottiana T N . r r u . . . . r . r r . . . . 998 Rutaceae Flindersia xanthoxyla T N . . . . . . . . . . r r . . . . 999 Rutaceae Melicope elleryana T N . . . r . . . r r u r r . . r . 1000 Rutaceae Melicope rubra S N . . . . . . . . . r . . . . . . 1001 Rutaceae Microcitrus sp. S N . . . . . . . . r . . . . . . . 1002 Rutaceae Murraya koenigii H E . . . . . . . . r . r . . . . . 1003 Rutaceae Murraya paniculata S N . . . . c c c c c c c . . . u . 1004 Rutaceae Phebalium sp. H N . . . . . . . . r . . . . . . . 1005 Rutaceae Zieria laxiflora S - c . . . . . . . . . . . . . . . 1006 Rutaceae Zieria minutiflora S N . . u c . . . . . . . . . . . . 1007 Rutaceae Zieria smithii S N . . r c . . . . . . . . . . . . 1008 Salicaceae Scolopia braunii T - . . . u . . . . . . . . . . . . 1009 Sapindaceae Acer palmatum T E . . . . . . r . . . . . . . . . 1010 Sapindaceae Alectryon connatus T N . . . . . . . . . . r . . . . . 1011 Sapindaceae Alectryon coriaceus T N . . . . r . . . . . . . . . . . 1012 Sapindaceae Alectryon tomentosus T N . r . . . . . . . . r . . . . .
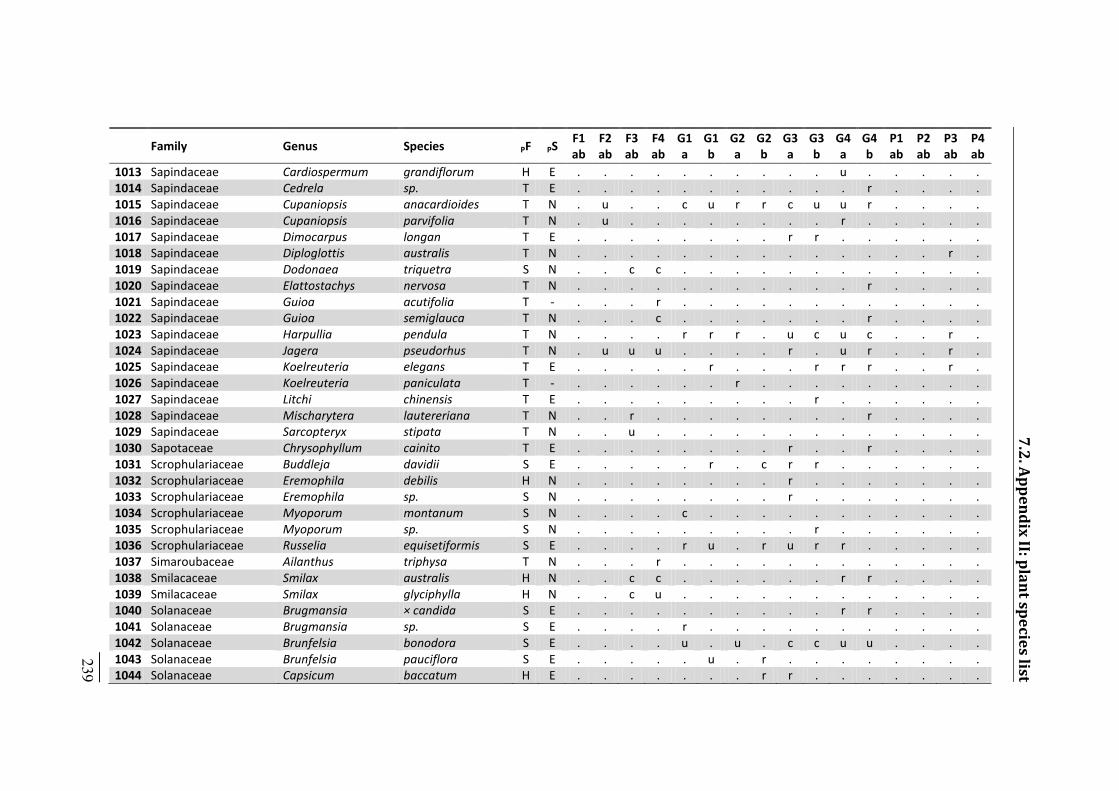
Family Genus Species PF PS F1 ab F2 ab F3 ab F4 ab G1 a G1 b G2 a G2 b G3 a G3 b G4 a G4 b P1 ab P2 ab P3 ab P4 ab 1013 Sapindaceae Cardiospermum grandiflorum H E . . . . . . . . . . u . . . . . 1014 Sapindaceae Cedrela sp. T E . . . . . . . . . . . r . . . . 1015 Sapindaceae Cupaniopsis anacardioides T N . u . . c u r r c u u r . . . . 1016 Sapindaceae Cupaniopsis parvifolia T N . u . . . . . . . . r . . . . . 1017 Sapindaceae Dimocarpus longan T E . . . . . . . . r r . . . . . . 1018 Sapindaceae Diploglottis australis T N . . . . . . . . . . . . . . r . 1019 Sapindaceae Dodonaea triquetra S N . . c c . . . . . . . . . . . . 1020 Sapindaceae Elattostachys nervosa T N . . . . . . . . . . . r . . . . 1021 Sapindaceae Guioa acutifolia T - . . . r . . . . . . . . . . . . 1022 Sapindaceae Guioa semiglauca T N . . . c . . . . . . . r . . . . 1023 Sapindaceae Harpullia pendula T N . . . . r r r . u c u c . . r . 1024 Sapindaceae Jagera pseudorhus T N . u u u . . . . r . u r . . r . 1025 Sapindaceae Koelreuteria elegans T E . . . . . r . . . r r r . . r . 1026 Sapindaceae Koelreuteria paniculata T - . . . . . . r . . . . . . . . . 1027 Sapindaceae Litchi chinensis T E . . . . . . . . . r . . . . . . 1028 Sapindaceae Mischarytera lautereriana T N . . r . . . . . . . . r . . . . 1029 Sapindaceae Sarcopteryx stipata T N . . u . . . . . . . . . . . . . 1030 Sapotaceae Chrysophyllum cainito T E . . . . . . . . r . . r . . . . 1031 Scrophulariaceae Buddleja davidii S E . . . . . r . c r r . . . . . . 1032 Scrophulariaceae Eremophila debilis H N . . . . . . . . r . . . . . . . 1033 Scrophulariaceae Eremophila sp. S N . . . . . . . . r . . . . . . . 1034 Scrophulariaceae Myoporum montanum S N . . . . c . . . . . . . . . . . 1035 Scrophulariaceae Myoporum sp. S N . . . . . . . . . r . . . . . . 1036 Scrophulariaceae Russelia equisetiformis S E . . . . r u . r u r r . . . . . 1037 Simaroubaceae Ailanthus triphysa T N . . . r . . . . . . . . . . . . 1038 Smilacaceae Smilax australis H N . . c c . . . . . . r r . . . . 1039 Smilacaceae Smilax glyciphylla H N . . c u . . . . . . . . . . . . 1040 Solanaceae Brugmansia × candida S E . . . . . . . . . . r r . . . . 1041 Solanaceae Brugmansia sp. S E . . . . r . . . . . . . . . . . 1042 Solanaceae Brunfelsia bonodora S E . . . . u . u . c c u u . . . . 1043 Solanaceae Brunfelsia pauciflora S E . . . . . u . r . . . . . . . . 1044 Solanaceae Capsicum baccatum H E . . . . . . . r r . . . . . . . _____ 239
7.2. Appendix II: plant species list
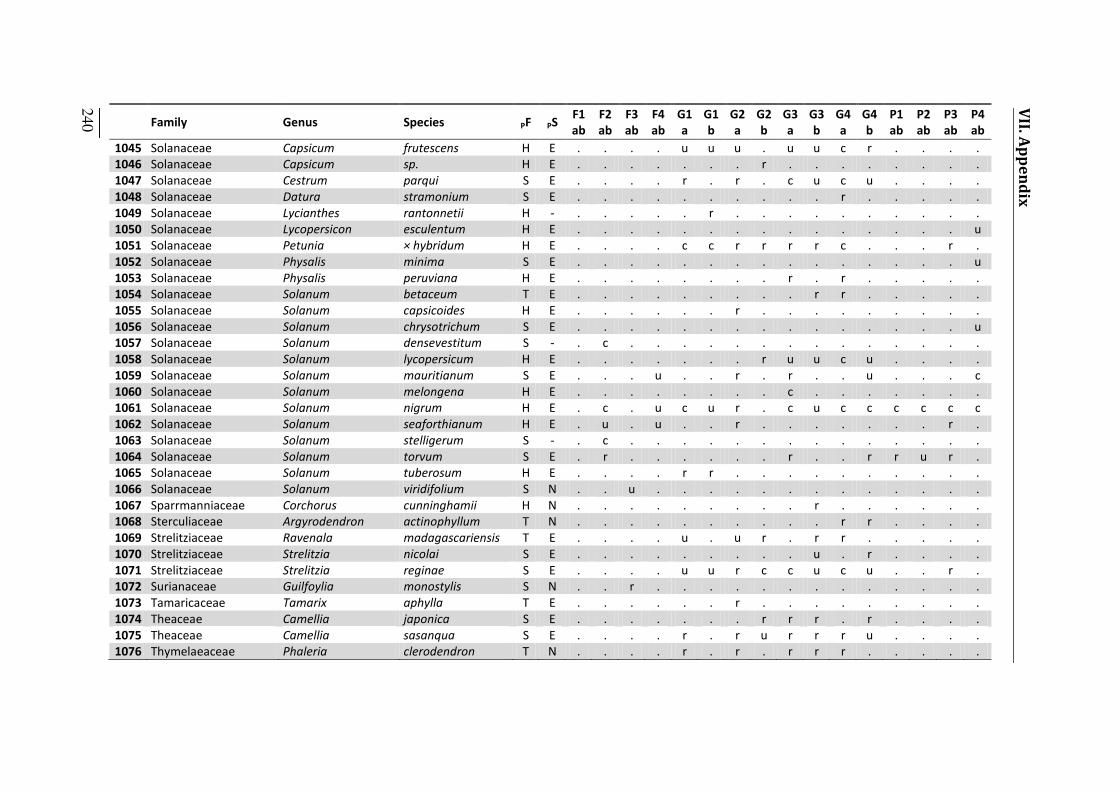
VII. Appendix
_____ 240 Family Genus Species PF PS F1 ab F2 ab F3 ab F4 ab G1 a G1 b G2 a G2 b G3 a G3 b G4 a G4 b P1 ab P2 ab P3 ab P4 ab 1045 Solanaceae Capsicum frutescens H E . . . . u u u . u u c r . . . . 1046 Solanaceae Capsicum sp. H E . . . . . . . r . . . . . . . . 1047 Solanaceae Cestrum parqui S E . . . . r . r . c u c u . . . . 1048 Solanaceae Datura stramonium S E . . . . . . . . . . r . . . . . 1049 Solanaceae Lycianthes rantonnetii H - . . . . . r . . . . . . . . . . 1050 Solanaceae Lycopersicon esculentum H E . . . . . . . . . . . . . . . u 1051 Solanaceae Petunia × hybridum H E . . . . c c r r r r c . . . r . 1052 Solanaceae Physalis minima S E . . . . . . . . . . . . . . . u 1053 Solanaceae Physalis peruviana H E . . . . . . . . r . r . . . . . 1054 Solanaceae Solanum betaceum T E . . . . . . . . . r r . . . . . 1055 Solanaceae Solanum capsicoides H E . . . . . . r . . . . . . . . . 1056 Solanaceae Solanum chrysotrichum S E . . . . . . . . . . . . . . . u 1057 Solanaceae Solanum densevestitum S - . c . . . . . . . . . . . . . . 1058 Solanaceae Solanum lycopersicum H E . . . . . . . r u u c u . . . . 1059 Solanaceae Solanum mauritianum S E . . . u . . r . r . . u . . . c 1060 Solanaceae Solanum melongena H E . . . . . . . . c . . . . . . . 1061 Solanaceae Solanum nigrum H E . c . u c u r . c u c c c c c c 1062 Solanaceae Solanum seaforthianum H E . u . u . . r . . . . . . . r . 1063 Solanaceae Solanum stelligerum S - . c . . . . . . . . . . . . . . 1064 Solanaceae Solanum torvum S E . r . . . . . . r . . r r u r . 1065 Solanaceae Solanum tuberosum H E . . . . r r . . . . . . . . . . 1066 Solanaceae Solanum viridifolium S N . . u . . . . . . . . . . . . . 1067 Sparrmanniaceae Corchorus cunninghamii H N . . . . . . . . . r . . . . . . 1068 Sterculiaceae Argyrodendron actinophyllum T N . . . . . . . . . . r r . . . . 1069 Strelitziaceae Ravenala madagascariensis T E . . . . u . u r . r r . . . . . 1070 Strelitziaceae Strelitzia nicolai S E . . . . . . . . . u . r . . . . 1071 Strelitziaceae Strelitzia reginae S E . . . . u u r c c u c u . . r . 1072 Surianaceae Guilfoylia monostylis S N . . r . . . . . . . . . . . . . 1073 Tamaricaceae Tamarix aphylla T E . . . . . . r . . . . . . . . . 1074 Theaceae Camellia japonica S E . . . . . . . r r r . r . . . . 1075 Theaceae Camellia sasanqua S E . . . . r . r u r r r u . . . . 1076 Thymelaeaceae Phaleria clerodendron T N . . . . r . r . r r r . . . . .
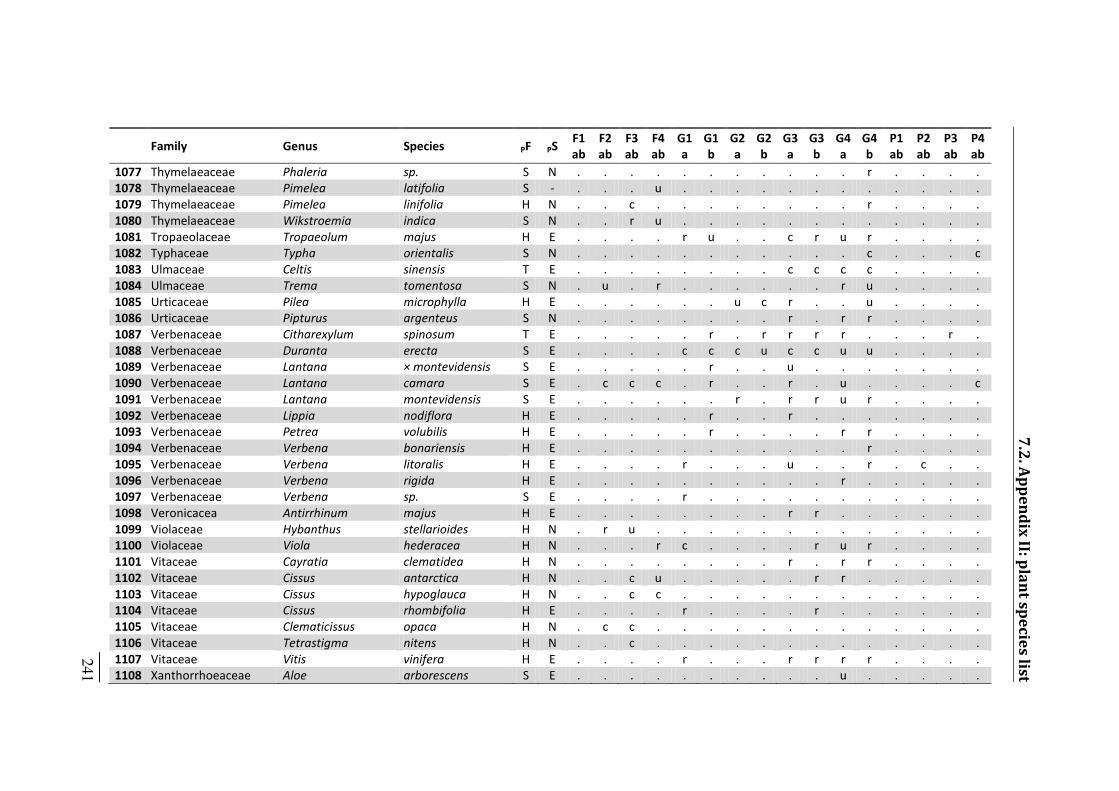
Family Genus Species PF PS F1 ab F2 ab F3 ab F4 ab G1 a G1 b G2 a G2 b G3 a G3 b G4 a G4 b P1 ab P2 ab P3 ab P4 ab 1077 Thymelaeaceae Phaleria sp. S N . . . . . . . . . . . r . . . . 1078 Thymelaeaceae Pimelea latifolia S - . . . u . . . . . . . . . . . . 1079 Thymelaeaceae Pimelea linifolia H N . . c . . . . . . . . r . . . . 1080 Thymelaeaceae Wikstroemia indica S N . . r u . . . . . . . . . . . . 1081 Tropaeolaceae Tropaeolum majus H E . . . . r u . . c r u r . . . . 1082 Typhaceae Typha orientalis S N . . . . . . . . . . . c . . . c 1083 Ulmaceae Celtis sinensis T E . . . . . . . . c c c c . . . . 1084 Ulmaceae Trema tomentosa S N . u . r . . . . . . r u . . . . 1085 Urticaceae Pilea microphylla H E . . . . . . u c r . . u . . . . 1086 Urticaceae Pipturus argenteus S N . . . . . . . . r . r r . . . . 1087 Verbenaceae Citharexylum spinosum T E . . . . . r . r r r r . . . r . 1088 Verbenaceae Duranta erecta S E . . . . c c c u c c u u . . . . 1089 Verbenaceae Lantana × montevidensis S E . . . . . r . . u . . . . . . . 1090 Verbenaceae Lantana camara S E . c c c . r . . r . u . . . . c 1091 Verbenaceae Lantana montevidensis S E . . . . . . r . r r u r . . . . 1092 Verbenaceae Lippia nodiflora H E . . . . . r . . r . . . . . . . 1093 Verbenaceae Petrea volubilis H E . . . . . r . . . . r r . . . . 1094 Verbenaceae Verbena bonariensis H E . . . . . . . . . . . r . . . . 1095 Verbenaceae Verbena litoralis H E . . . . r . . . u . . r . c . . 1096 Verbenaceae Verbena rigida H E . . . . . . . . . . r . . . . . 1097 Verbenaceae Verbena sp. S E . . . . r . . . . . . . . . . . 1098 Veronicacea Antirrhinum majus H E . . . . . . . . r r . . . . . . 1099 Violaceae Hybanthus stellarioides H N . r u . . . . . . . . . . . . . 1100 Violaceae Viola hederacea H N . . . r c . . . . r u r . . . . 1101 Vitaceae Cayratia clematidea H N . . . . . . . . r . r r . . . . 1102 Vitaceae Cissus antarctica H N . . c u . . . . . r r . . . . . 1103 Vitaceae Cissus hypoglauca H N . . c c . . . . . . . . . . . . 1104 Vitaceae Cissus rhombifolia H E . . . . r . . . . r . . . . . . 1105 Vitaceae Clematicissus opaca H N . c c . . . . . . . . . . . . . 1106 Vitaceae Tetrastigma nitens H N . . c . . . . . . . . . . . . . 1107 Vitaceae Vitis vinifera H E . . . . r . . . r r r r . . . . 1108 Xanthorrhoeaceae Aloe arborescens S E . . . . . . . . . . u . . . . . _____ 241
7.2. Appendix II: plant species list
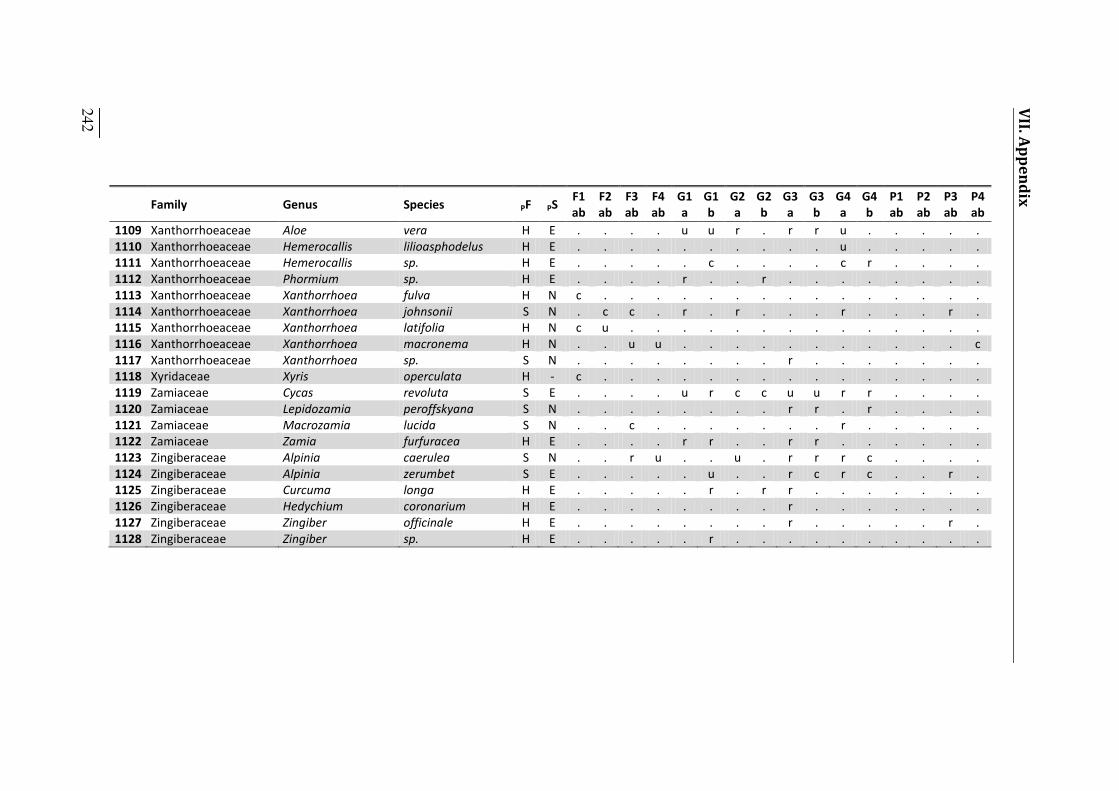
_____ 242
VII. Appendix
Family Genus Species PF PS F1 ab F2 ab F3 ab F4 ab G1 a G1 b G2 a G2 b G3 a G3 b G4 a G4 b P1 ab P2 ab P3 ab P4 ab 1109 Xanthorrhoeaceae Aloe vera H E . . . . u u r . r r u . . . . . 1110 Xanthorrhoeaceae Hemerocallis lilioasphodelus H E . . . . . . . . . . u . . . . . 1111 Xanthorrhoeaceae Hemerocallis sp. H E . . . . . c . . . . c r . . . . 1112 Xanthorrhoeaceae Phormium sp. H E . . . . r . . r . . . . . . . . 1113 Xanthorrhoeaceae Xanthorrhoea fulva H N c . . . . . . . . . . . . . . . 1114 Xanthorrhoeaceae Xanthorrhoea johnsonii S N . c c . r . r . . . r . . . r . 1115 Xanthorrhoeaceae Xanthorrhoea latifolia H N c u . . . . . . . . . . . . . . 1116 Xanthorrhoeaceae Xanthorrhoea macronema H N . . u u . . . . . . . . . . . c 1117 Xanthorrhoeaceae Xanthorrhoea sp. S N . . . . . . . . r . . . . . . . 1118 Xyridaceae Xyris operculata H - c . . . . . . . . . . . . . . . 1119 Zamiaceae Cycas revoluta S E . . . . u r c c u u r r . . . . 1120 Zamiaceae Lepidozamia peroffskyana S N . . . . . . . . r r . r . . . . 1121 Zamiaceae Macrozamia lucida S N . . c . . . . . . . r . . . . . 1122 Zamiaceae Zamia furfuracea H E . . . . r r . . r r . . . . . . 1123 Zingiberaceae Alpinia caerulea S N . . r u . . u . r r r c . . . . 1124 Zingiberaceae Alpinia zerumbet S E . . . . . u . . r c r c . . r . 1125 Zingiberaceae Curcuma longa H E . . . . . r . r r . . . . . . . 1126 Zingiberaceae Hedychium coronarium H E . . . . . . . . r . . . . . . . 1127 Zingiberaceae Zingiber officinale H E . . . . . . . . r . . . . . r . 1128 Zingiberaceae Zingiber sp. H E . . . . . r . . . . . . . . . .
Acknowledgements
_____ 243
VIII. ACKNOWLEDGEMENTS Countless people supported this thesis and were part of the journey, but this thesis
was made possible by the overwhelming support of several women.
First and foremost, I want to thank my two principal supervisors Sara Leonhardt and
Helen Wallace. Sara Leonhardt inspired me to enter the realm of bees, is a never-
ending source of new ideas and phenomenal setting the wheels in motion. I am very
grateful that she always had my back, as she helped solving any crisis, secured funding
and shielded me from suffocating administrative work. After years of developing new
ideas together, be it while doing field work under blazing sun, walking down the beach
or pushing a stroller, I hope to continue pursuing new exciting questions with her.
Helen Wallace welcomed me in Australia and in her family, assisted in developing the
project at every step and helped me see the world from the bees‘ perspective. As a supervisor she never stopped being supportive, fought for her students, but always kept
a smile in her eyes. I am grateful for many great conversations while sipping excellent
wine and for all the bird watching, which took us far and beyond Australia. I thank
Alexandra-Maria Klein for supporting the thesis from start to finish, for funding it in
the initial phase, advising on the study setup and helping to create the joint PhD
programme. Tim Heard as our most important co-author provided us with a huge
number of bee hives, shared his knowledge about bees and always helped advancing our
discussions with his thoughtful comments. I further thank all reviewers for investing
their time to inspect this thesis and follow its ideas.
A great number of engaged student helpers carried large parts of the field work: the
insect enthusiast Rhys Smith was there right from the start, building up the study setup
and helping to develop field work protocols. Julia Nagler initiated foraging
observations, conducted palynological analysis, developed the protocol for biometric
bee measurements and infected everybody with her sunny spirit. Birte Hensen and
Manuel Pützstück worked tirelessly during a long but very joyful field season. Marvin
Schäfer concluded biometric analysis and joined in on field trips. Furthermore, David
Walton, Shelley Read, Mia Kaluza, Brooke Dwan and Nora Drescher were part of
the field work and helped out at some point of the project. I very much enjoyed the great
and eager support of the next generation of our bee team, specifically from Ryan Newis
and Rachele Wilson on field trips, as well as Amanda Norton, Luke Verstraten and
Moritz Trinkl.
Acknowledgements
_____ 244
Bradley Jeffers, who is the living compendium of the plants of Queensland, single-
handedly completed the herculean task of conducting botanical surveys and compiling
the whole plant list. I greatly enjoyed our many shared hikes and field trips, where he
fruitlessly attempted to teach me about Australian plants. Katie Roberts searched the
botanical literature and helped improving the plant list. I further thank several
anonymous land owners for not shooting us for trespassing during botanical surveys.
The bee keepers Glenbo Craig and Chris Fuller shared their expertise of stingless
bees for the project. The beautiful images used in this thesis were courtesy of: Tobias
Smith, Rhys Smith, Tim Heard, Glenbo Craig, Jan Anderson, Sara Leonhardt,
Bradley Jeffers, Manuel Pützstück and Marvin Schäfer.
Alexander Keller helped me solve puzzles in R statistics since 2009 and we enjoyed
many discussions since. His outside perspective on our research problems and his
ingenious approaches were invaluable for this thesis. Nico Blüthgen advised on the
conceptual framework of Chapter IV and discussed methodological approaches with us.
Further, I thank Henrik von Wehrden and Oliver Mitesser for advice on statistical
approaches. Sanjeev Kumar Srivastava and Jie Zhang provided assistance with the
GIS map.
Laboratory analysis of nest and forager pollen was conducted by Andrea Hilpert.
Nora Drescher processed our nest resin samples and tested them for their antimicrobial
activity. Vanessa Minden performed stoichiometric analysis of nest pollen samples to
determine their content of macro- and microelements. Gudrun Grimmer conducted the
DNA meta-barcoding of nest pollen and Peter Brooks provided support on lab work at
USC.
We used several corporate and private owned locations to create our study sites and I
thank all owners for granting us frequent and often unannounced access to their
property: Sahara Farms (Beerwah), Macadamia Farm Management Pty Ltd
(Bundaberg), the Maroochy Bushland Botanic Gardens (Sunshine Coast), as well as
Danielle LeLagadec, Rod Daley, Brooke Dwan, Garry & Judith Clotz, David Bell,
Agnes Wiercinski & Mark Blows, Rose & John Broe, Morgan Brigg, Manon &
Rob Giffiths, but foremost and wholeheartedly Selwyn & Luise Read for adopting me
into their family.

Acknowledgements
Creating and conducting a joint PhD programme between two universities with such
divergent systems needed the support and good will of many people. I personally thank
Roland De Marco for initiating this great opportunity, and I thank Wolfgang Ruck,
Daniel Lang, Lyndal Kroker, Eva-Maria Voßhagen, Brett Franklin and everybody
else involved for advice and for guiding the process.
Many people helped me finding my way through the jungles of administration.
Thomas Niemeyer and Martina Nehring helped me starting up at Leuphana and
supported me from far. Bruce Randall was always able to organise necessary
equipment and knew how to handle people at USC. I want to thank Lynette McLaren
for her kind and competent support in organising conference travels and Nicole Levi for
her support in dealing with the USC graduate school. At Würzburg University, I want to
thank Birgit Bünger for lending me her ear and her always timely help. I also want to
thank Thomas Schmitt for many good discussions and for inviting me into his work
group. Further, I am grateful for the support of my office teams and fellow PhD students
at the Leuphana University, the University of the Sunshine Coast and Würzburg
University who helped keeping up the spirit. Lastly, I want to thank all the unique
people in my private environment who made this journey possible with their enduring
support. I am very grateful for a PhD scholarship by the German Academic Exchange Agency
(DAAD) funding my stay in Australia. I further received funding from USC and
Leuphana for conference travels. The overall project was funded by the Deutsche
Forschungs-Gemeinschaft (DFG project: LE 2750/1-1). This thesis was powered by
Queen Emma chocolate, product of Papua New Guinea.

DECLARATION Declaration according to § 9 section 2 e)-f) and section 3 of the Doctoral
Regulations of 2011 of the Faculty of Sustainability, Leuphana University
Lüneburg
I hereby declare that I have not taken or registered to take another examination to
receive a doctoral degree.
I hereby declare that the dissertation, in its present or any other version, has not yet
been submitted to any other university for review.
I hereby certify that the submitted dissertation entitled ‗Impacts of landscape
resource diversity and availability on bee foraging and fitness‘ has been written by me without using any unauthorized aids. I did not use any aids and writings other
than those indicated. All passages taken from other writings either verbatim or in
substance have been marked by me accordingly.
Erklärungen gem. § 9 Abs. 2 e)-f) und Versicherung gem. § 9 Abs. 3 der
Promotionsordnung 2011 der Fakultät Nachaltigkeit der Leuphana Universität
Lüneburg
Hiermit erkläre ich, dass ich mich bisher keiner anderen Doktorprüfung unterzogen
oder zu einer solchen Prüfung angemeldet habe.
Hiermit erkläre ich, dass die Dissertation in der gegenwärtigen oder einer anderen
Fassung noch keiner anderen Hochschule zur Begutachtung vorgelegen hat.
Ich versichere, dass ich die eingereichte Dissertation „Impacts of landscape resource diversity and availability on bee foraging and fitness― selbständig und ohne
unerlaubte Hilfsmittel verfasst habe. Anderer als der von mir angegebenen
Hilfsmittel und Schriften habe ich mich nicht bedient. Alle wörtlich oder sinngemäß
anderen Schriften entnommene Stellen habe ich kenntlich gemacht.
Benjamin Felix Kaluza