Embed Size (px)
Citation preview

Impacts of Land Cover Change on Hydrology in a Mountainous Environment
Scott N. Miller, PhD Associate Professor
Chair, Graduate Programs in Hydrology
University of Wyoming, USA

Sustainable Management of Watersheds
The SUMAWA Project

Research Collaborators
► Univ. of Wyoming
S. Miller (PI)
S. Mooney
T. Baldyga
L. Dalles
► Egerton University
W. Shivoga (PI)
F. Lelo (co-PI)
C. Gichaba (co-PI)
C. Ouma
L. Chiuri
S. Inoti
• Univ. of Calif. – Davis M. Jenkins (co-PI)
► Moi University
M. Muchiri (co-PI) D. Liti
► Dep’t of Fisheries G. Macharia N. Gitonga
► Kenya Wildlife Service
R. Ndetei
► Utah State University S. Huckett

The River Njoro Watershed
KENYA
Nairobi
Njoro

Description of the Njoro Watershed
►Around 270 km2 with 250,000+ people
► In the Rift Valley
► Forested uplands
►Agricultural middle
►Urban lowlands
► Lake Nakuru National Park At outlet

Watershed Characteristics

Climate Change – East Africa
►Changes in precipitation patterns
Short rains and Long rains: increase in monthly rainfall amounts and intensity
Challenge: historical 30-year variability
►Increasing temperatures
0.2°C – 0.5°C per decade
►Current study: two predicted climate change scenarios
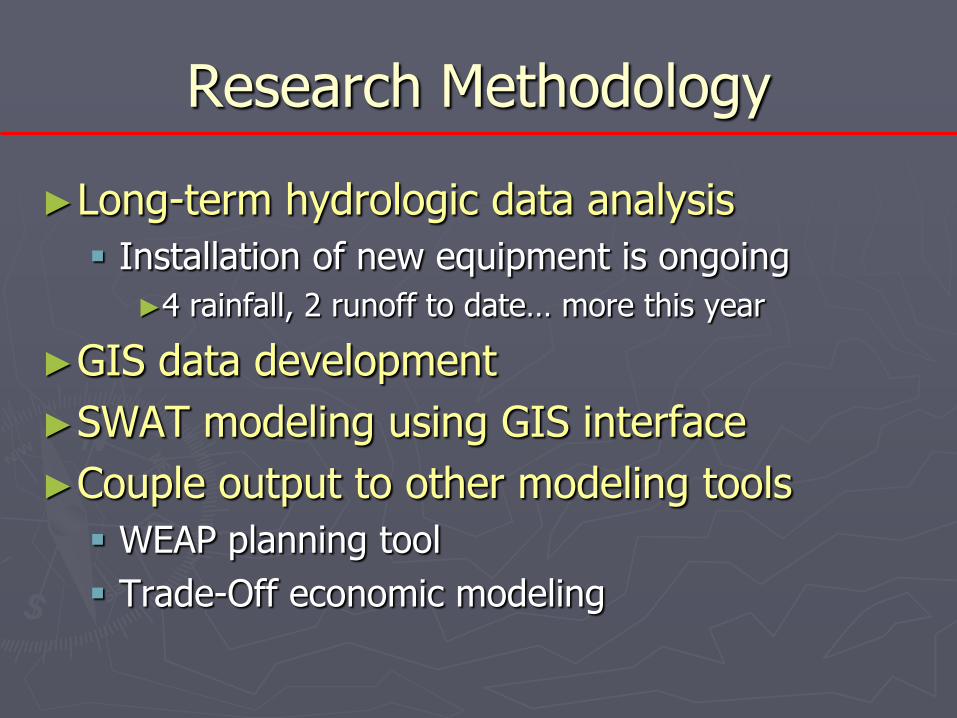
Research Methodology
►Long-term hydrologic data analysis
Installation of new equipment is ongoing
►4 rainfall, 2 runoff to date… more this year
►GIS data development
►SWAT modeling using GIS interface
►Couple output to other modeling tools
WEAP planning tool
Trade-Off economic modeling

Field Research
►Hydrologic sampling for analysis & modeling

Preliminary Findings
►Water quality (sediment, nutrients) already poor at upper end of watershed.
► Increased incidences of water-borne disease
Increased concentrations during dry season are pronounced
►Declining groundwater supplies, quality

Percentage Change in Annual Runoff in River Njoro Watershed; Data from 1961-1985
► Increase in runoff volume, BUT loss in access to water (e.g. increases water scarcity)
► We hypothesize that this is due to land cover change from mid-1990’s resulting in:
Loss of infiltration in upper watershed
Increased flashiness in runoff – downstream losses in water resources
1986-1989 1989-2000 2000-2003
-0.85 +31.34 +108.11

Remote Sensing
►11 images acquired from 1977 – 2004
►Focus on 3 anniversary images
1986, 1995, 2003
►Unsupervised / supervised classification
15 class system
►Change detection analysis

Landsat Image 2003
Change Detection
1986 Landsat Image
www.sumawa.org; Invited presentation to SENR student-faculty forum, Oct. 2003

Land Cover Change

Land Cover Change in Upper River Njoro Watershed (1986-2003)
Land
Cover
Class
1986
(ha)
1995
(ha)
2003
(ha)
Change
1986 – 2003
(ha)
Open
Water 0 0 1 1
Urban 275 438 502 227
Agriculture 10208 9902 11504 1296
Forest 11243 10110 7676 -3567
Grassland 4538 3017 4437 -101

GIS database construction * DEM, Soils, Landcover
AGWA – SWAT parameterization * CN, groundwater
Calibration on upper watershed * 1995 LC, 1990-1998 data * Nash-Sutcliffe * Annual (good), monthly (poor)
Comparison across time - upper * application of 1990-1998 rain, temp * assumed stationarity in time
Translation of parameter set to entire watershed
Rainfall-runoff time series analysis * Baseflow, missing data, weather
1986, 2003 Data
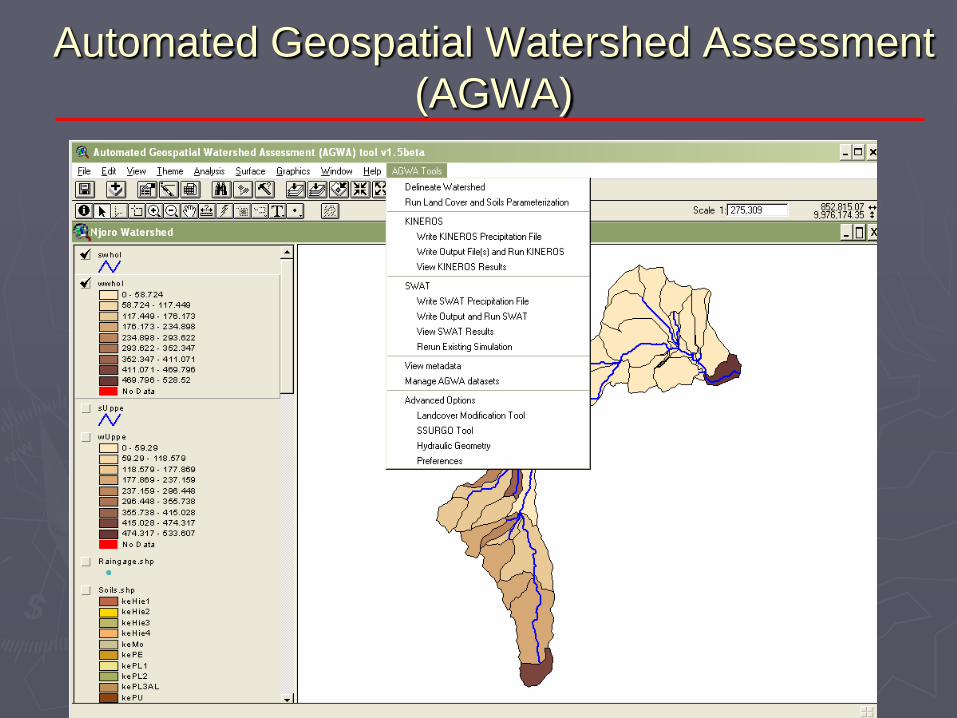
Automated Geospatial Watershed Assessment
(AGWA)

• Automated watershed modeling at multiple
scales using a GIS interface
– KINEROS & SWAT (modular)
• Investigate the impacts of land cover
change on runoff, erosion, water quality
• Targeted for use by research scientists,
management specialists
– technology transfer
– widely applicable
AGWA Summary

AGWA-SWAT Modeling on the Njoro
►Calibrated using 1995 Land Cover on the Upper Watershed (gaged)
►15+ year spin-up for rainfall
►Targeted 40% baseflow
►Climate
Elevation banding
Weather generator file for local conditions
Observed temperature

Input Data Layers
Soils
50m DEM
Land Cover
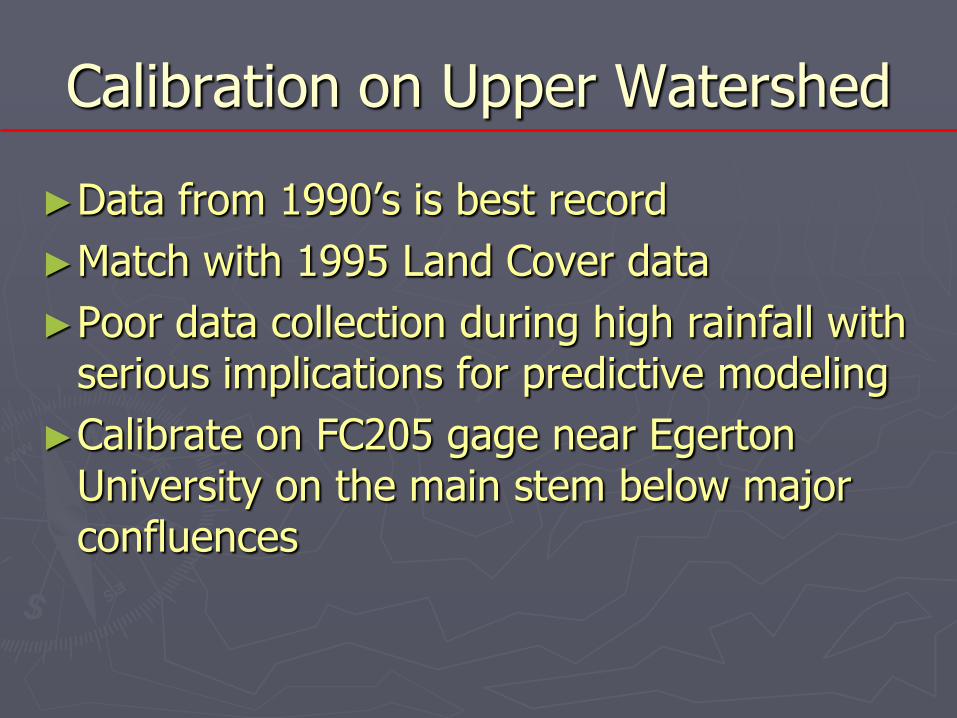
Calibration on Upper Watershed
►Data from 1990’s is best record
►Match with 1995 Land Cover data
►Poor data collection during high rainfall with serious implications for predictive modeling
►Calibrate on FC205 gage near Egerton University on the main stem below major confluences

Calibration on Upper Watershed
0
50
100
150
200
250
300
350
400
450
1990 1991 1992 1993 1994 1995 1996 1997 1998
YEAR
Q (
mm
)
Observed
Simulated
1997 removed due to poor data (>200 missing days)
Nash-Sutcliffe = 0.89
y = 0.84x + 37.3
R 2 = 0.92
0
50
100
150
200
250
300
350
400
450
0 50 100 150 200 250 300 350 400 450
Q Observed (mm)
Q S
imu
late
d (
mm
)
1:1 line

Comparison Across Time: 1995-2003
0
100
200
300
400
500
600
1990 1991 1992 1993 1994 1995 1996 1997 1998
1995 Simulation
2003 Simulation

Hydrologic Alterations - Simulated
►Overall trend: increased water yield
Increased surface discharge
Decreased groundwater discharge and percolation
►Altered timing is hard to determine but is implicated in the hydrologic changes
►Change is most dramatic after 1995

Modeling flow to the outlet
►Central portion heavily affected
► Increased surface runoff
►Altered timing and peak rates
►Overall net increase in water yield… decrease in groundwater recharge
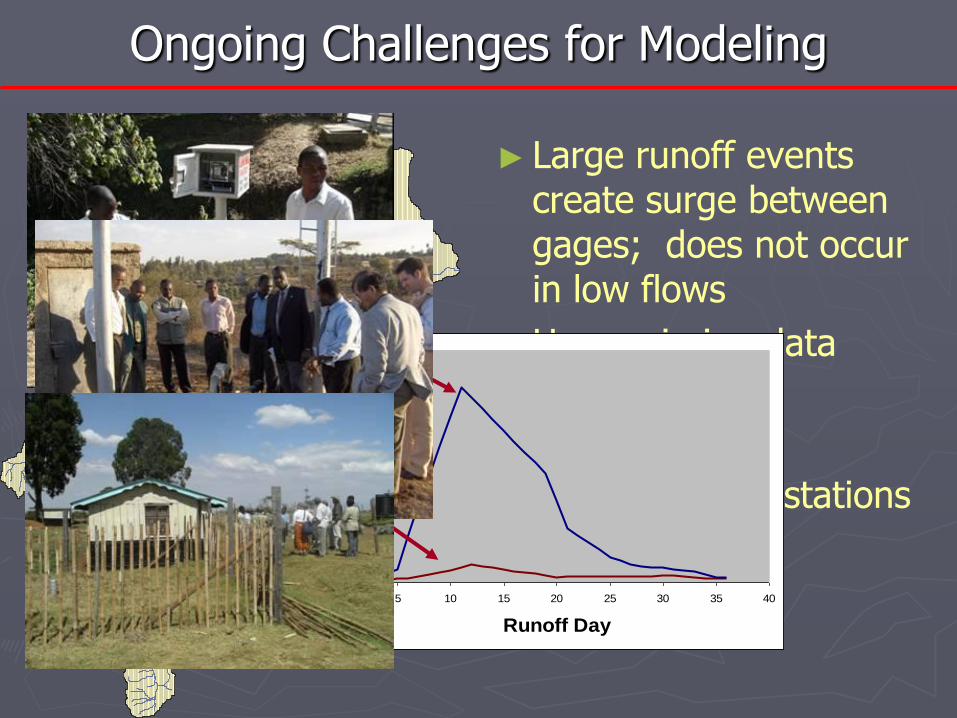
Ongoing Challenges for Modeling
► Large runoff events create surge between gages; does not occur in low flows
►Huge missing data
►Groundwater knowledge
► Lack of gaging stations
0
20
40
60
80
100
120
140
160
0 5 10 15 20 25 30 35 40
Runoff Day
Dis
ch
arg
e (
cm
s)
#
#

Minimum and Maximum Annual Potentials (PPT) Current Climate: 724 – 1264 mm 4 – 379 mm Conservative Climate Change: 713 – 1275 mm 5 – 369 mm Extreme Climate Change: 690 – 1413 mm 10 – 444 mm
Overview
►Results are supportive of hypotheses
Strong link between forest & land cover and hydrologic response
►Long-term concern over water balance for human and natural systems
►Concerns over effects of GCC on resources
►Several areas for improvement
►Groundwork for integrated decision support