Embed Size (px)
Citation preview
Impacts of initial stand density and thinning regimes on energywood production and management-related CO2 emissions inboreal ecosystems
Ashraful Alam • Antti Kilpelainen •
Seppo Kellomaki
Received: 25 June 2010 / Revised: 20 May 2011 / Accepted: 1 June 2011 / Published online: 5 July 2011
� Springer-Verlag 2011
Abstract An ecosystem model (Sima) was utilised to
investigate the impact of forest management (by changing
both the initial stand density and basal area thinning
thresholds from current recommendations) on energy wood
production (at energy wood thinning and final felling) and
management-related carbon dioxide (CO2) emissions for
the energy wood production in Finnish boreal conditions
(62�390 N, 29�370 E). The simultaneous effects of energy
wood, timber and C stocks in the forest ecosystem (live and
dead biomass) were also assessed. The analyses were car-
ried out at stand level during a rotation period of 80 years
for Scots pine (Pinus sylvestris L.) and Norway spruce
(Picea abies L. Karst.) growing in different fertility sites.
Generally, the results showed that decreased basal area
thinning thresholds, compared with current thinning,
reduced energy wood (logging residues) and timber pro-
duction, as well as carbon stocks in the forest ecosystem.
Conversely, increased thinning thresholds increased energy
wood production (ca. 1–27%) at both energy wood thin-
ning and final felling and reduced CO2 emissions (ca.
2–6%) related to the production chain (e.g. management
operations), depending on the thinning threshold levels,
initial stand density, species and site. Increased thinning
thresholds also enhanced timber production and carbon
stocks in the forest ecosystem. Additionally, increased
initial stand density enhanced energy wood production for
energy wood thinning for both species, but this reduced
energy wood production at final felling for Scots pine and
Norway spruce. This study concluded that increases in both
initial stand density and thinning thresholds, compared
with the current level, could be useful in energy wood,
timber and carbon stocks enhancement, as well as reducing
management-related CO2 emissions for energy wood pro-
duction. Only 2.4–3.3% of input of the produced energy
(energy wood) was required during the whole production
chain, depending on the management regime, species and
sites. However, a comprehensive substitution analysis of
wood-based energy, in respect to environmental benefits,
would also require the inclusion of CO2 emissions related
to ecosystem processes (e.g. decomposition).
Keywords Ecosystem model � Emission calculation �Energy wood production �Management � Boreal ecosystem
Introduction
The growing concentration of atmospheric carbon dioxide
(CO2) and its contribution to global warming is a well-
known phenomenon and long-term large-scale problem
(IPCC 2007). Mitigation strategies to tackle this issue
include reducing emissions and increasing the sequestra-
tion of carbon (C). With regards to these strategies, forests
and forest management are receiving particular attention
and can play a significant role in reducing net C emissions
by capturing and storing of C in forest biomass and utilise
them to substitute fossil fuels.
Communicated by K. Puettmann.
A. Alam (&) � A. Kilpelainen � S. Kellomaki
School of Forest Sciences, University of Eastern Finland,
P.O. Box 111, 80101 Joensuu, Finland
e-mail: [email protected]
Present Address:A. Kilpelainen
Finnish Environment Institute, Joensuu office, P.O. Box 111,
80101 Joensuu, Finland
e-mail: [email protected]
123
Eur J Forest Res (2012) 131:655–667
DOI 10.1007/s10342-011-0539-8
In Finland (60–70� N, 19–32� E), the traditional way of
managing forests has been to produce timber (pulpwood
and sawlogs). Environmental concerns, responding to
human-induced global warming, have lead to the realisa-
tion that the utilisation of other tangible and intangible
forestry services must also be included as additional forest
management objectives. Of them, the production of energy
wood, as logging residues from final felling and small-
sized trees from early thinning (energy wood thinning) or
first commercial thinning for energy generation (Ahtikoski
et al. 2008; Alam et al. 2010; Heikkila et al. 2009; Hoen
and Solberg 1994; Karkkainen et al. 2008) and exploring
possibilities to enhance C capturing capacity in forest
biomass and ecosystem (Alam et al. 2008, 2010; Briceno-
Elizondo et al. 2006; Garcia-Gonzalo et al. 2007), is much
highlighted at present.
The production of energy wood and harvested timber,
and C in the growing stocks are affected by forest man-
agement practices (Alam et al. 2008; Heikkila et al. 2009;
Profft et al. 2009), i.e. the intensity and timing of thinning.
Thinning of young stands yields wood suitable for pulp and
energy (small-sized trees) and provides more growing
space for the remaining trees, thereby shifts the distribution
of growth to larger and more valued trees (e.g. Petritsch
et al. 2007). During the later stages of stand development,
pulpwood and sawlogs are produced, including energy
wood from logging residues (i.e. the tree tops, branches and
stumps) (Hall 2002).
Several previous studies have shown that leaving forests
undisturbed or extending the rotation length could store
more C in the forest ecosystem (Kaipainen et al. 2004;
Karjalainen 1996; Liski et al. 2001; Pussinen et al. 2002).
However, this would reduce the timber production suitable
for industrial purposes (Alam et al. 2008; Seely et al.
2002). In order to find a solution on how the carbon stocks
of forest ecosystem can be increased during a rotation
period without losing forests’ potential to produce timber,
several efforts have been put on research. Some recent
studies have explored the possibility of increasing both
timber production and ecosystem carbon stocks by
changing the stand management (Briceno-Elizondo et al.
2006; Garcia-Gonzalo et al. 2007; Alam et al. 2010).
Changing management may also be used to increase the
share of energy wood production together with timber as
shown by Heikkila et al. (2009). In this context, higher
initial stand density might produce more energy wood
during energy wood thinning and also at final felling
(logging residues). In addition, increased basal area thin-
ning thresholds could increase the production of energy
wood, according to an earlier study conducted by the
authors (Alam et al. 2010).
The use of wood-based energy is considered as a pro-
spective substitute for fossil fuel. Energy wood use in lieu
of fossil fuel has the advantage that could avoid C emis-
sions related to fossil fuel burning. However, the use of
various machines for forest management operations,
extraction and transportation of wood requires fuel and
emits CO2 to the atmosphere, reducing partly the benefit of
its utilisation (Schlamadinger et al. 1995; Yoshioka et al.
2005). Hence, computing CO2 emissions from the energy
wood production, apart from the emissions of energy wood
combustion itself, requires considering the emissions
related to forest operations and associated product trans-
portation to the utilisation phase. From the forest man-
agement point of view, these emissions also vary
depending on the utilised management operations and
magnitude of management intensity (Eriksson et al. 2007).
Considering the above-mentioned issues, it is therefore
necessary to evaluate the energy input and output associ-
ated with C accumulation in forests and release to the
atmosphere, during the life cycle of forest production
system. There has been some studies conducted using the
life cycle approach for forest products emphasising mainly
either on logging residues as by-product and/or alternative
energy sources (Korpilahti 1998; Wihersaari 2005;
Yoshioka et al. 2005) or on postharvesting wood products
transportation and usage (Forsberg 2000; Gasol et al.
2009). There are gaps in knowledge in C emissions and
energy used in whole management chain and operations
(i.e. from the seedling production to the delivery of har-
vested wood to the manufacturing plants) for energy wood
production when forest management is aimed to produce
integrated energy wood and timber.
In this context, this study investigated the impacts of
forest management (initial stand density and thinning
regimes) on energy wood production (at energy wood
thinning and final felling) and management-related CO2
emissions for energy wood production in Finnish boreal
conditions. The simultaneous effects of energy wood,
timber and C stocks in the forest ecosystem were also
assessed. The analyses were done at stand level during a
rotation period of 80 years for Scots pine (Pinus sylvestris
L.) and Norway spruce (Picea abies L. Karst.) growing in
most-fertile, medium-fertile and less-fertile sites.
Materials and methods
Outlines of ecosystem model
This study utilised an ecosystem model (Sima) parame-
terised for the tree species growing between the latitudes N
60� and N 70� and longitudes E 20� and E 32� within
Finland (Kellomaki et al. 1992, 2008; Kolstrom 1998). In
the Sima model, the dynamics of the forest ecosystem is
assumed to be determined by the dynamics of the number
656 Eur J Forest Res (2012) 131:655–667
123
and mass of trees as regulated by their regeneration, growth
and death. All these processes are related to the availability
of resources, regulated by the canopy gap dynamics of the
tree stand. The model simulates the growth of individual
tree and its component in a stand based on diameter. The
model is run on an annual basis, and the computations are
applied to an area of 100 m2. The model is exhaustively
described in several other papers (Kellomaki et al. 1992,
2008; Kellomaki and Kolstrom 1994; Kolstrom 1998), and
therefore, only an outline of the model is presented here.
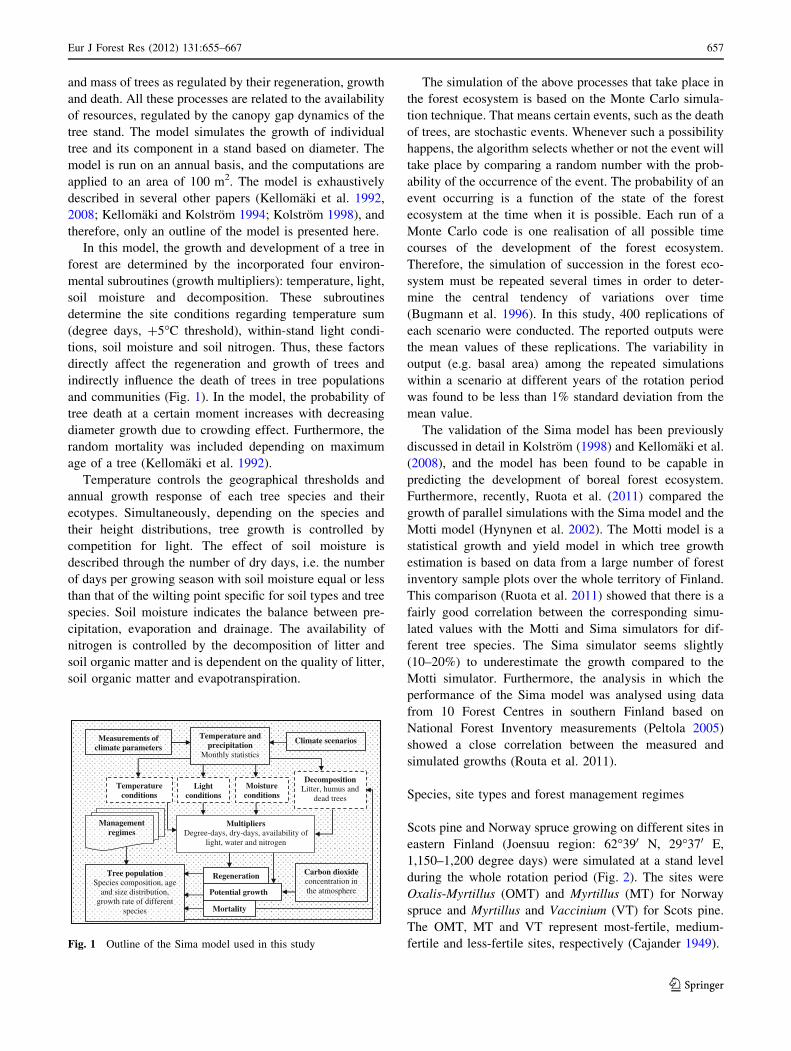
In this model, the growth and development of a tree in
forest are determined by the incorporated four environ-
mental subroutines (growth multipliers): temperature, light,
soil moisture and decomposition. These subroutines
determine the site conditions regarding temperature sum
(degree days, ?5�C threshold), within-stand light condi-
tions, soil moisture and soil nitrogen. Thus, these factors
directly affect the regeneration and growth of trees and
indirectly influence the death of trees in tree populations
and communities (Fig. 1). In the model, the probability of
tree death at a certain moment increases with decreasing
diameter growth due to crowding effect. Furthermore, the
random mortality was included depending on maximum
age of a tree (Kellomaki et al. 1992).
Temperature controls the geographical thresholds and
annual growth response of each tree species and their
ecotypes. Simultaneously, depending on the species and
their height distributions, tree growth is controlled by
competition for light. The effect of soil moisture is
described through the number of dry days, i.e. the number
of days per growing season with soil moisture equal or less
than that of the wilting point specific for soil types and tree
species. Soil moisture indicates the balance between pre-
cipitation, evaporation and drainage. The availability of
nitrogen is controlled by the decomposition of litter and
soil organic matter and is dependent on the quality of litter,
soil organic matter and evapotranspiration.
The simulation of the above processes that take place in
the forest ecosystem is based on the Monte Carlo simula-
tion technique. That means certain events, such as the death
of trees, are stochastic events. Whenever such a possibility
happens, the algorithm selects whether or not the event will
take place by comparing a random number with the prob-
ability of the occurrence of the event. The probability of an
event occurring is a function of the state of the forest
ecosystem at the time when it is possible. Each run of a
Monte Carlo code is one realisation of all possible time
courses of the development of the forest ecosystem.
Therefore, the simulation of succession in the forest eco-
system must be repeated several times in order to deter-
mine the central tendency of variations over time
(Bugmann et al. 1996). In this study, 400 replications of
each scenario were conducted. The reported outputs were
the mean values of these replications. The variability in
output (e.g. basal area) among the repeated simulations
within a scenario at different years of the rotation period
was found to be less than 1% standard deviation from the
mean value.
The validation of the Sima model has been previously
discussed in detail in Kolstrom (1998) and Kellomaki et al.
(2008), and the model has been found to be capable in
predicting the development of boreal forest ecosystem.
Furthermore, recently, Ruota et al. (2011) compared the
growth of parallel simulations with the Sima model and the
Motti model (Hynynen et al. 2002). The Motti model is a
statistical growth and yield model in which tree growth
estimation is based on data from a large number of forest
inventory sample plots over the whole territory of Finland.
This comparison (Ruota et al. 2011) showed that there is a
fairly good correlation between the corresponding simu-
lated values with the Motti and Sima simulators for dif-
ferent tree species. The Sima simulator seems slightly
(10–20%) to underestimate the growth compared to the
Motti simulator. Furthermore, the analysis in which the
performance of the Sima model was analysed using data
from 10 Forest Centres in southern Finland based on
National Forest Inventory measurements (Peltola 2005)
showed a close correlation between the measured and
simulated growths (Routa et al. 2011).
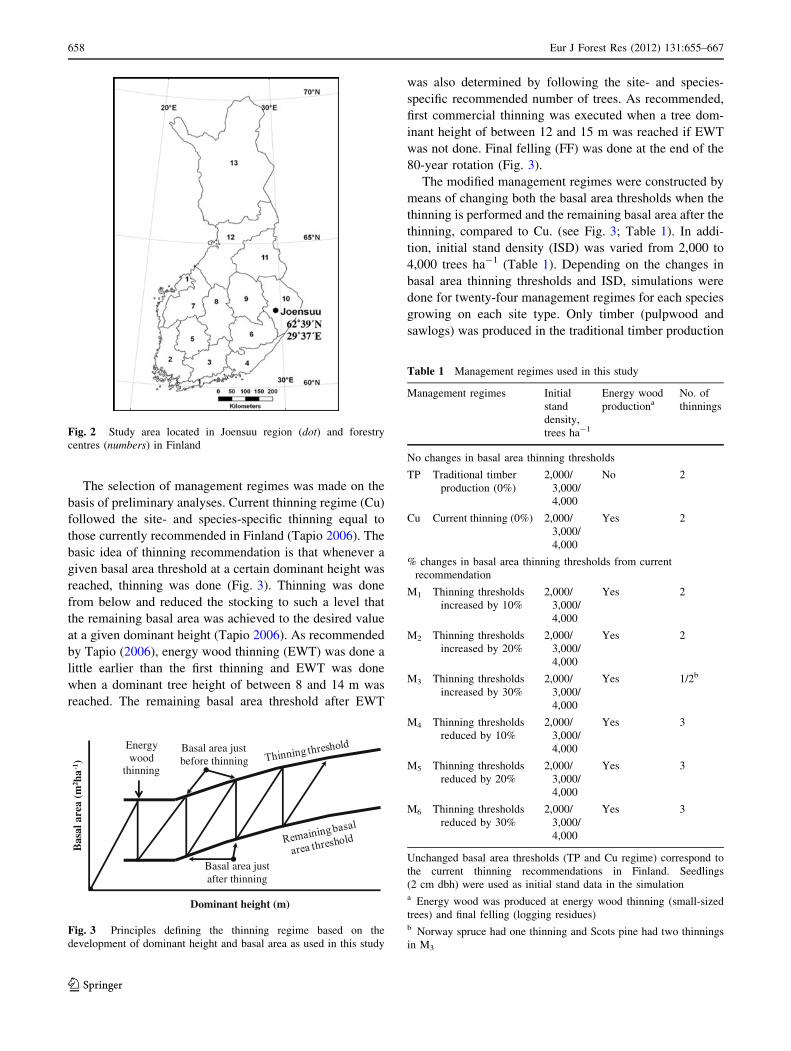
Species, site types and forest management regimes
Scots pine and Norway spruce growing on different sites in
eastern Finland (Joensuu region: 62�390 N, 29�370 E,
1,150–1,200 degree days) were simulated at a stand level
during the whole rotation period (Fig. 2). The sites were
Oxalis-Myrtillus (OMT) and Myrtillus (MT) for Norway
spruce and Myrtillus and Vaccinium (VT) for Scots pine.
The OMT, MT and VT represent most-fertile, medium-
fertile and less-fertile sites, respectively (Cajander 1949).
Temperature and precipitation
Measurements of climate parameters
Climate scenarios
Monthly statistics
Decomposition Temperature
conditions Moisture
conditionsLitter, humus and
dead trees
Tree population Species composition, age
and size distribution, growth rate of different
species
Light conditions
Management regimes
Multipliers Degree-days, dry-days, availability of
light, water and nitrogen
Carbon dioxide concentration inthe atmosphere
Regeneration
Potential growth
Mortality
Fig. 1 Outline of the Sima model used in this study
Eur J Forest Res (2012) 131:655–667 657
123
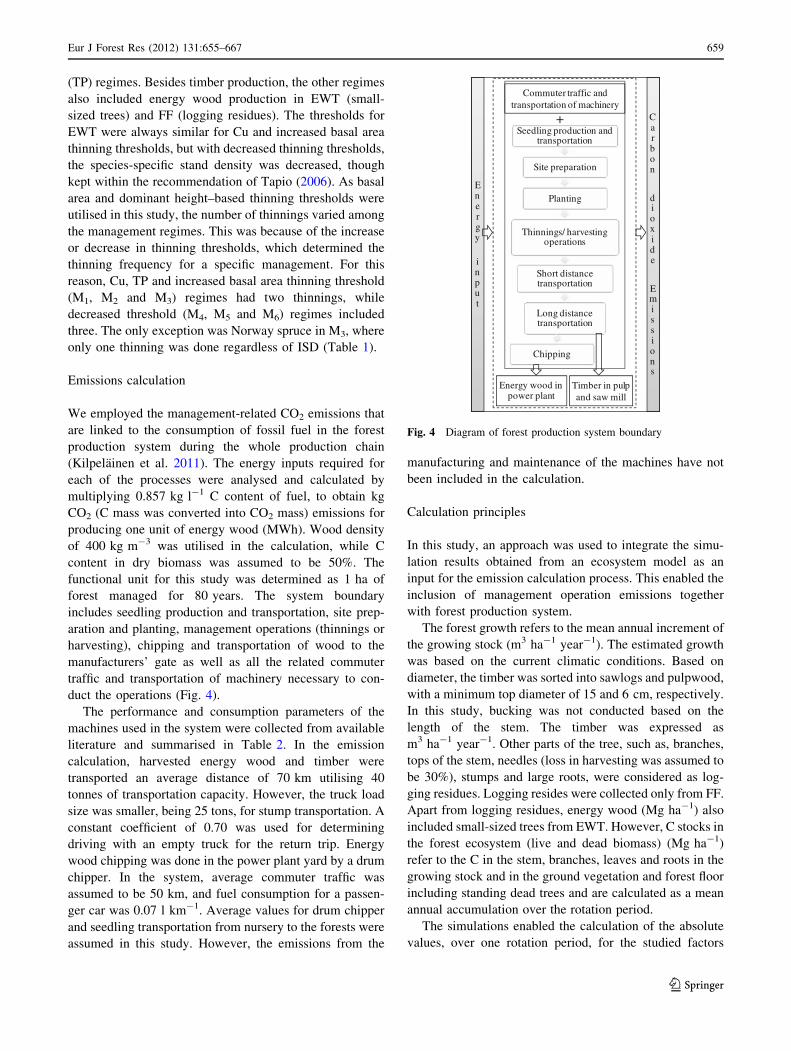
The selection of management regimes was made on the
basis of preliminary analyses. Current thinning regime (Cu)
followed the site- and species-specific thinning equal to
those currently recommended in Finland (Tapio 2006). The
basic idea of thinning recommendation is that whenever a
given basal area threshold at a certain dominant height was
reached, thinning was done (Fig. 3). Thinning was done
from below and reduced the stocking to such a level that
the remaining basal area was achieved to the desired value
at a given dominant height (Tapio 2006). As recommended
by Tapio (2006), energy wood thinning (EWT) was done a
little earlier than the first thinning and EWT was done
when a dominant tree height of between 8 and 14 m was
reached. The remaining basal area threshold after EWT
was also determined by following the site- and species-
specific recommended number of trees. As recommended,
first commercial thinning was executed when a tree dom-
inant height of between 12 and 15 m was reached if EWT
was not done. Final felling (FF) was done at the end of the
80-year rotation (Fig. 3).
The modified management regimes were constructed by
means of changing both the basal area thresholds when the
thinning is performed and the remaining basal area after the
thinning, compared to Cu. (see Fig. 3; Table 1). In addi-
tion, initial stand density (ISD) was varied from 2,000 to
4,000 trees ha-1 (Table 1). Depending on the changes in
basal area thinning thresholds and ISD, simulations were
done for twenty-four management regimes for each species
growing on each site type. Only timber (pulpwood and
sawlogs) was produced in the traditional timber production
Fig. 2 Study area located in Joensuu region (dot) and forestry
centres (numbers) in Finland
Bas
al a
rea
(m2 h
a-1)
Dominant height (m)
Basal area just after thinning
Basal area just before thinning
Energy wood
thinning
Fig. 3 Principles defining the thinning regime based on the
development of dominant height and basal area as used in this study
Table 1 Management regimes used in this study
Management regimes Initial
stand
density,
trees ha-1
Energy wood
productionaNo. of
thinnings
No changes in basal area thinning thresholds
TP Traditional timber
production (0%)
2,000/
3,000/
4,000
No 2
Cu Current thinning (0%) 2,000/
3,000/
4,000
Yes 2
% changes in basal area thinning thresholds from current
recommendation
M1 Thinning thresholds
increased by 10%
2,000/
3,000/
4,000
Yes 2
M2 Thinning thresholds
increased by 20%
2,000/
3,000/
4,000
Yes 2
M3 Thinning thresholds
increased by 30%
2,000/
3,000/
4,000
Yes 1/2b
M4 Thinning thresholds
reduced by 10%
2,000/
3,000/
4,000
Yes 3
M5 Thinning thresholds
reduced by 20%
2,000/
3,000/
4,000
Yes 3
M6 Thinning thresholds
reduced by 30%
2,000/
3,000/
4,000
Yes 3
Unchanged basal area thresholds (TP and Cu regime) correspond to
the current thinning recommendations in Finland. Seedlings
(2 cm dbh) were used as initial stand data in the simulationa Energy wood was produced at energy wood thinning (small-sized
trees) and final felling (logging residues)b Norway spruce had one thinning and Scots pine had two thinnings
in M3
658 Eur J Forest Res (2012) 131:655–667
123
(TP) regimes. Besides timber production, the other regimes
also included energy wood production in EWT (small-
sized trees) and FF (logging residues). The thresholds for
EWT were always similar for Cu and increased basal area
thinning thresholds, but with decreased thinning thresholds,
the species-specific stand density was decreased, though
kept within the recommendation of Tapio (2006). As basal
area and dominant height–based thinning thresholds were
utilised in this study, the number of thinnings varied among
the management regimes. This was because of the increase
or decrease in thinning thresholds, which determined the
thinning frequency for a specific management. For this
reason, Cu, TP and increased basal area thinning threshold
(M1, M2 and M3) regimes had two thinnings, while
decreased threshold (M4, M5 and M6) regimes included
three. The only exception was Norway spruce in M3, where
only one thinning was done regardless of ISD (Table 1).
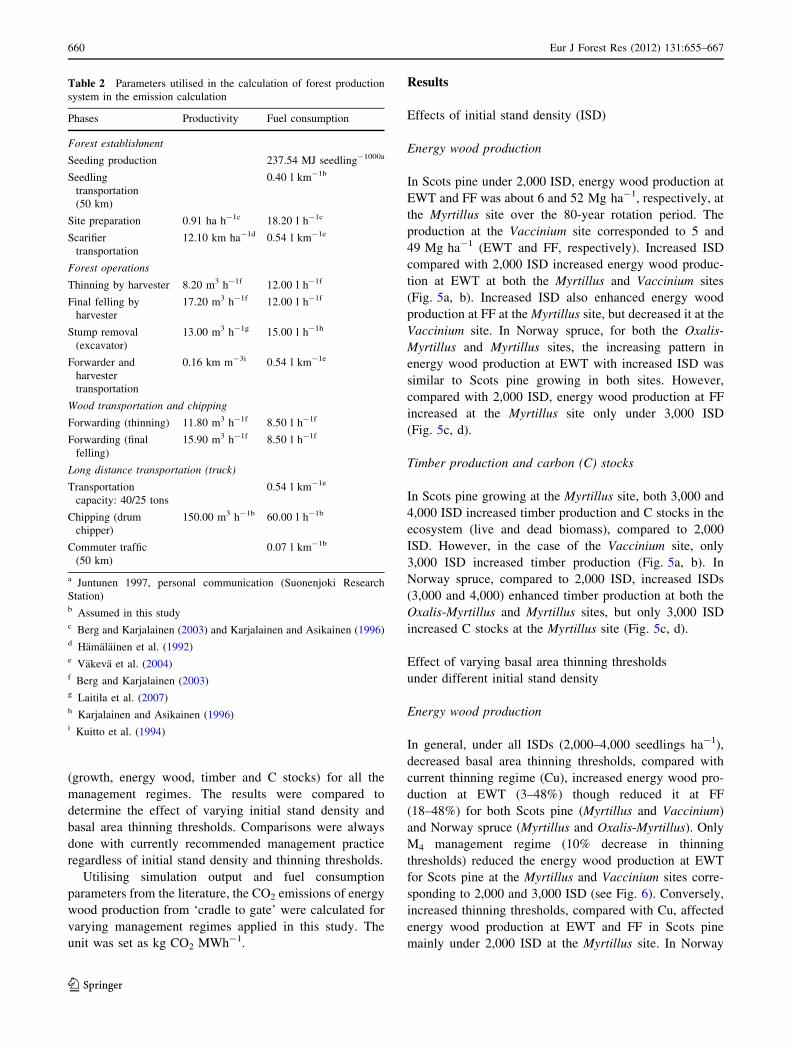
Emissions calculation
We employed the management-related CO2 emissions that
are linked to the consumption of fossil fuel in the forest
production system during the whole production chain
(Kilpelainen et al. 2011). The energy inputs required for
each of the processes were analysed and calculated by
multiplying 0.857 kg l-1 C content of fuel, to obtain kg
CO2 (C mass was converted into CO2 mass) emissions for
producing one unit of energy wood (MWh). Wood density
of 400 kg m-3 was utilised in the calculation, while C
content in dry biomass was assumed to be 50%. The
functional unit for this study was determined as 1 ha of
forest managed for 80 years. The system boundary
includes seedling production and transportation, site prep-
aration and planting, management operations (thinnings or
harvesting), chipping and transportation of wood to the
manufacturers’ gate as well as all the related commuter
traffic and transportation of machinery necessary to con-
duct the operations (Fig. 4).
The performance and consumption parameters of the
machines used in the system were collected from available
literature and summarised in Table 2. In the emission
calculation, harvested energy wood and timber were
transported an average distance of 70 km utilising 40
tonnes of transportation capacity. However, the truck load
size was smaller, being 25 tons, for stump transportation. A
constant coefficient of 0.70 was used for determining
driving with an empty truck for the return trip. Energy
wood chipping was done in the power plant yard by a drum
chipper. In the system, average commuter traffic was
assumed to be 50 km, and fuel consumption for a passen-
ger car was 0.07 l km-1. Average values for drum chipper
and seedling transportation from nursery to the forests were
assumed in this study. However, the emissions from the
manufacturing and maintenance of the machines have not
been included in the calculation.
Calculation principles
In this study, an approach was used to integrate the simu-
lation results obtained from an ecosystem model as an
input for the emission calculation process. This enabled the
inclusion of management operation emissions together
with forest production system.
The forest growth refers to the mean annual increment of
the growing stock (m3 ha-1 year-1). The estimated growth
was based on the current climatic conditions. Based on
diameter, the timber was sorted into sawlogs and pulpwood,
with a minimum top diameter of 15 and 6 cm, respectively.
In this study, bucking was not conducted based on the
length of the stem. The timber was expressed as
m3 ha-1 year-1. Other parts of the tree, such as, branches,
tops of the stem, needles (loss in harvesting was assumed to
be 30%), stumps and large roots, were considered as log-
ging residues. Logging resides were collected only from FF.
Apart from logging residues, energy wood (Mg ha-1) also
included small-sized trees from EWT. However, C stocks in
the forest ecosystem (live and dead biomass) (Mg ha-1)
refer to the C in the stem, branches, leaves and roots in the
growing stock and in the ground vegetation and forest floor
including standing dead trees and are calculated as a mean
annual accumulation over the rotation period.
The simulations enabled the calculation of the absolute
values, over one rotation period, for the studied factors
Energy wood in power plant
Timber in pulp and saw mill
Seedling production and transportation
Site preparation
Planting
Thinnings/ harvesting operations
Short distance transportation
Long distance transportation
Chipping
Energy
input
Commuter traffic and transportation of machinery
+ Carbon
dioxide
Emi ss ions
Fig. 4 Diagram of forest production system boundary
Eur J Forest Res (2012) 131:655–667 659
123
(growth, energy wood, timber and C stocks) for all the
management regimes. The results were compared to
determine the effect of varying initial stand density and
basal area thinning thresholds. Comparisons were always
done with currently recommended management practice
regardless of initial stand density and thinning thresholds.
Utilising simulation output and fuel consumption
parameters from the literature, the CO2 emissions of energy
wood production from ‘cradle to gate’ were calculated for
varying management regimes applied in this study. The
unit was set as kg CO2 MWh-1.
Results
Effects of initial stand density (ISD)
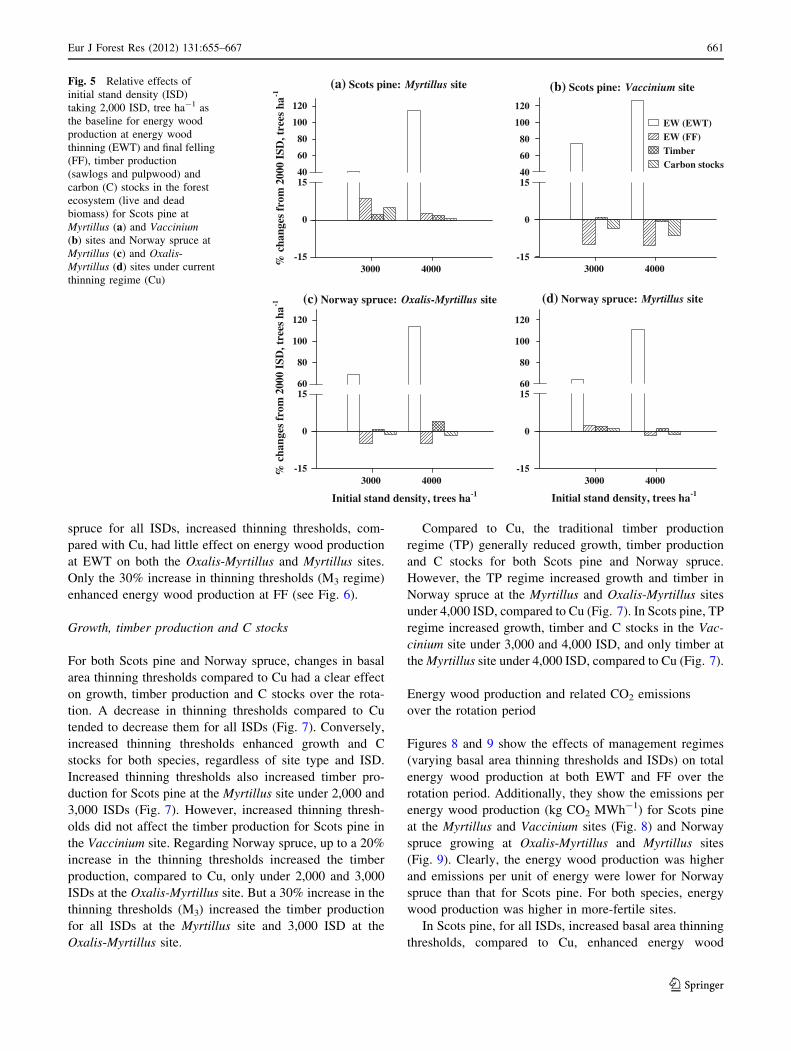
Energy wood production
In Scots pine under 2,000 ISD, energy wood production at
EWT and FF was about 6 and 52 Mg ha-1, respectively, at
the Myrtillus site over the 80-year rotation period. The
production at the Vaccinium site corresponded to 5 and
49 Mg ha-1 (EWT and FF, respectively). Increased ISD
compared with 2,000 ISD increased energy wood produc-
tion at EWT at both the Myrtillus and Vaccinium sites
(Fig. 5a, b). Increased ISD also enhanced energy wood
production at FF at the Myrtillus site, but decreased it at the
Vaccinium site. In Norway spruce, for both the Oxalis-
Myrtillus and Myrtillus sites, the increasing pattern in
energy wood production at EWT with increased ISD was
similar to Scots pine growing in both sites. However,
compared with 2,000 ISD, energy wood production at FF
increased at the Myrtillus site only under 3,000 ISD
(Fig. 5c, d).
Timber production and carbon (C) stocks
In Scots pine growing at the Myrtillus site, both 3,000 and
4,000 ISD increased timber production and C stocks in the
ecosystem (live and dead biomass), compared to 2,000
ISD. However, in the case of the Vaccinium site, only
3,000 ISD increased timber production (Fig. 5a, b). In
Norway spruce, compared to 2,000 ISD, increased ISDs
(3,000 and 4,000) enhanced timber production at both the
Oxalis-Myrtillus and Myrtillus sites, but only 3,000 ISD
increased C stocks at the Myrtillus site (Fig. 5c, d).
Effect of varying basal area thinning thresholds
under different initial stand density
Energy wood production
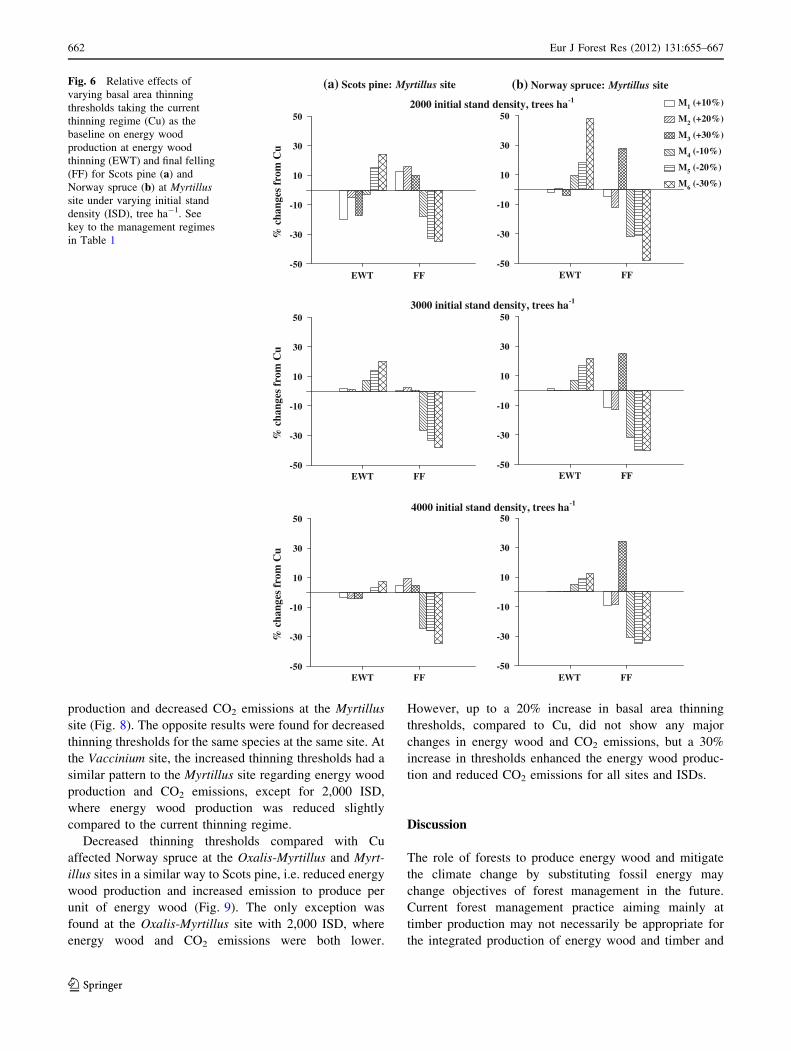
In general, under all ISDs (2,000–4,000 seedlings ha-1),
decreased basal area thinning thresholds, compared with
current thinning regime (Cu), increased energy wood pro-
duction at EWT (3–48%) though reduced it at FF
(18–48%) for both Scots pine (Myrtillus and Vaccinium)
and Norway spruce (Myrtillus and Oxalis-Myrtillus). Only
M4 management regime (10% decrease in thinning
thresholds) reduced the energy wood production at EWT
for Scots pine at the Myrtillus and Vaccinium sites corre-
sponding to 2,000 and 3,000 ISD (see Fig. 6). Conversely,
increased thinning thresholds, compared with Cu, affected
energy wood production at EWT and FF in Scots pine
mainly under 2,000 ISD at the Myrtillus site. In Norway
Table 2 Parameters utilised in the calculation of forest production
system in the emission calculation
Phases Productivity Fuel consumption
Forest establishment
Seeding production 237.54 MJ seedling-1000a
Seedling
transportation
(50 km)
0.40 l km-1b
Site preparation 0.91 ha h-1c 18.20 l h-1c
Scarifier
transportation
12.10 km ha-1d 0.54 l km-1e
Forest operations
Thinning by harvester 8.20 m3 h-1f 12.00 l h-1f
Final felling by
harvester
17.20 m3 h-1f 12.00 l h-1f
Stump removal
(excavator)
13.00 m3 h-1g 15.00 l h-1h
Forwarder and
harvester
transportation
0.16 km m-3i 0.54 l km-1e
Wood transportation and chipping
Forwarding (thinning) 11.80 m3 h-1f 8.50 l h-1f
Forwarding (final
felling)
15.90 m3 h-1f 8.50 l h-1f
Long distance transportation (truck)
Transportation
capacity: 40/25 tons
0.54 l km-1e
Chipping (drum
chipper)
150.00 m3 h-1b 60.00 l h-1b
Commuter traffic
(50 km)
0.07 l km-1b
a Juntunen 1997, personal communication (Suonenjoki Research
Station)b Assumed in this studyc Berg and Karjalainen (2003) and Karjalainen and Asikainen (1996)d Hamalainen et al. (1992)e Vakeva et al. (2004)f Berg and Karjalainen (2003)g Laitila et al. (2007)h Karjalainen and Asikainen (1996)i Kuitto et al. (1994)
660 Eur J Forest Res (2012) 131:655–667
123
spruce for all ISDs, increased thinning thresholds, com-
pared with Cu, had little effect on energy wood production
at EWT on both the Oxalis-Myrtillus and Myrtillus sites.
Only the 30% increase in thinning thresholds (M3 regime)
enhanced energy wood production at FF (see Fig. 6).
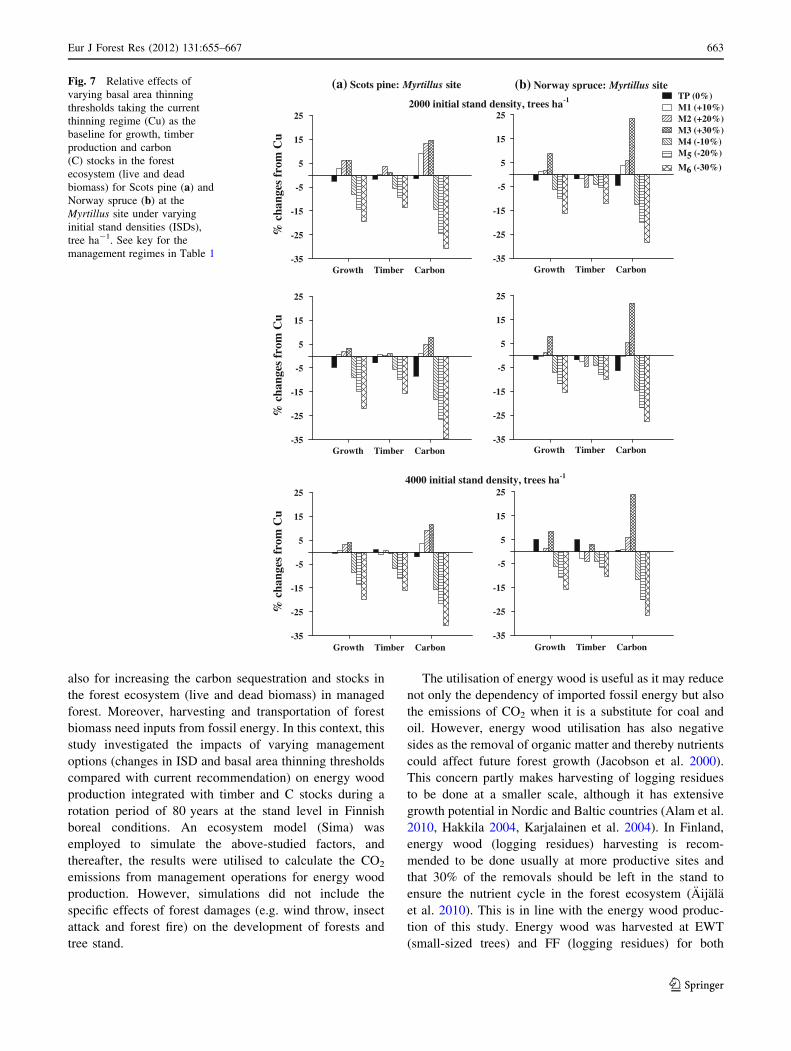
Growth, timber production and C stocks
For both Scots pine and Norway spruce, changes in basal
area thinning thresholds compared to Cu had a clear effect
on growth, timber production and C stocks over the rota-
tion. A decrease in thinning thresholds compared to Cu
tended to decrease them for all ISDs (Fig. 7). Conversely,
increased thinning thresholds enhanced growth and C
stocks for both species, regardless of site type and ISD.
Increased thinning thresholds also increased timber pro-
duction for Scots pine at the Myrtillus site under 2,000 and
3,000 ISDs (Fig. 7). However, increased thinning thresh-
olds did not affect the timber production for Scots pine in
the Vaccinium site. Regarding Norway spruce, up to a 20%
increase in the thinning thresholds increased the timber
production, compared to Cu, only under 2,000 and 3,000
ISDs at the Oxalis-Myrtillus site. But a 30% increase in the
thinning thresholds (M3) increased the timber production
for all ISDs at the Myrtillus site and 3,000 ISD at the
Oxalis-Myrtillus site.
Compared to Cu, the traditional timber production
regime (TP) generally reduced growth, timber production
and C stocks for both Scots pine and Norway spruce.
However, the TP regime increased growth and timber in
Norway spruce at the Myrtillus and Oxalis-Myrtillus sites
under 4,000 ISD, compared to Cu (Fig. 7). In Scots pine, TP
regime increased growth, timber and C stocks in the Vac-
cinium site under 3,000 and 4,000 ISD, and only timber at
the Myrtillus site under 4,000 ISD, compared to Cu (Fig. 7).
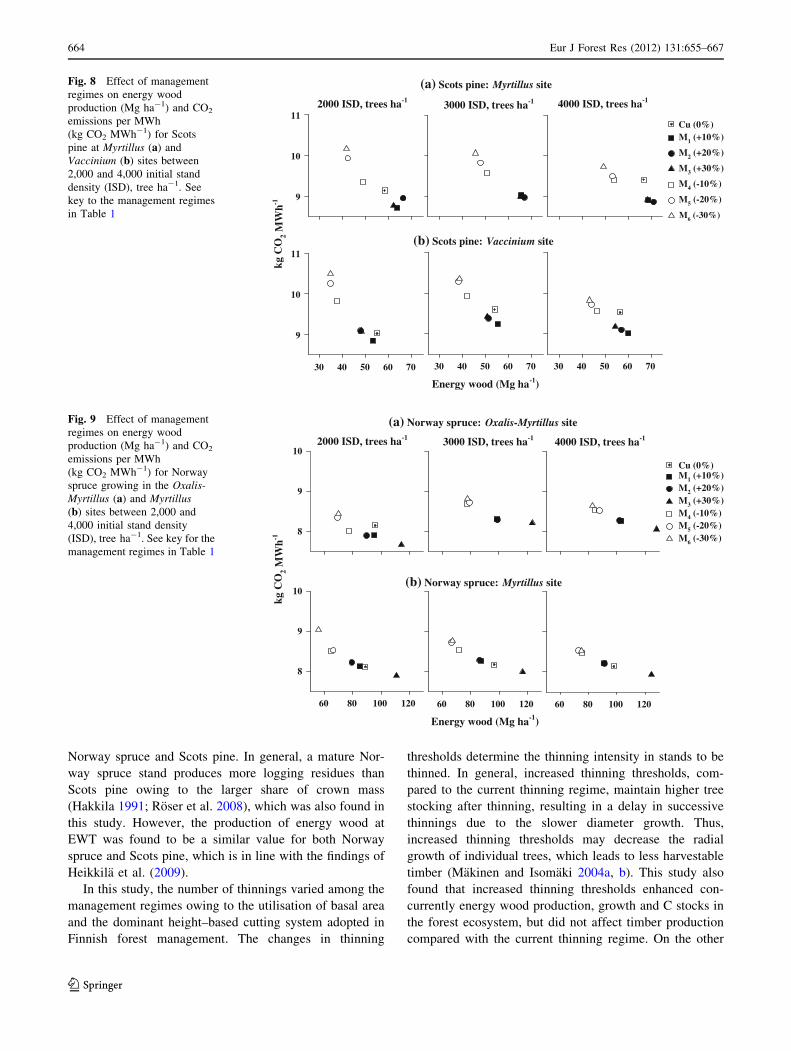
Energy wood production and related CO2 emissions
over the rotation period
Figures 8 and 9 show the effects of management regimes
(varying basal area thinning thresholds and ISDs) on total
energy wood production at both EWT and FF over the
rotation period. Additionally, they show the emissions per
energy wood production (kg CO2 MWh-1) for Scots pine
at the Myrtillus and Vaccinium sites (Fig. 8) and Norway
spruce growing at Oxalis-Myrtillus and Myrtillus sites
(Fig. 9). Clearly, the energy wood production was higher
and emissions per unit of energy were lower for Norway
spruce than that for Scots pine. For both species, energy
wood production was higher in more-fertile sites.
In Scots pine, for all ISDs, increased basal area thinning
thresholds, compared to Cu, enhanced energy wood
(a) Scots pine: Myrtillus site
3000 4000%
cha
nges
fro
m 2
000
ISD
, tre
es h
a-1
-15
0
1540
60
80
100
120
EW (EWT)EW (FF)TimberCarbon stocks
(b) Scots pine: Vaccinium site
3000 4000-15
0
1540
60
80
100
120
(d) Norway spruce: Myrtillus site
Initial stand density, trees ha-1
3000 4000-15
0
1560
80
100
120
(c) Norway spruce: Oxalis-Myrtillus site
Initial stand density, trees ha-1
3000 4000
% c
hang
es f
rom
200
0 IS
D, t
rees
ha-1
-15
0
1560
80
100
120
Fig. 5 Relative effects of
initial stand density (ISD)
taking 2,000 ISD, tree ha-1 as
the baseline for energy wood
production at energy wood
thinning (EWT) and final felling
(FF), timber production
(sawlogs and pulpwood) and
carbon (C) stocks in the forest
ecosystem (live and dead
biomass) for Scots pine at
Myrtillus (a) and Vaccinium(b) sites and Norway spruce at
Myrtillus (c) and Oxalis-
Myrtillus (d) sites under current
thinning regime (Cu)
Eur J Forest Res (2012) 131:655–667 661
123
production and decreased CO2 emissions at the Myrtillus
site (Fig. 8). The opposite results were found for decreased
thinning thresholds for the same species at the same site. At
the Vaccinium site, the increased thinning thresholds had a
similar pattern to the Myrtillus site regarding energy wood
production and CO2 emissions, except for 2,000 ISD,
where energy wood production was reduced slightly
compared to the current thinning regime.
Decreased thinning thresholds compared with Cu
affected Norway spruce at the Oxalis-Myrtillus and Myrt-
illus sites in a similar way to Scots pine, i.e. reduced energy
wood production and increased emission to produce per
unit of energy wood (Fig. 9). The only exception was
found at the Oxalis-Myrtillus site with 2,000 ISD, where
energy wood and CO2 emissions were both lower.
However, up to a 20% increase in basal area thinning
thresholds, compared to Cu, did not show any major
changes in energy wood and CO2 emissions, but a 30%
increase in thresholds enhanced the energy wood produc-
tion and reduced CO2 emissions for all sites and ISDs.
Discussion
The role of forests to produce energy wood and mitigate
the climate change by substituting fossil energy may
change objectives of forest management in the future.
Current forest management practice aiming mainly at
timber production may not necessarily be appropriate for
the integrated production of energy wood and timber and
2000 initial stand density, trees ha-1
% c
hang
es f
rom
Cu
-50
-30
-10
10
30
50
M1 (+10%)
M2 (+20%)
M3 (+30%)
M4 (-10%)
M5 (-20%)
M6 (-30%)
-50
-30
-10
10
30
50
% c
hang
es f
rom
Cu
-50
-30
-10
10
30
50
-50
-30
-10
10
30
503000 initial stand density, trees ha-1
% c
hang
es f
rom
Cu
-50
-30
-10
10
30
50
EWT FF-50
-30
-10
10
30
504000 initial stand density, trees ha-1
(a) Scots pine: Myrtillus site (b) Norway spruce: Myrtillus site
EWT FF
EWT FF EWT FF
EWT FFEWT FF
Fig. 6 Relative effects of
varying basal area thinning
thresholds taking the current
thinning regime (Cu) as the
baseline on energy wood
production at energy wood
thinning (EWT) and final felling
(FF) for Scots pine (a) and
Norway spruce (b) at Myrtillussite under varying initial stand
density (ISD), tree ha-1. See
key to the management regimes
in Table 1
662 Eur J Forest Res (2012) 131:655–667
123
also for increasing the carbon sequestration and stocks in
the forest ecosystem (live and dead biomass) in managed
forest. Moreover, harvesting and transportation of forest
biomass need inputs from fossil energy. In this context, this
study investigated the impacts of varying management
options (changes in ISD and basal area thinning thresholds
compared with current recommendation) on energy wood
production integrated with timber and C stocks during a
rotation period of 80 years at the stand level in Finnish
boreal conditions. An ecosystem model (Sima) was
employed to simulate the above-studied factors, and
thereafter, the results were utilised to calculate the CO2
emissions from management operations for energy wood
production. However, simulations did not include the
specific effects of forest damages (e.g. wind throw, insect
attack and forest fire) on the development of forests and
tree stand.
The utilisation of energy wood is useful as it may reduce
not only the dependency of imported fossil energy but also
the emissions of CO2 when it is a substitute for coal and
oil. However, energy wood utilisation has also negative
sides as the removal of organic matter and thereby nutrients
could affect future forest growth (Jacobson et al. 2000).
This concern partly makes harvesting of logging residues
to be done at a smaller scale, although it has extensive
growth potential in Nordic and Baltic countries (Alam et al.
2010, Hakkila 2004, Karjalainen et al. 2004). In Finland,
energy wood (logging residues) harvesting is recom-
mended to be done usually at more productive sites and
that 30% of the removals should be left in the stand to
ensure the nutrient cycle in the forest ecosystem (Aijala
et al. 2010). This is in line with the energy wood produc-
tion of this study. Energy wood was harvested at EWT
(small-sized trees) and FF (logging residues) for both
2000 initial stand density, trees ha-1
% c
hang
es f
rom
Cu
-35
-25
-15
-5
5
15
25
-35
-25
-15
-5
5
15
25
TP (0%)M1 (+10%)M2 (+20%)M3 (+30%)M4 (-10%)M5 (-20%)
M6 (-30%)
% c
hang
es f
rom
Cu
-35
-25
-15
-5
5
15
25
-35
-25
-15
-5
5
15
25
4000 initial stand density, trees ha-1
(a) Scots pine: Myrtillus site (b) Norway spruce: Myrtillus site
Growth Timber Carbon
% c
hang
es f
rom
Cu
-35
-25
-15
-5
5
15
25
-35
-25
-15
-5
5
15
25
Growth Timber Carbon
Growth Timber CarbonGrowth Timber Carbon
Growth Timber Carbon Growth Timber Carbon
Fig. 7 Relative effects of
varying basal area thinning
thresholds taking the current
thinning regime (Cu) as the
baseline for growth, timber
production and carbon
(C) stocks in the forest
ecosystem (live and dead
biomass) for Scots pine (a) and
Norway spruce (b) at the
Myrtillus site under varying
initial stand densities (ISDs),
tree ha-1. See key for the
management regimes in Table 1
Eur J Forest Res (2012) 131:655–667 663
123
Norway spruce and Scots pine. In general, a mature Nor-
way spruce stand produces more logging residues than
Scots pine owing to the larger share of crown mass
(Hakkila 1991; Roser et al. 2008), which was also found in
this study. However, the production of energy wood at
EWT was found to be a similar value for both Norway
spruce and Scots pine, which is in line with the findings of
Heikkila et al. (2009).
In this study, the number of thinnings varied among the
management regimes owing to the utilisation of basal area
and the dominant height–based cutting system adopted in
Finnish forest management. The changes in thinning
thresholds determine the thinning intensity in stands to be
thinned. In general, increased thinning thresholds, com-
pared to the current thinning regime, maintain higher tree
stocking after thinning, resulting in a delay in successive
thinnings due to the slower diameter growth. Thus,
increased thinning thresholds may decrease the radial
growth of individual trees, which leads to less harvestable
timber (Makinen and Isomaki 2004a, b). This study also
found that increased thinning thresholds enhanced con-
currently energy wood production, growth and C stocks in
the forest ecosystem, but did not affect timber production
compared with the current thinning regime. On the other
(a) Scots pine: Myrtillus site
kg C
O2
MW
h-1
9
10
11Cu (0%)M1 (+10%)
M2 (+20%)
M3 (+30%)
M4 (-10%)
M5 (-20%)
M6 (-30%)
(b) Scots pine: Vaccinium site
30 40 50 60 70
9
10
11
Energy wood (Mg ha-1)
2000 ISD, trees ha-1 3000 ISD, trees ha-1 4000 ISD, trees ha-1
30 40 50 60 70 30 40 50 60 70
Fig. 8 Effect of management
regimes on energy wood
production (Mg ha-1) and CO2
emissions per MWh
(kg CO2 MWh-1) for Scots
pine at Myrtillus (a) and
Vaccinium (b) sites between
2,000 and 4,000 initial stand
density (ISD), tree ha-1. See
key to the management regimes
in Table 1
(a) Norway spruce: Oxalis-Myrtillus site
kg C
O2
MW
h-1
8
9
10
(b) Norway spruce: Myrtillus site
8
9
10
Energy wood (Mg ha-1)
2000 ISD, trees ha-1 3000 ISD, trees ha-1 4000 ISD, trees ha-1
60 80 100 120
Cu (0%)M1 (+10%)M2 (+20%)M3 (+30%)M4 (-10%)M5 (-20%)M6 (-30%)
60 80 100 12060 80 100 120
Fig. 9 Effect of management
regimes on energy wood
production (Mg ha-1) and CO2
emissions per MWh
(kg CO2 MWh-1) for Norway
spruce growing in the Oxalis-
Myrtillus (a) and Myrtillus(b) sites between 2,000 and
4,000 initial stand density
(ISD), tree ha-1. See key for the
management regimes in Table 1
664 Eur J Forest Res (2012) 131:655–667
123
hand, decreased thinning thresholds, compared with current
thinning, reduced C stocks in the forest ecosystem due to
maintaining the decreased tree stocking over the rotation
period. As decreased thinning thresholds had lower
remaining basal area after EWT, compared with current
thresholds, it increased energy wood production at EWT.
The higher removal of energy wood at EWT reduced the
timber production at successive cuttings and thus nega-
tively impacted on the energy wood production at FF. In
addition, decreased tree stocking enabled single tree vol-
ume to grow faster, thus increasing the number of thinnings
over the rotation, implying less harvestable timber in each
thinning as also found elsewhere (Briceno-Elizondo et al.
2006; Makinen and Isomaki 2004a, b; Thornley and
Cannell 2000). As lower stocking levels may result in
higher individual tree growth and vigour, it may potentially
enabling greater resistance to environmental fluctuations
and/or pest infestation (Roser et al. 2008).
Increased ISD, compared with 2,000 ISD, enhanced
energy wood production at EWT, but at some sites, energy
wood production at FF was reduced, for example, in Scots
pine and Norway spruce in Vaccinium and Oxalis-Myrtillus
sites, respectively. This was mainly caused by the fact that
increased ISD means that EWT is likely to be done earlier,
and therefore, subsequent thinnings were delayed, com-
pared with 2,000 ISD due to not meeting the threshold of
basal area and dominant height in thinning. Because of the
delayed thinning, the time interval between last thinning
and FF was shortened and, therefore, optimal growth
potential remained unutilised during the later stages of the
rotation period. A similar trend also held when both ISD
and thinning thresholds were increased. This affected not
only the energy wood production at FF but also timber
production, as well as on-site C storage.
In previous studies, management implications for forest
production have been identified, with attempts being made
to compare the currently recommended management
practice with changes either in basal area–based thinning
levels (e.g. Alam et al. 2008; Briceno-Elizondo et al. 2006;
Garcia-Gonzalo et al. 2007) or in rotation length (e.g.
Kaipainen et al. 2004; Liski et al. 2001; Pohjola and Valsta
2007). Concurrently managing a forest for maximum car-
bon storage and energy wood production for fossil fuel
substitution is challenging because these two represent
competing demand (Kirschbaum 2003). This means that
undisturbed forests store the most C, while utilisation of
wood requires removal of wood from forests and reduce
on-site C storage. However, Briceno-Elizondo et al. (2006)
and Garcia-Gonzalo et al. (2007) reported that increased
thinning thresholds compared with the current level could
increase both timber production and on-site carbon storage.
Increased timber production could also increase the
energy wood production as reported by Maclaren (2000).
However, these studies did not include the effects of
changing ISD in the energy wood production. This study
suggests that increases in both ISD and thinning thresholds
compared with the current level could be an effective way
to increase energy wood and timber production, as well as
maintain higher C stocks in the ecosystem. In that case,
rotation length would need to be extended compared to the
one used in this study (Liski et al. 2001; Pohjola and Valsta
2007). Reduced rotation length could also be an option, but
this could be applied only with decreased thinning
thresholds (or tree stocking) compared to the current
thinning level. This would decrease on-site carbon storage
over the rotation, but increase the supply cycle of energy
wood if forests are regenerated and managed in a sustain-
able way.
In this study, all the CO2 emissions calculated for the
forest establishment phase (seedling production and trans-
portation, site preparation, transportation of scarifier and
commuter traffic) were included in the energy wood pro-
duction chain, and thus, the result could be an overesti-
mation of the energy input required for energy wood
production. However, this study showed that it was possi-
ble to concurrently enhance energy wood production and
reduce management-related CO2 emissions
(kg CO2 MWh-1) if the ISD and the thinning thresholds
are increased from the current practices. In general, the
emissions per unit energy wood production of Norway
spruce was lower than that of Scots pine, as can be
expected owing to the former producing higher mass of
logging residues though utilising similar amount of input
energy. This study found that 2.4–3.3% input of the output
energy is needed depending on the management regimes,
sites and species. This means one unit of fossil energy
could roughly produce 30–40 units of wood-based energy.
Repo et al. (2010) reported also that management-related
emissions were quite low compared to indirect emissions
(decomposition of soil organic matter) from the forest
ecosystems. In this study, the estimated emissions from the
whole management chain for energy wood production were
about 7.7–10.5 kg CO2 MWh-1 depending on applied
management, sites and species. This is in the range
(4–20 kg CO2 MWh-1) reported by other studies (Kor-
pilahti 1998; Malkki and Virtanen 2003; Wihersaari 2005).
The discrepancy might be due to the differences between
the studies regarding the system boundary settings, selec-
tion of species and their growth potential, utilised site type,
and assumed energy and moisture content in the wood.
Conclusions
This study concluded that energy wood production for
Scots pine and Norway spruce can be enhanced by
Eur J Forest Res (2012) 131:655–667 665
123
increasing both ISD and basal area thinning thresholds
compared with the current forest management recommen-
dation in Finland. At the same time, increased basal area
thinning thresholds enhanced C stocks in the forest eco-
system for both species and timber production mainly in
Scots pine. In addition, increased thinning thresholds
reduced relative CO2 emissions for the energy wood pro-
duction. For a holistic approach, however, emissions rela-
ted to ecosystem processes (e.g. decomposition) should
also be included in the analysis when assessing the role of
the forest in mitigating climate change. Effects of changing
climate on growth of forest and decomposition of soil
organic matter could also be considered in future modelling
attempts. On the whole, climate change mitigation and
emission reductions with the help of wood-based energy
require also sustainable land use and forest management
activities.
Acknowledgments The work was funded from Nordic Energy
Research (NER) (2007–2010) through the project ‘The Climate and
Energy System; Risks, Potential and Adaptation—Renewable Energy:
Bio-fuels working group’ coordinated by Prof. Seppo Kellomaki,
School of Forest Sciences, University of Eastern Finland. The authors
thank Mr. Harri Strandman for technical help and Dr. David Gritten
for linguistic revision.
References
Ahtikoski A, Heikkila J, Aleniusa V, Siren M (2008) Economic
viability of utilizing biomass energy from young stands—the
case of Finland. Biomass Bioenergy 32:988–996
Aijala O, Kuusinen M, Koistinen A (2010) Hyvan metsanhoidon
suositukset energiapuun korjuuseen ja kasvatukseen (Forest
management recommendation for energy wood production and
harvesting). Metsatalouden kehittamiskeskus Tapion julkaiseja,
31 pp (in Finnish)
Alam A, Kilpelainen A, Kellomaki S (2008) Impact of thinning on
growth, timber production and carbon stocks in Finland under
changing climate. Scand J For Res 23:501–512
Alam A, Kilpelainen A, Kellomaki S (2010) Potential timber and
energy wood production and carbon stocks in Finland under
varying thinning regimes and climate scenarios. Bioenergy Res
3:362–372
Berg S, Karjalainen T (2003) Comparison of greenhouse gas
emissions from forest operations in Finland and Sweden.
Forestry 76:3271–3284
Briceno-Elizondo E, Garcia-Gonzalo J, Peltola H, Kellomaki S
(2006) Carbon stocks and timber yield in two boreal forest
ecosystems under current and changing climatic conditions
subjected to varying management regimes. Environ Sci Policy
9:237–252
Bugmann H, Fischlin A, Kienast F (1996) Model convergence and
state variable update in forest gap models. Ecol Modell 89:
197–208
Cajander AK (1949) Metsatyypit ja niiden merkitys (Forest types and
their importance). Acta Forest Fenn 56:5–69 (in Finnish)
Eriksson E, Gillespie AR, Gustavsson L, Langvall O, Olsson M,
Sathre R, Stendahl J (2007) Integrated carbon analysis of forest
management practices and wood substitution. Can J For Res
37:671–681
Forsberg G (2000) Biomass energy transport analysis of bioenergy
transport chains using life cycle inventory method. Biomass
Bioenergy 19:17–30
Garcia-Gonzalo J, Peltola H, Briceno-Elizondo E, Kellomaki S
(2007) Changed thinning regimes may increase carbon stock
under climate change: a case study from a Finnish boreal forest.
Clim Change 81:431–454
Gasol CM, Gabarrell X, Anton A, Rigola M, Carrasco J, Ciria P,
Rieradevall J (2009) LCA of poplar bioenergy system compared
with Brassica carinata energy crop and natural gas in regional
scenario. Biomass Bioenergy 33:119–129
Hakkila P (1991) Hakkuupoistuman latvusmassa (Harvesting of
logging residues). Folia Forestalia 773:24 pp
Hakkila P (2004) Developing technology for large-scale production of
forest chips. Wood energy technology programme 1999–2003.
National technology agency report 6, 99 pp
Hall JP (2002) Sustainable production of forest biomass for energy.
For Chronicle 78:391–396
Hamalainen J, Oijala T, Rajamaki J (1992) Metsamaan muokkauksen
kustannuslaskentamalli (Cost calculation model for site prepa-
ration). Metsateho, Helsinki, 13 pp (in Finnish)
Heikkila J, Siren M, Ahtikoski A, Hynynen J, Sauvula T, Lehtonen M
(2009) Energy wood thinning as a part of the stand management
of Scots pine and Norway spruce. Silva Fenn 43:129–146
Hoen HF, Solberg B (1994) Potential and economic efficiency of
carbon sequestration in forest biomass through silvicultural
management. For Sci 40:429–451
Hynynen J, Ojansuu R, Hokka H, Siipilehto J, Salminen H, Haapala P
(2002) Models for predicting stand development in MELA
system. Finnish Forest Research Institute, Research papers 835,
116 pp
IPCC (2007) Climate change 2007: the physical science basis. In:
Solomon S, Qin D, Manning M, Marquies M, Averyt K, Tignor
MMB, Miller HL (eds) Contribution of working group I to the
fourth assessment report of the intergovernmental panel on
climate change. Cambridge University Press, Cambridge
Jacobson S, Kukkola M, Malkonen E, Tveite B (2000) Impact of
whole-tree harvesting and compensatory fertilization on growth
of coniferous thinning stands. For Ecol Manage 129:41–51
Kaipainen T, Liski J, Pussinen A, Karjalainen T (2004) Managing
carbon sinks by changing rotation length in European forests.
Environ Sci Policy 7:205–219
Karjalainen T (1996) Dynamics and potentials of carbon sequestration
in managed stands and wood products in Finland under changing
climatic conditions. For Ecol Manage 80:113–132
Karjalainen T, Asikainen A (1996) Greenhouse gas emissions from
the use of primary energy in forest operations and long-distance
transportation of timber in Finland. Forestry 69:215–228
Karjalainen T, Asikainen A, Ilavsky J, Zamboni R, Hotari K-E, Roser
D (2004) Estimating of energy wood potential in Europe.
Working papers of the Finnish Forest Research Institute 6, 43 pp
Karkkainen L, Matala J, Harkonen K, Kellomaki S, Nuutinen T
(2008) Potential recovery of industrial wood and energy wood
raw material in different cutting and climate scenarios for
Finland. Biomass Bioenergy 32:934–943
Kellomaki S, Kolstrom M (1994) The influence of climate change on
the productivity of Scots pine, Norway spruce, Pendula birch and
Pubescent birch in southern and northern Finland. For Ecol
Manage 65:201–217
Kellomaki S, Vaisanen H, Hanninen H, Kolstrom T, Lauhanen R,
Mattila U, Pajari B (1992) SIMA: a model for forest succession
based on the carbon and nitrogen cycles with application to
silvicultural management of the forest ecosystem. Silva Carelica
22:1–85
Kellomaki S, Peltola H, Nuutinen T, Korhonen K, Strandman H
(2008) Sensitivity of managed boreal forests in Finland to
666 Eur J Forest Res (2012) 131:655–667
123
climate change, with implications for adaptive management.
Philos Trans R Soc 363:2341–2351
Kilpelainen A, Alam A, Strandman H, Kellomaki S (2011) Life cycle
assessment tool for estimating net CO2 exchange of forest
production. Global Change Biol Bioenergy. doi:10.1111/j.1757-
1707.2011.01101.x
Kirschbaum MUF (2003) To sink or burn? A discussion of the
potential contributions of forests to greenhouse gas balances
through storing carbon or providing biofuels. Biomass Bioenergy
24:297–310
Kolstrom M (1998) Ecological simulation model for studying
diversity of stand structure in boreal forests. Ecol Modell 111:
17–36
Korpilahti A (1998) Finnish forest energy systems and CO2 conse-
quences. Biomass Bioenergy 15:293–297
Kuitto PJ, Keskinen S, Lindroos J, Oijala T, Rajamaki J, Rasanen T,
Terava J (1994) Mechanized cutting and forest haulage. Tiedotus
Metsateho, Helsinki. Report 410, 47 pp (in Finnish with English
summary)
Laitila J, Ala-Fossi A, Vartiamaki T, Ranta T, Asikainen A (2007)
Kantojen noston ja metsakuljetuksen tuottavuus (Productivity of
stump lifting and forest haulage). Metlan tyoraportteja 46:1-26
(in Finnish). http://www.metla.fi/julkaisut/workingpapers/2007/
mwp046.htm. Accessed 25 June 2010
Liski J, Pussinen A, Pingoud K, Makipaa R, Karjalainen T (2001)
Which rotation length is favorable for carbon sequestration? Can
J For Res 31:2004–2013
Maclaren JP (2000) Trees in the greenhouse—the role of forestry in
mitigating the enhanced greenhouse effect. Rotorua, New
Zealand. Forest research bulletin no. 219, 72 pp
Makinen H, Isomaki A (2004a) Thinning intensity and growth of
Scots pine stands in Finland. For Ecol Manage 201:311–325
Makinen H, Isomaki A (2004b) Thinning intensity and growth of
Norway spruce stands in Finland. Forestry 77:349–364
Malkki H, Virtanen Y (2003) Selected emissions and efficiencies of
energy systems based on logging and sawmill residues. Biomass
Bioenergy 24:321–327
Peltola A (2005) Metsatilastollinen vuosikirja (Finnish statistical
yearbook of forestry). Finnish Forest Research Institute, 421 pp
(in Finnish)
Petritsch R, Hasenauer H, Pietsch SA (2007) Incorporating forest
growth response to thinning within biome-BGC. For Ecol
Manage 242:324–336
Pohjola J, Valsta L (2007) Carbon credits and management of Scots
Pine and Norway spruce stands in Finland. For Policy Econ
9:789–798
Profft I, Mund M, Weber G-E, Weller E, Schulze E-D (2009) Forest
management and carbon sequestration in wood product. Eur J
For Res 128:399–413
Pussinen A, Karjalainen T, Makipaa R, Valsta L, Kellomaki S (2002)
Forest carbon sequestration and harvest in Scots pine stand under
different climate and nitrogen deposition scenarios. For Ecol
Manage 158:103–115
Repo A, Tuomi M, Liski J (2010) Indirect carbon dioxide emissions
from producing bioenergy from forest harvest residues. Global
Change Biol Bioenergy. doi:10.1111/j.1757-1707.2010.01065.x
Roser D, Asikainen A, Stupak I, Pasanen K (2008) Forest energy
resources and potentials. In: Roser D, Asikainen A, Raulund-
Rasmussen K, Stupak I (eds) Sustainable use of forest biomass
for energy. Springer, The Netherlands, pp 9–28
Ruota J, Kellomaki S, Peltola H, Asikainen A (2011) Impacts of
thinning and fertilization on timber and energy wood production
in Norway spruce and Scots pine: scenario analyses based on
ecosystem model simulations. Forestry 84(2):159–175
Schlamadinger B, Spitzer J, Kohlmaier GH, Ludeke M (1995) Carbon
balance of bioenergy from logging residues. Biomass Bioenergy
8:221–234
Seely B, Welham C, Kimmins H (2002) Carbon sequestration in a
boreal forest ecosystem: results from the ecosystem simulation
model, FORECAST. For Ecol Manage 169:123–135
Tapio (2006) Hyvan metsanhoidon suositukset (Recommendations
for forest management). Metsatalouden kehittamiskeskus Tapio,
Metsakustannus Oy, 100 pp (in Finnish)
Thornley JHM, Cannell MGR (2000) Managing forests for wood
yield and carbon storage: a theoretical study. Tree Physiol
20:477–484
Vakeva J, Pennanen O, Orn J (2004) Puutavara–autojen polttoaineen
kulutus (Fuel consumption of timber trucks). Metsatehon raportti
166:32 pp (in Finnish)
Wihersaari M (2005) Greenhouse gas emissions from final harvest
fuel chip production in Finland. Biomass Bioenergy 28:435–443
Yoshioka T, Aruga K, Nitami T, Kobayashi H, Sakai H (2005)
Energy and carbon dioxide (CO2) balance of logging residues as
alternative energy resources: system analysis based on the
method of a life cycle inventory (LCI) analysis. J For Res
10:125–134
Eur J Forest Res (2012) 131:655–667 667
123