Embed Size (px)
Citation preview
Agriculture 2020, 10, 457; doi:10.3390/agriculture10100457 www.mdpi.com/journal/agriculture
Article
Impacts of Green Coffee Powder Supplementation on Growth Performance, Carcass Characteristics, Blood Indices, Meat Quality and Gut Microbial Load in Broilers Elwy A. Ashour 1, Mohamed E. Abd El-Hack 1, Manal E. Shafi 2, Wed Y. Alghamdi 2, Ayman E. Taha 3, Ayman A. Swelum 4,5,*, Vincenzo Tufarelli 6,*, Zohair S. Mulla 7, Waleed R. El-Ghareeb 7 and Mohamed T. El-Saadony 8
1 Poultry Department, Faculty of Agriculture, Zagazig University, Zagazig 44111, Egypt; [email protected] (E.A.A.); [email protected] (M.E.A.E.-H.)
2 Department of Biological Sciences, Zoology, King Abdulaziz University, Jeddah 21589, Saudi Arabia; [email protected] (M.E.S.); [email protected] (W.Y.A.)
3 Department of Animal Husbandry and Animal Wealth Development, Faculty of Veterinary Medicine, Alexandria University, Rasheed, Edfina 22758, Egypt; [email protected]
4 Department of Animal Production, College of Food and Agriculture Sciences, King Saud University, P.O. Box 2460, Riyadh 11451, Saudi Arabia
5 Department of Theriogenology, Faculty of Veterinary Medicine, Zagazig University, Zagazig 44511, Egypt 6 Department of DETO, Section of Veterinary Science and Animal Production, University of Bari ‘Aldo
Moro’, 70010 Bari, Italy 7 Department of Public Health, College of Veterinary Medicine, King Faisal University,
Hofuf 31982, Saudi Arabia; [email protected] (Z.S.M.); [email protected] (W.R.E.-G.) 8 Department of Agricultural Microbiology, Faculty of Agriculture, Zagazig University, Zagazig 44511,
Egypt; [email protected] * Correspondence: [email protected] (A.A.S.); [email protected] (V.T.)
Received: 25 July 2020; Accepted: 21 September 2020; Published: 4 October 2020
Abstract: This work investigated the effect of dietary green coffee powder (GCP) on the growth, body characteristics, antioxidant status, serum metabolites, and meat quality of 308 Ross broiler chickens. A total of 180 non-sexed seven-day old chicks were randomly distributed into three experimental groups. The untreated group received a basal diet (control), while the second and third groups were fed the original diet fortified with 1.25 and 2.5 g GCP/kg, respectively, for four weeks. Results revealed an improvement (p < 0.05) in live body weight in the group fed 2.5 g/kg GCP at five weeks of age compared to the other groups. Broiler Chicks fed the 1.25 g/kg GCP diet showed a more significant decrease in live body weight than the control group at five weeks of age. The GCP supplementation at level 2.5 g/kg GCP enhanced feed conversion ratio at 3–5 and 1–5 weeks of age. Dietary treatments did not affect (p > 0.05) carcass, dressing, and giblets percentages. Different levels of GCP significantly affected the liver, abdominal fat, intestinal length, and lymphoid organs percentages. The changes in serum blood traits and serum oxidative stress markers were not significant among the control and the treated groups. With the increment levels of GCP, results showed elevated values of meat pH, lightness (L*), and redness (a*), as well as a significant decrease in its yellowness (b*). Broilers fed 2.5 g/kg GCP diet showed a significant reduction in the total bacterial count, total yeasts and molds count, Escherichia coli, Enterococcus spp., and Salmonella spp., as well as increasing counts of lactic acid bacteria. The dietary GCP 2.5 g/kg diet supplementation could be used to decrease the pathogenic microorganisms’ populations in the broiler’s gut. The present experiment has shown that in unsexed broiler chickens, green
Agriculture 2020, 10, 457 2 of 19
coffee powder at level of 2.5 g/kg improved the live body weight and feed conversion ratio and decreased the pathogenic bacterial count in the gut.
Keywords: broilers; green coffee powder; natural antioxidant; growth; blood metabolites; meat quality; gut microbial load
1. Introduction
The dietary phytogenic additives are plant-derived products used in poultry feed for improving productivity and growth performance of poultry. Researchers have reported several beneficial impacts of plant-derived additives in poultry nutrition, like the enhancement of appetite and improving the feed consumption, stimulating the secretion of the endogenous digestive enzyme, antibacterial, anthelminthic, antiviral properties, and activation of the immune response [1–4]. Various studies confirmed the valuable impacts of additives (Ginger, Cinnamon, black cumin, Moringa, Chicory seeds, Rosmarinus officinalis, peppermint, and thyme) on nutrient utilization, growth performance, and intestinal flora, susceptibility to diseases, immunity function, and carcass quality in poultry [5–10]. Fotina et al. [11] reported that antioxidants play vital roles in poultry feed through improving and keeping antioxidant defenses in their tissues.
Coffee (Coffee arabica L.) is the most favorite drink in the world and considered the second most valuable international product after oil [12–14]. Economically, coffee farming in the world represents about 20 million tons, and more than 100 million people considered coffee as the primary source of their livelihoods. The export value of coffee alone is around 15.4 billion USD in 2009/2010 [15]. The process of coffee bean roasting decreases the amount of chlorogenic acid. Thus, the beans of the green coffee contain a higher chlorogenic acid level compared to those of roasted coffee beans. Chlorogenic acid is thought to have health benefits [16]. It has a potent antioxidant effect in the human body [5] and is capable of slowing glucose absorption in the human gut [10]. Coffee boasts an abundant supply of chlorogenic acid compounds with potent antioxidant and anti-inflammatory effects that may provide many health benefits [17]. Acheson et al. [18] confirmed the beneficial role of caffeine in boosting the metabolic rate in humans within the 3 h after caffeine ingestion.
Similar antioxidants such as green tea had a potent role in the improvement of feed intake, final body weight, and feed efficiency, enhancement of immunity against Newcastle disease and coccidiosis, beside reducing abdominal fat and improving the meat quality of broilers [14].
It is essential to include a novel antioxidant in poultry diets to assess its impact on growth performance, meat quality, and immunity. Thus, the current study evaluated the effects of dietary green coffee powder (GCP) supplementation as natural antioxidants to broiler chicks’ diet on growing and carcass traits, blood metabolites, meat quality, and antimicrobial effects of broiler gut.
2. Materials and Methods
2.1. Materials
Green coffee Seeds were obtained from the local market (Zagazig City, Sharqia Governorate, Egypt). Seeds were lyophilized using a freeze-Dryer (Heto Power Dry LL 300 Freeze Dryer, Thermo-Electron Corporation, Waltham, MA, USA) to stabilize the moisture content for 48 h. The dried seeds were crushed into a fine powder using a blender. The powder was stored at −20 °C in airtight bags until analyses.
Folin & Ciocalteu’s phenol reagent 2,2-diphenyl-1-picryl-hydrazyl-hydrate (DPPH), methanol, ethanol, quercetin, gallic acid, and aluminum chloride (Merck KGaA, Darmstadt, Germany) were used. Pathogenic Gram positive bacteria (G+ bacteria) Bacillus subtilis ATCC 23857, Bacillus cereus ATCC 14579, and Staphylococcus aureus ATCC 25923, besides Gram negative bacteria (G− bacteria) Escherichia coli ATCC 43886, Klebsiella pneumoniae ATCC BAA-1705 and Pseudomonas aeruginosa ATCC 27853, were obtained from Cairo MIRCEN (Ain Shams University, Cairo, Egypt).
Agriculture 2020, 10, 457 3 of 19
2.2. Chemical Characterization of GCP Powder
2.2.1. Sample Preparation
A total of 5 g of GCP were mixed with 70% methanol (100 mL), then stirred for 3 h and filtered by filter paper (Whatman No. 2, Maidstone, UK). Methanol was removed under vacuum from the extract in a BüCHI-rotary evaporator at 45 °C followed by lyophilization using the Heto-Power Dry LL 300 Freeze-Dryer, Waltham, MA, USA. The resulting extract was kept at −20 °C until the following analyses.
2.2.2. Total Phenolic Compounds Estimation
The total phenolic compounds (TPCs) of the methanolic extract (1 mg/mL) acquired from GCP were estimated by Folin–Ciocalteu assay [19]. Gallic acid was diluted in distilled water at several concentrations (10–500 µg/mL) to obtain a standard curve. The gallic acid calibration equation was y = 0.001x + 0.0563 (R2 = 0.9792), where x and y are the gallic acid concentration and absorbance in µg/mL, respectively. The reaction mixture (standard solution or extract 1 mL + 3 mL diluted Folin-Ciocalteu with distilled water 1:10, V/V + sodium carbonate 7.5% (2 mL)) was stirred for the 60 s then kept in the room temperature at the darkness for 30 min. Then, a spectrophotometer (JENWAY, 6405 UV/Vis, UK) was used to record the mixture absorbance at 765 nm. The obtained results were expressed as gallic acid equivalents (GAE) mg/g of extract.
2.2.3. Total Flavonoids Estimation
The methanolic extract’s TFs (1 mg/mL) acquired from GCP were estimated [20,21]. Quercetin was diluted in ethanol at several concentrations (10–500 µg/mL) to obtain a standard curve. Total flavonoids contents stated as quercetin equivalent (QE), which was calculated based on the calibration curve. y = 0.0012x + 0.008 (R2 = 0.944), where y represents the absorbance and x represents the quercetin concentration in µg/mL. The reaction mixture (500 µL from standard solution or extract + 1000 µL of ethanolic AlCl3 solution). The color absorbance was reported by spectrophotometer (JENWAY, 6405 UV/Vis, UK) at 420 nm.
2.2.4. Scavenging Activity Estimation
The antioxidant properties of the methanolic extract acquired from GCP were determined according to their scavenging abilities against ABTS radicals (2,2′-azino-bis (3-ethylbenzothiazoline-6-sulfonic acid)) as previously described [22,23], and DPPH-assay (1,1-diphenyl-2-picrylhydrazyl) [24]. Concisely, 10 mg from each sample were dissolved in 1 mL methanol 70% and then diluted from 2-fold to 10-fold. The absorbance of diluted samples (500 µL) plus 2500 µL (methanolic- ABTS or DPPH solution) was recorded by spectrophotometer (JENWAY, 6405 UV/Vis, UK) at 405 nm (ABTS-assay) and 520 nm (DPPH-assay) after 30 min incubation. The linear regression of curves was used to show the scavenging percentage against sample concentration. The extract concentration that scavenges 50% of the DPPH and ABTS radicals (SC50) was calculated via the curve.
2.3. Chicks, Diets, and Experimental Design
The current work was approved by the ethics of the Institutional Committee of the Poultry Dept., Fac. Agric., Zagazig University, Zagazig City, Egypt. The experimental procedures were performed according to the Local Experimental Animal Care Committee. The ethical approval code is ZU-IACUC/2/F/95/2018. A number of 180 unsexed Ross 308 chicks (seven days old) with initial live body weight (LBW) of 130.11 ± 0.20 g were allotted into three treatment groups; 60 chicks (each group had six pens) as six replicates (ten chicks each). Chicks were bought from commercial hatchery lab at one day old, and acclimation were done at the first week and fed the only basal diet. Chicks were accommodated in a floor litter box (40 × 100 × 100 cm, high, width, and length, separately), covered with wood-shaving materials 5 cm height. Chicks had free access to fresh water
Agriculture 2020, 10, 457 4 of 19
daily. Experimental groups were as follows: G1 (control and received basic diet); G2 (basic diet + 1.25 g GCP/kg diet), and G3 (basal diet + 2.50 g GCP/kg diet). Diets of all treatments were produced in pellet form from one to five weeks of age, each pen supplied with whole litter box/pen for feeding, and the amount of feed calculated daily as the differences between offered and the remaining feed then divided by a number of chicks. Two types of diets were used, namely starter (1–3 weeks of age) and finisher (4–5 weeks of age). The basal diets’ conformation is presented in Table 1.
Table 1. Composition of the basal diets (as fed-basis).
Items Basal Diets
Starter (1–3 Weeks)
Finisher (4–5 Weeks)
Ingredients (%) Soybean meal (44% CP) 31.65 27.15
Gluten meal 6.50 6.1 Yellow corn 57.13 60.53
Vitamin and mineral premix * 0.30 0.3 Ca2HPO4 1.70 1.5
Salt 0.30 0.3 Limestone 1.24 1.15
Vegetable oil 1.00 2.85 L-Lysine hydrochloride 0.13 0.1
DL Methionine 0.05 0.02 Nutrients (%)
Metabolizable Energy (MJ/kg diet) 12.35 12.97 Crude protein 23.00 21.00
Available phosphorous 0.45 0.40 Calcium 1.00 0.90
Methionine + cysteine 0.83 0.74 Lysine 1.20 1.05
* Vitamin and Mineral premix Each 2.5 kg consists of Vit A 12000 IU; Vit D3, 2000 IU; Vit E, 10 g; Vit K3, 2 g; Vit B1, 1000 mg; Vit B2, 49 g; Vit B6, 105 g; Vit B12, 10 mg; Pantothenic acid, 10 g; Niacin, 20 g; Folic acid, 1000 mg; Biotin, 50 g; Choline Chloride, 500 mg; Fe, 30 g; Mn, 40 g; Cu, 3 g; Co, 200 mg; Si, 100 mg and Zn, 45 g.
2.4. Measured Traits
Chicks were wing-banded and individually weighed at weekly basis to the nearest gram by using a digital scale. Body weight gain (BWG) was recorded. Daily feed intake (DFI) and feed conversion ratio (FCR) were calculated. At the end of the experiment (5 weeks of age), twelve chicks were randomly selected from each treatment and were slaughtered for carcass evaluation. The carcasses and internal organs (gizzard, liver, abdominal fat, heart, and lymphoid organs including spleen and bursa) were weighed, recorded, and expressed as a percentage from the broilers’ live weight. Also, carcass and dressing weights were reported as follows: ℎ = ℎ + ℎ ℎ
From the slaughtered broilers, twelve blood samples were collected from each treatment into clean and sterile tubes and were left to coagulate to separate serum samples [25], then stored at −20 °C until analyses. The serum content of urea, creatinine, total protein, and albumin, as well as aspartate aminotransferase (AST), and alanine aminotransferase (ALT) activity were evaluated using the commercially available kits (Bio Diagnostic Co.; Giza, Egypt). Markers of oxidative stress were estimated in the blood serum, including malondialdehyde (MDA), glutathione peroxidase, glutathione-S-transferase and glutathione reduced using kits manufactured by Merck (KGaA, Darmstadt, Germany).

Agriculture 2020, 10, 457 5 of 19
2.5. Breast Meat Quality and Sensory Evaluation
The color of cooked meat was calculated by Wattanachant et al. [26] method using a colorimeter (NR-3000, Nippon Denshoku Ind. Co., Ltd., Osaka, Japan) at three positions of each sample and recorded as L* (lightness), a* (redness), and b* (yellowness). The shear force value was calculated with modifications as per Wattanachant et al. [27] method. Cooked samples were cut into approximately 2 cm pieces for shear analysis (Compac-100 model, Sun Scientific Co., Tokyo, Japan). The crosshead speed was set at 240 mm/min, and a load cell of 10 kg was used. A shear analysis was perpendicularly applied to the axis of muscle fiber, and calculated with 40 replicates per breed. The peak value profile of shear force was reported as the value of shear force.
The 2-thiobarbituric acid test was performed. Lipid oxidation was assessed in triplicates [28]. The pH value of minced meat samples was assessed using a pH meter. Total volatile bases nitrogen (TVBN) was estimated. Meat color measurements of (L*, a* and b*) were evaluated by the color analyzer (Hunter Lab color Flex EZ, USA). The L* value (whiteness (0) to darkness (100) scale), a* expressed (redness (-) to greenness (+)) and b* value observed (yellowness (+) to blueness (-)). Minced meat samples were fully placed into Petri dishes. Then, color attributes were measured by the colorimeter sensor. ∆ ∗ = − ∗ + − ∗ + − ∗
where L*, a*, and b* are control measurements (L* = Lightness, a* = redness and b* = yellowness) and ∆E* is the total color difference in comparison to untreated control.
Sensory evaluation: For the sample preparation, external connective tissue was trimmed after cooking as mentioned above and 2.0 cm long strips were separated from the breast by cutting next to a template parallel to the muscle fibers and then cut into cubes of approximately 2 cm. Each panelist received five cubes put in a ceiling of four once styrofoam cups marked with 3-digit blinding codes [29]. Sensory panel and descriptive sensory assessment: A descriptive sensory assessment was carried out using a variation of the Sow and Grongnet [29] process. The sensory descriptive study consisted of assessing the meat attributes for each of the three phases: Initial suck (phase 1), chew for 10 to 12 bites (phase 2), and swallow (phase 3). The panelists measured attribute strength and graded their responses on a 7-point scale, where 1 = low and 7 = high for attributes of texture and flavour. Meat color (1 = white, 7 = dark) and fibre texture (1 = fine, 7 = coarse) were determined on the cut surfaces of the samples for the appearance of cooked samples. Panelists were given unsalted crackers and mouth-cleaning water between samples [30].
Four sensory characteristics (color, flavor, appearance, and juiciness) were tested at a temperature of 30–35 °C (8 patties/treatment). Eight experienced panelists used eight-point descriptive scales, where eight, extremely desirable, and one, extremely undesirable. Tap water was provided between sessions to alter mouth feel. The number of samples was 6 for each treatment group, while the number of sittings was two. The results were expressed by the mean ± standard error of the mean for eight patties/treatment.
2.6. Antimicrobial Activity
2.6.1. Preparation of Coffee Bean Seed Extract (CBSE)
The green coffee aqueous extract was prepared [31,32]. Preparation of 30% extract was done by percolating 100 mL of pre-boiling (95 °C) sterile water by 40 g of ground coffee. Filter paper was used to filter the extract. After preparation of 40% aqueous extract, further dilution was done using sterile water to obtain concentrations of 30%, 20%, 10%, and 5%.
2.6.2. Antibacterial Activity of Coffee Bean Seed Extract against Six Bacterial Strains
Throughout the experiment, bacterium recovery was performed via sub-culturing. From each bacterium, a tiny inoculum part was mixed with nutrient broth (5 mL) and incubated at 37 °C overnight, and were stored at 4 °C in the nutrient agar slants. The pathogenic bacteria (Bacillus
Agriculture 2020, 10, 457 6 of 19
subtilis ATCC 23857, Bacillus cereus ATCC 14579, Staphylococcus aureus ATCC 25923, Escherichia coli ATCC 43886, Klebsiella pneumoniae ATCC BAA-1705 and Pseudomonas aeruginosa ATCC 27853) were cultured on a Muller Hinton agar plate. The disc diffusion method was used to estimate the antibacterial properties of CBSE [33–35], following the national committee for clinical laboratory standards. After one day of incubation, the inhibition zone was determined at 37 °C. Bactericidal efficacy of CBSE was detected and presented by National Committee for Clinical Laboratory Standards (NCCLS). Subsequently, 0.1 mL of the diluted bacterial culture was extended on the sterile Mueller Hinton Agar (MHA) plate. Enriched Whatman paper discs (six mm) with coffee bean seed extract, which were placed on MHA plates seeded with G− and G+ bacteria [36].
2.6.3 Determination of Minimum Inhibitory Concentration (MIC) and Minimum Bactericidal Concentration (MBC) of Coffee Bean Seed Extract
Luria broth was used in a microdilution method for the determination of minimum inhibitory concentration (MIC) and minimum bactericidal concentration (MBC). An inoculum of 10 mL (2.5 × 10⁵ CFU/mL) from every individual bacterial strain was added to 1 mL of NB. Each tube contained a test strain was supplemented with one of each concentration of coffee bean seed extracts. After incubation for one day, the MIC levels were determined according to the bacterial growth turbidity. The inhibited concentration was 99% of bacterial growth is considered the MIC [36,37]. Additionally, the MBC values of CBSE were estimated following the standard method; then, the MBC esteem was estimated via sub-culturing of the MIC dilutions onto the sterile Muller Hinton agar plates and one day of incubation at 37 °C. The minimum concentration of the CBSE was observed. The value of MBC is equal to the concentration where one hundred percent of the bacterial growth was held and compared to the positive control, which means no treatment. The culture of bacteria without CBSE was used as a control. The whole solution volume used in each flask was 50 mL. The growth of tested bacteria was measured at 620 nm by UV-Vis spectroscopy after every two h and up to 24 h.
2.6.4. Microbial Count
Diet samples were exposed to microbial examination at 0, 5, 10, and 15 d during the starter period; and 0, 5, 10, and 15 d during the finisher period. A stomacher bag contains dietary samples and sterile saline peptone solution 1:10 (w/v) were homogenized for three min. The isolation process was performed according to accepted microbiological methods. Plate count agar was used to estimate the total bacterial count (TBC) after two days of incubation at 30 °C. The total yeasts and molds count (TYMC) were determined on Rose Bengal Chloramphenicol agar at 25 °C for 5 d. Total coliforms were counted according to Harrigen and Mccance-Margart [38] using the MacConkey agar medium. 10 g of broiler caecal from each replicate (5 samples/treatment) were transported to an Erlenmeyer (flask 250 mL) and well-mixed with sterile peptone saline solution (90 mL). Serial dilutions up to 107 were prepared. Enterococcus spp., coliforms and total bacteria were counted according to Sheiha et al. [39] and Reda et al. [40]. Total coliforms were counted according to Richard et al. [41] by MacConkey agar medium. Salmonella spp. was counted according to Edwards and Hilderbrand [42] Black colonies on S.S. agar are typical colonies of Salmonella spp. Molds were also estimated as described by Kurtzman and Fell [43]. Lactic acid bacteria were counted using MRS-medium and MRS-cysteine agar to improve the isolation of lactobacilli and bifidobacteria, respectively as recommended by Argyri et al. [44]. Red colonies in Chromocult® enterococci agar with a diameter of 0.5–2 mm were considered are typical colonies of Enterococcus spp. [45].
2.7. Statistical Analysis
All data were analyzed using SPSS (version 16, USA) software statistical analysis program. The analyses of variances (one-way ANOVA) were performed among the experimental groups. Comparisons among means were made using Tukey test. For the microbiological study, all experiments and analytical measurements were done 3 times. The level of probability is p < 0.05 and means ± standard errors were reported.
Agriculture 2020, 10, 457 7 of 19
3. Results and Discussion
3.1. Chemical Characterization
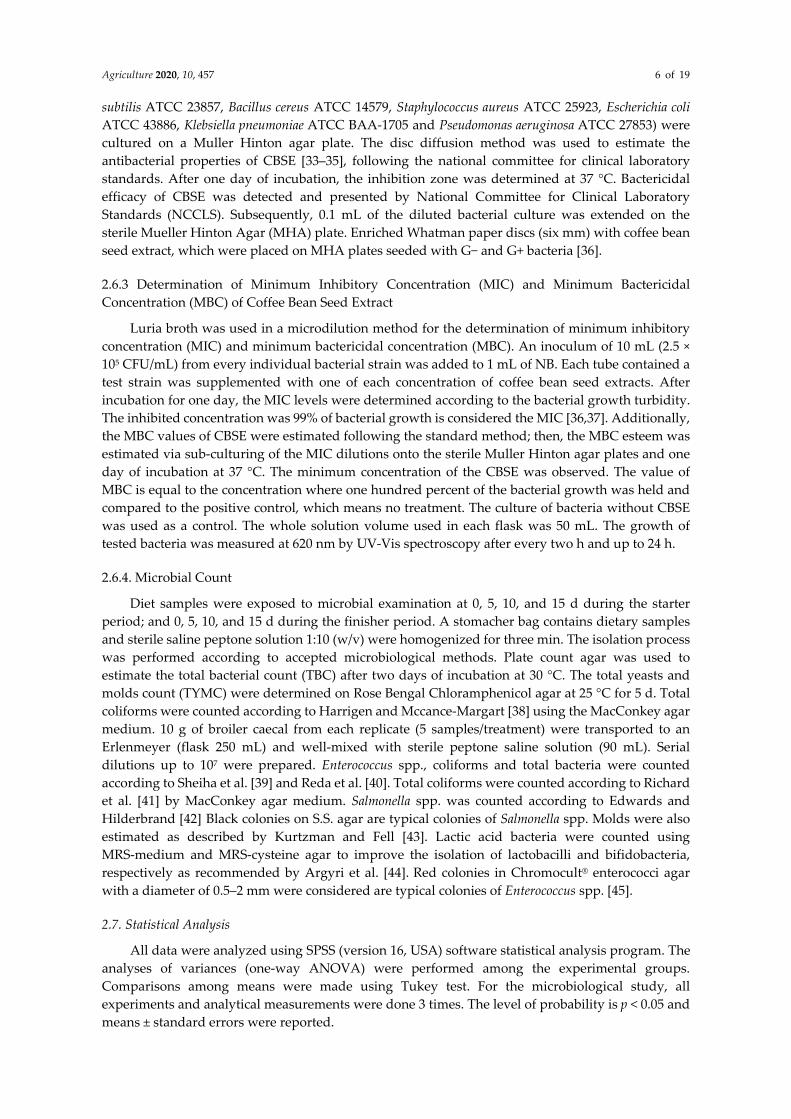
The total phenolic and flavonoid contents of methanolic extract acquired from GCP are presented in Figure 1A. The total phenol amount was 55.4 ± 1.11 mg GAE g−1 extract. While the total amount of flavonoid was 14.2 ± 0.42 mg QE g−1 extract. The antioxidant properties of the methanolic extract acquired from GCP were compared using DPPH and ABTS-radical scavenging activity assay (Figure 1B). The antioxidant efficacy represented as SC50 (µg mL−1) of the extract. Low SC50 values mean high antioxidant properties [46]. In the DPPH-radical scavenging activity assay, the antioxidant properties (SC50) was 60 ± 1.25 µg mL−1. In the ABTS-assay, the SC50 was 26 ± 0.95 µg mL−1. Coffee species include various phytochemicals components such as chlorogenic acids, caffeine, mangiferin, and trigonelline, etc. which make their broad use for health and pharmacological elevating benefits [47]. The seeds content of phenolic compounds is related to their function in the defense process against oxidative injury and for outlook utilize in the synthesis of cell wall-bound phenolic polymers during seedling growth and after seed germination [48]. Coffee seeds are a promising source for dietary antioxidants, and this is attributed to polyphenol aggregation [49].
Figure 1. TPs (mg GAE/g extract) and TFs (mg QE/g extract) contents (A), 2,2′-azino-bis(3-ethylbenzothiazoline-6-sulfonic acid (ABTS) activity (SC50; µg mL−1) and 1,1-diphenyl-2-picrylhydrazyl (DPPH) activity (SC50; µg mL−1) (B) of the methanolic extract acquired from green coffee seeds flour.
3.2. Growth Performance
The supplementation impacts of GCP on broiler’s growth performance from 1–5 weeks of age are presented in Table 2. Results revealed non-significant change in BWG and DFI among experimental treatments during all periods of the trial. LBW with highest levels was noticed in chicks fed GCP at the level of 2.5 g/kg diet at five weeks of age in comparison to those consumed the control diet and broilers supplemented with 1.25 g GCP/kg diet at five weeks of age. Meanwhile, broilers supplemented with 1.25 g GCP/kg diet represented a more significant decrease for LBW than the control group at five weeks of age. This improvement may be due to the existence of the bioactive compounds in GCP that improve digestion and enhance the absorption of nutrients and consequently increase the efficiency of feed utilization. The decrease in body weight of broilers that received 1.25 g GCP/kg diet may be due to the fact that the dose is not enough to produce improvements in body weight, and although uniform managerial procedures between different groups were applied, further investigation with different doses needed
The influences of phytogenic additives as growth promoters can minimize using antibiotic, which cause health problems according to bacterial resistance [50]. The supplementation of feed additives containing antioxidants in chicks’ diets is essential to sustain immune competence, optimum growth rate, and meat quality [11]. Reversely, Cardoso et al. [51] informed that a phyto-additive (piperine) non-significantly affect the growth performance of broiler chickens.
Agriculture 2020, 10, 457 8 of 19
On the other hand, GCP administration statistically p < 0.05 affect FCR at 3–5 weeks and at 1–5 weeks of the experiment. In general, with the increment of GCP level in broiler diets, FCR was improved significantly compared to the control diet. The best FCR was recorded in chicks fed GCP with 2.5 g/kg level, while the least FCR was observed in the control group. Cho et al. [52] claimed that phyto-additives had no significant effects on FCR or feed intake in contradiction to the control group. In contrast, Perić et al. [50] and Scheuermann et al. [53] reported that phytogenic additives’ supplementation could improve the feed consumption in broilers. The promoting mechanism of these additives is not yet precise. This positive effect may be belonged to BWG improvement, as shown in Table 2. Moreover, this improvement may be due to the synergetic effects of phenolic compounds present in GCP. Kohlert et al. [54] confirmed that the phytochemicals in natural additives are absorbed in the intestine by enterocytes and then quickly metabolized by the body of animals. These components promote alterations in membrane permeability, dynamics characteristics, and enhance the cytoskeletal proteins synthesis, resulting in an improvement of the absorptive function of the small intestine [55].
Table 2. Growth performance parameters of broiler chicks as affected by graded levels of dietary green coffee powder supplementation.
Items Green Coffee Powder (g/kg Diet) SEM
n = 6 Replicates p Value
0 1.25 2.5 Live body weight (g)
1 week 129.7 130.3 130.3 0.20 0.332 3 week 822.5 753.2 803.4 9.05 0.049 5 week 1824.3 b 1772.7 c 1840.3 a 11.43 0.036
Body weight gain (g/day) 1–3 week 49.5 44.5 48.1 1.15 0.195 3–5 week 71.6 72.9 74.1 1.32 0.790 1–5 week 60.5 58.7 61.1 0.94 0.615
Daily feed intake (g/day) 1–3 week 63.7 57.8 61.9 1.37 0.215 3–5 week 112.8 112.4 111.3 2.10 0.967 1–5 week 88.2 85.1 86.6 1.13 0.598
Feed conversion ratio (g feed/g gain) 1–3 week 1.29 1.31 1.29 0.03 0.969 3–5 week 1.58 a 1.55 b 1.50 c 0.04 0.027 1–5 week 1.46 a 1.46 a 1.42 b 0.03 0.043
BWG: body weight gain; LBW: live body weight; DFI: daily feed intake; FCR: feed conversion ratio. SEM: standard error of mean. Different letters within one row are significantly different (p < 0.05).
3.3. Carcass Characteristics
At the end of the experimental period, the impact of dietary supplementation of GCP at various levels on carcass traits is shown in Table 3. Results revealed that all carcass traits studied (carcass, dressing, and giblets yields) did not show significant changes (p > 0.05) due to dietary supplementation. The increment of GCP in the broiler diet resulted in a significant increase in liver weight compared to the control group. On the other hand, broilers supplemented with GCP at different levels showed a significant decrease in the intestinal length compared to control ones. Although there is a lack of articles dealt with the effect of GCP on broiler performance including carcass traits, the increased in liver weight may be attributed to the increased metabolic rate of the broilers consumed higher levels of GCP. Broilers received diets supplemented with 2.5 g GCP/kg had the lowest (p < 0.05) levels of abdominal fat in comparison to the control group at five weeks of age, while broilers received 1.25 g GCP/kg diet showed significant increase in abdominal fat percent compared to other treatments. Antioxidants decline the cytosolic malic enzyme activity and lead to depression of the deposition of abdominal fat. Yang et al. [56] and Guray et al. [57] reported that the increment in the level of green tea by-product in the broiler diet resulted in decreased the percentage of abdominal fat. In a partial consistency with the obtained results, Marzoni et al. [58] stated that the natural antioxidant mixture support had no significant impacts on carcass yields in broiler chickens.
Agriculture 2020, 10, 457 9 of 19
Results reported that lymphoid organs (bursa and spleen) were statistically significant (p < 0.05) affected by the dietary GCP supplementation. The group fed the diet at a level of 1.25 g/kg of diet gave the highest value of bursa compared to the control group and the other GCP level.
Table 3. Carcass characteristics of broiler chicks as affected by graded levels of dietary green coffee powder supplementation.
Traits (% of LBW) Green Coffee Powder (g/kg Diet) SEM
n = 12 Replicates p Value
0 1.25 2.5 Carcass 75.40 74.14 75.16 0.46 0.557
Dressing 79.14 78.27 79.19 0.35 0.543 Liver 1.95 c 2.21 b 2.36 a 0.13 0.045
Gizzard 1.25 1.47 1.20 0.07 0.222 Heart 0.54 0.45 0.47 0.03 0.358
Abdominal fat 1.07 b 1.40 a 0.90 c 0.10 0.015 Intestine 4.52 4.87 4.96 0.27 0.829
Intestine length (cm) 88.33 a 81.67 c 85.00 b 2.04 0.041 Lymphoid organs
Spleen 0.08 b 0.14 a 0.13 a 0.01 0.013 Bursa 0.09 b 0.12 a 0.08 b 0.01 0.031
LBW: live body weight. Mean with different letters within one row are significantly different (p < 0.05). SEM: standard error of mean.
3.4. Blood Biochemical Parameters
The health status of the broilers is usually related to biochemical blood parameters. These parameters may represent the nutritional, pathological, and physiological status of the chicks, which reflect the impact of diets supplemented with feed additives. The changes in levels of serum content of urea, creatinine, total albumin, and protein besides AST and ALT activities in broiler chicks administrated GCP were non-significant compared to the control group (Table 4). Non-significant differences in blood biochemical parameters of broilers supplemented with antioxidants, such as selenium and vitamin E, were recorded by Swain and Johri [59] and Biswas et al. [60].
The effect of GCP supplementation on the oxidative stress markers of the blood is demonstrated in Table 5. The fluctuations in lipid peroxidation (MDA), glutathione peroxidase, glutathione-S-transferase, and glutathione levels reduced in broiler chicks administrated to levels of green coffee powder were not significantly affected against the control.
Table 4. The effect of green coffee supplementation of serum biochemical parameters of broiler chicks at two levels (1.25 and 2.5 g GCP/Kg diet) compared to control.
Traits Green Coffee Powder (g/kg Diet) SEM
n = 12 Replicates p Value 0 1.25 2.5
Total protein (mg/dL) 6.40 6.47 6.30 0.04 0.664 Albumin (mg/dL) 3.23 3.54 3.31 0.11 0.584 Globulin (mg/dL) 3.17 2.93 2.99 0.10 0.982 A/G ratio 1.03 1.27 1.10 0.08 0.867 ALT (IU/L) 11.50 9.87 11.08 0.30 0.475 AST (IU/L) 122.67 124.00 119.00 0.98 0.188 Urea (mg/dL) 43.67 38.33 35.33 1.23 0.123 Creatinine (mg/dL) 0.53 0.54 0.64 0.02 0.167
A/G: Albumin/Globulin; ALT: alanine aminotransferase; AST: aspartate aminotransferase. SEM: standard of error mean.
Agriculture 2020, 10, 457 10 of 19
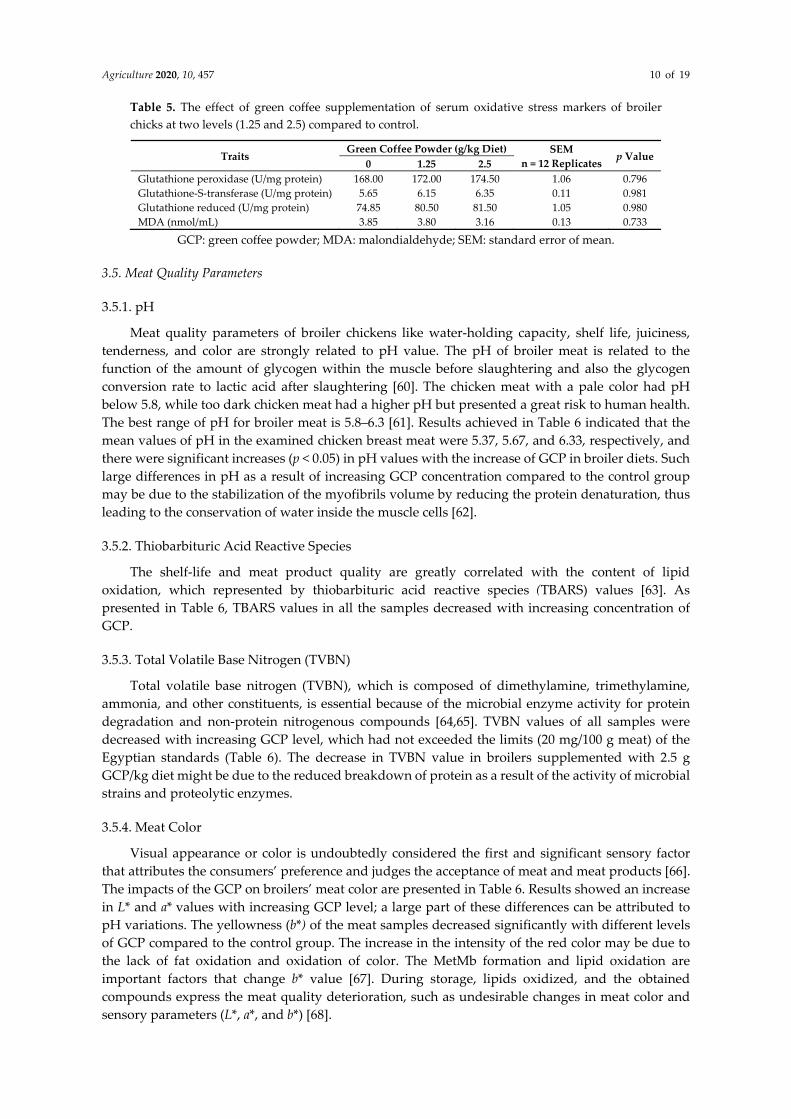
Table 5. The effect of green coffee supplementation of serum oxidative stress markers of broiler chicks at two levels (1.25 and 2.5) compared to control.
Traits Green Coffee Powder (g/kg Diet) SEM
n = 12 Replicates p Value
0 1.25 2.5 Glutathione peroxidase (U/mg protein) 168.00 172.00 174.50 1.06 0.796 Glutathione-S-transferase (U/mg protein) 5.65 6.15 6.35 0.11 0.981 Glutathione reduced (U/mg protein) 74.85 80.50 81.50 1.05 0.980 MDA (nmol/mL) 3.85 3.80 3.16 0.13 0.733
GCP: green coffee powder; MDA: malondialdehyde; SEM: standard error of mean.
3.5. Meat Quality Parameters
3.5.1. pH
Meat quality parameters of broiler chickens like water-holding capacity, shelf life, juiciness, tenderness, and color are strongly related to pH value. The pH of broiler meat is related to the function of the amount of glycogen within the muscle before slaughtering and also the glycogen conversion rate to lactic acid after slaughtering [60]. The chicken meat with a pale color had pH below 5.8, while too dark chicken meat had a higher pH but presented a great risk to human health. The best range of pH for broiler meat is 5.8–6.3 [61]. Results achieved in Table 6 indicated that the mean values of pH in the examined chicken breast meat were 5.37, 5.67, and 6.33, respectively, and there were significant increases (p < 0.05) in pH values with the increase of GCP in broiler diets. Such large differences in pH as a result of increasing GCP concentration compared to the control group may be due to the stabilization of the myofibrils volume by reducing the protein denaturation, thus leading to the conservation of water inside the muscle cells [62].
3.5.2. Thiobarbituric Acid Reactive Species
The shelf-life and meat product quality are greatly correlated with the content of lipid oxidation, which represented by thiobarbituric acid reactive species (TBARS) values [63]. As presented in Table 6, TBARS values in all the samples decreased with increasing concentration of GCP.
3.5.3. Total Volatile Base Nitrogen (TVBN)
Total volatile base nitrogen (TVBN), which is composed of dimethylamine, trimethylamine, ammonia, and other constituents, is essential because of the microbial enzyme activity for protein degradation and non-protein nitrogenous compounds [64,65]. TVBN values of all samples were decreased with increasing GCP level, which had not exceeded the limits (20 mg/100 g meat) of the Egyptian standards (Table 6). The decrease in TVBN value in broilers supplemented with 2.5 g GCP/kg diet might be due to the reduced breakdown of protein as a result of the activity of microbial strains and proteolytic enzymes.
3.5.4. Meat Color
Visual appearance or color is undoubtedly considered the first and significant sensory factor that attributes the consumers’ preference and judges the acceptance of meat and meat products [66]. The impacts of the GCP on broilers’ meat color are presented in Table 6. Results showed an increase in L* and a* values with increasing GCP level; a large part of these differences can be attributed to pH variations. The yellowness (b*) of the meat samples decreased significantly with different levels of GCP compared to the control group. The increase in the intensity of the red color may be due to the lack of fat oxidation and oxidation of color. The MetMb formation and lipid oxidation are important factors that change b* value [67]. During storage, lipids oxidized, and the obtained compounds express the meat quality deterioration, such as undesirable changes in meat color and sensory parameters (L*, a*, and b*) [68].
Agriculture 2020, 10, 457 11 of 19
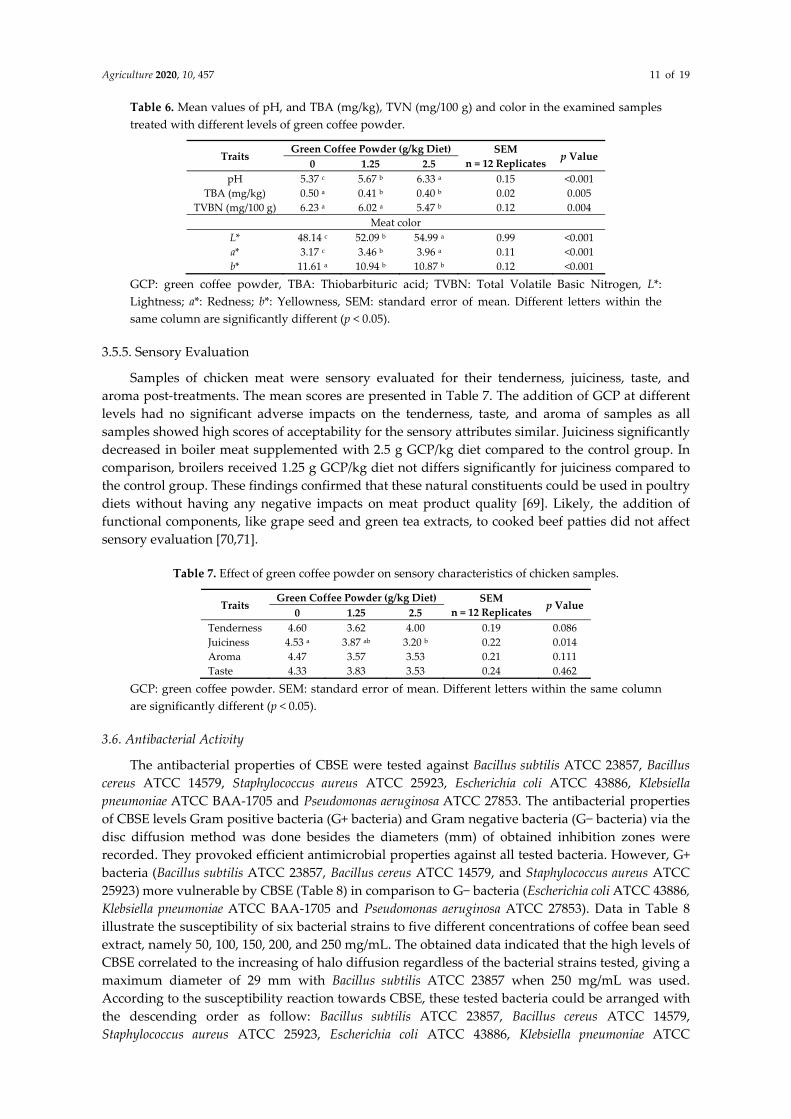
Table 6. Mean values of pH, and TBA (mg/kg), TVN (mg/100 g) and color in the examined samples treated with different levels of green coffee powder.
Traits Green Coffee Powder (g/kg Diet) SEM
n = 12 Replicates p Value
0 1.25 2.5 pH 5.37 c 5.67 b 6.33 a 0.15 <0.001
TBA (mg/kg) 0.50 a 0.41 b 0.40 b 0.02 0.005 TVBN (mg/100 g) 6.23 a 6.02 a 5.47 b 0.12 0.004
Meat color L* 48.14 c 52.09 b 54.99 a 0.99 <0.001 a* 3.17 c 3.46 b 3.96 a 0.11 <0.001 b* 11.61 a 10.94 b 10.87 b 0.12 <0.001
GCP: green coffee powder, TBA: Thiobarbituric acid; TVBN: Total Volatile Basic Nitrogen, L*: Lightness; a*: Redness; b*: Yellowness, SEM: standard error of mean. Different letters within the same column are significantly different (p < 0.05).
3.5.5. Sensory Evaluation
Samples of chicken meat were sensory evaluated for their tenderness, juiciness, taste, and aroma post-treatments. The mean scores are presented in Table 7. The addition of GCP at different levels had no significant adverse impacts on the tenderness, taste, and aroma of samples as all samples showed high scores of acceptability for the sensory attributes similar. Juiciness significantly decreased in boiler meat supplemented with 2.5 g GCP/kg diet compared to the control group. In comparison, broilers received 1.25 g GCP/kg diet not differs significantly for juiciness compared to the control group. These findings confirmed that these natural constituents could be used in poultry diets without having any negative impacts on meat product quality [69]. Likely, the addition of functional components, like grape seed and green tea extracts, to cooked beef patties did not affect sensory evaluation [70,71].
Table 7. Effect of green coffee powder on sensory characteristics of chicken samples.
Traits Green Coffee Powder (g/kg Diet) SEM
n = 12 Replicates p Value 0 1.25 2.5
Tenderness 4.60 3.62 4.00 0.19 0.086 Juiciness 4.53 a 3.87 ab 3.20 b 0.22 0.014 Aroma 4.47 3.57 3.53 0.21 0.111 Taste 4.33 3.83 3.53 0.24 0.462
GCP: green coffee powder. SEM: standard error of mean. Different letters within the same column are significantly different (p < 0.05).
3.6. Antibacterial Activity
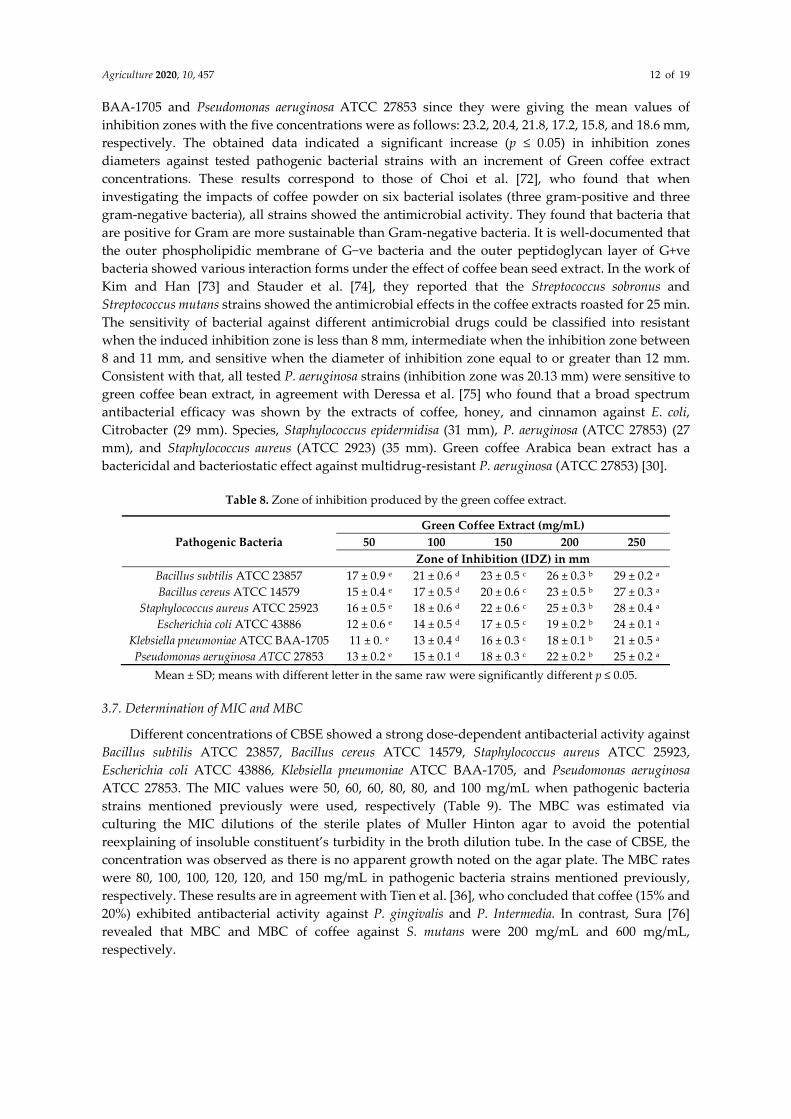
The antibacterial properties of CBSE were tested against Bacillus subtilis ATCC 23857, Bacillus cereus ATCC 14579, Staphylococcus aureus ATCC 25923, Escherichia coli ATCC 43886, Klebsiella pneumoniae ATCC BAA-1705 and Pseudomonas aeruginosa ATCC 27853. The antibacterial properties of CBSE levels Gram positive bacteria (G+ bacteria) and Gram negative bacteria (G− bacteria) via the disc diffusion method was done besides the diameters (mm) of obtained inhibition zones were recorded. They provoked efficient antimicrobial properties against all tested bacteria. However, G+ bacteria (Bacillus subtilis ATCC 23857, Bacillus cereus ATCC 14579, and Staphylococcus aureus ATCC 25923) more vulnerable by CBSE (Table 8) in comparison to G− bacteria (Escherichia coli ATCC 43886, Klebsiella pneumoniae ATCC BAA-1705 and Pseudomonas aeruginosa ATCC 27853). Data in Table 8 illustrate the susceptibility of six bacterial strains to five different concentrations of coffee bean seed extract, namely 50, 100, 150, 200, and 250 mg/mL. The obtained data indicated that the high levels of CBSE correlated to the increasing of halo diffusion regardless of the bacterial strains tested, giving a maximum diameter of 29 mm with Bacillus subtilis ATCC 23857 when 250 mg/mL was used. According to the susceptibility reaction towards CBSE, these tested bacteria could be arranged with the descending order as follow: Bacillus subtilis ATCC 23857, Bacillus cereus ATCC 14579, Staphylococcus aureus ATCC 25923, Escherichia coli ATCC 43886, Klebsiella pneumoniae ATCC
Agriculture 2020, 10, 457 12 of 19
BAA-1705 and Pseudomonas aeruginosa ATCC 27853 since they were giving the mean values of inhibition zones with the five concentrations were as follows: 23.2, 20.4, 21.8, 17.2, 15.8, and 18.6 mm, respectively. The obtained data indicated a significant increase (p ≤ 0.05) in inhibition zones diameters against tested pathogenic bacterial strains with an increment of Green coffee extract concentrations. These results correspond to those of Choi et al. [72], who found that when investigating the impacts of coffee powder on six bacterial isolates (three gram-positive and three gram-negative bacteria), all strains showed the antimicrobial activity. They found that bacteria that are positive for Gram are more sustainable than Gram-negative bacteria. It is well-documented that the outer phospholipidic membrane of G−ve bacteria and the outer peptidoglycan layer of G+ve bacteria showed various interaction forms under the effect of coffee bean seed extract. In the work of Kim and Han [73] and Stauder et al. [74], they reported that the Streptococcus sobronus and Streptococcus mutans strains showed the antimicrobial effects in the coffee extracts roasted for 25 min. The sensitivity of bacterial against different antimicrobial drugs could be classified into resistant when the induced inhibition zone is less than 8 mm, intermediate when the inhibition zone between 8 and 11 mm, and sensitive when the diameter of inhibition zone equal to or greater than 12 mm. Consistent with that, all tested P. aeruginosa strains (inhibition zone was 20.13 mm) were sensitive to green coffee bean extract, in agreement with Deressa et al. [75] who found that a broad spectrum antibacterial efficacy was shown by the extracts of coffee, honey, and cinnamon against E. coli, Citrobacter (29 mm). Species, Staphylococcus epidermidisa (31 mm), P. aeruginosa (ATCC 27853) (27 mm), and Staphylococcus aureus (ATCC 2923) (35 mm). Green coffee Arabica bean extract has a bactericidal and bacteriostatic effect against multidrug-resistant P. aeruginosa (ATCC 27853) [30].
Table 8. Zone of inhibition produced by the green coffee extract.
Pathogenic Bacteria Green Coffee Extract (mg/mL)
50 100 150 200 250 Zone of Inhibition (IDZ) in mm
Bacillus subtilis ATCC 23857 17 ± 0.9 e 21 ± 0.6 d 23 ± 0.5 c 26 ± 0.3 b 29 ± 0.2 a Bacillus cereus ATCC 14579 15 ± 0.4 e 17 ± 0.5 d 20 ± 0.6 c 23 ± 0.5 b 27 ± 0.3 a
Staphylococcus aureus ATCC 25923 16 ± 0.5 e 18 ± 0.6 d 22 ± 0.6 c 25 ± 0.3 b 28 ± 0.4 a Escherichia coli ATCC 43886 12 ± 0.6 e 14 ± 0.5 d 17 ± 0.5 c 19 ± 0.2 b 24 ± 0.1 a
Klebsiella pneumoniae ATCC BAA-1705 11 ± 0. e 13 ± 0.4 d 16 ± 0.3 c 18 ± 0.1 b 21 ± 0.5 a Pseudomonas aeruginosa ATCC 27853 13 ± 0.2 e 15 ± 0.1 d 18 ± 0.3 c 22 ± 0.2 b 25 ± 0.2 a
Mean ± SD; means with different letter in the same raw were significantly different p ≤ 0.05.
3.7. Determination of MIC and MBC
Different concentrations of CBSE showed a strong dose-dependent antibacterial activity against Bacillus subtilis ATCC 23857, Bacillus cereus ATCC 14579, Staphylococcus aureus ATCC 25923, Escherichia coli ATCC 43886, Klebsiella pneumoniae ATCC BAA-1705, and Pseudomonas aeruginosa ATCC 27853. The MIC values were 50, 60, 60, 80, 80, and 100 mg/mL when pathogenic bacteria strains mentioned previously were used, respectively (Table 9). The MBC was estimated via culturing the MIC dilutions of the sterile plates of Muller Hinton agar to avoid the potential reexplaining of insoluble constituent’s turbidity in the broth dilution tube. In the case of CBSE, the concentration was observed as there is no apparent growth noted on the agar plate. The MBC rates were 80, 100, 100, 120, 120, and 150 mg/mL in pathogenic bacteria strains mentioned previously, respectively. These results are in agreement with Tien et al. [36], who concluded that coffee (15% and 20%) exhibited antibacterial activity against P. gingivalis and P. Intermedia. In contrast, Sura [76] revealed that MBC and MBC of coffee against S. mutans were 200 mg/mL and 600 mg/mL, respectively.
Agriculture 2020, 10, 457 13 of 19
Table 9. MIC and MBC of the green coffee extract against six types of pathogenic bacteria.
Pathogenic Bacteria Green Coffee Extract (mg/mL)
MIC µg/mL MBC µg/mL Bacillus subtilis ATCC 23857 50 d 80 d Bacillus cereus ATCC 14579 60 c 100 c
Staphylococcus aureus ATCC 25923 60 c 100 c Escherichia coli ATCC 43886 80 b 120 b
Klebsiella pneumoniae ATCC BAA-1705 80 b 120 b Pseudomonas aeruginosa ATCC 27853 100 a 150 a
Means with different letter in the same column were significantly different p ≤ 0.05.
3.8. Impacts of the Coffee Extract on Microbial Count
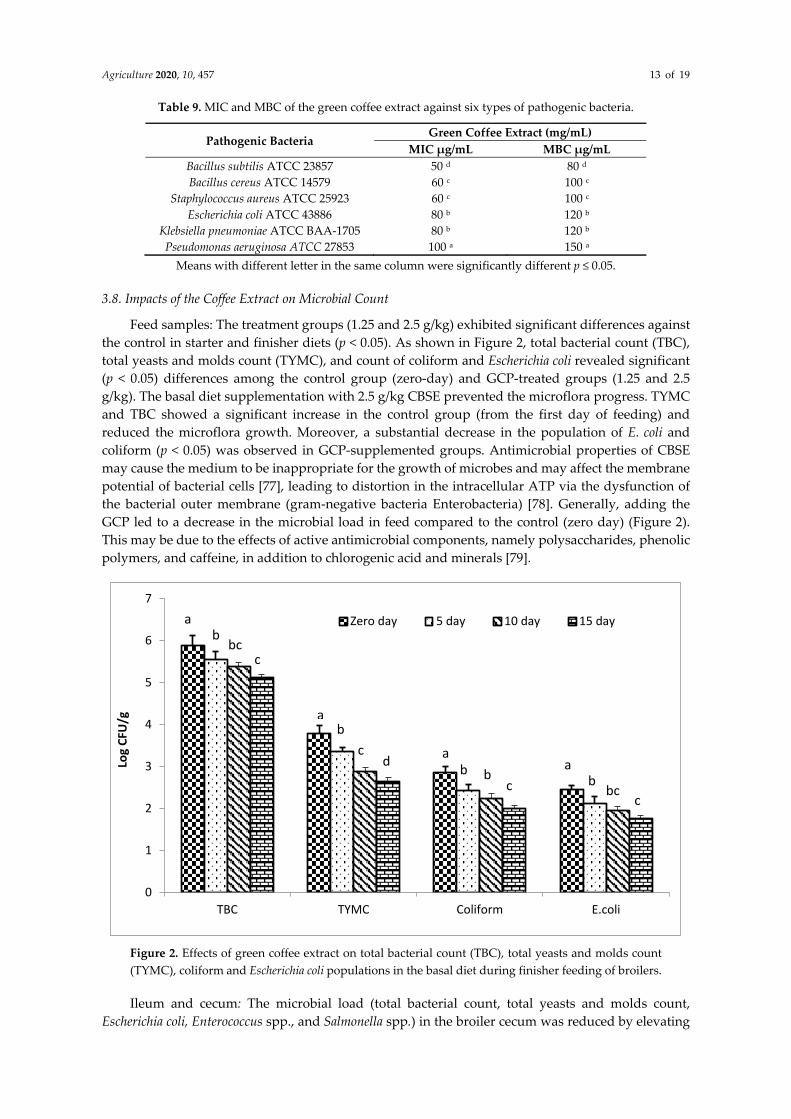
Feed samples: The treatment groups (1.25 and 2.5 g/kg) exhibited significant differences against the control in starter and finisher diets (p < 0.05). As shown in Figure 2, total bacterial count (TBC), total yeasts and molds count (TYMC), and count of coliform and Escherichia coli revealed significant (p < 0.05) differences among the control group (zero-day) and GCP-treated groups (1.25 and 2.5 g/kg). The basal diet supplementation with 2.5 g/kg CBSE prevented the microflora progress. TYMC and TBC showed a significant increase in the control group (from the first day of feeding) and reduced the microflora growth. Moreover, a substantial decrease in the population of E. coli and coliform (p < 0.05) was observed in GCP-supplemented groups. Antimicrobial properties of CBSE may cause the medium to be inappropriate for the growth of microbes and may affect the membrane potential of bacterial cells [77], leading to distortion in the intracellular ATP via the dysfunction of the bacterial outer membrane (gram-negative bacteria Enterobacteria) [78]. Generally, adding the GCP led to a decrease in the microbial load in feed compared to the control (zero day) (Figure 2). This may be due to the effects of active antimicrobial components, namely polysaccharides, phenolic polymers, and caffeine, in addition to chlorogenic acid and minerals [79].
Figure 2. Effects of green coffee extract on total bacterial count (TBC), total yeasts and molds count (TYMC), coliform and Escherichia coli populations in the basal diet during finisher feeding of broilers.
Ileum and cecum: The microbial load (total bacterial count, total yeasts and molds count, Escherichia coli, Enterococcus spp., and Salmonella spp.) in the broiler cecum was reduced by elevating
0
1
2
3
4
5
6
7
TBC TYMC Coliform E.coli
Log
CFU
/g
Zero day 5 day 10 day 15 dayab
c
bc
d ab b
c
bc
ab
bcc
a
Agriculture 2020, 10, 457 14 of 19
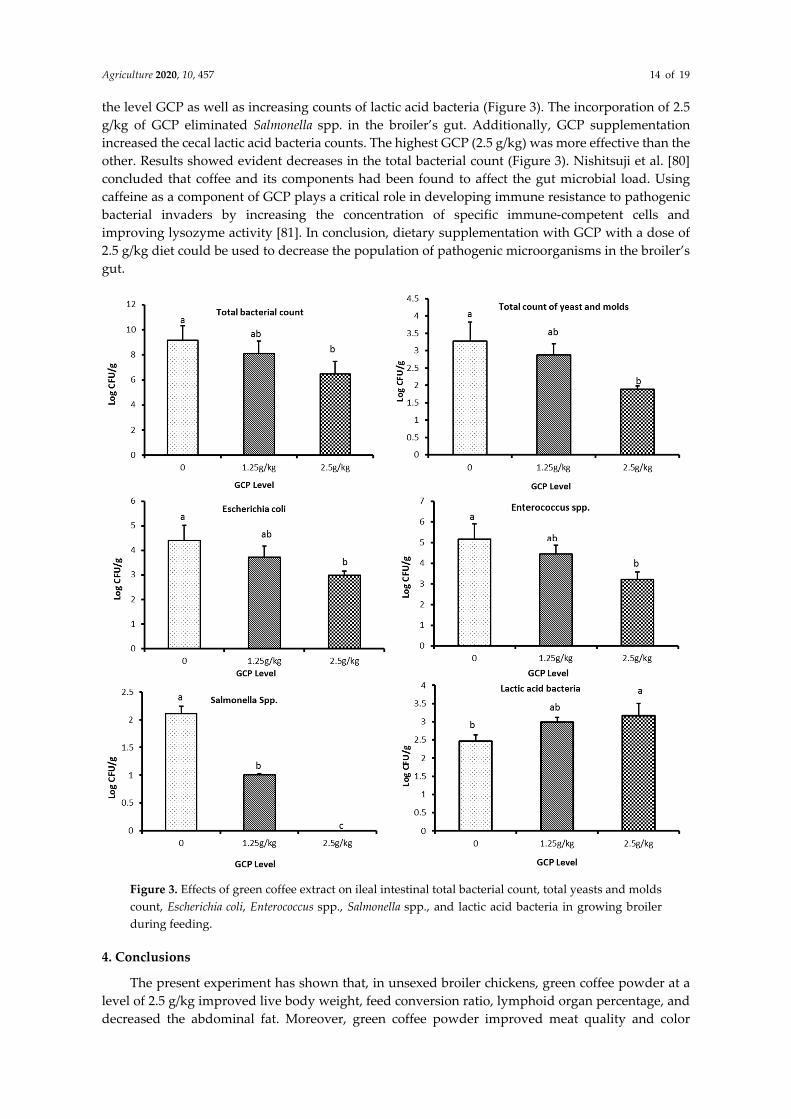
the level GCP as well as increasing counts of lactic acid bacteria (Figure 3). The incorporation of 2.5 g/kg of GCP eliminated Salmonella spp. in the broiler’s gut. Additionally, GCP supplementation increased the cecal lactic acid bacteria counts. The highest GCP (2.5 g/kg) was more effective than the other. Results showed evident decreases in the total bacterial count (Figure 3). Nishitsuji et al. [80] concluded that coffee and its components had been found to affect the gut microbial load. Using caffeine as a component of GCP plays a critical role in developing immune resistance to pathogenic bacterial invaders by increasing the concentration of specific immune-competent cells and improving lysozyme activity [81]. In conclusion, dietary supplementation with GCP with a dose of 2.5 g/kg diet could be used to decrease the population of pathogenic microorganisms in the broiler’s gut.
Figure 3. Effects of green coffee extract on ileal intestinal total bacterial count, total yeasts and molds count, Escherichia coli, Enterococcus spp., Salmonella spp., and lactic acid bacteria in growing broiler during feeding.
4. Conclusions
The present experiment has shown that, in unsexed broiler chickens, green coffee powder at a level of 2.5 g/kg improved live body weight, feed conversion ratio, lymphoid organ percentage, and decreased the abdominal fat. Moreover, green coffee powder improved meat quality and color
Agriculture 2020, 10, 457 15 of 19
parameters and minimized the pathogenic microorganisms’ populations in the gut. It is worth noting that the level of 1.25 g/kg green coffee powder diet showed some adverse effects on broilers. We recommend further investigation of different doses and other related parameters such as the economic efficiency of using such new additive in poultry diets.
Author Contributions: E.A.A. and M.E.A.E.-H. conceived, designed and performed the experiments; M.E.A.E.-H. and A.E.T. analyzed the data; M.T.E.-S., A.A.S., M.E.S., W.Y.A. and A.E.T. contributed to analysis tools; M.E.A.E.-H., Z.S.M., W.R.E.-G., M.T.E.-S., V.T., and A.E.T. wrote the paper. All authors have read and agreed to the published version of the manuscript.
Funding: This research was funded by the Deputyship for Research & Innovation, “Ministry of Education” in Saudi Arabia through the project number IFKSU-RG1442-002.
Acknowledgments: The authors extend their appreciation to the Deputyship for Research & Innovation, “Ministry of Education” in Saudi Arabia for funding this research work through the project number IFKSU-RG1442-002.
Conflicts of Interest: All authors declare that they do not have any conflicts of interest that could inappropriately influence this manuscript.
References
1. Alagawany, M.; Elnesr, S.S.; Farag, M.R.; Abd El-Hack, M.E.; Khafaga, A.F.; Taha, A.E.; Tiwari, R.; Yatoo, M.; Bhatt, P.; Marappan, G.; et al. Use of licorice (Glycyrrhiza glabra) herb as a feed additive in poultry: Current knowledge and prospects. Animal 2019, 8, 536.
2. Alagawany, M.; Elnesr, S.S.; Farag, M.R.; Abd El-Hack, M.E.; Khafaga, A.F.; Taha, A.E.; Tiwari, R.; Yatoo, M.; Bhatt, P.; Khurana, S.K.; et al. Omega-3 and Omega-6 fatty acids in poultry nutrition: Effect on production performance and health. Animal 2019, 8, 593.
3. Abd El-Hack, M.E.; Abdelnour, S.A.; Taha, A.E.; Khafaga, A.F.; Arif, M.; Ayasan, T.; Abdel-Daim, M.M. Herbs as thermoregulatory agents in poultry: An overview. Sci. Total Environ. 2019, 703, 134399 .
4. Abd El-Hack, E.M.; Mahrose, K.M.; Attia, F.A.M.; Swelum, A.A.; Taha, A.E.; Shewita, R.S.; Hussein, E.O.S.; Alowaimer, A.N. Laying performance, physical, and internal egg quality criteria of hens fed distillers dried grains with solubles and exogenous enzyme mixture. Animals 2019, 9, 150.
5. Abd El-Hack, E.M.; Alagawany, M.; Shaheen, H.; Samak, D.; Othman, S.I.; Allam, A.A.; Taha, A.E.; Khafaga, A.F.; Arif, M.; Osman, A.; et al. Ginger and its derivatives as promising alternatives to antibiotics in poultry feed. Animals 2020, 10, 452.
6. Abd El-Hack, M.E.; Alagawany, M.; Abdel-Moneim, A.E.; Mohammed, N.G.; Khafaga, A.F.; Bin-Jumah, M.; Othman, S.I.; Allam, A.A.; Elnesr, S.S. cinnamon (Cinnamomum zeylanicum) oil as a potential alternative to antibiotics in poultry. Antibiotic 2020, 9, 210.
7. Gado, A.R.; Ellakany, H.F.; Elbestawy, A.R.; Abd El-Hack, M.E.; Khafaga, A.F.; Taha, A.E.; Mahgoub, S.A. Herbal medicine additives as powerful agents to control and prevent avian influenza virus in poultry—A review. Ann. Anim. Sci. 2019, 19, 905–935.
8. Arif, M.; Hayat, Z.; Abd El-Hack, M.E.; Saeed, M.; Imran, H.M.; Alowaimer, A.N.; Saadeldin, I.M.; Taha, A.E.; Swelum, A.A. Impacts of supplementing broiler diets with a powder mixture of black cumin, Moringa and chicory seeds. S. Afr. J. Anim. Sci.2019, 49, 564–572.
9. Mahgoub, S.A.M.; Abd El-Hack, M.E.; Saadeldin, I.M.; Hussein, M.A.; Swelum, A.A.; Alagawany, M. Impact of Rosmarinus officinalis cold-pressed oil on health, growth performance, intestinal bacterial populations, and immunocompetence of Japanese quail. Poult. Sci. 2019, 98, 2139–2149.
10. Ocak, N.; Erener, G.; Burak, A.K.F.; Sungu, M.; Altop, A.; Ozmen, A. Performance of broilers fed diets supplemented with dry peppermint (Mentha piperita L.) or thyme (Thymus vulgaris L.) leaves as growth promoter source. Czech J. Anim. Sci. 2008, 53, 69-175.
11. Fotina, A.A.; Fisinin, V.I.; Surai, P.F. Recent developments in usage of natural antioxidants to improve chicken meat production and quality. Bulg. J. Agric. Sci. 2013, 19, 889–896.
12. Taha, A.E.; Hassan, S.S.; Shewita, R.S.; El-seidy, A.A.; Abd El-Hack, M.E.; Hussein, E.S.O.; El-Edel, M.A. Effects of supplementing broiler diets with coriander seed powder on growth performance, blood haematology, ileum microflora and economic efficiency. J. Anim. Aphysiol. Anim. Nutr. 2019, 103, 1474–1483.
Agriculture 2020, 10, 457 16 of 19
13. Ashour, E.A.; Bin-Jumah, M.; Abou Sayed-Ahmed, E.T.; Osman, A.O.; Taha, A.E.; Momenah, M.A.; Abd El-Hack, M.E. Effects of dried okra fruit (Abelmoschus esculentus L.) powder on growth, carcass characteristics, blood indices, and meat quality of stored broiler meat. Poult. Sci. 2020, 99, 3060–3069.
14. Osman, A.; Bin-Jumah, M.; Abd El-Hack, M.E.; Elaraby, G.; Swelum, A.A.; Taha, A.E.; Ashour, E.A. Dietary supplementation of soybean glycinin can alter the growth, carcass traits, blood biochemical indices, and meat quality of broilers. Poult. Sci. 2020, 99, 820–828.
15. Davis, A.P.; Tosh, J.; Ruch, N.; Fay, M. Growing coffee: On the bases of plastid and nuclear DNA sequences; implication for the size, morphology, distribution and evolutionary history of coffee. Bot. J. Linn. Soc. 2011, 167, 357–377.
16. Moon, J.K.; Yoo, H.S.; Shibamoto, T. Role of roasting conditions in the level of chlorogenic acid content in coffee beans: Correlation with coffee acidity. J. Agric. Food Chem. 2009, 57, 5365–5369.
17. Liang, N.; Kitts, D.D. Role of chlorogenic acids in controlling oxidative and inflammatory stress conditions. Nutrients 2016, 8, 16.
18. Acheson, K.J.; Zahorska-Markiewicz, B.; Pittet, P.; Anantharaman, K.; Jéquier, E. Caffeine and coffee: Their influence on metabolic rate and substrate utilization in normal weight and obese individuals. Am. J. Clin. Nutr. 1980, 33, 989–997.
19. Singleton, V.L.; Orthofer, R.; Lamuela-Raventós, R.M. Analysis of total phenols and other oxidation substrates and antioxidants by means of folin-ciocalteu reagent. Methods Enzymol. 1999, 299, 152–178.
20. Ordonez, A.; Gomez, J.; Vattuone, M. Antioxidant activities of Sechium edule (Jacq.) Swartz extracts. Food Chem. 2006, 97, 452–458.
21. Abdel-Shafi, S.; Al-Mohammadi, A.-R.; Sitohy, M.; Mosa, B.; Ismaiel, A.; Enan, G.; Osman, A. Antimicrobial activity and chemical constitution of the crude, phenolic-rich extracts of Hibiscus sabdariffa, Brassica oleracea and Beta vulgaris. Molecules 2019, 24, 4280.
22. De Gobba, C.; Tompa, G.; Otte, J. Bioactive peptides from caseins released by cold active proteolytic enzymes from Arsukibacterium ikkense. Food Chem. 2014, 165, 205–215.
23. Abdel-Hamid, M.; Otte, J.;De Gobba, C.; Osman, A.; Hamad, E. Angiotensin I-converting enzyme inhibitory activity and antioxidant capacity of bioactive peptides derived from enzymatic hydrolysis of buffalo milk proteins. Int. Dairy J. 2017, 66, 91–98.
24. Osman, A.; Mahgoub, S.; Sitohy, M. Hindering milk quality storage deterioration by mild thermization combined with methylated chickpea protein. Int. Food Res. J. 2014, 21, 693–701.
25. Sitohy, M.; Osman, A.; Gharib, A.; Chobert, J.-M.; Haertlé, T. Preliminary assessment of potential toxicity of methylated soybean protein and methylated β-lactoglobulin in male Wistar rats. Food Chem. Toxic. 2013, 59, 618–625.
26. Wattanachant, S.; Benjakul, S.; Ledward, D.A. Microstructure and thermal characteristics of Thai indigenous and broiler chicken muscles. Poult. Sci. 2005, 84, 328–336.
27. Wattanachant, S.; Benjakul, S.; Ledward, D.A. Composition, color, and texture of Thai indigenous and broiler chicken muscles. Poult. Sci. 2004, 83, 123–128.
28. Fermandez-Lopez, J.; Zhi, N.; Aleson-Carbonell, L.; Pérez-Alvarez, J.A.; Kuri, V. Antioxidant and antibacterial activities of natural extracts: Application in beef meatball. Meat Sci. 2005, 69, 371–380.
29. Sow, T.M.A.; Grongnet, J.F. Sensory characteristics and consumer reference for chicken meat in Guinea. Poult. Sci. 2010, 89, 2281–2292.
30. Zhuang, H.; Savage, E.M. Effect of postmortem deboning time on sensory descriptive flavor and texture profiles of cooked boneless skinless broiler thighs. Food Sci. Technol. 2011, 44, 2087–2090.
31. Antonio, A.G.; Iorio, N.L.P.; Pierro, V.S.S.; Candreva, M.S.; Farah, A.; Dos Santos, K.R.N.; Maia, L.C. Inhibitory properties of Coffee canephora extract against oral bacteria and its effect on demineralization of deciduous teeth. Arch. Oral Biol. 2011, 56, 556–564.
32. ELSayed, M.N. Determination of antibacterial activity of Green Coffee Arabica bean extract on multidrug resistance Pseudomonas aeruginosa (ATCC 27853). IOSR J. Pharm. 2018, 6, 33–38.
33. Bauer, A.W.; Kirby, W.M.M.; Sherris, J.C.; Turck, M. Antibiotic susceptibility testing by a standardized single disk method. Am. J. Clinic. Path. 1966, 45, 493-496.
34. Akl, B.A.; Nader, M.M.; El-Saadony, M.T. Biosynthesis of silver nanoparticles by Serratia marcescens ssp. sakuensis and its antibacterial application against some pathogenic bacteria. J. Agric. Chem. Biotechnol. 2020, 11, 1–8.
Agriculture 2020, 10, 457 17 of 19
35. El-Saadony, M.T.; Elsadek, M.F.; Alaa, S.; Mohamed Taha, A.E.; Ahmed, B.M.; Saad, A.M. Effects of chemical and natural additives on cucumber juice’s quality, shelf life, and safety. Foods. 2020, 9, 639, doi:10.3390/foods9050639.
36. Tien, L.; Divyaraj, Y.M.; Deepak, R.D. Comparative evaluation of antimicrobial efficacy of coffee extract and 0.2% chlorhexidine mouthwash on the periodontal pathogens Porphyromonas Gingivalis, Prevotella Intermedia, Fusobacterium Nucleatum and Aggregatibacter Actinomycetemcomitans an In Vitro Study. Adv. Hum. Biol. 2016, 6, 99–103.
37. Dash, S.K.; Chakraborty, S.P.; Mandal, D.; Roy, S. Isolation and characterization of multidrug resistant uropathogenic Escherichia coli from urine sample of urinary tract infected patients. Int. J. Life Sci. Pharm. Res. 2012, 2, 25–39.
38. Harrigen, W.F.; Mccance-Margart, E. Laboratory Methods in Food and Dairy Microbiology; Academic Press: London, UK, 1976; pp. 1–115.
39. Sheiha, A.M.; Abdelnour, S.A.; Abd El-Hack, M.E.; Khafaga, A.F.; Metwally, K.A.; Ajarem, J.S.; Maodaa, S.N.; Allam, A.A.; El-Saadony, M.T. Effects of dietary biological or chemical-synthesized nano-selenium supplementation on growing rabbits exposed to thermal stress. Animals 2020, 10, 430.
40. Reda, F.M.; El-Saadony, M.T.; Elnesr, S.S.; Alagawany, M.; Tufarelli, V. Effect of dietary supplementation of biological curcumin nanoparticles on growth and carcass traits, antioxidant status, immunity and caecal microbiota of Japanese quails. Animals 2020, 10, 754.
41. Richard, A.; Szabo, E.; Todd, C.D.; Jean, R.E. Method to isolate Escherichia coli 0157.H7 from food. J. Food Prot. 1986, 49, 768–772.
42. Edwards, E.A.; and Hilderbrand, R.L. Method for identifying Salmonella and Shigella directly from the primary isolation plate by coagglutination of protein A-containing staphylococci sensitized with specific antibody. J. Clin. Microbiol. 1976, 3, 339–343.
43. Kurtzman, C.; Fell, J.W. The Yeasts, a Taxonomic Study; Elsevier Science Publishers: Amsterdam, The Netherlands, 1984.
44. Argyri, A.A.; Zoumpopoulou, G.; Karatizas, K.A.; Tsakalidou, E.; Nychas, G.J.E.; Paganou, E.Z.; Tassou, C.C. Selection of potential probiotic lactic acid bacteria from fermented olives by In Vitro tests. Food Microbiol. 2013, 33, 282–291.
45. Miranda, J.M.; Franco, C.M.; Va´zquez, B.I.; Fente, C.A.; Barros-Vela´zquez, J.; Cepeda, A. Evaluation of Chromocult enterococci agar for the isolation and selective enumeration of Enterococcus spp. in broilers. Lett. Appl. Microbiol. 2005, 41, 153–156.
46. Osman, A.; Abd-Elaziz, S.; Salama, A.; Eita, A.A.; Sitohy, M. Health protective actions of phycocyanin obtained from an Egyptian isolate of Spirulina platensis on albino rats. EurAsian J. BioSci. 2019, 13, 105–112.
47. Patay, É.B.; Bencsik, T.; Papp, N. Phytochemical overview and medicinal importance of Coffee species from the past until now. Asian Pac. J. Trop. Med. 2016, 9, 1127–1135.
48. Alvarez-Jubete, L.; Wijngaard, H.; Arendt, E.; Gallagher, E. Polyphenol composition and in vitro antioxidant activity of amaranth, quinoa buckwheat and wheat as affected by sprouting and baking. Food Chem. 2010, 119, 770–778.
49. Acidri, R.; Sawai, Y.; Sugimoto, Y.; Handa, T.; Sasagawa, D.; Masunaga, T.; Yamamoto, S.; Nishihara, E. Phytochemical profile and antioxidant capacity of coffee plant organs compared to green and roasted coffee beans. Antioxidants 2020, 9, 93.
50. Perić, L.; Žikić, D.; Lukić, M. Application of alternative growth promoters in broiler production. Biotechnol. Anim. Husb. 2009, 25, 387-397.
51. Cardoso, V.S.; De-Lima, C.A.R.; De-Lima, M.E.F.; Dorneles, L.E.G.; Danelli, M.G.M. Piperine as a phytogenic additive in broiler diets. Pesqui. Agropecu. Bras. 2012, 47, 489–496.
52. Cho, J.H.; Kim, H.J.; Kim, I.H. Effects of phytogenic feed additive on growth performance, digestibility, blood metabolites, intestinal microbiota, meat color and relative organ weight after oral challenge with Clostridium perfringens in broilers. Livest. Sci. 2014, 160, 82–88.
53. Scheuermann, G.N.; Cunha Junior, A.; Cypriano, L.; Gabbi, A.M. Phytogenic additive as an alternative to growth promoters in broiler chickens. Ciênc. Rural. 2009, 39, 522–527.
54. Kohlert, C.; van Rensen, I.; März, R.; Schindler, G.; Graefe, E.U.; Veit, M. Bioavailability and pharmacokinetics of natural volatile terpenes in animals and humans. Planta Méd. 2000, 66, 495–505.
Agriculture 2020, 10, 457 18 of 19
55. Khajuria, A.; Thusu, N.; Zutshi, U. Piperine modulates permeability characteristics of intestine by inducing alterations in membrane dynamics: Influence on brush border membrane fluidity, ultrastructure and enzyme kinetics. Phytomedicine 2002, 9, 224-231.
56. Yang, C.J.; Yang, I.Y.; Oh, D.H.; Bae, I.H.; Cho, S.G.; Kong, I.G.; Uuganbayar, D.; Nou, I.S.; Choi, K.S. Effect of green tea by-product on performance and body composition in broiler chicks. Asian-Australas. J. Anim. Sci. 2003, 16, 867–872.
57. Guray, E.; Ocak, N.; Altop, A.; Cankaya, S.; Aksoy, H.M.; Ozturk, E. Growth performance, meat quality and caecal coliform bacteria count of broiler chicks fed diet with green tea extract. Asian-Australas. J. Anim. Sci. 2011, 24, 1128.
58. Marzoni, M.; Chiarini, R.; Castillo, A.; Romboli, I.; De Marco, M.; Schiavone, A. Effects of dietary natural antioxidant supplementation on broiler chicken and Muscovy duck meat quality. ASPR 2014, 32, 359–368.
59. Swain, B.K.; Johri, T.S. Effects of supplementation of combinations of different levels of selenium and vitamin E on relative weight of some organs and serum enzymes level in broilers. Ind. J. Poult. Sci. 2000, 35, 66–69.
60. Biswas, A.; Ahmed, M.; Bharti, V.K.; Singh, S.B. Effect of antioxidants on physio-biochemical and hematological parameters in broiler chicken at high altitude. Asian-Australas. J. Anim. Sci. 2011, 24, 246–249.
61. Nasir, A.; Aasima, R.; Faneshwar, K.; Vijay, S.; Vivek, S. Determinants of broiler chicken meat quality and factors affecting them: A review. J. Food Sci. Technol. 2017, 54, 2997–3009.
62. Honikel, K.O. Reference methods for the assessment of physical characteristics of meat. Meat Sci. 1998, 49, 447–457.
63. Pearson, A.M.; Gillette, T.A. Processed Meats, 3rd ed.; Aspen: Albany, NY, USA; Bonn, Germany; Boston, MA, USA; London, UK, 1996.
64. Zhao, C.; Liu, Y.; Lai, S.; Cao, H.; Guan, Y.; Cheang, W.S.; Xiao, J. Effects of domestic cooking process on the chemical and biological properties of dietary phytochemicals. Trends Food Sci. Technol. 2019, 85, 55–66.
65. Yi, S.; Li, J.; Zhu, J.; Lin, Y.; Fu, L.; Chen, W.; Li, X. Effect of tea polyphenols on microbiological and biochemical quality of collichthys fish ball. J. Sci. Food Agric. 2011, 91, 1591–1597, doi:10.1002/jsfa. v91.9.
66. Balamatsia, C.C.; Patsias, A.; Kontominas, M.G.; Savvaidis, I. Possible role of volatile amines as quality-indicating metabolites in modified atmosphere-packaged chicken fillets: Correlation with microbiological and sensory attributes. Food Chem. 2007, 104, 1622–1628, doi:10.1016/j.foodchem.2007.03.013.
67. Adeyemi, K.D.; Sazili, A.Q. Efficacy of carcass electrical stimulation in meat quality enhancement: A review. Asian-Australas. J. Anim. Sci. 2014, 27, 447–456.
68. Xiong, Y.L. Protein oxidation and implications for muscle food quality. In Antioxidants in Muscle Foods: Nutritional Strategies to Improve Quality; Decker, E., Faustman, C., Lopez-Bote, C.J., Eds.; John Wiley and Sons: New York, NY, USA, 2000; pp. 85–111.
69. Gok, V.; Obuz, E.; Akkaya, L. Effect of packaging method and storage time on the chemical, microbiological, and sensory properties of Turkish pastirma—A dry cured beef product. Meat Sci. 2008, 80, 335–344.
70. Beach- Larsen, T.; Scholderer, J. Functional foods in Europe: Consumer research, market experiences and regulatory aspects. Trends Food Sci. Technol. 2007, 18, 231–234.
71. Banon, S.P.; Daz, M.; Rodrguez, M.D.; Garrido, A.P. Ascorbate, green tea and grape seed extracts increase the shelf life of low sulphite beef patties. Meat Sci. 2007, 77, 626–633.
72. Choi, Y.H.; Kim, S.E.; Huh, J.; Han, Y.H.; Lee, M.J. Antibacterial and antioxidative activity of roasted coffee and red ginseng mixture extracts. J Korean Soc. Food Sci. Nutr. 2012, 41, 320–326.
73. Kim, J.Y.; Han, Y.S. Influence of roasting time on antibacterial and antioxidative effects of coffee extract. Korean J. Food Cook. Sci. 2009, 25, 496–505.
74. Stauder, M.; Papetti, A.; Mascherpa, D.; Schito, A.M.; Gazzani, G.; Pruzzo, C.; Daglia, M. Antiadhesion and antibiofilm activities of high molecular weight coffee components against Streptococcus mutans. J. Agric. Food Chem. 2010, 58, 11662–11666.
75. Deressa, T.; Tamiru, T.; Biadgo, B.; Belete, D.; Zewdu, S. Antimicrobial Potentials of Apis Multiflora honey in combination with coffee and cinnamon extracts against common human pathogenic bacteria. Med. Aromat. Plants 2015, 4, 2167-0412.
Agriculture 2020, 10, 457 19 of 19
76. Sura, I. The antibacterial activity of ethanolic extract of some Plant containing polyphenols component against Streptococcus mutans isolated from teeth caries International. J. Med. Pharm. 2016, 2, 82–86.
77. Akhlaghi, N.; Sadeghi, M.; Fazeli, F.; Akhlaghi, S.; Mehnati, M.; Sadeghi, M. The antibacterial effects of coffee extract, chlorhexidine, and fluoride against Streptococcus mutans and Lactobacillus plantarum: An in vitro study. Dent. Res. J. 2019, 16, 346-53.
78. Almeida, A.A.P.; Farah, A.; Silva, D.A.M.; Nunan, E.A.; Glória, M.B.A. Antibacterial activity of coffee extracts and selected coffee chemical compounds against Enterobacteria. J. Agric. Food Chem. 2006, 54, 8738–8743.
79. Dorea, J.G.; da Costa, T.H. Is coffee a functional food? Br. J. Nutr. 2005, 93, 773–782. 80. Nishitsuji, K.; Watanabe, S.; Xiao, J.; Nagatomo, R.; Ogawa, H.; Tsunematsu, T.; Umemoto, H.; Morimoto,
Y.; Akatsu, H.; Inoue, K.; et al. Effect of coffee or coffee components on gut microbiome and short-chain fatty acids in a mouse model of metabolic syndrome. Sci. Rep. 2018, 8, 16173, doi:10.1038/s41598-018-34571-9.
81. Vinod, D. Rangari, Pharmacognosy and Phytochemistry, 1st ed.; Carrier Publication: Nashik, Maharashtra, India, 2004; Volume II, pp. 311–312.
© 2020 by the authors. Licensee MDPI, Basel, Switzerland. This article is an open access article distributed under the terms and conditions of the Creative Commons Attribution (CC BY) license (http://creativecommons.org/licenses/by/4.0/).