Embed Size (px)
Citation preview

Atmos. Chem. Phys., 16, 14805–14824, 2016www.atmos-chem-phys.net/16/14805/2016/doi:10.5194/acp-16-14805-2016© Author(s) 2016. CC Attribution 3.0 License.
Impacts of global open-fire aerosols on direct radiative, cloud andsurface-albedo effects simulated with CAM5Yiquan Jiang1,2, Zheng Lu2, Xiaohong Liu2, Yun Qian3, Kai Zhang3, Yuhang Wang4, and Xiu-Qun Yang1
1CMA-NJU Joint Laboratory for Climate Prediction Studies, Institute for Climate and Global Change Research,School of Atmospheric Sciences, Nanjing University, Nanjing, China2Department of Atmospheric Science, University of Wyoming, Laramie, Wyoming, USA3Pacific Northwest National Laboratory, Richland, Washington, USA4School of Earth and Atmospheric Sciences, Georgia Institute of Technology, Atlanta, Georgia, USA
Correspondence to: Xiaohong Liu ([email protected])
Received: 24 February 2016 – Published in Atmos. Chem. Phys. Discuss.: 1 April 2016Revised: 30 October 2016 – Accepted: 8 November 2016 – Published: 29 November 2016
Abstract. Aerosols from open-land fires could significantlyperturb the global radiation balance and induce climatechange. In this study, Community Atmosphere Model ver-sion 5 (CAM5) with prescribed daily fire aerosol emis-sions is used to investigate the spatial and seasonal char-acteristics of radiative effects (REs, relative to the case ofno fires) of open-fire aerosols including black carbon (BC)and particulate organic matter (POM) from 2003 to 2011.The global annual mean RE from aerosol–radiation inter-actions (REari) of all fire aerosols is 0.16± 0.01 W m−2
(1σ uncertainty), mainly due to the absorption of fire BC(0.25± 0.01 W m−2), while fire POM induces a small ef-fect (−0.05 and 0.04± 0.01 W m−2 based on two differ-ent methods). Strong positive REari is found in the Arc-tic and in the oceanic regions west of southern Africaand South America as a result of amplified absorption offire BC above low-level clouds, in general agreement withsatellite observations. The global annual mean RE due toaerosol–cloud interactions (REaci) of all fire aerosols is−0.70± 0.05 W m−2, resulting mainly from the fire POM ef-fect (−0.59± 0.03 W m−2). REari (0.43± 0.03 W m−2) andREaci (−1.38± 0.23 W m−2) in the Arctic are stronger thanin the tropics (0.17± 0.02 and −0.82± 0.09 W m−2 forREari and REaci), although the fire aerosol burden is higherin the tropics. The large cloud liquid water path over landareas and low solar zenith angle of the Arctic favor thestrong fire aerosol REaci (up to−15 W m−2) during the Arc-tic summer. Significant surface cooling, precipitation reduc-tion and increasing amounts of low-level cloud are also found
in the Arctic summer as a result of the fire aerosol REacibased on the atmosphere-only simulations. The global an-nual mean RE due to surface-albedo changes (REsac) overland areas (0.03± 0.10 W m−2) is small and statistically in-significant and is mainly due to the fire BC-in-snow effect(0.02 W m−2) with the maximum albedo effect occurring inspring (0.12 W m−2) when snow starts to melt.
1 Introduction
Open fires or biomass burning of living and dead vegetationare an integral component of the Earth’s system and have sig-nificant impacts on the carbon cycle (Ciais et al., 2013) andthe climate (Bowman et al., 2009; Keywood et al., 2011; Liuet al., 2014; Sommers et al., 2014; Voulgarakis and Field,2015). On one hand, open fires can perturb the climate sys-tem by emitting greenhouse gases and aerosols (Kaiser et al.,2012; Wiedinmyer et al., 2011). On the other hand, climatestates and variabilities can play a critical role in determiningthe occurrence frequency and intensity of open fires (Marlonet al., 2009; van der Werf et al., 2008; Westerling et al., 2006;Bistinas et al., 2014). However, much is unknown regardingthe feedback mechanisms between open fire and climate in-teractions (Carslaw et al., 2010; Liu et al., 2014). A quali-fication of radiative forcing of fire aerosols as conducted inthis study is the first step to reducing these uncertainties.
Particles emitted from open fires can exert significant per-turbations to the climate system by scattering and absorbing
Published by Copernicus Publications on behalf of the European Geosciences Union.

14806 Y. Jiang et al.: Impacts of global open-fire aerosols
the solar radiation in the atmosphere (direct effect) (Carslawet al., 2010) and by changing the surface albedo when theyare deposited on the snow and ice (surface-albedo effect)(Flanner et al., 2007; Quinn et al., 2008; Randerson et al.,2006; Qian et al., 2011, 2015). In addition, open fire or smokeparticles can modify the cloud properties, precipitation ef-ficiency and the hydrological cycle by changing the atmo-spheric thermal structure (semi-direct effect) (Koch and DelGenio, 2010; Andreae et al., 2004) or acting as cloud conden-sation nuclei (CCN) (indirect effects) (Andreae and Rosen-feld, 2008; Qian et al., 2009; Lu and Sokolik, 2013).
The radiative effect (RE) (Boucher and Tanré, 2000)and radiative forcing (RF) (Forster et al., 2007; Myhre etal., 2013a) are typical metrics used to assess and compareanthropogenic and natural drivers of climate change. Theaerosol RE represents the instantaneous radiative impact ofatmospheric particles on the Earth’s energy balance (Healdet al., 2014). RF is calculated as the change of RE betweentwo different periods, e.g., the pre-industrial and the present-day times (Heald et al., 2014; Liu et al., 2007), based on theaerosol and precursor gas emissions in the two periods (Den-tener et al., 2006; Lamarque et al., 2010).
RF from aerosol–radiation interactions (RFari) involvingbiomass burning aerosols has been estimated since the IPCCsecond Assessment Report (AR2). Based on the AerosolComparisons between Observations and Models (AeroCom)Phase II simulations (Bond et al., 2013; Myhre et al., 2013b),RFari of biomass burning aerosols in the IPCC Fifth Assess-ment Report (AR5) is estimated to be 0.0 W m−2 (rangingfrom −0.20 to 0.20 W m−2), and the RFari of biomass burn-ing black carbon (BC) and primary organic matter (POM)have values with opposite signs (i.e., 0.10 and−0.10 W m−2,respectively).
There are also some studies that estimated the RE fromaerosol–radiation interactions (REari) involving fire aerosolsby comparing the simulation with fire emissions to the simu-lation with no fire emissions. For example, using the NCARCommunity Atmosphere Model version 4 (CAM4) with abulk aerosol module, Tosca et al. (2013) reported that thetop-of-atmosphere (TOA) REari from global biomass burn-ing aerosols is 0.18± 0.10 W m−2, averaged for the periodof 1997–2009. Ward et al. (2012) estimated the REari frombiomass burning aerosols in the pre-industrial (for the year1850), present-day (for the year 2000) and future time peri-ods (for the year 2100), and found that the biomass burningaerosol REari for the year 2000 is 0.13 and−0.27 W m−2 forall-sky and clear-sky conditions, respectively.
RE from aerosol–cloud interactions (REaci) of biomassburning aerosols can be comparable in magnitude or of aneven stronger magnitude than the REari (Liu et al., 2014).With a global aerosol-climate model, the REaci of biomassburning aerosols was estimated to range from −1.74 to−1.00 W m−2 for the year 2000 in Ward et al. (2012). Thesemi-direct radiative effect of biomass burning aerosols is notindependently assessed in IPCC reports. The magnitude was
reported to be about 7.0 W m−2 in the southern Americanbiomass burning regions by examining the radiative flux dif-ference with and without the biomass burning aerosol effecton clouds (Liu, 2005).
The RF or RE due to surface-albedo changes (RFsac orREsac) of BC from open fires and other sources has been es-timated in previous studies. For biomass burning emissionswith a strong (1998) and weak (2001) boreal fire year, RE offire BC-in-snow was estimated to be 0.011 and 0.006 W m−2,respectively (Flanner et al., 2007). Randerson et al. (2006)reported that BC from a boreal forest fire deposited onsnow and sea ice introduced a global annual mean RE of8± 5 W m−2 of burned area in the first year when the firehappened. A summary of BC-in-snow forcing/effect can befound in Bond et al. (2013). They reported that the present-day RE of fire BC-in-snow ranges from 0.006 to 0.02 W m−2
based on previous studies (Jacobson, 2004; Rypdal et al.,2009; Skeie et al., 2011; Hansen et al., 2005; Flanner et al.,2007, 2009; Koch et al., 2009).
Biomass burning aerosols can have significant impactson global and regional precipitation and atmospheric cir-culation. With the change of fire emissions from 1860 to2000, Jones et al. (2007) found that biomass burning aerosolsdecrease the global near-surface air temperature by about0.25 ◦C when considering the feedbacks of sea surface tem-perature (SST) in the model. As shown in Tosca et al. (2013),the direct and semi-direct effects of biomass burning aerosolsreduce the precipitation near the equator and weaken theHadley circulation. With a regional climate model, Zhang etal. (2009) found that biomass burning aerosols may warmand stabilize the lower troposphere and thus reinforce the dryseason rainfall pattern in southern Amazonia. The absorptionof shortwave radiation by biomass burning BC could increasethe vertical stratification and inhibit both the cloud forma-tion and precipitation (Ackerman et al., 2000; Tosca et al.,2014). In contrast, biomass burning aerosols could invigo-rate the convective clouds (Andreae et al., 2004; Koren et al.,2005) through suppressing warm rain processes in the con-vection and enhance the latent heat release at higher levels(Andreae and Rosenfeld, 2008).
Although there have been many studies quantifying theRE of fire aerosols, further investigation is still needed asthe current estimations of fire aerosol RE are still associ-ated with large uncertainties (e.g., Myhre and Samset, 2015;Chakrabarty et al., 2014). The REs of co-emitted fire POMvs. BC are even less clear. In this study, we estimate thepresent day (from 2003 to 2011) open-fire aerosol REs (in-cluding REari, REaci and REsac) using the NCAR Com-munity Atmosphere Model version 5.3 (CAM5) with the 4-mode version of the modal aerosol module (MAM4). We usetwo methods to calculate the REari of fire aerosols (total, BConly and POM only). One method estimates the REari basedon different model simulations (Ghan, 2013), and the otherone calculates the REari directly through multiple diagnosticradiation calls in a single simulation. The spatial and sea-
Atmos. Chem. Phys., 16, 14805–14824, 2016 www.atmos-chem-phys.net/16/14805/2016/

Y. Jiang et al.: Impacts of global open-fire aerosols 14807
sonal characteristics of fire aerosol REs, and the impacts onthe global precipitation and temperature are discussed.
Compared to earlier studies of fire aerosol REs (Tosca etal., 2013; Ward et al., 2012), a number of improvements aremade in this study. First, a higher model horizontal resolu-tion at 0.9◦ by 1.25◦ is used vs. 1.9◦ by 2.5◦. The higher res-olution allows for more efficient transport of aerosols fromthe sources to remote regions (Ma et al., 2013, 2014). Modelresolution has also been shown to be important for aerosolREaci (Ma et al., 2015). Second, the latest CAM5 model withMAM4 is used. MAM4 with an additional primary carbonmode explicitly treats the microphysical aging of primarycarbonaceous aerosols (POM/BC) in the atmosphere. MAM4has higher BC and POM burdens over the earlier 3-mode ver-sion of MAM (MAM3) in the remote regions by∼ 30 % (Liuet al., 2016). Third, daily instead of monthly fire emissionsare used, which allows the model to consider the effect offast changes in the fire emission flux on local atmosphericconditions. It is expected that, using the monthly mean emis-sion flux, the model cannot consider the effect of extremelystrong fires, thus it might underestimate the fire aerosol REsfor such cases. Finally, a new methodology (Ghan, 2013) isused to more accurately diagnose the REs of fire aerosols.Central to this method is that the REari must be calculatedin the presence of clouds (i.e., under the all-sky condition),and the REaci must be calculated under the condition of noaerosol effects on radiation. With the radiative forcing de-composition of this method, REsac can also be quantified.
The paper is organized as follows. Section 2 introducesthe model and experiments. Section 3 describes the methodsof diagnosing the fire aerosol REs. Section 4 presents themodel results of fire aerosol REs and impacts on global andregional surface temperature and precipitation. Conclusionsand discussion are given in Sect. 5.
2 Model, experimental design and aerosol radiativeeffect method
2.1 Model
In our study, we use the Community Earth System Model(CESM) version 1.2, with the Community AtmosphereModel version 5.3 (CAM5.3) (Neale et al., 2012) coupledwith the Community Land Model version 4 (CLM4) (Olesonet al., 2010). The Snow, Ice, and Aerosol Radiative model(SNICAR) (Flanner and Zender, 2005) is turned on in thesimulations to diagnose the biomass burning BC-in-snow ef-fect. CAM5 includes several major updates in its physics pa-rameterizations compared to previous CAM versions. A two-moment stratiform cloud microphysics scheme is includedin CAM5 to predict both the mass and number mixing ra-tios of cloud liquid and cloud ice (Morrison and Gettelman,2008). MAM4, which was updated from MAM3 (Liu et al.,2012), includes aerosol mass and number mixing ratios in
four lognormal modes: Aitken, accumulation, coarse and pri-mary carbon mode (Liu et al., 2016). An additional primarycarbon mode is included in MAM4 on the top of MAM3 toexplicitly treat the microphysical aging of primary carbona-ceous aerosols (POM and BC) in the atmosphere. POM andBC in MAM4 are emitted in the primary carbon mode insteadof directly in the accumulation mode as in MAM3. MAM4significantly increases the BC and POM concentrations in theremote regions (e.g., over oceans and the Arctic) due to re-duced wet scavenging of POM and BC in the primary carbonmode with a lower hygroscopicity than in the accumulationmode. The increase is relatively small in the land source re-gions (Liu et al., 2016).
2.2 Experimental design
CAM5 was run with the finite volume dynamics core in aresolution of 0.9◦ latitude by 1.25◦ longitude and 30 verticallevels. The model was run for the time period of year 2003to 2011 (i.e., for 9 years) with prescribed monthly SST andsea ice. The year 2003 was run twice and the first year sim-ulation was used as a model spin-up. Global Fire EmissionsDatabase version 3.1 (GFED 3.1) daily emissions (Giglio etal., 2013) for BC, POM and sulfur dioxide (SO2) from 2003to 2011 are prescribed, and the vertical distribution of fireemissions is based on the AeroCom protocol (Dentener etal., 2006). Anthropogenic aerosol and precursor gas emis-sions are from the IPCC AR5 data set (Lamarque et al.,2010). We performed our control experiment (FIRE) withthe GFED fire emissions turned on and a sensitivity exper-iment (NOFIRE) with the fire emissions turned off. Differ-ences between FIRE and NOFIRE experiments are used tocalculate the REs and atmospheric effects of biomass burn-ing aerosols on temperature and precipitation. Two additionalexperiments, NOFIREBC and NOFIREPOM, were respec-tively performed with fire BC and POM emissions turned off.Differences between the control (FIRE) and these two exper-iments represent the contributions from biomass burning ofBC and POM. Other forcings (e.g., SST, greenhouse gases)of all these experiments are kept the same. We performed tenensemble members for each of these experiments. Further-more, we performed the other experiment (FIRE_BBFFBF)using the modified CAM5 model that separately predicts theBC and POM from biomass burning (BB), fossil fuel (FF)and biofuel (BF) sources, while other model features are keptthe same as the FIRE experiment. A summary of all the ex-periments in this study can be found in Table 1.
2.3 Methods of calculating fire aerosol radiative effects
The REs of all fire aerosols, fire BC and fire POM are cal-culated from the differences in TOA shortwave fluxes (1F )between the FIRE experiment and the three other exper-iments (NOFIRE, NOFIREBC and NOFIREPOM, respec-tively). All the atmospheric variables (including temperature,
www.atmos-chem-phys.net/16/14805/2016/ Atmos. Chem. Phys., 16, 14805–14824, 2016

14808 Y. Jiang et al.: Impacts of global open-fire aerosols
Table 1. Numerical experiments and associated fire aerosol emis-sions in each experiment.
Experiment Ensembles Fire Fire FireBC POM SO2
FIRE 10 On On OnNOFIRE 10 Off Off OffNOFIREBC 10 Off On OnNOFIREPOM 10 On Off OnFIRE_BBFFBF 1 On On On
precipitation and circulation) are allowed to adjust in the ex-periments. However, with SST and sea ice prescribed in theseexperiments, only the rapid adjustments are taken into ac-count. Thus, the effective radiative effects are actually calcu-lated in this study.
1Ffire aero = Ffire−Fnofire (1)1Ffire bc = Ffire−Fnofirebc (2)1Ffire pom = Ffire−Fnofirepom (3)
The total TOA shortwave flux change can be broken intothe REari, REaci and REsac. The aerosol REaci results fromboth the aerosol effect on clouds (i.e., acting as CCN) andthe aerosol semi-direct effect on clouds (i.e., affecting the at-mospheric states due to absorbing aerosols). We adopt themethod by Ghan (2013) to separate the REari, REaci andREsac from the total effects of all fire aerosols, fire BC andfire POM, respectively. The method is summarized as fol-lows. Fclean is the radiative flux at TOA calculated from adiagnostic radiation call in the same control simulations, butneglecting the scattering and absorption of solar radiation byaerosols. Fclean,clear is the clear-sky radiative flux at TOA cal-culated from the same diagnostic radiation call, but neglect-ing scattering and absorption by both clouds and aerosols.
1F = 1(F −Fclean) +1(Fclean−Fclean,clear)
(REari) (REaci)
+1Fclean,clear(REsac) (4)
In the method above, REaci includes both aerosol indirectand semi-direct effects. The fire BC has a much weaker indi-rect effect due to its lower mass burden and lower hygroscop-icity compared to fire POM (Koch et al., 2011). Thus, the fireaerosol semi-direct effect can be approximately representedby the REaci of fire BC. The fire aerosol indirect effect canbe estimated as the difference between the fire aerosol REaciand semi-direct effect. With the sea ice prescribed in theseexperiments, the radiative effect of fire aerosols on sea icealbedo is not considered in REsac.
We undertake another method to estimate the fire aerosolREari from the experiment (FIRE_BBFFBF). With explicitpredictions of fire POM and fire BC in FIRE_BBFFBF, the
Figure 1. Seasonal variation of GFED monthly fire (a) organic car-bon (OC) and (b) black carbon (BC) emissions (Tg C month−1) av-eraged for the period of year 2003 to 2011 in the global, tropical(25◦ S to 25◦ N) and the Arctic (60 to 90◦ N) regions.
REari of fire BC and fire POM are estimated by two di-agnostic radiation calls, each time neglecting the scatteringand absorption of solar radiation of fire BC and fire POM.This more direct method is named BBFFBF, and the REariof fire BC and fire POM will be compared with those fromthe method by Ghan (2013). The fire BC-in-snow effect iscalculated from SNICAR, and compared with the REsac es-timated from Ghan (2013).
3 Results
3.1 Simulation of biomass burning aerosols
The biomass burning BC and POM from forest, grass andagriculture fires are significant contributors to the total BCand POM emissions. Figure 1 shows the seasonal variation ofGFED fire emissions (including forest, grass and agriculturefires) in the global, tropical (25◦ S to 25◦ N), and the Arc-tic (60 to 90◦ N) regions. Global fire emission is the largestduring the boreal summer as well as in the boreal autumn(September/October) when it is the fire season in the tropi-cal regions of the Southern Hemisphere (SH). The tropicalfire emission contributes the most to the annual global fireemission (80 % for BC and 85 % for OC), compared to other
Atmos. Chem. Phys., 16, 14805–14824, 2016 www.atmos-chem-phys.net/16/14805/2016/
Y. Jiang et al.: Impacts of global open-fire aerosols 14809
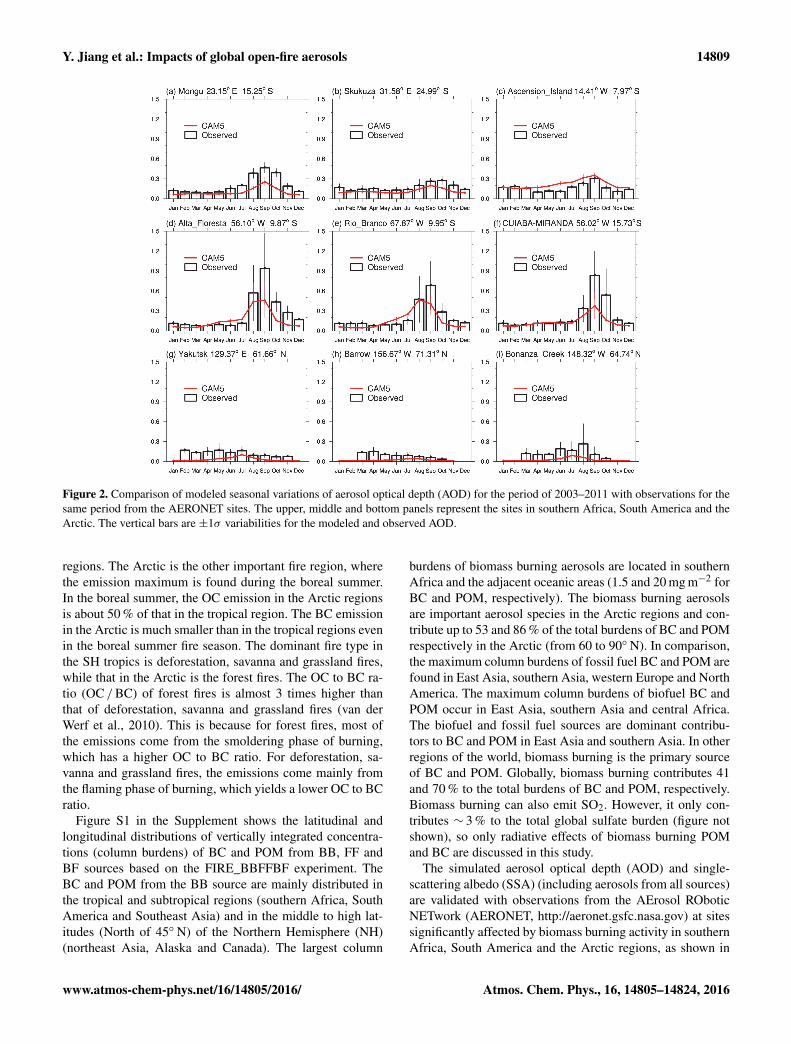
Figure 2. Comparison of modeled seasonal variations of aerosol optical depth (AOD) for the period of 2003–2011 with observations for thesame period from the AERONET sites. The upper, middle and bottom panels represent the sites in southern Africa, South America and theArctic. The vertical bars are ±1σ variabilities for the modeled and observed AOD.
regions. The Arctic is the other important fire region, wherethe emission maximum is found during the boreal summer.In the boreal summer, the OC emission in the Arctic regionsis about 50 % of that in the tropical region. The BC emissionin the Arctic is much smaller than in the tropical regions evenin the boreal summer fire season. The dominant fire type inthe SH tropics is deforestation, savanna and grassland fires,while that in the Arctic is the forest fires. The OC to BC ra-tio (OC /BC) of forest fires is almost 3 times higher thanthat of deforestation, savanna and grassland fires (van derWerf et al., 2010). This is because for forest fires, most ofthe emissions come from the smoldering phase of burning,which has a higher OC to BC ratio. For deforestation, sa-vanna and grassland fires, the emissions come mainly fromthe flaming phase of burning, which yields a lower OC to BCratio.
Figure S1 in the Supplement shows the latitudinal andlongitudinal distributions of vertically integrated concentra-tions (column burdens) of BC and POM from BB, FF andBF sources based on the FIRE_BBFFBF experiment. TheBC and POM from the BB source are mainly distributed inthe tropical and subtropical regions (southern Africa, SouthAmerica and Southeast Asia) and in the middle to high lat-itudes (North of 45◦ N) of the Northern Hemisphere (NH)(northeast Asia, Alaska and Canada). The largest column
burdens of biomass burning aerosols are located in southernAfrica and the adjacent oceanic areas (1.5 and 20 mg m−2 forBC and POM, respectively). The biomass burning aerosolsare important aerosol species in the Arctic regions and con-tribute up to 53 and 86 % of the total burdens of BC and POMrespectively in the Arctic (from 60 to 90◦ N). In comparison,the maximum column burdens of fossil fuel BC and POM arefound in East Asia, southern Asia, western Europe and NorthAmerica. The maximum column burdens of biofuel BC andPOM occur in East Asia, southern Asia and central Africa.The biofuel and fossil fuel sources are dominant contribu-tors to BC and POM in East Asia and southern Asia. In otherregions of the world, biomass burning is the primary sourceof BC and POM. Globally, biomass burning contributes 41and 70 % to the total burdens of BC and POM, respectively.Biomass burning can also emit SO2. However, it only con-tributes ∼ 3 % to the total global sulfate burden (figure notshown), so only radiative effects of biomass burning POMand BC are discussed in this study.
The simulated aerosol optical depth (AOD) and single-scattering albedo (SSA) (including aerosols from all sources)are validated with observations from the AErosol ROboticNETwork (AERONET, http://aeronet.gsfc.nasa.gov) at sitessignificantly affected by biomass burning activity in southernAfrica, South America and the Arctic regions, as shown in
www.atmos-chem-phys.net/16/14805/2016/ Atmos. Chem. Phys., 16, 14805–14824, 2016
14810 Y. Jiang et al.: Impacts of global open-fire aerosols
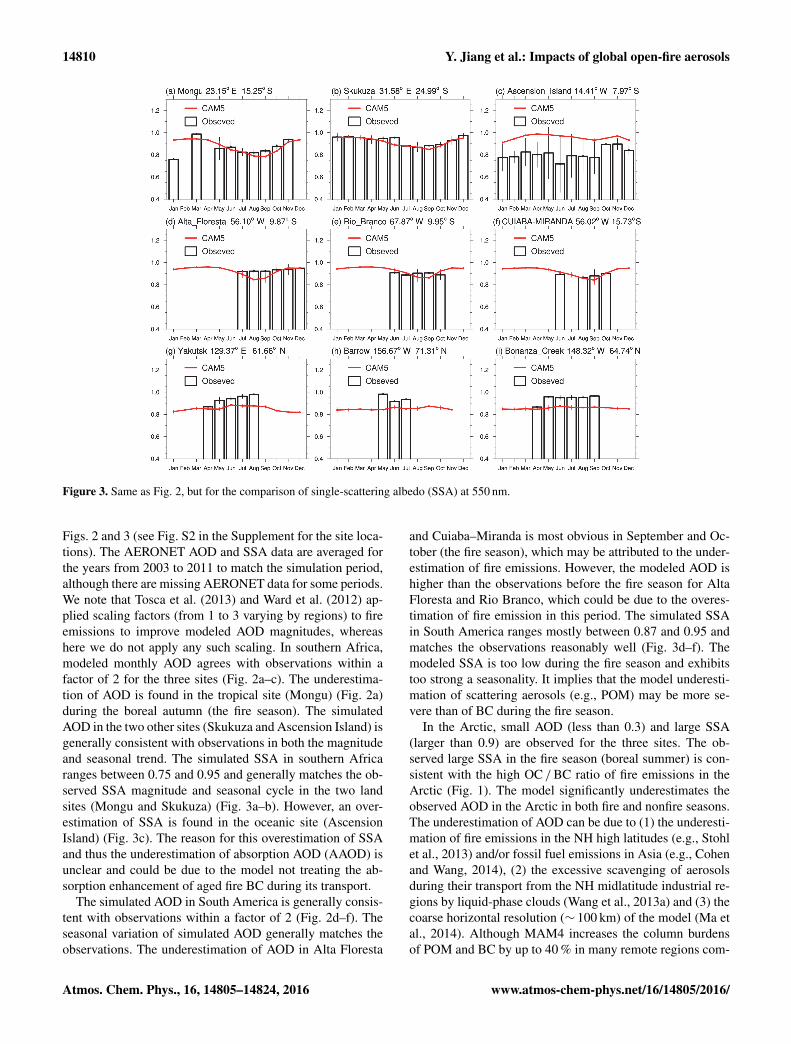
Figure 3. Same as Fig. 2, but for the comparison of single-scattering albedo (SSA) at 550 nm.
Figs. 2 and 3 (see Fig. S2 in the Supplement for the site loca-tions). The AERONET AOD and SSA data are averaged forthe years from 2003 to 2011 to match the simulation period,although there are missing AERONET data for some periods.We note that Tosca et al. (2013) and Ward et al. (2012) ap-plied scaling factors (from 1 to 3 varying by regions) to fireemissions to improve modeled AOD magnitudes, whereashere we do not apply any such scaling. In southern Africa,modeled monthly AOD agrees with observations within afactor of 2 for the three sites (Fig. 2a–c). The underestima-tion of AOD is found in the tropical site (Mongu) (Fig. 2a)during the boreal autumn (the fire season). The simulatedAOD in the two other sites (Skukuza and Ascension Island) isgenerally consistent with observations in both the magnitudeand seasonal trend. The simulated SSA in southern Africaranges between 0.75 and 0.95 and generally matches the ob-served SSA magnitude and seasonal cycle in the two landsites (Mongu and Skukuza) (Fig. 3a–b). However, an over-estimation of SSA is found in the oceanic site (AscensionIsland) (Fig. 3c). The reason for this overestimation of SSAand thus the underestimation of absorption AOD (AAOD) isunclear and could be due to the model not treating the ab-sorption enhancement of aged fire BC during its transport.
The simulated AOD in South America is generally consis-tent with observations within a factor of 2 (Fig. 2d–f). Theseasonal variation of simulated AOD generally matches theobservations. The underestimation of AOD in Alta Floresta
and Cuiaba–Miranda is most obvious in September and Oc-tober (the fire season), which may be attributed to the under-estimation of fire emissions. However, the modeled AOD ishigher than the observations before the fire season for AltaFloresta and Rio Branco, which could be due to the overes-timation of fire emission in this period. The simulated SSAin South America ranges mostly between 0.87 and 0.95 andmatches the observations reasonably well (Fig. 3d–f). Themodeled SSA is too low during the fire season and exhibitstoo strong a seasonality. It implies that the model underesti-mation of scattering aerosols (e.g., POM) may be more se-vere than of BC during the fire season.
In the Arctic, small AOD (less than 0.3) and large SSA(larger than 0.9) are observed for the three sites. The ob-served large SSA in the fire season (boreal summer) is con-sistent with the high OC /BC ratio of fire emissions in theArctic (Fig. 1). The model significantly underestimates theobserved AOD in the Arctic in both fire and nonfire seasons.The underestimation of AOD can be due to (1) the underesti-mation of fire emissions in the NH high latitudes (e.g., Stohlet al., 2013) and/or fossil fuel emissions in Asia (e.g., Cohenand Wang, 2014), (2) the excessive scavenging of aerosolsduring their transport from the NH midlatitude industrial re-gions by liquid-phase clouds (Wang et al., 2013a) and (3) thecoarse horizontal resolution (∼ 100 km) of the model (Ma etal., 2014). Although MAM4 increases the column burdensof POM and BC by up to 40 % in many remote regions com-
Atmos. Chem. Phys., 16, 14805–14824, 2016 www.atmos-chem-phys.net/16/14805/2016/
Y. Jiang et al.: Impacts of global open-fire aerosols 14811
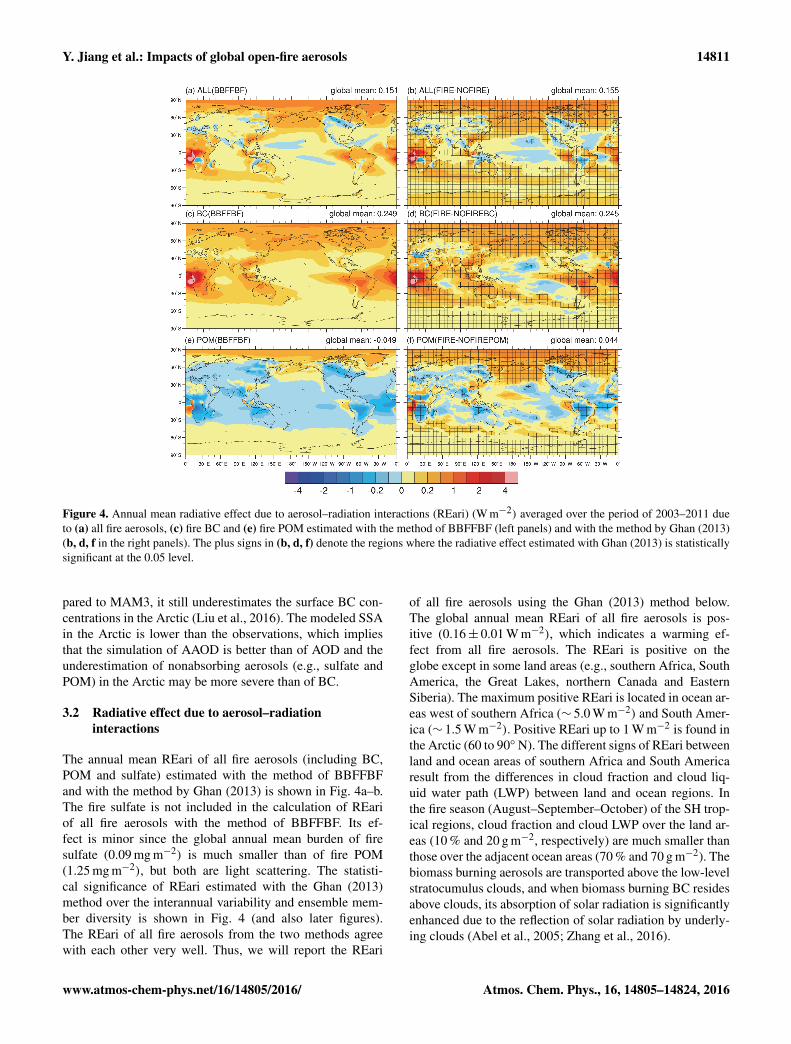
Figure 4. Annual mean radiative effect due to aerosol–radiation interactions (REari) (W m−2) averaged over the period of 2003–2011 dueto (a) all fire aerosols, (c) fire BC and (e) fire POM estimated with the method of BBFFBF (left panels) and with the method by Ghan (2013)(b, d, f in the right panels). The plus signs in (b, d, f) denote the regions where the radiative effect estimated with Ghan (2013) is statisticallysignificant at the 0.05 level.
pared to MAM3, it still underestimates the surface BC con-centrations in the Arctic (Liu et al., 2016). The modeled SSAin the Arctic is lower than the observations, which impliesthat the simulation of AAOD is better than of AOD and theunderestimation of nonabsorbing aerosols (e.g., sulfate andPOM) in the Arctic may be more severe than of BC.
3.2 Radiative effect due to aerosol–radiationinteractions
The annual mean REari of all fire aerosols (including BC,POM and sulfate) estimated with the method of BBFFBFand with the method by Ghan (2013) is shown in Fig. 4a–b.The fire sulfate is not included in the calculation of REariof all fire aerosols with the method of BBFFBF. Its ef-fect is minor since the global annual mean burden of firesulfate (0.09 mg m−2) is much smaller than of fire POM(1.25 mg m−2), but both are light scattering. The statisti-cal significance of REari estimated with the Ghan (2013)method over the interannual variability and ensemble mem-ber diversity is shown in Fig. 4 (and also later figures).The REari of all fire aerosols from the two methods agreewith each other very well. Thus, we will report the REari
of all fire aerosols using the Ghan (2013) method below.The global annual mean REari of all fire aerosols is pos-itive (0.16± 0.01 W m−2), which indicates a warming ef-fect from all fire aerosols. The REari is positive on theglobe except in some land areas (e.g., southern Africa, SouthAmerica, the Great Lakes, northern Canada and EasternSiberia). The maximum positive REari is located in ocean ar-eas west of southern Africa (∼ 5.0 W m−2) and South Amer-ica (∼ 1.5 W m−2). Positive REari up to 1 W m−2 is found inthe Arctic (60 to 90◦ N). The different signs of REari betweenland and ocean areas of southern Africa and South Americaresult from the differences in cloud fraction and cloud liq-uid water path (LWP) between land and ocean regions. Inthe fire season (August–September–October) of the SH trop-ical regions, cloud fraction and cloud LWP over the land ar-eas (10 % and 20 g m−2, respectively) are much smaller thanthose over the adjacent ocean areas (70 % and 70 g m−2). Thebiomass burning aerosols are transported above the low-levelstratocumulus clouds, and when biomass burning BC residesabove clouds, its absorption of solar radiation is significantlyenhanced due to the reflection of solar radiation by underly-ing clouds (Abel et al., 2005; Zhang et al., 2016).
www.atmos-chem-phys.net/16/14805/2016/ Atmos. Chem. Phys., 16, 14805–14824, 2016
14812 Y. Jiang et al.: Impacts of global open-fire aerosols
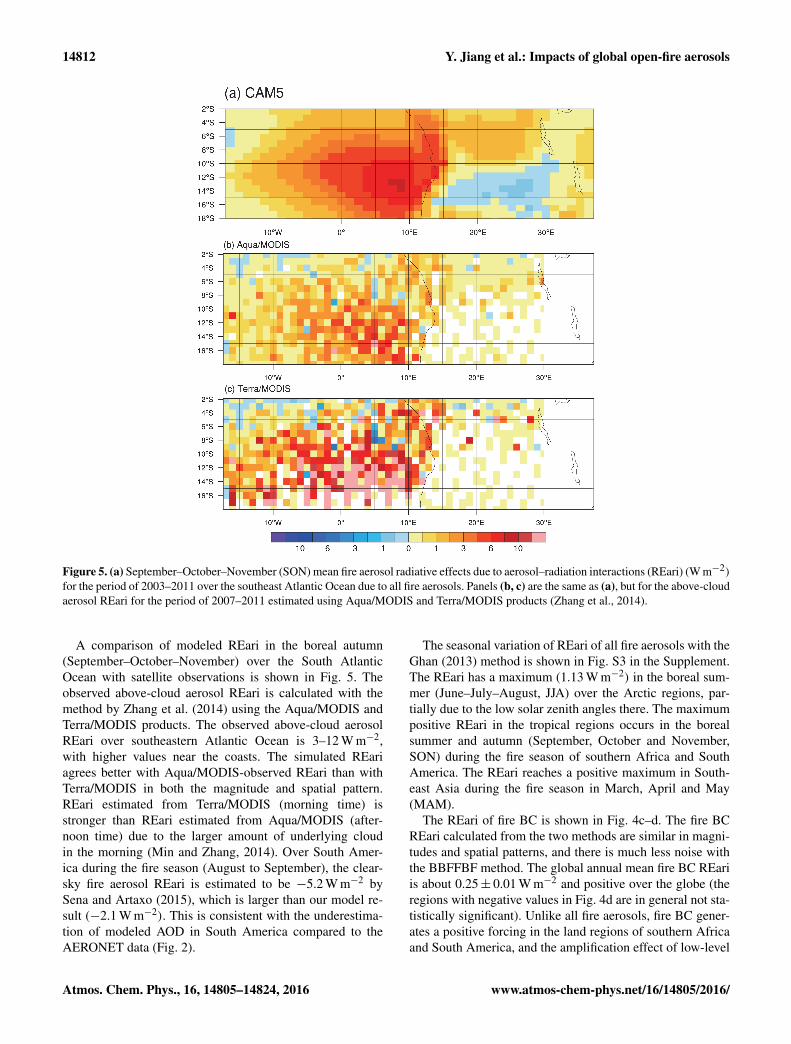
Figure 5. (a) September–October–November (SON) mean fire aerosol radiative effects due to aerosol–radiation interactions (REari) (W m−2)for the period of 2003–2011 over the southeast Atlantic Ocean due to all fire aerosols. Panels (b, c) are the same as (a), but for the above-cloudaerosol REari for the period of 2007–2011 estimated using Aqua/MODIS and Terra/MODIS products (Zhang et al., 2014).
A comparison of modeled REari in the boreal autumn(September–October–November) over the South AtlanticOcean with satellite observations is shown in Fig. 5. Theobserved above-cloud aerosol REari is calculated with themethod by Zhang et al. (2014) using the Aqua/MODIS andTerra/MODIS products. The observed above-cloud aerosolREari over southeastern Atlantic Ocean is 3–12 W m−2,with higher values near the coasts. The simulated REariagrees better with Aqua/MODIS-observed REari than withTerra/MODIS in both the magnitude and spatial pattern.REari estimated from Terra/MODIS (morning time) isstronger than REari estimated from Aqua/MODIS (after-noon time) due to the larger amount of underlying cloudin the morning (Min and Zhang, 2014). Over South Amer-ica during the fire season (August to September), the clear-sky fire aerosol REari is estimated to be −5.2 W m−2 bySena and Artaxo (2015), which is larger than our model re-sult (−2.1 W m−2). This is consistent with the underestima-tion of modeled AOD in South America compared to theAERONET data (Fig. 2).
The seasonal variation of REari of all fire aerosols with theGhan (2013) method is shown in Fig. S3 in the Supplement.The REari has a maximum (1.13 W m−2) in the boreal sum-mer (June–July–August, JJA) over the Arctic regions, par-tially due to the low solar zenith angles there. The maximumpositive REari in the tropical regions occurs in the borealsummer and autumn (September, October and November,SON) during the fire season of southern Africa and SouthAmerica. The REari reaches a positive maximum in South-east Asia during the fire season in March, April and May(MAM).
The REari of fire BC is shown in Fig. 4c–d. The fire BCREari calculated from the two methods are similar in magni-tudes and spatial patterns, and there is much less noise withthe BBFFBF method. The global annual mean fire BC REariis about 0.25± 0.01 W m−2 and positive over the globe (theregions with negative values in Fig. 4d are in general not sta-tistically significant). Unlike all fire aerosols, fire BC gener-ates a positive forcing in the land regions of southern Africaand South America, and the amplification effect of low-level
Atmos. Chem. Phys., 16, 14805–14824, 2016 www.atmos-chem-phys.net/16/14805/2016/
Y. Jiang et al.: Impacts of global open-fire aerosols 14813
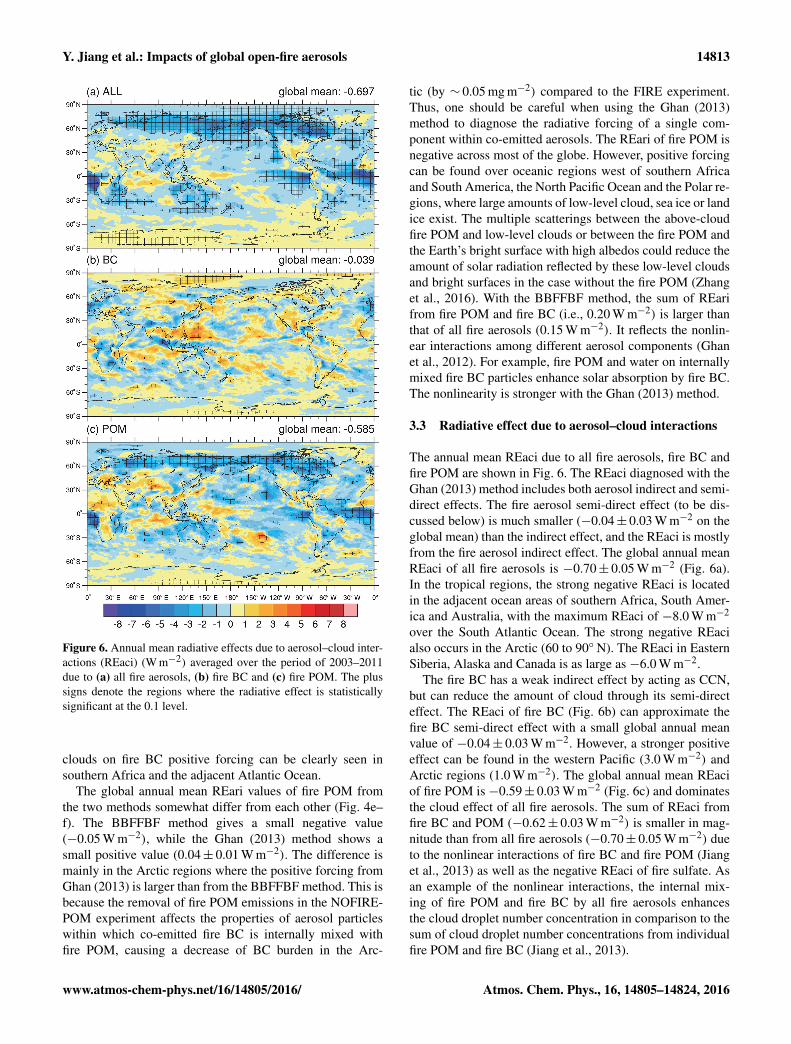
Figure 6. Annual mean radiative effects due to aerosol–cloud inter-actions (REaci) (W m−2) averaged over the period of 2003–2011due to (a) all fire aerosols, (b) fire BC and (c) fire POM. The plussigns denote the regions where the radiative effect is statisticallysignificant at the 0.1 level.
clouds on fire BC positive forcing can be clearly seen insouthern Africa and the adjacent Atlantic Ocean.
The global annual mean REari values of fire POM fromthe two methods somewhat differ from each other (Fig. 4e–f). The BBFFBF method gives a small negative value(−0.05 W m−2), while the Ghan (2013) method shows asmall positive value (0.04± 0.01 W m−2). The difference ismainly in the Arctic regions where the positive forcing fromGhan (2013) is larger than from the BBFFBF method. This isbecause the removal of fire POM emissions in the NOFIRE-POM experiment affects the properties of aerosol particleswithin which co-emitted fire BC is internally mixed withfire POM, causing a decrease of BC burden in the Arc-
tic (by ∼ 0.05 mg m−2) compared to the FIRE experiment.Thus, one should be careful when using the Ghan (2013)method to diagnose the radiative forcing of a single com-ponent within co-emitted aerosols. The REari of fire POM isnegative across most of the globe. However, positive forcingcan be found over oceanic regions west of southern Africaand South America, the North Pacific Ocean and the Polar re-gions, where large amounts of low-level cloud, sea ice or landice exist. The multiple scatterings between the above-cloudfire POM and low-level clouds or between the fire POM andthe Earth’s bright surface with high albedos could reduce theamount of solar radiation reflected by these low-level cloudsand bright surfaces in the case without the fire POM (Zhanget al., 2016). With the BBFFBF method, the sum of REarifrom fire POM and fire BC (i.e., 0.20 W m−2) is larger thanthat of all fire aerosols (0.15 W m−2). It reflects the nonlin-ear interactions among different aerosol components (Ghanet al., 2012). For example, fire POM and water on internallymixed fire BC particles enhance solar absorption by fire BC.The nonlinearity is stronger with the Ghan (2013) method.
3.3 Radiative effect due to aerosol–cloud interactions
The annual mean REaci due to all fire aerosols, fire BC andfire POM are shown in Fig. 6. The REaci diagnosed with theGhan (2013) method includes both aerosol indirect and semi-direct effects. The fire aerosol semi-direct effect (to be dis-cussed below) is much smaller (−0.04± 0.03 W m−2 on theglobal mean) than the indirect effect, and the REaci is mostlyfrom the fire aerosol indirect effect. The global annual meanREaci of all fire aerosols is −0.70± 0.05 W m−2 (Fig. 6a).In the tropical regions, the strong negative REaci is locatedin the adjacent ocean areas of southern Africa, South Amer-ica and Australia, with the maximum REaci of −8.0 W m−2
over the South Atlantic Ocean. The strong negative REacialso occurs in the Arctic (60 to 90◦ N). The REaci in EasternSiberia, Alaska and Canada is as large as −6.0 W m−2.
The fire BC has a weak indirect effect by acting as CCN,but can reduce the amount of cloud through its semi-directeffect. The REaci of fire BC (Fig. 6b) can approximate thefire BC semi-direct effect with a small global annual meanvalue of −0.04± 0.03 W m−2. However, a stronger positiveeffect can be found in the western Pacific (3.0 W m−2) andArctic regions (1.0 W m−2). The global annual mean REaciof fire POM is −0.59± 0.03 W m−2 (Fig. 6c) and dominatesthe cloud effect of all fire aerosols. The sum of REaci fromfire BC and POM (−0.62± 0.03 W m−2) is smaller in mag-nitude than from all fire aerosols (−0.70± 0.05 W m−2) dueto the nonlinear interactions of fire BC and fire POM (Jianget al., 2013) as well as the negative REaci of fire sulfate. Asan example of the nonlinear interactions, the internal mix-ing of fire POM and fire BC by all fire aerosols enhancesthe cloud droplet number concentration in comparison to thesum of cloud droplet number concentrations from individualfire POM and fire BC (Jiang et al., 2013).
www.atmos-chem-phys.net/16/14805/2016/ Atmos. Chem. Phys., 16, 14805–14824, 2016

14814 Y. Jiang et al.: Impacts of global open-fire aerosols
Figure 7. Seasonal variation of radiative effects of all fire aerosols due to aerosol–cloud interactions (REaci) (W m−2) for the period of2003–2011 for (a) December–January–February (DJF), (b) March–April–May (MAM), (c) June–July–August (JJA) and (d) September–October–November (SON). The plus signs denote the regions where the radiative effect is statistically significant at the 0.05 level.
The seasonal variation of all fire aerosol REaci is shownin Fig. 7. The maximum of fire aerosol REaci is in the borealsummer (i.e., the fire season in NH), located in the NH highlatitudes (60 to 90◦ N). The largest summer REaci is found inthe land areas and is as large as−15 W m−2. The fire aerosolREaci in the tropical regions is most significant in the borealsummer (up to−15 W m−2) and autumn (up to−10 W m−2)
over the ocean areas. The different spatial distributions offire aerosol REaci in the NH high latitudes and in the trop-ics result from the difference in cloud distribution betweenthe two regions. During the fire season the cloud LWP overthe land areas in the NH middle and high latitudes is 3 timeslarger than over the ocean areas in the tropics. Larger cloudLWP favors the stronger REaci, because a larger LWP asso-ciated with warm cloud and rain processes favors the aerosolindirect effect of slowing down the autoconversion of cloudwater to rain (Ghan et al., 2012; Jiang et al., 2015). Mean-while, in the NH high latitudes, the lower solar zenith anglein the boreal summer favors the stronger REaci. Like the fireaerosol REari, the smallest fire aerosol REaci occurs in theboreal spring.
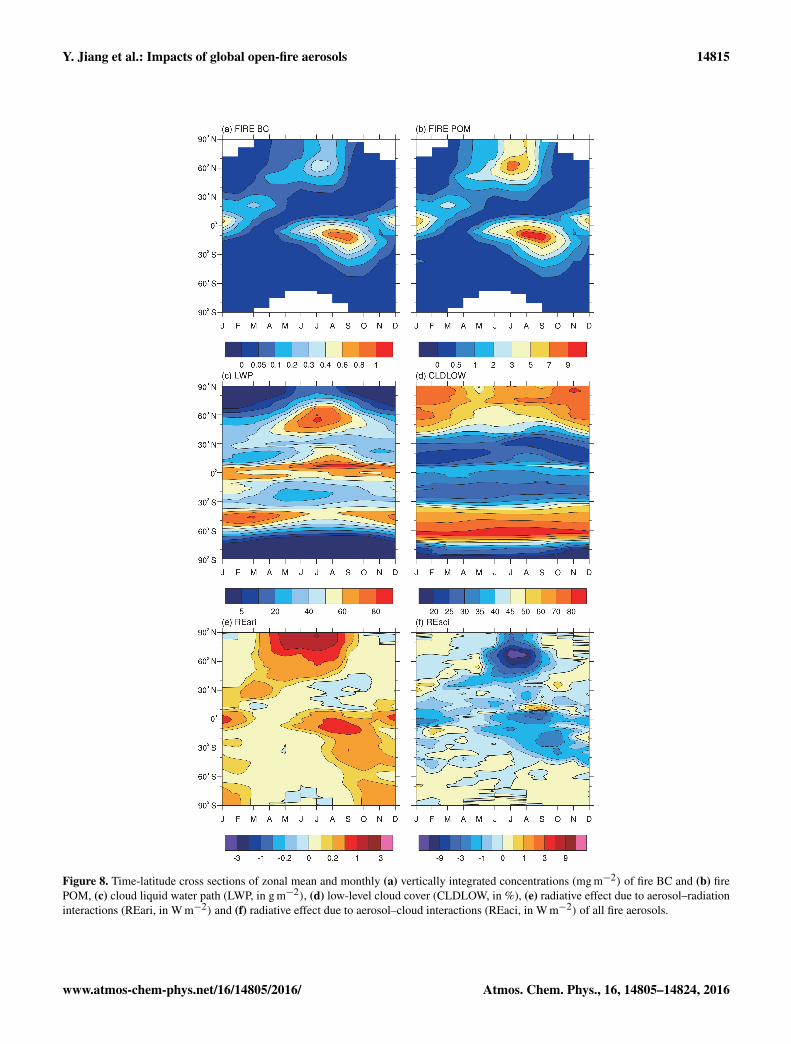
Seasonal variations of zonal mean fire aerosol REari,REaci, cloud LWP, amount of low-level (from surface to750 hPa) cloud and vertically integrated (burden) concentra-tions of fire POM and fire BC are shown in Fig. 8. The sea-sonal variation of fire BC and fire POM burdens is largestin the SH low latitudes (from 30◦ S to 0◦ N) and NH mid-
dle and high latitudes (50 to 90◦ N). A distinct feature ofthese two areas is that the maximum fire BC burden in NH(0.3 mg m−2) is much lower than in SH (0.8 mg m−2), whilethe maximum POM burdens in these two areas are compa-rable. Interestingly, the REari is larger in the boreal summerin NH than in the boreal autumn in SH, although the fire BCburden is much lower in the NH summer. It is mainly dueto the larger amount of low cloud in the NH high latitudes,which enhances the absorption of fire BC. The maximumREari in the NH summer is found near the North Pole (70to 90◦ N) and not around 60◦ N where the fire aerosol burdenis highest. The REaci of fire aerosols is about 3 times largerin the boreal summer in NH than in the boreal autumn inSH, although the burden of fire POM in NH is comparable tothat in SH. The larger cloud LWP in the NH summer around40–70◦ N favors the stronger REaci there.
3.4 Surface-albedo effect
Here we compare the modeled BC-in-snow (BCS) concen-trations with observation data collected from multiple fieldcampaigns over the Arctic (Doherty et al., 2010) and north-ern China (Wang et al., 2013b; Qian et al., 2014). Figure 9ashows the simulated (from FIRE and NOFIRE experiments)and observed BCS concentrations as a function of latitude.The range of observed BCS concentrations is between 1 and200 ng g−1 in the Arctic and between 50 and 2000 ng g−1 in
Atmos. Chem. Phys., 16, 14805–14824, 2016 www.atmos-chem-phys.net/16/14805/2016/
Y. Jiang et al.: Impacts of global open-fire aerosols 14815
Figure 8. Time-latitude cross sections of zonal mean and monthly (a) vertically integrated concentrations (mg m−2) of fire BC and (b) firePOM, (c) cloud liquid water path (LWP, in g m−2), (d) low-level cloud cover (CLDLOW, in %), (e) radiative effect due to aerosol–radiationinteractions (REari, in W m−2) and (f) radiative effect due to aerosol–cloud interactions (REaci, in W m−2) of all fire aerosols.
www.atmos-chem-phys.net/16/14805/2016/ Atmos. Chem. Phys., 16, 14805–14824, 2016

14816 Y. Jiang et al.: Impacts of global open-fire aerosols
40 45 50 55 60 65 70 75 8010-1
100
101
102
103
104
ObservationFire-onFire-off
BCintopsnow
layer(ngg-1 )
Latitude N
a
Observation
Fire-off
Fire-on
Observation
Fire-off
Fire-on
10-1
100
101
102
103
104
b
BCintopsnow
layer(ngg-1 )
Northern ChinaArctic
Figure 9. Evaluation of CAM5-simulated black carbon (BC) concentration for the period of 2003–2011 (in ng g−1) in the top snow layeragainst observations in the Arctic (Doherty et al., 2010) and northern China (Wang et al., 2013b). The top snow layer ranges in thicknessfrom 1 to 3 cm. Configuration of the two CAM5 simulations (FIRE and NOFIRE) is summarized in Table 1. Panel (a) shows the comparisonsat different latitudes. The box and whisker plot in (b) shows the minimum and maximum value with the bar, the 25th and 75th percentileswith the box, the 50th percentile (i.e., median) by the bar within the box and the mean value with the dot.
northern China. Both FIRE and NOFIRE experiments cap-ture the meridional gradient in BCS concentrations betweenthe midlatitudes (northern China) and high latitudes (Arctic).The mean and median concentrations of BCS are both over-estimated in northern China, implying high biases from theanthropogenic emissions and/or model physics (Fig. 9b). Themean and median BCS concentrations from the FIRE exper-iment agree slightly better with the observations than thosefrom the NOFIRE experiment in the Arctic (Fig. 9b). Thissuggests that fire emissions are important for BCS concen-trations in the Arctic.
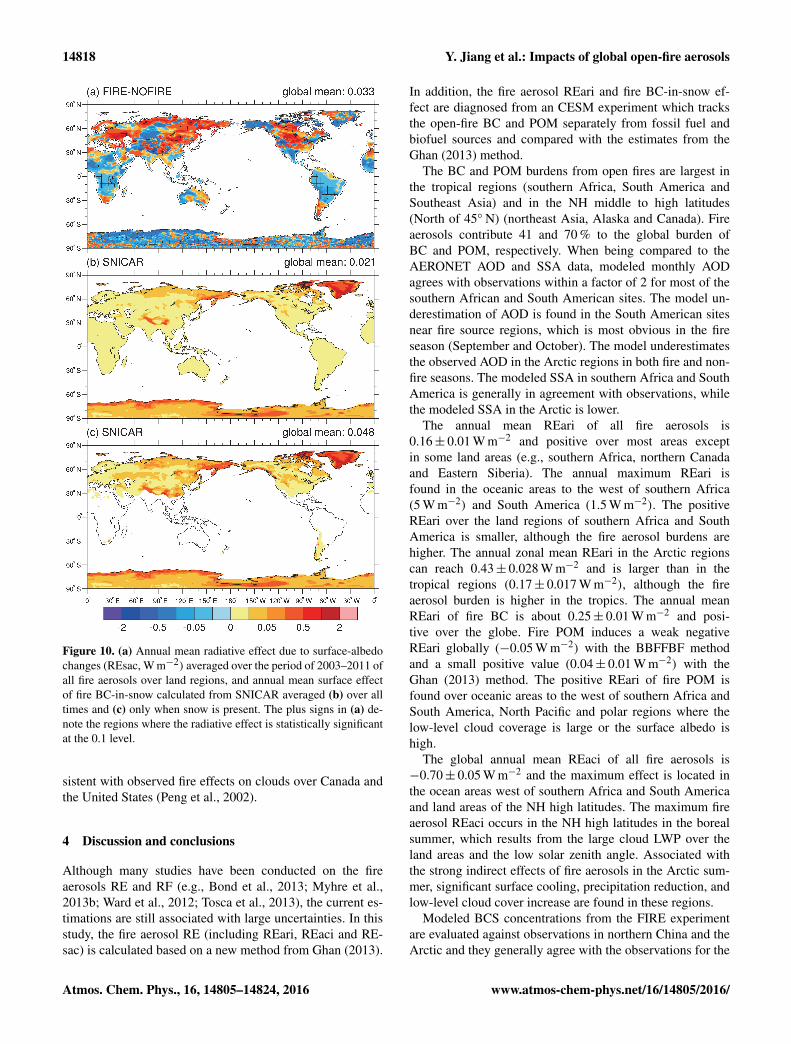
The annual mean REsac of all fire aerosols estimatedwith Ghan (2013) and the fire BCS effect diagnosed fromSNICAR are shown in Fig. 10a. We note that the radia-tive effect due to BC deposition on sea ice is not con-sidered since sea ice is prescribed in the simulations. Theglobal annual mean REsac (0.03± 0.10 W m−2) is muchsmaller compared to the REari and REaci. The REsac overland is maximum in spring (0.12± 0.27 W m−2) and win-ter (0.06± 0.16 W m−2). The REsac over land in summerand autumn is very small (less than 0.01 W m−2). We notethat the mean REsac calculated from Ghan (2013) is muchsmaller than the standard deviation which resulted from theinternal variability.
The annual mean fire BCS effect calculated from SNICARis shown in Fig. 10b and c. The spatial distribution of thefire BCS effect is similar to the fire REsac, implying that thefire REsac has a significant contribution from the fire BCSeffect. Averaged when only snow is present, the fire BCS ef-fect is larger (0.048 W m−2). The global mean fire BCS effect(with the presence of snow) can be as large as 0.06 W m−2 inspring. The maximum fire BCS effect (up to 1 W m−2) is lo-cated in Greenland and the very northern reaches of Canada,
while in the other Arctic regions and northern China it issmaller.
The positive REsac in Siberia, North America and Canadacan be a result of the BCS effect. However, the REsac in theseregions is larger than the BCS effect especially in spring.The snow melting and snow depth change due to the BCSwarming may induce a larger positive REsac than the albedochange due to BCS itself. The negative REsac over land canbe a result of atmospheric feedbacks caused by fire aerosols(Ghan, 2013).
3.5 Fire aerosol effects on shortwave radiation, globaltemperature and precipitation
Here, we show the annual mean net shortwave flux changesat TOA (i.e., total radiative effect), in the atmosphere andat the surface as well as changes in surface air temper-ature, convective and large-scale precipitation due to allfire aerosols in Fig. 11 and Table 2. The global mean netshortwave flux change at TOA due to all fire aerosols is−0.55± 0.07 W m−2, which indicates that fire aerosols leadto the reduction of shortwave flux into the Earth’s system.The zonal mean TOA shortwave flux reduction in the Arc-tic regions (−1.35± 1.03 W m−2) is much larger than in thetropical regions (−0.66± 0.09 W m−2). The cooling at TOAis mostly from fire aerosol REaci. The maximum negativeRE is located in the land areas of the Arctic and ocean areasof the tropics. Although the global mean total radiative effectis negative, a positive effect is found in some land areas (e.g.,Africa, Greenland).
Atmos. Chem. Phys., 16, 14805–14824, 2016 www.atmos-chem-phys.net/16/14805/2016/

Y. Jiang et al.: Impacts of global open-fire aerosols 14817
Table 2. Global, tropics (25◦ S to 25◦ N) and Arctic (60 to 90◦ N) annual mean fire aerosol (POM and BC) burdens, fire aerosol AOD, totalfire aerosol radiative effect (RE) at TOA, radiative effects due to aerosol–radiation interactions (REari), due to aerosol–cloud interactions(REaci), surface-albedo changes (REsac) and changes in cloud liquid water path (LWP), low-level cloud cover, net solar fluxes at thesurface, shortwave atmospheric absorption, surface air temperature and precipitation (total, convective and large scale) due to all fire aerosols.Standard deviations about the 10-ensemble means are included.
Global Tropics Arctic(25◦ S to 25◦ N) (60 to 90◦ N)
Fire POM burden (mg m−2) 1.25± 0.01 1.87± 0.01 1.70± 0.08Fire BC burden (mg m−2) 0.106± 0.001 0.17± 0.001 0.09± 0.004Fire aerosol optical depth 0.008± 0.001 0.012± 0.001 0.007± 0.0004Total radiative effect (W m−2) −0.55± 0.07 −0.66± 0.09 −1.35± 1.03Radiative effect due to ARI (W m−2) 0.16± 0.01 0.17± 0.017 0.43± 0.028Radiative effect due to ACI (W m−2) −0.70± 0.05 −0.82± 0.09 −1.38± 0.23Radiative effect due to surface-albedo changes (over land, W m−2) 0.03± 0.10 −0.04± 0.06 0.09± 0.80Cloud liquid water path (g m−2) 1.62± 0.01 1.95± 0.13 2.59± 0.25Low-level cloud cover (%) 0.012± 0.06 −0.055± 0.05 0.46± 0.45Net solar flux at surface (W m−2) −1.38± 0.05 −1.91± 0.12 −2.27± 1.04Shortwave atmospheric absorption (W m−2) 0.83± 0.03 1.25± 0.04 0.92± 0.05Surface air temperature (K) −0.03± 0.03 −0.024± 0.011 −0.15± 0.20Total precipitation rate (mm day−1) −0.010± 0.002 −0.016± 0.01 −0.001± 0.02Convective precipitation rate (mm day−1) −0.003± 0.002 −0.001± 0.009 −0.005± 0.003Large-scale precipitation rate (mm day−1) −0.007± 0.002 −0.015± 0.003 0.004± 0.019
The shortwave atmospheric absorption change in the trop-ical regions is larger than in the Arctic regions. It is becauseBC burden in the tropics (0.17 mg m−2) is larger than in theArctic (0.09 mg m−2). Strong absorption (∼ 8 W m−2) in theatmosphere is found in the land areas of southern Africa andSouth America and in the southeast Atlantic. The surfaceshortwave flux change in the Arctic is mostly from the TOAshortwave flux reduction due to the fire aerosol REaci, whilethe surface shortwave flux change in the tropics is mostly dueto the fire BC absorption in the atmosphere.
The fire aerosols lead to the reduction of the global meansurface air temperature (Ts) by 0.03± 0.03 K, consistent withthe reduction of shortwave fluxes at TOA and at the surface.The largest surface cooling is found in the Arctic and tropicalregions by up to 0.6 K. The cooling of the Arctic is related tothe strong fire aerosol REaci, while the cooling in the tropicsis mainly from the surface shortwave flux reduction due tothe fire BC absorption. The Ts change in the ocean areas isvery small since the SST is prescribed in our simulations.
The global mean total precipitation is reduced by0.010± 0.002 mm day−1 due to all fire aerosols (Table 2).Unlike the Ts change, the precipitation reduction in the trop-ics (0.016± 0.01 mm day−1) is much larger than in the Arc-tic (0.001± 0.02 mm day−1, not statistically significant). Thereduction in the tropics is mainly from the large-scale pre-cipitation decrease (0.015± 0.003 mm day−1). The net de-crease in convective precipitation is very small in the trop-ics (0.001± 0.009 mm day−1, not statistically significant), asthe convective precipitation significantly decreases near theequator and increases in the regions away from the equator,
partly consistent with the results of Tosca et al. (2013). Theprecipitation reduction in southern Africa is consistent withthe recent findings of Hodnebrog et al. (2016). The shortwaveflux reduction at the surface leads to a stabilization of the at-mospheric boundary layer and a suppression of convectionnear the equator. The strong atmospheric absorption by fireBC leads to the reduction of low-level clouds and large-scaleprecipitation in the tropics. Both effects lead to a significantreduction of total precipitation near the equator. The precip-itation decrease in the NH high latitudes is mainly from thereduction of convective precipitation. We note that the tem-perature and (especially) precipitation changes reported heredo not represent the complete impact of fire aerosols, sincethe SSTs are fixed in our simulations. Fully coupled atmo-sphere and ocean models will be used to further investigatethe impact of fire aerosols.
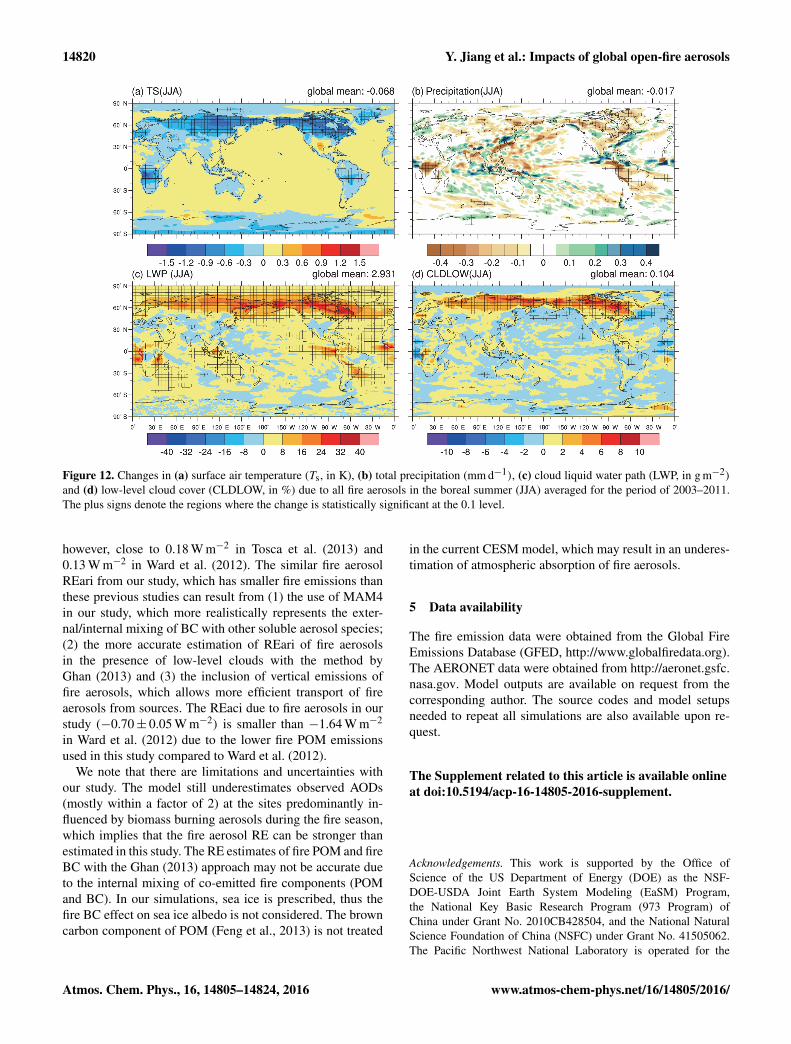
Figure 12 shows the changes of Ts, total precipitation,cloud LWP and low-level cloud cover in the boreal sum-mer due to all fire aerosols. The Ts is reduced by morethan 1 K in most of land areas around 60◦ N. The maxi-mum cooling (larger than 1.5 K) is found in Eastern Siberia,Alaska and Canada. A decrease of total precipitation (byabout 0.2 mm day−1) is found in these regions. Accompa-nying the surface cooling and precipitation reduction, a sig-nificant increase of cloud LWP and low-level cloud coveris found there. This is a result of the indirect effect of fireaerosols in the land areas of the Arctic (60 to 90◦ N). The firePOM leads to the reduction of cloud droplet effective radiusand the increase of cloud droplet number concentration, con-
www.atmos-chem-phys.net/16/14805/2016/ Atmos. Chem. Phys., 16, 14805–14824, 2016
14818 Y. Jiang et al.: Impacts of global open-fire aerosols
Figure 10. (a) Annual mean radiative effect due to surface-albedochanges (REsac, W m−2) averaged over the period of 2003–2011 ofall fire aerosols over land regions, and annual mean surface effectof fire BC-in-snow calculated from SNICAR averaged (b) over alltimes and (c) only when snow is present. The plus signs in (a) de-note the regions where the radiative effect is statistically significantat the 0.1 level.
sistent with observed fire effects on clouds over Canada andthe United States (Peng et al., 2002).
4 Discussion and conclusions
Although many studies have been conducted on the fireaerosols RE and RF (e.g., Bond et al., 2013; Myhre et al.,2013b; Ward et al., 2012; Tosca et al., 2013), the current es-timations are still associated with large uncertainties. In thisstudy, the fire aerosol RE (including REari, REaci and RE-sac) is calculated based on a new method from Ghan (2013).
In addition, the fire aerosol REari and fire BC-in-snow ef-fect are diagnosed from an CESM experiment which tracksthe open-fire BC and POM separately from fossil fuel andbiofuel sources and compared with the estimates from theGhan (2013) method.
The BC and POM burdens from open fires are largest inthe tropical regions (southern Africa, South America andSoutheast Asia) and in the NH middle to high latitudes(North of 45◦ N) (northeast Asia, Alaska and Canada). Fireaerosols contribute 41 and 70 % to the global burden ofBC and POM, respectively. When being compared to theAERONET AOD and SSA data, modeled monthly AODagrees with observations within a factor of 2 for most of thesouthern African and South American sites. The model un-derestimation of AOD is found in the South American sitesnear fire source regions, which is most obvious in the fireseason (September and October). The model underestimatesthe observed AOD in the Arctic regions in both fire and non-fire seasons. The modeled SSA in southern Africa and SouthAmerica is generally in agreement with observations, whilethe modeled SSA in the Arctic is lower.
The annual mean REari of all fire aerosols is0.16± 0.01 W m−2 and positive over most areas exceptin some land areas (e.g., southern Africa, northern Canadaand Eastern Siberia). The annual maximum REari isfound in the oceanic areas to the west of southern Africa(5 W m−2) and South America (1.5 W m−2). The positiveREari over the land regions of southern Africa and SouthAmerica is smaller, although the fire aerosol burdens arehigher. The annual zonal mean REari in the Arctic regionscan reach 0.43± 0.028 W m−2 and is larger than in thetropical regions (0.17± 0.017 W m−2), although the fireaerosol burden is higher in the tropics. The annual meanREari of fire BC is about 0.25± 0.01 W m−2 and posi-tive over the globe. Fire POM induces a weak negativeREari globally (−0.05 W m−2) with the BBFFBF methodand a small positive value (0.04± 0.01 W m−2) with theGhan (2013) method. The positive REari of fire POM isfound over oceanic areas to the west of southern Africa andSouth America, North Pacific and polar regions where thelow-level cloud coverage is large or the surface albedo ishigh.
The global annual mean REaci of all fire aerosols is−0.70± 0.05 W m−2 and the maximum effect is located inthe ocean areas west of southern Africa and South Americaand land areas of the NH high latitudes. The maximum fireaerosol REaci occurs in the NH high latitudes in the borealsummer, which results from the large cloud LWP over theland areas and the low solar zenith angle. Associated withthe strong indirect effects of fire aerosols in the Arctic sum-mer, significant surface cooling, precipitation reduction, andlow-level cloud cover increase are found in these regions.
Modeled BCS concentrations from the FIRE experimentare evaluated against observations in northern China and theArctic and they generally agree with the observations for the
Atmos. Chem. Phys., 16, 14805–14824, 2016 www.atmos-chem-phys.net/16/14805/2016/

Y. Jiang et al.: Impacts of global open-fire aerosols 14819
Figure 11. Annual mean net shortwave flux changes (W m−2) over the period of 2003–2011 (a) at top of the atmosphere, (b) in the at-mosphere, (c) at the surface and changes of (d) surface air temperature (Ts, K), (e) convective precipitation (mm d−1) and (f) large-scaleprecipitation (mm d−1) due to all fire aerosols. The plus signs denote the regions where the change is statistically significant at the 0.1 level.
mean and median values in the Arctic regions. The high biasof modeled BCS concentrations in northern China may notresult from the fire BC because differences in BCS concen-trations between FIRE and NOFIRE experiments are verysmall in northern China. The global annual mean REsac is0.03± 0.10 W m−2 (statistically insignificant) with the max-imum effect in spring (0.12 W m−2). The REsac is mainlydue to the effect of fire BC deposit on snow (0.02 W m−2)
diagnosed from SNICAR with the maximum effect as largeas 0.06 W m−2 (when snow is present) in spring.
The fire aerosols reduce the global mean surface airtemperature (Ts) by 0.03± 0.03 K and precipitation by0.01± 0.002 mm day−1. The maximum cooling (∼ 1 K) dueto fire aerosols occurs around 60◦ N in boreal summer, and asuppression of precipitation (∼ 0.1 mm day−1) is also foundthere. The strong cooling is a result of the strong indirect ef-
fects (−15 W m−2) in the land areas of the Arctic regions (60to 90◦ N). A significant reduction of precipitation in southernAfrica is also noticed. We note that these results are based onthe simulations with fixed SSTs and may not represent thefull climate responses.
In our study, the global radiative effect of fire aerosols isestimated from simulations performed with the 4-mode ver-sion modal aerosol module (MAM4) (Liu et al., 2016), dailyfire emissions with prescribed vertical emission profiles, andhigher model resolution (0.9◦ by 1.25◦) compared to earliermodeling studies of fire aerosols (Tosca et al., 2013; Wardet al., 2012). In their studies, the GFED fire aerosol emis-sions were increased by a factor of 1–3 depending on regionsmatching the observed AOD. In our study, we do not applythe scaling factor to the fire aerosol emissions. Our globalannual mean REari of fire aerosols (0.16± 0.01 W m−2) is,
www.atmos-chem-phys.net/16/14805/2016/ Atmos. Chem. Phys., 16, 14805–14824, 2016
14820 Y. Jiang et al.: Impacts of global open-fire aerosols
Figure 12. Changes in (a) surface air temperature (Ts, in K), (b) total precipitation (mm d−1), (c) cloud liquid water path (LWP, in g m−2)and (d) low-level cloud cover (CLDLOW, in %) due to all fire aerosols in the boreal summer (JJA) averaged for the period of 2003–2011.The plus signs denote the regions where the change is statistically significant at the 0.1 level.
however, close to 0.18 W m−2 in Tosca et al. (2013) and0.13 W m−2 in Ward et al. (2012). The similar fire aerosolREari from our study, which has smaller fire emissions thanthese previous studies can result from (1) the use of MAM4in our study, which more realistically represents the exter-nal/internal mixing of BC with other soluble aerosol species;(2) the more accurate estimation of REari of fire aerosolsin the presence of low-level clouds with the method byGhan (2013) and (3) the inclusion of vertical emissions offire aerosols, which allows more efficient transport of fireaerosols from sources. The REaci due to fire aerosols in ourstudy (−0.70± 0.05 W m−2) is smaller than −1.64 W m−2
in Ward et al. (2012) due to the lower fire POM emissionsused in this study compared to Ward et al. (2012).
We note that there are limitations and uncertainties withour study. The model still underestimates observed AODs(mostly within a factor of 2) at the sites predominantly in-fluenced by biomass burning aerosols during the fire season,which implies that the fire aerosol RE can be stronger thanestimated in this study. The RE estimates of fire POM and fireBC with the Ghan (2013) approach may not be accurate dueto the internal mixing of co-emitted fire components (POMand BC). In our simulations, sea ice is prescribed, thus thefire BC effect on sea ice albedo is not considered. The browncarbon component of POM (Feng et al., 2013) is not treated
in the current CESM model, which may result in an underes-timation of atmospheric absorption of fire aerosols.
5 Data availability
The fire emission data were obtained from the Global FireEmissions Database (GFED, http://www.globalfiredata.org).The AERONET data were obtained from http://aeronet.gsfc.nasa.gov. Model outputs are available on request from thecorresponding author. The source codes and model setupsneeded to repeat all simulations are also available upon re-quest.
The Supplement related to this article is available onlineat doi:10.5194/acp-16-14805-2016-supplement.
Acknowledgements. This work is supported by the Office ofScience of the US Department of Energy (DOE) as the NSF-DOE-USDA Joint Earth System Modeling (EaSM) Program,the National Key Basic Research Program (973 Program) ofChina under Grant No. 2010CB428504, and the National NaturalScience Foundation of China (NSFC) under Grant No. 41505062.The Pacific Northwest National Laboratory is operated for the
Atmos. Chem. Phys., 16, 14805–14824, 2016 www.atmos-chem-phys.net/16/14805/2016/

Y. Jiang et al.: Impacts of global open-fire aerosols 14821
DOE by the Battelle Memorial Institute under contract DE-AC05-76RL01830. The authors would like to acknowledge theuse of computational resources (ark:/85065/d7wd3xhc) at theNCAR-Wyoming Supercomputing Center provided by the NationalScience Foundation and the State of Wyoming, and supported byNCAR’s Computational and Information Systems Laboratory. Thefire emission data were obtained from the Global Fire EmissionsDatabase (GFED, http://www.globalfiredata.org). The AERONETdata were obtained from http://aeronet.gsfc.nasa.gov. We thankXiangjun Shi for the help with processing the AERONET data.
Edited by: K. TsigaridisReviewed by: two anonymous referees
References
Abel, S. J., Highwood, E. J., Haywood, J. M., and Stringer, M.A.: The direct radiative effect of biomass burning aerosolsover southern Africa, Atmos. Chem. Phys., 5, 1999–2018,doi:10.5194/acp-5-1999-2005, 2005.
Ackerman, A. S., Toon, O. B., Stevens, D. E., Heyms-field, A. J., Ramanathan, V., and Welton, E. J.: Reductionof Tropical Cloudiness by Soot, Science, 288, 1042–1047,doi:10.1126/science.288.5468.1042, 2000.
Andreae, M. O. and Rosenfeld, D.: Aerosol–cloud–precipitation interactions. Part 1. The nature and sourcesof cloud-active aerosols, Earth-Sci. Rev., 89, 13–41,doi:10.1016/j.earscirev.2008.03.001, 2008.
Andreae, M. O., Rosenfeld, D., Artaxo, P., Costa, A. A., Frank,G. P., Longo, K. M., and Silva-Dias, M. A. F.: SmokingRain Clouds over the Amazon, Science, 303, 1337–1342,doi:10.1126/science.1092779, 2004.
Bistinas, I., Harrison, S. P., Prentice, I. C., and Pereira, J. M.C.: Causal relationships versus emergent patterns in the globalcontrols of fire frequency, Biogeosciences, 11, 5087–5101,doi:10.5194/bg-11-5087-2014, 2014.
Bond, T. C., Doherty, S. J., Fahey, D. W., Forster, P. M., Berntsen,T., DeAngelo, B. J., Flanner, M. G., Ghan, S., Karcher, B., Koch,D., Kinne, S., Kondo, Y., Quinn, P. K., Sarofim, M. C., Schultz,M. G., Schulz, M., Venkataraman, C., Zhang, H., Zhang, S.,Bellouin, N., Guttikunda, S. K., Hopke, P. K., Jacobson, M.Z., Kaiser, J. W., Klimont, Z., Lohmann, U., Schwarz, J. P.,Shindell, D., Storelvmo, T., Warren, S. G., and Zender, C. S.:Bounding the role of black carbon in the climate system: A sci-entific assessment, J. Geophys. Res.-Atmos., 118, 5380–5552,doi:10.1002/Jgrd.50171, 2013.
Boucher, O. and Tanré, D.: Estimation of the aerosol perturbationto the Earth’s Radiative Budget over oceans using POLDERsatellite aerosol retrievals, Geophys. Res. Lett., 27, 1103–1106,doi:10.1029/1999GL010963, 2000.
Bowman, D. M. J. S., Balch, J. K., Artaxo, P., Bond, W. J., Carlson,J. M., Cochrane, M. A., D’Antonio, C. M., DeFries, R. S., Doyle,J. C., Harrison, S. P., Johnston, F. H., Keeley, J. E., Krawchuk,M. A., Kull, C. A., Marston, J. B., Moritz, M. A., Prentice, I. C.,Roos, C. I., Scott, A. C., Swetnam, T. W., van der Werf, G. R.,and Pyne, S. J.: Fire in the Earth System, Science, 324, 481–484,doi:10.1126/science.1163886, 2009.
Carslaw, K. S., Boucher, O., Spracklen, D. V., Mann, G. W., Rae,J. G. L., Woodward, S., and Kulmala, M.: A review of natu-ral aerosol interactions and feedbacks within the Earth system,Atmos. Chem. Phys., 10, 1701–1737, doi:10.5194/acp-10-1701-2010, 2010.
Chakrabarty, R. K., Beres, N. D., Moosmüller, H., China, S., Maz-zoleni, C., Dubey, M. K., Liu, L., and Mishchenko, M. I.: Sootsuperaggregates from flaming wildfires and their direct radia-tive forcing, Scientific Reports, 4, 5508, doi:10.1038/srep05508,2014.
Ciais, P., Sabine, C., Bala, G., Bopp, L., Brovkin, V., Canadell, J.,Chhabra, A., DeFries, R., Galloway, J., Heimann, M., Jones, C.,Le Quéré, C., Myneni, R. B., Piao, S., and Thornton, P.: Carbonand Other Biogeochemical Cycles, in: Climate Change 2013:The Physical Science Basis. Contribution of Working Group I tothe Fifth Assessment Report of the Intergovernmental Panel onClimate Change, edited by: Stocker, T. F., Qin, D., Plattner, G.-K., Tignor, M., Allen, S. K., Boschung, J., Nauels, A., Xia, Y.,Bex, V., and Midgley, P. M., Cambridge University Press, Cam-bridge, UK and New York, NY, USA, 465–570, 2013.
Cohen, J. B. and Wang, C.: Estimating global black carbon emis-sions using a top-down Kalman Filter approach, J. Geophys.Res.-Atmos., 119, 2013JD019912, doi:10.1002/2013JD019912,2014.
Dentener, F., Kinne, S., Bond, T., Boucher, O., Cofala, J., Generoso,S., Ginoux, P., Gong, S., Hoelzemann, J. J., Ito, A., Marelli, L.,Penner, J. E., Putaud, J.-P., Textor, C., Schulz, M., van der Werf,G. R., and Wilson, J.: Emissions of primary aerosol and precur-sor gases in the years 2000 and 1750 prescribed data-sets for Ae-roCom, Atmos. Chem. Phys., 6, 4321–4344, doi:10.5194/acp-6-4321-2006, 2006.
Doherty, S. J., Warren, S. G., Grenfell, T. C., Clarke, A. D.,and Brandt, R. E.: Light-absorbing impurities in Arctic snow,Atmos. Chem. Phys., 10, 11647–11680, doi:10.5194/acp-10-11647-2010, 2010.
Feng, Y., Ramanathan, V., and Kotamarthi, V. R.: Brown carbon:a significant atmospheric absorber of solar radiation?, Atmos.Chem. Phys., 13, 8607–8621, doi:10.5194/acp-13-8607-2013,2013.
Flanner, M. G. and Zender, C. S.: Snowpack radiative heating:Influence on Tibetan Plateau climate, Geophys. Res. Lett., 32,L06501, L06501, doi:10.1029/2004gl022076, 2005.
Flanner, M. G., Zender, C. S., Randerson, J. T., and Rasch,P. J.: Present-day climate forcing and response from blackcarbon in snow, J. Geophys. Res.-Atmos., 112, D11202,doi:10.1029/2006JD008003, 2007.
Flanner, M. G., Zender, C. S., Hess, P. G., Mahowald, N. M.,Painter, T. H., Ramanathan, V., and Rasch, P. J.: Springtimewarming and reduced snow cover from carbonaceous particles,Atmos. Chem. Phys., 9, 2481–2497, doi:10.5194/acp-9-2481-2009, 2009.
Forster, P., Ramaswamy, V., Artaxo, P., Berntsen, T., Betts, R., Fa-hey, D. W., Haywood, J., Lean, J., Lowe, D. C., Myhre, G.,Nganga, J., Prinn, R., Raga, G., Schulz, M., and Van Dorland,R.: Changes in Atmospheric Constituents and in Radiative Forc-ing, in: Climate Change 2007: The Physical Science Basis. Con-tribution of Working Group I to the Fourth Assessment Reportof the Intergovernmental Panel on Climate Change, edited by:Solomon, S., Qin, D., Manning, M., Chen, Z., Marquis, M., Av-
www.atmos-chem-phys.net/16/14805/2016/ Atmos. Chem. Phys., 16, 14805–14824, 2016

14822 Y. Jiang et al.: Impacts of global open-fire aerosols
eryt, K. B., Tignor, M., and Miller, H. L., Cambridge UniversityPress, Cambridge, UK and New York, NY, USA, 2007.
Ghan, S. J.: Technical Note: Estimating aerosol effects oncloud radiative forcing, Atmos. Chem. Phys., 13, 9971–9974,doi:10.5194/acp-13-9971-2013, 2013.
Ghan, S. J., Liu, X., Easter, R. C., Zaveri, R., Rasch, P. J., Yoon, J.-H., and Eaton, B.: Toward a Minimal Representation of Aerosolsin Climate Models: Comparative Decomposition of Aerosol Di-rect, Semidirect, and Indirect Radiative Forcing, J. Climate, 25,6461–6476, doi:10.1175/JCLI-D-11-00650.1, 2012.
Giglio, L., Randerson, J. T., and van der Werf, G. R.: Analy-sis of daily, monthly, and annual burned area using the fourth-generation global fire emissions database (GFED4), J. Geophys.Res.-Biogeo., 118, 317–328, doi:10.1002/jgrg.20042, 2013.
Hansen, J., Sato, M., Ruedy, R., Nazarenko, L., Lacis, A., Schmidt,G. A., Russell, G., Aleinov, I., Bauer, M., Bauer, S., Bell, N.,Cairns, B., Canuto, V., Chandler, M., Cheng, Y., Del Genio, A.,Faluvegi, G., Fleming, E., Friend, A., Hall, T., Jackman, C., Kel-ley, M., Kiang, N., Koch, D., Lean, J., Lerner, J., Lo, K., Menon,S., Miller, R., Minnis, P., Novakov, T., Oinas, V., Perlwitz, J.,Perlwitz, J., Rind, D., Romanou, A., Shindell, D., Stone, P., Sun,S., Tausnev, N., Thresher, D., Wielicki, B., Wong, T., Yao, M.,and Zhang, S.: Efficacy of climate forcings, J. Geophys. Res.-Atmos., 110, D18104, doi:10.1029/2005JD005776, 2005.
Heald, C. L., Ridley, D. A., Kroll, J. H., Barrett, S. R. H., Cady-Pereira, K. E., Alvarado, M. J., and Holmes, C. D.: Contrastingthe direct radiative effect and direct radiative forcing of aerosols,Atmos. Chem. Phys., 14, 5513–5527, doi:10.5194/acp-14-5513-2014, 2014.
Hodnebrog, Ø., Myhre, G., Forster, P. M., Sillmann, J., and Sam-set, B. H.: Local biomass burning is a dominant cause of the ob-served precipitation reduction in southern Africa, Nat. Commun.,7, 11236, doi:10.1038/ncomms11236, 2016.
Jacobson, M. Z.: Climate response of fossil fuel and biofuelsoot, accounting for soot’s feedback to snow and sea icealbedo and emissivity, J. Geophys. Res.-Atmos., 109, D21201,doi:10.1029/2004JD004945, 2004.
Jiang, Y., Liu, X., Yang, X.-Q., and Wang, M.: A numericalstudy of the effect of different aerosol types on East Asiansummer clouds and precipitation, Atmos. Environ., 70, 51–63,doi:10.1016/j.atmosenv.2012.12.039, 2013.
Jiang, Y., Yang, X.-Q., and Liu, X.: Seasonality in anthro-pogenic aerosol effects on East Asian climate simulatedwith CAM5, J. Geophys. Res.-Atmos., 120, 2015JD023451,doi:10.1002/2015JD023451, 2015.
Jones, A., Haywood, J. M., and Boucher, O.: Aerosol forcing,climate response and climate sensitivity in the Hadley Cen-tre climate model, J. Geophys. Res.-Atmos., 112, D20211,doi:10.1029/2007JD008688, 2007.
Kaiser, J. W., Heil, A., Andreae, M. O., Benedetti, A., Chubarova,N., Jones, L., Morcrette, J.-J., Razinger, M., Schultz, M. G.,Suttie, M., and van der Werf, G. R.: Biomass burning emis-sions estimated with a global fire assimilation system basedon observed fire radiative power, Biogeosciences, 9, 527–554,doi:10.5194/bg-9-527-2012, 2012.
Keywood, M., Kanakidou, M., Stohl, A., Dentener, F., Grassi,G., Meyer, C. P., Torseth, K., Edwards, D., Thompson, A. M.,Lohmann, U., and Burrows, J.: Fire in the Air: Biomass Burn-
ing Impacts in a Changing Climate, Crit. Rev. Env. Sci. Tec., 43,40–83, doi:10.1080/10643389.2011.604248, 2011.
Koch, D. and Del Genio, A. D.: Black carbon semi-direct effectson cloud cover: review and synthesis, Atmos. Chem. Phys., 10,7685–7696, doi:10.5194/acp-10-7685-2010, 2010.
Koch, D., Menon, S., Del Genio, A., Ruedy, R., Alienov, I.,and Schmidt, G. A.: Distinguishing Aerosol Impacts on Cli-mate over the Past Century, J. Climate, 22, 2659–2677,doi:10.1175/2008JCLI2573.1, 2009.
Koch, D., Balkanski, Y., Bauer, S. E., Easter, R. C., Ferrachat, S.,Ghan, S. J., Hoose, C., Iversen, T., Kirkevåg, A., Kristjansson, J.E., Liu, X., Lohmann, U., Menon, S., Quaas, J., Schulz, M., Se-land, Ø., Takemura, T., and Yan, N.: Soot microphysical effectson liquid clouds, a multi-model investigation, Atmos. Chem.Phys., 11, 1051–1064, doi:10.5194/acp-11-1051-2011, 2011.
Koren, I., Kaufman, Y. J., Rosenfeld, D., Remer, L. A., andRudich, Y.: Aerosol invigoration and restructuring of At-lantic convective clouds, Geophys. Res. Lett., 32, L14828,doi:10.1029/2005GL023187, 2005.
Lamarque, J.-F., Bond, T. C., Eyring, V., Granier, C., Heil, A.,Klimont, Z., Lee, D., Liousse, C., Mieville, A., Owen, B.,Schultz, M. G., Shindell, D., Smith, S. J., Stehfest, E., Van Aar-denne, J., Cooper, O. R., Kainuma, M., Mahowald, N., Mc-Connell, J. R., Naik, V., Riahi, K., and van Vuuren, D. P.: His-torical (1850–2000) gridded anthropogenic and biomass burningemissions of reactive gases and aerosols: methodology and ap-plication, Atmos. Chem. Phys., 10, 7017–7039, doi:10.5194/acp-10-7017-2010, 2010.
Liu, X., Penner, J. E., Das, B., Bergmann, D., Rodriguez, J. M., Stra-han, S., Wang, M., and Feng, Y.: Uncertainties in global aerosolsimulations: Assessment using three meteorological datasets, J.Geophys. Res., 112, D11212, doi:10.1029/2006JD008216, 2007.
Liu, X., Easter, R. C., Ghan, S. J., Zaveri, R., Rasch, P., Shi, X.,Lamarque, J.-F., Gettelman, A., Morrison, H., Vitt, F., Conley,A., Park, S., Neale, R., Hannay, C., Ekman, A. M. L., Hess, P.,Mahowald, N., Collins, W., Iacono, M. J., Bretherton, C. S., Flan-ner, M. G., and Mitchell, D.: Toward a minimal representationof aerosols in climate models: description and evaluation in theCommunity Atmosphere Model CAM5, Geosci. Model Dev., 5,709–739, doi:10.5194/gmd-5-709-2012, 2012.
Liu, X., Ma, P.-L., Wang, H., Tilmes, S., Singh, B., Easter, R.C., Ghan, S. J., and Rasch, P. J.: Description and evaluationof a new four-mode version of the Modal Aerosol Module(MAM4) within version 5.3 of the Community AtmosphereModel, Geosci. Model Dev., 9, 505–522, doi:10.5194/gmd-9-505-2016, 2016.
Liu, Y.: Atmospheric response and feedback to radiative forcingfrom biomass burning in tropical South America, Agr. For-est Meteorol., 133, 40–53, doi:10.1016/j.agrformet.2005.03.011,2005.
Liu, Y., Goodrick, S., and Heilman, W.: Wildland fire emissions,carbon, and climate: Wildfire–climate interactions, Forest Ecol.Manage., 317, 80–96, doi:10.1016/j.foreco.2013.02.020, 2014.
Lu, Z. and Sokolik, I. N.: The effect of smoke emission amounton changes in cloud properties and precipitation: A casestudy of Canadian boreal wildfires of 2007, J. Geophys. Res.-Atmospheres, 118, 2013JD019860, doi:10.1002/2013JD019860,2013.
Atmos. Chem. Phys., 16, 14805–14824, 2016 www.atmos-chem-phys.net/16/14805/2016/
Y. Jiang et al.: Impacts of global open-fire aerosols 14823
Ma, P.-L., Rasch, P. J., Wang, H., Zhang, K., Easter, R. C., Tilmes,S., Fast, J. D., Liu, X., Yoon, J.-H., and Lamarque, J.-F.: The roleof circulation features on black carbon transport into the Arc-tic in the Community Atmosphere Model version 5 (CAM5), J.Geophys. Res.-Atmos., 118, 4657–4669, 2013.
Ma, P.-L., Rasch, P. J., Fast, J. D., Easter, R. C., Gustafson Jr., W. I.,Liu, X., Ghan, S. J., and Singh, B.: Assessing the CAM5 physicssuite in the WRF-Chem model: implementation, resolution sen-sitivity, and a first evaluation for a regional case study, Geosci.Model Dev., 7, 755–778, doi:10.5194/gmd-7-755-2014, 2014.
Ma, P.-L., Rasch, P. J., Wang, M., Wang, H., Ghan, S. J., Easter, R.C., Gustafson Jr., W. I., Liu, X., Zhang, Y., and Ma, H.-Y.: Howdoes increasing horizontal resolution in a global climate modelimprove the simulation of aerosol-cloud interactions?, Geophys.Res. Lett., 42, 5058–5065, doi:10.1002/2015GL064183, 2015.
Marlon, J. R., Bartlein, P. J., Walsh, M. K., Harrison, S. P., Brown,K. J., Edwards, M. E., Higuera, P. E., Power, M. J., Ander-son, R. S., Briles, C., Brunelle, A., Carcaillet, C., Daniels,M., Hu, F. S., Lavoie, M., Long, C., Minckley, T., Richard,P. J. H., Scott, A. C., Shafer, D. S., Tinner, W., Umbanhowar,C. E., and Whitlock, C.: Wildfire responses to abrupt climatechange in North America, P. Natl. Acad. Sci., 106, 2519–2524,doi:10.1073/pnas.0808212106, 2009.
Min M. and Zhang Z.: On the influence of cloud fraction diurnalcycle and sub-grid cloud optical thickness variability on all-skydirect aerosol radiative forcing, J. Quant. Spectros. Ra., 142, 25–36, doi:10.1016/j.jqsrt.2014.03.014, 2014.
Morrison, H. and Gettelman, A.: A New Two-Moment BulkStratiform Cloud Microphysics Scheme in the Commu-nity Atmosphere Model, Version 3 (CAM3). Part I: De-scription and Numerical Tests, J. Climate, 21, 3642–3659,doi:10.1175/2008JCLI2105.1, 2008.
Myhre, G. and Samset, B. H.: Standard climate models radia-tion codes underestimate black carbon radiative forcing, Atmos.Chem. Phys., 15, 2883–2888, doi:10.5194/acp-15-2883-2015,2015.
Myhre, G., Samset, B. H., Schulz, M., Balkanski, Y., Bauer, S.,Berntsen, T. K., Bian, H., Bellouin, N., Chin, M., Diehl, T.,Easter, R. C., Feichter, J., Ghan, S. J., Hauglustaine, D., Iversen,T., Kinne, S., Kirkevåg, A., Lamarque, J.-F., Lin, G., Liu, X.,Lund, M. T., Luo, G., Ma, X., van Noije, T., Penner, J. E., Rasch,P. J., Ruiz, A., Seland, Ø., Skeie, R. B., Stier, P., Takemura, T.,Tsigaridis, K., Wang, P., Wang, Z., Xu, L., Yu, H., Yu, F., Yoon,J.-H., Zhang, K., Zhang, H., and Zhou, C.: Radiative forcing ofthe direct aerosol effect from AeroCom Phase II simulations,Atmos. Chem. Phys., 13, 1853–1877, doi:10.5194/acp-13-1853-2013, 2013a.
Myhre, G., Shindell, D., Breìon, F.-M., Collins, W., Fuglestvedt,J., Huang, J., Koch, D., Lamarque, J.-F., Lee, D., Mendoza,B., Nakajima, T., Robock, A., Stephens, G., Takemura, T., andZhang, H.: Anthropogenic and Natural Radiative Forcing, in:Climate Change 2013: The Physical Science Basis. Contributionof Working Group I to the Fifth Assessment Report of the Inter-governmental Panel on Climate Change, edited by: Stocker, T.F., Qin, D., Plattner, G.-K., Tignor, M., Allen, S. K., Boschung,J., Nauels, A., Xia, Y., Bex, V., and Midgley, P. M., CambridgeUniversity Press, Cambridge, United Kingdom and New York,NY, USA, 659–740, 2013b.
Neale, R. B., Chen, C.-C., Gettelman, A., Lauritzen, P. H.,Park, S., Williamson, D. L., Conley, A. J., Garcia, R., Kin-nison, D., Lamarque, J.-F., Marsh, D., Mills, M., Smith,A. K., Tilmes, S., Vitt, F., Cameron-Smith, P., Collins,W.D., Iacono, M. J., Easter, R. C., Ghan, S. J., Liu, X.,Rasch, P. J., and Taylor, M. A.: Description of the NCARCommunity Atmosphere Model (CAM 5.0), NCAR/TN-486+STR, available at: http://www.cesm.ucar.edu/models/cesm1.0/cam/docs/description/cam5_desc.pdf (last access: 28 November2016), 2012.
Oleson, K. W., Lawrence, D. M., Bonan, G. B., Flanner, M. G.,Kluzek, E., Lawrence, P. J., Levis, S., Swenson, S. C., Thorn-ton, P. E., Dai, A., Decker, M., DIckinson, R., Feddema, J.,Heald, C. L., Hoffman, F., Lamarque, J. F., Mahowald, N.,Niu, G.-Y., Qian, T., Randerson, J., Running, S., Sakaguchi,K., Slater, A., Stockli, R., Wang, A., Yang, Z.-L., Zeng, X.,and Zeng, X.: Technical description of version 4.0 of the Com-munity Land Model, NCAR Tech. Note NCAR/TN-478+STR,doi:10.5065/D6FB50WZ, 2010.
Peng, Y., Lohmann, U., Leaitch, R., Banic, C., and Cou-ture, M.: The cloud albedo-cloud droplet effective radius re-lationship for clean and polluted clouds from RACE andFIRE.ACE, J. Geophys. Res.-Atmos., 107, AAC 1-1–AAC 1-6,doi:10.1029/2000JD000281, 2002.
Qian, Y., Gong, D., Fan, J., Leung, L. R., Bennartz, R., Chen,D., and Wang, W.: Heavy pollution suppresses light rain inChina: Observations and modeling, J. Geophys. Res.-Atmos.,114, D00K02, doi:10.1029/2008JD011575, 2009.
Qian, Y., Flanner, M. G., Leung, L. R., and Wang, W.: Sensitiv-ity studies on the impacts of Tibetan Plateau snowpack pollu-tion on the Asian hydrological cycle and monsoon climate, At-mos. Chem. Phys., 11, 1929–1948, doi:10.5194/acp-11-1929-2011, 2011.
Qian, Y., Wang, H., Zhang, R., Flanner, M. G., and Rasch, P. J.:A sensitivity study on modeling black carbon in snow and itsradiative forcing over the Arctic and Northern China, Environ.Res. Lett., 9, 064001, doi:10.1088/1748-9326/9/6/064001, 2014.
Qian, Y., Yasunari, T. J., Doherty, S. J., Flanner, M. G., Lau, W. K.M., Ming, J., Wang, H., Wang, M., Warren, S. G., and Zhang,R.: Light-absorbing particles in snow and ice: Measurement andmodeling of climatic and hydrological impact, Adv. Atmos. Sci.,32, 64–91, doi:10.1007/s00376-014-0010-0, 2015.
Quinn, P. K., Bates, T. S., Baum, E., Doubleday, N., Fiore, A. M.,Flanner, M., Fridlind, A., Garrett, T. J., Koch, D., Menon, S.,Shindell, D., Stohl, A., and Warren, S. G.: Short-lived pollu-tants in the Arctic: their climate impact and possible mitigationstrategies, Atmos. Chem. Phys., 8, 1723–1735, doi:10.5194/acp-8-1723-2008, 2008.
Randerson, J. T., Liu, H., Flanner, M. G., Chambers, S. D., Jin, Y.,Hess, P. G., Pfister, G., Mack, M. C., Treseder, K. K., Welp, L.R., Chapin, F. S., Harden, J. W., Goulden, M. L., Lyons, E., Neff,J. C., Schuur, E. A. G., and Zender, C. S.: The Impact of Bo-real Forest Fire on Climate Warming, Science, 314, 1130–1132,2006.
Rypdal, K., Rive, N., Berntsen, T. K., Klimont, Z., Mideksa, T.K., Myhre, G., and Skeie, R. B.: Costs and global impactsof black carbon abatement strategies, Tellus B, 61, 625–641,doi:10.1111/j.1600-0889.2009.00430.x, 2009.
www.atmos-chem-phys.net/16/14805/2016/ Atmos. Chem. Phys., 16, 14805–14824, 2016
14824 Y. Jiang et al.: Impacts of global open-fire aerosols
Sena, E. T. and Artaxo, P.: A novel methodology for large-scale daily assessment of the direct radiative forcing of smokeaerosols, Atmos. Chem. Phys., 15, 5471–5483, doi:10.5194/acp-15-5471-2015, 2015.
Skeie, R. B., Berntsen, T., Myhre, G., Pedersen, C. A., Ström, J.,Gerland, S., and Ogren, J. A.: Black carbon in the atmosphereand snow, from pre-industrial times until present, Atmos. Chem.Phys., 11, 6809–6836, doi:10.5194/acp-11-6809-2011, 2011.
Sommers, W. T., Loehman, R. A., and Hardy, C. C.: Wild-land fire emissions, carbon, and climate: Science overviewand knowledge needs, Forest Ecol. Manage., 317, 1–8,doi:10.1016/j.foreco.2013.12.014, 2014.
Stohl, A., Klimont, Z., Eckhardt, S., Kupiainen, K., Shevchenko,V. P., Kopeikin, V. M., and Novigatsky, A. N.: Black carbon inthe Arctic: the underestimated role of gas flaring and residen-tial combustion emissions, Atmos. Chem. Phys., 13, 8833–8855,doi:10.5194/acp-13-8833-2013, 2013.
Tosca, M. G., Randerson, J. T., and Zender, C. S.: Global im-pact of smoke aerosols from landscape fires on climate andthe Hadley circulation, Atmos. Chem. Phys., 13, 5227–5241,doi:10.5194/acp-13-5227-2013, 2013.
Tosca, M. G., Diner, D. J., Garay, M. J., and Kalashnikova, O. V.:Observational evidence of fire-driven reduction of cloud fractionin tropical Africa, J. Geophys. Res.-Atmos., 119, 8418–8432,doi:10.1002/2014JD021759, 2014.
van der Werf, G. R., Dempewolf, J., Trigg, S. N., Randerson, J.T., Kasibhatla, P. S., Giglio, L., Murdiyarso, D., Peters, W.,Morton, D. C., Collatz, G. J., Dolman, A. J., and DeFries, R.S.: Climate regulation of fire emissions and deforestation inequatorial Asia, P. Natl. Acad. Sci. USA, 105, 20350–20355,doi:10.1073/pnas.0803375105, 2008.
van der Werf, G. R., Randerson, J. T., Giglio, L., Collatz, G. J., Mu,M., Kasibhatla, P. S., Morton, D. C., DeFries, R. S., Jin, Y., andvan Leeuwen, T. T.: Global fire emissions and the contribution ofdeforestation, savanna, forest, agricultural, and peat fires (1997–2009), Atmos. Chem. Phys., 10, 11707–11735, doi:10.5194/acp-10-11707-2010, 2010.
Voulgarakis, A. and Field, R. D.: Fire influences on atmosphericcomposition, air quality and climate, Current Pollution Reports,1, 70–81, doi:10.1007/s40726-015-0007-z, 2015.
Wang, H., Easter, R. C., Rasch, P. J., Wang, M., Liu, X., Ghan, S.J., Qian, Y., Yoon, J.-H., Ma, P.-L., and Vinoj, V.: Sensitivity ofremote aerosol distributions to representation of cloud-aerosolinteractions in a global climate model, Geosci. Model Dev., 6,765–782, doi:10.5194/gmd-6-765-2013, 2013a.
Wang, X., Doherty, S. J., and Huang, J.: Black carbon andother light-absorbing impurities in snow across North-ern China, J. Geophys. Res.-Atmos., 118, 1471–1492,doi:10.1029/2012JD018291, 2013b.
Ward, D. S., Kloster, S., Mahowald, N. M., Rogers, B. M., Ran-derson, J. T., and Hess, P. G.: The changing radiative forc-ing of fires: global model estimates for past, present and fu-ture, Atmos. Chem. Phys., 12, 10857–10886, doi:10.5194/acp-12-10857-2012, 2012.
Westerling, A. L., Hidalgo, H. G., Cayan, D. R., and Swet-nam, T. W.: Warming and earlier spring increase west-ern U.S. forest wildfire activity, Science, 313, 940–943,doi:10.1126/science.1128834, 2006.
Wiedinmyer, C., Akagi, S. K., Yokelson, R. J., Emmons, L. K., Al-Saadi, J. A., Orlando, J. J., and Soja, A. J.: The Fire INventoryfrom NCAR (FINN): a high resolution global model to estimatethe emissions from open burning, Geosci. Model Dev., 4, 625–641, doi:10.5194/gmd-4-625-2011, 2011.
Zhang, Y., Fu, R., Yu, H., Qian, Y., Dickinson, R., Silva Dias,M. A. F., da Silva Dias, P. L., and Fernandes, K.: Im-pact of biomass burning aerosol on the monsoon circulationtransition over Amazonia, Geophys. Res. Lett., 36, L10814,doi:10.1029/2009GL037180, 2009.
Zhang, Z., Meyer, K., Platnick, S., Oreopoulos, L., Lee, D., andYu, H.: A novel method for estimating shortwave direct radia-tive effect of above-cloud aerosols using CALIOP and MODISdata, Atmos. Meas. Tech., 7, 1777–1789, doi:10.5194/amt-7-1777-2014, 2014.
Zhang, Z., Meyer, K., Yu, H., Platnick, S., Colarco, P., Liu, Z., andOreopoulos, L.: Shortwave direct radiative effects of above-cloudaerosols over global oceans derived from 8 years of CALIOPand MODIS observations, Atmos. Chem. Phys., 16, 2877–2900,doi:10.5194/acp-16-2877-2016, 2016.
Atmos. Chem. Phys., 16, 14805–14824, 2016 www.atmos-chem-phys.net/16/14805/2016/