Embed Size (px)
Citation preview

Impacts of Driving Patterns on the Life Cycle Performance of Plug-in Hybrid
Electric Vehicles
Leon Raykin
SupervisorsHeather L. MacLean Matthew J. Roordahttp://myecoproject
.org/tag/electric-cars
MASc PresentationSeptember 7, 2011
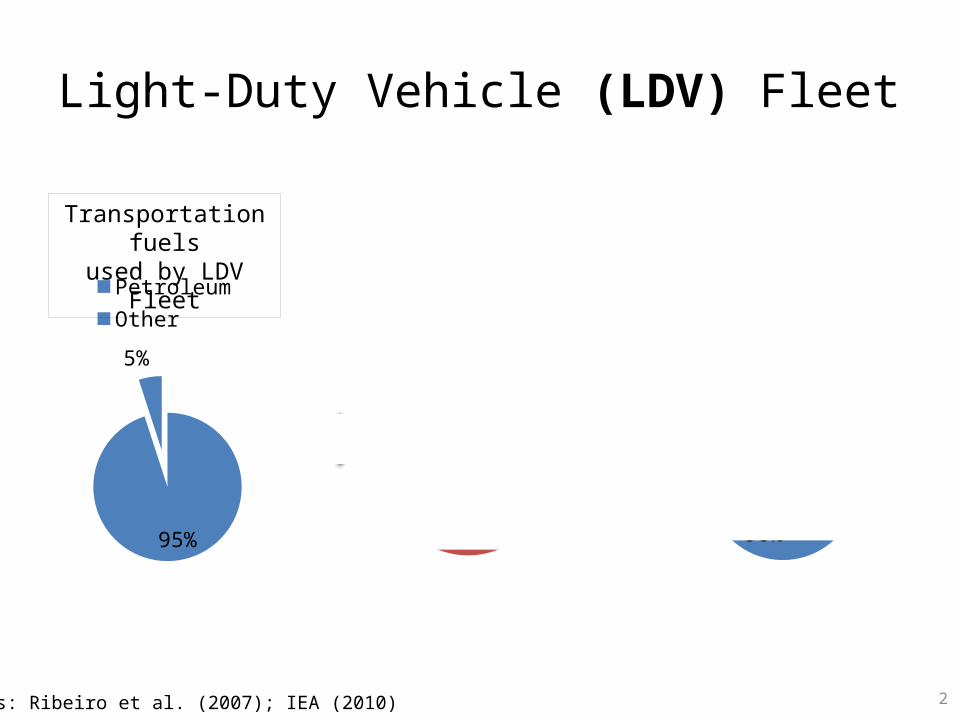
Light-Duty Vehicle (LDV) Fleet
2Sources: Ribeiro et al. (2007); IEA (2010)
95%
5%Petroleum Other
27%
73%
LDV Fleet Other
10%
90%
LDV Fleet Other
Transportation fuelsused by LDV Fleet
Global petroleumenergy use
Energy-related greenhouse gas (GHG) emissions

Alternative Vehicle Options
ICE
Wheels
Fuel Tank
ICE: Internal Combustion Engine
Internal Combustion Engine Vehicle (ICEV)
Electric MotorICE
Wheels
BatteryFuel Tank
Parallel HybridConfiguration
Hybrid ElectricVehicle (HEV)
Plug-In Hybrid ElectricVehicle (PHEV)
Series Hybrid Configuration
Electric Motor
Battery
Wheels
ICE
Fuel Tank
3

Driving Patterns
Driving Conditions Driving Distance Between Recharging
http://www.pikeresearch.com/research/electric-vehicle-charging-equipment 4

2
3
4
5
6
7
8
9
10
11
Driving Distance
Aver
age
Petr
oleu
m E
nerg
y U
se (L
/100
km)
Driving Distance (Between Recharging)
5
ICEV
HEV
PHEV
ElectricMode
HEVMode
Adapted from Shiau et al. (2009)

Driving Cycles
• Used to represent driving patternsCertification driving
cycles represent fleet-average driving
• Exhibit significant regional variationSpecific regional driving
cycles can be estimated using travel demand models
0 300 600 900 12000
10
20
30
40
50
60
70
80
90
100
Time (s)
Spee
d (k
m/h
)
6

Life Cycle Assessment
• Technique for evaluating the environmental performance of a product or process over all stages of its life
• Life cycle assessment of transportation fuels/vehicles is known as a Well-To-Wheel (WTW) analysis
7

WTW Analysis
Well-To-Tank (WTT)
Tank-To-Wheel (TTW)

Objectives
• Paper 1 Apply a travel demand modeling approach to
estimate driving cycles for regional driving patterns Examine impacts of driving patterns on TTW
energy use of PHEVs• Paper 2
Evaluate implications of driving patterns on the WTW environmental performance of PHEVs:
Total, fossil, and petroleum energy use (MJ/km) GHG emissions (g CO2-eq/km)
9

Paper 1 – Travel Demand Modeling Approach

Travel Demand Modeling Approach - Methods
Lake Ontario
Max speed, length and congestion
Origin-destination demands
1. Travel Demand
Data
2. Traffic Assign-ment
Driving Cycles
3. Vehicle Motion
Modeling
PHEVsHEVICEV
4. Vehicle Selection
TTW results
4. Vehicle Simulation
Petroleum and electricity
use
1. Transportation Tomorrow Survey2. Emme 33. CALMOB64. Autonomie
Tools Used
11

1 & 2. Travel Demand Modeling
• Range of driving patternsDifferent commute
orientationsConstant commute
duration
12
Lake Ontario
Downtown Toronto
Increasing Distance and Speed
Increasing Congestion
Suburban HighwayCity

3. Vehicle Motion Modeling
Congestion
Complete Stop
Partial Stop
Reduced Cruise
City Driving Cycle
HighwayDriving Cycle
Free Flow
13
4. Vehicle Selection & Simulation
14www.dealertrend.com; www.funcar.cc
• Two PHEV designs• One HEV• One ICEV
• Vehicles normalized:Body and tire specificationsAcceleration performance

TTW Petroleum Energy Use Results
http://green.autoblog.com/2008/10/27/autoexpress-looks-at-mpg-myths-little-impact-from-tire-pressure/ 15

Average TTW Petroleum Energy Use
16
0
2
4
6
8
10
12
PHEVHEVICEV
TTW
Pet
role
um E
nerg
y U
se
(L/1
00 k
m)
City Suburban Highway
Increasing Distance and Speed
Increasing Congestion

0
1
2
3
4
5
6
7
8
9
PHEVHEV
Redu
ction
in T
TW P
etro
leum
Ene
rgy
Use
Rel
ative
to IC
EV (L
/100
km)
TTW Petroleum Savings Relative to ICEV
17
Increasing Distance and Speed
Increasing Congestion
City Suburban Highway

Paper 1 Summary
• Applied a travel demand modeling approach to estimate driving cycles for specific regional driving patterns
• Examined TTW energy use of vehicles for a wide range of driving patternsTrends in TTW energy use were generally as expected
Both driving distance and driving conditions affect TTW petroleum energy use of PHEVs
Driving patterns have opposite effects on TTW petroleum energy use of PHEVs/HEVs and ICEVs

Paper 2 – WTW Analysis

Gasoline
WTW Analysis Methods
20
TTW petroleum &
electricity use
HydroelectricNatural
GasCoalOntario
Mix
Electricity Scenario Selection
Energy use and GHG emissions
Life Cycle Inventory Analysis
WTT Inventory
Liquid Fuel Selection
WTW Results
GREET & Misc.Tools Used
www.opg.com

WTW Energy Use Results
21

WTW Total Energy Use
22
0
0.5
1
1.5
2
2.5
3
3.5
4
4.5
PHEV - Hydroelectric PHEV - Ontario Mix PHEV - Natural Gas PHEV - Coal HEV ICEV
WTW
Tot
al E
nerg
y U
se (M
J/km
)
Increasing Distance and Speed
City Suburban Highway
Increasing Congestion
-Electric Propulsion-Gasoline Propulsion

WTW Fossil Energy Use
23
0
0.5
1
1.5
2
2.5
3
3.5
4
PHEV - Hydroelectric PHEV - Ontario Mix PHEV - Natural Gas PHEV - Coal HEV ICEV
WTW
Fos
sil E
nerg
y U
se (M
J/km
)
Increasing Distance and Speed
City Suburban Highway
Increasing Congestion

WTW Petroleum Energy Use
Increasing Distance and Speed
City Suburban Highway
Increasing Congestion24
0
0.5
1
1.5
2
2.5
3
3.5
4
PHEV - Hydroelectric PHEV - Ontario Mix PHEV - Natural Gas PHEV - Coal HEV ICEV
WTW
Pet
role
um E
nerg
y U
se (M
J/km
)

WTW GHG Emissions Results
25

WTW GHG Emissions
26
0
50
100
150
200
250
300
WTW
GH
G E
mis
sion
s (g
CO
2-eq
/km
)
Increasing Distance and Speed
City Suburban Highway
Increasing Congestion
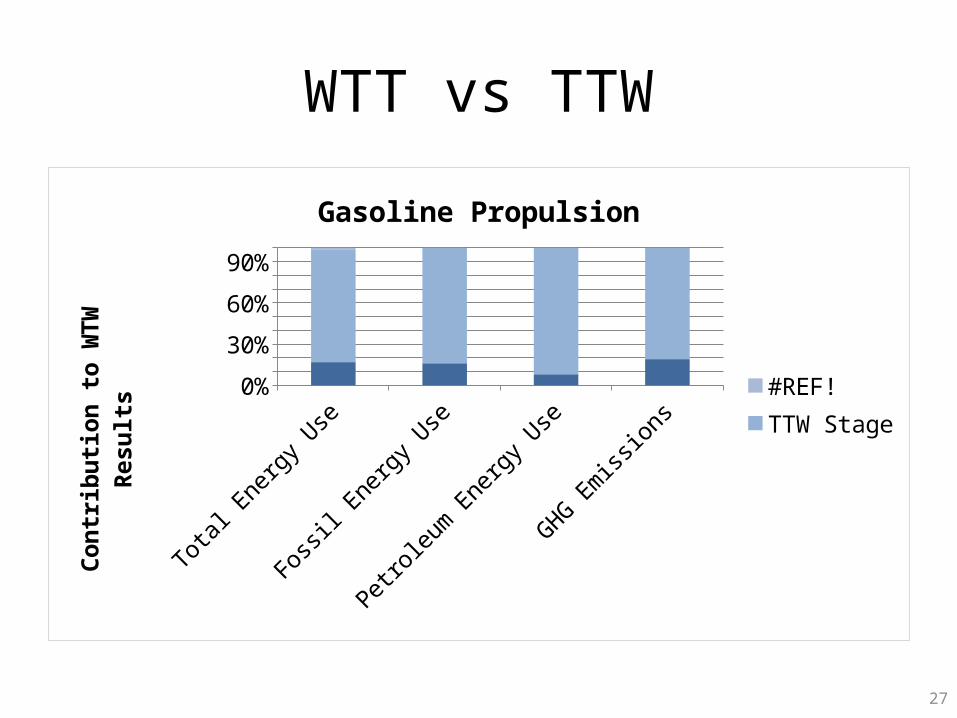
WTT vs TTW
Total Energy Use
Fossil Energy Use
Petroleum Energy Use
GHG Emissions
0%10%20%30%40%50%60%70%80%90%
100%
Gasoline Propulsion
#REF!TTW Stage
Cont
ribu
tion
to W
TW R
esul
ts
27
Paper 2 Summary
• Driving patterns substantially affect the WTW performance of PHEVs
• City favorable over highway for WTW performance of PHEVs
• Extent to which driving patterns affect WTW performance depends on electricity supply
• When charging from coal, PHEVs only result in WTW (non-petroleum) energy use and GHG emissions reductions relative to ICEVs due to differences in vehicle fuel efficiency
28

Future Research Directions
• Further calibration and evaluation of the vehicle motion model
• Application to other trips and jurisdictions• Evaluation of additional metrics and lifecycle
activities• PHEV scenario analyses using Transportation
Tomorrow Survey microdata
29

Conclusions
• Paper 1Applied a travel demand modeling approach for estimating
driving cycles for regional driving patternsEvaluated impacts of regional driving patterns on TTW
energy use of PHEVs General trends in TTW energy use were as expected
• Paper 2Demonstrated that driving patterns and the electricity
generation supply interact to substantially affect the WTW energy use and GHG emissions of PHEVs Jurisdictions characterized as having favorable electricity generation
supply and frequent traffic congestion should be most willing to support PHEVs on basis of energy use and GHG emissions benefits
30

Acknowledgements
• Heather L. MacLean and Matthew J. Roorda• UofT Graduate Students• David Checkel and Dan Handford (University of
Alberta)• Matthew Stevens (CrossChasm)

Questions?
32