Embed Size (px)
Citation preview
IMPACTS OF COVID-19 ON THE AUSTRALIAN SEAFOOD INDUSTRY:JANUARY-JUNE 2020FRDC ReportFisheries Research and Development Corporation
Emily Ogier, Sevaly Sen, Sarah Jennings,Anders Magnusson, David C. Smith,Ewan Colquhoun, Steven Rust, Julian Morison
Institute for Marine and Antarctic StudiesOceanomics P/LResearchers Providers NetworkBDO EconSearchRidge Partners
© 2021 Fisheries Research and Development Corporation. All rights reserved. ISBN [Print - 978-1-922352-79-8] [eBook 978-1-922352-79-8]
Impacts of COVID-19 on the Australian Seafood Industry: January-June 2020
OWNERSHIP OF INTELLECTUAL PROPERTY RIGHTSUnless otherwise noted, copyright (and any other intellectual property rights, if any) in this publication is owned by the Fisheries Research and Development Corporation and the Institute for Marine and Antarctic Studies (IMAS) of the University of Tasmania
This publication (and any information sourced from it) should be attributed to:
Ogier, E., Sen, S., Jennings, S., Magnusson, A., Smith, D. C., Colquhoun, E., Rust, S., Morison, J. (2021). Impacts of COVID-19 on the Australian Seafood Industry: January-June 2020. FRDC 2016-128. Canberra, Australia, Fisheries Research and Development Corporation (FRDC).
CREATIVE COMMONS LICENCEAll material in this publication is licensed under a Creative Commons Attribution 3.0 Australia Licence, save for content supplied by third parties, logos and the Commonwealth Coat of Arms.
Creative Commons Attribution 3.0 Australia Licence is a standard form licence agreement that allows you to copy, distribute, transmit and adapt this publication provided you attribute the work. A summary of the licence terms is available from https://creativecommons.org/licenses/by/3.0/au/. The full licence terms are available from https://creativecommons.org/licenses/by-sa/3.0/au/legalcode.
Inquiries regarding the licence and any use of this document should be sent to: [email protected]
DISCLAIMERThe authors do not warrant that the information in this document is free from errors or omissions. The authors do not accept any form of liability, be it contractual, tortious, or otherwise, for the contents of this document or for any consequences arising from its use or any reliance placed upon it. The information, opinions and advice contained in this document may not relate, or be relevant, to a reader’s circumstances. Opinions expressed by the authors are the individual opinions expressed by those persons and are not necessarily those of the publisher, research provider or the FRDC.
The Fisheries Research and Development Corporation (FRDC) plans, invests in and manages fisheries research and development throughout Australia. It is a statutory authority within the portfolio of the federal Minister for Agriculture, Fisheries and Forestry, jointly funded by the Australian Government and the fishing industry.
RESEARCHER CONTACT DETAILSName: Dr. Emily Ogier Address: IMAS, University of Tasmania Private Bag 49, Hobart TAS 7001Phone: 03 6226 8225Email: [email protected]
FRDC CONTACT DETAILSAddress: 25 Geils Court Deakin ACT 2600Phone: 02 6285 0400Fax: 02 6285 0499Email: [email protected]: www.frdc.com.au
In submitting this report, the researcher has agreed to FRDC publishing this material in its edited form.
ACKNOWLEDGMENTSThe authors wish to acknowledge members of Australia’s seafood industry who shared their experience and information about the effects of the COVID-19 pandemic on their sectors supply chain.
The authors also wish to acknowledge the State, Territory and Commonwealth management agencies who shared preliminary data on fisheries and aquaculture production levels across this period. The Research Providers Network for Australian fisheries and aquaculture was instrumental in coordinating this data sharing.
Table of ContentsForewardSummaryIntroduction Assessing impact Impacts to seafood production and its supply chains Production and imports Wild-catch Aquaculture Imports Wholesale and processing Wholesale Processing and packaging Transport and logistics Air Road Sea freight Cold storage Consumer markets Exports Food service Retail Direct salesCase studiesGovernment responses Marine resource management agency Other governmentAustralian seafood: Impact and outlook Recovery and resilience Ongoing exposure and emergent impactsReferences and data sources
34691111142225272930313335363637394143454657575859606162
3
FOREWARDAs a sector relying on natural resources, the seafood industry is familiar with, and has had to deal with, many environmental shocks and other disruptions outside its control, but market shocks are far less common and have never been as pervasive as the COVID-19 pandemic.
2020 presented us all with unprecedented challenges. The extent of this crisis went far beyond anything anyone could have prepared for and some sectors, especially those relying on exports, found their markets essentially vanishing overnight.
The overall impacts of the pandemic on the seafood industry have been asymmetric, with sectors supplying domestic markets mostly able to prosper, while exporters often brought to their knees. Irrespective of their main market, businesses that have been both willing and able to be innovative, have fared better. The many forms of Government assistance, including the designation of the seafood industry as essential, were critical to economic survival during this period.
The industry at large showed resilience, but does that equal being ready for future crisis? It does not.
Businesses that were able to adapt quickly did better, but few can claim having had a crisis plan they implemented. This is the purpose of this report, to record the past so it can inform the future.
This work is a pilot that analysed three moments in time during the pandemic. The initial shock phase, when trade to China stopped, flights were cancelled and the world took stock of the enormity of what we were facing. Then the lock-down when Government assistance started to flow in and businesses that could, adapted to a new, local market intensely focussed on home cooking. Finally, the initial easing phase, a period of continued uncertainty where restrictions started to ease but sometimes had to be tightened again. A phase where we tentatively start to map a way forward.
We now need to look at the data collected in this report and identify the areas of industry vulnerability. We must remember the responses that improved coping during challenging early stages of the pandemic and the commercial strategies which have strengthened resilience.
As the industry moves forward, it is important to ask ourselves what we learned from this past year. What were the surprises and what can we do differently in the future? The cost of being under-prepared is too great. The lesson from the previous SARS Asian Pandemic was that we did not ask these questions or collect the data to inform how we future-proof the seafood sectors.
For FRDC, this report will provide a reference point for further impact analysis and highlight future research needed to improve early warning systems and diagnostic capacity of our seafood industry, should future shocks or disruption occur.
Patrick Hone,Managing DirectorFisheries Research and Development Corporation
COVID-19 report Foreword
As a sector relying on natural resources, the seafood industry is familiar with, and has had to deal with, many environmental shocks and other disruptions outside its control, but market shocks are far less common and have never been as pervasive as the COVID-19 pandemic.
2020 presented us all with unprecedented challenges. The extent of this crisis went far beyond anything anyone could have prepared for and some sectors, especially those relying on exports, found their markets essentially vanishing overnight.
The overall impacts of the pandemic on the seafood industry has been asymmetric, with sectors supplying domestic markets mostly able to prosper, while exporters were often brought to their knees. Irrespective of their main market, businesses that have been both willing and able to be innovative, have fared better. The many forms of Government assistance, including the designation of the seafood industry as essential, were critical to economic survival during this period.
The industry at large showed resilience, but does that equal being ready for future crisis? It does not.
Businesses that were able to adapt quickly did better, but few can claim having had a crisis plan they implemented. This is the purpose of this report, to record the past so it can inform the future.
This work is a pilot that analysed three moments in time during the pandemic. The initial shock phase, when trade to China stopped, flights were cancelled and the world took stock of the enormity of what we were facing. Then the lock-down when Government assistance started to flow in and businesses that could, adapted to a new, local market intensely focussed on home cooking. Finally, the initial easing phase, a period of continued uncertainty where restrictions started to ease but sometimes had to be tightened again. A phase where we tentatively start to map a way forward.
We now need to look at the data collected in this report and identify the areas of industry vulnerability. We must remember the responses that improved coping during challenging early stages of the pandemic and the commercial strategies which have strengthened resilience.
As the industry moves forward, it is important to ask ourselves what we learned from this past year. What were the surprises and what can we do differently in the future? The cost of being under-prepared is too great. The lesson from the previous SARS Asian Pandemic was that we did not ask these questions or collect the data to inform how we future-proof the seafood sectors.
For the FRDC, this report will provide a reference point for further impact analysis and highlight future research needed to improve early warning systems and diagnostic capacity of our seafood industry, should future shocks or disruption occur.
Patrick Hone Managing Director FRDC
4
SUMMARYIMPACTS OF COVID-19 JANUARY-JUNE 2020• There is no single seafood industry COVID-19 story. The degree of exposure, impact and recovery for
sectors and businesses, whether wild caught or farmed, varied in magnitude, ranging from positive, neutral, negative and in a few cases, catastrophic.
• Between January-June 2020, overall domestic production initially fell but then re-bounded from April 2020 onwards. This can be attributed to the declaration of the seafood supply chains as essential, the easing of COVID-19 restrictions halfway through the period, and the ability of producers to find and adapt to alternative markets.
• Sectors negatively impacted by COVID-19 were those exporting live and fresh product, supplying dine-in food service, heavily reliant on international air freight and affected by movement restrictions.
• Live and fresh export products were significantly negatively impacted due to a decline in both price and volume, e.g. the value of Lobster and Abalone exports declined by 45%, while live and fresh seafood exports overall declined in value by 32% compared with the five-year average for the same period.
• Sectors positively impacted were those supplying domestic retail and take-away food service markets which normally compete with fresh international imports. These sectors experienced a rise in demand and in some cases, price. As a result, value of these types of domestically sold products generally remained relatively stable with any decline in production volumes offset by rising domestic prices.
• Forecasts of profits for 2020, particularly wild-catch, have been lower. This has been attributed to lower revenues and increases in some operating costs, particularly transaction costs in adapting to COVID-19 prevention measures. Sectors experiencing price gains or successfully accessing alternative markets also experienced substantial transaction costs as a result of adaptation to ensure business continuity.
RESILIENCE OF THE SEAFOOD INDUSTRY• Across the industry, business uncertainty related to COVID-19 was amplified by the effects of other
factors affecting this uncertainty e.g. bushfires, drought, exchange rates.• Government support measures have assisted the seafood industry weather some of the negative
impacts on profitability and business continuity.• The COVID-19 disruption continues, and further indirect effects are being experienced. What seafood
industry recovery looks like and how resilience can be built is still evolving.• Differences in degree of exposure, impact and recovery will continue across sectors of the Australian
seafood industry.
ASSESSING IMPACTS• Data about production, immediate post-harvest, wholesale and processing, transport and freight
logistics, and markets activities has been sourced and collated in this rapid assessment to understand how COVID-19 has impacted the Australian seafood industry across its supply chain stages.
• Data gaps exist. Timely access to near-real time data from all jurisdictions and from major seafood markets is needed to enable more targeted economic analysis at the sector level. This is particularly the case for aquaculture sectors.
• Further assessment of longer-term and emerging impacts based on more timely and comprehensive data will further support the Australian seafood industry in being prepared for future disruptions.
5
B
Positivedisruption
Negativedisruption
Negativedisruption
Minimaldisruption
Positivedisruption
Minimaldisruption
Mar
ket
Supply chain
Single export marketLive product
C
Multiple export marketsFresh and frozenproducts
A
Dine-in food service marketsLive and fresh productLong-haul freight dependent
Dine-in food service marketsFresh productLong-haul freight dependent
HI Dine-in food service markets
Live and fresh
Multiple export marketsDomestic retail markets
Non and semiperishable products
Import-competingDomestic retail marketFresh and frozen productD G
E
J
A.E.I.
KeyTunas and BillfishFarmed BarramundiBlue Swimmer Crab
B.F.J.
AbalonesMud CrabWrasses
C.G.
Rock LobstersFinfish species caught in theCommonwealth Trawl Sector (CTS)
D.H.
Farmed SalmonOysters
F
% of total GVP of Australia's seafood product, 2018-19Relative value
Salmons0%
Tuna Other crustaceans(inc. Crabs)
OystersRock Lobsters Other fish(various, inc.
species caught inthe CTS, Wrasses)
Abalones
5%10%15%20%25%30%
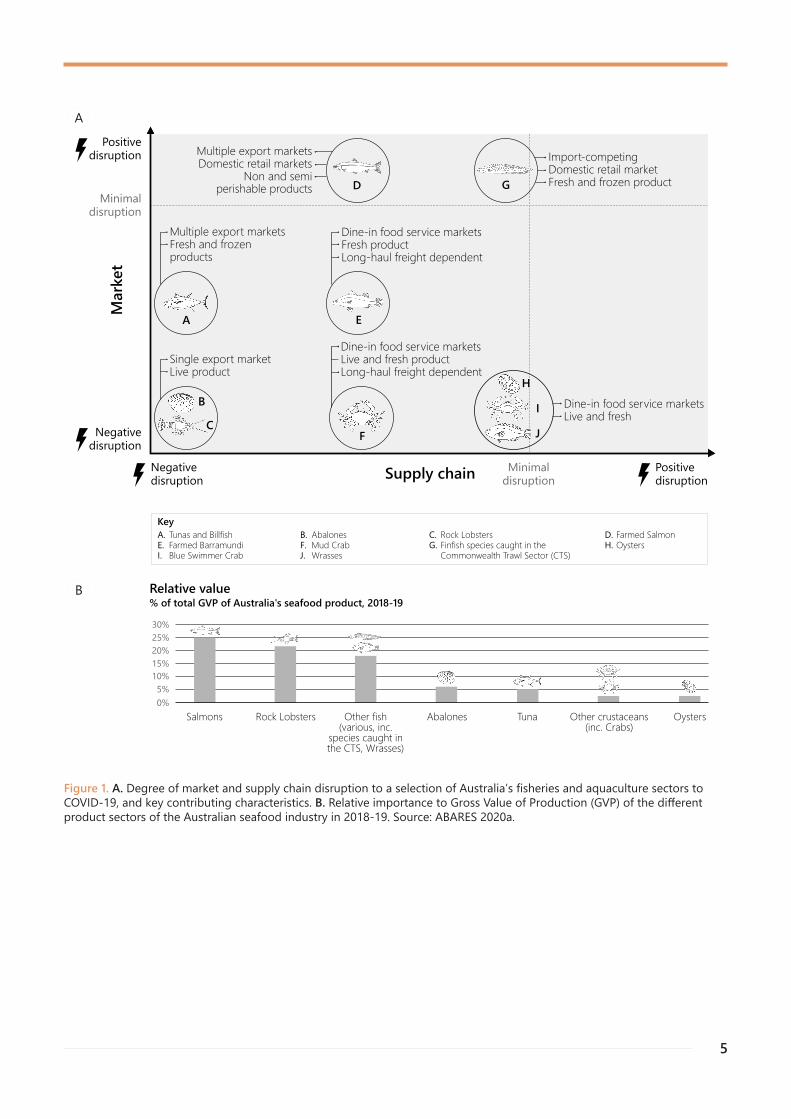
Figure 1. A. Degree of market and supply chain disruption to a selection of Australia’s fisheries and aquaculture sectors to COVID-19, and key contributing characteristics. B. Relative importance to Gross Value of Production (GVP) of the different product sectors of the Australian seafood industry in 2018-19. Source: ABARES 2020a.
B
A
6
INTRODUCTIONThis report provides an overview of the economic impacts of and responses to the early phase of the COVID-19 pandemic on the Australian seafood industry in the first half of 2020 (Figure 2). It does this by focusing on impacts at the sector level, rather than on the range of business-level experiences of COVID-19. Its primary focus is on the commercial wild-catch and aquaculture production sectors, and the activities and businesses that comprise the seafood supply chains that see seafood distributed from fishers and farmers to consumers, namely wholesale and processing, transport and logistics and consumer markets.
Australia’s seafood industry has been exposed to the global COVID-19 pandemic and associated primary health protection response through numerous pathways, reflecting the diversity of products, production sectors and supply chains (see Fisheries and Aquaculture Statistics 2018, ABARES 2020b). Approximately 65% of the seafood Australians eat is imported, while approximately 17% of Australia’s high-value seafood is exported (ABARES 2020a). Disruption has been to both our global seafood supply chains, and to the way we access Australian seafood products domestically. The stories of impact are both negative and positive over the reporting period, and highlight some innovative responses by our seafood community.
The report’s scope is to document, describe and assess economic impacts, as measured by a range of metrics including volumes and values produced and by final market destination, prices and costs, employment and business confidence (Figure 3). The report draws on qualitative and quantitative data available at the time of writing. Cases of impact are used to illustrate some of the range of COVID-19 experiences. Links to data sources and other resources are provided at the end of the report to allow readers to access detail further to the quantitative information provided here. Analysis of COVID-19 impacts is included in the Australian Fisheries and Aquaculture Outlook 2020 (ABARES 2020c).
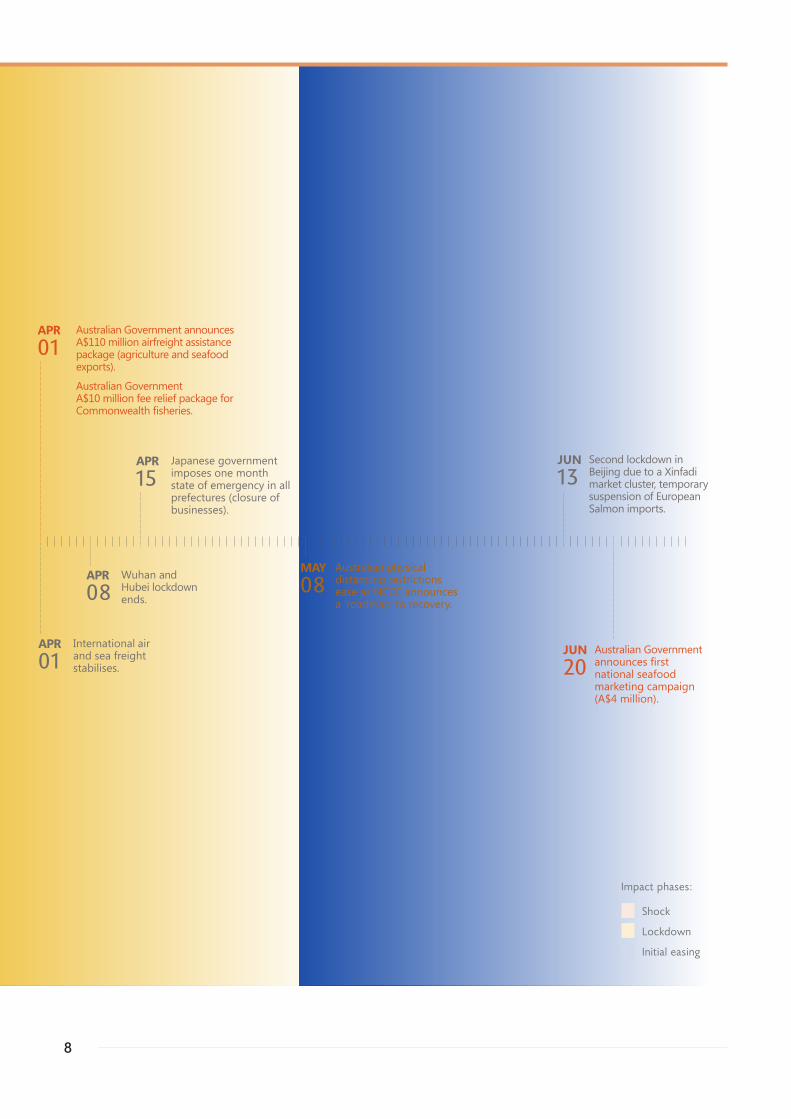
Economic impacts are ‘mapped’ to three impact phases (shock, lockdown and initial easing) corresponding to broader economy-wide COVID-19 events and measures (Figure 2). The role government and management agency COVID-19 relief measures have played in mitigating negative impacts to the seafood sector over the report period is also considered.
The report’s focus on the first half of 2020 limits discussion to short-term impacts and responses. The Australian seafood industry’s exposure to COVID-19 health and economic shocks and disruptions continued throughout 2020 and persists into 2021. Enduring changes in consumer behaviours, and possible unintended consequences of responses, may further impact the seafood industry but will likely take even longer to detect. Medium and longer-term impacts are outside the report’s scope. While the focus is on rapid assessment of economic impacts, the market and supply chain disruptions described interact with – and impact on – other social and economic factors. Impacts on wellness and mental health are not dealt with here and are reported elsewhere (e.g. Seafood Industry Australia 2020).
7
JUN20
Australian Government announces first national seafood marketing campaign (A$4 million).
First case of COVID-19 detected
in Australia.
JAN25
Seafood exports to China halt as COVID-19
restricts Lunar New Year celebrations.
JAN24
Seafood export trade from Australia to China recommences
at very low volumes.
FEB14
World Health Organisation
declares pandemic.
MAR1 1
Increasing international flight bans put
pressure on air freight pricing and availability.
MAR1 2
State government fee relief packages for fisheries (and
some aquaculture) commence.
MAR1 7
State and Territory border closures begin.
MAR1 9
Australian Government announces closure of international air and sea borders, affecting
freight availability.
MAR20
Australian banks announce repayment freezes for home and business customers (6 months).
MAR20
Australian physical distancing restrictions come into effect
(restaurants, hospitality shutdown; takeaway increases).
State and Territory governments agree that agricultural workers
and businesses (incl. fisheries and aquaculture) will be ‘essential’.
MAR23
Australian Government establishes COVID-19 Relief and Recovery Fund (A$1 billion) to
support regions, communities, and industries impacted by the pandemic.
MAR23
National COVID-19 Coordination Commission
(NCCC) established.
MAR25
Remote community biosecurity lockdowns begin (in Northern Territory)
affecting local seafood trade.
MAR27
Hong Kong introduces physical
distancing measures.
MAR27
Australian Government announces A$130 billion JobKeeper wage
subsidy (fisheries eligible).
MAR30
JUN13
Second lockdown in Beijing due to a Xinfadi market cluster, temporary suspension of European Salmon imports.
APR01
International air and sea freight stabilises.
APR08
Wuhan and Hubei lockdown ends.
APR15
Japanese government imposes one month state of emergency in all prefectures (closure of businesses).
MAY08
Australian physical distancing restrictions ease as NCCC announces a ‘roadmap’ to recovery.
APR01
Australian Government announces A$110 million airfreight assistance package (agriculture and seafood exports).
Australian Government A$10 million fee relief package for Commonwealth fisheries.
Australian Government financial stimulus
International event Seafood industry event Loan repayment support Australian physical distancing
or control measure
China lockdown in Wuhan
and Hubei.
JAN23
Shock
Lockdown
Initial easing
Impact phases:
Events types:
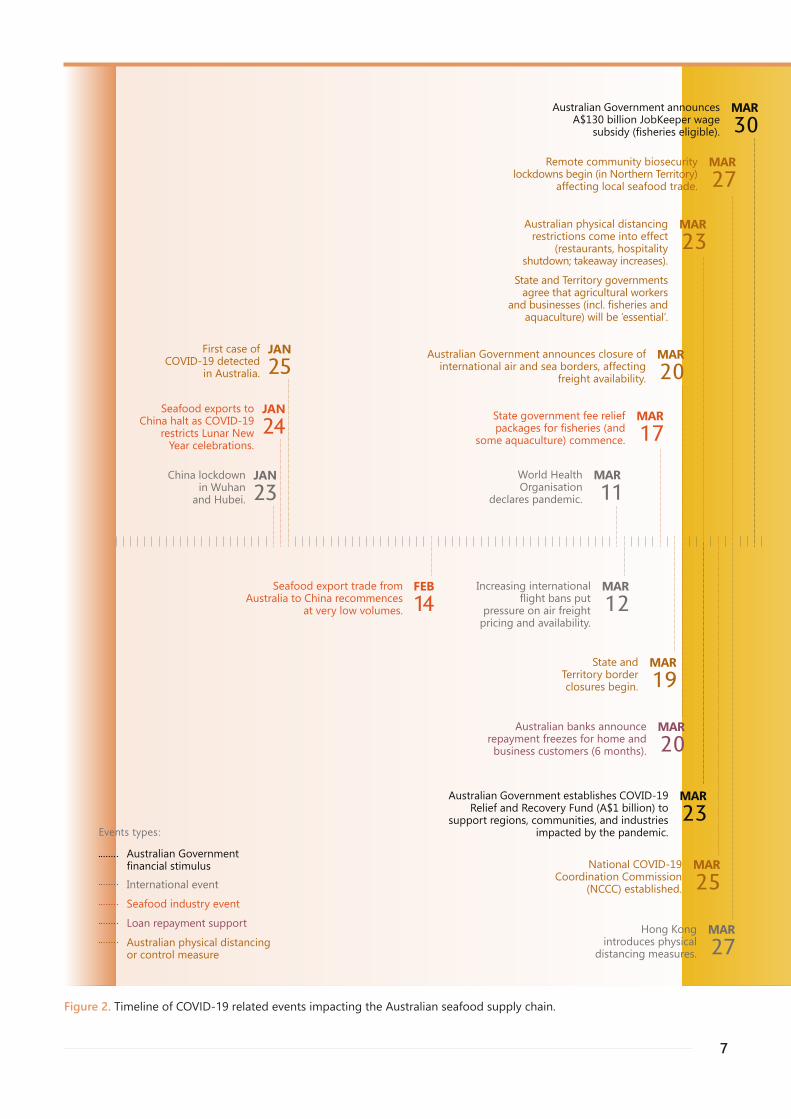
Figure 2. Timeline of COVID-19 related events impacting the Australian seafood supply chain.
8
JUN20
Australian Government announces first national seafood marketing campaign (A$4 million).
First case of COVID-19 detected
in Australia.
JAN25
Seafood exports to China halt as COVID-19
restricts Lunar New Year celebrations.
JAN24
Seafood export trade from Australia to China recommences
at very low volumes.
FEB14
World Health Organisation
declares pandemic.
MAR1 1
Increasing international flight bans put
pressure on air freight pricing and availability.
MAR1 2
State government fee relief packages for fisheries (and
some aquaculture) commence.
MAR1 7
State and Territory border closures begin.
MAR1 9
Australian Government announces closure of international air and sea borders, affecting
freight availability.
MAR20
Australian banks announce repayment freezes for home and business customers (6 months).
MAR20
Australian physical distancing restrictions come into effect
(restaurants, hospitality shutdown; takeaway increases).
State and Territory governments agree that agricultural workers
and businesses (incl. fisheries and aquaculture) will be ‘essential’.
MAR23
Australian Government establishes COVID-19 Relief and Recovery Fund (A$1 billion) to
support regions, communities, and industries impacted by the pandemic.
MAR23
National COVID-19 Coordination Commission
(NCCC) established.
MAR25
Remote community biosecurity lockdowns begin (in Northern Territory)
affecting local seafood trade.
MAR27
Hong Kong introduces physical
distancing measures.
MAR27
Australian Government announces A$130 billion JobKeeper wage
subsidy (fisheries eligible).
MAR30
JUN13
Second lockdown in Beijing due to a Xinfadi market cluster, temporary suspension of European Salmon imports.
APR01
International air and sea freight stabilises.
APR08
Wuhan and Hubei lockdown ends.
APR15
Japanese government imposes one month state of emergency in all prefectures (closure of businesses).
MAY08
Australian physical distancing restrictions ease as NCCC announces a ‘roadmap’ to recovery.
APR01
Australian Government announces A$110 million airfreight assistance package (agriculture and seafood exports).
Australian Government A$10 million fee relief package for Commonwealth fisheries.
Australian Government financial stimulus
International event Seafood industry event Loan repayment support Australian physical distancing
or control measure
China lockdown in Wuhan
and Hubei.
JAN23
Shock
Lockdown
Initial easing
Impact phases:
Events types:
9
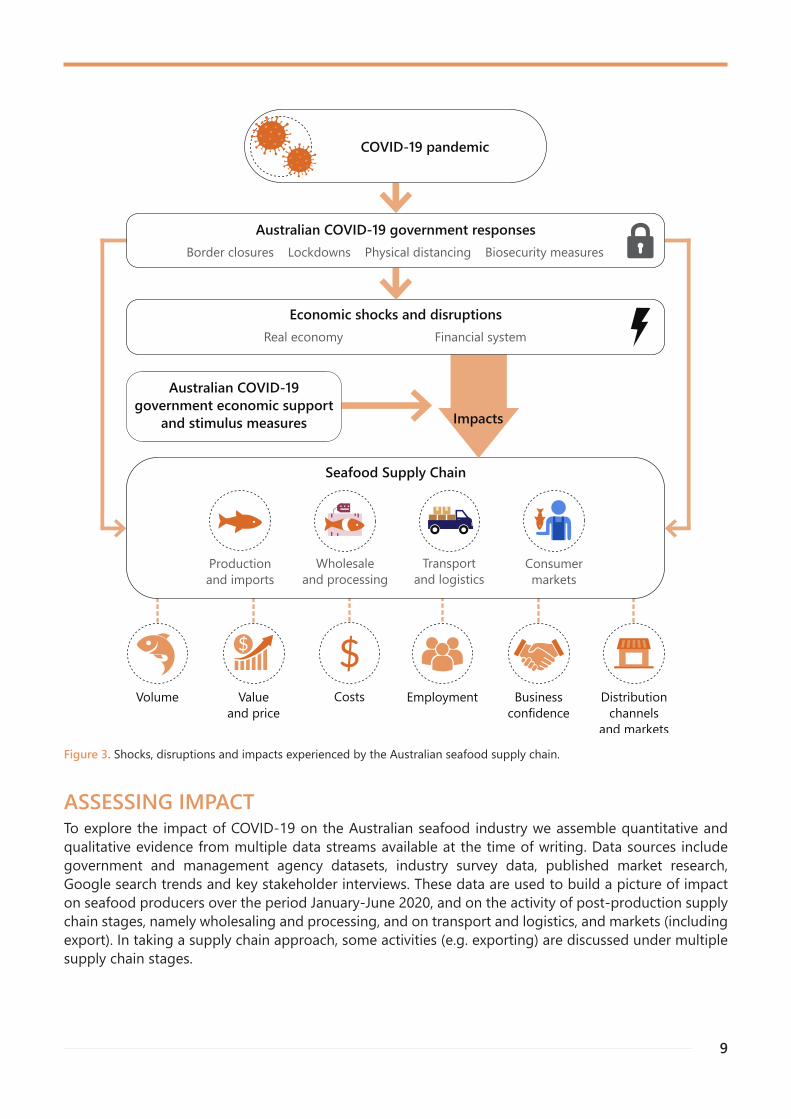
Figure 3. Shocks, disruptions and impacts experienced by the Australian seafood supply chain.
Impacts
Seafood Supply Chain
Wholesaleand processing
Volume Valueand price
Costs Employment Businessconfidence
$
Economic shocks and disruptionsReal economy
Distributionchannels
and markets
Financial system
COVID-19 pandemic
Transportand logistics
Australian COVID-19 government responsesBorder closures Lockdowns Physical distancing Biosecurity measures
Productionand imports
Consumermarkets
$
Australian COVID-19government economic support
and stimulus measures
ASSESSING IMPACTTo explore the impact of COVID-19 on the Australian seafood industry we assemble quantitative and qualitative evidence from multiple data streams available at the time of writing. Data sources include government and management agency datasets, industry survey data, published market research, Google search trends and key stakeholder interviews. These data are used to build a picture of impact on seafood producers over the period January-June 2020, and on the activity of post-production supply chain stages, namely wholesaling and processing, and on transport and logistics, and markets (including export). In taking a supply chain approach, some activities (e.g. exporting) are discussed under multiple supply chain stages.
10
The picture of economic impact across supply chain stages is built through synthesis of data on industry- wide economic impact indicators, sector-level examples of impact and more detailed case studies. Case studies were selected on the basis of data availability and to highlight specific disruptions and impacts across the seafood supply chain. A small number of these case studies use existing models and re-purposed published financial and economic data to report selected economic impacts.
Where the availability and quality of reported evidence allows, we also report a summary assessment of impact for various stages of the wild-catch and aquaculture supply chains, based on the rating of assembled evidence by the report’s author team. The purpose of the summary assessments is to highlight where impacts occurred, rather than quantitatively assess the overall economic impact. Results are also scrutinised to identify what parts of the seafood industry were most exposed to market and supply chain disruptions, based on their market orientation, freight dependence and product type (e.g. live, frozen).
The economic indicators used assess the impact on sectors of the Australian seafood supply chain anddo not necessarily reflect the economic impacts experienced by individual businesses as the impacts of COVID-19 varied within and between sectors and businesses.
Reported changes in economic impact indicators over the period January-June 2020 may or may not be caused primarily by COVID-19 – there may be a number of contributing factors. As available data does not allow us to formally identify causality, attribution of reported changes in economic impact indicators over the period to COVID-19 has been challenging. In reporting some COVID-19 impacts we use informed stakeholder or expert assessment to determine attribution. In other cases, we have not been able to isolate the COVID-19 impact, meaning that reported impacts are highly uncertain.
Regardless, this impact assessment provides important early clues as to where the vulnerabilities of Australia’s seafood industry lie, and what needs to change to make seafood businesses and supply chains resilient to the still unfolding COVID-19 crisis or any other shock and disruption.
11
IMPACTS TO SEAFOOD PRODUCTION AND ITS SUPPLY CHAINPRODUCTION AND IMPORTSAcross the period January to June 2020 volume (tonnes) and value (AUD$) of Australian seafood production was affected to varying extents (see Table 1) and through different mechanisms of shock and disruption associated with COVID-19. As a result, some Australian seafood producers have experienced catastrophic impacts, others moderate negative impacts and still others have been positively impacted.
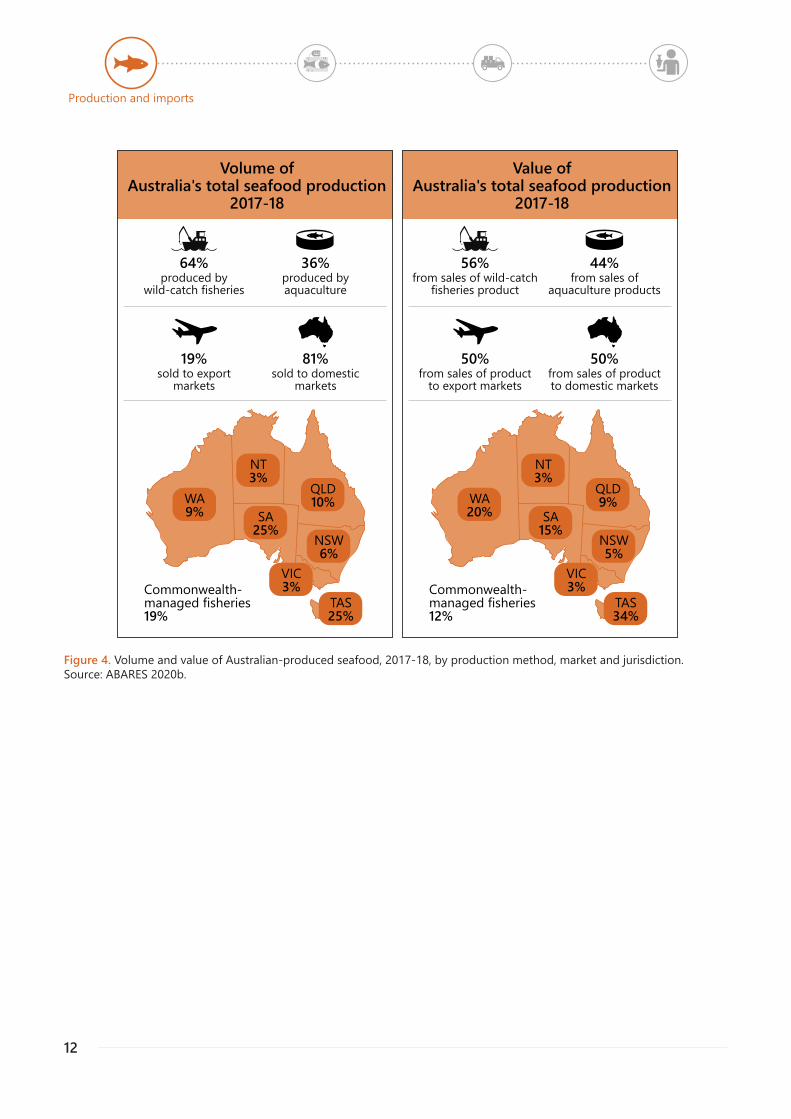
In the initial shock phase, impact was most evident and broadly experienced across a number of high-value sectors airfreighting seafood to live and fresh export markets (e.g. Lobster, Abalone – see Figure 4). These products were particularly exposed to the initial outbreak in China and subsequent physical distancing restrictions dampening demand, as well as to international border closures and reductions in air freight capacity. This resulted in reduced volume and price for product targeted at a range of export markets.
During the lockdown phase, Australian seafood such as Wrasse, Mud Crabs, and Oysters, sold live into the food service sector, experienced significant dampening of domestic consumer demand due to the impact on dine-in activity and restaurant trade in most Australian states. This resulted in some fisheries and aquaculture sectors effectively shutting down production for a period with resultant revenue losses.
During this phase seafood producers experienced heightened uncertainty and delays in supply of production inputs, such as labour and aquaculture feed ingredients, due to COVID-19 disruptions to transport and logistic services.
The lockdown phase also saw Australian seafood exports resume but at lower levels in terms of both price and volume. Imports of New Zealand seafood remain lower than average, and some Australian wholesalers and retailers capitalise on increased consumer demand for fresh, frozen and canned seafood to eat at home. This phase also saw an increase within Australia of average prices for seafood products.
In the initial easing phase, production levels returned to close to normal for most seafood producers, as either their usual markets were re-established, or producers had adapted to find new markets or distribution channels.
The effects on price and value do not reflect the full financial impact of the COVID-19 pandemic on the Australian seafood industry. Many businesses experienced additional direct cost and other transaction burdens as a result of disruptions and delays in freight and logistics and in meeting physical distancing requirements. For example, additional hours were worked by staff and operators to meet COVID-19 safety requirements, find alternative freight services, packaging options and markets.
Production and imports
12
Production and imports
Volume ofAustralia's total seafood production
2017-18
64%
WA9%
NT3%
Commonwealth-managed fisheries19%
produced bywild-catch fisheries
QLD10%
NSW6%
VIC3%
SA25%
TAS25%
36%produced byaquaculture
19%sold to export
markets
81%sold to domestic
markets
Value ofAustralia's total seafood production
2017-18
56%
WA20%
NT3%
Commonwealth-managed fisheries12%
from sales of wild-catchfisheries product
QLD9%
NSW5%
VIC3%
SA15%
TAS34%
44%from sales of
aquaculture products
50%from sales of product
to export markets
50%from sales of productto domestic markets
Figure 4. Volume and value of Australian-produced seafood, 2017-18, by production method, market and jurisdiction.Source: ABARES 2020b.
13
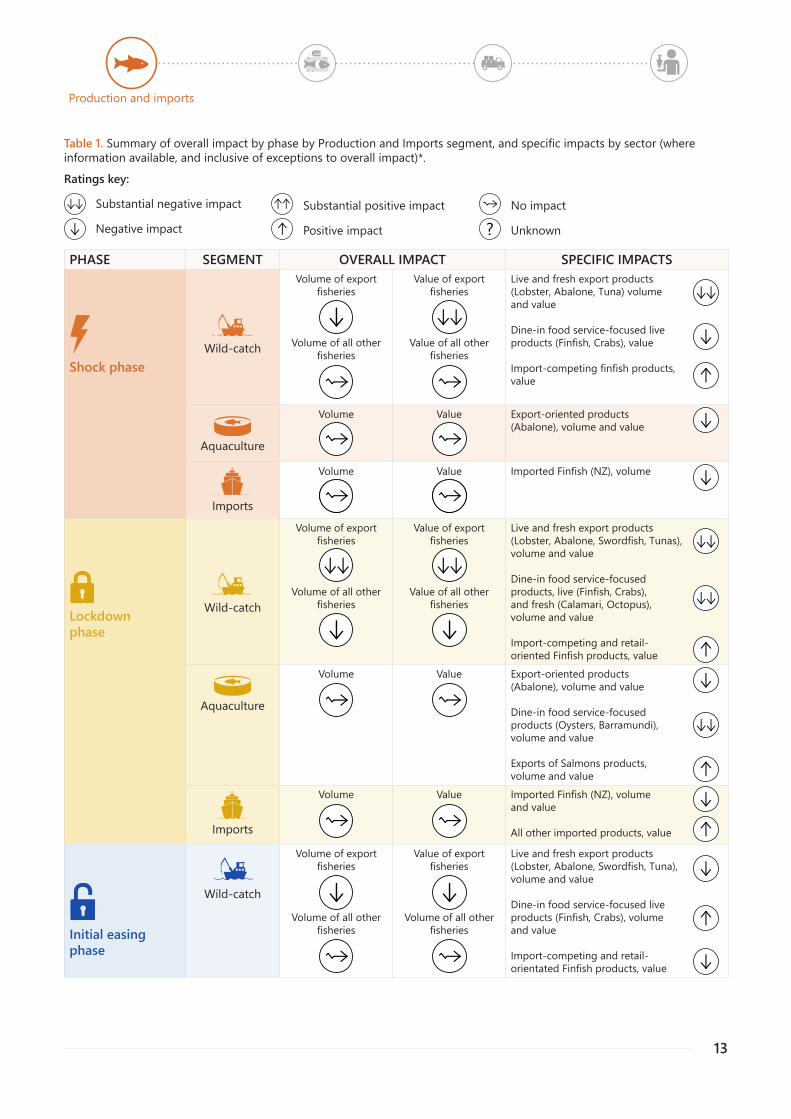
Table 1. Summary of overall impact by phase by Production and Imports segment, and specific impacts by sector (where information available, and inclusive of exceptions to overall impact)*.
Ratings key:
Substantial negative impact
Negative impact
Substantial positive impact
Positive impact
No impact
PHASE SEGMENT OVERALL IMPACT SPECIFIC IMPACTS
Shock phaseWild-catch
Volume of export fisheries
Volume of all other fisheries
Value of export fisheries
Value of all other fisheries
Live and fresh export products(Lobster, Abalone, Tuna) volumeand value
Dine-in food service-focused liveproducts (Finfish, Crabs), value
Import-competing finfish products,value
Aquaculture
Volume Value Export-oriented products(Abalone), volume and value
Imports
Volume Value Imported Finfish (NZ), volume
Lockdownphase
Wild-catch
Volume of export fisheries
Volume of all other fisheries
Value of export fisheries
Value of all other fisheries
Live and fresh export products(Lobster, Abalone, Swordfish, Tunas),volume and value
Dine-in food service-focusedproducts, live (Finfish, Crabs),and fresh (Calamari, Octopus),volume and value
Import-competing and retail-oriented Finfish products, value
Aquaculture
Volume Value Export-oriented products(Abalone), volume and value
Dine-in food service-focusedproducts (Oysters, Barramundi),volume and value
Exports of Salmons products,volume and value
Imports
Volume Value Imported Finfish (NZ), volumeand value
All other imported products, value
Initial easing phase
Wild-catch
Volume of exportfisheries
Volume of all otherfisheries
Value of exportfisheries
Volume of all otherfisheries
Live and fresh export products(Lobster, Abalone, Swordfish, Tuna),volume and value
Dine-in food service-focused liveproducts (Finfish, Crabs), volumeand value
Import-competing and retail-orientated Finfish products, value
Unknown?
Production and imports
14
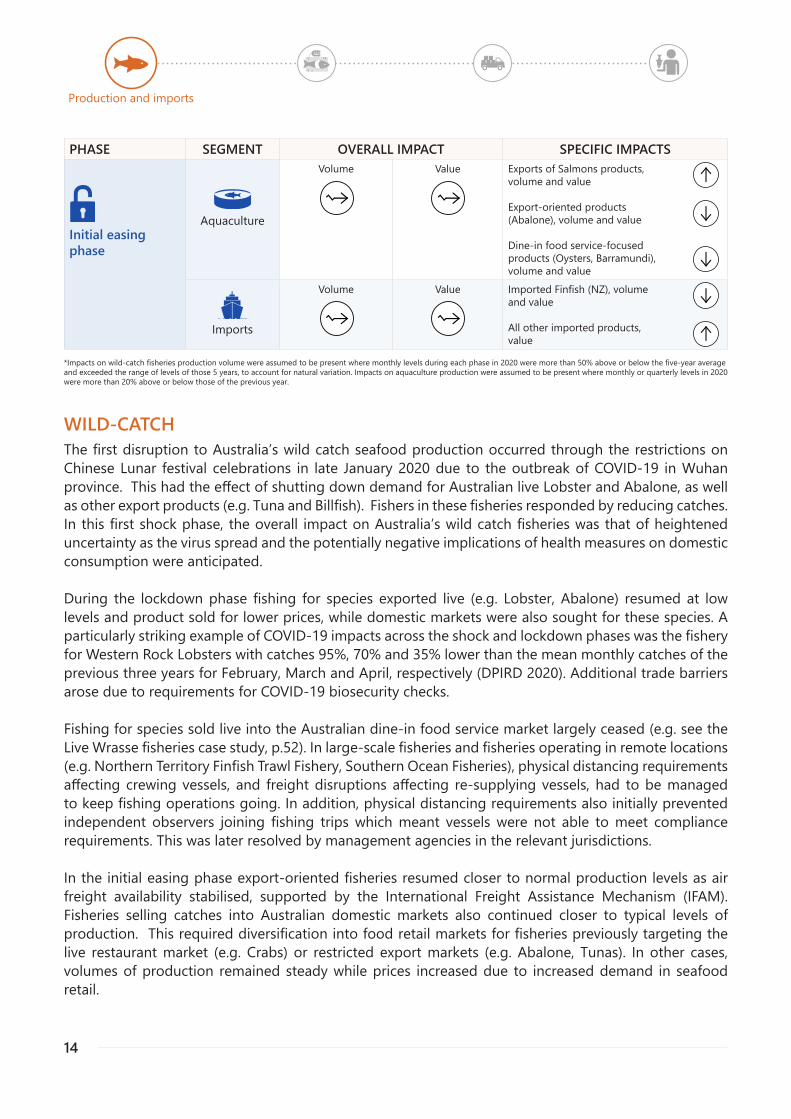
PHASE SEGMENT OVERALL IMPACT SPECIFIC IMPACTS
Initial easing phase
Aquaculture
Volume Value Exports of Salmons products,volume and value
Export-oriented products(Abalone), volume and value
Dine-in food service-focusedproducts (Oysters, Barramundi),volume and value
Imports
Volume Value Imported Finfish (NZ), volumeand value
All other imported products,value
WILD-CATCHThe first disruption to Australia’s wild catch seafood production occurred through the restrictions on Chinese Lunar festival celebrations in late January 2020 due to the outbreak of COVID-19 in Wuhan province. This had the effect of shutting down demand for Australian live Lobster and Abalone, as well as other export products (e.g. Tuna and Billfish). Fishers in these fisheries responded by reducing catches. In this first shock phase, the overall impact on Australia’s wild catch fisheries was that of heightened uncertainty as the virus spread and the potentially negative implications of health measures on domestic consumption were anticipated.
During the lockdown phase fishing for species exported live (e.g. Lobster, Abalone) resumed at low levels and product sold for lower prices, while domestic markets were also sought for these species. A particularly striking example of COVID-19 impacts across the shock and lockdown phases was the fishery for Western Rock Lobsters with catches 95%, 70% and 35% lower than the mean monthly catches of the previous three years for February, March and April, respectively (DPIRD 2020). Additional trade barriers arose due to requirements for COVID-19 biosecurity checks.
Fishing for species sold live into the Australian dine-in food service market largely ceased (e.g. see the Live Wrasse fisheries case study, p.52). In large-scale fisheries and fisheries operating in remote locations (e.g. Northern Territory Finfish Trawl Fishery, Southern Ocean Fisheries), physical distancing requirements affecting crewing vessels, and freight disruptions affecting re-supplying vessels, had to be managed to keep fishing operations going. In addition, physical distancing requirements also initially prevented independent observers joining fishing trips which meant vessels were not able to meet compliance requirements. This was later resolved by management agencies in the relevant jurisdictions.
In the initial easing phase export-oriented fisheries resumed closer to normal production levels as air freight availability stabilised, supported by the International Freight Assistance Mechanism (IFAM). Fisheries selling catches into Australian domestic markets also continued closer to typical levels of production. This required diversification into food retail markets for fisheries previously targeting the live restaurant market (e.g. Crabs) or restricted export markets (e.g. Abalone, Tunas). In other cases, volumes of production remained steady while prices increased due to increased demand in seafood retail.
Production and imports
*Impacts on wild-catch fisheries production volume were assumed to be present where monthly levels during each phase in 2020 were more than 50% above or below the five-year average and exceeded the range of levels of those 5 years, to account for natural variation. Impacts on aquaculture production were assumed to be present where monthly or quarterly levels in 2020 were more than 20% above or below those of the previous year.
15
Through the national Research Providers Network aggregated monthly catch data for major species and or fisheries is being made available for all Australian jurisdictions. Data from most jurisdictions covering diverse fisheries from coastal to offshore and demersal to pelagic are reported here (Figures 5-10). The fisheries for which data was available represent approximately 80% of total Australian fisheries production, and approximately 70% of total value, based on 2017-18 levels (ABARES 2020b). There are clear and substantial COVID-19 impacts on production in some fisheries, more complex impacts on other fisheries where COVID-19 is only one source of disruption, and limited impact on others (mostly the domestic Finfish fisheries).
Charts show monthly catches for January-June 2020 are compared to average monthly catches for the period 2015-2019 or 2014/15-2018/19 for a number of fisheries and species to illustrate COVID-19 impacts. The average is shown for simplicity, however where the 2020 catch in a particular month is lower than the average it may not mean the difference is significant. In many cases the 2020 monthly catch still sits within the range of the previous years. Specific months when the catch was lower than the range are highlighted below.
Data from two jurisdictions were not available at the completion of this report. In addition, data were aggregated across species and fisheries due to confidentiality considerations. As data for some species could not be reported, totals presented here may be lower than the actual catch in some months.
In specific fisheries, factors other than COVID-19 had a large effect on production levels over the January -June 2020 period, such as seismic testing effects on some Finfish species targeted in the South East Shark and Scalefish Fishery, and environmental effects of preceding dry years in the northern Australian fisheries.
Production and imports
16
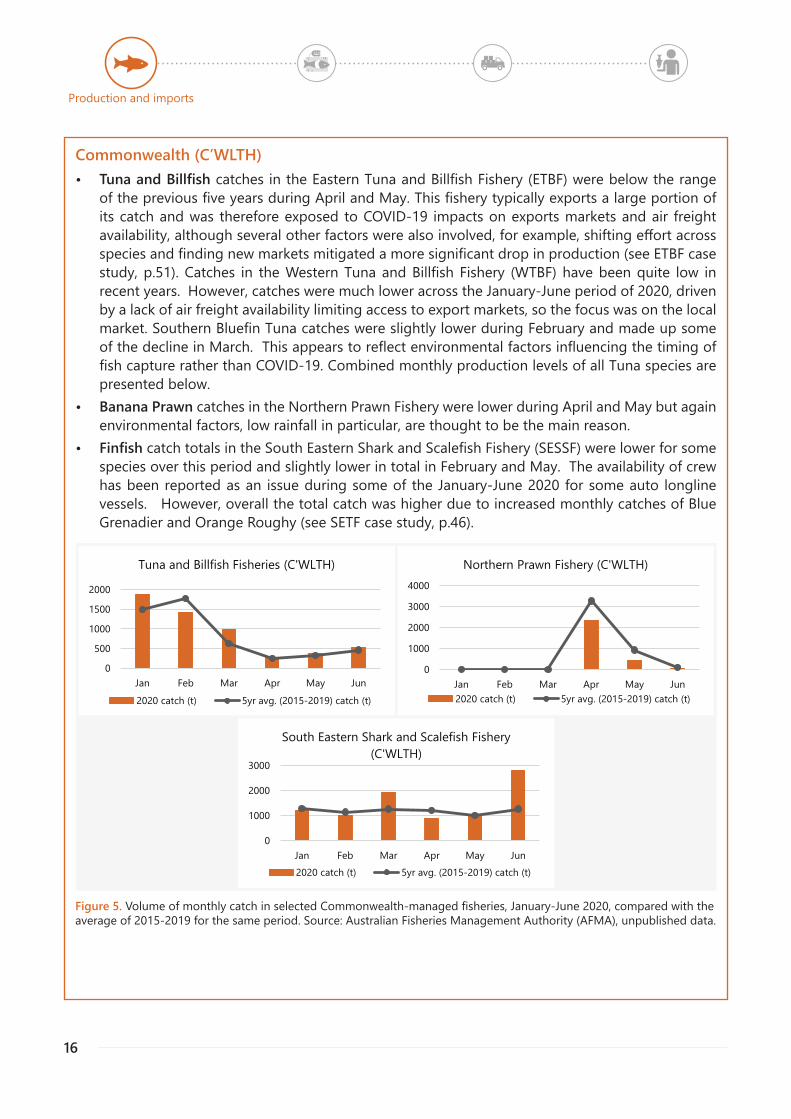
Figure 5. Volume of monthly catch in selected Commonwealth-managed fisheries, January-June 2020, compared with the average of 2015-2019 for the same period. Source: Australian Fisheries Management Authority (AFMA), unpublished data.
Commonwealth (C’WLTH)• Tuna and Billfish catches in the Eastern Tuna and Billfish Fishery (ETBF) were below the range
of the previous five years during April and May. This fishery typically exports a large portion of its catch and was therefore exposed to COVID-19 impacts on exports markets and air freight availability, although several other factors were also involved, for example, shifting effort across species and finding new markets mitigated a more significant drop in production (see ETBF case study, p.51). Catches in the Western Tuna and Billfish Fishery (WTBF) have been quite low in recent years. However, catches were much lower across the January-June period of 2020, driven by a lack of air freight availability limiting access to export markets, so the focus was on the local market. Southern Bluefin Tuna catches were slightly lower during February and made up some of the decline in March. This appears to reflect environmental factors influencing the timing of fish capture rather than COVID-19. Combined monthly production levels of all Tuna species are presented below.
• Banana Prawn catches in the Northern Prawn Fishery were lower during April and May but again environmental factors, low rainfall in particular, are thought to be the main reason.
• Finfish catch totals in the South Eastern Shark and Scalefish Fishery (SESSF) were lower for some species over this period and slightly lower in total in February and May. The availability of crew has been reported as an issue during some of the January-June 2020 for some auto longline vessels. However, overall the total catch was higher due to increased monthly catches of Blue Grenadier and Orange Roughy (see SETF case study, p.46).
0
500
1000
1500
2000
Jan Feb Mar Apr May Jun
Tuna and Billfish Fisheries (C'WLTH)
2020 catch (t) 5yr avg. (2015-2019) catch (t)
0
1000
2000
3000
4000
Jan Feb Mar Apr May Jun
Northern Prawn Fishery (C'WLTH)
2020 catch (t) 5yr avg. (2015-2019) catch (t)
0
1000
2000
3000
Jan Feb Mar Apr May Jun
South Eastern Shark and Scalefish Fishery (C'WLTH)
2020 catch (t) 5yr avg. (2015-2019) catch (t)
Production and imports
17
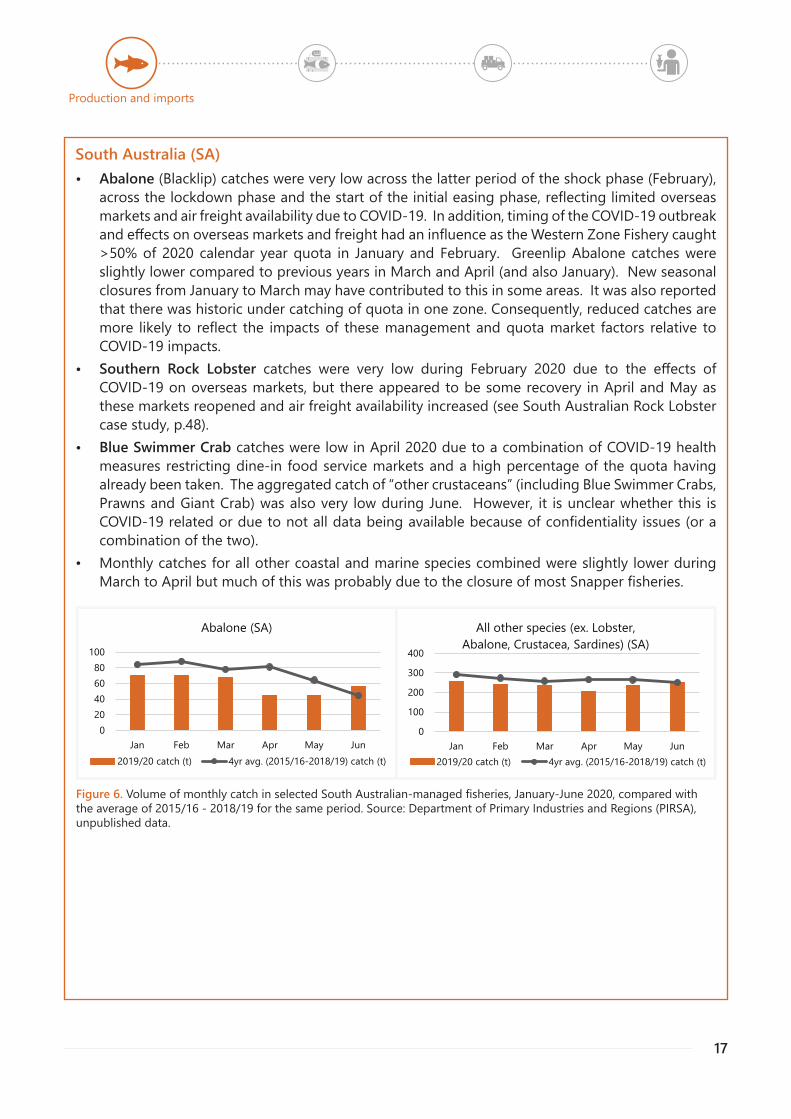
Figure 6. Volume of monthly catch in selected South Australian-managed fisheries, January-June 2020, compared with the average of 2015/16 - 2018/19 for the same period. Source: Department of Primary Industries and Regions (PIRSA), unpublished data.
South Australia (SA)• Abalone (Blacklip) catches were very low across the latter period of the shock phase (February),
across the lockdown phase and the start of the initial easing phase, reflecting limited overseas markets and air freight availability due to COVID-19. In addition, timing of the COVID-19 outbreak and effects on overseas markets and freight had an influence as the Western Zone Fishery caught >50% of 2020 calendar year quota in January and February. Greenlip Abalone catches were slightly lower compared to previous years in March and April (and also January). New seasonal closures from January to March may have contributed to this in some areas. It was also reported that there was historic under catching of quota in one zone. Consequently, reduced catches are more likely to reflect the impacts of these management and quota market factors relative to COVID-19 impacts.
• Southern Rock Lobster catches were very low during February 2020 due to the effects of COVID-19 on overseas markets, but there appeared to be some recovery in April and May as these markets reopened and air freight availability increased (see South Australian Rock Lobster case study, p.48).
• Blue Swimmer Crab catches were low in April 2020 due to a combination of COVID-19 health measures restricting dine-in food service markets and a high percentage of the quota having already been taken. The aggregated catch of “other crustaceans” (including Blue Swimmer Crabs, Prawns and Giant Crab) was also very low during June. However, it is unclear whether this is COVID-19 related or due to not all data being available because of confidentiality issues (or a combination of the two).
• Monthly catches for all other coastal and marine species combined were slightly lower during March to April but much of this was probably due to the closure of most Snapper fisheries.
020406080
100
Jan Feb Mar Apr May Jun
Abalone (SA)
2019/20 catch (t) 4yr avg. (2015/16-2018/19) catch (t)
0
100
200
300
400
Jan Feb Mar Apr May Jun
All other species (ex. Lobster, Abalone, Crustacea, Sardines) (SA)
2019/20 catch (t) 4yr avg. (2015/16-2018/19) catch (t)
Production and imports
18
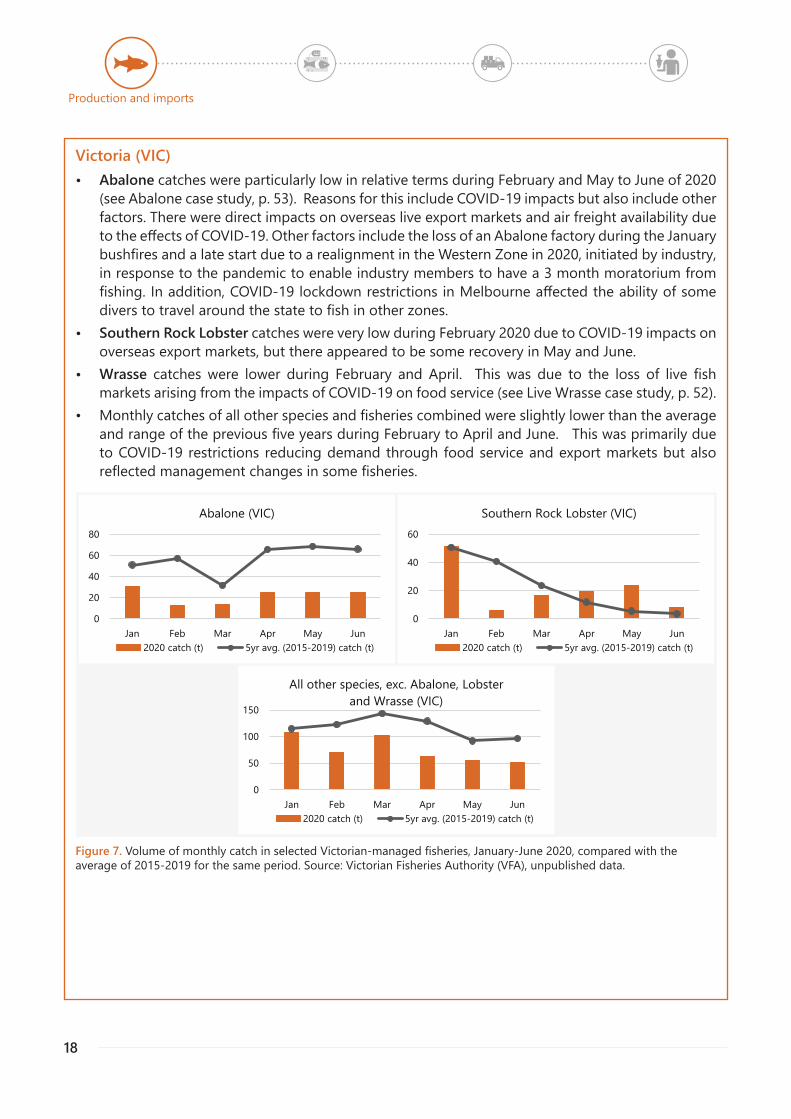
Figure 7. Volume of monthly catch in selected Victorian-managed fisheries, January-June 2020, compared with the average of 2015-2019 for the same period. Source: Victorian Fisheries Authority (VFA), unpublished data.
Victoria (VIC)• Abalone catches were particularly low in relative terms during February and May to June of 2020
(see Abalone case study, p. 53). Reasons for this include COVID-19 impacts but also include other factors. There were direct impacts on overseas live export markets and air freight availability due to the effects of COVID-19. Other factors include the loss of an Abalone factory during the January bushfires and a late start due to a realignment in the Western Zone in 2020, initiated by industry, in response to the pandemic to enable industry members to have a 3 month moratorium from fishing. In addition, COVID-19 lockdown restrictions in Melbourne affected the ability of some divers to travel around the state to fish in other zones.
• Southern Rock Lobster catches were very low during February 2020 due to COVID-19 impacts on overseas export markets, but there appeared to be some recovery in May and June.
• Wrasse catches were lower during February and April. This was due to the loss of live fish markets arising from the impacts of COVID-19 on food service (see Live Wrasse case study, p. 52).
• Monthly catches of all other species and fisheries combined were slightly lower than the average and range of the previous five years during February to April and June. This was primarily due to COVID-19 restrictions reducing demand through food service and export markets but also reflected management changes in some fisheries.
0
20
40
60
80
Jan Feb Mar Apr May Jun
Abalone (VIC)
2020 catch (t) 5yr avg. (2015-2019) catch (t)
0
20
40
60
Jan Feb Mar Apr May Jun
Southern Rock Lobster (VIC)
2020 catch (t) 5yr avg. (2015-2019) catch (t)
0
50
100
150
Jan Feb Mar Apr May Jun
All other species, exc. Abalone, Lobster and Wrasse (VIC)
2020 catch (t) 5yr avg. (2015-2019) catch (t)
Production and imports
19
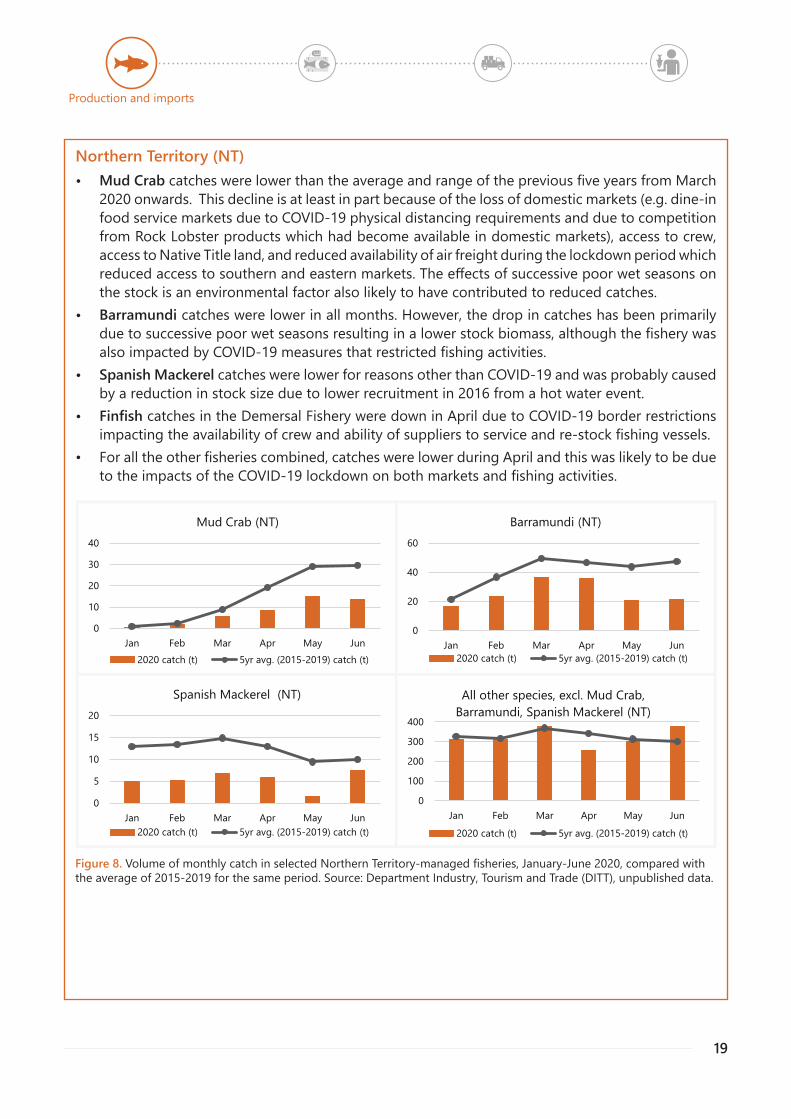
Figure 8. Volume of monthly catch in selected Northern Territory-managed fisheries, January-June 2020, compared with the average of 2015-2019 for the same period. Source: Department Industry, Tourism and Trade (DITT), unpublished data.
Northern Territory (NT)• Mud Crab catches were lower than the average and range of the previous five years from March
2020 onwards. This decline is at least in part because of the loss of domestic markets (e.g. dine-in food service markets due to COVID-19 physical distancing requirements and due to competition from Rock Lobster products which had become available in domestic markets), access to crew, access to Native Title land, and reduced availability of air freight during the lockdown period which reduced access to southern and eastern markets. The effects of successive poor wet seasons on the stock is an environmental factor also likely to have contributed to reduced catches.
• Barramundi catches were lower in all months. However, the drop in catches has been primarily due to successive poor wet seasons resulting in a lower stock biomass, although the fishery was also impacted by COVID-19 measures that restricted fishing activities.
• Spanish Mackerel catches were lower for reasons other than COVID-19 and was probably caused by a reduction in stock size due to lower recruitment in 2016 from a hot water event.
• Finfish catches in the Demersal Fishery were down in April due to COVID-19 border restrictions impacting the availability of crew and ability of suppliers to service and re-stock fishing vessels.
• For all the other fisheries combined, catches were lower during April and this was likely to be due to the impacts of the COVID-19 lockdown on both markets and fishing activities.
0
10
20
30
40
Jan Feb Mar Apr May Jun
Mud Crab (NT)
2020 catch (t) 5yr avg. (2015-2019) catch (t)
0
20
40
60
Jan Feb Mar Apr May Jun
Barramundi (NT)
2020 catch (t) 5yr avg. (2015-2019) catch (t)
0
5
10
15
20
Jan Feb Mar Apr May Jun
Spanish Mackerel (NT)
2020 catch (t) 5yr avg. (2015-2019) catch (t)
0
100
200
300
400
Jan Feb Mar Apr May Jun
All other species, excl. Mud Crab, Barramundi, Spanish Mackerel (NT)
2020 catch (t) 5yr avg. (2015-2019) catch (t)
Production and imports
20
Figure 9. Volume of monthly catch in selected Tasmania-managed fisheries, January-June 2020, compared with the average of 2015-2019 for the same period. Source: Department Primary Industries, Parks, Water and Environment (DPIPWE), unpublished data.
050
100150200
Jan Feb Mar Apr May Jun
Abalone (TAS)
2020 catch (t) 5yr avg (2015-19) catch (t)
0
50
100
150
200
Jan Feb Mar Apr May Jun
Southern Rock Lobster (TAS)
2020 catch (t) 5yr avg. (2015-2019) catch (t)
0
2
4
6
Jan Feb Mar Apr May Jun
Giant Crab (TAS)
2020 catch (t) 5yr avg. (2015-2019) catch (t)
0
20
40
60
Jan Feb Mar Apr May Jun
Selected other species, Finfish and Cephalopods (TAS)
2020 catch (t) 5yr avg. (2015-2019) catch (t)
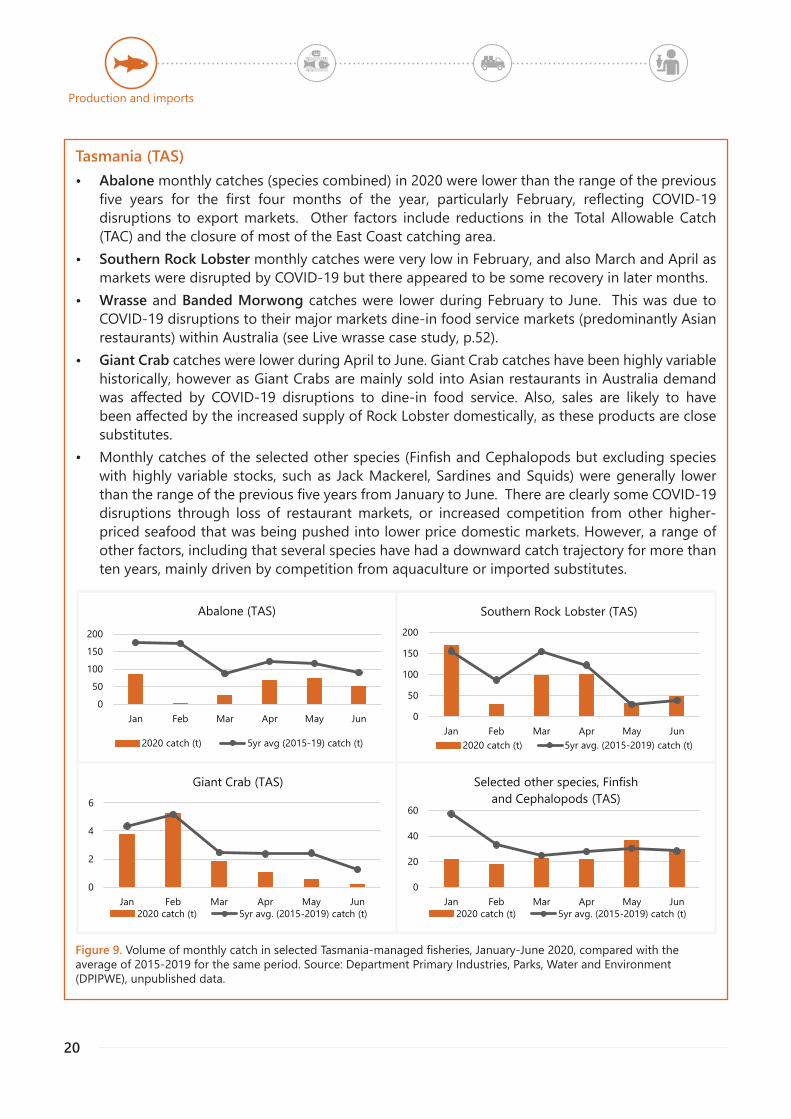
Tasmania (TAS)• Abalone monthly catches (species combined) in 2020 were lower than the range of the previous
five years for the first four months of the year, particularly February, reflecting COVID-19 disruptions to export markets. Other factors include reductions in the Total Allowable Catch (TAC) and the closure of most of the East Coast catching area.
• Southern Rock Lobster monthly catches were very low in February, and also March and April as markets were disrupted by COVID-19 but there appeared to be some recovery in later months.
• Wrasse and Banded Morwong catches were lower during February to June. This was due to COVID-19 disruptions to their major markets dine-in food service markets (predominantly Asian restaurants) within Australia (see Live wrasse case study, p.52).
• Giant Crab catches were lower during April to June. Giant Crab catches have been highly variable historically, however as Giant Crabs are mainly sold into Asian restaurants in Australia demand was affected by COVID-19 disruptions to dine-in food service. Also, sales are likely to have been affected by the increased supply of Rock Lobster domestically, as these products are close substitutes.
• Monthly catches of the selected other species (Finfish and Cephalopods but excluding species with highly variable stocks, such as Jack Mackerel, Sardines and Squids) were generally lower than the range of the previous five years from January to June. There are clearly some COVID-19 disruptions through loss of restaurant markets, or increased competition from other higher-priced seafood that was being pushed into lower price domestic markets. However, a range of other factors, including that several species have had a downward catch trajectory for more than ten years, mainly driven by competition from aquaculture or imported substitutes.
Production and imports
21
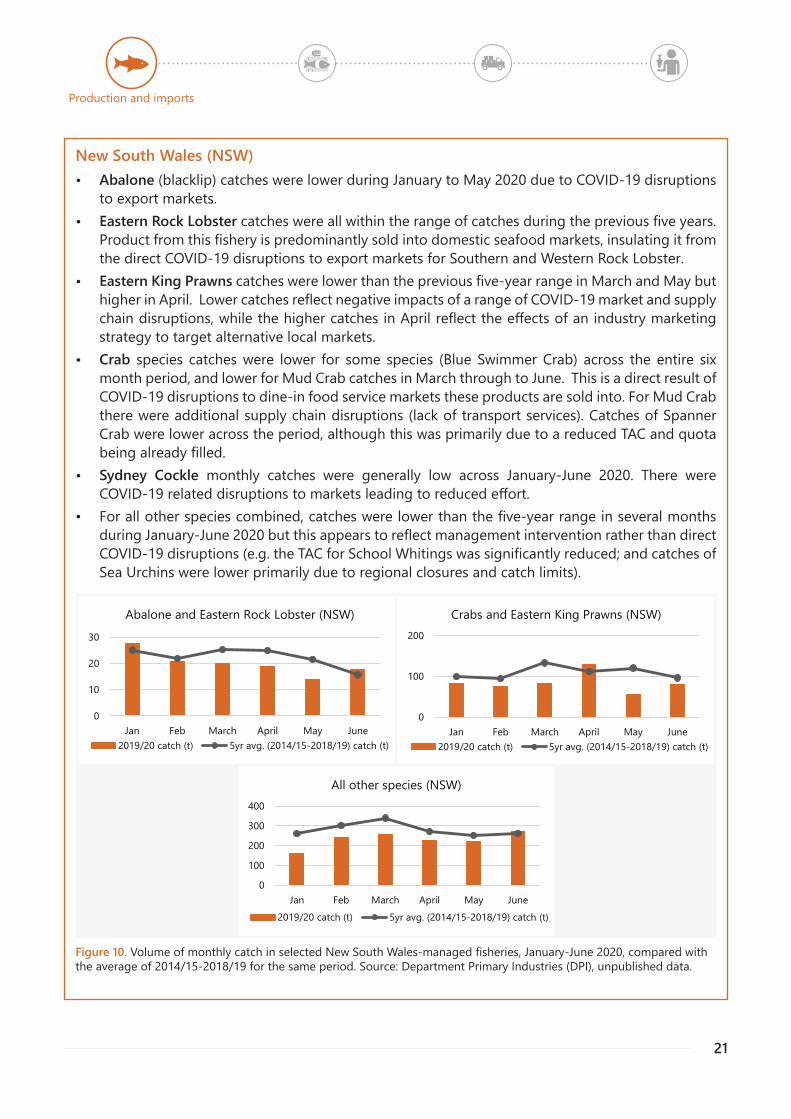
Figure 10. Volume of monthly catch in selected New South Wales-managed fisheries, January-June 2020, compared with the average of 2014/15-2018/19 for the same period. Source: Department Primary Industries (DPI), unpublished data.
0
10
20
30
Jan Feb March April May June
Abalone and Eastern Rock Lobster (NSW)
2019/20 catch (t) 5yr avg. (2014/15-2018/19) catch (t)
0
100
200
Jan Feb March April May June
Crabs and Eastern King Prawns (NSW)
2019/20 catch (t) 5yr avg. (2014/15-2018/19) catch (t)
0
100
200
300
400
Jan Feb March April May June
All other species (NSW)
2019/20 catch (t) 5yr avg. (2014/15-2018/19) catch (t)
New South Wales (NSW)• Abalone (blacklip) catches were lower during January to May 2020 due to COVID-19 disruptions
to export markets. • Eastern Rock Lobster catches were all within the range of catches during the previous five years.
Product from this fishery is predominantly sold into domestic seafood markets, insulating it from the direct COVID-19 disruptions to export markets for Southern and Western Rock Lobster.
• Eastern King Prawns catches were lower than the previous five-year range in March and May but higher in April. Lower catches reflect negative impacts of a range of COVID-19 market and supply chain disruptions, while the higher catches in April reflect the effects of an industry marketing strategy to target alternative local markets.
• Crab species catches were lower for some species (Blue Swimmer Crab) across the entire six month period, and lower for Mud Crab catches in March through to June. This is a direct result of COVID-19 disruptions to dine-in food service markets these products are sold into. For Mud Crab there were additional supply chain disruptions (lack of transport services). Catches of Spanner Crab were lower across the period, although this was primarily due to a reduced TAC and quota being already filled.
• Sydney Cockle monthly catches were generally low across January-June 2020. There were COVID-19 related disruptions to markets leading to reduced effort.
• For all other species combined, catches were lower than the five-year range in several months during January-June 2020 but this appears to reflect management intervention rather than direct COVID-19 disruptions (e.g. the TAC for School Whitings was significantly reduced; and catches of Sea Urchins were lower primarily due to regional closures and catch limits).
Production and imports
22
AQUACULTUREThe COVID-19 pandemic effected aquaculture production and value in Australia differently due to the sector’s lower exposure to live export markets, greater focus on retail markets, and due to the production process itself which means that production levels can’t be rapidly adjusted in response to disruptions. Impacts were variable, however, and negative for export and domestic food service-oriented aquaculture producers such as Oyster and Abalone growers.
In the shock phase, disruption to aquaculture production was limited primarily to farmed abalone, which is exported to overseas food service markets, although reductions in the volume and value of domestic sales of some products (e.g. Barramundi and Oysters) through food service were being experienced as early as late February as well as through lockdown.
During the lockdown phase, exporting aquaculture sectors (e.g. Salmons, Tuna, Abalone) faced limited air freight availability and all producers experienced increased production and transaction costs as a result of domestic lockdown and physical distancing requirements for workplaces, and disruptions to transport services linking regional and metro areas of Australia. Oyster production volume and value was negatively affected by the restrictions on dine-in food service and producers lost significant market access as a result during this period. In the initial easing phase, Salmon producers were able to increase their supply into domestic retail outlets which to some extent offset the fall in food service sales. Farmed Prawn producers were somewhat protected against COVID-19 market disruptions, comparatively, as their harvest season ended in March. COVID-19 biosecurity measures introduced at Australian ports caused increased uncertainty and some delays in supplies of aquaculture inputs, such as feed and vaccines, during this phase.
During the initial easing phase, aquaculture volume and value for most species appears to have returned to levels consistent with recent past levels. Salmon producers were also able to export to alternative international markets, at a lower price, in the following months of the initial easing phase
Other factors which affected aquaculture production levels and value during this period as reported in industry interviews and reports included the continued expansion of sectors of aquaculture production (e.g. Prawns and Abalone), lower than average mortality rates (e.g. Salmons), and disease events in preceding years (e.g. White Spot, Pacific Oyster Mortality Syndrome) from which sectors were still recovering.
Production and imports
23
Production and imports
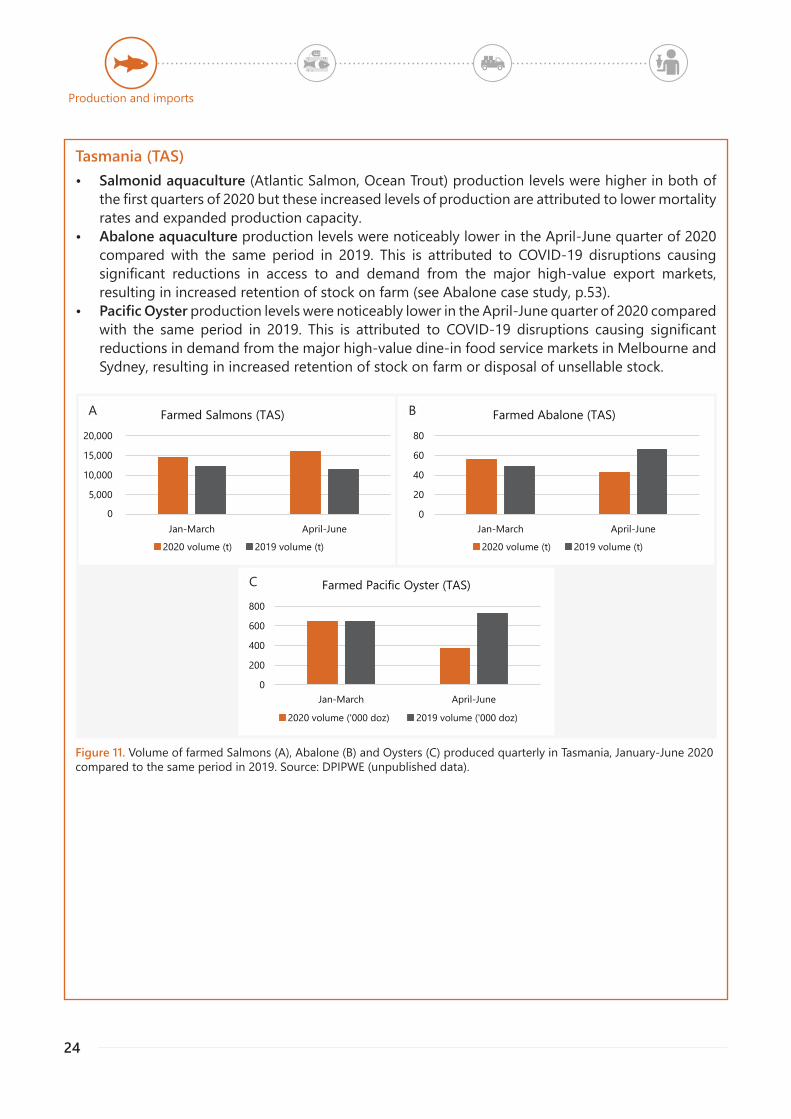
Aquaculture production data is reported annually by each State and Territory for the financial year period, rather than for the January-June period of this study, and so is not reported here. Quarterly production data of Tasmanian aquaculture is reported by the Department of Primary Industries, Parks, Water and Environment (DPIPWE), and is presented here as an example.
The data shows changes in levels of quarterly production of Tasmanian aquaculture species January-March and April-June 2020 compared with levels in the same quarters in 2019 (Figure 11). There are clear and substantial COVID-19 impacts on production for some aquaculture species (e.g. Oysters, Abalone). However, measuring the extent of these impacts on production is complex as aquaculture production levels are slower to adjust to short term impacts, and changes in production also reflect other drivers not linked to the COVID-19 pandemic.
24
Figure 11. Volume of farmed Salmons (A), Abalone (B) and Oysters (C) produced quarterly in Tasmania, January-June 2020 compared to the same period in 2019. Source: DPIPWE (unpublished data).
0
5,000
10,000
15,000
20,000
Jan-March April-June
Farmed Salmons (TAS)
2020 volume (t) 2019 volume (t)
0
20
40
60
80
Jan-March April-June
Farmed Abalone (TAS)
2020 volume (t) 2019 volume (t)
0
200
400
600
800
Jan-March April-June
Farmed Pacific Oyster (TAS)
2020 volume ('000 doz) 2019 volume ('000 doz)
Production and imports
Tasmania (TAS)• Salmonid aquaculture (Atlantic Salmon, Ocean Trout) production levels were higher in both of
the first quarters of 2020 but these increased levels of production are attributed to lower mortality rates and expanded production capacity.
• Abalone aquaculture production levels were noticeably lower in the April-June quarter of 2020 compared with the same period in 2019. This is attributed to COVID-19 disruptions causing significant reductions in access to and demand from the major high-value export markets, resulting in increased retention of stock on farm (see Abalone case study, p.53).
• Pacific Oyster production levels were noticeably lower in the April-June quarter of 2020 compared with the same period in 2019. This is attributed to COVID-19 disruptions causing significant reductions in demand from the major high-value dine-in food service markets in Melbourne and Sydney, resulting in increased retention of stock on farm or disposal of unsellable stock.
A B
C
25
IMPORTSDisruptions to levels of imported seafood is important to Australia’s seafood industry for two reasons; imports contribute approximately 65% of Australian seafood domestic consumption and is therefore a major source of revenue for many Australian seafood traders and product for Australian consumers, and secondarily, some imports (particularly the higher value ones) compete with Australian seafood. China, Thailand, Vietnam, New Zealand (NZ) and Indonesia are the top five countries by value from which Australia imports seafood.
Imports dominate the frozen and canned sectors and overall, both have done very well throughout the period January to June, in particular lower price-point fish sold by food service businesses, including fish and chip shops, Asian style food-court vendors and the lower tier dine-in outlets, such as cafes, pubs and clubs. As well, imports are also important in the food catering sector which services accommodation and travel, hospitals, aged care, prisons, cruise ships, etc. These sectors rely on affordable, shelf stable, ready to use, portion controlled, no waste products, typically frozen cartons of processed seafood – requiring form and volumes not produced in Australia.
Retailers have also taken the opportunity to sell imported frozen product (thawed) at wet fish counters (Basa, Hoki, Vanamei Prawns, Barramundi). More agile wholesalers have changed packaging to enable wholesale product intended for the food service to be split into retail ready packs.
The larger wholesalers and more versatile companies who import and sell higher value domestic product to higher end restaurants seized new opportunities by diverting product to be sold at wet fish counters of independent grocers and fishmongers resulting in an increase in market share in these sectors over the period.
Imports mainly rely on sea freight, which was less exposed to border restrictions and associated supply chain disruptions than other forms of freight.
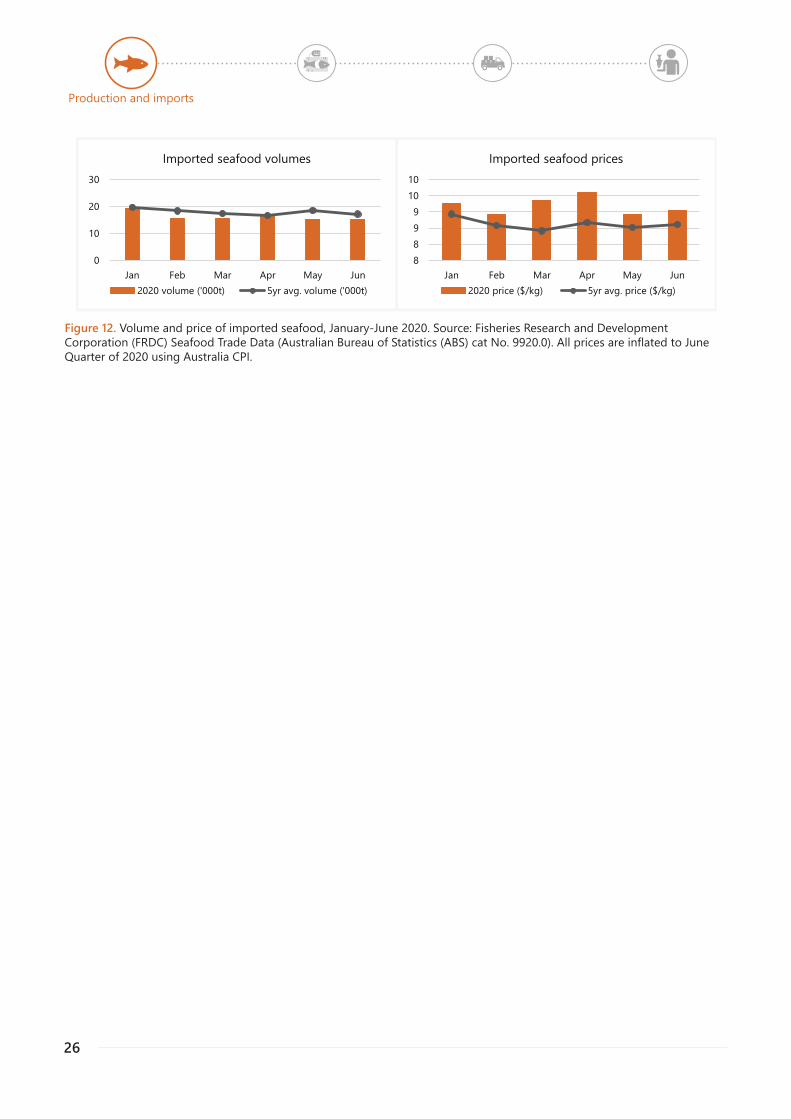
There was no significant change in the aggregate value or volume of seafood products imported to Australia January-June 2020 compared to the average of the same period in the last five years. However, one notable difference was the increase in price paid for imported product in March and April 2020 compared to the average of these months in the previous five years, largely a result of a sharp fall in the Australian dollar exchange rate in those months causing unit prices of imports to rise (Figure 12).
Imports of competing product from New Zealand (NZ) decreased when passenger flights were suspended, halting air freight of fish from NZ to Australia. Seafood imports from NZ were 24% lower January-June 2020 compared to the average of the same period in the previous five years (see CTS case study, p. 46).
Anecdotal evidence suggests that import inventories were largely unaffected during this period as there was little, or no, sea freight delays or disruptions. However, for importers who imported fresh seafood by air, the costs and availability of air freight did reduce supply to the Australian market.
Production and imports
26
Figure 12. Volume and price of imported seafood, January-June 2020. Source: Fisheries Research and Development Corporation (FRDC) Seafood Trade Data (Australian Bureau of Statistics (ABS) cat No. 9920.0). All prices are inflated to June Quarter of 2020 using Australia CPI.
0
10
20
30
Jan Feb Mar Apr May Jun
Imported seafood volumes
2020 volume ('000t) 5yr avg. volume ('000t)
8899
1010
Jan Feb Mar Apr May Jun
Imported seafood prices
2020 price ($/kg) 5yr avg. price ($/kg)
Production and imports
27
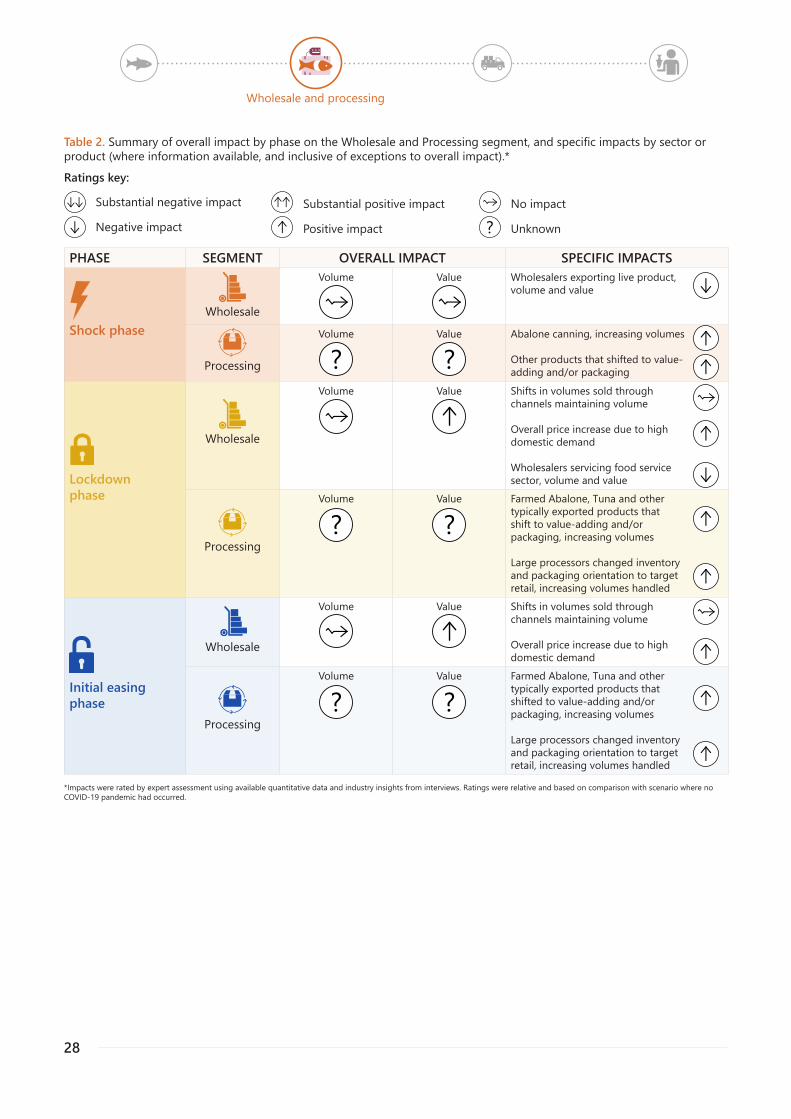
WHOLESALE AND PROCESSINGSeafood within Australia is received from producers by wholesalers who re-distribute and, in some cases, convert the seafood into product for further markets, including export markets, domestic retail and food service, or sell directly into final markets (e.g. institutional markets).
Wholesalers became central to the process of cold store inventory as well as re-directing product from food service towards retail. In some cases, this included additional packaging or processing (i.e. value- adding).
In the initial shock phase the wholesale and processing sector was impacted by the restrictions on export markets in China, and responded by tanking, inventory and processing some of this live product for alternative markets (e.g. canning of Abalone, see Table 2). During this phase some wholesalers and processors handling primarily live or fresh product for export faced high degrees of uncertainty concerning their business continuity. In the lockdown phase wholesalers and processors experienced additional demand for packaging and value-adding seafood product typically sold as wetfish or live product for product types better suited to retail or takeaway food service. In the initial easing phase export wholesalers were able to resume more typical levels of export volumes although at lower prices. The shift in demand for seafood product through retail rather than dine-in food service continued.
Businesses in this sector experienced considerable impacts to their operating costs due to increased requirements for physical distancing and other preventative health measures including COVID-19 safety planning and biosecurity requirements for imported and exported products.
Wholesale and processing
28
Table 2. Summary of overall impact by phase on the Wholesale and Processing segment, and specific impacts by sector or product (where information available, and inclusive of exceptions to overall impact).*
Ratings key:
Substantial negative impact
Negative impact
Substantial positive impact
Positive impact
No impact
PHASE SEGMENT OVERALL IMPACT SPECIFIC IMPACTS
Shock phaseWholesale
Volume Value Wholesalers exporting live product,volume and value
Processing
Volume Value Abalone canning, increasing volumes
Other products that shifted to value-adding and/or packaging
Lockdownphase
Wholesale
Volume Value Shifts in volumes sold throughchannels maintaining volume
Overall price increase due to highdomestic demand
Wholesalers servicing food servicesector, volume and value
Processing
Volume Value Farmed Abalone, Tuna and othertypically exported products thatshift to value-adding and/orpackaging, increasing volumes
Large processors changed inventoryand packaging orientation to targetretail, increasing volumes handled
Initial easing phase
Wholesale
Volume Value Shifts in volumes sold throughchannels maintaining volume
Overall price increase due to highdomestic demand
Processing
Volume Value Farmed Abalone, Tuna and othertypically exported products thatshifted to value-adding and/orpackaging, increasing volumes
Large processors changed inventoryand packaging orientation to targetretail, increasing volumes handled
Unknown?
? ?
? ?
? ?
Wholesale and processing
*Impacts were rated by expert assessment using available quantitative data and industry insights from interviews. Ratings were relative and based on comparison with scenario where no COVID-19 pandemic had occurred.
29
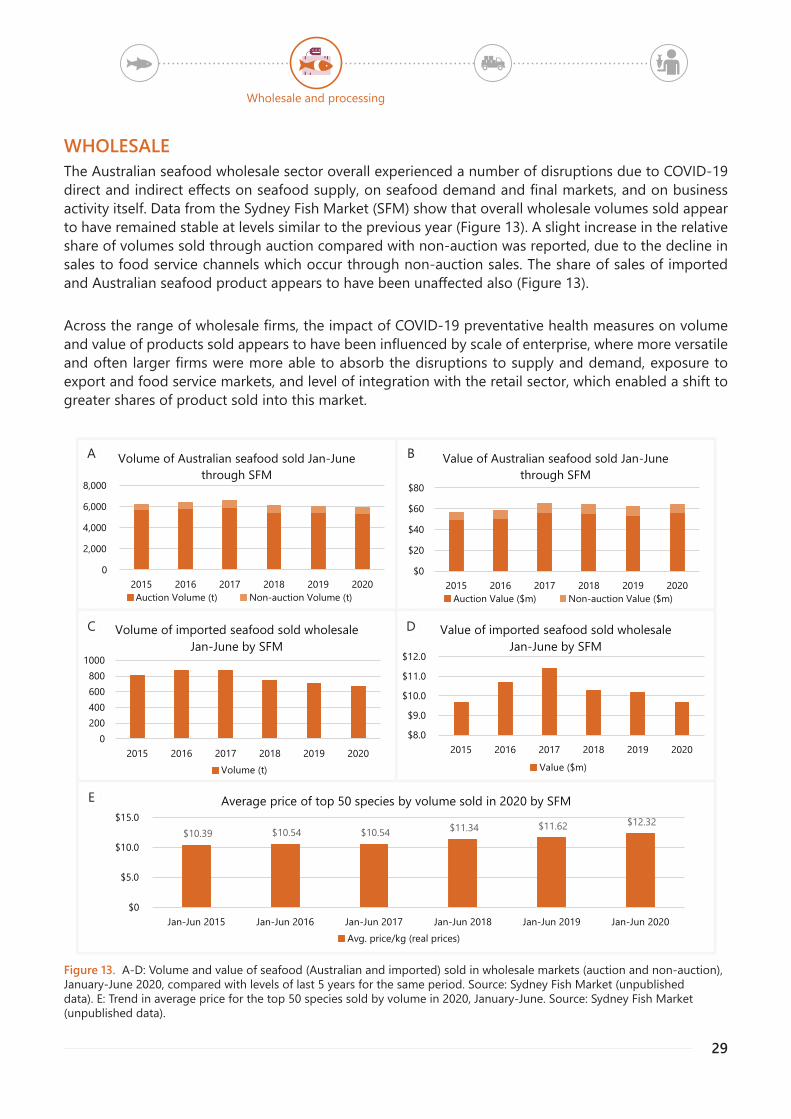
Figure 13. A-D: Volume and value of seafood (Australian and imported) sold in wholesale markets (auction and non-auction), January-June 2020, compared with levels of last 5 years for the same period. Source: Sydney Fish Market (unpublished data). E: Trend in average price for the top 50 species sold by volume in 2020, January-June. Source: Sydney Fish Market (unpublished data).
0
2,000
4,000
6,000
8,000
2015 2016 2017 2018 2019 2020
Volume of Australian seafood sold Jan-June through SFM
Auction Volume (t) Non-auction Volume (t)
$0
$20
$40
$60
$80
2015 2016 2017 2018 2019 2020
Value of Australian seafood sold Jan-June through SFM
Auction Value ($m) Non-auction Value ($m)
0200400600800
1000
2015 2016 2017 2018 2019 2020
Volume of imported seafood sold wholesale Jan-June by SFM
Volume (t)
$8.0
$9.0
$10.0
$11.0
$12.0
2015 2016 2017 2018 2019 2020
Value of imported seafood sold wholesale Jan-June by SFM
Value ($m)
A
C
B
D
$10.39 $10.54 $10.54 $11.34 $11.62 $12.32
$0
$5.0
$10.0
$15.0
Jan-Jun 2015 Jan-Jun 2016 Jan-Jun 2017 Jan-Jun 2018 Jan-Jun 2019 Jan-Jun 2020
Average price of top 50 species by volume sold in 2020 by SFM
Avg. price/kg (real prices)
E
Wholesale and processing
WHOLESALEThe Australian seafood wholesale sector overall experienced a number of disruptions due to COVID-19 direct and indirect effects on seafood supply, on seafood demand and final markets, and on business activity itself. Data from the Sydney Fish Market (SFM) show that overall wholesale volumes sold appear to have remained stable at levels similar to the previous year (Figure 13). A slight increase in the relative share of volumes sold through auction compared with non-auction was reported, due to the decline in sales to food service channels which occur through non-auction sales. The share of sales of imported and Australian seafood product appears to have been unaffected also (Figure 13).
Across the range of wholesale firms, the impact of COVID-19 preventative health measures on volume and value of products sold appears to have been influenced by scale of enterprise, where more versatile and often larger firms were more able to absorb the disruptions to supply and demand, exposure to export and food service markets, and level of integration with the retail sector, which enabled a shift to greater shares of product sold into this market.
30
PROCESSING AND PACKAGINGSeafood processing includes skinning, gilling and gutting, filleting, shucking, cooking, smoking, preserving or canning. Processing establishments vary in their size, scope of operations and sophistication of technologies employed.
Compared with other food commodities, very little value-added processing of fish products occurs in Australia for either export or domestic markets. The majority of businesses undertake only basic processing, such as cleaning, filleting, chilling, freezing and packaging, but some have the capacity for significant product transformation and innovation (e.g. Walker Seafoods, Fergusons, Goolwa Pipis). Only a few companies are able to handle large volumes, three of which are focused on Atlantic salmon (Huon, Tassal, Petuna). A majority of domestic supplies is sent fresh-chilled to markets including Sydney Fish Market and the Melbourne Seafood Centre. During the lockdown phase there was an increase in online sales to retail consumers.
There is no data on the impact of COVID-19 on the processing sector but it can be assumed with buoyant domestic demand that negative impacts were minimal. Those businesses with facilities affected by lockdowns but able to shift processing to other facilities to meet demand, are likely to have been the most resilient.
Wholesale and processing
31
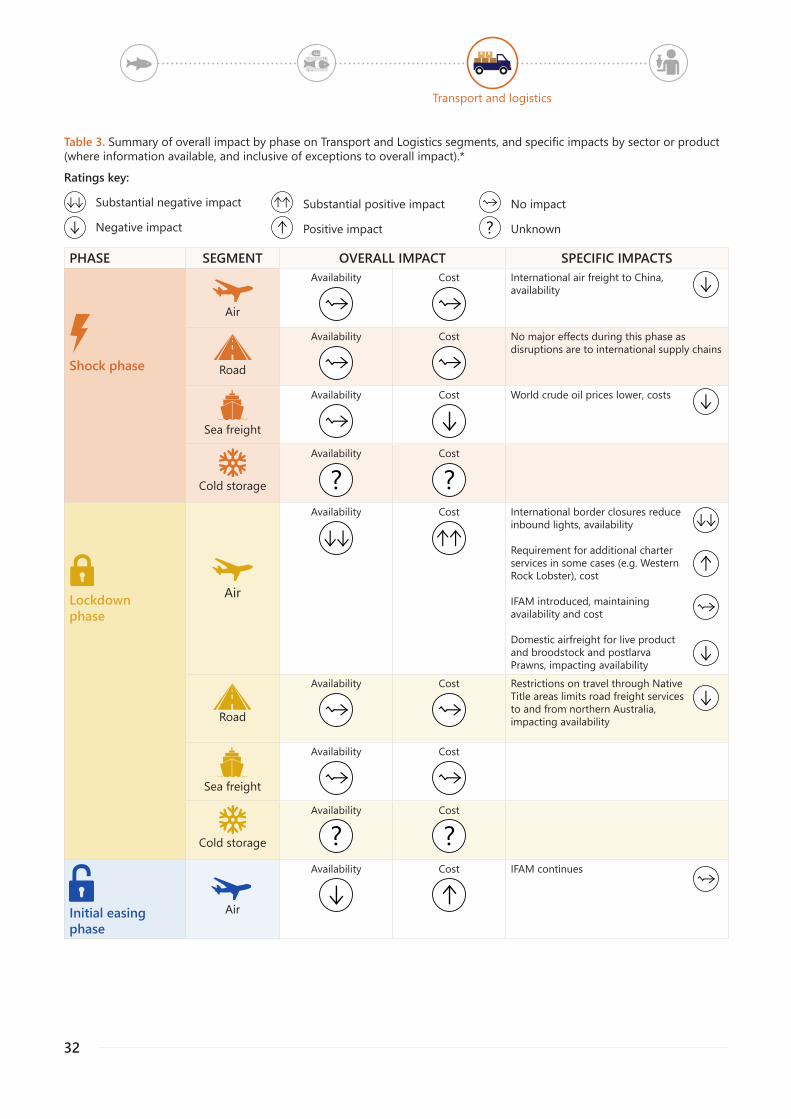
TRANSPORT AND LOGISTICSAlthough Australia’s seafood industry is highly reliant on transport and logistics to link producers, wholesales, final markets and consumers in terms of volumes, it is a minor user. Impacts of COVID-19 on the transport and logistics sectors more broadly was therefore a driver of disruption to the Australian seafood sector through its effects on availability and cost of these services (Table 3).
In the initial shock phase, the transport and logistics sector was impacted through the drop in air freight availability for flights to China due to lockdowns. This impacted inbound tourism numbers from China (Figure 14).
In the lockdown phase, Australia and other countries began to shut their borders, causing a dramatic reduction in inbound tourism and air freight availability into and out of Australia. Costs of airfreight skyrocketed triggering government intervention in the form of the International Freight Assistance Mechanism in April. In this phase, there was also increased pressure on domestic transport and logistics to supply food retail outlets as consumers began to stockpile.
Road and rail freight did see the same levels of reduced activity as other sectors. However, air and road freight to regional Australia was disrupted during this phase, in part because of preventative health measures restricting travel through Native Title areas. This affected seafood producers from northern Australia, who were unable to get deliveries of supplies and transport product back to their main markets in southern and eastern Australia for some of the time. For example, Australian prawn farmers experienced logistics challenges in being able to get deliveries of broodstock and postlarvae from northern Australian hatcheries to their grow-out farms in other areas.
Domestic shipping volumes experienced a slight decrease in the first half of 2020. From February-June 2020, when COVID-19 impacts were most acute, domestic voyage numbers fell by 7% compared with the February-June 2019 period (Freight Australia 2020). Offloading of supplies at Australian ports was also delayed by COVID-19 biosecurity requirements, causing temporary disruption to feed production, vaccine and plastic manufacture and supply to aquaculture producers during this period.
The initial easing phase saw air freight availability increase slightly and sea freight costs start to stabilise.
Over the period, costs and availability of international sea freight was not substantially affected. In initial shock and lockdown phases, there as a global decrease in demand for shipping services since retailers were wary to restock their shelves as the pandemic spread. In response, freight companies reduced ocean shipping capacity to match these falling demands to keep rates stable. Managing capacity to meet demand and keep freight rates constant continued into the initial easing phase. Changes in costs of services were also affected by falling crude oil prices which likely counteracted somecost increases due to COVID-19.
Cold store capacity and costs of services have been reported as critical to the capacity of some seafood producers to switch from live to fresh or frozen markets targeting the retail sector. However, no data is available to support this assessment.
Transport and logistics
32
Table 3. Summary of overall impact by phase on Transport and Logistics segments, and specific impacts by sector or product (where information available, and inclusive of exceptions to overall impact).*
Ratings key:
Substantial negative impact
Negative impact
Substantial positive impact
Positive impact
No impact
PHASE SEGMENT OVERALL IMPACT SPECIFIC IMPACTS
Shock phase
Air
Availability Cost International air freight to China,availability
Road
Availability Cost No major effects during this phase as disruptions are to international supply chains
Sea freight
Availability Cost World crude oil prices lower, costs
Cold storage
Availability Cost
Lockdownphase
Air
Availability Cost International border closures reduceinbound lights, availability
Requirement for additional charterservices in some cases (e.g. WesternRock Lobster), cost
IFAM introduced, maintainingavailability and cost
Domestic airfreight for live productand broodstock and postlarvaPrawns, impacting availability
Road
Availability Cost Restrictions on travel through NativeTitle areas limits road freight servicesto and from northern Australia,impacting availability
Sea freight
Availability Cost
Cold storage
Availability Cost
Initial easing phase
Air
Availability Cost IFAM continues
Unknown?
? ?
? ?
Transport and logistics
33
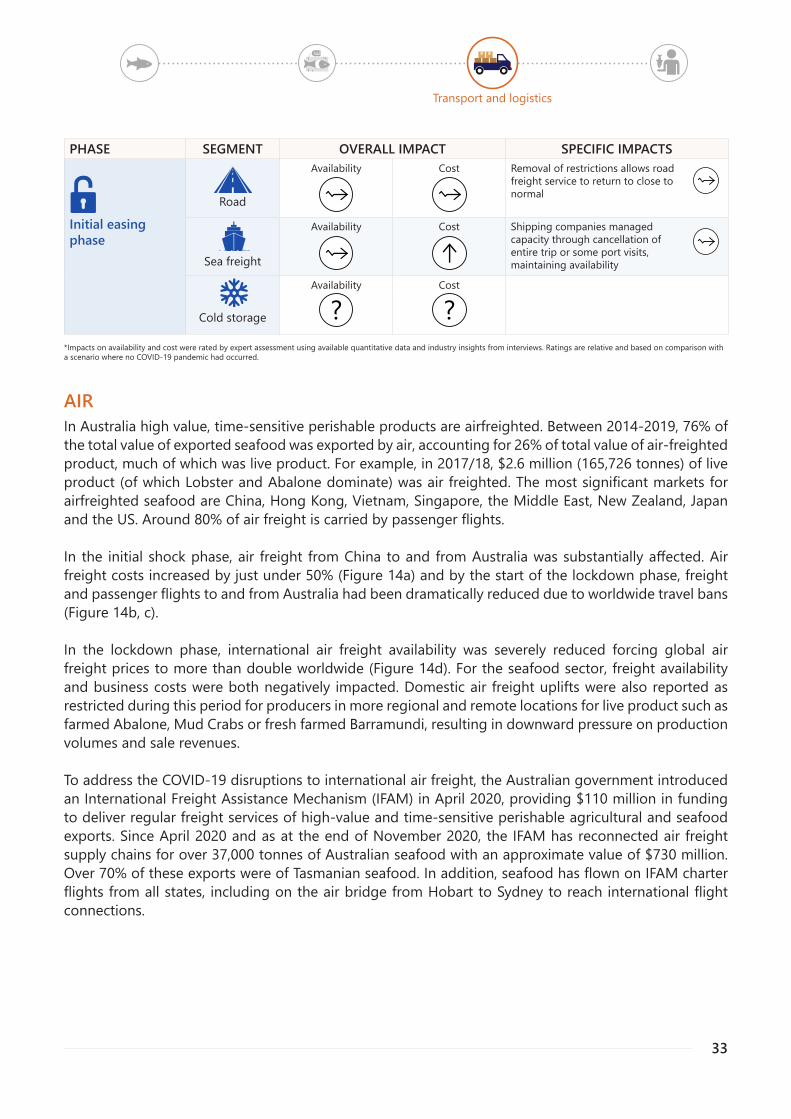
AIRIn Australia high value, time-sensitive perishable products are airfreighted. Between 2014-2019, 76% of the total value of exported seafood was exported by air, accounting for 26% of total value of air-freighted product, much of which was live product. For example, in 2017/18, $2.6 million (165,726 tonnes) of live product (of which Lobster and Abalone dominate) was air freighted. The most significant markets for airfreighted seafood are China, Hong Kong, Vietnam, Singapore, the Middle East, New Zealand, Japan and the US. Around 80% of air freight is carried by passenger flights.
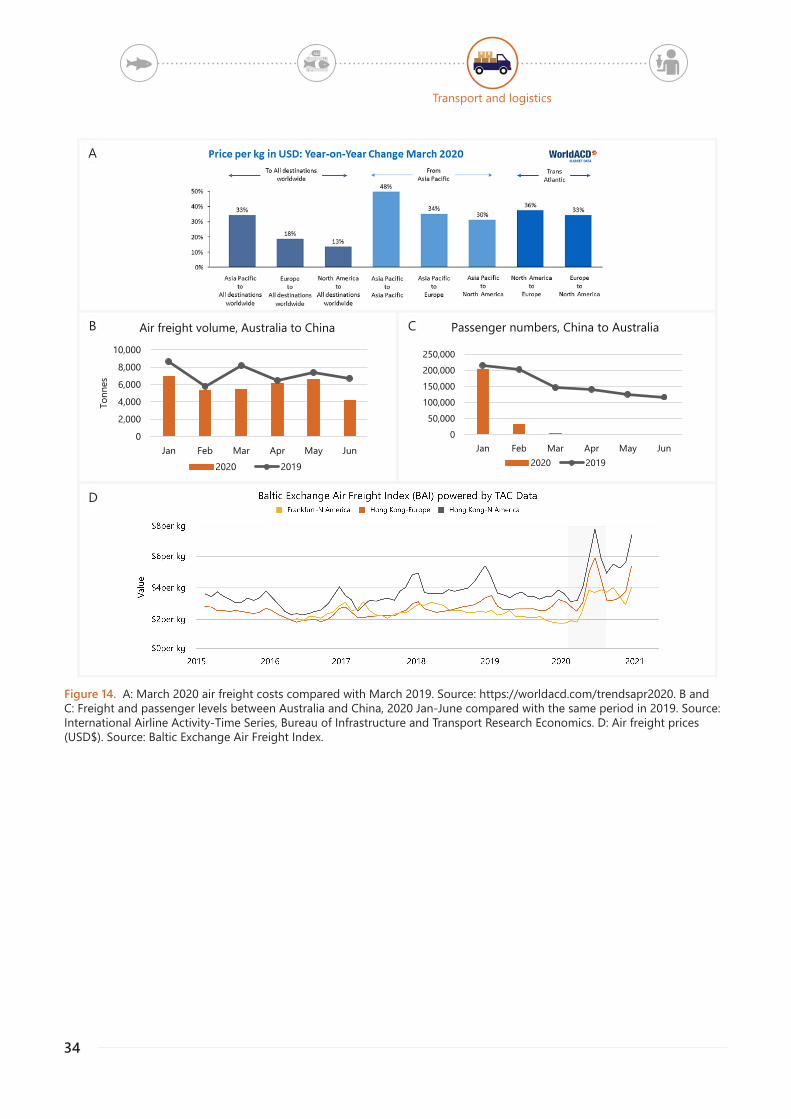
In the initial shock phase, air freight from China to and from Australia was substantially affected. Air freight costs increased by just under 50% (Figure 14a) and by the start of the lockdown phase, freight and passenger flights to and from Australia had been dramatically reduced due to worldwide travel bans (Figure 14b, c).
In the lockdown phase, international air freight availability was severely reduced forcing global air freight prices to more than double worldwide (Figure 14d). For the seafood sector, freight availability and business costs were both negatively impacted. Domestic air freight uplifts were also reported as restricted during this period for producers in more regional and remote locations for live product such as farmed Abalone, Mud Crabs or fresh farmed Barramundi, resulting in downward pressure on production volumes and sale revenues.
To address the COVID-19 disruptions to international air freight, the Australian government introduced an International Freight Assistance Mechanism (IFAM) in April 2020, providing $110 million in funding to deliver regular freight services of high-value and time-sensitive perishable agricultural and seafood exports. Since April 2020 and as at the end of November 2020, the IFAM has reconnected air freight supply chains for over 37,000 tonnes of Australian seafood with an approximate value of $730 million. Over 70% of these exports were of Tasmanian seafood. In addition, seafood has flown on IFAM charter flights from all states, including on the air bridge from Hobart to Sydney to reach international flight connections.
PHASE SEGMENT OVERALL IMPACT SPECIFIC IMPACTS
Initial easing phase
Road
Availability Cost Removal of restrictions allows roadfreight service to return to close tonormal
Sea freight
Availability Cost Shipping companies managedcapacity through cancellation ofentire trip or some port visits,maintaining availability
Cold storage
Availability Cost
? ?*Impacts on availability and cost were rated by expert assessment using available quantitative data and industry insights from interviews. Ratings are relative and based on comparison with a scenario where no COVID-19 pandemic had occurred.
Transport and logistics
34
Figure 14. A: March 2020 air freight costs compared with March 2019. Source: https://worldacd.com/trendsapr2020. B and C: Freight and passenger levels between Australia and China, 2020 Jan-June compared with the same period in 2019. Source: International Airline Activity-Time Series, Bureau of Infrastructure and Transport Research Economics. D: Air freight prices (USD$). Source: Baltic Exchange Air Freight Index.
0
2,000
4,000
6,000
8,000
10,000
Jan Feb Mar Apr May Jun
Tonn
es
Air freight volume, Australia to China
2020 2019
050,000
100,000150,000200,000250,000
Jan Feb Mar Apr May Jun
Passenger numbers, China to Australia
2020 2019
B
D
C
A
Transport and logistics
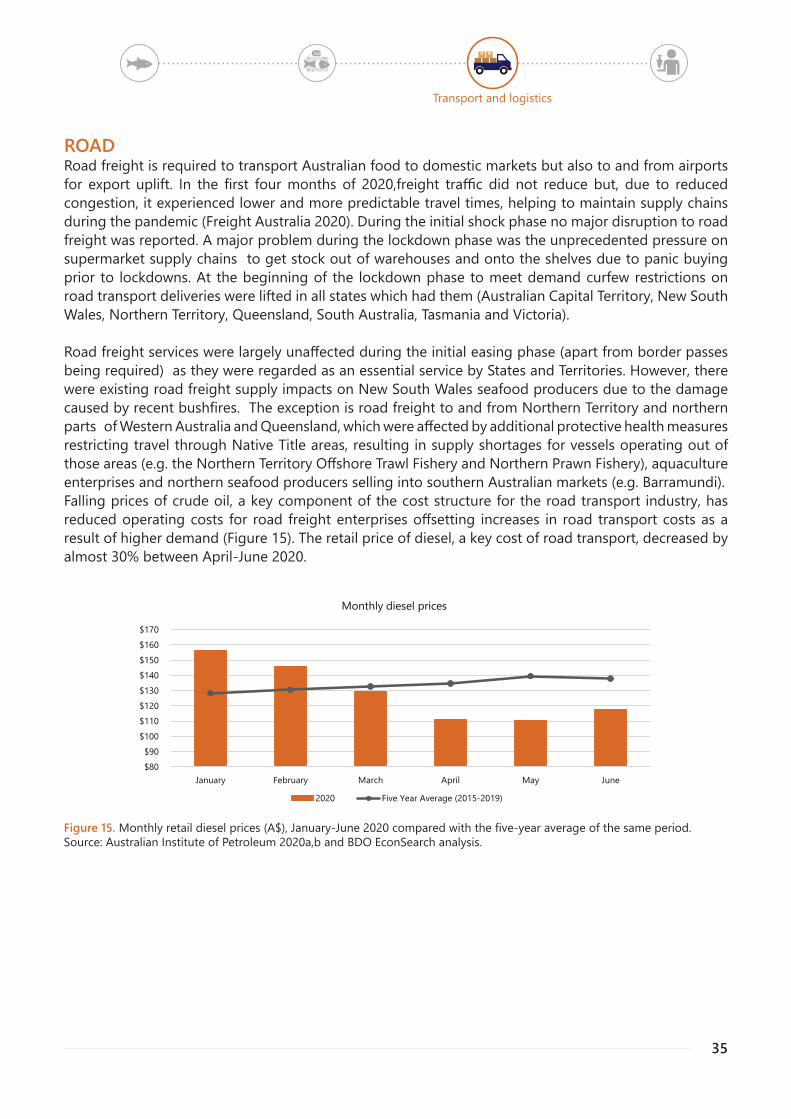
35
ROADRoad freight is required to transport Australian food to domestic markets but also to and from airports for export uplift. In the first four months of 2020,freight traffic did not reduce but, due to reduced congestion, it experienced lower and more predictable travel times, helping to maintain supply chains during the pandemic (Freight Australia 2020). During the initial shock phase no major disruption to road freight was reported. A major problem during the lockdown phase was the unprecedented pressure on supermarket supply chains to get stock out of warehouses and onto the shelves due to panic buying prior to lockdowns. At the beginning of the lockdown phase to meet demand curfew restrictions on road transport deliveries were lifted in all states which had them (Australian Capital Territory, New South Wales, Northern Territory, Queensland, South Australia, Tasmania and Victoria).
Road freight services were largely unaffected during the initial easing phase (apart from border passes being required) as they were regarded as an essential service by States and Territories. However, there were existing road freight supply impacts on New South Wales seafood producers due to the damage caused by recent bushfires. The exception is road freight to and from Northern Territory and northern parts of Western Australia and Queensland, which were affected by additional protective health measures restricting travel through Native Title areas, resulting in supply shortages for vessels operating out of those areas (e.g. the Northern Territory Offshore Trawl Fishery and Northern Prawn Fishery), aquaculture enterprises and northern seafood producers selling into southern Australian markets (e.g. Barramundi).Falling prices of crude oil, a key component of the cost structure for the road transport industry, has reduced operating costs for road freight enterprises offsetting increases in road transport costs as a result of higher demand (Figure 15). The retail price of diesel, a key cost of road transport, decreased by almost 30% between April-June 2020.
$80 $90
$100 $110 $120 $130 $140 $150 $160 $170
January February March April May June
Monthly diesel prices
2020 Five Year Average (2015-2019)
Figure 15. Monthly retail diesel prices (A$), January-June 2020 compared with the five-year average of the same period. Source: Australian Institute of Petroleum 2020a,b and BDO EconSearch analysis.
Transport and logistics
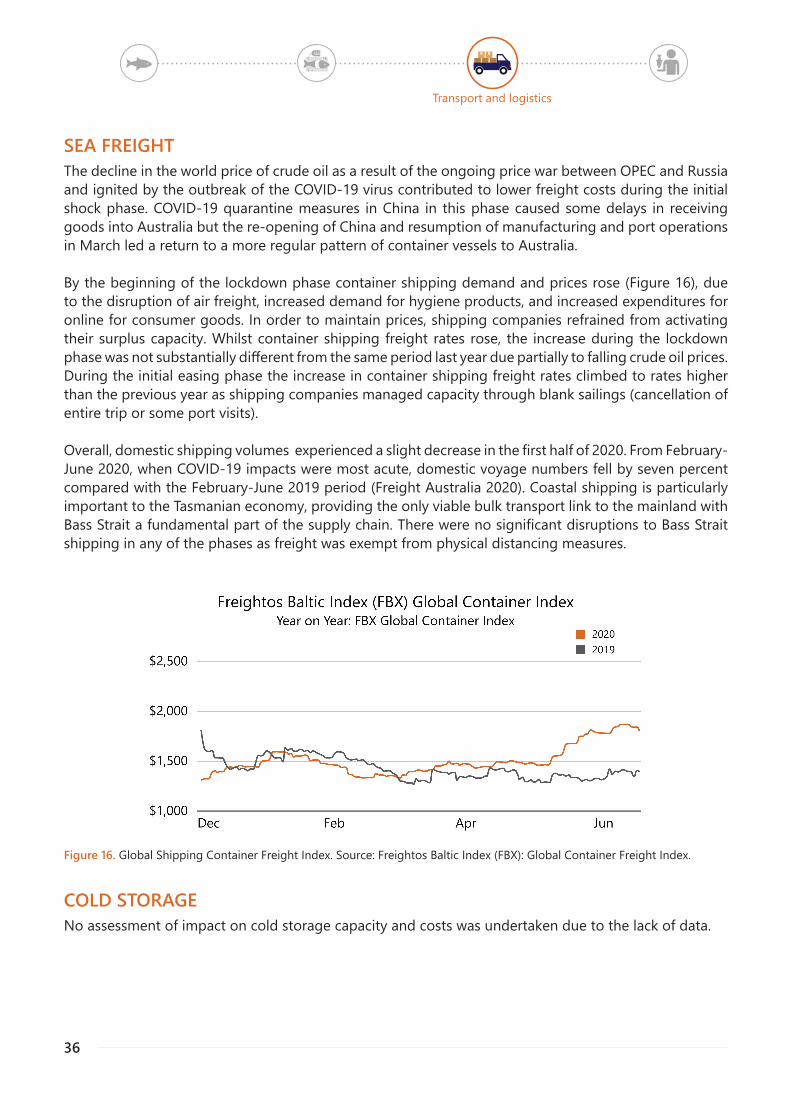
36
SEA FREIGHTThe decline in the world price of crude oil as a result of the ongoing price war between OPEC and Russia and ignited by the outbreak of the COVID-19 virus contributed to lower freight costs during the initial shock phase. COVID-19 quarantine measures in China in this phase caused some delays in receiving goods into Australia but the re-opening of China and resumption of manufacturing and port operations in March led a return to a more regular pattern of container vessels to Australia.
By the beginning of the lockdown phase container shipping demand and prices rose (Figure 16), due to the disruption of air freight, increased demand for hygiene products, and increased expenditures for online for consumer goods. In order to maintain prices, shipping companies refrained from activating their surplus capacity. Whilst container shipping freight rates rose, the increase during the lockdown phase was not substantially different from the same period last year due partially to falling crude oil prices. During the initial easing phase the increase in container shipping freight rates climbed to rates higher than the previous year as shipping companies managed capacity through blank sailings (cancellation of entire trip or some port visits).
Overall, domestic shipping volumes experienced a slight decrease in the first half of 2020. From February-June 2020, when COVID-19 impacts were most acute, domestic voyage numbers fell by seven percent compared with the February-June 2019 period (Freight Australia 2020). Coastal shipping is particularly important to the Tasmanian economy, providing the only viable bulk transport link to the mainland with Bass Strait a fundamental part of the supply chain. There were no significant disruptions to Bass Strait shipping in any of the phases as freight was exempt from physical distancing measures.
Figure 16. Global Shipping Container Freight Index. Source: Freightos Baltic Index (FBX): Global Container Freight Index.
COLD STORAGENo assessment of impact on cold storage capacity and costs was undertaken due to the lack of data.
Transport and logistics
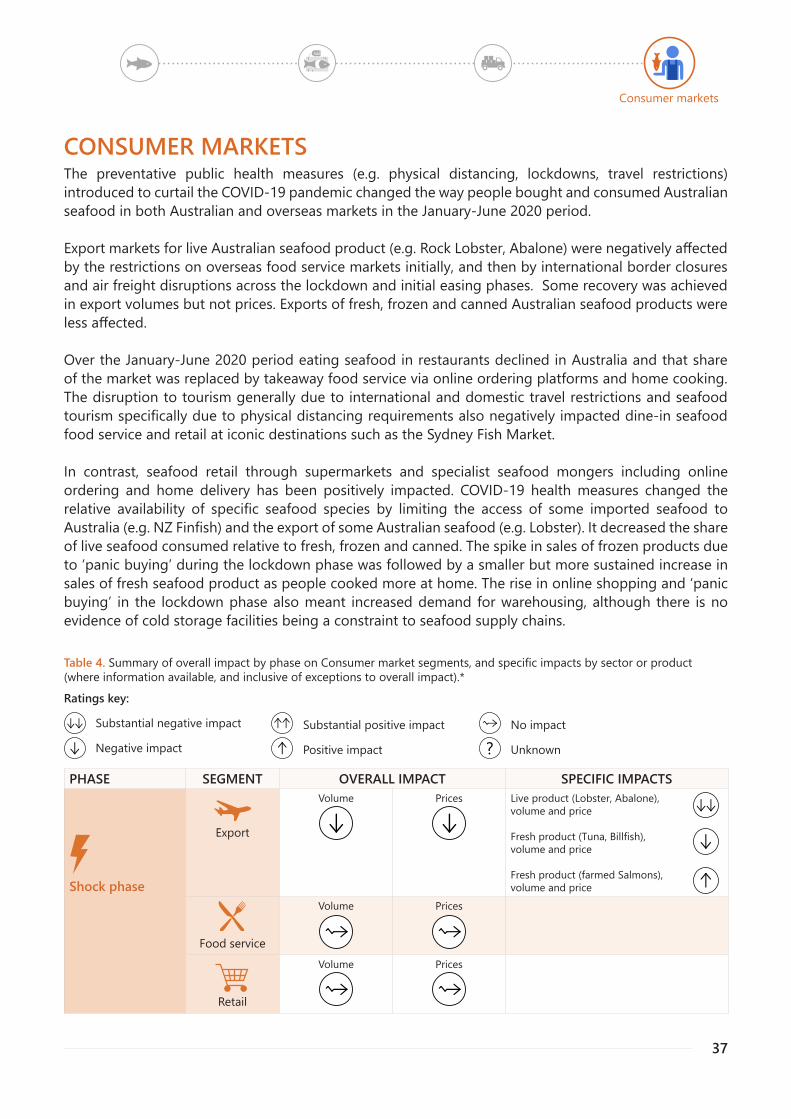
37
CONSUMER MARKETSThe preventative public health measures (e.g. physical distancing, lockdowns, travel restrictions) introduced to curtail the COVID-19 pandemic changed the way people bought and consumed Australian seafood in both Australian and overseas markets in the January-June 2020 period.
Export markets for live Australian seafood product (e.g. Rock Lobster, Abalone) were negatively affected by the restrictions on overseas food service markets initially, and then by international border closures and air freight disruptions across the lockdown and initial easing phases. Some recovery was achieved in export volumes but not prices. Exports of fresh, frozen and canned Australian seafood products were less affected.
Over the January-June 2020 period eating seafood in restaurants declined in Australia and that share of the market was replaced by takeaway food service via online ordering platforms and home cooking. The disruption to tourism generally due to international and domestic travel restrictions and seafood tourism specifically due to physical distancing requirements also negatively impacted dine-in seafood food service and retail at iconic destinations such as the Sydney Fish Market.
In contrast, seafood retail through supermarkets and specialist seafood mongers including online ordering and home delivery has been positively impacted. COVID-19 health measures changed the relative availability of specific seafood species by limiting the access of some imported seafood to Australia (e.g. NZ Finfish) and the export of some Australian seafood (e.g. Lobster). It decreased the share of live seafood consumed relative to fresh, frozen and canned. The spike in sales of frozen products due to ‘panic buying’ during the lockdown phase was followed by a smaller but more sustained increase in sales of fresh seafood product as people cooked more at home. The rise in online shopping and ‘panic buying’ in the lockdown phase also meant increased demand for warehousing, although there is no evidence of cold storage facilities being a constraint to seafood supply chains.
Consumer markets
Table 4. Summary of overall impact by phase on Consumer market segments, and specific impacts by sector or product (where information available, and inclusive of exceptions to overall impact).*
Ratings key:
Substantial negative impact
Negative impact
Substantial positive impact
Positive impact
No impact
PHASE SEGMENT OVERALL IMPACT SPECIFIC IMPACTS
Shock phase
Export
Volume Prices Live product (Lobster, Abalone),volume and price
Fresh product (Tuna, Billfish),volume and price
Fresh product (farmed Salmons),volume and price
Food service
Volume Prices
Retail
Volume Prices
Unknown?
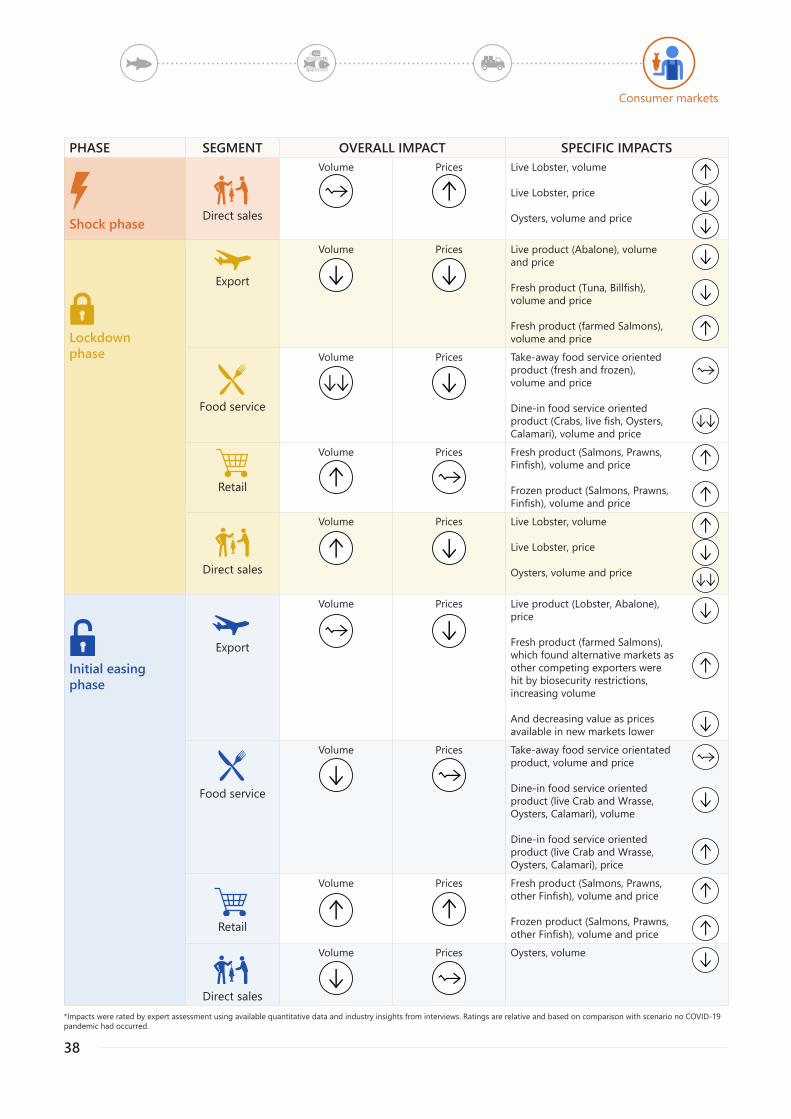
38
PHASE SEGMENT OVERALL IMPACT SPECIFIC IMPACTS
Shock phase Direct sales
Volume Prices Live Lobster, volume
Live Lobster, price
Oysters, volume and price
Lockdownphase
Export
Volume Prices Live product (Abalone), volumeand price
Fresh product (Tuna, Billfish),volume and price
Fresh product (farmed Salmons),volume and price
Food service
Volume Prices Take-away food service orientedproduct (fresh and frozen),volume and price
Dine-in food service orientedproduct (Crabs, live fish, Oysters,Calamari), volume and price
Retail
Volume Prices Fresh product (Salmons, Prawns,Finfish), volume and price
Frozen product (Salmons, Prawns,Finfish), volume and price
Direct sales
Volume Prices Live Lobster, volume
Live Lobster, price
Oysters, volume and price
Initial easing phase
Export
Volume Prices Live product (Lobster, Abalone),price
Fresh product (farmed Salmons),which found alternative markets asother competing exporters werehit by biosecurity restrictions,increasing volume
And decreasing value as pricesavailable in new markets lower
Food service
Volume Prices Take-away food service orientatedproduct, volume and price
Dine-in food service orientedproduct (live Crab and Wrasse,Oysters, Calamari), volume
Dine-in food service orientedproduct (live Crab and Wrasse,Oysters, Calamari), price
Retail
Volume Prices Fresh product (Salmons, Prawns,other Finfish), volume and price
Frozen product (Salmons, Prawns,other Finfish), volume and price
Direct sales
Volume Prices Oysters, volume
Consumer markets
*Impacts were rated by expert assessment using available quantitative data and industry insights from interviews. Ratings are relative and based on comparison with scenario no COVID-19 pandemic had occurred.
39
EXPORTSThis market was impacted by COVID-19 health restrictions in the initial shock phase affecting demandthrough food service in market destinations (e.g. Chinese Lunar celebrations in Wuhan Province in late January). This caused a drop in both volumes uplifted and the price of exported seafood, particularly of live and fresh Australian seafood product, which makes up 55% of Australia’s total exports by volume, based on the average of the last five years (Figure 17).
In the lockdown phase international border closures and lockdowns introduced to slow the spread of COVID-19 caused decline in international passenger numbers and flights limiting air freight capacity to allow product to reach all export markets. However, later in the lockdown phase the Australian Government’s IFAM assisted in the resumption of international outbound flights from Australia to re- establish global supply chains. This saw an improvement in levels of export of Australian Rock Lobster and Abalone, as well as of farmed Salmons.
Throughout the initial easing phase Australian seafood exporters were able to resume closer to typicallevels of export although prices remained lower than the five-year average for the same period.
Across the initial shock and lockdown impact phases volumes and prices of exported mollusc species (e.g. Abalone) and crustacean species (e.g. Prawns, Rock Lobster) declined however both volumes and prices of exported Australian Finfish species (e.g. Tuna, farmed Salmons) increased (Figure 17). The early increase in export volumes and total value of export sales of farmed Salmons was sustained across the January-June 2020 period. This increase may be explained by factors other than COVID-19, such as the development of alternative export markets at lower prices by building on market strategies implemented prior to COVID-19. The negative impact on mollusc and crustacean species reflects the exposure of these products to declines in dine-in food service in export market destinations due to COVID-19 health protection measures.
Across January-June 2020 the value of mollusc and crustacea exports was 46% and 43% lower respectively than the average of the last five years for the same period respectively (Figure 17).
Consumer markets
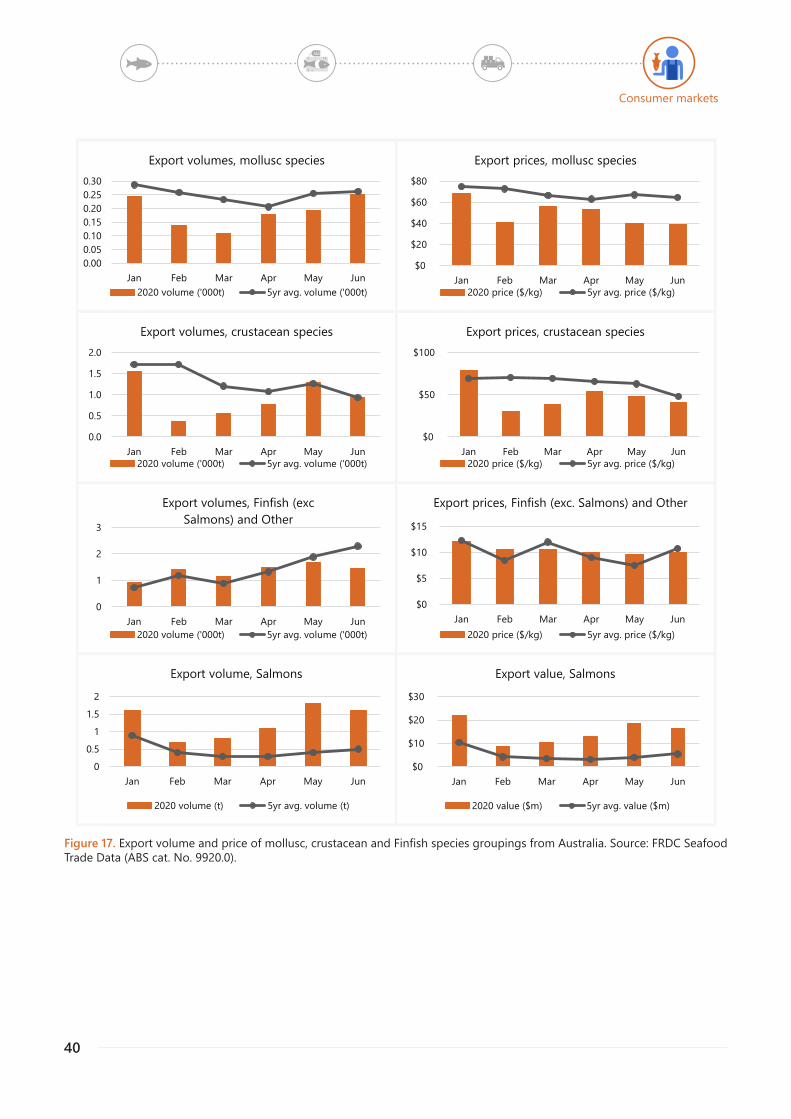
40
Figure 17. Export volume and price of mollusc, crustacean and Finfish species groupings from Australia. Source: FRDC Seafood Trade Data (ABS cat. No. 9920.0).
0.0
0.5
1.0
1.5
2.0
Jan Feb Mar Apr May Jun
Export volumes, crustacean species
2020 volume ('000t) 5yr avg. volume ('000t)
$0
$50
$100
Jan Feb Mar Apr May Jun
Export prices, crustacean species
2020 price ($/kg) 5yr avg. price ($/kg)
0
1
2
3
Jan Feb Mar Apr May Jun
Export volumes, Finfish (exc Salmons) and Other
2020 volume ('000t) 5yr avg. volume ('000t)
$0
$5
$10
$15
Jan Feb Mar Apr May Jun
Export prices, Finfish (exc. Salmons) and Other
2020 price ($/kg) 5yr avg. price ($/kg)
0.000.050.100.150.200.250.30
Jan Feb Mar Apr May Jun
Export volumes, mollusc species
2020 volume ('000t) 5yr avg. volume ('000t)
$0
$20
$40
$60
$80
Jan Feb Mar Apr May Jun
Export prices, mollusc species
2020 price ($/kg) 5yr avg. price ($/kg)
Consumer markets
00.5
11.5
2
Jan Feb Mar Apr May Jun
Export volume, Salmons
2020 volume (t) 5yr avg. volume (t)
$0
$10
$20
$30
Jan Feb Mar Apr May Jun
Export value, Salmons
2020 value ($m) 5yr avg. value ($m)
41
FOOD SERVICEThe food service sector includes dine-in restaurants, cafes and takeaway, food home delivery sectors and institutional food service such as hospitals, aged care homes and prisons. In the shock phase the COVID-19 outbreak and preventative health measures dampened China’s dine-in food service sector and therefore demand for Australian live exported seafood. During this phase there were no noticeable effects on Australia’s dine-in or takeaway food service sectors.
During the lockdown phase Australia’s dine-in food service sector was severely impacted as preventative health measures restricted restaurant operations and access to restaurant precincts (Figure 18a), as well as the number of tourists as a major client group. Turnover for cafes, restaurants and catering services was strongly down for the whole lockdown phase, especially April. This had a negative effect on demand for Australian live seafood specifically, such as wrasse, mud and giant crab, which are primarily sold in Asian-food restaurants in Melbourne and Sydney’s Chinatown. It had a negative impact more broadly on non-auction sale volumes through the Sydney Fish Markets (see Wholesale section), as well as on other species sold primarily through dine-in food service outlets (e.g. Oysters, Calamari).
In contrast, turnover for takeaway food services was down a little in April 2020, but otherwise relatively normal (Figure 18b). There is no evidence that seafood takeaway eat-at-home food services were particularly negatively affected over and above these trends for takeaway food services, as illustrated by the rise in Google searches for ‘Fish and Chips’ within Australia (Figure 18c). However, some Fish and Chips shop operators describe a range of supply chain effects, including costs of meeting COVID-19 safe measures, which caused them to shut down for a period during the peak of the lockdown phase (see Fish and Chips case study, p. 56).
The initial easing phase saw some recovery of the proportion of meals eaten out of home and the average spend per meal (Figure 18d, e). Turnover for cafes, restaurants and catering services was down for the initial easing period, especially in May, but recovering. Demand for takeaway eat-at-home food services stabilised at normal levels across this phase, as indicated by monthly turnover levels.
No data is available for institutional markets for Australian seafood including the aged care and other public service provider sectors (e.g. hospitals, prisons, defense forces) but they are unlikely to have been affected as they were deemed essential services in many cases.
Australia’s fish and chip businesses reported normal to higher than normal takeaway sales through the initial easing phase (see Fish and Chips case study, p. 56).
Consumer markets
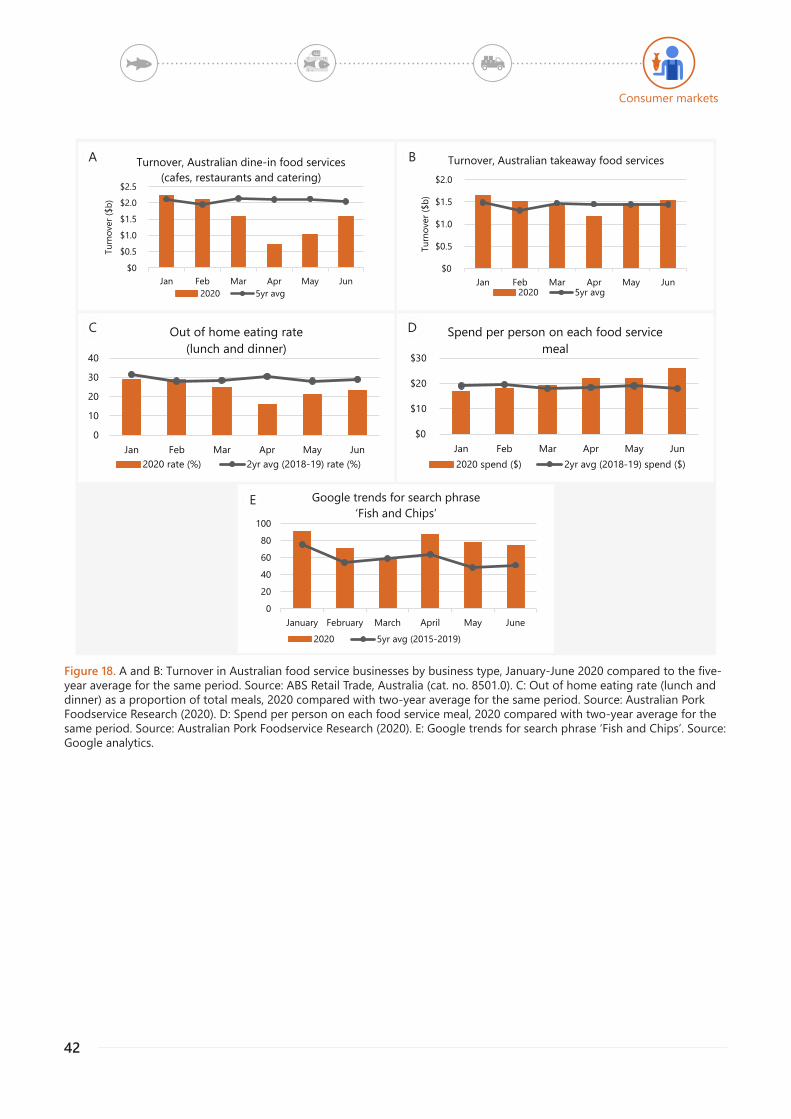
42
Figure 18. A and B: Turnover in Australian food service businesses by business type, January-June 2020 compared to the five-year average for the same period. Source: ABS Retail Trade, Australia (cat. no. 8501.0). C: Out of home eating rate (lunch and dinner) as a proportion of total meals, 2020 compared with two-year average for the same period. Source: Australian Pork Foodservice Research (2020). D: Spend per person on each food service meal, 2020 compared with two-year average for the same period. Source: Australian Pork Foodservice Research (2020). E: Google trends for search phrase ‘Fish and Chips’. Source: Google analytics.
0
10
20
30
40
Jan Feb Mar Apr May Jun
Out of home eating rate (lunch and dinner)
2020 rate (%) 2yr avg (2018-19) rate (%)
$0
$10
$20
$30
Jan Feb Mar Apr May Jun
Spend per person on each food service meal
2020 spend ($) 2yr avg (2018-19) spend ($)
0
20
40
60
80
100
January February March April May June
Google trends for search phrase‘Fish and Chips’
2020 5yr avg (2015-2019)
$0
$0.5
$1.0
$1.5
$2.0
$2.5
Jan Feb Mar Apr May Jun
Turn
over
($b)
Turnover, Australian dine-in food services (cafes, restaurants and catering)
2020 5yr avg
$0
$0.5
$1.0
$1.5
$2.0
Jan Feb Mar Apr May Jun
Turn
over
($b)
Turnover, Australian takeaway food services
2020 5yr avg
A B
C D
E
Consumer markets
43
RETAILThe Australian retail market for seafood was positively impacted by the COVID-19 pandemic and associated disruptions. COVID-19 health measures and restrictions which limited food service, saw Australian consumers shift their purchasing behaviour towards home-cooking The volume of retail sales of seafood, both fresh and frozen, increased in the lockdown phase when the first national physical distancing restrictions were announced and implemented (Figure 19a). The total level of sales at this time was similar to the Christmas periods in 2018 and 2019 (typically peak periods for seafood sales). However, unlike the Christmas period, it was frozen seafood that drove the increase in seafood sales during the COVID-19 panic buying period (Figure 19a). Frozen seafood was preferred over fresh but once frozen product had sold out, customers bought fresh, particularly farmed Tasmanian Salmons. COVID-19 also expedited online sales with pre-packaged fresh and frozen products most suited to online. Sales increased for large supermarket chains, independent grocers and fishmongers. During the lockdown and initial easing periods, volume of sales of Salmons, Prawns and other species increased in particular, as did farmed Barramundi but only in the initial easing period.
Whilst the sales of frozen seafood returned to normal levels during the latter part of the lockdown phase, the volume of fresh seafood sales remained above average. This could have been in response to an increase in the availability of Australian fresh seafood product on the domestic market and an increase in consumers cooking at home as suggested by the sharp increase in Google searches for ‘fish recipe’ in April 2020 (Figure 19b). This supports anecdotal evidence from large retailers who identified an expansion of the “entertainment buyers” market where customers were increasing their purchases of higher value products as they were unable to eat in restaurants e.g. Lobster tails, half shell Scallops.
Moreover, these retail trends were also observed for other fresh or frozen protein sources across January-June 2020. Demand was close to normal in the initial shock phase, peaked strongly in the first part of the lockdown phase, dipped to approximately normal in the later part then increased to moderately above normal again in the initial easing phase. This pattern was particularly strong for seafood with the peaks and dips being of greater magnitude than most other protein sources including meat, dairy, eggs, and fruit, vegetables and nuts (Figure 19c). The late March/early April peak for seafood can be attributed to Easter.
The switch from a seafood food service focus to a retail focus resulted in some additional costs for these businesses, due to closer inventory management, higher bad debt recovery, and staff retraining.
Consumer markets
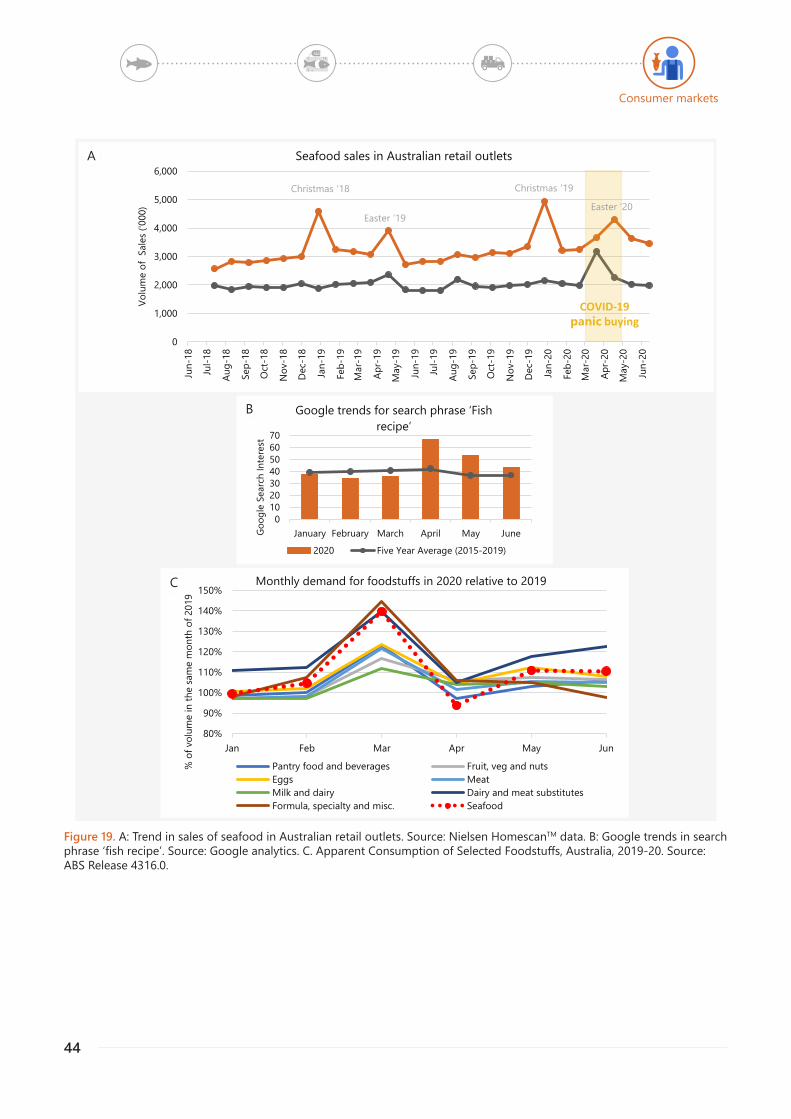
44
Figure 19. A: Trend in sales of seafood in Australian retail outlets. Source: Nielsen HomescanTM data. B: Google trends in search phrase ‘fish recipe’. Source: Google analytics. C. Apparent Consumption of Selected Foodstuffs, Australia, 2019-20. Source: ABS Release 4316.0.
0
1,000
2,000
3,000
4,000
5,000
6,000Ju
n-18
Jul-1
8
Aug-
18
Sep-
18
Oct
-18
Nov
-18
Dec
-18
Jan-
19
Feb-
19
Mar
-19
Apr-
19
May
-19
Jun-
19
Jul-1
9
Aug-
19
Sep-
19
Oct
-19
Nov
-19
Dec
-19
Jan-
20
Feb-
20
Mar
-20
Apr-
20
May
-20
Jun-
20
Volu
me
of S
ales
('00
0)Seafood sales in Australian retail outlets
Fresh Seafood Frozen Seafood
Christmas '18 Christmas '19
COVID-19panic buying
Easter ‘19Easter ‘20
010203040506070
January February March April May JuneGoog
le S
earc
h In
tere
st
Google trends for search phrase ‘Fish recipe’
2020 Five Year Average (2015-2019)
80%
90%
100%
110%
120%
130%
140%
150%
Jan Feb Mar Apr May Jun
% o
f vol
ume
in th
e sa
me
mon
th o
f 201
9
Monthly demand for foodstuffs in 2020 relative to 2019
Pantry food and beverages Fruit, veg and nutsEggs MeatMilk and dairy Dairy and meat substitutesFormula, specialty and misc. Seafood
B
A
C
Consumer markets
45
DIRECT SALESDirect sales by Australian seafood producers to final consumers represent a small portion of total sales by volume of Australian seafood. This market was affected by the disruption to export and competing import markets for live Australian seafood and by COVID-19 preventative health measures introduced in Australia which had the effect of curtailing regional tourism and visitation and thereby seafood tourism in these areas.
Farm gate sales of products such as fresh Oysters were affected by the drop in inbound international tourism during the latter part of the shock phase. The decline in direct sales decreased more dramatically during the lockdown phase as restrictions on domestic travel reduced tourism visitation levels to regional areas while physical distancing restrictions limited the operations of farm gate retail outlets. This resulted in farm gate outlets shutting and staff lay-offs, particularly in Tasmania and South Australia, and strongly impacted revenue as farm gate prices are typically higher than wholesale. In South Australia and Tasmania, sales of Oysters and Finfish species by producers via home delivery or fishing ports close to metro areas increased during the lockdown phase and continued into the initial easing phase.
In the shock phase direct or ‘back of the boat’ sales of Rock Lobster in Tasmania (and in Western Australia) increased as producers were no longer able to sell the normal volumes into export markets in China. This trend continued across the lockdown and initial easing phases as the price of product into these export markets remained low even when resumed. In a survey of Tasmanians about food access and supply, 22% reported buying Rock Lobsters directly from fishers during the COVID-19 lockdown period (UTAS 2020).
A decline in volumes sold directly to consumers was reported by 47% of those seafood producers responding to the Fisheries Research and Development Corporation (FRDC) Stakeholder Survey (2020b), while 38% reported no change and 21% reported an increase in volumes.
Consumer markets
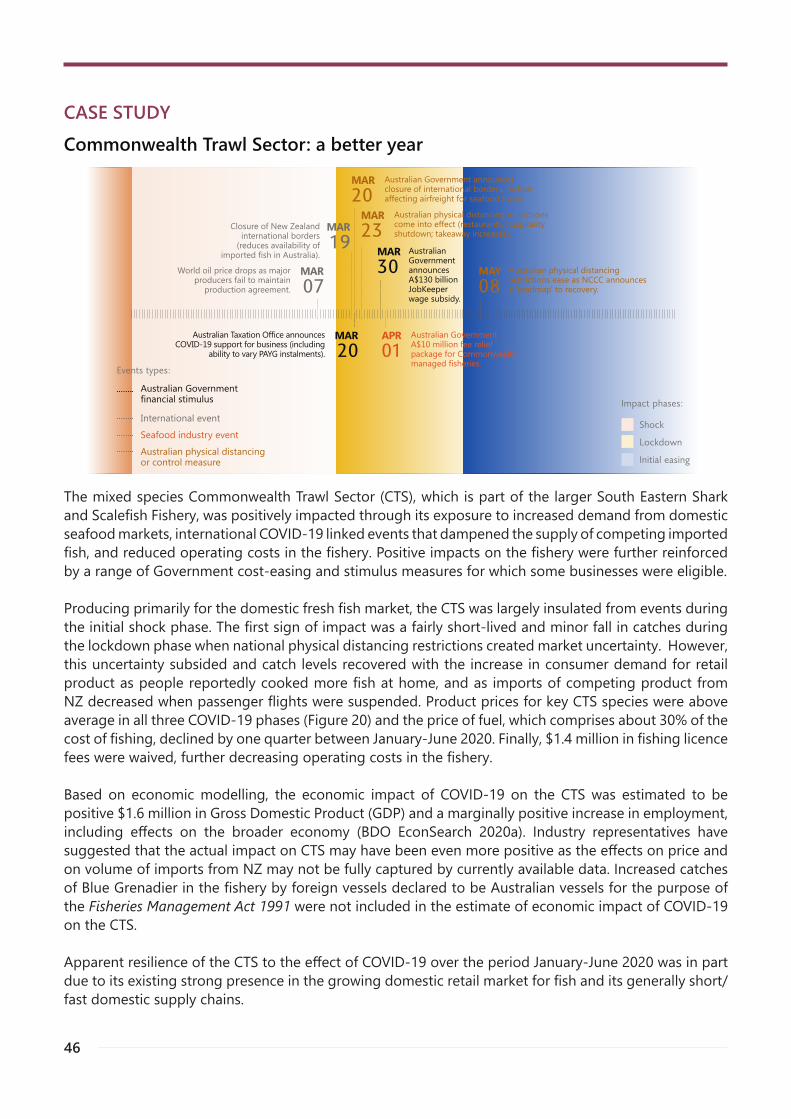
46
CASE STUDYCommonwealth Trawl Sector: a better year
Shock
Lockdown
Initial easing
Impact phases:
MAR20
Australian Government announces closure of international borders, further affecting airfreight for seafood trade.
MAR23
Australian physical distancing restrictions come into effect (restaurants, hospitality shutdown; takeaway increases).
MAR30
Australian Government announces A$130 billion JobKeeper wage subsidy.
APR01
Australian Government A$10 million fee relief package for Commonwealth managed fisheries.
MAY08
Australian physical distancing restrictions ease as NCCC announces a ‘roadmap’ to recovery.
World oil price drops as major producers fail to maintain
production agreement.
MAR07
Closure of New Zealand international borders
(reduces availability of imported fish in Australia).
MAR1 9
Australian Taxation Office announces COVID-19 support for business (including
ability to vary PAYG instalments).
MAR20
Australian Government financial stimulus
International event Seafood industry event Australian physical distancing
or control measure
Events types:
The mixed species Commonwealth Trawl Sector (CTS), which is part of the larger South Eastern Shark and Scalefish Fishery, was positively impacted through its exposure to increased demand from domestic seafood markets, international COVID-19 linked events that dampened the supply of competing imported fish, and reduced operating costs in the fishery. Positive impacts on the fishery were further reinforced by a range of Government cost-easing and stimulus measures for which some businesses were eligible.
Producing primarily for the domestic fresh fish market, the CTS was largely insulated from events during the initial shock phase. The first sign of impact was a fairly short-lived and minor fall in catches during the lockdown phase when national physical distancing restrictions created market uncertainty. However, this uncertainty subsided and catch levels recovered with the increase in consumer demand for retail product as people reportedly cooked more fish at home, and as imports of competing product from NZ decreased when passenger flights were suspended. Product prices for key CTS species were above average in all three COVID-19 phases (Figure 20) and the price of fuel, which comprises about 30% of the cost of fishing, declined by one quarter between January-June 2020. Finally, $1.4 million in fishing licence fees were waived, further decreasing operating costs in the fishery.
Based on economic modelling, the economic impact of COVID-19 on the CTS was estimated to be positive $1.6 million in Gross Domestic Product (GDP) and a marginally positive increase in employment, including effects on the broader economy (BDO EconSearch 2020a). Industry representatives have suggested that the actual impact on CTS may have been even more positive as the effects on price and on volume of imports from NZ may not be fully captured by currently available data. Increased catches of Blue Grenadier in the fishery by foreign vessels declared to be Australian vessels for the purpose of the Fisheries Management Act 1991 were not included in the estimate of economic impact of COVID-19 on the CTS.
Apparent resilience of the CTS to the effect of COVID-19 over the period January-June 2020 was in part due to its existing strong presence in the growing domestic retail market for fish and its generally short/fast domestic supply chains.
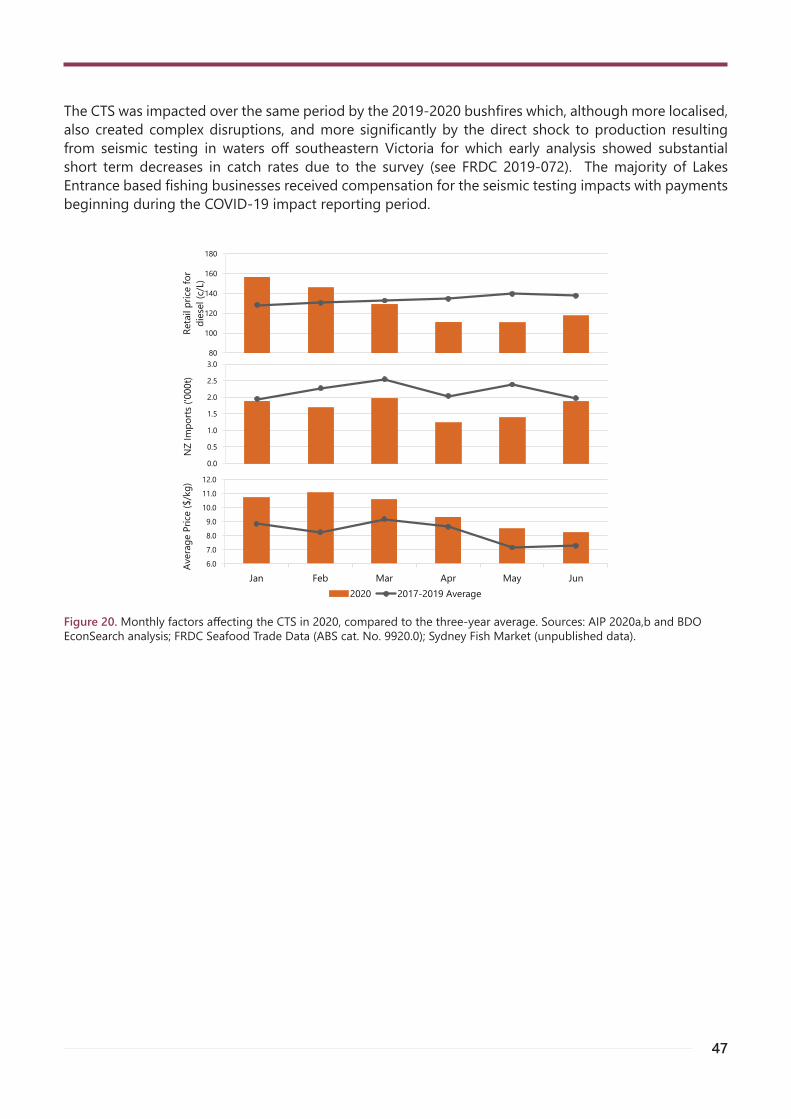
47
Figure 20. Monthly factors affecting the CTS in 2020, compared to the three-year average. Sources: AIP 2020a,b and BDO EconSearch analysis; FRDC Seafood Trade Data (ABS cat. No. 9920.0); Sydney Fish Market (unpublished data).
The CTS was impacted over the same period by the 2019-2020 bushfires which, although more localised, also created complex disruptions, and more significantly by the direct shock to production resulting from seismic testing in waters off southeastern Victoria for which early analysis showed substantial short term decreases in catch rates due to the survey (see FRDC 2019-072). The majority of Lakes Entrance based fishing businesses received compensation for the seismic testing impacts with payments beginning during the COVID-19 impact reporting period.
6.07.08.09.0
10.011.012.0
Jan Feb Mar Apr May Jun
Aver
age
Price
($/k
g)
2020 2017-2019 Average
0.0
0.5
1.0
1.5
2.0
2.5
3.0
NZ
Impo
rts ('
000t
)
80
100
120
140
160
180
Reta
il pr
ice fo
r di
esel
(c/L
)
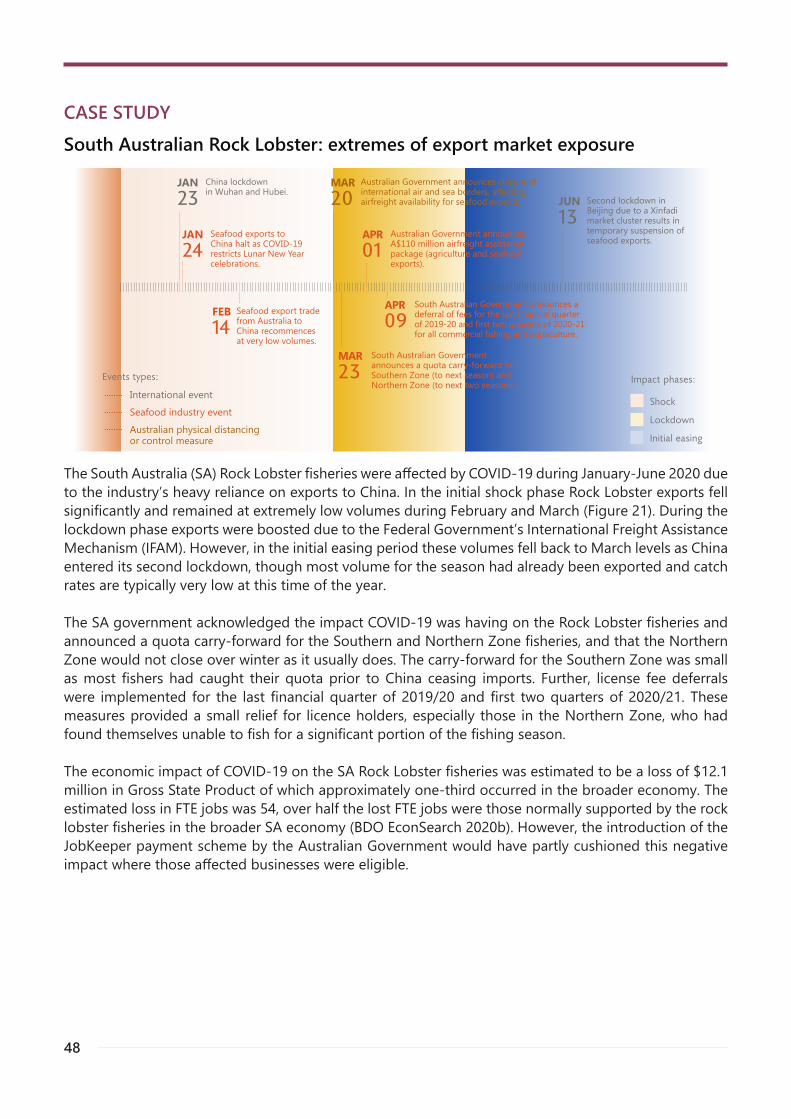
48
Shock
Lockdown
Initial easing
Impact phases:
JAN23
China lockdown in Wuhan and Hubei.
JAN24
Seafood exports to China halt as COVID-19 restricts Lunar New Year celebrations.
FEB14
Seafood export trade from Australia to China recommences at very low volumes.
MAR20
Australian Government announces closure of international air and sea borders, affecting airfreight availability for seafood exports.
MAR23
South Australian Government announces a quota carry-forward for Southern Zone (to next season) and Northern Zone (to next two seasons).
APR01
Australian Government announces A$110 million airfreight assistance package (agriculture and seafood exports).
APR09
South Australian Government announces a deferral of fees for the last financial quarter of 2019-20 and first two quarters of 2020-21 for all commercial fishing and aquaculture.
JUN13
Second lockdown in Beijing due to a Xinfadi market cluster results in temporary suspension of seafood exports.
International event Seafood industry event Australian physical distancing
or control measure
Events types:
The South Australia (SA) Rock Lobster fisheries were affected by COVID-19 during January-June 2020 due to the industry’s heavy reliance on exports to China. In the initial shock phase Rock Lobster exports fell significantly and remained at extremely low volumes during February and March (Figure 21). During the lockdown phase exports were boosted due to the Federal Government’s International Freight Assistance Mechanism (IFAM). However, in the initial easing period these volumes fell back to March levels as China entered its second lockdown, though most volume for the season had already been exported and catch rates are typically very low at this time of the year.
The SA government acknowledged the impact COVID-19 was having on the Rock Lobster fisheries and announced a quota carry-forward for the Southern and Northern Zone fisheries, and that the Northern Zone would not close over winter as it usually does. The carry-forward for the Southern Zone was small as most fishers had caught their quota prior to China ceasing imports. Further, license fee deferrals were implemented for the last financial quarter of 2019/20 and first two quarters of 2020/21. These measures provided a small relief for licence holders, especially those in the Northern Zone, who had found themselves unable to fish for a significant portion of the fishing season.
The economic impact of COVID-19 on the SA Rock Lobster fisheries was estimated to be a loss of $12.1 million in Gross State Product of which approximately one-third occurred in the broader economy. The estimated loss in FTE jobs was 54, over half the lost FTE jobs were those normally supported by the rock lobster fisheries in the broader SA economy (BDO EconSearch 2020b). However, the introduction of the JobKeeper payment scheme by the Australian Government would have partly cushioned this negative impact where those affected businesses were eligible.
CASE STUDYSouth Australian Rock Lobster: extremes of export market exposure
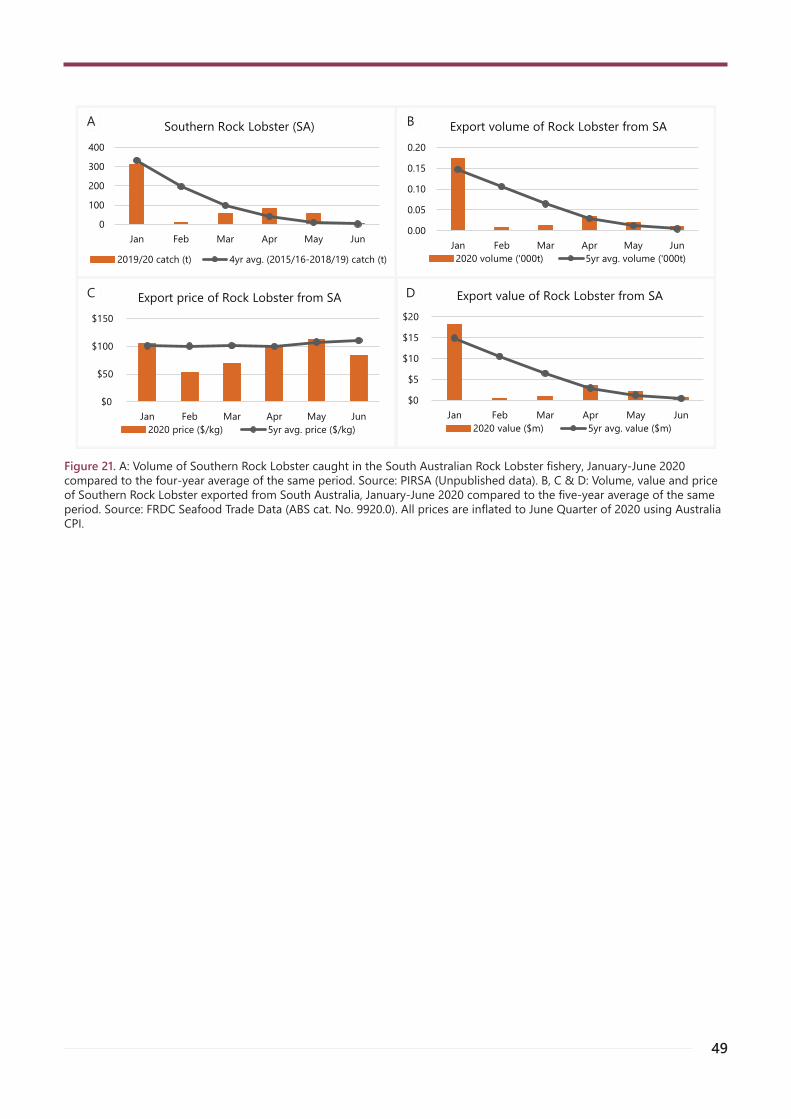
49
Figure 21. A: Volume of Southern Rock Lobster caught in the South Australian Rock Lobster fishery, January-June 2020 compared to the four-year average of the same period. Source: PIRSA (Unpublished data). B, C & D: Volume, value and price of Southern Rock Lobster exported from South Australia, January-June 2020 compared to the five-year average of the same period. Source: FRDC Seafood Trade Data (ABS cat. No. 9920.0). All prices are inflated to June Quarter of 2020 using Australia CPI.
0
100
200
300
400
Jan Feb Mar Apr May Jun
Southern Rock Lobster (SA)
2019/20 catch (t) 4yr avg. (2015/16-2018/19) catch (t)
0.00
0.05
0.10
0.15
0.20
Jan Feb Mar Apr May Jun
Export volume of Rock Lobster from SA
2020 volume ('000t) 5yr avg. volume ('000t)
$0
$50
$100
$150
Jan Feb Mar Apr May Jun
Export price of Rock Lobster from SA
2020 price ($/kg) 5yr avg. price ($/kg)
$0
$5
$10
$15
$20
Jan Feb Mar Apr May Jun
Export value of Rock Lobster from SA
2020 value ($m) 5yr avg. value ($m)
A
C
B
D
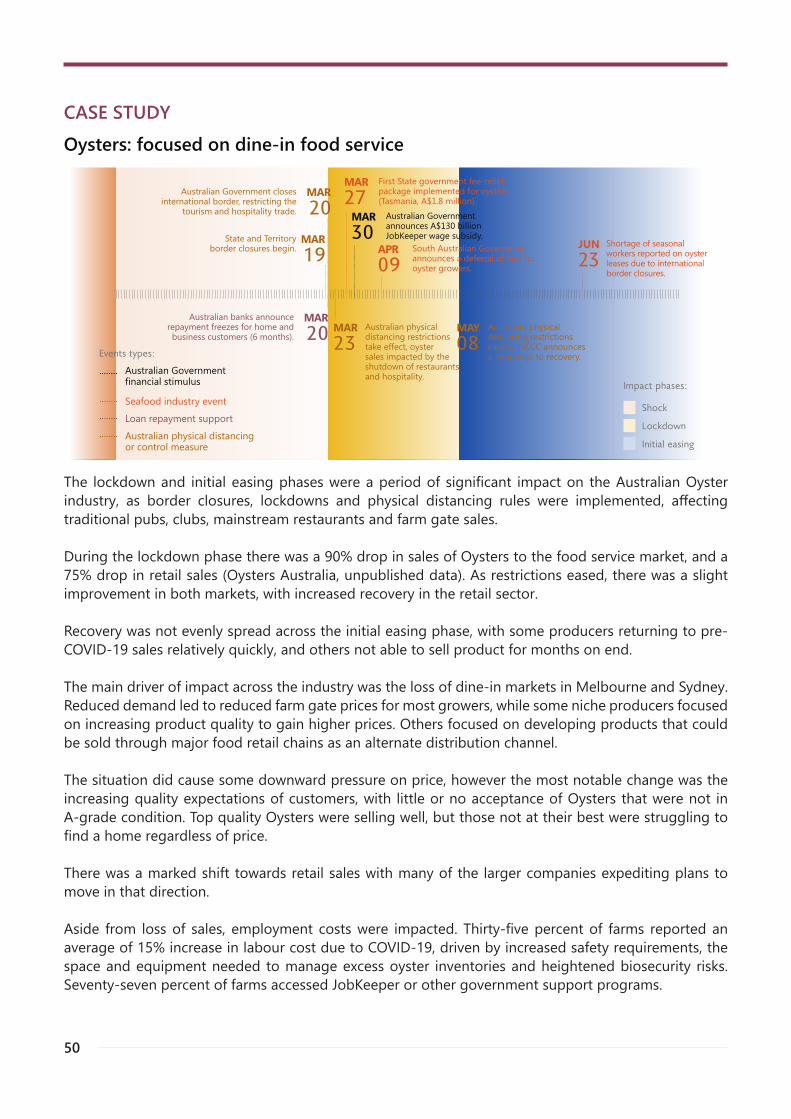
50
Shock
Lockdown
Initial easing
Impact phases:
MAY08
Australian physical distancing restrictions ease as NCCC announces a ‘roadmap’ to recovery.
Australian Government closes international border, restricting the
tourism and hospitality trade.
MAR20
Australian banks announce repayment freezes for home and business customers (6 months).
MAR20
State and Territory border closures begin.
MAR1 9
MAR30
Australian Government announces A$130 billion JobKeeper wage subsidy.
MAR23
Australian physical distancing restrictions take effect, oyster sales impacted by the shutdown of restaurants and hospitality.
MAR27
First State government fee-relief package implemented for oysters (Tasmania, A$1.8 million).
APR09
South Australian Government announces a deferral of fees for oyster growers.
JUN23
Shortage of seasonal workers reported on oyster leases due to international border closures.
Australian Government financial stimulus
Seafood industry event Loan repayment support Australian physical distancing
or control measure
Events types:
The lockdown and initial easing phases were a period of significant impact on the Australian Oyster industry, as border closures, lockdowns and physical distancing rules were implemented, affecting traditional pubs, clubs, mainstream restaurants and farm gate sales.
During the lockdown phase there was a 90% drop in sales of Oysters to the food service market, and a 75% drop in retail sales (Oysters Australia, unpublished data). As restrictions eased, there was a slight improvement in both markets, with increased recovery in the retail sector.
Recovery was not evenly spread across the initial easing phase, with some producers returning to pre-COVID-19 sales relatively quickly, and others not able to sell product for months on end.
The main driver of impact across the industry was the loss of dine-in markets in Melbourne and Sydney. Reduced demand led to reduced farm gate prices for most growers, while some niche producers focused on increasing product quality to gain higher prices. Others focused on developing products that could be sold through major food retail chains as an alternate distribution channel.
The situation did cause some downward pressure on price, however the most notable change was the increasing quality expectations of customers, with little or no acceptance of Oysters that were not in A-grade condition. Top quality Oysters were selling well, but those not at their best were struggling to find a home regardless of price.
There was a marked shift towards retail sales with many of the larger companies expediting plans to move in that direction.
Aside from loss of sales, employment costs were impacted. Thirty-five percent of farms reported an average of 15% increase in labour cost due to COVID-19, driven by increased safety requirements, the space and equipment needed to manage excess oyster inventories and heightened biosecurity risks. Seventy-seven percent of farms accessed JobKeeper or other government support programs.
CASE STUDYOysters: focused on dine-in food service
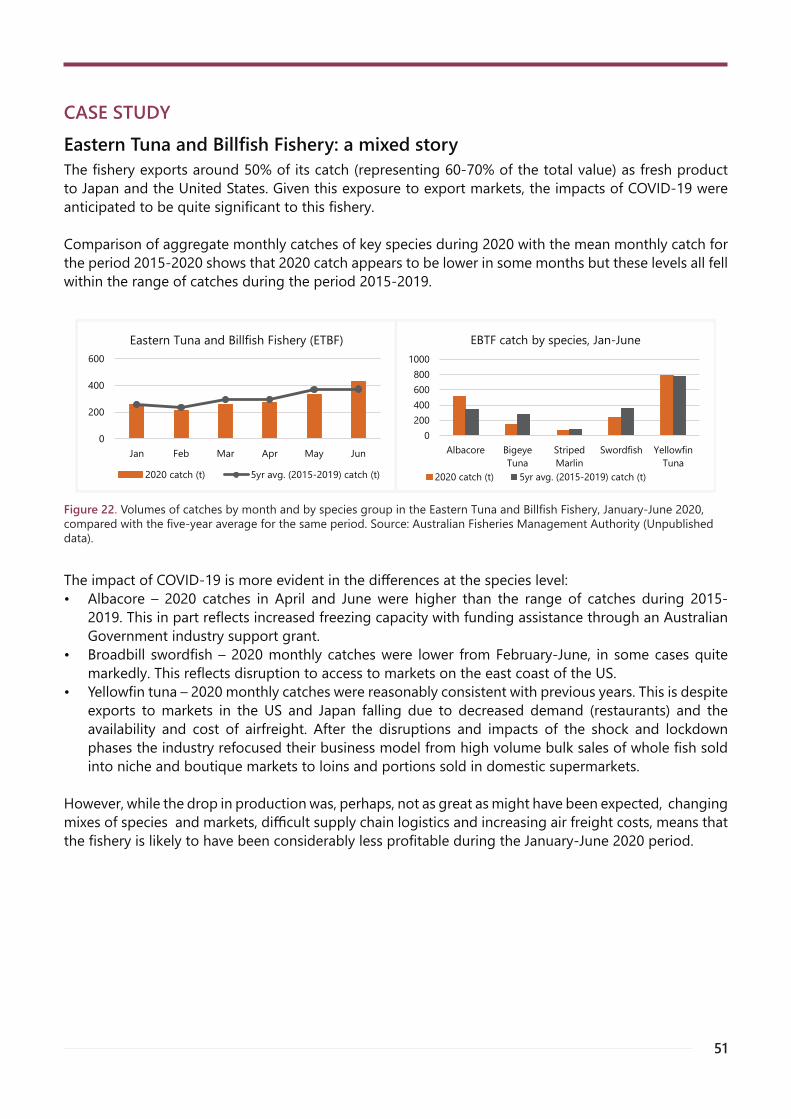
51
CASE STUDYEastern Tuna and Billfish Fishery: a mixed storyThe fishery exports around 50% of its catch (representing 60-70% of the total value) as fresh product to Japan and the United States. Given this exposure to export markets, the impacts of COVID-19 were anticipated to be quite significant to this fishery.
Comparison of aggregate monthly catches of key species during 2020 with the mean monthly catch for the period 2015-2020 shows that 2020 catch appears to be lower in some months but these levels all fell within the range of catches during the period 2015-2019.
Figure 22. Volumes of catches by month and by species group in the Eastern Tuna and Billfish Fishery, January-June 2020, compared with the five-year average for the same period. Source: Australian Fisheries Management Authority (Unpublished data).
0
200
400
600
Jan Feb Mar Apr May Jun
Eastern Tuna and Billfish Fishery (ETBF)
2020 catch (t) 5yr avg. (2015-2019) catch (t)
0200400600800
1000
Albacore BigeyeTuna
StripedMarlin
Swordfish YellowfinTuna
EBTF catch by species, Jan-June
2020 catch (t) 5yr avg. (2015-2019) catch (t)
The impact of COVID-19 is more evident in the differences at the species level:• Albacore – 2020 catches in April and June were higher than the range of catches during 2015-
2019. This in part reflects increased freezing capacity with funding assistance through an Australian Government industry support grant.
• Broadbill swordfish – 2020 monthly catches were lower from February-June, in some cases quite markedly. This reflects disruption to access to markets on the east coast of the US.
• Yellowfin tuna – 2020 monthly catches were reasonably consistent with previous years. This is despite exports to markets in the US and Japan falling due to decreased demand (restaurants) and the availability and cost of airfreight. After the disruptions and impacts of the shock and lockdown phases the industry refocused their business model from high volume bulk sales of whole fish sold into niche and boutique markets to loins and portions sold in domestic supermarkets.
However, while the drop in production was, perhaps, not as great as might have been expected, changing mixes of species and markets, difficult supply chain logistics and increasing air freight costs, means that the fishery is likely to have been considerably less profitable during the January-June 2020 period.
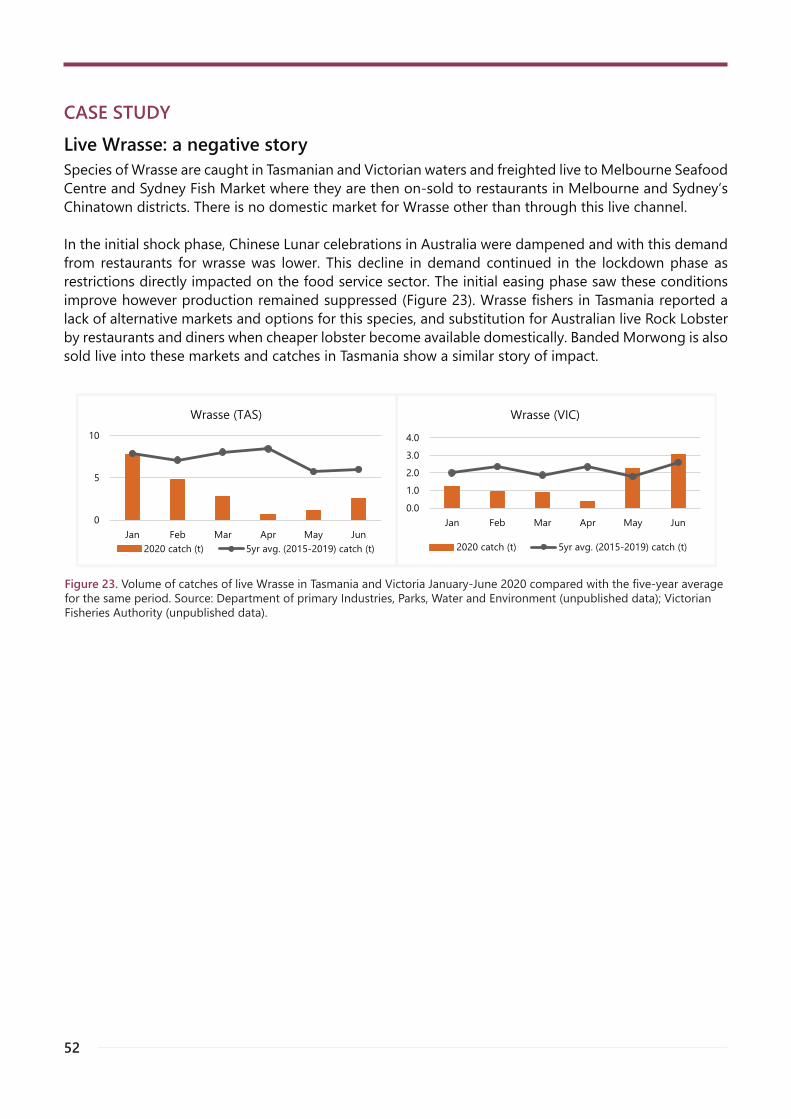
52
CASE STUDYLive Wrasse: a negative storySpecies of Wrasse are caught in Tasmanian and Victorian waters and freighted live to Melbourne Seafood Centre and Sydney Fish Market where they are then on-sold to restaurants in Melbourne and Sydney’s Chinatown districts. There is no domestic market for Wrasse other than through this live channel.
In the initial shock phase, Chinese Lunar celebrations in Australia were dampened and with this demand from restaurants for wrasse was lower. This decline in demand continued in the lockdown phase as restrictions directly impacted on the food service sector. The initial easing phase saw these conditions improve however production remained suppressed (Figure 23). Wrasse fishers in Tasmania reported a lack of alternative markets and options for this species, and substitution for Australian live Rock Lobster by restaurants and diners when cheaper lobster become available domestically. Banded Morwong is also sold live into these markets and catches in Tasmania show a similar story of impact.
Figure 23. Volume of catches of live Wrasse in Tasmania and Victoria January-June 2020 compared with the five-year average for the same period. Source: Department of primary Industries, Parks, Water and Environment (unpublished data); Victorian Fisheries Authority (unpublished data).
0
5
10
Jan Feb Mar Apr May Jun
Wrasse (TAS)
2020 catch (t) 5yr avg. (2015-2019) catch (t)
0.01.02.03.04.0
Jan Feb Mar Apr May Jun
Wrasse (VIC)
2020 catch (t) 5yr avg. (2015-2019) catch (t)
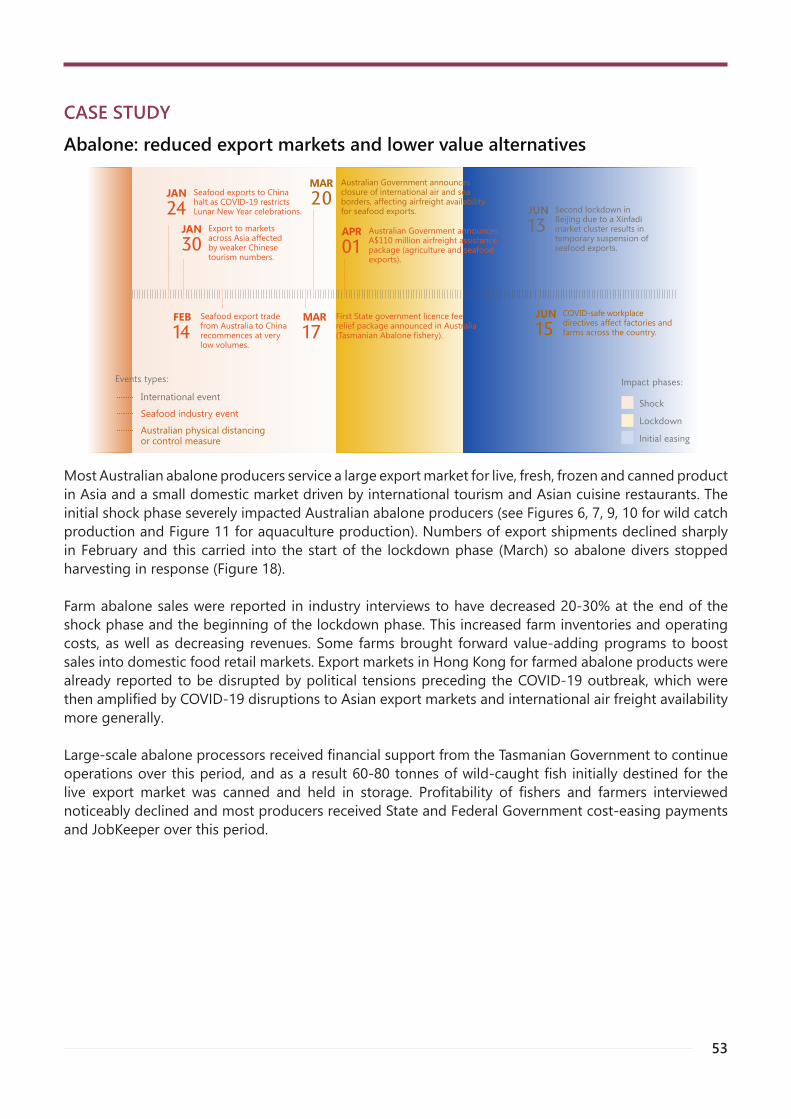
53
CASE STUDYAbalone: reduced export markets and lower value alternatives
Shock
Lockdown
Initial easing
Impact phases:
JUN13
Second lockdown in Beijing due to a Xinfadi market cluster results in temporary suspension of seafood exports.
APR01
Australian Government announces A$110 million airfreight assistance package (agriculture and seafood exports).
MAR20
Australian Government announces closure of international air and sea borders, affecting airfreight availability for seafood exports.
FEB14
Seafood export trade from Australia to China recommences at very low volumes.
JAN24
Seafood exports to China halt as COVID-19 restricts Lunar New Year celebrations.
JAN30
Export to markets across Asia affected by weaker Chinese tourism numbers.
MAR17
First State government licence fee relief package announced in Australia (Tasmanian Abalone fishery).
JUN15
COVID-safe workplace directives affect factories and farms across the country.
International event Seafood industry event Australian physical distancing
or control measure
Events types:
Most Australian abalone producers service a large export market for live, fresh, frozen and canned product in Asia and a small domestic market driven by international tourism and Asian cuisine restaurants. The initial shock phase severely impacted Australian abalone producers (see Figures 6, 7, 9, 10 for wild catch production and Figure 11 for aquaculture production). Numbers of export shipments declined sharply in February and this carried into the start of the lockdown phase (March) so abalone divers stopped harvesting in response (Figure 18).
Farm abalone sales were reported in industry interviews to have decreased 20-30% at the end of the shock phase and the beginning of the lockdown phase. This increased farm inventories and operating costs, as well as decreasing revenues. Some farms brought forward value-adding programs to boost sales into domestic food retail markets. Export markets in Hong Kong for farmed abalone products were already reported to be disrupted by political tensions preceding the COVID-19 outbreak, which were then amplified by COVID-19 disruptions to Asian export markets and international air freight availability more generally.
Large-scale abalone processors received financial support from the Tasmanian Government to continue operations over this period, and as a result 60-80 tonnes of wild-caught fish initially destined for the live export market was canned and held in storage. Profitability of fishers and farmers interviewed noticeably declined and most producers received State and Federal Government cost-easing payments and JobKeeper over this period.
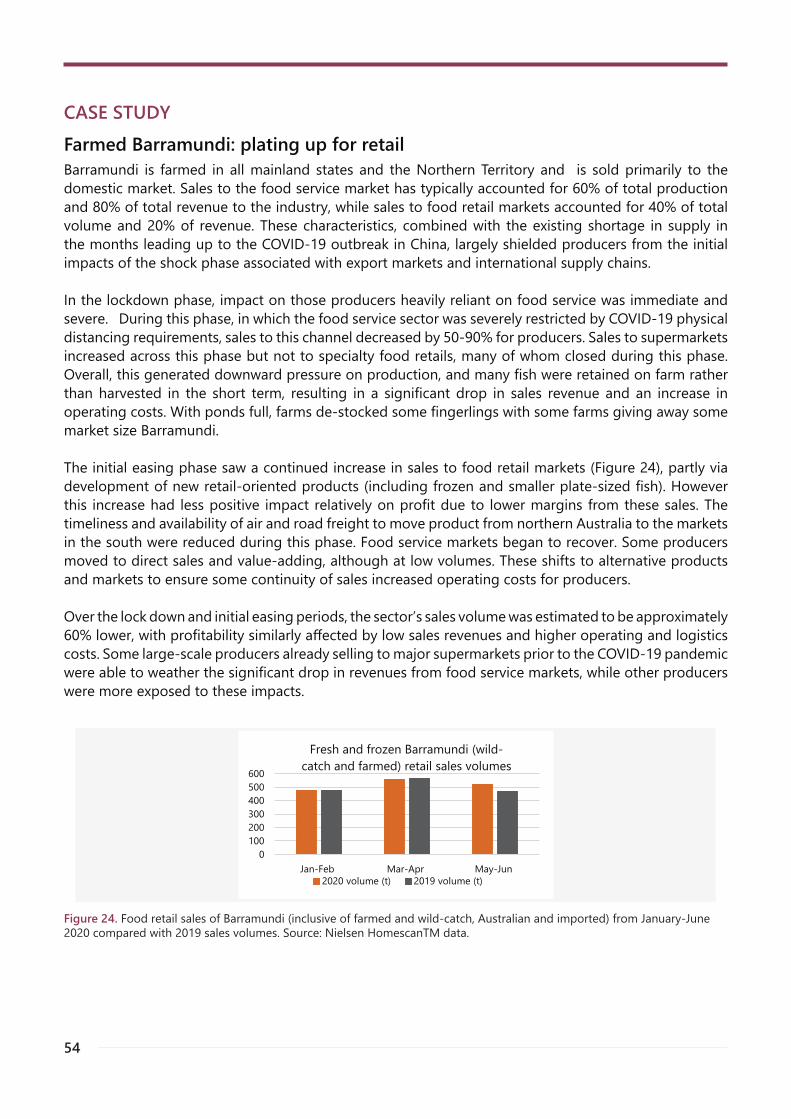
54
0100200300400500600
Jan-Feb Mar-Apr May-Jun
Fresh and frozen Barramundi (wild-catch and farmed) retail sales volumes
2020 volume (t) 2019 volume (t)
Figure 24. Food retail sales of Barramundi (inclusive of farmed and wild-catch, Australian and imported) from January-June 2020 compared with 2019 sales volumes. Source: Nielsen HomescanTM data.
CASE STUDYFarmed Barramundi: plating up for retailBarramundi is farmed in all mainland states and the Northern Territory and is sold primarily to the domestic market. Sales to the food service market has typically accounted for 60% of total production and 80% of total revenue to the industry, while sales to food retail markets accounted for 40% of total volume and 20% of revenue. These characteristics, combined with the existing shortage in supply in the months leading up to the COVID-19 outbreak in China, largely shielded producers from the initial impacts of the shock phase associated with export markets and international supply chains.
In the lockdown phase, impact on those producers heavily reliant on food service was immediate and severe. During this phase, in which the food service sector was severely restricted by COVID-19 physical distancing requirements, sales to this channel decreased by 50-90% for producers. Sales to supermarkets increased across this phase but not to specialty food retails, many of whom closed during this phase. Overall, this generated downward pressure on production, and many fish were retained on farm rather than harvested in the short term, resulting in a significant drop in sales revenue and an increase in operating costs. With ponds full, farms de-stocked some fingerlings with some farms giving away some market size Barramundi.
The initial easing phase saw a continued increase in sales to food retail markets (Figure 24), partly via development of new retail-oriented products (including frozen and smaller plate-sized fish). However this increase had less positive impact relatively on profit due to lower margins from these sales. The timeliness and availability of air and road freight to move product from northern Australia to the markets in the south were reduced during this phase. Food service markets began to recover. Some producers moved to direct sales and value-adding, although at low volumes. These shifts to alternative products and markets to ensure some continuity of sales increased operating costs for producers.
Over the lock down and initial easing periods, the sector’s sales volume was estimated to be approximately 60% lower, with profitability similarly affected by low sales revenues and higher operating and logistics costs. Some large-scale producers already selling to major supermarkets prior to the COVID-19 pandemic were able to weather the significant drop in revenues from food service markets, while other producers were more exposed to these impacts.
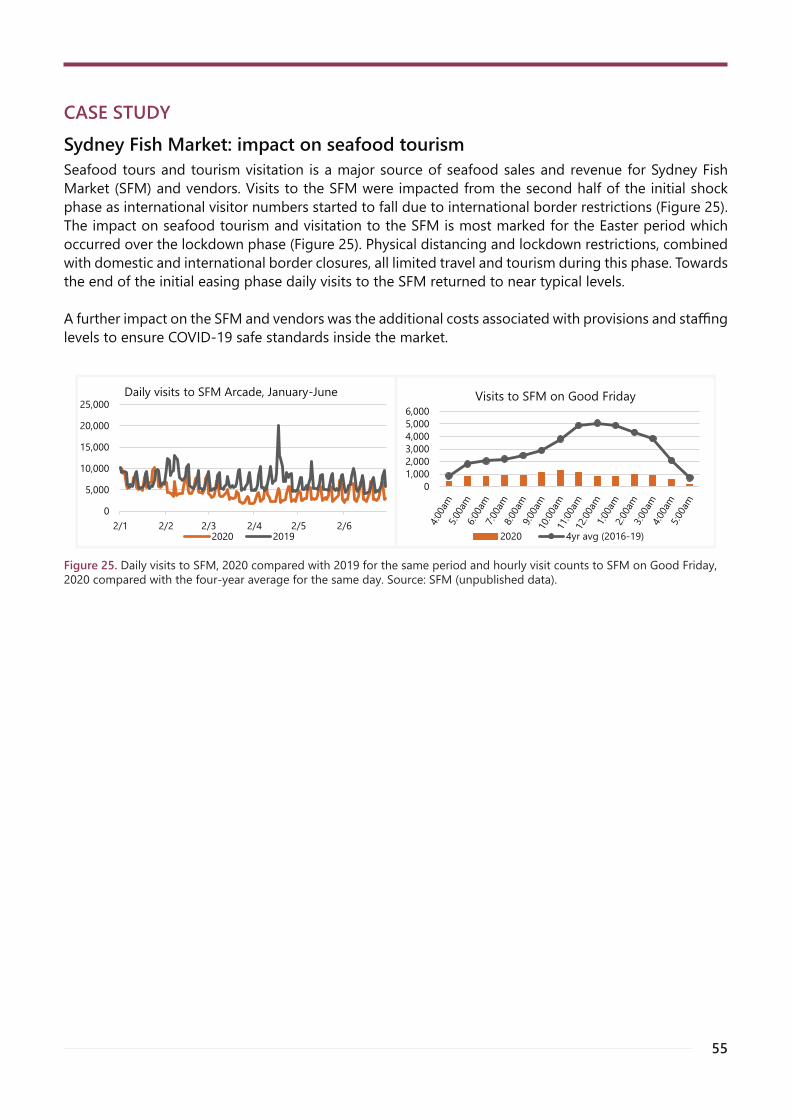
55
CASE STUDYSydney Fish Market: impact on seafood tourismSeafood tours and tourism visitation is a major source of seafood sales and revenue for Sydney Fish Market (SFM) and vendors. Visits to the SFM were impacted from the second half of the initial shock phase as international visitor numbers started to fall due to international border restrictions (Figure 25). The impact on seafood tourism and visitation to the SFM is most marked for the Easter period which occurred over the lockdown phase (Figure 25). Physical distancing and lockdown restrictions, combined with domestic and international border closures, all limited travel and tourism during this phase. Towards the end of the initial easing phase daily visits to the SFM returned to near typical levels.
A further impact on the SFM and vendors was the additional costs associated with provisions and staffing levels to ensure COVID-19 safe standards inside the market.
Figure 25. Daily visits to SFM, 2020 compared with 2019 for the same period and hourly visit counts to SFM on Good Friday, 2020 compared with the four-year average for the same day. Source: SFM (unpublished data).
0
5,000
10,000
15,000
20,000
25,000
2/1 2/2 2/3 2/4 2/5 2/6
Daily visits to SFM Arcade, January-June
2020 2019
01,0002,0003,0004,0005,0006,000
Visits to SFM on Good Friday
2020 4yr avg (2016-19)
56
CASE STUDYFish and Chip shops: sentinels of Australian consumers andthe seafood communityAustralia’s fish and chip shops sell both Australian and imported seafood. Many of those interviewed by FRDC reported that they shut down during the latter part of the shock phase and the early part of the lockdown phase, with substantial loss of revenue. Most proprietors reported a recovery in food sales volumes in the later lockdown and initial easing phases, largely through recovery of local consumer demand rather than a return of tourist markets. Proprietors observed the strong sentiment among customers toward supporting Australian seafood producers and businesses during such times. Some shops ran local marketing campaigns during the lockdown phase. Those businesses more focused on dine-in food service were – on the whole – able to shift to takeaway services, as well as home delivery in some cases.
Fish and chip shop proprietors reported that the fishers who supplied them were experiencing difficulties in finding crew, which was attributed to the reduced incentive to take up jobs on fishing vessels as a result of the availability of the JobKeeper and JobSeeker payment schemes, but were otherwise able to continue fishing and supplying them with seafood. The availability of supplies of Australian seafood that would otherwise be exported was a boost to some of these businesses. Prices for seafood supplies stayed steady for most proprietors. However, business costs increased due to additional hygiene supply needs, and some proprietors put on extra staff to ensure COVID-19-safe standards were met.
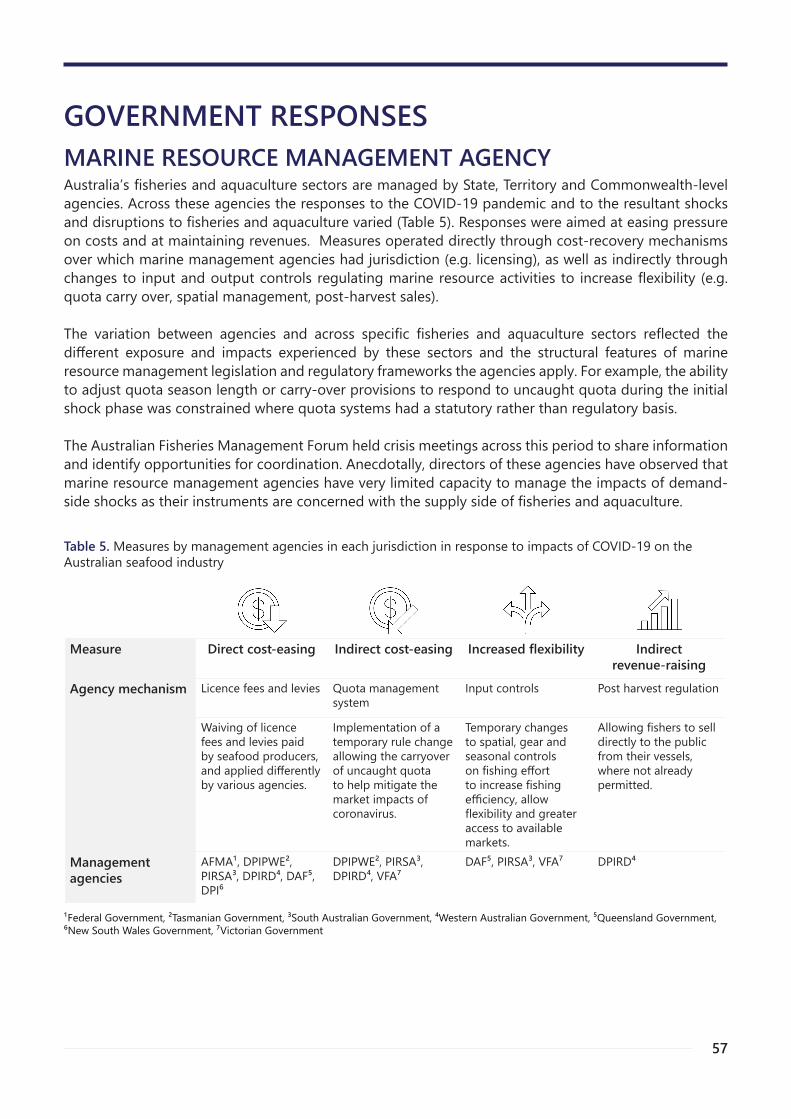
57
GOVERNMENT RESPONSESMARINE RESOURCE MANAGEMENT AGENCYAustralia’s fisheries and aquaculture sectors are managed by State, Territory and Commonwealth-level agencies. Across these agencies the responses to the COVID-19 pandemic and to the resultant shocks and disruptions to fisheries and aquaculture varied (Table 5). Responses were aimed at easing pressure on costs and at maintaining revenues. Measures operated directly through cost-recovery mechanisms over which marine management agencies had jurisdiction (e.g. licensing), as well as indirectly through changes to input and output controls regulating marine resource activities to increase flexibility (e.g. quota carry over, spatial management, post-harvest sales).
The variation between agencies and across specific fisheries and aquaculture sectors reflected the different exposure and impacts experienced by these sectors and the structural features of marine resource management legislation and regulatory frameworks the agencies apply. For example, the ability to adjust quota season length or carry-over provisions to respond to uncaught quota during the initial shock phase was constrained where quota systems had a statutory rather than regulatory basis.
The Australian Fisheries Management Forum held crisis meetings across this period to share information and identify opportunities for coordination. Anecdotally, directors of these agencies have observed that marine resource management agencies have very limited capacity to manage the impacts of demand-side shocks as their instruments are concerned with the supply side of fisheries and aquaculture.
Table 5. Measures by management agencies in each jurisdiction in response to impacts of COVID-19 on the Australian seafood industry
Measure Direct cost-easing Indirect cost-easing Increased flexibility Indirectrevenue-raising
Agency mechanism Licence fees and levies Quota management system
Input controls Post harvest regulation
Waiving of licence fees and levies paid by seafood producers, and applied differently by various agencies.
Implementation of a temporary rule change allowing the carryover of uncaught quota to help mitigate the market impacts of coronavirus.
Temporary changes to spatial, gear and seasonal controls on fishing effort to increase fishing efficiency, allow flexibility and greater access to available markets.
Allowing fishers to sell directly to the public from their vessels, where not already permitted.
Management agencies
AFMA¹, DPIPWE², PIRSA³, DPIRD⁴, DAF⁵, DPI⁶
DPIPWE², PIRSA³, DPIRD⁴, VFA⁷
DAF⁵, PIRSA³, VFA⁷ DPIRD⁴
¹Federal Government, ²Tasmanian Government, ³South Australian Government, ⁴Western Australian Government, ⁵Queensland Government, ⁶New South Wales Government, ⁷Victorian Government
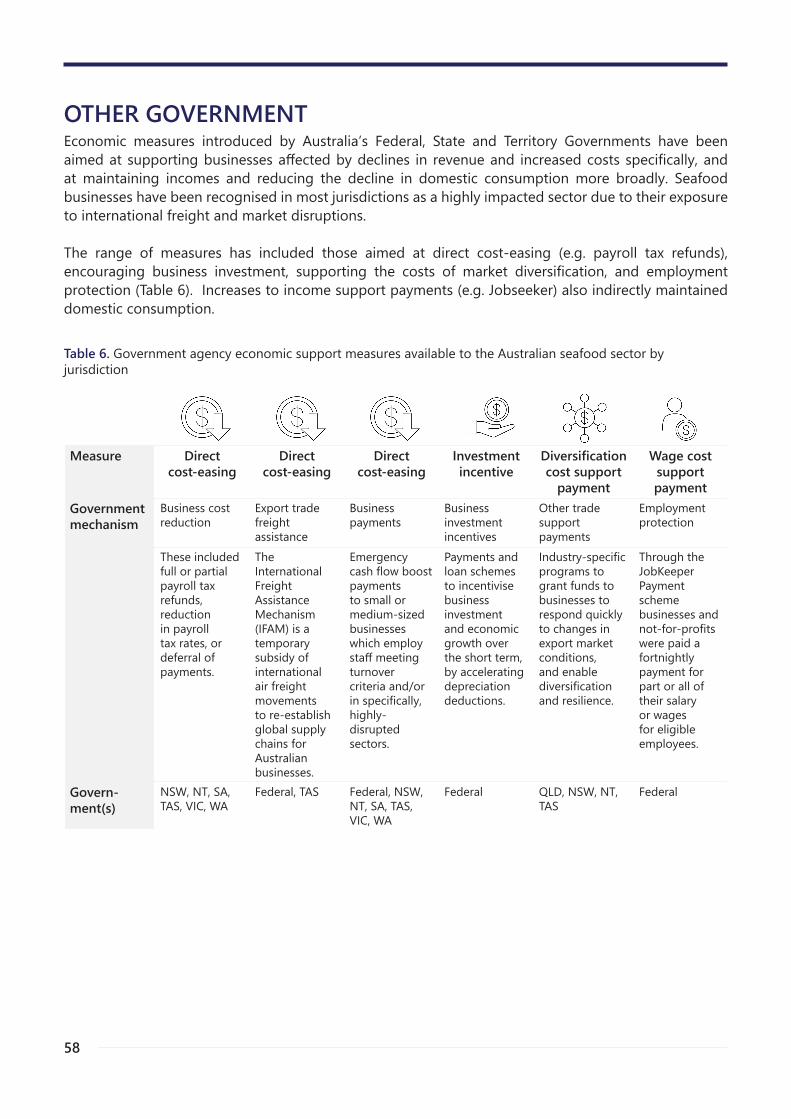
58
OTHER GOVERNMENTEconomic measures introduced by Australia’s Federal, State and Territory Governments have been aimed at supporting businesses affected by declines in revenue and increased costs specifically, and at maintaining incomes and reducing the decline in domestic consumption more broadly. Seafood businesses have been recognised in most jurisdictions as a highly impacted sector due to their exposure to international freight and market disruptions.
The range of measures has included those aimed at direct cost-easing (e.g. payroll tax refunds), encouraging business investment, supporting the costs of market diversification, and employment protection (Table 6). Increases to income support payments (e.g. Jobseeker) also indirectly maintained domestic consumption.
Table 6. Government agency economic support measures available to the Australian seafood sector by jurisdiction
Measure Direct cost-easing
Direct cost-easing
Direct cost-easing
Investment incentive
Diversification cost support
payment
Wage cost support payment
Government mechanism
Business cost reduction
Export trade freight assistance
Business payments
Business investment incentives
Other trade support payments
Employment protection
These included full or partial payroll tax refunds, reduction in payroll tax rates, or deferral of payments.
The International Freight Assistance Mechanism (IFAM) is a temporary subsidy of international air freight movements to re-establish global supply chains for Australian businesses.
Emergency cash flow boost payments to small or medium-sized businesses which employ staff meeting turnover criteria and/or in specifically, highly-disrupted sectors.
Payments and loan schemes to incentivise business investment and economic growth over the short term, by accelerating depreciation deductions.
Industry-specific programs to grant funds to businesses to respond quickly to changes in export market conditions, and enable diversification and resilience.
Through the JobKeeper Payment scheme businesses and not-for-profits were paid a fortnightly payment for part or all of their salary or wages for eligible employees.
Govern-ment(s)
NSW, NT, SA, TAS, VIC, WA
Federal, TAS Federal, NSW, NT, SA, TAS, VIC, WA
Federal QLD, NSW, NT, TAS
Federal
59
AUSTRALIAN SEAFOOD: IMPACT AND OUTLOOKThere have been striking differences in the COVID-19 experience of various parts of the Australian seafood industry and various businesses, only some of which this high-level impact assessment has been able capture. Impacts range from positive (through positive price effects) to negative and, in some cases, catastrophic across sectors and businesses.
These differences in impact are explained in part by the different exposure of Australia’s fisheries and aquaculture to two broad types of economic shocks (Figure 1); • disruptions in supply chains (i.e. loss of air and road freight availability); and • market disruptions (due to physical distancing measures and border closures)
The high value export and live dine-in domestic food service focused parts of Australia’s seafood industry experienced negative impacts to production and value due to higher levels of vulnerability to disruption to both supply chains and end markets. Businesses affected by physical distancing measures which impacted on transporting goods and services required for production, perishable product or fishing crews out of or into closed areas, were also negatively affected. The pattern of exposure across different sectors of fisheries and aquaculture was in part explained by the seasonality of production and demand.
Positively-impacted parts of the industry were characterised by either an initial retail focus (which benefited from strong demand) or products which could be more easily diverted to other markets.
As an outcome of COVID-19 impacts on markets and supply chains, some seafood businesses have reported a negative impact on profitability. More than half of respondents to the FRDC 2020 Stakeholder Survey reported a decline or significant decline in profitability relative to levels otherwise expected over the January-June 2020 report period. This was driven by a fall in revenue and an increase in non-wage costs. Respondents involved primarily in aquaculture reported lower overall negative impacts on profitability compared to those from the wild-catch sector.
Seafood businesses have also reported a negative impact on employment as a further outcome, both in terms of fewer causal staff employed and a lower ratio of full-time to part-time employees (FRDC 2020 Stakeholder Survey). These effects are partly confounded by the Australian Government’s JobKeeper payment scheme, for which not all seafood businesses and employers were eligible. Total hours worked were generally reported as lower than expected for the January to June period, with wild-catch fisheries businesses being more affected than those in aquaculture. Anecdotally, seafood businesses who were able to adapt to COVID-19 conditions through finding alternative supply chains or markets report increased levels of unpaid work by business operators during this period. This suggests that indicators of seafood business profitability maybe be confounded by such unaccounted costs.
This report’s focus on economic impacts means that other impacts on people in Australia’s seafood community have not been covered. Significant impacts to the mental health of people in the broader Australian community – due in part to negative economic impacts such as unemployment, uncertainty and loss of businesses and livelihood – have been reported elsewhere. A recent Wellness in Seafood Communities survey (Seafood Industry Australia 2020) found nearly two thirds of seafood industry respondents reporting experiencing heightened stress and pressure as a result of COVID-19. Some respondents cited pressures on business performance due to poor prices and loss of markets as the cause, and others indicated loss of job or reduced hours as the cause.
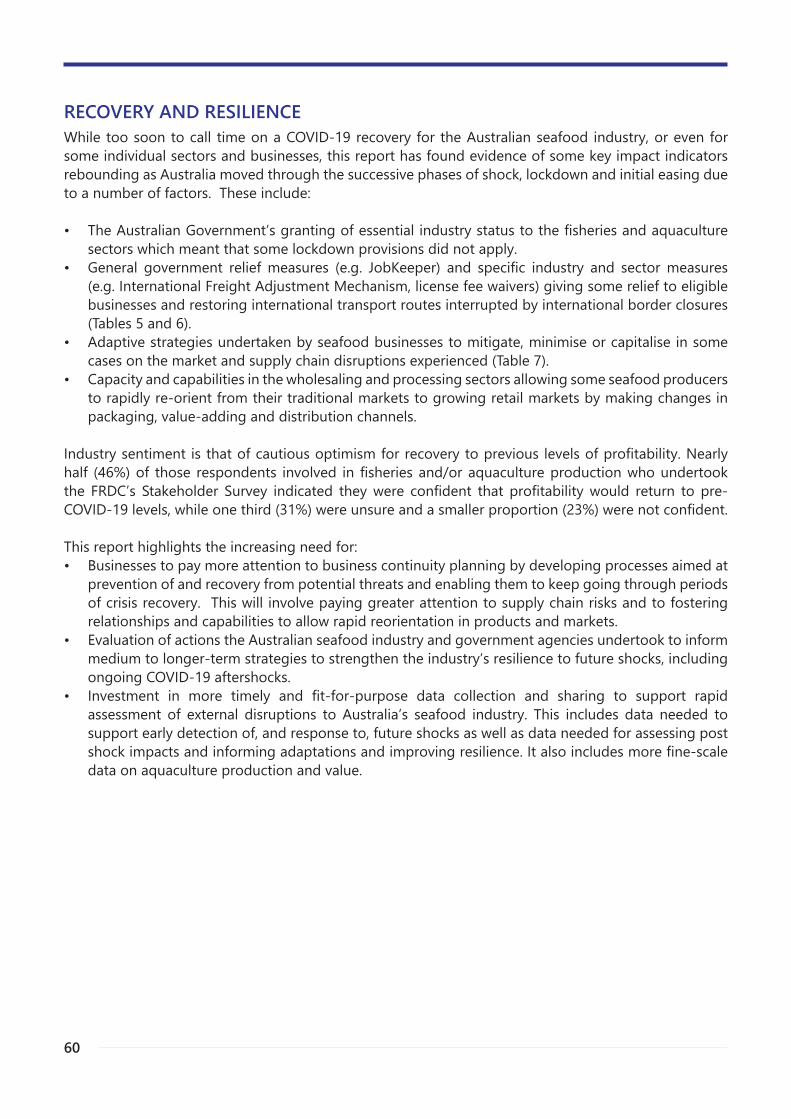
60
RECOVERY AND RESILIENCEWhile too soon to call time on a COVID-19 recovery for the Australian seafood industry, or even for some individual sectors and businesses, this report has found evidence of some key impact indicators rebounding as Australia moved through the successive phases of shock, lockdown and initial easing due to a number of factors. These include:
• The Australian Government’s granting of essential industry status to the fisheries and aquaculture sectors which meant that some lockdown provisions did not apply.
• General government relief measures (e.g. JobKeeper) and specific industry and sector measures (e.g. International Freight Adjustment Mechanism, license fee waivers) giving some relief to eligible businesses and restoring international transport routes interrupted by international border closures (Tables 5 and 6).
• Adaptive strategies undertaken by seafood businesses to mitigate, minimise or capitalise in some cases on the market and supply chain disruptions experienced (Table 7).
• Capacity and capabilities in the wholesaling and processing sectors allowing some seafood producers to rapidly re-orient from their traditional markets to growing retail markets by making changes in packaging, value-adding and distribution channels.
Industry sentiment is that of cautious optimism for recovery to previous levels of profitability. Nearly half (46%) of those respondents involved in fisheries and/or aquaculture production who undertook the FRDC’s Stakeholder Survey indicated they were confident that profitability would return to pre-COVID-19 levels, while one third (31%) were unsure and a smaller proportion (23%) were not confident.
This report highlights the increasing need for:• Businesses to pay more attention to business continuity planning by developing processes aimed at
prevention of and recovery from potential threats and enabling them to keep going through periods of crisis recovery. This will involve paying greater attention to supply chain risks and to fostering relationships and capabilities to allow rapid reorientation in products and markets.
• Evaluation of actions the Australian seafood industry and government agencies undertook to inform medium to longer-term strategies to strengthen the industry’s resilience to future shocks, including ongoing COVID-19 aftershocks.
• Investment in more timely and fit-for-purpose data collection and sharing to support rapid assessment of external disruptions to Australia’s seafood industry. This includes data needed to support early detection of, and response to, future shocks as well as data needed for assessing post shock impacts and informing adaptations and improving resilience. It also includes more fine-scale data on aquaculture production and value.
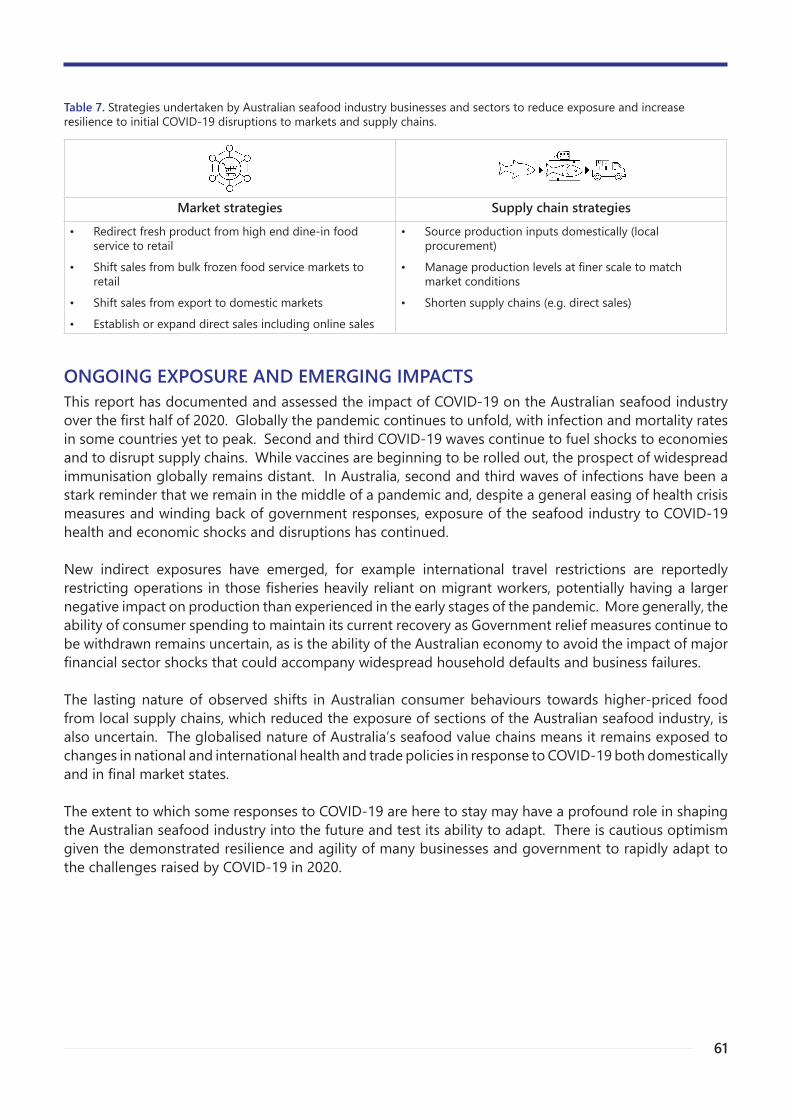
61
ONGOING EXPOSURE AND EMERGING IMPACTSThis report has documented and assessed the impact of COVID-19 on the Australian seafood industry over the first half of 2020. Globally the pandemic continues to unfold, with infection and mortality rates in some countries yet to peak. Second and third COVID-19 waves continue to fuel shocks to economies and to disrupt supply chains. While vaccines are beginning to be rolled out, the prospect of widespread immunisation globally remains distant. In Australia, second and third waves of infections have been a stark reminder that we remain in the middle of a pandemic and, despite a general easing of health crisis measures and winding back of government responses, exposure of the seafood industry to COVID-19 health and economic shocks and disruptions has continued.
New indirect exposures have emerged, for example international travel restrictions are reportedly restricting operations in those fisheries heavily reliant on migrant workers, potentially having a larger negative impact on production than experienced in the early stages of the pandemic. More generally, the ability of consumer spending to maintain its current recovery as Government relief measures continue to be withdrawn remains uncertain, as is the ability of the Australian economy to avoid the impact of major financial sector shocks that could accompany widespread household defaults and business failures.
The lasting nature of observed shifts in Australian consumer behaviours towards higher-priced food from local supply chains, which reduced the exposure of sections of the Australian seafood industry, is also uncertain. The globalised nature of Australia’s seafood value chains means it remains exposed to changes in national and international health and trade policies in response to COVID-19 both domestically and in final market states.
The extent to which some responses to COVID-19 are here to stay may have a profound role in shaping the Australian seafood industry into the future and test its ability to adapt. There is cautious optimism given the demonstrated resilience and agility of many businesses and government to rapidly adapt to the challenges raised by COVID-19 in 2020.
Table 7. Strategies undertaken by Australian seafood industry businesses and sectors to reduce exposure and increase resilience to initial COVID-19 disruptions to markets and supply chains.
Market strategies Supply chain strategies• Redirect fresh product from high end dine-in food
service to retail
• Shift sales from bulk frozen food service markets to retail
• Shift sales from export to domestic markets
• Establish or expand direct sales including online sales
• Source production inputs domestically (local procurement)
• Manage production levels at finer scale to match market conditions
• Shorten supply chains (e.g. direct sales)
62
REFERENCES AND DATA SOURCESProduction and Imports:ABARES 2020a, Agricultural commodities: December quarter 2020, Australian Bureau of Agricultural and Resource Economics and Sciences, Canberra, December. CC BY 4.0. https://doi.org/10.25814/vtqw-gm43
ABARES 2020b Fisheries and Aquaculture Statistics 2018. https://www.agriculture.gov.au/abares/research-topics/fisheries/fisheries-and-aquaculture-statistics
ABARES 2020c Australian fisheries and aquaculture outlook 2020. https://www.agriculture.gov.au/abares/research-topics/fisheries/fisheries-economics/fisheries-forecasts#potential-impact-of-covid19-outbreak-on-australian-fisheries-exports
Department Primary Industries and Resources, Western Australia (DPIR) - unpublished data
Australian Fisheries Management Authority (AFMA) - unpublished data
Department of Primary Industries and Regions, South Australia (PIRSA) - unpublished data
Victorian Fisheries Authority (VFA) - unpublished data
Department Industry, Tourism and Trade, Northern Territory (DITT) - unpublished data
Department Primary Industry, Parks, Water and Environment Tasmania (DPIPWE) - unpublished data
Department Primary Industries, New South Wales (DPI) - unpublished data
Fisheries Research and Development Corporation (FRDC) (2020a) Seafood Trade Data, http://frdc.com.au/services/seafood-trade-data (ABS cat. No. 9920.0)
Wholesale and Processing:Sydney Fish Market (2020) Wholesale volumes, prices and values - unpublished data
Transport and Logistics:WorldACD (2020) March 2020 air cargo market data. https://worldacd.com/trendsapr2020
Bureau of Infrastructure and Transport Research Economics (2020) International Airline Activity-Time Series. https://www.bitre.gov.au/publications/ ongoing/international_airline_activity-time_series
Baltic Exchange (2020). Air Freight Index. https://www.balticexchange.com/en/data-services/routes.html
Australian Trade and Investment Commission (Austrade) (2020) International Freight Adjustment Mechanism (IFAM) - unpublished data
Australian Institute of Petroleum (AIP) (2020a) Historical Daily Diesel Terminal Gate Prices, http://www.aip.com.au/historical-ulp-and-diesel-tgp-data accessed on 27/11/2020
Australian Institute of Petroleum (AIP) (2020b) Historical Average Diesel Retail Prices, https://www.aip.com.au/pricing/pump-prices accessed on 27/11/2020
Freightos (2020) Baltic Exchange Global Container Freight Index. https://fbx.freightos.com/
Freight Australia (2020). National Freight and Supply Chain Strategy Annual Report 2019-20 https://www.freightaustralia.gov.au/annual-report
Other background data:https://www.agriculture.gov.au/sites/default/files/documents/tmad-trade-implications-factsheet-2.pdf
https://infrastructure.org.au/wp-content/uploads/2019/03/2019-International-Airfreight-Indicator- digital.pdf
https://infrastructure.org.au/wp-content/uploads/2019/03/2019-International-Airfreight-Indicator- digital.pdf
https://www.freightforwarderquoteonline.com.au/news-freight-forwarding-custom-broker- clearance/coronavirus-sea-freight-australia-update-2020-coronavirus-air-freight-australia-update- 2020/#airfreight
https://www.dhl.com/content/dam/dhl/global/dhl-global-forwarding/documents/pdf/glo- dgf-ocean-market-update.pdf
63
Consumer markets:Fisheries Research and Development Corporation (FRDC) (2020a) Seafood Trade Data, http://frdc.com.au/services/seafood-trade-data (ABS cat No. 9920.0)
Australian Bureau of Statistics (ABS) Retail Trade, Australia (cat. no. 8501.0): https://www.abs.gov.au/statistics/industry/retail-and- wholesale-trade/retail-trade-australia/latest-release
Australian Pork Foodservice Research (2020). Monthly report November. Thrive Insights.
Google Trends (2020a) Fish and Chips, https://trends.google.com/trends/explore?date=2015-01-01%202020-12-17&geo=AU&q=fish%20and%20chips accessed on 3/12/2020
Nielsen (2020) FRDC Seafood Industry Trends Report, April – June. Nielsen Homescan TM data.
Google Trends (2020b) Fish Recipe, https://trends.google.com/trends/explore?date=2015-01-01%202020-12-17&geo=AU&q=fish%20recipe accessed on 9/12/2020
Australian Bureau of Statistics (ABS) Apparent Consumption of Selected Foodstuffs, Australia, 2019-20 (release 4316.0).
University of Tasmania (UTAS) (2020) Food access and supply: Preliminary report on findings from The Tasmania Project’s Food Survey. Report number 17, June 2020. https://blogs.utas.edu.au/isc/2020/06/17/food-access-and-supply-in-tasmania-during-the-covid-19-pandemic-report-17/
Fisheries Research and Development Corporation (FRDC) (2020b) Stakeholder Survey. http://frdc.com.au/services/market-research
Wedding, Nicole. (2020) ‘Direct Sales Have Become a Lifeline for SA Producers – Here’s How You Can Show Your Support’ Broadsheet 9 April 2020.
Case Studies:BDO EconSearch (2020a) Economic Impact of COVID-19 on the South Eastern Trawl Fishery, January to June 2020, prepared for Fisheries Research and Development Corporation (FRDC), December, Adelaide.
BDO EconSearch (2020b) Economic Impact of COVID-19 on the South Australian Rock Lobster Fishery, January to June 2020, prepared for Fisheries Research and Development Corporation (FRDC), December, Adelaide.
Australian Institute of Petroleum (AIP) (2020a) Historical Daily Diesel Terminal Gate Prices, http://www.aip.com.au/historical-ulp-and-diesel-tgp-data accessed on 27/11/2020.
Australian Institute of Petroleum (AIP) (2020b), Historical Average Diesel Retail Prices, https://www.aip.com.au/pricing/pump-prices accessed on 27/11/2020.
Sydney Fish Market (2020a) Wholesale price data – unpublished
Ridge Partners (2020) Industry interviews – unpublished data.
Schrobback, P. Rust, S., Ugalde, S. and Rolfe, J. (2020) Describing and analysing the Pacific oyster supply chain in Australia: Final Research Report. October 2020. Central Queensland University, School of Business and Law, and the University of Tasmania, Institute for Marine and Antarctic Studies.
Nielsen (2020) FRDC Seafood Industry Trends Report, April – June. Nielsen Homescan TM data.
Sydney Fish Market (2020b) Visitation data – unpublished
Fisheries Research and Development Corporation (FRDC) (2020c) Fish and Chip shop proprietor interviews – unpublished.
Government responses:Australian Fisheries Management Forum (2020) Summary of support in response to coronavirus. https://www.agriculture.gov.au/coronavirus/fisheries

64