Embed Size (px)
Citation preview

lable at ScienceDirect
Atmospheric Environment 44 (2010) 1726e1739
Contents lists avai
Atmospheric Environment
journal homepage: www.elsevier .com/locate/atmosenv
Impacts of boundary layer mixing on pollutant vertical profiles in the lowertroposphere: Implications to satellite remote sensing
Jin-Tai Lin*, Michael B. McElroySchool of Engineering and Applied Sciences, Harvard University, Cambridge, MA 02138, USA
a r t i c l e i n f o
Article history:Received 30 November 2009Received in revised form2 February 2010Accepted 5 February 2010
Keywords:PBL mixingNon-local schemeFull-mixingSatellite remote sensing
* Corresponding author. Harvard University, Cruft LCambridge, MA 02138, USA. Tel.: þ1 617 496 6365; fa
E-mail address: [email protected] (J.-T. Lin).
1352-2310/$ e see front matter � 2010 Elsevier Ltd.doi:10.1016/j.atmosenv.2010.02.009
a b s t r a c t
Mixing in the planetary boundary layer (PBL) affects vertical distributions of air tracers in the lowertroposphere. An accurate representation of PBL mixing is critical for chemical-transport models (CTMs)for applications sensitive to simulations of the vertical profiles of tracers. The full mixing assumption inthe widely used global CTM GEOS-Chem has recently been supplemented with a non-local PBL scheme.This study analyzes the impact of the non-local scheme on model representation of PBL mixing,consequences for simulations of vertical profiles of air tracers and surface air pollution, and implicationsfor model applications to the interpretation of data retrieved from satellite remote sensing. The non-localscheme significantly improves simulations of the vertical distributions for NO2 and O3, as evaluated usingaircraft measurements in summer 2004. It also reduces model biases over the U.S. by more than 10 ppbfor surface ozone concentrations at night and by 2e5 ppb for peak ozone in the afternoon, as evaluatedusing ground observations. The application to inverse modeling of anthropogenic NOx emissions for EastChina using satellite retrievals of NO2 from OMI and GOME-2 suggests that the full mixing assumptionresults in 3e14% differences in topedown emission budgets as compared to the non-local scheme. Thetopedown estimate combining the non-local scheme and the Lin et al. inverse modeling approachsuggests a magnitude of 6.6 TgN yr�1 for emissions of NOx over East China in July 2008 and 8.0 TgN yr�1
for January 2009, with the magnitude and seasonality in good agreement with bottomeup estimates.� 2010 Elsevier Ltd. All rights reserved.
1. Introduction
Vertical distributions of air tracers in the lower troposphere areinfluenced by vertical mixing within the planetary boundary layer(PBL) (Holtslag, 2002; Stull, 2003). Stronger mixing, includinga deeper PBL and stronger interactions of tracers from differentaltitudes in the PBL, leads to more uniform vertical distributions ofair tracers in the lower troposphere. On the contrary, weaker PBLmixing tends to result in greater vertical gradients for air tracers. Themagnitude of PBL mixing varies significantly in both space and time(Stull, 2003). For example, the depth of the PBL in summer varies bya factor of 2 or more between the eastern and western U.S. in theafternoon and by a factor of 10 or so from night to day (Lin et al.,2008). An accurate representation of PBL mixing is critical forsimulation of air tracers in the lower troposphere (Holtslag, 2002).
Mixing in the PBL is driven by turbulence with chaotic character-istics.Asa result, the setofdynamicequationsspecifying the temporal
ab Room 211A, 19 Oxford St.,x: þ1 617 384 8016.
All rights reserved.
variation of PBLmixing includesmore unknowns than the number ofequations; thus parameterizations have to be implemented forcertain unknowns in order to simulate the evolution of PBL mixing(Stull, 2003). Distinguished primarily by the extent of parameteriza-tion, several types of PBL mixing scheme have been employed inglobal and regional climate and chemistry models (Holtslag andBoville, 1993; Holtslag, 2002; Stull, 2003; http://www.mi.unihamburg.de/Mesoscale-transport-or-chemistry-transportmodel.676.0.html). The first-order ‘local’ mixing scheme derived based onK-theory (e.g., Louis et al., 1982) assumes that mixing for heat, watervapor and air tracers occurs only between adjacent layers of the PBL,and that themagnitudeofmixing is determinedby theeddydiffusioncoefficient and local gradients of corresponding scalars. In particular,the eddydiffusion coefficient is diagnosedusingothermeteorologicalparameters. The local scheme is unable to simulate the PBL-widemixing by large eddies in the case of an unstable PBL (Holtslag andBoville, 1993; Holtslag, 2002; Stull, 2003). Another type of localmixing scheme relates the eddy diffusion coefficient to the turbulentkinetic energy (TKE) and attempts to solve for the evolution of TKE byequation sets with 1.5 or higher order closure (e.g., Mellor andYamada, 1982). These schemes are more complicated, and may notnecessarily improve the simulation of PBLmixing as a consequenceof
J.-T. Lin, M.B. McElroy / Atmospheric Environment 44 (2010) 1726e1739 1727
complex model interactions and uncertainties associated withassumptions concerning the unknowns (Holtslag, 2002). In addition,anumberof so-called ‘non-local’mixingschemeshavebeenproposedto improve the simulation of mixing when the PBL is unstable(Holtslag, 2002). These schemes typically incorporate a ‘non-local’term driving mixing across the PBL, allowing for the effect of largeeddies. When the PBL is stable, the non-local term vanishes and thebehavior of non-local schemes is similar to that of local mixingschemes (Holtslag and Boville,1993;Holtslag, 2002).While non-localschemes with higher order closure exist, the most popular non-localschemes employed in global and regional models are based on first-order closure; with relatively simple formulation and computation,they are capable of simulating the PBL mixing under differentconditions.Onesuchnon-local schemewaspresentedbyHoltslagandBoville (1993) (see detailed discussions in Section 2.1) and isemployed widely in many state-of-the-art global and regionalmodels, such as MOZART (Horowitz et al., 2003), TM5 (Krol et al.,2005), CAM3 (Collins et al., 2006) and RegCM3 (Pal et al., 2007).Similar non-local schemes are incorporated in MM5 (Hong and Pan,1996) and several observation assimilations, including the NationalAeronautics and Space Administration (NASA) GOES-5 (Lock et al.,2000) and the European Centre for Medium-Range Weather Fore-casts (ECMWF) ERA-40 (Troen and Mahrt, 1986).
GEOS-Chem is a popular and well-known global chemical-transport model (CTM) used by more than 50 research groupsworldwide for studies of sources, sinks and transport of gaseousand aerosol tracers in the troposphere; its nested version has beenused for studying regional air quality in Asia and North America(http://www.as.harvard.edu/chemistry/trop/geos/). The last modelmeeting in April 2009 accommodated more than 150 researchersfrom around the world. And hundreds of peer-reviewed papersassociated with the model have been published (e.g., http://www.as.harvard.edu/chemistry/trop/recentpapers.html). Until now, themodel incorporates a relatively simple representation of mixing inthe PBL. It assumes that tracers are fully mixed within the PBL, i.e.,the volume mixing ratio for any given tracer is constant below thePBL top at each simulation time step. Also, effects of surface emis-sions and dry depositions are distributed uniformly throughout thePBL. As discussed in Section 2.1, this assumption tends to over-estimate vertical mixing except under conditions where the PBL isextremely unstable. This deficiency has significant consequencesfor a range of applications of the model. To improve the simulationof PBL mixing in GEOS-Chem, the non-local mixing schemeformulated by Holtslag and Boville (1993) was implementedrecently; and it received enormous interests across the GEOS-Chemcommunity. Using MOZART simulations, Lin et al. (2008) showedthat the Holtslag and Boville (1993) scheme reduces biases forsurface ozone during nighttime by as much as 15 ppb over the U.S.in summer 1999, as compared to the full-mixing assumption. Thispaper extends our previous work by analyzing impacts of theimproved PBL representation for GEOS-Chem simulations froma variety of aspects, including vertical distributions of gaseoustracers in the lower troposphere, diurnal variation of surface airpollution, and implications for model applications (see below).
Improvements in the representation of PBL mixing in GEOS-Chem have important implications for applications to the inter-pretation of satellite remote sensing data for tropospheric airpollution. Satellite remote sensing has been used intensively in theanalysis of surface and tropospheric gaseous tracers, especially inregions where ground and airborne measurements are scarce(Martin et al., 2003, 2006; Boersma et al., 2004; Jaegle et al., 2005;Zhang et al., 2006; Emmons et al., 2007, 2009; Wang et al., 2007;Boersma et al., 2008b; Martin, 2008; Millet et al., 2008; van der Aet al., 2008; Zhang et al., 2008; Lin et al., 2009; Mijling et al.,2009; Zhao and Wang, 2009). Satellite instruments measure
ultraviolet, visible or infrared radiation from the top of the atmo-sphere affected by absorption by specific gaseous tracers. Theobserved radiance is converted to derive vertical column densities(VCDs) of the tracers (e.g., O3, NO2, HCHO, etc.) (Martin et al., 2003,2006; Boersma et al., 2004; Ziemke et al., 2006; Boersma et al.,2007; Millet et al., 2008) or mixing ratios at particular altitudes(e.g., O3 and CO) (Zhang et al., 2006; Emmons et al., 2007, 2009).The sensitivity of satellite observed radiation to changes in tracerconcentrations depends on altitude as well as on other factors(Boersma et al., 2004, 2007; Zhang et al., 2006). This dependence isrepresented in terms of the so-called ‘averaging kernel’. RetrievedVCDs or mixing ratios provide therefore a proxy for actual VCDs ormixing ratios. To analyze characteristics (sources, sinks, etc.) oftracers, retrieval products are compared with counterparts derivedfrom independent CTM simulations. To minimize the impact of thedependence of satellite sensitivity on altitude, simulated concen-trations of tracers at different altitudes are multiplied by theaveraging kernel in deriving proxies for simulated VCDs or mixingratios corresponding to the retrievals (Boersma et al., 2004; Zhanget al., 2006; Lin et al., 2009). This results in a dependence of proxysimulated VCDs or mixing ratios on the vertical shape of tracerconcentrations as defined by the model. Since the modeled verticalshape is sensitive to PBL mixing, the newly implemented non-localscheme is expected to enhance the performance of GEOS-Chem inapplications to satellite remote sensing. This study analyzes theeffect of the two PBL mixing representations on the GEOS-Cheminterpretation of satellite NO2 data used in deriving surface emis-sions of nitrogen oxides (NOx h NO þ NO2). GEOS-Chem has beenemployed extensively in such inverse modeling studies (Martinet al., 2003, 2006; Jaegle et al., 2005; Wang et al., 2007; Lin et al.,2009). The impact of PBL mixing is particularly significant for thisapplication, as NOx is concentrated in the lower troposphere wherethe influence of PBL mixing is greatest.
Descriptions of GEOS-Chemare presented in Section 2, includinga detailed analysis of the two PBL schemes. Section 3 illustrates theimpact of the treatment of PBL mixing on the simulation of verticaldistributions of air tracers in the lower troposphere, using aircraftmeasurements over the U.S. and Canada in summer 2004. Section 4evaluates the impact of the different PBL schemes on the simulationof diurnal variations of surface air pollution over the U.S. The non-local scheme is found to result in simulations significantly improvedrelative to results derived using the full mixing assumption.Implications of the improved PBL mixing representation for appli-cations to the interpretation of satellite remote sensing data areillustrated in Section 5, where GEOS-Chem and satellite NO2 dataare used to estimate themagnitude of anthropogenic NOx emissionsin China. Concluding remarks are presented in Section 6.
2. Model
GEOS-Chem (v08-01-01; http://www.as.harvard.edu/chemistry/trop/geos/) is driven by the GEOS-5 assimilation of meteorologicaldata from theNASAGlobalModeling andAssimilationOffice. It is runat a resolution of 2� lat by2.5� longwith 47 vertical layers, each of thelowest 10 layers having a thickness ofw130m. All of the simulationsin this study were conducted using full HOxeNOxeVOCeCOeOx
chemistry.Anthropogenic emissions of gaseous tracers were taken from
the global dataset EDGAR (Olivier and Berdowski, 2001), replacedby regional emission inventories over specific regions. The NEI99emission dataset is adopted for the U.S., but with emissions for NOxfrom power plants and industry reduced by 50% (Hudman et al.,2007) and with emissions for CO from all anthropogenic sourcesreduced by 60% (Hudman et al., 2008) over the eastern U.S. TheINTEX-B emission inventory for 2006 (Zhang et al., 2009) is used for
J.-T. Lin, M.B. McElroy / Atmospheric Environment 44 (2010) 1726e17391728
Asia, distinguishing four major sectors: industry, power plants,transportation, and residential.
Emissions from biomass burning are taken from the GFED2dataset (van der Werf et al., 2006). Emissions of NOx from soil arecalculated using the scheme introduced by Yienger and Levy(1995). Emissions of NOx from lightning are evaluated using thescheme presented by Price et al. (1997), adopting the ‘C’ shapeprofile proposed by Pickering et al. (1998).
2.1. PBL mixing schemes
Up to now, all versions of GEOS-Chem have assumed full mixingin the PBL. Concentrations, surface emissions, and dry depositionsfor individual species are assumed to be distributed evenly belowthe top of the PBL as specified in meteorological datasets (GEOS-5here). This results in the strongest possible PBL mixing under allpossible meteorological conditions. The assumption is reasonablewhen the actual PBL is extremely unstable, e.g., for a hot summerafternoon over the U.S. Midwest under cloud free conditions. It willseriously overestimate, however, vertical mixing when the PBL ismodestly or weakly unstable, neutral, or stable, e.g., for a coolsummer night with clear sky and weak winds.
The non-local scheme evaluates the extent of vertical mixingwithin the PBL taking into account the magnitude of the instability.The detailed formulation and description of the scheme were
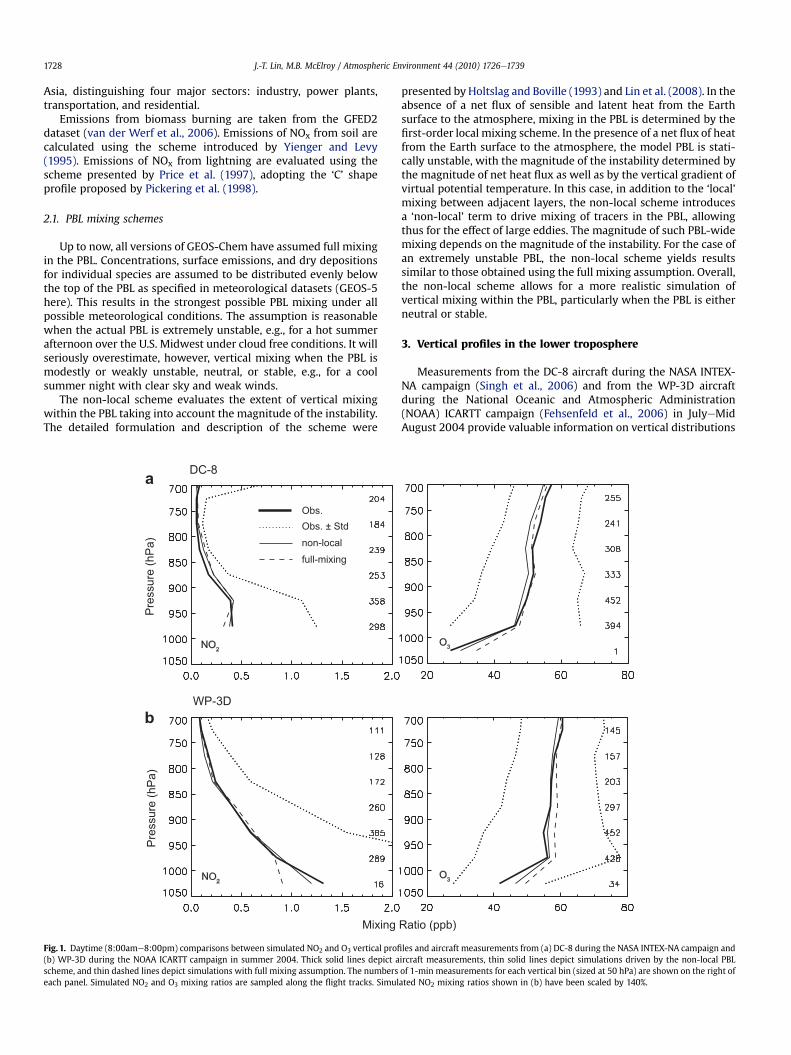
Fig. 1. Daytime (8:00ame8:00pm) comparisons between simulated NO2 and O3 vertical profi(b) WP-3D during the NOAA ICARTT campaign in summer 2004. Thick solid lines depict ascheme, and thin dashed lines depict simulations with full mixing assumption. The numberseach panel. Simulated NO2 and O3 mixing ratios are sampled along the flight tracks. Simul
presented by Holtslag and Boville (1993) and Lin et al. (2008). In theabsence of a net flux of sensible and latent heat from the Earthsurface to the atmosphere, mixing in the PBL is determined by thefirst-order local mixing scheme. In the presence of a net flux of heatfrom the Earth surface to the atmosphere, the model PBL is stati-cally unstable, with the magnitude of the instability determined bythe magnitude of net heat flux as well as by the vertical gradient ofvirtual potential temperature. In this case, in addition to the ‘local’mixing between adjacent layers, the non-local scheme introducesa ‘non-local’ term to drive mixing of tracers in the PBL, allowingthus for the effect of large eddies. The magnitude of such PBL-widemixing depends on the magnitude of the instability. For the case ofan extremely unstable PBL, the non-local scheme yields resultssimilar to those obtained using the full mixing assumption. Overall,the non-local scheme allows for a more realistic simulation ofvertical mixing within the PBL, particularly when the PBL is eitherneutral or stable.
3. Vertical profiles in the lower troposphere
Measurements from the DC-8 aircraft during the NASA INTEX-NA campaign (Singh et al., 2006) and from the WP-3D aircraftduring the National Oceanic and Atmospheric Administration(NOAA) ICARTT campaign (Fehsenfeld et al., 2006) in JulyeMidAugust 2004 provide valuable information on vertical distributions
les and aircraft measurements from (a) DC-8 during the NASA INTEX-NA campaign andircraft measurements, thin solid lines depict simulations driven by the non-local PBLof 1-min measurements for each vertical bin (sized at 50 hPa) are shown on the right ofated NO2 mixing ratios shown in (b) have been scaled by 140%.

J.-T. Lin, M.B. McElroy / Atmospheric Environment 44 (2010) 1726e1739 1729
of various tracers in the lower troposphere. The DC-8 flightscovered a large portion of the U.S. and southern Canada, measuringtracers at a height of several hundred meters or more above theground. The WP-3D flights focused significantly on the NortheastU.S. with particular attention to studying the vertical distributionsof tracers in the PBL. Detailed flight track information was pre-sented by Hudman et al. (2007). In this section, 1-min average datafor NO2 and O3 from DC-8 and WP-3D were used to evaluate theimpact of different representations of PBL mixing in GEOS-Chemon the simulation of vertical profiles for key tracers in the lowertroposphere (Figs. 1 and 2). NO2 was measured by Laser InducedFlorescence on the DC-8 (Bertram et al., 2007) and by photolysis-chemiluminescence on the WP-3D (Ryerson et al., 1999); while O3was measured by NO/O3 chemiluminescence on both aircrafts(Ryerson et al., 1998; Avery et al., 2001). Concentrations of thedifferent tracers were evaluated along the flight tracks using themodel to ensure consistent comparison with measurements.
Several criteria were used to select measurement data forappropriatemodel evaluation. Sincewe focus on vertical profiles, wechose to emphasize measurements taken when the aircrafts wereeither descending or ascending. Specifically, for a given measure-ment, if the maximum andminimum altitudes of the aircraft within2.5 min (both forward and backward) differ by less than 50 m, thecorresponding measurements were excluded from the analysis. Inaddition,measurementswith anO3/CO concentration ratio of 1.25 orlarger were excluded to eliminate the influence of stratospheric air
Fig. 2. Nighttime (8:00pme8:00am) comparisons between simulated NO2 and O3 vertical pand (b) WP-3D during the NOAA ICARTT campaign in summer 2004. Thick solid lines depictscheme, and thin dashed lines depict simulations with full mixing assumption. The numberseach panel. Simulated NO2 and O3 mixing ratios are sampled along the flight tracks. Simul
intrusions (Hudman et al., 2007). And measurements with HCNmixing ratios larger than 500 ppt or CH3CNmixing ratios larger than225 ppt were also excluded in order to eliminate the influence offresh wildfire plumes (Hudman et al., 2007).
To enhance comparisons with theWP-3D data for NO2, a specialadjustment was imposed on profiles simulated with both PBLschemes. The present study uses anthropogenic emissions of NOxestimated by Hudman et al. (2007) for the U.S., which are muchlower than the NEI99 emissions. For the Northeast U.S., the loweremissions are inconsistent with findings of Martin et al. (2006) whosuggested that the NEI99 dataset underestimated NOx emissionsfor this region. Hudman et al. (2007) concluded that large uncer-tainties are associated with NOx emissions for the Northeast U.S.Using the reduced emissions proposed by Hudman et al. (2007),NO2 concentrations simulated here are much lower than the WP-3D measurements at all altitudes in the lower troposphere. None-theless, the magnitude of surface emissions is expected to havea relativelyminor impact on the shape of the vertical profile for NO2over the Northeast U.S., which is determined mainly by PBL mixing.Thus we scaled the simulated NO2 concentrations by an arbitrary140% to match the observed NO2 burden below 700 hPa from WP-3D; no such adjustment was applied for purposes of comparisonwith the DC-8 data. A sensitivity simulation using the non-localscheme, in which anthropogenic and soil emissions of NOx werescaled by 140% over the region of 83.75�We58.75�W and37�Ne51�N, resulted in a vertical distribution of NO2 below 700 hPa
rofiles and aircraft measurements from (a) DC-8 during the NASA INTEX-NA campaignaircraft measurements, thin solid lines depict simulations driven by the non-local PBLof 1-min measurements for each vertical bin (sized at 50 hPa) are shown on the right ofated NO2 mixing ratios shown in (b) have been scaled by 140%.

J.-T. Lin, M.B. McElroy / Atmospheric Environment 44 (2010) 1726e17391730
that is essentially the same as the corresponding simulation basedon the arbitrary 140% scaling assumption (Fig. 3). This indicates thatthe shape of the vertical profile of NOx in the lower troposphereover the Northeast U.S. is relatively independent of the magnitudeof surface emissions, and that scaling NO2 concentrations by 140%represents an appropriate adjustment for the purpose of evaluatingthe PBL schemes.
Figs. 1 and 2 compare observed and modeled vertical distribu-tions below 700 hPa for NO2 and O3. Simulated NO2 profiles arescaled by 140% for comparison with WP-3D measurements. Tracerconcentrations at different heights were averaged into severalvertical intervals with a depth of 50 hPa in each interval. Compar-isons were selected to separately reflect daytime (8:00ame8:00pmlocal time; Fig. 1) and nighttime (8:00pme8:00am; Fig. 2) condi-tions in order to differentiate vertical profiles of tracers underdifferent states of the PBL.
3.1. Daytime (8:00ame8:00pm)
During the daytime (Fig. 1), the observed profile for NO2 indi-cates a rapid reduction in concentration with increasing height,from 0.4 ppb at 975 hPa to 0.1 ppb at 800 hPa for DC8 measure-ments and from 1.3 ppb below 1000 hPa to 0.2 ppb at 800 hPa forWP-3D. This is due to the short lifetime of NO2 combined with thefact that NOx in the lower troposphere is derived primarily fromemissions at the surface. The simulation driven by the non-localscheme compares well with the observed data, with a compara-tively small bias below 900 hPa. From 900 hPa to 700 hPa, themodeled NO2 concentrations exceed the DC8 values while beingslightly lower than the WP-3D measurements. By comparison, thesimulation assuming full PBL mixing yields lower NO2 concentra-tions near the surface as compared with either measurement set.Comparisons with WP-3D measurements clearly indicate that thefull mixing assumption underestimates the vertical gradient of NO2in the lower troposphere.
Fig. 3. Comparisons of NO2 vertical profiles during the daytime (8:00ame8:00pm)between the simulation with resulted NO2 mixing ratio arbitrarily scaled by 140% (thinsolid line) and the sensitivity simulation with anthropogenic and soil emissions of NOx
scaled by 140% (thin dashed line). The non-local mixing scheme is used in bothsimulations, and modeled NO2 mixing ratios are sampled along the flight tracks of WP-3D. Also presented are measurements from WP-3D (thick solid line). The numbers of1-min measurements for each vertical bin (sized at 50 hPa) are shown on the right.
Observed profiles for O3 indicate a gradual increase of concen-tration with height (Fig. 1). This feature is caused mainly by thevertical gradient of O3 in the morning; in the afternoon, O3 is rela-tively well mixed in the PBL (see also Lin et al., 2008). The non-localscheme results in concentrations 3e5 ppb higher than measure-ments from both aircrafts below 1000 hPa. Above 1000 hPa, modelconcentrations ofO3 are up to 4ppb lower thanvalues observed fromtheDC8,while close tomeasurements by theWP-3D. Bycomparison,the simulation assuming full mixing in the PBL results in concen-trations of O3 1e5 ppb larger than values obtained using the non-local scheme. This is because the non-local scheme results in lessefficient and more realistic production of ozone (Lin et al., 2008).
The underestimate of O3 above 1000 hPa using the non-localscheme relative to the DC8measurements is attributed primarily toan underestimate of wildfire emissions in Alaska and Canada thatimpacted background ozone concentrations during the period ofaircraft measurements. The best estimate for wildfire emissions ofCO in summer 2004 is approximately 30 Tg (Turquety et al., 2007),approximately twice the magnitude implied by the GFED2 datasetadopted here. In a sensitivity simulation, emissions from biomassburning were doubled, resulting in little underestimate of O3 atmost altitudes relative to the DC-8 measurements (Fig. 4). Mean-while, the ozone bias was decreased (increased) above (below)800 hPa by 0e2 ppb as compared to the WP-3D measurements(Fig. 4). It is expected that if biomass burning emissions weredoubled, the full mixing assumption would lead to an overestimateof O3 concentrations in the lower troposphere as compared to bothmeasurement datasets. The sensitivity simulation indicates alsothat the underestimate of wildfire emissions has little influence onprofiles derived for NO2, a consequence of the short lifetime of NOx.
The likely underestimate of NOx emissions over the NortheastU.S. affects also the simulations of O3. As shown in Fig. 5, thesensitivity simulation with NOx emissions scaled by 140% resultedin a 2e5 ppb increase in O3 concentrations in the lower tropo-sphere over the Northeast U.S., an increase of w2 ppb near thesurface. Nonetheless, the non-local scheme persists in producinga bias smaller than that derived using the full mixing assumption.
3.2. Nighttime (8:00pme8:00am)
The DC-8measurementswere takenmainly during daytime. Thenumber of nighttime measurements is consequently insufficient toallow definite conclusions to be drawn as to the relative merits ofthe two PBL schemes (Fig. 2a). The WP-3D measurements indicatea much larger vertical gradient at night as compared to day for bothtracers (Fig. 2b). The observed NO2 mixing ratio decreases fromw3.3 ppb below 1000 hPa to 0.3 ppb at 800 hPa, while O3 increasesfrom 30 ppb below 1000 hPa to more than 60 ppb at 800 hPa.Vertical gradients of NO2 calculated using both PBL schemes areweaker than the observation. Simulated results for O3 are in muchbetter agreement with the WP-3D measurements below 800 hPawhen the non-local scheme is used, with the bias near the surfacew7 ppb smaller than the simulation assuming full PBL mixing.
3.3. Summary
Overall, the non-local scheme is found to improve GEOS-Chemsimulations of the vertical distributions of NO2 and O3 in the lowertroposphere, as indicated by comparisons with aircraft measure-ments from the DC-8 and WP-3D. The improvement in NO2 simu-lations is most significant during daytime, especially in terms of theshape of the vertical profile. The enhancement for O3 persiststhroughout the day, especially near the surface. These improve-ments impact not only simulations of surface air pollution, but haveimportant implications also for applications of the model to

Fig. 4. Comparisons of O3 vertical profiles during the daytime (8:00ame8:00pm) between the simulation with GFED2 biomass burning emissions (thin solid lines) and thesensitivity simulation with 2 times GFED2 biomass burning emissions (thin dashed lines). The non-local mixing scheme is used in both simulations, and modeled O3 mixing ratiosare sampled along the flight tracks. Also presented are the aircraft measurements (thick solid lines). The numbers of 1-min measurements for each vertical bin (sized at 50 hPa) areshown on the right of each panel.
J.-T. Lin, M.B. McElroy / Atmospheric Environment 44 (2010) 1726e1739 1731
analysis of satellite remote sensing data. In particular, the improvedvertical shape of daytime NO2 concentrations has importantconsequences for inverse modeling of NOx emissions using satelliteNO2 retrievals, as discussed in Section 5.
4. Diurnal variation of surface air pollution
Vertical mixing in the PBL has important influences on themagnitude and temporal variability of surface air pollution. Thissection analyzes differences in GEOS-Chem simulations of thediurnal variation of surface O3 obtained using the different PBLschemes for July 2004 over four U.S. regions: Northeast, Midwest,Southeast, and Southwest. Rural site measurements from the U.S.Environmental Protection Agency (EPA) Air Quality System (AQS)are used for model evaluations. Following Lin et al. (2008),observed O3 concentrations at all sites within the boundaries ofa given model gridcell were averaged to represent measurementsfor the gridcell; and gridcells with available observations wereaveraged in calculating regional mean O3 concentrations.
As shown in Fig. 6, O3 concentrations exhibit a maximum duringtheafternoonresultingprimarily fromfastphotochemicalproduction
Fig. 5. Comparisons of O3 vertical profiles between the simulationwith NOx emissions un-scaof NOx scaled by 140% (thin dashed line). The non-local mixing scheme is used in both simulapresented are measurements from WP-3D (thick solid line). The numbers of 1-min measure
driven by strong solar radiation, high temperature, and largeanthropogenic and natural emissions of precursors. They exhibita minimum around sunrise reflecting titration by NOx and the influ-ence of dry deposition during the night. Weak nighttime PBL mixinginhibits transport to the surface of air plumes with high O3 contentfrom higher altitudes. The non-local scheme predicts weaker andmore realistic mixing at night as compared with the full-mixingassumption, resulting in lower concentrations of ozone near thesurface. As a consequence, the positive bias of the model at night isreduced by up to more than 10 ppb over the four regions. During theafternoon, both schemes simulate strong mixing in the PBL; resultsfor O3 are consequently similar. Nonetheless, the non-local scheme isfound to produce more realistic results as compared with the full-mixing assumption, with 2e5 ppb less bias over the Midwest,Northeast and Southeast. Simulations with both schemes over theSouthwest underestimate observed O3 concentrations in the after-noon. The dependence ofmodel results on the different PBL schemesfound here is similar to that presented by Lin et al. (2008) usingMOZART.
The overall performance of GEOS-Chem for simulation of surfaceozone is similar to that of MOZART (Lin et al., 2008). Depending on
led (thin solid line) and the sensitivity simulationwith anthropogenic and soil emissionstions, and modeled O3 mixing ratios are sampled along the flight tracks of WP-3D. Alsoments for each vertical bin (sized at 50 hPa) are shown on the right of each panel.

Local Time (hour)Local Time (hour)
)bpp( oitaR gnixi
M Mix
ing
Rat
io(p
pb)
Northeast: 81.25W-66.25W, 37N-47NNortheast: 81.25W-66.25W, 37N-47N Midwest: 101.25W-81.25W, 37N-51NMidwest: 101.25W-81.25W, 37N-51N
Southeast: 101.25W-73.75W, 29N-37NSoutheast: 101.25W-73.75W, 29N-37N Southwest: 126.25W-101.25W, 29N-43NSouthwest: 126.25W-101.25W, 29N-43N
Obs.non-localfull-mixing
Fig. 6. Observed and simulated monthly mean diurnal variations of surface ozone concentrations over various regions of the U.S. in July 2004. Thick solid lines depict rural sitemeasurements from the U.S. EPA AQS, thin solid lines depict simulations driven by the non-local PBL scheme, and thin dashed lines depict simulations with full mixing assumption.Boundary specifications of the regions are visualized in Fig. 7a.
J.-T. Lin, M.B. McElroy / Atmospheric Environment 44 (2010) 1726e17391732
the choice of PBL scheme, the model overestimates peak ozoneconcentrations in the afternoon by 10e15 ppb over the eastern U.S.(Fig. 6). Biases are found also in the spatial distributions ofmaximum daily 8-h average ozone concentrations (Fig. 7a). Thesemay be related to an overestimate of mixing of NOx and volatileorganic compounds (VOCs) (isoprene in particular), due to thecoarse spatial resolution of themodel, resulting thus in an enhancedefficiency for ozone production (Wild and Prather, 2006; Lin et al.,2008). Also, it is likely that dry deposition of ozone in summerover the easternU.S. is underestimatedbyat least 30% on the basis ofthe Wesely (1989) scheme used in GEOS-Chem (Wesely and Hicks,2000; Lin et al., 2008) Lin et al. (2008) found that a 30% increasein ozone dry deposition reduces ozone biases by 2e6 ppb over theeastern U.S. Furthermore, nighttime concentrations of ozone areoverestimated in GEOS-Chem by 15e20 ppb over the Southeast,evenwith use of the non-local scheme (Fig. 6). This overestimate canbe attributed partially to the large biases along the south andsoutheast coasts where the coarse resolution of the model isinsufficient to capture the land-ocean contrast (Fig. 7b). Similarbiases are found in simulations using MOZART (Lin et al., 2008).
5. Implications for inverse modeling of NOx emissionsusing satellite NO2 retrievals
This section evaluates impacts of PBL mixing representations inGEOS-Chem on results derived for inverse modeling of anthropo-genic NOx emissions based on satellite retrievals of troposphericNO2 VCDs. GEOS-Chem simulations driven by the full mixingassumption have been used widely in such inverse modelingstudies (Martin et al., 2003, 2006; Jaegle et al., 2005; Wang et al.,2007). Lin et al. (2009) presented the first application of themodel using the non-local scheme. Two satellite level-2 NO2 VCDdatasets from the Royal Netherlands Meteorological Institute(KNMI) were used in this analysis, including GOME-2 (versionTM4NO2A v1.10) (Boersma et al., 2004) and OMI (version DOMINOv1.0.2) (Boersma et al., 2007). GOME-2 is onboard the satelliteMetOp-A with an overpass time of w9:30am local time, with OMIon AURA with an overpass time of w1:30pm. Similar retrieval
methods were used to derive the two NO2 products (Boersma et al.,2004, 2007; Lin et al., 2009). Here the level-2 data were griddedonto 2� lat � 2.5� long to facilitate comparison with GEOS-Chemsimulations. Details of the retrievals are given by Lin et al. (2009).
Topedown emissions from anthropogenic sources in East Chinaare derived here for July 2008 and January 2009; they are used toevaluate the influence of the different PBL mixing representationson results from such inversemodeling studies, including impacts onconclusions drawn concerning the seasonality of emissions. OMIdata are available since October 2004; GOME-2 data since April2007. We focus on East China (103.75�Ee123.75�E, 19�Ne45�N),where anthropogenic emissions of NOx are large and have increasedrapidly in recent years. Also, individual contributions of anthropo-genic emissions in this region, including their diurnal variations, arereadily available and can be incorporated in the inverse modelingapproach described by Lin et al. (2009) (see Section 5.1).
Spatial distributions of annualmean anthropogenic emissions ofNOx from all sectors over East China as defined in the a prioridataset from the INTEX-B mission are presented in Fig. 8a; theseasonal variation of anthropogenic emissions is not resolved inthis dataset. Emissions are found to be large over industrial andurban centers, including Northern East China, the Yangtze RiverDelta, and the Pearl River Delta, lower over rural areas. The emis-sions arew5.7 TgN yr�1 for East China, representing approximately86% of total Chinese anthropogenic emissions. The best estimate ofdiurnal profiles for individual emission sources (Lin et al., 2009)assumed for INTEX-B emissions is presented in Fig. 8b.
5.1. Inverse modeling approaches
Two inverse modeling approaches are examined. The first wasproposed by Martin et al. (2003). It derives topedown emissionscorresponding to NO2 retrievals by multiplying daily mean emis-sions in the a priori dataset by an amount equal to the ratio ofretrieved to modeled tropospheric NO2 VCDs at the overpass timefor the satellite (see Eq. (3) in Martin et al. (2003)). In this approach,NO2 retrievals from a single satellite instrument are used for eachderivation. Also, diurnal variations of anthropogenic NOx emissions

Fig. 7. Observed and simulated monthly mean (a) maximum and (b) minimum daily 8-h average ozone concentrations over the U.S. in July 2004. Gridcells with no observations areshown in gray. The dark pink boxes in (a) (left panel) specify the lateral boundaries of the regions used in Fig. 6. (For interpretation of the references to colour in this figure legend,the reader is referred to the web version of this article.)
J.-T. Lin, M.B. McElroy / Atmospheric Environment 44 (2010) 1726e1739 1733
are determined by the prescribed temporal profiles used in CTMs.Lin et al. (2009) found that the prescribed profiles may not repre-sent the best understanding of temporal variations of NOx emis-sions for many regions, including China. An alternate approach wasproposed incorporating multiple satellite NO2 instrumentsobserving the atmosphere at different times of day, using differ-ences in retrieved NO2 VCDs between the instruments to estimateNOx emissions. Topedown emissions from individual anthropo-genic sources are derived simultaneously. The formulation of thisapproach accounts explicitly for diurnal variations of NOx emissionsand concentrations (see Eqs. (7)e(9) in Lin et al. (2009)). Inparticular, since diurnal profiles of NOx emissions are definedexplicitly in the formulation, they are independent of the profilesprescribed in CTMs. In this study, the same profiles (Fig. 8b) areused both for GEOS-Chem simulations and in the topedownformulation. Detailed derivations and comparisons of the twoapproaches are given by Martin et al. (2003) and Lin et al. (2009).
The Lin et al. approach can be improved further as follows. Fora given model gridcell, the approach derives topedown emissionsbased on the weighted difference in retrieved NO2 VCDs betweenOMI and GOME-2, i.e., OMI � K � GOME-2, where K is a weightingfactor equal to the residual fraction of the VCDs observed by GOME-2 at the overpass time of OMI after all loss processes during the timeperiod (see Eq. (6) in Lin et al. (2009)). If this weighted difference islarger (smaller) than its counterpart derived from GEOS-Chemsimulations, topedown total emissions will be larger (smaller) thana priori values. Thus the magnitude of topedown emissions is non-linearly related to either retrieval product. In other words, retrieved
VCDs higher than model values might be expected to lead to lowervalues for topedown as compared to a priori emissions; whileretrievals lower than modeled VCDs might lead to topedownemissions larger than a priori values. In estimating emissions fromanthropogenic sources, it is expected that the actual anthropogenicemissions will be most likely larger than a priori values if retrievedVCDs from GOME-2 and OMI are both larger than 120% of corre-sponding model results. Consequently, the final topedownanthropogenic emissions are set as the largest of the a priori and thetopedown estimate using the original Lin et al. approach. Concur-rently, the final topedown anthropogenic emissions are set not toexceed the a priori values if VCDs modeled at both times of day aregreater than 120% of corresponding retrievals.
Satellite retrievals cannot be used alone to differentiate contri-butions from individual emission sources. To derive topedownemissions of NOx from anthropogenic sources, assumptions aremade on natural emissions in East China. In the topedown dataset,lightning emissions are assumed to be the same as those used inGEOS-Chem,w0.37 TgN yr�1 in July 2008 and negligible for January2009. Emissions from soil are taken to be twice as large as emissionsadopted inGEOS-Chembased onprevious studies (Wanget al., 2004,2007; Jaegle et al., 2005; McElroy andWang, 2005; Zhao andWang,2009). As such, soil emissions for July 2008 arew0.56 TgNyr�1 in thea priori dataset as compared to 1.12 TgNyr�1 in the topedown result;they are insignificant in January 2009. Emissions from aircraft andbiomass burning are assumed to be the same as those used in GEOS-Chem, and their contributions are negligible over East China. Thesame assumptions were made by Lin et al. (2009).

Fig. 8. Spatial distributions of annual mean total anthropogenic emissions of NOx inEast China from the INTEX-B dataset (a) and corresponding diurnal profiles for indi-vidual emission sectors (b). These diurnal profiles are used for both GEOS-Chemsimulations and the formulation of the Lin et al. inversing modeling approach. In (a),gridcells not covering Chinese lands or with no emissions are shown in gray.
J.-T. Lin, M.B. McElroy / Atmospheric Environment 44 (2010) 1726e17391734
5.2. Topedown anthropogenic emissions
Table 1 compares topedown estimates of anthropogenic emis-sions for NOx in East Chinawith bottomeup estimates. For July 2008,topedown anthropogenic emissions calculated by the Martin et al.method are about 7.5 TgN yr�1 using the OMI retrievals for inversemodeling and 9.5 TgN yr�1 for GOME-2 if GEOS-Chem is driven by
Table 1Bottomeup and topedown estimates of anthropogenic emission budgets for NOx in Eas
Bottomeupa Topedown
Full mixing in the PBL
OMI (Mb) GOME-2 (M)
July 2008 (TgN yr�1) 5.9 7.7 8.8January 2009 (TgN yr�1) 6.8 9.9 12.8JanuaryeJuly ratio 116% 129% 146%
a The bottomeup estimates are derived by increasing the annual mean emissions bysuperimposed such that emissions in July and January are 5% lower and 10% higher than
b The letter ‘M’ denotes the inverse modeling approach proposed by Martin et al. (200
the non-local PBL scheme. Assuming full PBL mixing in GEOS-Chem,the Martin et al. method results in a NOx emission budget of7.7 TgN yr�1 relative to OMI and 8.8 TgN yr�1 relative to GOME-2, 3%larger and 7% lower, respectively, than results obtained using thenon-local PBL scheme. Using the Lin et al. approach, the full mixingassumption implies emissions of 7.4 TgN yr�1 for East China, about12% larger than values obtained using the non-local scheme.
For January 2009 (Table 1), the non-local scheme results ina budget of 11.3 TgN yr�1 for OMI, 14.8 TgN yr�1 for GOME-2, overEast China, as estimated using the Martin et al. method. Using theLin et al. approach, topedown emissions are estimated at8.0 TgN yr�1. Compared to the non-local scheme, the full mixingassumption leads to a budget from OMI (GOME-2) using the Martinet al. method that is 12% (14%) lower; emissions derived are 8%lower when the Lin et al. method is used.
The a priori emissions from the INTEX-B dataset suggest emis-sions of 5.7 TgN yr�1 for East China in 2006, with no seasonality.Assuming that Chinese anthropogenic emissions increased from2006 to 2008 at a rate of 8% per year as projected from the trend inearlier years (Zhao and Wang, 2009), the bottomeup emissions for2008 estimated using the INTEX-B dataset would bew6.7 TgN yr�1,about 17% larger than the a priori. Due to emission controlmeasurestargeting the 2008 Beijing Olympics and the 11th Five Year Plan,which have been enforced more strictly since 2007 (http://www.mep.gov.cn/info/gw/gg/200703/t20070302_101268.htm; http://news.xinhuanet.com/newscenter/2009-04/22/content_11233585.htm), the actual emissions for 2008 may be lower than 6.7 TgN yr�1
(Lin et al., 2009). Our best estimate for emissions in 2008 derivedfrom the bottomeup dataset is w6.2 TgN yr�1, 8% larger than thea priori. Additionally, previous bottomeup estimates suggested thatanthropogenic emissions of NOx were w5% lower in July ascompared with the annual mean and w10% higher in January; theseasonality is due primarily to sources related to domestic heating(Streets et al., 2003; Zhang et al., 2009). Consequently, our bot-tomeup estimates forNOxemissions for July 2008 and January 2009are 5.9 TgN yr�1 and 6.8 TgN yr�1, respectively (Table 1). Overall, theMartin et al. method results in emission estimates 31e160% higherthan the a priori values, depending on season and on the PBLmixingrepresentations adopted in GEOS-Chem; whereas the Lin et al.method leads to emissions 15e40% larger than the a priori values(Table 1). The topedown estimate incorporating the Lin et al.approach and the non-local scheme, i.e., 6.6 TgN yr�1 for July 2008and 8.0 TgN yr�1 for January 2009, is in good agreement with thebottomeup estimate.
The choice of PBL mixing representation in GEOS-Chem can havea significant impact also on inferences concerning the seasonality ofemissions (Table 1). Incorporating the non-local scheme, the emis-sion budget for East China in January 2009 estimated using theMartin et al. method is 52% (57%) larger than that for July 2008 basedon OMI (GOME-2) retrievals; based on the Lin et al. method, thebudget in January 2009 is 22% greater than that for July 2008.Assuming full PBL mixing in GEOS-Chem, the topedown emissions
t China.
Non-local mixing
GOME-2 þ OMI (L) OMI (M) GOME-2 (M) GOME-2 þ OMI (L)
7.4 7.5 9.5 6.67.3 11.3 14.8 8.099% 152% 157% 122%
8% from the budget in the INTEX-B dataset, on top of which a seasonal variation isthe annual mean, respectively.3), and ‘L’ by Lin et al. (2009).

J.-T. Lin, M.B. McElroy / Atmospheric Environment 44 (2010) 1726e1739 1735
for January 2009 are 29% (46%) larger than for July 2008 based onOMI (GOME-2), as determined using the Martin et al. method;emissions in January 2009 are w1% lower than for July 2008 usingthe Lin et al. inverse modeling approach. The non-local scheme,togetherwith the Lin et al. approach, results in a January-to-July ratioof w122% for anthropogenic NOx emissions, comparable to bot-tomeup estimates ofw116% (Streets et al., 2003; Zhang et al., 2009).
Spatially, the general patterns of topedown emissions aresimilar to those specified in the a priori dataset, independent of PBLschemes and inversemodeling approaches (Figs. 9 and 10). The non-local scheme together with theMartin et al. method leads to higher
Fig. 9. Topedown estimates of NOx emissions for July 2008 derived using Martin et al. and Lithe non-local scheme and the full mixing assumption are presented in (a) and (b), respecti
topedown emissions than the a priori over most regions in bothmonths. Correspondingly, topedown emissions derived using theLin et al.method are closer to a priori values, especially for July 2008.Differences in topedown results between the two PBL schemes areconsistent over most regions. For July 2008, the full mixingassumption using the Martin et al. method leads to higher (lower)emissions relative to the OMI (GOME-2) retrieval than resultsobtained using the non-local scheme, with larger emissions esti-mated on the basis of the Lin et al. method (Fig. 9). For January 2009,it results in lower emissions than estimates associatedwith thenon-local scheme, irrespective of inverse modeling approaches (Fig. 10).
n et al. approaches. Emission distributions relative to GEOS-Chem simulations driven byvely. Gridcells not covering Chinese lands or with no emissions are shown in gray.

Fig. 10. Topedown estimates of NOx emissions for January 2009 derived usingMartin et al. and Lin et al. approaches. Emission distributions relative to GEOS-Chem simulations drivenby the non-local scheme and the full mixing assumption are presented in (a) and (b), respectively. Gridcells not covering Chinese lands or with no emissions are shown in gray.
J.-T. Lin, M.B. McElroy / Atmospheric Environment 44 (2010) 1726e17391736
5.3. Discussion
Both inverse modeling approaches assume that horizontaltransport of NOx has an insignificant impact on topedown esti-mates for individual model gridcells at a resolution of 2� � 2.5�. Theassumption is appropriate for summer when the lifetime of NOx isonly 3e5 h over East China such that only a small fraction of NOx istransported horizontally between adjacent gridcells (Martin et al.,2003, 2006; Lin et al., 2009). In winter, however, the lifetime ofNOx is longer and horizontal transport between adjacent gridcells
may be expected to have an impact on concentrations in individualgridcells and to complicate consequently topedown estimates foremissions (Boersma et al., 2008a). As a result, spatial distributionsof topedown emissions for NOx over East China may be affected bythe neglect of horizontal transport (see more discussions in Linet al., 2009). Nonetheless, estimates for topedown emissionbudgets in East China are not impacted significantly. In a sensitivitytest, topedown emission budgets were derived by applying eachapproach to East China as a whole. As such, effects of horizontaltransport are minimized since transport among gridcells within the

J.-T. Lin, M.B. McElroy / Atmospheric Environment 44 (2010) 1726e1739 1737
region does not affect topedown estimates. The resulting emissionbudgets are within 10% of the corresponding budgets summed overtopedown emissions estimated for individual gridcells.
The NO2 VCDs retrieved from both OMI and GOME-2 are muchlarger than corresponding model results (see Lin et al., 2009).Consequently, topedown emissions derived with the Martin et al.method are 31e160% higher than bottomeup estimates (Table 1),consistent with conclusions in previous studies (Martin et al., 2003,2006; Jaegle et al., 2005; Wang et al., 2007; Zhang et al., 2007).These topedown estimates are also 4e85% larger than estimatesobtained using the Lin et al. method, depending on the choice ofsatellite retrievals and PBL schemes, consistent with the findings ofLin et al. (2009). While it is possible that bottomeup approachesunderestimate Chinese emissions to some extent, the magnitude ofthe underestimate inferred using the Martin et al. method appearsunlikely (Qiang Zhang, Yu Zhao, Yu Lei, personal communication).We speculate that the large emissions estimated based on theMartin et al. method may be due at least in part to errors in theretrieval process contributing most likely to an overestimate of NO2VCDs (Folkert Boersma, personal communication; also see Lin et al.(2009) and references therein). Biases in satellite NO2 VCDs areattributed significantly to systematic errors introduced in theprocess converting satellite observed radiation to troposphericNO2 VCDs (Boersma et al., 2004). These systematic biases lead toconsequent uncertainties in topedown emissions estimated withthe Martin et al. method, which assumes a linear relation betweenNOx emissions and NO2 retrievals. The Lin et al. method, bycomparison, relates NOx emissions to differences in NO2 retrievalsbetween satellite instruments observing the atmosphere at differenttimes of day. Furthermore, systematic biases in GOME-2 and OMINO2 data are most likely consistent as a result of similar retrievalmethods (Lin et al., 2009). Thus impacts of systematic errors inOMI and GOME-2 retrievals may be reduced significantly by thedifferentiation, leading to closer agreement between topedown andbottomeup emissions. This represents an important advantage ofthe methodology highlighted by Lin et al. (2009).
Lin et al. (2009) estimated Chinese anthropogenic emissionsfor July 2008 using the same non-local PBL scheme and satelliteretrievals, and suggested a best estimate of emission budget as5.5 TgN yr�1 for East China. The budget is 16% lower than the estimategiven here for several reasons. First, Lin et al. (2009) did not allowfor a diurnal variation in a priori NOx emissions, while the bestestimate of diurnal profiles for NOx emissions is included in thepresent simulation. Lin et al. (2009) found that applying these diurnalprofiles in GEOS-Chem led to a 9% increase in topedown emissions.The second factor reflects uncertainties in the estimate of lightningemissions, which are taken in Lin et al. (2009) at the climatologicalmean of 0.44 TgN yr�1 for July derived from the OTD/LIS measure-ments during 1995e2005 (Lee Murray, personal communication)but are about 84% of the climatology for purposes of this study.Lin et al. (2009) found that 100%higher lightningemissions led to 15%lower anthropogenic emissions in the topedown dataset. Also, theimprovement on the Lin et al. method introduced in this study hassome impacts on topedown estimates.
6. Concluding remarks
Vertical mixing in the PBL impacts interactions and distributionsof air tracers at different altitudes of the lower troposphere (Stull,2003). Representations of PBL mixing in CTMs influence thesimulation of vertical profiles of air tracers, with importantconsequences for various model studies of tracer sources, sinks andtransport. Up to now, the widely used global CTM GEOS-Chem hasassumed full mixing in the PBL, which tends to overestimatevertical interactions of tracers in the lower troposphere. To improve
the simulation of PBL mixing, the non-local scheme formulated byHoltslag and Boville (1993) was implemented in the CTM as dis-cussed here. This paper analyzes impacts of the non-local schemefor GEOS-Chem simulations of vertical profiles of air tracers,diurnal variations of surface air pollution, and for inverse modelingof NOx emissions using satellite NO2 retrievals.
It is found that the non-local scheme significantly improvessimulations of the vertical shape of NO2 and the magnitude of O3concentrations in the lower troposphere, as evaluated with aircraftmeasurements from the NASA INTEX-NA and the NOAA ICARTTcampaigns in JulyeMid August 2004. In particular, it results ina stronger vertical gradient of NO2 during the day as compared tosimulations using the full mixing assumption, leading to betteragreement with aircraft measurements. Additionally, it reducessimulation biases for the lower tropospheric ozone concentrationsthroughout the day, especially near the surface. Comparisons withthe U.S. EPA AQS measurements suggest that the non-local schememarkedly improves simulations of the diurnal variation of surfaceozone in July 2004 over the U.S. As compared to the full mixingassumption, the non-local scheme reduces biases by more than10 ppb for ozone at night and by 2e5 ppb for peak ozone in theafternoon, consistent with the findings of Lin et al. (2008).
The improvement in the simulation of the vertical shape of NO2
has important implications for applications of GEOS-Chem to theinverse modeling of NOx emissions using satellite NO2 retrievals.Topedown estimates of anthropogenic NOx emissions in East Chinausing the approach proposed by Martin et al. (2003) show, ascompared to the non-local scheme, that the full mixing assumptionleads to a 3% higher (7% lower) budget for July 2008 when OMI(GOME-2) retrievals from KNMI are used for inverse modeling.Corresponding estimates for January 2009 suggest a 12e14% lowerbudget when the full mixing assumption is used to drive the simu-lation. Meanwhile, topedown estimates using the approachproposed by Lin et al. (2009) indicate that the fullmixing assumptionresults in a 12% higher budget in July 2008 and an 8% lower budget inJanuary 2009 as comparedwith results obtained using the non-localscheme. The topedown estimate combining the non-local schemeand the Lin et al. approach indicates emissions of 6.6 TgN yr�1 in July2008 and 8.0 TgN yr�1 in January 2009 for East China, in goodagreement with the bottomeup estimates of 5.9 TgN yr�1 and6.8 TgN yr�1, respectively. The seasonality of topedown emissionsdetermined on the basis of the non-local scheme and the Lin et al.approach is also closest to bottomeup estimates, with a January-to-July ratio of w122% that is similar to the estimates of w116% byStreets et al. (2003) and Zhang et al. (2009).
Accurate simulation of PBL mixing in global and regional CTMsand climate models poses a difficult challenge, reflecting thechaotic nature of turbulence and the simplification of mixingprocesses necessary for timely simulations with limited computa-tional resources (Holtslag, 2002; Stull, 2003; Teixeira et al., 2008).Great efforts have been made to improve the understanding of PBLmixing and the performance of PBL schemes (Teixeira et al., 2008),such as the Global Energy and Water Cycle Experiment (GEWEX)Atmospheric Boundary Layer Study (GABLS) (Holtslag, 2006).Various attempts have been implemented to improve the Holtslagand Boville (1993) scheme and other non-local schemes, includingparameterizations of PBL depth, non-local momentum mixing,eddy diffusion coefficient, and air entrainment at the PBL top(Vogelezang and Holtslag, 1996; Brown and Grant, 1997; vanMeijgaard and van Ulden, 1998; Lock et al., 2000; Noh et al.,2003; Hong et al., 2006; Brown et al., 2008; Sorbjan, 2009). Atpresent, these improvements have not been incorporated intoGEOS-Chem due to complications in the implementation (e.g.,requirement for additional parameters and longer calculation, etc.);they, however, will be considered in future model development.
J.-T. Lin, M.B. McElroy / Atmospheric Environment 44 (2010) 1726e17391738
Meanwhile, the non-local scheme by Holtslag and Boville (1993)provides an easily implemented approach that has been adoptedwidely in a range of state-of-the-art CTMs and climate models. Asdemonstrated here, it results in a more realistic representation ofPBLmixing as comparedwith formulations assuming full mixing. Inconclusion, this newly implemented non-local scheme offers animportant improvement for a range of GEOS-Chem applicationssensitive to the details of PBL mixing, including analysis of datafrom satellite remote sensing.
Acknowledgments
This research is supported by the National Science Foundation,grant ATM-0635548. We thank Melody Avery and Tom Ryerson forthe aircraft data. We thank Bob Yantosca, Shiliang Wu and YuxuanWang for developing the current model with the capability of usingGEOS-5 data. We acknowledge the free use of tropospheric NO2column data from GOME-2 and OMI from www.temis.nl.
References
Avery, M.A., Westberg, D.J., Fuelberg, H.E., Newell, R.E., Anderson, B.E., Vay, S.A.,Sachse, G.W., Blake, D.R., 2001. Chemical transport across the ITCZ in the centralPacific during an El Nino-Southern Oscillation cold phase event in MarcheApril1999. Journal of Geophysical Research 106, 32539e32553.
Bertram, T.H., Perring, A.E., Wooldridge, P.J., Crounse, J.D., Kwan, A.J., Wennberg, P.O.,Scheuer, E., Dibb, J., Avery, M., Sachse, G., Vay, S.A., Crawford, J.H., McNaughton, C.S., Clarke, A., Pickering, K.E., Fuelberg, H., Huey, G., Blake, D.R., Singh, H.B., Hall, S.R., Shetter, R.E., Fried, A., Heikes, B.G., Cohen, R.C., 2007. Direct measurements ofthe convective recycling of the upper troposphere. Science 315, 816e820.
Boersma, K.F., Eskes, H.J., Brinksma, E.J., 2004. Error analysis for tropospheric NO2retrieval from space. Journal of Geophysical Research 109. doi:10.1029/2003JD003962.
Boersma, K.F., Eskes, H.J., Veefkind, J.P., Brinksma, E.J., van der, A.R.J., Sneep, M., vanden Oord, G.H.J., Levelt, P.F., Stammes, P., Gleason, J.F., Bucsela, E.J., 2007. Near-real time retrieval of tropospheric NO2 from OMI. Atmospheric Chemistry andPhysics 7, 2103e2118.
Boersma, K.F., Jacob, D.J., Bucsela, E.J., Perring, A.E., Dirksen, R., Van Der., A.R.J.,Yantosca, R.M., Park, R.J., Wenig, M.O., Bertram, T.H., Cohen, R.C., 2008a. Vali-dation of OMI tropospheric NO2 observations during INTEX-B and application toconstrain NOx emissions over the eastern United States and Mexico. Atmo-spheric Environment 42, 18. doi:10.1016/j.atmosenv.2008.02.004.
Boersma, K.F., Jacob, D.J., Eskes, H.J., Pinder, R.W., Wang, J., Van Der, A.R.J., 2008b.Intercomparison of SCIAMACHY and OMI tropospheric NO2 columns: observingthe diurnal evolution of chemistry and emissions from space. Journal ofGeophysical Research 113, 14. doi:10.1029/2007JD008816.
Brown, A.R., Grant, A.L.M., 1997. Non-local mixing of momentum in the convectiveboundary layer. Boundary-Layer Meteorology 84, 1e22.
Brown, A.R., Beare, R.J., Edwards, J.M., Lock, A.P., Keogh, S.J., Milton, S.F., Walters, D.N.,2008. Upgrades to the boundary-layer scheme in the met office numericalweather prediction model. Boundary-Layer Meteorology 128, 117e132.doi:10.1007/s10546-008-9275-0.
Collins, W.D., Rasch, P.J., Boville, B.A., Hack, J.J., McCaa, J.R., Williamson, D.L.,Briegleb, B.P., Bitz, C.M., Lin, S.J., Zhang, M.H., 2006. The formulation andatmospheric simulation of the Community Atmosphere Model version 3(CAM3). Journal of Climate 19, 2144e2161.
Emmons, L.K., Pfister, G.G., Edwards, D.P., Gille, J.C., Sachse, G., Blake, D., Wofsy, S.,Gerbig, C., Matross, D., Nedelec, P., 2007. Measurements of Pollution in theTroposphere (MOPITT) validation exercises during summer 2004 fieldcampaigns over North America. Journal of Geophysical Research 112.doi:10.1029/2006jd007833.
Emmons, L.K., Edwards, D.P., Deeter, M.N., Gille, J.C., Campos, T., Nedelec, P.,Novelli, P., Sachse, G., 2009. Measurements of Pollution in the Troposphere(MOPITT) validation through 2006. Atmospheric Chemistry and Physics 9,1795e1803.
Fehsenfeld, F.C., Ancellet, G., Bates, T.S., Goldstein, A.H., Hardesty, R.M., Honrath, R.,Law, K.S., Lewis, A.C., Leaitch, R., McKeen, S., Meagher, J., Parrish, D.D., Pszenny, A.A.P., Russell, P.B., Schlager, H., Seinfeld, J., Talbot, R., Zbinden, R., 2006. Interna-tional Consortium for Atmospheric Research on Transport and Transformation(ICARTT): North America to Europe e overview of the 2004 summer field study.Journal of Geophysical Research 111, 36. doi:10.1029/2006jd007829.
Holtslag, A., Boville, B., 1993. Local versus nonlocal boundary-layer diffusion ina global climate model. Journal of Climate 6, 1825.
Holtslag, A.A.M., 2002. Atmospheric boundary layers: modeling and parameteri-zation. In: Encyclopedia of Atmospheric Sciences. Academic Press, pp. 253e261.
Holtslag, B., 2006. Preface e GEWEX Atmospheric Boundary-Layer Study (GABLS)on stable boundary layers. Boundary-Layer Meteorology 118, 243e246.doi:10.1007/s10546-005-9008-6.
Hong, S.Y., Pan, H.L., 1996. Nonlocal boundary layer vertical diffusion in a medium-range forecast model. Monthly Weather Review 124, 2322e2339.
Hong, S.Y., Noh, Y., Dudhia, J., 2006. A new vertical diffusion package with anexplicit treatment of entrainment processes. Monthly Weather Review 134,2318e2341.
Horowitz, L.W., Walters, S., Mauzerall, D.L., Emmons, L.K., Rasch, P.J., Granier, C.,Tie, X.X., Lamarque, J.F., Schultz, M.G., Tyndall, G.S., Orlando, J.J., Brasseur, G.P.,2003. A global simulation of tropospheric ozone and related tracers: descrip-tion and evaluation of MOZART, version 2. Journal of Geophysical Research 108.doi:10.1029/2002jd002853.
Hudman, R.C., Jacob, D.J., Turquety, S., Leibensperger, E.M., Murray, L.T., Wu, S.,Gilliland, A.B., Avery, M., Bertram, T.H., Brune, W., Cohen, R.C., Dibb, J.E.,Flocke, F.M., Fried, A., Holloway, J., Neuman, J.A., Orville, R., Perring, A., Ren, X.,Sachse, G.W., Singh, H.B., Swanson, A., Wooldridge, P.J., 2007. Surface andlightning sources of nitrogen oxides over the United States: magnitudes,chemical evolution, and outflow. Journal of Geophysical Research 112.doi:10.1029/2006jd007912.
Hudman, R.C., Murray, L.T., Jacob, D.J., Millet, D.B., Turquety, S., Wu, S., Blake, D.R.,Goldstein, A.H., Holloway, J., Sachse, G.W., 2008. Biogenic versus anthropogenicsources of CO in the United States. Geophysical Research Letters 35.doi:10.1029/2007gl032393.
Jaegle, L., Steinberger, L., Martin, R.V., Chance, K., 2005. Global partitioning of NOxsources using satellite observations: relative roles of fossil fuel combustion,biomass burning and soil emissions. Faraday Discussion 130. doi:10.1039/b502128f.
Krol, M., Houweling, S., Bregman, B., van den Broek, M., Segers, A., van Velthoven, P.,Peters, W., Dentener, F., Bergamaschi, P., 2005. The two-way nested globalchemistry-transport zoom model TM5: algorithm and applications. Atmo-spheric Chemistry and Physics 5, 417e432.
Lin, J.-T., Youn, D., Liang, X.-Z., Wuebbles, D.J., 2008. Global model simulation ofsummertime U.S. ozone diurnal cycle and its sensitivity to PBL mixing, spatialresolution, and emissions. Atmospheric Environment. doi:10.1016/j.atmosenv.2008.08.012.
Lin, J., McElroy, M.B., Boersma, K.F., 2009. Constraint of anthropogenic NOx emis-sions in China from different sectors: a new methodology using multiplesatellite retrievals. Atmospheric Chemistry and Physics Discussions.
Lock, A.P., Brown, A.R., Bush, M.R., Martin, G.M., Smith, R.N.B., 2000. A newboundary layer mixing scheme. Part I: scheme description and single-columnmodel tests. Monthly Weather Review 128, 3187e3199.
Louis, J.F., Tiedtke, M., Geleyn, J.F., 1982. A Short History of the PBL Parameterizationat ECMWF, ECMWF Workshop on Boundary-Layer Parameterization.
Martin, R.V., Jacob, D.J., Chance, K., Kurosu, T.P., Palmer, P.I., Evans, M.J., 2003. Globalinventory of nitrogen oxide emissions constrained by space-based observations ofNO2 columns. Journal of Geophysical Research 108. doi:10.1029/2003JD003453.
Martin, R.V., Sioris, C.E., Chance, K., Ryerson, T.B., Bertram, T.H., Wooldridge, P.J.,Cohen, R.C., Andy Neuman, J., Swanson, A., Flocke, F.M., 2006. Evaluation ofspace-based constraints on global nitrogen oxide emissions with regionalaircraft measurements over and downwind of eastern North America. Journal ofGeophysical Research 111. doi:10.1029/2005JD006680.
Martin, R.V., 2008. Satellite remote sensing of surface air quality. AtmosphericEnvironment 42, 7823e7843. doi:10.1016/j.atmosenv.2008.07.018.
McElroy, M.B., Wang, Y.X., 2005. Human and animal wastes: implications foratmospheric N2O and NOx. Global Biogeochemical Cycles 19. doi:10.1029/2004GB002429.
Mellor, G.L., Yamada, T., 1982. Development of a turbulence closure-model forgeophysical fluid problems. Reviews of Geophysics 20, 851e875.
Mijling, B., Van Der, A.R.J., Boersma, K.F., Roozendael, M.V., DeSmedt, I., Kelder, H.M.,2009. Reductions of NO2 detected from space during the 2008 Beijing OlympicGames. Geophysical Research Letters 36. doi:10.1029/2009gl038943.
Millet, D.B., Jacob, D.J., Boersma, K.F., Fu, T.M., Kurosu, T.P., Chance, K., Heald, C.L.,Guenther, A., 2008. Spatial distribution of isoprene emissions from NorthAmerica derived from formaldehyde column measurements by the OMI satel-lite sensor. Journal of Geophysical Research 113. doi:10.1029/2007jd008950.
Noh, Y., Cheon, W.G., Hong, S.Y., Raasch, S., 2003. Improvement of the K-profilemodel for the planetary boundary layer based on large eddy simulation data.Boundary-Layer Meteorology 107, 401e427.
Olivier, J.G.J., Berdowski, J.J.M., 2001. Global emissions sources and sinks. In:Berdowski, J.J.M., Guicherit, R., Heij, B.J. (Eds.), The Climate System. A.A. Bal-kema Publishers/Swets & Zeitlinger Publishers, Lisse, The Netherlands.
Pal, J.S., Giorgi, F., Bi, X.Q., Elguindi, N., Solmon, F., Gao, X.J., Rauscher, S.A.,Francisco, R., Zakey, A.,Winter, J., Ashfaq, M., Syed, F.S., Bell, J.L., Diffenbaugh, N.S.,Karmacharya, J., Konare, A., Martinez, D., da Rocha, R.P., Sloan, L.C., Steiner, A.L.,2007. Regional climate modeling for the developing world e the ICTP RegCM3and RegCNET. Bulletin of the American Meteorological Society 88. doi:10.1175/bams-88-9-1395.
Pickering, K.E., Wang, Y., Tao, W.-K., Price, C., Müller, J.-F., 1998. Vertical distributionsof lighting NOx for use in regional and global chemical transport models.Journal of Geophysical Research 103, 14.
Price, C., Penner, J., Prather, M., 1997. NOx from lightning, 1, Global distributionbased on lightning physics. Journal of Geophysical Research 102, 12.
Ryerson, T.B., Buhr, M.P., Frost, G.J., Goldan, P.D., Holloway, J.S., Hubler, G., Jobson, B.T., Kuster, W.C., McKeen, S.A., Parrish, D.D., Roberts, J.M., Sueper, D.T.,Trainer, M., Williams, J., Fehsenfeld, F.C., 1998. Emissions lifetimes and ozoneformation in power plant plumes. Journal of Geophysical Research 103,22569e22583.

J.-T. Lin, M.B. McElroy / Atmospheric Environment 44 (2010) 1726e1739 1739
Ryerson,T.B.,Huey,L.G.,Knapp,K.,Neuman, J.A., Parrish,D.D., Sueper,D.T.,Fehsenfeld, F.C.,1999.Designand initial characterizationof an inlet for gas-phaseNOymeasurementsfrom aircraft. Journal of Geophysical Research 104, 5483e5492.
Singh, H.B., Brune, W.H., Crawford, J.H., Jacob, D.J., Russell, P.B., 2006. Overview ofthe summer 2004 intercontinental chemical transport experiment e NorthAmerica (INTEX-A). Journal of Geophysical Research 111. doi:10.1029/2006jd007905.
Sorbjan, Z., 2009. Improving non-local parameterization of the convective boundarylayer. Boundary-Layer Meteorology 130, 57e69. doi:10.1007/s10546-008-9331-9.
Streets, D.G., Bond, T.C., Carmichael, G.R., Fernandes, S.D., Fu, Q., He, D., Klimont, Z.,Nelson, S.M., Tsai, N.Y., Wang, M.Q., Woo, J.-H., Yarber, K.F., 2003. An inventoryof gaseous and primary aerosol emissions in Asia in the year 2000. Journal ofGeophysical Research 108. doi:10.1029/2002JD003093.
Stull, R.B., 2003. An Introduction to Boundary Layer Meteorology. Kluwer Academic,Boston, p. 670.
Teixeira, J., Stevens, B., Bretherton, C.S., Cederwall, R., Doyle, J.D., Golaz, J.C.,Holtslag, A.A.M., Klein, S.A., Lundquist, J.K., Randall, D.A., Siebesma, A.R.,Soares, P.M.M., 2008. Parameterization of the atmospheric boundary layer.Bulletin of the American Meteorological Society 89, 453e458. doi:10.1175/bams-89-4-453.
Troen, I., Mahrt, L., 1986. A simple-model of the atmospheric boundary-layer esensitivity to surface evaporation. Boundary-Layer Meteorology 37, 129e148.
Turquety, S., Logan, J.A., Jacob, D.J., Hudman, R.C., Leung, F.Y., Heald, C.L.,Yantosca, R.M., Wu, S.L., Emmons, L.K., Edwards, D.P., Sachse, G.W., 2007.Inventory of boreal fire emissions for North America in 2004: importance ofpeat burning and pyroconvective injection. Journal of Geophysical Research112. doi:10.1029/2006jd007281.
van der A, R.J., Eskes, H.J., Boersma, K.F., Noije, T.P.C.v., Roozendael, M.V., DeSmedt, I.,Peters, D.H.M.U., Meijer, E.W., 2008. Trends, seasonal variability and dominantNOx source derived from a ten year record of NO2 measured from space. Journalof Geophysical Research 113. doi:10.1029/2007JD009021.
van derWerf, G.R., Randerson, J.T., Giglio, L., Collatz, G.J., Kasibhatla, P.S., Arellano, A.F.,2006. Interannual variability in global biomass burning emissions from 1997 to2004. Atmospheric Chemistry and Physics 6, 3423e3441.
van Meijgaard, E., van Ulden, A.P., 1998. A first order mixing-condensation schemefor nocturnal stratocumulus. Atmospheric Research 45, 253e273.
Vogelezang, D.H.P., Holtslag, A.A.M.,1996. Evaluation andmodel impacts of alternativeboundary-layer height formulations. Boundary-Layer Meteorology 81, 245e269.
Wang, Y., McElroy, M.B., Wang, T., Palmer, P.I., 2004. Asian emissions of CO and NOx:constraints from aircraft and Chinese station data. Journal of GeophysicalResearch 109. doi:10.1029/2004JD005250.
Wang, Y., McElroy, M.B., Martin, R.V., Streets, D.G., Zhang, Q., Fu, T.-M., 2007.Seasonal variability of NOx emissions over east China constrained by satelliteobservations: implications for combustion and microbial sources. Journal ofGeophysical Research 112. doi:10.1029/2006JD007538.
Wesely, M.L., 1989. Parameterization of surface resistances to gaseous dry deposi-tion in regional-scale numerical-models. Atmospheric Environment 23,1293e1304.
Wesely, M.L., Hicks, B.B., 2000. A review of the current status of knowledge on drydeposition. Atmospheric Environment 34, 2261e2282.
Wild, O., Prather, M.J., 2006. Global tropospheric ozone modeling: quantifyingerrors due to grid resolution. Journal of Geophysical Research 111. doi:10.1029/2005jd006605.
Yienger, J.J., Levy II, H., 1995. Empirical model of global soil-biogenic NOx emissions.Journal of Geophysical Research 100, 18.
Zhang, L., Jacob, D.J., Bowman, K.W., Logan, J.A., Turquety, S., Hudman, R.C., Li, Q.B.,Beer, R., Worden, H.M., Worden, J.R., Rinsland, C.P., Kulawik, S.S., Lampel, M.C.,Shephard, M.W., Fisher, B.M., Eldering, A., Avery, M.A., 2006. OzoneeCOcorrelations determined by the TES satellite instrument in continental outflowregions. Geophysical Research Letters 33. doi:10.1029/2006gl026399.
Zhang, L., Jacob, D.J., Boersma, K.F., Jaffe, D.A., Olson, J.R., Bowman, K.W., Worden, J.R.,Thompson, A.M., Avery, M.A., Cohen, R.C., Dibb, J.E., Flocke, F.M., Fuelberg, H.E.,Huey, L.G., McMillan, W.W., Singh, H.B., Weinheimer, A.J., 2008. Transpacifictransport of ozone pollution and the effect of recent Asian emission increases onair quality in North America: an integrated analysis using satellite, aircraft,ozonesonde, and surface observations. Atmospheric Chemistry and Physics 8, 20.
Zhang, Q., Streets, D.G., He, K., Wang, Y., Richter, A., Burrows, J.P., Uno, I., Jang, C.J.,Chen, D., Yao, Z., Lei, Y., 2007. NOx emission trends for China, 1995e2004: theview from the ground and the view from space. Journal of Geophysical Research112. doi:10.1029/2007JD008684.
Zhang, Q., Streets, D.G., Carmichael, G.R., He, K., Huo, H., Kannari, A., Klimont, Z.,Park, I., Reddy, S., Fu, J.S., Chen, D., Duan, L., Lei, Y., Wang, L., Yao, Z., 2009. Asianemissions in 2006 for the NASA INTEX-B mission. Atmospheric Chemistry andPhysics Discussions 9.
Zhao, C., Wang, Y.H., 2009. Assimilated inversion of NOx emissions over East Asiausing OMI NO2 column measurements. Geophysical Research Letters 36.doi:10.1029/2008gl037123.
Ziemke, J.R., Chandra, S., Duncan, B.N., Froidevaux, L., Bhartia, P.K., Levelt, P.F.,Waters, J.W., 2006. Tropospheric ozone determined from aura OMI and MLS:evaluation of measurements and comparison with the Global Modeling ini-tiative's Chemical Transport Model. Journal of Geophysical Research 111.doi:10.1029/2006jd007089.