Embed Size (px)
Citation preview
20-Nov-12 Page 1 of 46
Impacts of Atmospheric Temperature Trends 1
on Tropical Cyclone Activity 2
3
4
Submitted to Journal of Climate 5
6
7
Gabriel A. Vecchi1, Stephan Fueglistaler2, Isaac M. Held1, 8
Thomas R. Knutson1, Ming Zhao1,3 9
10
1. NOAA/GFDL, Princeton, NJ 08540 USA 11
2. Princeton University, Princeton, NJ 08540 USA 12
3. UCAR, Boulder, CO USA 13
14
20-Nov-12 Page 2 of 46
Abstract 1
Impacts of tropical temperature changes in the upper troposphere (UT) and the tropical 2
tropopause layer (TTL) on tropical cyclone (TC) activity are explored. UT and lower 3
TTL cooling both lead to an overall increase in potential intensity (PI), while 4
temperatures 70hPa and higher have negligible effect. Idealized experiments with a high-5
resolution global model show that lower temperatures in the UT are associated with 6
increases in global and North Atlantic TC frequency, but modeled TC frequency changes 7
are not significantly affected by TTL temperature changes nor do they scale directly with 8
PI. 9
10
Future projections of hurricane activity have been made with models that simulate the 11
recent upward Atlantic TC trends while assuming or simulating very different tropical 12
temperature trends. Recent Atlantic TC trends have been simulated by: i) high-resolution 13
global models with nearly moist-adiabatic warming profiles, and ii) regional TC 14
downscaling systems that impose the very strong UT and TTL trends of the NCEP 15
Reanalysis, an outlier among observational estimates. Impact of these differences in 16
temperature trends on TC activity is comparable to observed TC changes, affecting 17
assessments of the connection between hurricanes and climate. Therefore, understanding 18
the character of and mechanisms behind changes in UT and TTL temperature is 19
important to understanding past and projecting future TC activity changes. We conclude 20
that the UT and TTL temperature trends in NCEP are unlikely to be accurate, and likely 21
drive spuriously positive TC and PI trends, and an inflated connection between absolute 22
surface temperature warming and TC activity increases. 23
20-Nov-12 Page 3 of 46
1
1. Introduction: 2
Understanding and modeling the links between climate and tropical cyclones (TCs) is 3
a topic of substantial scientific interest (e.g., Knutson et al. 2010), motivated in large part 4
by the societal and economic impact of hurricanes (e.g., Pielke Jr. et al. 2008; 5
Mendelsohn et al. 2012; Peduzzi et al. 2012). Statistical, dynamical and hybrid statistical-6
dynamical models have all proved useful in the development of understanding of 7
hurricane activity changes and predictive capability for changes (e.g., Gray 1984; Elsner 8
and Jagger 2006; Oouchi et al. 2006; Camargo et al. 2007; Knutson et al. 2007, 2008, 9
2012; Swanson 2007, 2008; Emanuel et al. 2008; Gualdi et al. 2008; LaRow et al. 2008; 10
Vecchi et al. 2008, 2011, 2012; Zhao et al. 2009, 2010; Bender et al. 2010; Chen and Lin 11
2011; Smith et al. 2010; Villarini et al. 2011.a,.b, 2012; Villarini and Vecchi 2012.a; 12
Zhao and Held 2012). Most of these studies, and others (e.g., Emanuel 2005; Vecchi and 13
Soden 2007; Ramsay and Sobel 2011), have focused attention on the role of sea surface 14
temperature (SST) changes in directly or indirectly controlling past and future hurricane 15
changes. However, processes controlling hurricane statistics may be impacted by changes 16
in the atmosphere that are not closely tied to SST (e.g., Sugi and Yoshimura 2004; 17
Yoshimura and Sugi 2005; Emanuel 2010; Held and Zhao 2011); in particular, upper 18
atmospheric temperature changes could impact TC activity (e.g., Emanuel 2010; 19
Emanuel et al. 2012). 20
The dynamical and statistical-dynamical modeling studies that have explored the 21
impact of climate variability and change on hurricanes to date can be categorized into two 22
broad categories: 1) global models that are either forced by estimates of SST (e.g.,Oouchi 23
20-Nov-12 Page 4 of 46
et al. 2006; LaRow et al. 2008; Zhao et al. 2009, 2010; Murakami et al. 2012), or 1
coupled to ocean models (e.g., Gualdi et al. 2008; Smith et al. 2010; Scocimarro et al. 2
2011); and 2) regional/limited-domain models that are forced by estimates of the large-3
scale 3D structure of the atmosphere, in addition to SST (e.g., Knutson et al. 2007, 2008; 4
Emanuel et al. 2008; Emanuel 2010). The changes to the 3D structure of the atmosphere 5
in the SST-forced and coupled global models emerges from the dynamical response of 6
the model system to the imposed boundary conditions and forcings (which usually 7
include changes in atmospheric composition, e.g. CO2 concentrations, O3, volcanic 8
aerosols); meanwhile, limited-domain models impose the evolution of the large-scale 9
three-dimensional structure of the atmosphere. 10
In particular, as was shown in Knutson et al. (2010), the observed history of Atlantic 11
hurricane activity (including the multi-decadal trend) was recovered with comparable 12
skill by the global SST-forced AGCM studies of Zhao et al. (2009,2010) and LaRow et 13
al. (2008), and the limited-domain studies of Knutson et al. (2007) and Emanuel et al. 14
(2008). This similarity in historical North Atlantic hurricane hindcast skill emerges even 15
though these limited-domain models were forced with the NCEP-NCAR Reanalysis 16
(Kalnay et al. 1996), which has tropical atmospheric temperature trends that are outliers 17
when compared to other reanalyses and homogenized radiosonde data (e.g., Pawson and 18
Fiorino 1998, Santer et al. 2004), and differ considerably from the tropical-mean moist-19
adiabatic warming and stratospheric cooling exhibited by the global models. Therefore, 20
to the extent that atmospheric temperature changes have been important to hurricane 21
activity, different limited-domain and global modeling systems may have been achieving 22
20-Nov-12 Page 5 of 46
comparable hindcast skill for different reasons, and in response to large-scale changes 1
that may have differed from those that occurred in the real climate system. 2
To what extent do different estimates of past tropical atmospheric temperature 3
changes impact hurricane activity in numerical models? And, at which pressure levels in 4
the atmosphere are temperature/heating uncertainties/perturbations most influential? In 5
this manuscript, specific attention is given to the possibility of an influence of 6
temperatures in the upper troposphere (UT), tropical tropopause layer (TTL) and lower 7
stratosphere on hurricane intensity and trends (e.g., Emanuel 2010; Emanuel et al. 2012). 8
Temperatures in these layers can be influenced by trends in the strength of the 9
stratospheric circulation and trends in radiatively active species such as ozone, both of 10
which may be correlated with changes in the troposphere but cannot be understood in 11
terms of changes of a moist adiabatic temperature profile in response to changes in SST 12
(Fueglistaler et al., 2009), and may not be captured by models that do not adequately 13
simulate stratospheric dynamics and chemistry. 14
In Section 2 we describe our data sources and modeling framework. Section 3 focuses 15
on the various estimates of the structure of atmospheric temperature change over the 16
1980-2008 period. Section 4 assesses the role of different estimates of past atmospheric 17
temperature changes on hurricane potential intensity. In Section 5 we explore the impact 18
of idealized atmospheric diabatic heating perturbations on hurricane activity in an 19
AGCM. In Section 6 we discuss the implications of these results for interpreting the 20
fidelity of models used to make projections of hurricane activity. In Section 7 we 21
summarize our results, offer some discussion of their implications. 22
23 2. Data and Methods: 24
20-Nov-12 Page 6 of 46
a. Observational analyses: 1
We explore six different observationally-based estimates of the evolution of tropical 2
atmospheric temperatures over the period 1980-2008. We use two products based 3
entirely on homogenized radiosonde measurements of atmospheric temperature from 4
selected stations: 5
i) The United Kingdom’s Meteorological Office’s Hadley Centre Atmospheric 6
Temperature (HadAT2) analysis (Thorne et al. 2005). 7
ii) Version 1.51 of the Radiosonde Innovation Composite Homogenization 8
(RICH) made available at the University of Vienna (Haimberger et al. 2012) 9
that is homogenized using information from neighboring radiosonde stations, 10
and which provides an ensemble of 32 plausible records by varying 11
parameters in the homogenization methodology. 12
The four other products used are observationally-constrained dynamical-model 13
reanalyses. 14
i) The reanalysis produced by United States National Oceanic and Atmospheric 15
Administration’s (NOAA) National Center for Environmental Prediction 16
(NCEP) and the United States National Center for Atmospheric Research 17
(NCAR), referred to as the NCEP (Kalnay et al., 1996). The data used are on 18
a monthly, 2.5°x2.5° grid, and archived at 17 standard pressure levels. 19
ii) The interim reanalysis produced by the European Centre for Medium Range 20
Weather Forecasting (ECMWF), referred to as ERA-Interim (Dee et al., 21
2011). The data used are on a monthly, 1°x1° grid, and archived at 60 pressure 22
levels between the surface and 0.1hPa. 23
20-Nov-12 Page 7 of 46
iii) The Modern-Era Retrospective Analysis for Research and Applications 1
(MERRA; Rienecker et al. 2011), produced by the United States National 2
Aeronautics and Space Administration (NASA). The data used are on a 3
monthly, 1.25°x1.25° grid and 42 pressure levels between 1000 and 0.1 hPa. 4
iv) The NCEP Climate Forecast System Reanalysis (CFSR; Saha et al. 2010). 5
The data used are on a monthly, 2.5°x2.5° longitude-latitude grid and archived 6
at standard pressure levels with additional intermediate pressure levels. 7
The use of the older NCEP-NCAR reanalysis (i), in addition to the three newer 8
reanalyses (ii-iv), is motivated by its use in several regional downscaling studies. 9
b. Potential Intensity: 10
Potential intensity (PI) is a theoretical upper bound on the intensity a TC can attain, 11
given its environment. From observational estimates and models we compute PI as 12
estimated by Bister and Emanuel (1998, 2002) based on monthly-mean values of sea 13
surface temperature (SST), sea level pressure, and profiles of atmospheric temperature 14
and humidity, using the Fortran code available here: 15
ftp://texmex.mit.edu/pub/emanuel/TCMAX/ 16
c. Model: HiRAM 17
HiRAM is a global high-resolution atmospheric model developed at GFDL with a 18
goal of providing an improved simulation of the statistics of tropical storms. At about 19
50km horizontal grid size, HiRAM forced by the observed sea surface temperatures 20
(HadiSST) reproduces many aspects of the observed hurricane frequency variability for 21
the past few decades, for which reliable observations are available (Zhao et al. 2009). 22
These include the geographical distribution of global hurricane tracks, the seasonal cycle, 23
20-Nov-12 Page 8 of 46
as well as the inter-annual variability and the decadal trend of hurricane frequency over 1
multiple ocean basins. HiRAM has also been used to study hurricane seasonal forecasting 2
in the N. Atlantic (Zhao et al. 2010; Chen and Lin 2011; Vecchi et al. 2011, 2012), with 3
results supporting a view that the overall activity of the Atlantic hurricane season has 4
substantial predictability, if one can predict ocean temperatures. The historical 5
simulations used for this study are also the integrations (3-member ensemble) for 6
GFDL’s participation in the CMIP5 high-resolution time-slice simulations (Held et al., 7
2012) and the US CLIVAR Hurricane Working Group. 8
9
3. Observed and Modeled Temperature Changes: 10
Figure 1 compares the time-evolution and 1980-2008 linear trends of atmospheric 11
temperatures averaged over the peak season of northern hemisphere hurricane activity 12
(July-October) from the observational estimates and the three-member ensemble mean of 13
the HiRAM AMIP experiment, focussing on the tropical-average (30°S-30°N). Because 14
hurricane changes in the tropical Atlantic have been a topic of particular interest in 15
AGCM and limited domain hindcasts, we also explore values at the data point nearest the 16
San Juan, Puerto Rico radiosonde station (66°W,18°N). Both in the tropical-mean and at 17
San Juan, all the observational estimates show long-term cooling in the lower 18
stratosphere (50hPa) and upper TTL (70hPa), punctuated by warming in response to the 19
eruptions of Mts. El Chichón (1983) and Pinatubo (1991). The HiRAM model shows 20
weaker 50-70hPa cooling than that of any of the observationally-based estimates even 21
though it is forced with estimates of past ozone changes and stratospheric aerosols, and it 22
20-Nov-12 Page 9 of 46
also shows reduced variability, in part because HiRAM does not have a good 1
representation of the quasi-biennial oscillation (QBO; Baldwin et al. 2001). 2
In the lower TTL (100h-150hPa) HiRAM tends to track the observations relatively 3
well. The NCEP-NCAR Reanalysis stands out as an outlier among the observational 4
estimates, by exhibiting very large cooling in the lower TTL and in the UT. Most 5
observational estimates have the sign of the long-term trend in temperature change from 6
negative to positive between 150-200hPa, while that in NCEP has its zero crossing below 7
250hPa. The zero-crossing for HiRAM, near 150hPa, is higher than most observational 8
estimates. 9
The results are similar over San Juan and in the tropical mean, with the outlier nature 10
of NCEP in the lower TTL and UT more notable than in the tropical mean. In the upper 11
TTL the trends from the NCEP are at the cold end of the spectrum of the various 12
observational estimates, while those from the HiRAM AGCM are at the warm end. In the 13
lower TTL and UT the NCEP is an extreme outlier among the other products in its 14
estimate of trends and in the temporal evolution of temperature. In the lower TTL, the 15
trends in the HiRAM model are deviate from the non-NCEP datasets in the opposite 16
direction to those of NCEP. In the UT, the temperature trends in HiRAM are less of an 17
outlier, relative to the population – while the NCEP trends depart from the population as 18
a whole down to ~300hPa. 19
Two divergent views of the past evolution of tropical atmospheric temperatures 20
(NCEP and HiRAM) have been used in assessments of the changes of hurricane activity 21
since 1980. Exemplifying these two views, the ZETAC regional model (Knutson et al. 22
2007, 2008; Garner et al. 2009) and the statistical-dynamical methodology of Emanuel et 23
20-Nov-12 Page 10 of 46
al. (2008) use the NCEP to drive their hurricane downscaling methodologies, while the 1
HiRAM evolution emerges from the AGCM used to explore hurricane activity in Zhao et 2
al. (2009, 2010), Zhao and Held (2011) and Held and Zhao (2011). Therefore, it is 3
important to understand the extent to which these differences in the multi-decadal trends 4
in atmospheric temperatures influence simulated hurricane activity. 5
6
4. Atmospheric Temperature Changes and Potential Intensity: 7
In this section we explore the impact of the differences in the temperature evolution 8
between the NCEP, HiRAM and the MERRA reanalysis on the Bister and Emanuel 9
(1998, 2002) TC Potential Intensity (PI). Overall, the differences in atmospheric 10
temperature trends between NCEP, MERRA and HiRAM in the Atlantic main 11
development region (MDR; 80°W-20°W, 10°N-25°N) are of a similar character to those 12
averaged over the tropics. The NCEP PI trends differ from those of both HiRAM and 13
MERRA PI across the tropics (Figure 2.a-.c). NCEP has positive PI trends almost 14
everywhere in the tropics, which exceed 2.5 m·s-1·decade-1 over large areas of the tropics. 15
Meanwhile, MERRA and HiRAM PI are positive in as many places as they are negative, 16
and the increases are almost everywhere less than 2 m·s-1·decade-1. 17
There are also differences between NCEP and the two other datasets in the 18
relationship between trends in PI and relative SST (the difference in local SST to the 19
tropical average, which has been found to be a good predictor of the response of PI across 20
a range of models – e.g., Vecchi and Soden 2007; Gualdi et al. 2008; Xie et al. 2010; 21
Ramsay and Sobel 2011; Camargo et al. 2012). The patterns of PI trends exhibit some 22
relationship to patterns of SST change in both datasets, but while in HiRAM and 23
20-Nov-12 Page 11 of 46
MERRA the zero line of relative SST trends corresponds strongly to the zero line of PI 1
trends, in the NCEP there are large areas with positive PI trends and negative relative 2
SST trends (e.g., the east Pacific). 3
The differences between the evolution of PI of the NCEP with thouse of HiRAM and 4
MERRA emerge clearly in their tropical-mean behavior (Figure 3.a), with the NCEP 5
showing a clear increase but little change in HiRAM, and a slight decrease in MERRA. 6
The difference in PI trends emerges in the regional, seasonal PI as well; for example, Fig. 7
3.b shows time series of PI from the NCEP, HiRAM and MERRA averaged over the 8
Atlantic hurricane main development region (MDR; 80°W-20°W, 10°N-25°N) over the 9
hurricane season (June-November). All three products exhibit increases in MDR PI over 10
the 1980-2008 period – but the increase in NCEP is more than twice as large as that in 11
HiRAM or MERRA. The difference in the trend of June-November North Atlantic PI 12
(Fig. 3.b) between the three products is comparable to the tropical-mean differences (Fig. 13
3.a). 14
PI depends on the surface enthalpy disequilibrium as well as the vertical profile of 15
temperature in the atmosphere, with larger enthalpy disequilibrium or lower UT/TTL 16
temperatures leading to larger PI. The main source of the difference between HiRAM and 17
NCEP PI trends is the difference in tropical-mean atmospheric temperature trends. To 18
demonstrate this we recomputed PI from the NCEP data, after replacing the NCEP 19
tropical-mean temperature linear least-squares trend at each point with that from HiRAM. 20
We scale the HiRAM temperature change by the SST trend in NCEP in order to isolate 21
the impact of differences in the profile of tropical-mean temperature trend on PI. The 22
modified temperature profile T*, at each point is: 23
20-Nov-12 Page 12 of 46
!∗ !,!,!, ! = !! !,!,!, ! −ℒ!!!! ! · ! +ℒ!!!! ! ·ℒ!!!!
ℒ!!!!· ! (Eq. 1) 1
where TN and SN are the NCEP monthly atmospheric temperature and SST fields, 2
respectively; TH and SH are the HiRAM monthly atmospheric temperature and SST fields, 3
respectively; ℒ! is the slope of the linear least-squares trend of quantity ξ; and <·> is the 4
tropical average of a quantity. Differences between the NCEP PI evolution and that 5
computed using the modified temperature data reflect the impact of differences in the 6
vertical structure of tropical-mean temperature trends between NCEP and HiRAM. We 7
refer to this modified NCEP temperature field as NCEP*. 8
As can be seen in Figure 2.d, the PI trends over the globe are very similar between 9
HiRAM and NCEP*, indicating that a large contribution to the regional differences in PI 10
trend between NCEP and HiRAM arises from differences in tropical-mean atmospheric 11
temperature trends. There are still differences between the NCEP* and HiRAM trends in 12
certain regions: NCEP* has its largest Atlantic PI increase off the coast of South 13
America, while HiRAM has its largest positive Atlantic trends off the coast of Africa. 14
However, these regional differences are much smaller than the differences between 15
NCEP and HiRAM. 16
Differences in regional PI trends between the NCEP* and HiRAM may be tied to 17
differences in their relative SST trends; this HiRAM experiment is forced with the 18
HadISSTv1 product (Rayner et al. 2003), while NCEP uses a different optimal-19
interpolation estimate of SST (Kalnay et al. 1996). For example, the relative warming of 20
the Atlantic coincides with the location of the largest PI trends in each product. In fact, 21
the zero line of the relative SST trend in NCEP corresponds very well with the zero line 22

20-Nov-12 Page 13 of 46
of PI trends in NCEP*, in contrast to that in the original NCEP (Fig. 2.a) but similar to 1
HiRAM (Fig. 2.b) and MERRA (Fig. 2.c). 2
The influence of the differences in tropical-mean temperature trends on PI can be 3
seen by comparing the red and blue lines in Figure 3; area averaged evolution and trends 4
of PI computed from the NCEP* temperature are much more similar to those in HiRAM 5
and MERRA than to NCEP – although the year-to-year values can still differ from 6
HiRAM. This analysis indicates that the dominant contribution to differences in trends in 7
PI between the NCEP and HiRAM is the difference in the profile of tropical-mean 8
atmospheric temperature trends in these two datasets. 9
In order to determine the atmospheric levels that contribute most to these PI 10
differences, we perform additional partial perturbations to the temperature profile in the 11
NCEP, where we substitute T*(x,y,p,t) at and above a certain pressure level only. The 12
results from these partial perturbations are shown in Figure 4, focusing on the TTL (in 13
blue), UT (dark orange) and rest of troposphere (light orange). More than half the 14
difference between HiRAM and NCEP tropical-mean (and regional, not shown) PI trends 15
is due to differences in temperature trends in the TTL, primarily from the large 16
differences at 100hPa and 150hPa. Differences in temperature trends at and above 70hPa 17
have a negligible impact on the differences in PI trends between NCEP and HiRAM. The 18
differences in temperature trends in the troposphere also contribute a substantial amount 19
to the differences in PI trends between the NCEP and HiRAM, with the NCEP cooling 20
between 150hPa and 300hPa and HiRAM warming at those levels (Figure 1). 21
Therefore, to the extent that PI is an important control on hurricane intensity and, 22
possibly, frequency as well (e.g., Emanuel and Nolan 2004; Emanuel 2007, 2008), it is 23
20-Nov-12 Page 14 of 46
important to understand temperature trends that impact its evolution. We have found that 1
differences between HiRAM and NCEP in their temperature trends at 70 hPa and higher 2
up have little influence on trends in PI. However, temperature trends below that - roughly 3
from 300 to 100hPa - have a substantial impact on trends in PI, and correspondingly the 4
uncertainties in tropical UT and TTL temperature trends are also a source of major 5
uncertainty in trends of PI. 6
7
5. Atmospheric Heating Influences on HiRAM: 8
Using the HiRAM AGCM we explore the impacts on TC activity of idealized 9
diabatic heating perturbation that affect the mean tropical temperature profile and 10
compare the model’s response to those in PI computed from the model’s temperature 11
structure. We are encouraged to analyze HiRAM due to the quality of its simulation of 12
TC genesis – climatology, variability, and trends (Zhao et al, 2009, 2010). In order to 13
efficiently isolate the impact of atmospheric heating anomalies we build off of a control 14
experiment forced with monthly climatological SST, with no interannual variability, 15
computed from HadISST (Rayner et al. 2003) over 1981-2005. Four perturbation 16
experiments were generated in which horizontally uniform and time-invariant 17
atmospheric diabatic cooling rates of different amplitudes were imposed to produce a 18
prescribed temperature perturbation with two different vertical structures, one targeting 19
the TTL and the other the UT (see Table 1). 20
The impact of the prescribed diabatic cooling rates on tropical-mean temperature, 21
averaged over 20 years of model simulation, can be seen in the left panel of Figure 6. For 22
reference, the right panel of Figure 5 shows the linear trends in tropical-mean temperature 23
20-Nov-12 Page 15 of 46
from NCEP, HiRAM-AMIP and their difference. All of the idealized heating experiments 1
exhibit their largest temperature anomalies in the TTL, even when the heating is applied 2
to the UT. In this model, UT heating has large impact on the TTL, but TTL heating does 3
not efficiently impact the UT. The atmospheric cooling perturbations also drive increases 4
in precipitation and convective mass flux averaged through the tropics. 5
The model response in hurricane activity can be explored by tracking hurricane-6
like vortices in HiRAM; we identify TCs from the model output using instantaneous 7
values every six hours of 850hPa vorticity, sea level pressure, surface wind and upper 8
tropospheric temperature, as in Zhao et al. 2008). Figure 6 shows the response of two 9
metrics of global and Atlantic TC activity: i) fractional change in the number of 10
hurricanes1, and ii) the change in the ratio of hurricanes to TCs (HU/TC ratio), which can 11
be interpreted as a measure of storm intensity in this AGCM, which is too coarse to 12
capture the most intense TCs (e.g., Zhao and Held 2010). In these HiRAM AGCM 13
experiments, the amplitude of the cooling in the TTL is not a useful metric by which to 14
discriminate the response of these TC metrics: the largest TTL cooling is in experiment 15
TT3, but it has the third weakest response in either hurricane measure, weaker than all the 16
UT experiments, which have smaller cooling of the TTL. However, the mean cooling of 17
the UT (150hPa-300hPa) is well correlated to the response of global and Atlantic 18
frequency and HU/TC ratio (top panels Figure 6). 19
1 The maximum 10-meter wind speed obtained during the storm lifetime is used to define a TC or hurricane. Following the recommendation of Walsh (2007) for a model of this resolution, we reduce the standard criteria (17 m/s for TCs and 33m/s for hurricanes), by 10%. This adjustment has very little effect on the fractional changes in storm counts in the model.
20-Nov-12 Page 16 of 46
We also explore the relationship between PI changes and frequency changes in the 1
bottom panels of Figure 6. PI changes in this set of experiments are well correlated with 2
the change in HU/TC ratio (Fig. 6.d), showing a response of ~5% per ms-1. However, for 3
hurricane frequency PI does not provide a clean description of the response across the six 4
experiments – it can discriminate between the frequency response of the TTL and UT 5
cooling experiments, but it cannot explain the differences in frequency response across 6
them. For example, experiments TT3 and UT2 have a similar PI change, but hurricane 7
frequency in TT3 changes increases by less than 30% while UT2 has a ~90% increase. 8
The HiRAM AGCM shows sensitivity of TC intensity, but not of frequency, to PI 9
changes. 10
The blue horizontal and green vertical lines place the model-estimated sensitivity of 11
the various TC activity metrics in the context of the observed activity changes in the 12
Atlantic and the differences between NCEP and HiRAM. Based on the HiRAM AGCM’s 13
sensitivity of frequency to UT temperature changes, the differences in UT temperature 14
trends between NCEP and HiRAM project onto fractional changes that are comparable 15
compared to the observed changes. That is, the impact on hurricane activity of the PI and 16
UT temperature differences between HiRAM and NCEP trends in this AGCM appear to 17
be a first order effect relative to the observed TC frequency trends in the Atlantic in this 18
AGCM. Meanwhile, the estimated impact of the differences of PI and UT temperature 19
trends between HiRAM and MERRA is a small fraction of observed changes. For the 20
HU/TC ratio changes, the observed trends have been much smaller (indistinguishable 21
from zero, but nominally -5% / 29 years – other observations measures of intensity show 22
a clearer increase in the Atlantic over this period; e.g., Elsner et al. 2008) so the 23
20-Nov-12 Page 17 of 46
discrepancies between NCEP and HiRAM trends in their PI and UT temperature trends 1
are proportionately large. 2
3
6. Reconciling sensitivities in hurricane downscale methodologies: 4
The multi-decadal evolution of atmospheric temperature and TC PI in the 5
hindcast experiments with HiRAM (Zhao et al. 2009, 2010) differs considerably from 6
that of NCEP, which was used in ZETAC (Knutson et al. 2007, 2008) and the 7
downscaling studies of Emanuel et al. (2008; henceforth labelled E08) – yet these three 8
studies reported comparable hindcast skill in tropical Atlantic hurricane activity (see 9
Knutson et al. 2012, Figure 1 for a comparison of all three methodologies). Historical 10
hindcasts with HiRAM (Zhao et al. 2009) and ZETAC (Knutson et al. 2007) over 1980-11
2006 reported linear trends2 in hurricane counts that were comparable to those observed 12
(the ZETAC trends were slightly larger than those observed), as did the statistical-13
dynamical methodology of E08. This suggests that the sensitivity of Atlantic hurricane 14
activity to changes in the atmospheric temperature profile in these three systems may 15
differ. However, the response of future projections by these three systems shows 16
comparable sensitivity to relative SST (Villarini et al. 2010; Knutson et al. 2012) – 17
suggesting some level of commonality in their sensitivity to climate. 18
Figure 7 shows an extended time series (1980-2008) of hurricane frequency from 19
HiRAM and ZETAC, and suggests a path towards reconciling the sensitivities of those 20
two systems. The year-to-year correlations of Atlantic hurricane frequency in HiRAM 21
and ZETAC to observations are comparable to each other and comparable to the results 22
2 We note that since hurricane frequency is not Normally distributed, caution should be exercised in interpreting linear least-squares trends.
20-Nov-12 Page 18 of 46
described in the original papers (Zhao et al. 2009; Knutson et al. 2007) over a shorter 1
record. In addition, the ensemble of linear trends in Atlantic hurricane from HiRAM 2
compares well with observed over the longer 1980-2008 period, as did the shorter record 3
in Zhao et al. (2009). However, the addition of 2007 and 2008 to the original ZETAC 4
1980-2006 time series leads to an Atlantic hurricane trend that goes from being 5
somewhat larger than that observed to more than twice that observed (the 2007 and 2008 6
integrations with ZETAC were not available for Knutson et al. (2007, 2008)). The 7
difference in the HiRAM and ZETAC trends over 1980-2008 is qualitatively consistent 8
with the expectation from the differences in the atmospheric temperature trends present in 9
both systems, assuming they have similar sensitivities to atmospheric temperature 10
change. Therefore, Atlantic hurricanes in HiRAM and ZETAC need not have 11
fundamentally different sensitivities to climate. We hypothesize that the unrealistically 12
large trend in ZETAC hurricane counts over 1980-2008 reflects the influence of an 13
unrealistic cooling of the UT in NCEP, and that ZETAC simulations with large-scale 14
conditions like those of HiRAM or MERRA would produce more realistic hurricane 15
frequency trends; experiments are underway to explicitly test this hypothesis. 16
Reconciling the behavior of HiRAM and E08 is more problematic. The E08 17
methodology shows a strong sensitivity of hurricane frequency to temperature changes in 18
the TTL (Emanuel et al. 2012); meanwhile, HiRAM shows strong sensitivity of global 19
and Atlantic hurricane frequency to temperature changes in the UT, but not to TTL 20
changes (Section 5). We speculate that this difference in sensitivity to TTL temperatures 21
is related to a difference in sensitivity of frequency to PI: in the E08 methodology PI is a 22
primary thermodynamic constraint on storm genesis; while in the HiRAM model there is 23
20-Nov-12 Page 19 of 46
no consistent emergent relationship between PI and genesis. Since PI is impacted by TTL 1
temperature changes (Figure 4), frequency in the E08 methodology is sensitive to TTL 2
changes. The relationship that sometimes appears between PI and frequency in HiRAM 3
reflects a connection of both PI and genesis to upper tropospheric temperature (Figure 4
6.d-.e) and to patterns of SST (Zhao et al. 2009, 2010; Vecchi et al. 2011, Held and Zhao 5
2011), rather than a direct connection of PI to genesis. In global atmospheric (e.g., Sugi 6
et al. 2002, 2012; Held and Zhao 2011; Zhao and Held 2012) and coupled (e.g., Gualdi et 7
al. 2008) models hurricane frequency tends to scale with changes in monthly, mid-8
tropospheric vertical velocity, for which tropospheric stability is of greater relevance than 9
TTL temperatures. 10
It appears that HiRAM and the E08 downscaling technique have distinct 11
sensitivity to climate; in fact, a downscale of the HiRAM model shown here using E08 12
technique does not recover the trends in Atlantic hurricane frequency that emerge in the 13
HiRAM model (Emanuel et al. 2012). We speculate that the similar sensitivity to relative 14
SST in future projections from HiRAM and E08 (e.g., Villarini et al. 2011.a; Knutson et 15
al. 2012) arises because GCM projections of the future have an approximately moist 16
adiabatic warming of the troposphere, in which both large-scale stability and potential 17
intensity tend to follow relative SST – so the differences in genesis sensitivity in HiRAM 18
and E08 are masked. The differences in sensitivity of HiRAM and E08 are only apparent 19
when atmospheric temperature changes depart strongly from a moist adiabatic profile. 20
21
7. Summary and Discussion: 22
20-Nov-12 Page 20 of 46
We have explored uncertainties in multi-decadal changes in atmospheric temperature, 1
and their influence on TC PI and frequency. Over the period 1980-2008 multiple 2
observational estimates agree that the troposphere has warmed and the stratosphere has 3
cooled, but disagree on the magnitude of the tropospheric warming and its vertical 4
structure, and on the sign of temperature changes in the upper troposphere (UT) and 5
tropical tropopause layer (TTL). The large differences in temperature trends between 6
different observational estimates, and their difference to the trend in the HiRAM AGCM, 7
project onto uncertainties in TC metrics. 8
We have focused primarily on the differences (and impacts) of the 1980-2008 trends 9
in the NCEP-NCAR Reanalysis (NCEP) and of the SST-forced HiRAM AGCM because 10
the HiRAM model has been used to explore the sensitivity of hurricanes to climate (e.g., 11
Zhao et al. 2009, 2010) and the NCEP has been used as a forcing to limited-domain 12
models used to understand the hurricane-climate connection (e.g., Knutson et al. 2007, 13
2008; Emanuel et al. 2008, 2012; Emanuel 2010). The trends from the NCEP-NCAR 14
Reanalysis (NCEP) product deviate most strongly from the rest of the estimates explored 15
in this paper, and show much stronger cooling of the TTL and upper troposphere than any 16
other estimate, with cooling extending from the stratosphere to 300hPa (Figure 1). 17
Overall, the tropical-mean and Atlantic temperature atmospheric temperature trends in 18
HiRAM tend to be within the spread of the various non-NCEP estimates, while the trend 19
in NCEP between 300hPa and 100hPa is an extreme outlier among the various products 20
explored (Figure 1). 21
Trends in TC potential intensity (PI) calculated according to Bister and Emanuel 22
(1998, 2002) using NCEP data differ considerably from those using the newer MERRA 23
20-Nov-12 Page 21 of 46
data, or using model data from the HiRAM AGCM. The principal contributors to the 1
difference between PI trends from NCEP and the other data are the differences in the 2
temperature trends of the UT (300-150hPa) and lower TTL (150-100hPa). NCEP reports 3
a substantial cooling of these layers, and correspondingly PI calculated from NCEP data 4
shows a positive trend. Temperature trend differences in the upper TTL and higher have 5
negligible impact on PI, while differences in lower tropospheric temperature trends 6
contribute <20% to the PI trend differences. Over the period 1980-2008, tropical mean PI 7
calculated from HiRAM data does not show a significant trend, while that calculated 8
from MERRA shows a decrease. 9
The strong TTL and UT cooling in NCEP make trends in PI deviate from the tight 10
relationship to relative SST that has been noted in other studies (e.g., Vecchi and Soden 11
2007; Gualdi et al. 2008; Xie et al. 2010; Ramsay and Sobel 2011; Camargo et al. 2012). 12
The large tropical-mean trend in PI that has been noted in the literature (e.g., Emanuel 13
2007, 2010, 2012) arises primarily from the large cooling in the lower TTL and UT in 14
NCEP (Figure 3), and is not evident in the HiRAM integrations, nor in the radiosonde 15
observations and more modern reanalysis (Figs. 1, 2, 3). 16
Beyond differences in atmospheric temperature trends, NCEP, MERRA and 17
HiRAM also use SST products that have exhibited different trends in tropical-mean and 18
in patterns of SST (Figure 2; Vecchi and Soden 2007). These differences in the patterns 19
of SST change lead to differences in trends of regional PI between HiRAM, MERRA and 20
NCEP. There are indications that differences in SST reconstructions can also lead do 21
differences in the vertical structure of atmospheric temperature change (Po-Chedley and 22
Fu 2012). 23
20-Nov-12 Page 22 of 46
In sensitivity experiments with an idealized diabatic heating anomaly imposed on 1
HiRAM (Section 5), a measure of intensity (the ratio of the number of hurricanes to TCs) 2
shows a strong relationship to both PI and UT temperature change (Figure 6). While this 3
model is of insufficient resolution to represent the full spectrum of TC intensity, this ratio 4
is reasonably well simulated in the model and so the model provides a crude estimate of 5
intensity changes (Zhao and Held 2010). In HiRAM, there is no direct dependence of TC 6
frequency on PI, with an indirect co-variation coming through the dependence of both TC 7
frequency and PI on UT temperature changes. That is, HiRAM does not support the use 8
of PI as a genesis index. 9
All of the observationally-based temperature products explored here, as well as 10
HiRAM, show a cooling of the TTL across the tropics – though they disagree in its 11
magnitude. If, as the E08 methodology indicates, TTL cooling acts to increase hurricane 12
frequency, one would perhaps expect to have seen an increase in global mean frequency 13
since 1980. However, the observed record shows a non-significant decrease in global 14
hurricane frequency (Zhao et al. 2009; Maue 2011). Meanwhile, HiRAM (which does not 15
show a sensitivity of frequency to TTL temperature) is able to recover the observed 16
global-mean hurricane trends, along with the increases seen in the Atlantic and decreases 17
seen in the East and West Pacific (Zhao et al. 2009). The observed history of global 18
hurricanes may indicate that TTL temperature changes are not a robust influence on 19
hurricane frequency. 20
If the spread in tropical atmospheric temperature trends shown in Figure 1 21
represents our true uncertainty about the character of past tropical temperature trends, 22
then there is a large resulting limitation in our ability to attribute the causes of past trends 23
20-Nov-12 Page 23 of 46
and project future changes in hurricane frequency and intensity. However, the spread 1
temperature trends in the UT is dominated by NCEP, so one must consider whether the 2
upper tropospheric cooling in NCEP is as plausible as the other estimates shown in 3
Figure 1. Although currently there is considerable uncertainty as to the character of past 4
tropical atmospheric temperature trends, which does not allow the rejection of the 5
hypotheses that tropical-mean UT temperatures have warmed at a reduced, equal or 6
larger rate than tropical-mean SST since the late-1970s from direct temperature 7
observations, there is growing evidence that the tropical upper troposphere has warmed 8
(Thorne et al. 2005, 2011; Santer et al. 2005, 2008; Sherwood et al. 2008; Po-Chedley 9
and Fu 2012; Seidel et al. 2012). Further, indirect evidence from observed changes to the 10
structure of zonal-mean wind (Allen and Sherwood 2008) and the SST threshold for 11
strong convection (Johnson and Xie 2010) suggests that the tropical troposphere has 12
warmed, perhaps approximately moist-adiabatically. Other questions have been raised in 13
the literature regarding the accuracy of atmospheric trends in NCEP (e.g., Pawson and 14
Fiorino 1998; Santer et al. 2004). Therefore, we conclude that NCEP is unlikely to be an 15
accurate representation of the multi-decadal trends in tropical atmospheric temperature 16
that appear so influential to hurricane activity, and the estimates of the uncertainty in past 17
tropical temperature trends, and the impacts of these uncertainties, should exclude NCEP. 18
Agreement between observed and historical simulations with hurricane 19
downscaling methodologies has been used to justify their use in climate change 20
applications, but different methodologies have assumed different atmospheric 21
temperature trends in historical simulations (Section 6). Given that tropical UT and TTL 22
temperature trends in NCEP appear unreliable, and since upper atmospheric temperature 23
20-Nov-12 Page 24 of 46
trends can impact hurricane activity, the reliability of downscaling methodologies that 1
depend on NCEP atmospheric temperature trends should be questioned (e.g., Knutson et 2
al. 2007, 2008; E08; Section 6). The E08 methodology is unable to recover the observed 3
trend in Atlantic hurricane activity with atmospheric reanalyses other than NCEP 4
(Emanuel et al. 2012), which may indicate some deficiency in that methodology. 5
Conversely, the Knutson et al. (2007, 2008) methodology overestimates the 6
observed trend in Atlantic hurricanes when forced with NCEP (Figure 7), which is what 7
one would expect a “correct” model to do in the case that the NCEP underestimated 8
upper tropospheric warming. We speculate that the Knutson et al. (2007,2008) 9
methodology may perform more faithfully if nudged to atmospheric conditions without 10
the large UT and TTL cooling trend seen in NCEP. 11
These results highlight the need to understand tropical atmospheric temperature 12
changes. In particular, if the tropical-mean troposphere has not been warming like that of 13
GCMs between 300 hPa and 100 hPa, there are implications to the evolution of TC 14
potential and actual intensity. According to the GCM utilized here, if there are departures 15
from the moist adiabat below 150hPa, this could influence TC frequency. Currently, most 16
dynamical model historical simulations of the 20th century and projections of the 21st 17
century show something resembling moist adiabatic warming in the tropics (e.g., Santer 18
et al. 2005; Seidell et al. 2012), but if the models are deficient in a process, or a key 19
forcing has been neglected, the likely future evolution of TC statistics may differ from 20
these projections and interpretation of the mechanisms responsible for observed hurricane 21
changes. For example, past changes in TC intensity may include a signature from 22
radiative forcing agents that have influenced TTL temperatures, such as volcanic 23
20-Nov-12 Page 25 of 46
aerosols. If current models overestimate the warming of the upper troposphere and lower 1
TTL in response to increasing CO2 or other changes in radiative forcing, we would 2
expect that current projections of 21st century hurricane intensity underestimate the 3
potential for future increases in TC intensity (e.g.,Knutson and Tuleya 2004; Emanuel et 4
al. 2008; Bender et al. 2010, Knutson et al. 2012; Villarini and Vecchi 2012.b), and the 5
CO2 influence on past TC intensity changes (e.g., Villarini and Vecchi 2012.b). On the 6
other hand, if there has been an underestimated TTL cooling due to a misrepresentation 7
of the impact of stratospheric ozone decreases, which are expected to recover over the 8
coming century (WMO 2011), or the impact of volcanic aerosols, we would expect that 9
projections for the coming century may overestimate the potential increases of TC 10
intensity. 11
12
Acknowledgments: 13
We are grateful to Mike Winton, Massimo Bollasina, and three anonymous reviewers for 14
comments and suggestions, and Peter Thorne and John Lanzante for discussions on 15
atmospheric temperature records. We thank ECMWF for providing the ERA-Interim 16
data. MERRA data used in this study/project have been have been provided by the Global 17
Modeling and Assimilation Office (GMAO) at NASA Goddard Space Flight Center 18
through the NASA GES DISC online archive. We thank NCEP and NCAR for providing 19
the CFSR data, available at 20
http://dss.ucar.edu/pub/cfsr.html. HADAT2 temperature data was downloaded from 21
http://www.metoffice.gov.uk/hadobs/hadat/. RICH temperature data was downloaded 22
from http://www.univie.ac.at/theoret-met/research/raobcore/. 23
20-Nov-12 Page 26 of 46
1
References: 2
Allen, R.J., and S.C. Sherwood, 2008: Warming maximum in the tropical upper 3
troposphere deduced from thermal winds. Nature Geosci., 1, 399-403. 4
Baldwin M.P., Gray LJ, Dunkerton TJ, Hamilton K, Haynes PH, Randel WJ, Holton JR, 5
Alexander MJ, Hirota I, Horinouchi T, Jones DBA, Kinnersley JS, Marquardt C, Sato 6
K, Takahashi M, 2001. The quasi-biennial oscillation, Rev. Geophys., 39(2), 179-229. 7
Bender, M.A., T.R.Knutson, R.E.Tuleya, J.J. Sirutis, G.A.Vecchi, S.T. Garner, and I.M. 8
Held, 2010: Model impact of anthropogenic warming on the frequency of intense 9
Atlantic hurricanes. Science 327, 454–458. 10
Bister, M., and K. A. Emanuel 1998: Dissipative heating and hurricane intensity. Meteor. 11
Atmos. Phys., 65, 233–240. 12
——, and ——, 2002: Low frequency variability of tropical cyclone potential intensity. 13
1. Interannual to interdecadal variability. J. Geophys. Res., 107, 4801, 14
doi:10.1029/2001JD000776. 15
Bretherton, C.S., M. Widmann, V.P. Dymnikov, J.M. Wallace, and I. Bladé, 1999: The 16
Effective number of spatial degrees of freedom of a time-varying field. J. 17
Climate, 12, 1990-2009. 18
Camargo, S. J., K. A. Emanuel, and A. H. Sobel, 2007: Use of a genesis potential index 19
to diagnose ENSO effects on tropical cyclone genesis. J. Climate, 20, 4819–4834. 20
——, M. Ting, and Y. Kushnir, 2012: Influence of local and remote SST on North 21
Atlantic tropical cyclone potential intensity. J. Climate (submitted). 22

20-Nov-12 Page 27 of 46
Chen, J. H., and S. J. Lin, 2011: The remarkable predictability of inter-annual variability 1
of Atlantic hurricanes during the past decade. Geophysical Research Letters, 38 2
(L11804), doi:10.1029/2011GL047629. 3
Dee, D.P. and coauthors, 2011: The ERA-Interim reanalysis: configuration and 4
performance of the data assimilation system, Q. J. R. Meteorol. Soc., 137, 553-5
597. 6
Elsner, J.B., and T.H. Jagger, 2006: Prediction Models for Annual U.S. Hurricane 7
Counts. J. Climate, 19, 2935–2952. doi: http://dx.doi.org/10.1175/JCLI3729.1 8
Elsner, J.B., J.P. Kossin and T.H. Jagger, 2008: The increasing intensity of the strongest 9
tropical cyclones. Nature 455, 92-95, doi:10.1038/nature07234 10
Emanuel, K., 2005: Increasing destructiveness of tropical cyclones over the past 30 years. 11
Nature, 436, 686–688. 12
——, 2007: Environmental Factors Affecting Tropical Cyclone Power Dissipation. J. 13
Climate, 20, 5497–5509. doi://10.1175/2007JCLI1571.1 14
——, 2010: Tropical cyclone activity downscaled from NOAA-CIRES Reanalysis, 1908-15
1958. Journal of Advances in Modeling Earth Systems 2, 1-12, 2010. 16
——, and D. S. Nolan, 2004: Tropical cyclones and the global climate system, paper 17
presented at 26th Conference on Hurricanes and Tropical Meteorology, Am. 18
Meteorol. Soc., Miami, Fla. 19
——, R. Sundararajan, and J. Williams, 2008: Hurricanes and global warming—Results 20
from downscaling IPCC AR4 sim- ulations. Bull. Amer. Meteor. Soc., 89, 347–21
367. 22
20-Nov-12 Page 28 of 46
——, S. Solomon, D. Folini, S. Davis, and C. Cagnazzo, 2012: Influence of Tropical 1
Tropopause Layer Cooling on Atlantic Hurricane Activity. J. Climate (submitted). 2
Fueglistaler, S., A.E. Dessler, T. Dunkerton, I. Folkins, Q. Fu, P.W. Mote, 2009: Tropical 3
Tropopause Layer, Rev. Geophys., 47, RG1004, doi:10.1029/2008RG000267. 4
Garner, S.T., I.M. Held, T.R. Knutson, and J.J. Sirutis, 2009: The roles of wind shear and 5
thermal stratification in past and projected changes of Atlantic tropical cyclone 6
activity. J. Climate, 22(17), DOI:10.1175/2009JCLI2930.1. 7
Gray, W. M., 1984: Atlantic seasonal hurricane frequency. Part I: El Niño and 30 mb 8
quasi-biennial oscillation influences, Monthly Weather Review, 112, 1649-1668. 9
Gualdi, S., E. Scoccimarro, and A. Navarra, 2008: Changes in tropical cyclone activity 10
due to global warming: Results from a high-resolution coupled general circulation 11
model. J. Climate, 21, 5204–5228. 12
Haimberger, L., C. Tavolato, and S. Sperka, 2012: Homogenization of the global 13
radiosonde temperature dataset through combined comparison with reanalysis 14
background series and neighboring stations. J. Climate (in press). 15
Held, I.M., and M. Zhao, 2011: The response of tropical cyclone statistics to an increase 16
in CO2 with fixed sea surface temperatures. J. Climate, 24, 5353–5364. 17
Jarvinen, B. R., C. J. Neumann, and M. A. S. Davis, 1984: A tropical cyclone data tape 18
for the North Atlantic Basin, 1886–1983: Contents, limitations, and uses. Tech. 19
Memo. NWS NHC 22, National Oceanic and Atmospheric Administration, 24 pp. 20
Johnson, N.C., and S.-P. Xie, 2010: Changes in the sea surface temperature threshold for 21
tropical convection. Nature Geosci., 3, 842-845, doi:10.1038/ngeo1008 22
20-Nov-12 Page 29 of 46
Kalnay and coauthors, 1996: The NCEP/NCAR 40-Year Reanalysis Project. Bull. Amer. 1
Meteorol. Soc., 77(3), 437-471. 2
Knutson, T.R., and R.E. Tuleya, 2004: Impact of CO2-induced warming on simulated 3
hurricane intensity and precipitation: Sensitivity to the choice of climate model 4
and convective parameterization. Journal of Climate, 17, 3477–3495. 5
——, J. J. Sirutis, S. T. Garner, I. Held, and R. E. Tuleya, 2007: Simulation of recent 6
increase of Atlantic hurricane activity using an 18-km-grid regional model. Bull. 7
Amer. Meteor. Soc., 88, 1549–1565. 8
——, ——, ——, G. A. Vecchi, and I. Held, 2008: Simulated reduction in Atlantic 9
hurricane frequency under twenty-first- century warming conditions. Nat. Geosci., 10
1(6), 359–364. 11
——, J.L. McBride, J. chan, K. Emanuel, G. Holland, C. Landsea, I. Held, J.P. Kossin, 12
A.K. Srivastava, and M. Sugi, 2010: Tropical cyclones and climate change. 13
Nature Geoscience, 3, 157–163. 14
——, et al., 2012: Dynamical Downscaling Projections of Late 21st Century Atlantic 15
Hurricane Activity: CMIP3 and CMIP5 Model-based Scenarios. J. Climate 16
(submitted) 17
LaRow, T. E., Y. K. Lim, D. W. Shin, E. P. Chassignet, and S. Cocke, 2008: Altantic 18
basin seasonal hurricane simulations. J. Climate, 21, 3191–3206. 19
Maue, R. N., 2011: Recent historically low global tropical cyclone activity. Geophys. 20
Res. Lett., 38, L14803, doi:10.1029/2011GL047711 21
20-Nov-12 Page 30 of 46
Mendelsohn, R., K. Emanuel, S. Chonabayashi, and L. Bakkensen, 2012: The impact of 1
climate change on global tropical cyclone damage, Nature Climate Change, 2, 205-2
209. 3
Murakami, H., and Coauthors, 2012: Future Changes in Tropical Cyclone Activity 4
Projected by the New High-Resolution MRI-AGCM. J. Climate, 25, 3237-3260. 5
Oouchi, K., J. Yoshimura, H. Yoshimura, R. Mizuta, S. Kusumoki, and A. Noda, 2006: 6
Tropical cyclone climatology in a global warming climate as simulated in a 20-km-7
mesh global atmospheric model: Frequency and wind intensity analysis. Journal of 8
the Meteorological Society of Japan 84, 259–276. 9
Pawson, S., and M. Fiorino, 1998: A comparison of reanalyses in the tropical 10
stratosphere. Part 1: thermal structure and the annual cycle, Climate Dynamics, 11
14, 631-644. 12
Peduzzi, P., B. Chatenoux, H. Dao, A. De Bono, C. Herold, J. Kossin, F. Mouton, and O. 13
Nordbeck, 2012: Global trends in tropical cyclone risk, Nature Climate Change, 14
2, 289-294. 15
Pielke, R. A. Jr and coauthors, 2008: Normalized hurricane damages in the United States: 16
1900–2005 Nat. Hazard. Rev., 9, 29–42. 17
Po-Chedley, S. and Q. Fu, 2012: Discrepancies in tropical upper tropospheric warming 18
between atmospheric circulation models and satellites. Environmental Research 19
Letters, 7, doi:10.1088/1748-9326/7/4/044018 20
Ramsay, H. A., and A. H. Sobel, 2011: Effects of relative and absolute sea surface 21
temperature on tropical cyclone potential intensity using a single-column model. 22
J. Climate, 24, 183–193. 23
20-Nov-12 Page 31 of 46
Rayner, N. A., D. E. Parker, E. B. Horton, C. K. Folland, L. V. Alexander, D. P. Rowell, 1
E. C. Kent, and A. Kaplan, 2003: Global analyses of sea surface temperature, sea 2
ice, and night marine air temperature since the late nineteenth century. J. 3
Geophys. Res., 108, 4407, doi:10.1029/2002JD002670. 4
Rienecker, M. and coauthors, 2011: MERRA: NASA's Modern-Era Retrospective 5
Analysis for Research and Applications, J. Clim., 24, 3624-3648, doi: 6
10.1175/JCLI-D-11-00015.1. 7
Saha, S., and coauthors, The NCEP Climate Forecast System Reanalysis, 2010: Bull. 8
Amer. Meteor. Soc., 91(8), 1015-1057, doi:10.1175/2010BAMS3001.1. 9
Santer, B. D., and Coauthors, 2005: Amplification of surface temperature trends and 10
variability in the tropical atmosphere.Science, 309, 1551–1556. 11
——, and Coauthors, 2008: Consistency of modelled and observed temperature trends in 12
the tropical troposphere. Int. J. Climatol., DOI: 10.1002/joc.1756. 13
——, T. M. L. Wigley, A. J. Simmons, P. Kahlberg, G. A. Kelly, S. Uppala, C. 14
Ammann, J. S. Boyle, W. Brüggemann, C. Doutriaux, M. Fiorino, C. Mears, G. 15
A. Meehl, R. Sausen, K.E. Taylor, W. M. Washington, M. F. Wehner and F. J. 16
Wentz, 2004: Identification of anthropogenic climate change using a second 17
generation analysis. J. Geophysical Research, 109 (2004) D21104 18
Scoccimarro, E., and Coauthors, 2011: Effects of Tropical Cyclones on Ocean Heat 19
Transport in a High-Resolution Coupled General Circulation Model. J. Climate, 20
24, 4368-4384. 21

20-Nov-12 Page 32 of 46
Seidel, D.J., M. Free, and J.S. Wang, 2012: Reexamining the warming in the tropical 1
upper troposphere: Models versus radiosonde observations. Geophys. Res. Lett. 2
(submitted). 3
Sherwood, S.C., C.L. Meyer, and R.J. Allen, 2008: Robust Tropospheric Warming 4
Revealed by Iteratively Homogenized Radiosonde. J. Climate, 21, 5336-5350. 5
Smith, D. M., R. Eade, N. J. Dunstone, D. Fereday, J. M. Murphy, H. Pohlmann, and A. 6
A. Scaife,, 2010: Skillful multi-year predictions of Atlantic hurricane frequency, 7
Nature Geoscience, 3, 846-849. 8
Sugi, M., and J. Yoshimura, 2004: A mechanism of tropical precipitation change due to 9
CO2 increase. J. Climate, 17, 238-243. 10
Swanson, K. L., 2007: Impact of scaling behavior on tropical cyclone intensities, 11
Geophys. Res. Lett., 34, L18815, doi:10.1029/2007GL030851. 12
——, 2008: Nonlocality of Atlantic tropical cyclone intensities. Geochemistry 13
Geophysics Geosystems 9, Q04V01, doi:10.1029/ 2007GC00184. 14
Thorne, P. W., D. E. Parker, S.F.B. Tett , P.D. Jones, M. McCarthy, H. Coleman, and P. 15
Brohan, 2005: Revisiting radiosonde upper-air temperatures from 1958 to 2002, 16
J. Geophys. Res., 110, D18105, doi:10.1029/2004JD005753, 2005. 17
——, P. Brohan, H.A. Titchner, M.P. McCarthy, S.C. Sherwood, T.C. Peterson, L. 18
Haimberger, D.E. Parker, S.F.B. Tett, B.D. Santer, D.R. Fereday, and J.J. 19
Kennedy, 2011: A quantification of uncertainties in historical tropical 20
tropospheric temperature trends from radiosondes, J. Geophys. Res., 116, 21
D12116, doi:10.1029/2010JD015487. 22
20-Nov-12 Page 33 of 46
Vecchi, G. A., and B. J. Soden, 2007: Effect of remote sea surface temperature change on 1
tropical cyclone potential intensity. Nature, 450, 1066–1071. 2
——, K.L. Swanson, and B.J. Soden 2008: Whither Hurricane Activity? Science 322 3
(5902), 687-689. 4
——, M. Zhao, H. Wang, G. Villarini, A. Rosati, A. Kumar, I. M. Held, and R. Gudgel, 5
2011: Statistical-dynamical predictions of seasonal North Atlantic hurricane 6
activity, Monthly Weather Review, 139(4), 1070-1082. 7
——, R. Msadek, W. Anderson, Y. C. Chang, T. Delworth, K. Dixon, R. Gudgel, A. 8
Rosati, B. Stern, , G. Villarini, A. Wittenberg, X. Yiang, R. Zhang, S. Zhang, and 9
F. Zeng, 2012: Multi-year predictions of North Atlantic hurricane frequency: 10
Promise and limitations, Journal of Climate (submitted). 11
Villarini, G., and G.A. Vecchi, 2012.a: North Atlantic Power Dissipation Index (PDI) and 12
Accumulated Cyclone Energy (ACE): Statistical modeling and sensitivity to sea 13
surface temperature changes. Journal of Climate 25(2), 625-637. 14
——, ——, 2012.b: Projected Increases in North Atlantic Tropical Cyclone Intensity 15
from CMIP5 Models. J. Climate (submitted). 16
——, ——, and ——, 2012: U.S. landfalling and North Atlantic hurricanes: Statistical 17
modeling of their frequencies and ratios. Monthly Weather Review, 140, 44–65,. 18
——, ——, T.R. Knutson, M. Zhao and J.A. Smith, 2011a: Reconciling Differing Model 19
Projections of Changes in the Frequency of Tropical Storms in the North Atlantic 20
Basin in a Warmer Climate, J. Climate, 24(13), 3224-3238, doi: 21
10.1175/2011JCLI3853.1. 22
20-Nov-12 Page 34 of 46
——, ——, ——, and J.A. Smith, 2011b: Is the Recorded Increase in Short Duration 1
North Atlantic Tropical Storms Spurious? J. Geophys. Res. 2
doi:10.1029/2010JD015493 3
Walsh, K., Fiorino, M., Landsea, C. and McInnes, K. 2007. Objectively determined 4
resolution-dependent threshold criteria for the detection of tropical cyclones in 5
climate models and reanalyses. J. Clim., 20(10) 2307-2314. 6
WMO (World Meteorological Organization), 2011: Scientific Assessment of Ozone 7
Depletion: 2010, GLobal Ozone Research and Monitoring Project -- Report No. 8
52, 516 pp., Geneva, Switzerland. 9
Xie, S., C. Deser, G. A. Vecchi, J. Ma, H. Teng, and A. T. Wittenberg, 2010: Global 10
warming pattern formation: Sea surface temperature and rainfall. J. Climate, 23, 11
966–986. 12
Yoshimura, J. and M. Sugi, 2005: Tropical cyclone climatology in a high-resolution 13
AGCM – Impacts of SST warming and CO2 increase. SOLA, 1, 133-136, 14
doi:10.2151/sola.2005-035. 15
Zhao, M., and I. M. Held, 2012: TC-permitting GCM simulations of hurricane frequency 16
response to sea surface temperature anomalies projected for the late 21st century. 17
J. Climate, 25(8), doi:10.1175/JCLI-D-11-00313.1. 18
——, ——, S.-J. Lin, and G. A. Vecchi, 2009: Simulations of global hurricane 19
climatology, interannual variability, and response to global warming using a 50-20
km resolution GCM. J. Climate, 22, 6653–6678. 21
20-Nov-12 Page 35 of 46
——, ——, and G. A. Vecchi, 2010: Retrospective forecasts of the hurricane season 1
using a global atmospheric model assuming persistence of SST anomalies. 2
Mon.Wea. Rev., 138, 3858–3868. 3
Zwillinger, D. 1996: CRC Standard Mathematical Tables and Formulate. CRC Press, 4
Boca Raton, FL, USA, 812pp. 5
6
20-Nov-12 Page 36 of 46
Figure Captions 1
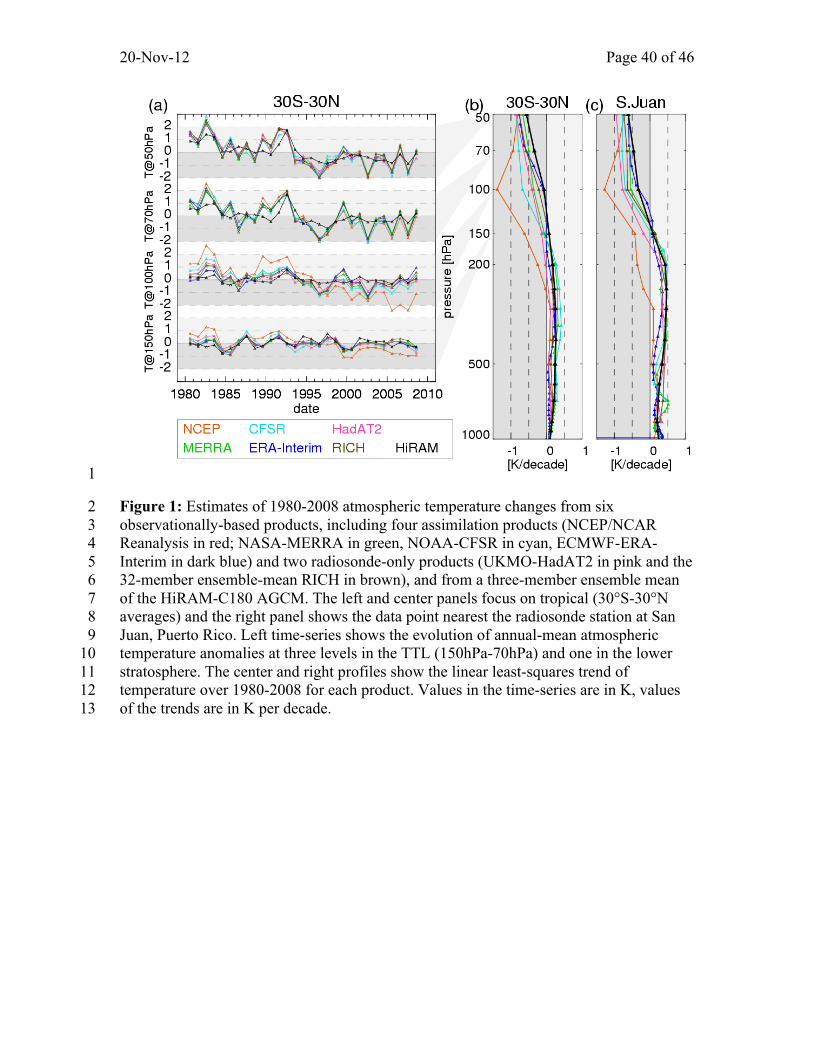
Figure 1: Estimates of 1980-2008 atmospheric temperature changes from six 2
observationally-based products, including four assimilation products (NCEP/NCAR 3
Reanalysis in red; NASA-MERRA in green, NOAA-CFSR in cyan, ECMWF-ERA-4
Interim in dark blue) and two radiosonde-only products (UKMO-HadAT2 in pink and the 5
32-member ensemble-mean RICH in brown), and from a three-member ensemble mean 6
of the HiRAM-C180 AGCM. The left and center panels focus on tropical (30°S-30°N 7
averages) and the right panel shows the data point nearest the radiosonde station at San 8
Juan, Puerto Rico. Left time-series shows the evolution of annual-mean atmospheric 9
temperature anomalies at three levels in the TTL (150hPa-70hPa) and one in the lower 10
stratosphere. The center and right profiles show the linear least-squares trend of 11
temperature over 1980-2008 for each product. Values in the time-series are in K, values 12
of the trends are in K per decade. 13
14
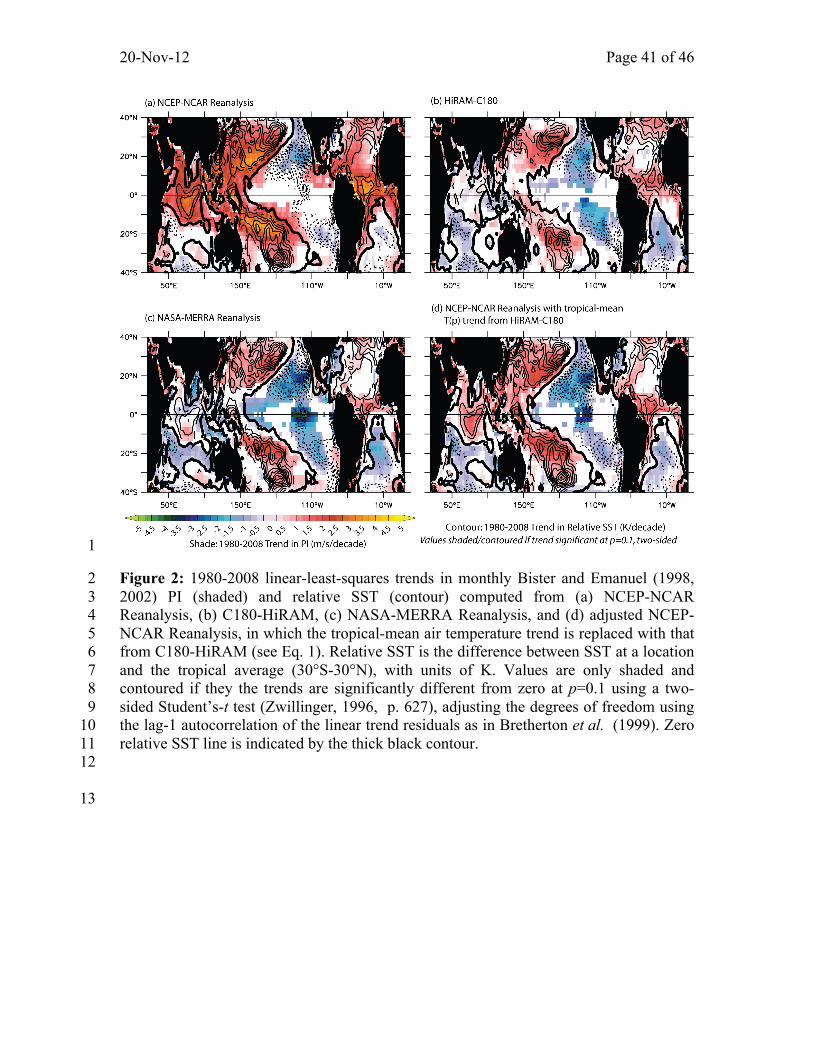
Figure 2: 1980-2008 linear-least-squares trends in monthly Bister and Emanuel (1998, 15
2002) PI (shaded) and relative SST (contour) computed from (a) NCEP-NCAR 16
Reanalysis, (b) C180-HiRAM, (c) NASA-MERRA Reanalysis, and (d) adjusted NCEP-17
NCAR Reanalysis, in which the tropical-mean air temperature trend is replaced with that 18
from C180-HiRAM (see Eq. 1). Relative SST is the difference between SST at a location 19
and the tropical average (30°S-30°N), with units of K. Values are only shaded and 20
contoured if they the trends are significantly different from zero at p=0.1 using a two-21
sided Student’s-t test (Zwillinger, 1996, p. 627), adjusting the degrees of freedom using 22
20-Nov-12 Page 37 of 46
the lag-1 autocorrelation of the linear trend residuals as in Bretherton et al. (1999). Zero 1
relative SST line is indicated by the thick black contour. 2
3
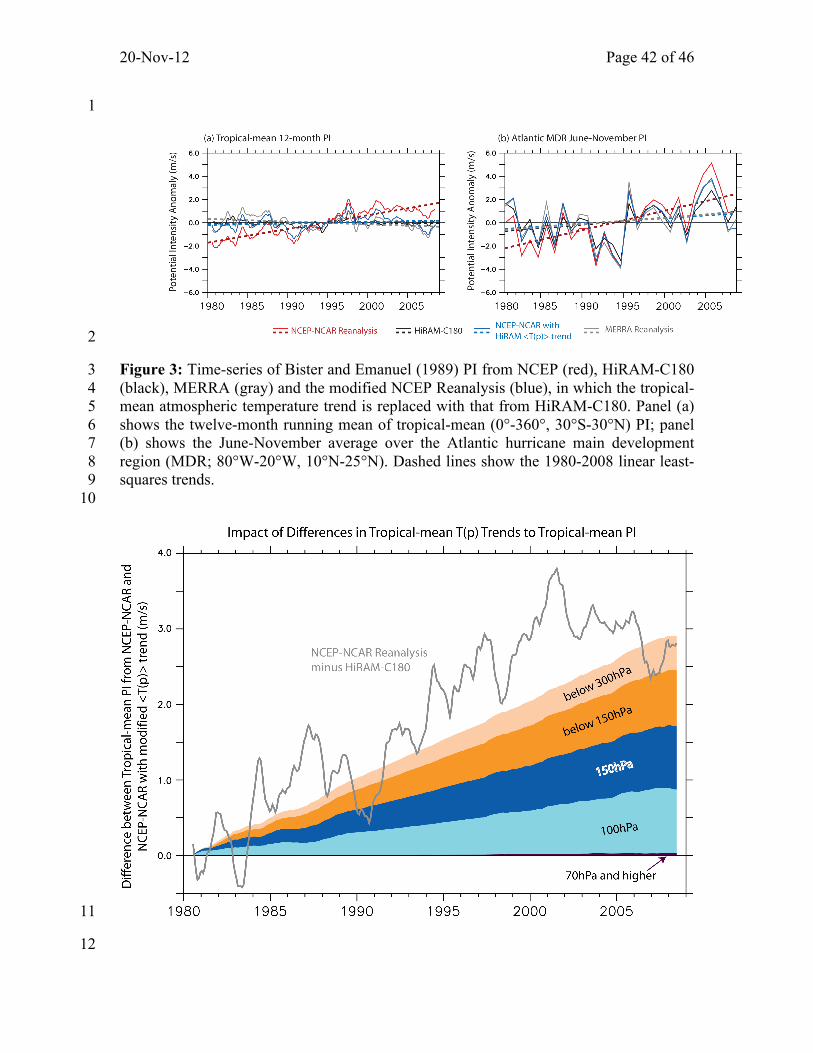
Figure 3: Time-series of Bister and Emanuel (1989) PI from NCEP (red), HiRAM-C180 4
(black), MERRA (gray) and the modified NCEP Reanalysis (blue), in which the tropical-5
mean atmospheric temperature trend is replaced with that from HiRAM-C180. Panel (a) 6
shows the twelve-month running mean of tropical-mean (0°-360°, 30°S-30°N) PI; panel 7
(b) shows the June-November average over the Atlantic hurricane main development 8
region (MDR; 80°W-20°W, 10°N-25°N). Dashed lines show the 1980-2008 linear least-9
squares trends. 10
11
12
Figure 4: Contribution to PI differences between NCEP and HiRAM from different 13
trends in tropical temperature at different atmospheric levels. The gray line shows the 14
twelve-month running mean of the difference between tropical-mean PI in NCEP and 15
HiRAM. The different wedges show the impact on tropical-mean PI of replacing the 16
tropical-mean temperature trend in NCEP with that from HiRAM (see Section 4, Eq. 1). 17
18
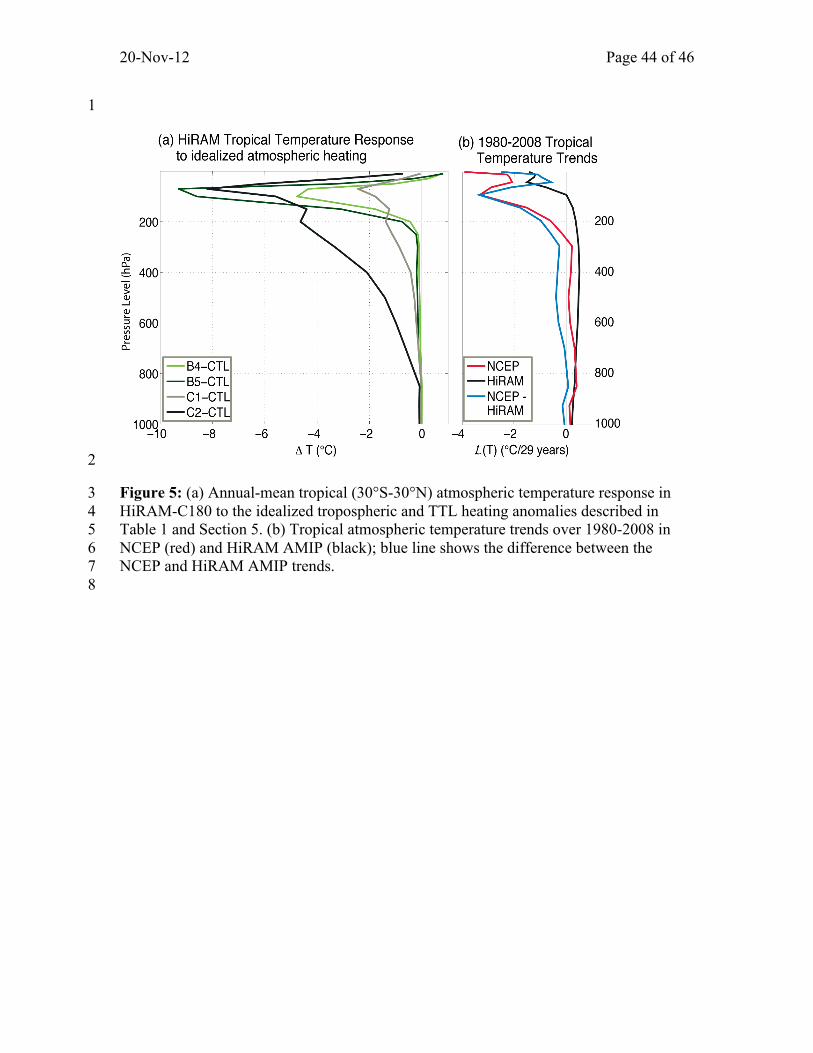
Figure 5: (a) Annual-mean tropical (30°S-30°N) atmospheric temperature response in 19
HiRAM-C180 to the idealized tropospheric and TTL heating anomalies described in 20
Table 1 and Section 5. (b) Tropical atmospheric temperature trends over 1980-2008 in 21
NCEP (red) and HiRAM AMIP (black); blue line shows the difference between the 22
NCEP and HiRAM AMIP trends. 23
20-Nov-12 Page 38 of 46
1
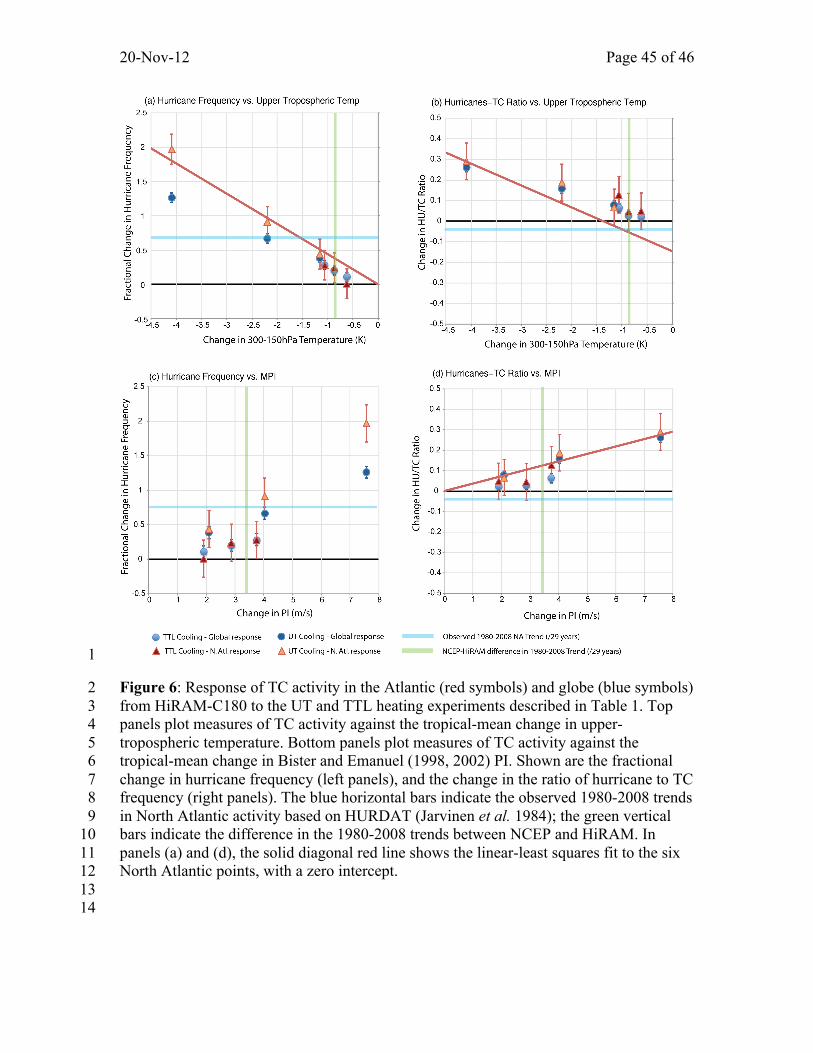
Figure 6: Response of TC activity in the Atlantic (red symbols) and globe (blue symbols) 2
from HiRAM-C180 to the UT and TTL heating experiments described in Table 1. Top 3
panels plot measures of TC activity against the tropical-mean change in upper-4
tropospheric temperature. Bottom panels plot measures of TC activity against the 5
tropical-mean change in Bister and Emanuel (1998, 2002) PI. Shown are the fractional 6
change in hurricane frequency (left panels), and the change in the ratio of hurricane to TC 7
frequency (right panels). The blue horizontal bars indicate the observed 1980-2008 trends 8
in North Atlantic activity based on HURDAT (Jarvinen et al. 1984); the green vertical 9
bars indicate the difference in the 1980-2008 trends between NCEP and HiRAM. In 10
panels (a) and (d), the solid diagonal red line shows the linear-least squares fit to the six 11
North Atlantic points, with a zero intercept. 12
13
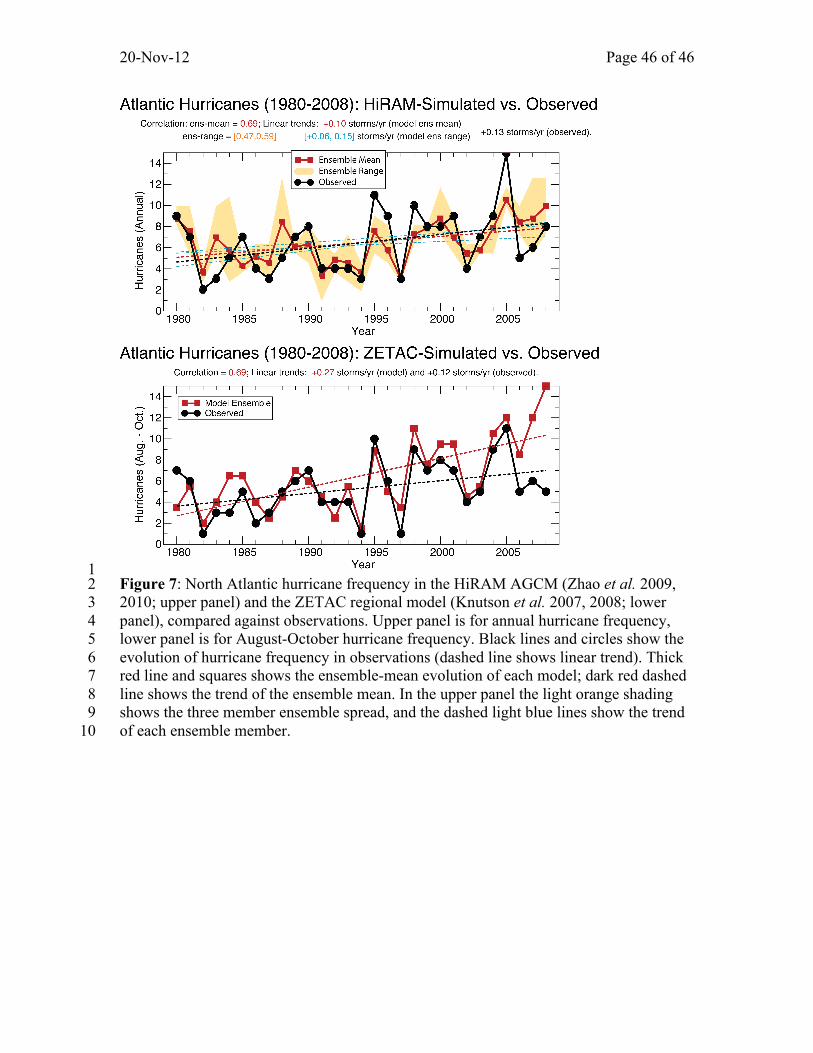
Figure 7: North Atlantic hurricane frequency in the HiRAM AGCM (Zhao et al. 2009, 14
2010; upper panel) and the ZETAC regional model (Knutson et al. 2007, 2008; lower 15
panel), compared against observations. Upper panel is for annual hurricane frequency, 16
lower panel is for August-October hurricane frequency. Black lines and circles show the 17
evolution of hurricane frequency in observations (dashed line shows linear trend). Thick 18
red line and squares shows the ensemble-mean evolution of each model; dark red dashed 19
line shows the trend of the ensemble mean. In the upper panel the light orange shading 20
shows the three member ensemble spread, and the dashed light blue lines show the trend 21
of each ensemble member. 22
23
20-Nov-12 Page 39 of 46
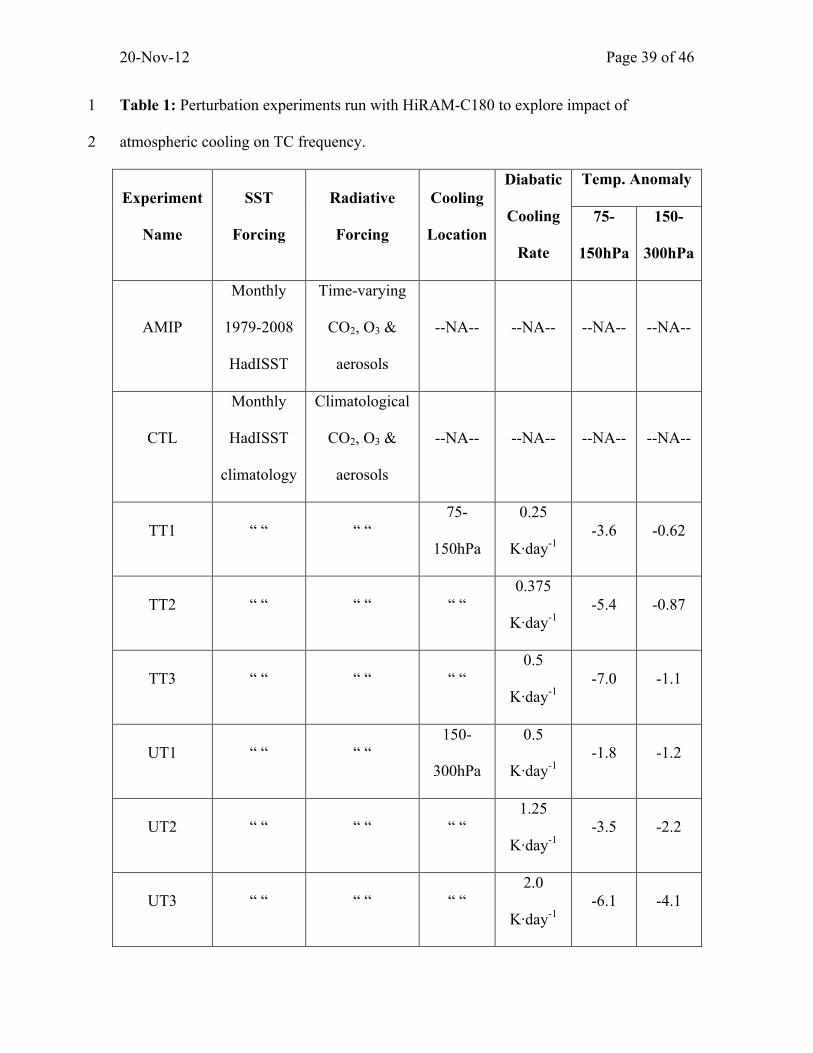
Table 1: Perturbation experiments run with HiRAM-C180 to explore impact of 1
atmospheric cooling on TC frequency. 2
Experiment
Name
SST
Forcing
Radiative
Forcing
Cooling
Location
Diabatic
Cooling
Rate
Temp. Anomaly
75-
150hPa
150-
300hPa
AMIP
Monthly
1979-2008
HadISST
Time-varying
CO2, O3 &
aerosols
--NA-- --NA-- --NA-- --NA--
CTL
Monthly
HadISST
climatology
Climatological
CO2, O3 &
aerosols
--NA-- --NA-- --NA-- --NA--
TT1 “ “ “ “ 75-
150hPa
0.25
K·day-1 -3.6 -0.62
TT2 “ “ “ “ “ “ 0.375
K·day-1 -5.4 -0.87
TT3 “ “ “ “ “ “ 0.5
K·day-1 -7.0 -1.1
UT1 “ “ “ “ 150-
300hPa
0.5
K·day-1 -1.8 -1.2
UT2 “ “ “ “ “ “ 1.25
K·day-1 -3.5 -2.2
UT3 “ “ “ “ “ “ 2.0
K·day-1 -6.1 -4.1
20-Nov-12 Page 40 of 46
1
Figure 1: Estimates of 1980-2008 atmospheric temperature changes from six 2 observationally-based products, including four assimilation products (NCEP/NCAR 3 Reanalysis in red; NASA-MERRA in green, NOAA-CFSR in cyan, ECMWF-ERA-4 Interim in dark blue) and two radiosonde-only products (UKMO-HadAT2 in pink and the 5 32-member ensemble-mean RICH in brown), and from a three-member ensemble mean 6 of the HiRAM-C180 AGCM. The left and center panels focus on tropical (30°S-30°N 7 averages) and the right panel shows the data point nearest the radiosonde station at San 8 Juan, Puerto Rico. Left time-series shows the evolution of annual-mean atmospheric 9 temperature anomalies at three levels in the TTL (150hPa-70hPa) and one in the lower 10 stratosphere. The center and right profiles show the linear least-squares trend of 11 temperature over 1980-2008 for each product. Values in the time-series are in K, values 12 of the trends are in K per decade. 13
20-Nov-12 Page 41 of 46
1
Figure 2: 1980-2008 linear-least-squares trends in monthly Bister and Emanuel (1998, 2 2002) PI (shaded) and relative SST (contour) computed from (a) NCEP-NCAR 3 Reanalysis, (b) C180-HiRAM, (c) NASA-MERRA Reanalysis, and (d) adjusted NCEP-4 NCAR Reanalysis, in which the tropical-mean air temperature trend is replaced with that 5 from C180-HiRAM (see Eq. 1). Relative SST is the difference between SST at a location 6 and the tropical average (30°S-30°N), with units of K. Values are only shaded and 7 contoured if they the trends are significantly different from zero at p=0.1 using a two-8 sided Student’s-t test (Zwillinger, 1996, p. 627), adjusting the degrees of freedom using 9 the lag-1 autocorrelation of the linear trend residuals as in Bretherton et al. (1999). Zero 10 relative SST line is indicated by the thick black contour. 11 12
13
20-Nov-12 Page 42 of 46
1
2
Figure 3: Time-series of Bister and Emanuel (1989) PI from NCEP (red), HiRAM-C180 3 (black), MERRA (gray) and the modified NCEP Reanalysis (blue), in which the tropical-4 mean atmospheric temperature trend is replaced with that from HiRAM-C180. Panel (a) 5 shows the twelve-month running mean of tropical-mean (0°-360°, 30°S-30°N) PI; panel 6 (b) shows the June-November average over the Atlantic hurricane main development 7 region (MDR; 80°W-20°W, 10°N-25°N). Dashed lines show the 1980-2008 linear least-8 squares trends. 9 10
11
12

20-Nov-12 Page 43 of 46
Figure 4: Contribution to PI differences between NCEP and HiRAM from different 1 trends in tropical temperature at different atmospheric levels. The gray line shows the 2 twelve-month running mean of the difference between tropical-mean PI in NCEP and 3 HiRAM. The different wedges show the impact on tropical-mean PI of replacing the 4 tropical-mean temperature trend in NCEP with that from HiRAM (see Section 4, Eq. 1). 5
20-Nov-12 Page 44 of 46
1
2
Figure 5: (a) Annual-mean tropical (30°S-30°N) atmospheric temperature response in 3 HiRAM-C180 to the idealized tropospheric and TTL heating anomalies described in 4 Table 1 and Section 5. (b) Tropical atmospheric temperature trends over 1980-2008 in 5 NCEP (red) and HiRAM AMIP (black); blue line shows the difference between the 6 NCEP and HiRAM AMIP trends. 7 8
20-Nov-12 Page 45 of 46
1
Figure 6: Response of TC activity in the Atlantic (red symbols) and globe (blue symbols) 2 from HiRAM-C180 to the UT and TTL heating experiments described in Table 1. Top 3 panels plot measures of TC activity against the tropical-mean change in upper-4 tropospheric temperature. Bottom panels plot measures of TC activity against the 5 tropical-mean change in Bister and Emanuel (1998, 2002) PI. Shown are the fractional 6 change in hurricane frequency (left panels), and the change in the ratio of hurricane to TC 7 frequency (right panels). The blue horizontal bars indicate the observed 1980-2008 trends 8 in North Atlantic activity based on HURDAT (Jarvinen et al. 1984); the green vertical 9 bars indicate the difference in the 1980-2008 trends between NCEP and HiRAM. In 10 panels (a) and (d), the solid diagonal red line shows the linear-least squares fit to the six 11 North Atlantic points, with a zero intercept. 12 13 14
20-Nov-12 Page 46 of 46
1 Figure 7: North Atlantic hurricane frequency in the HiRAM AGCM (Zhao et al. 2009, 2 2010; upper panel) and the ZETAC regional model (Knutson et al. 2007, 2008; lower 3 panel), compared against observations. Upper panel is for annual hurricane frequency, 4 lower panel is for August-October hurricane frequency. Black lines and circles show the 5 evolution of hurricane frequency in observations (dashed line shows linear trend). Thick 6 red line and squares shows the ensemble-mean evolution of each model; dark red dashed 7 line shows the trend of the ensemble mean. In the upper panel the light orange shading 8 shows the three member ensemble spread, and the dashed light blue lines show the trend 9 of each ensemble member. 10