Embed Size (px)
Citation preview

WORKING PAPER NO. 172
IMPACT ON INDIA OF TARIFF AND QUANTITATIVE
RESTRICTIONS UNDER WTO
Bishwanath Goldar
NOVEMBER 2005
INDIAN COUNCIL FOR RESEARCH ON INTERNATIONAL ECONOMIC RELATIONS Core-6A, 4th Floor, India Habitat Centre, Lodi Road, New Delhi-110 003
Website: www.icrier.org

IMPACT ON INDIA OF TARIFF AND QUANTITATIVE RESTRICTIONS UNDER WTO
Bishwanath Goldar
NOVEMBER 2005
The views expressed in the ICRIER Working Paper Series are those of the author(s) and do not necessarily reflect those of the Indian Council for Research on International Economic Relations (ICRIER).

Table of Contents
FOREWORD ................................................................................................................................................. I
1. INTRODUCTION ............................................................................................................................... 1
2. TARIFF REFORM ............................................................................................................................. 4
3. LIBERALIZATION OF TEXTILES IMPORTS............................................................................. 6
4. REMOVAL OF QRS IN 2000 AND 2001........................................................................................ 12
5. CONCLUDING REMARKS ............................................................................................................ 16
REFERENCES ........................................................................................................................................... 18
List of Tables
TABLE 1: INDIA’S URUGUAY ROUND BOUND RATES, PREVAILING TARIFF RATES IN THE BASE PERIOD AND
APPLIED RATES IN 1995-96, AVERAGES FOR SELECTED SECTIONS ......................................................... 1 TABLE 2: EXTENT OF QR (%) ON TEXTILES IMPORTS, 1988-89 TO 1999-00 ................................................... 7 TABLE 3: EXPORTS AND IMPORTS OF TEXTILES, 1987-88 TO 2003-04 (MILLION $)......................................... 7 TABLE 4: TEXTILE IMPORTS, 2002-03 AND 2003-04 (RS MILLION)................................................................ 10 TABLE 5: PRODUCTION OF TEXTILES............................................................................................................. 11 TABLE 6: IMPORTS OF 300 ‘SENSITIVE ITEMS’, 2000 TO 2003 (US $ MILLION) ............................................. 14 TABLE 7: IMPORTS AND EXPORTS OF SELECT ITEMS FREED FROM QR IN 2000/2001 (RS MILLION) .............. 15

i
Foreword
This paper assesses the impact of India’s unilateral tariff reductions and lowering
of Quantitative restrictions since 1991. It then evaluates the WTO commitments on non-
agricultural market access in the light of these reductions. This short paper based on hard
quantitative analysis is a valuable addition to the literature on the impact of tariff
reductions and NAMA issues in WTO.
We are very grateful to the Sir Ratan Tata Trust for supporting our research on
WTO issues.
Arvind Virmani
Director & Chief Executive ICRIER
November 2005

1
1. Introduction
In the Uruguay Round negotiations, India agreed to reduce tariff on a large
number of commodities and remove quantitative restrictions (QRs) on all commodities,
except for about 600 commodities at ITC-HS (International Trade Classification,
Harmonized System) 8-digit or 10-digit level or their sub-groups for security or other
reasons (under Article XX and XXI of GATT, 1994).
India committed to make adjustments in the tariff rates for 3373 commodities at
6-digit HS level or sub-groups of 6-digit HS level, constituting about 65 per cent of the
total number of tariff lines (Mehta 1999; Mehta and Mohanty, 1999). The “offer rates”
or “bound rates of duty” for these 3373 commodities were in general significantly lower
than the “base rates”(see Table 1). For industrial products, India’s commitment was to
bring down the average tariff rate from about 71 per cent in the pre-Uruguay Round
period to about 32 per cent in the post-Uruguay Round era (Mehta, 2001).
Table 1: India’s Uruguay Round Bound Rates, Prevailing Tariff Rates in the Base Period and Applied Rates in 1995-96, Averages for Selected Sections
Section/Description Import-weighted average MFN rate Prevailing in the
base period (1.9.86 or 1.1.90)
UR bound rate Applied rate, 1995-96
IV Prepared foodstuff; beverages, spirits and vinegar
103.3 146.1 62.6
VI. Products of chemical and allied industries
105.4 34.6 51.4
VII Plastics and articles thereof; rubber and articles thereof
131.1 39.7 75.8
XI Textiles and textile articles 94.1 64.3 57.8
XIII Articles of stone, plaster, cement, asbestos, mica
115.1 37.9 58.9
XV Base metals and articles of base metal 114.2 38.5 56.7
XVI Machinery and mechanical appliances; electrical equipment
89.2 32.4 54.6
Source: Mehta (1999).

2
As regards removal of QRs, India had removed most but not all QRs on
manufactured intermediate goods and machinery in 1991. But, nearly all consumer goods
remained subject to import licensing, in practice an import ban, and the import of nearly
all agricultural products was subject to import licensing or controlled by parastatal import
monopolies (canalizing agencies) (Pursell and Sattar, 2003). In May 1995, about two-
thirds of tradable GDP (gross domestic product) was still protected by some kind of non-
tariff import restrictions: 84 per cent of agriculture, 36 per cent of manufacturing and 40
per cent of mining and querying (Pursell, 1996). Within manufacturing, the relevant
proportions were 10 per cent for machinery, 12 per cent for intermediate goods, and 79
per cent for consumer goods (Pursell, 1996). During the years 1995 to 2001, these
restrictions on imports were gradually removed in a large measure in response to
international pressures (Pursell and Sattar, 2003). The first of these pressures came from
Uruguay Round negotiations on textiles and clothing, the second from a dispute brought
against India at the WTO in the matter of imposing QRs on imports under the balance-of-
payments clause of the GATT (Article XVIII (B)).
While the 1991 reforms removed QRs on most manufactured intermediate and
capital goods, there was little change in the import policy for textiles and clothing, and
the imports of these products remained practically banned. The situation began to change
substantially in December 1994 when in separate treaties with the EU and the USA, India
agreed to a comprehensive liberalization of import policies for textiles. This liberalization
in imports of textiles was agreed to in part as quid pro quo for the ATC (Agreement on
Textiles and Clothing) to phase out the MFA quotas, and in part in exchange for
increased MFA quotas in the US and EU markets (Pursell and Sattar, 2003). The reform
process began in early 1995 with the removal of QRs on imports of wool tops, synthetic
fibers, textile yarn and some selected industrial fabrics. Simultaneously, selected textile
fabrics (mostly woolen and synthetic fabrics), selected textile products (“made-ups”) and
a fairly long list of apparel items (about 125 of the 233 six-digit HS tariff lines in the
apparel chapter) were made eligible to be imported against SIL (Special Import License)
given to exporters. It was also agreed that these products would be free from import
licensing altogether at specified future dates (1998, 2000 or 2002), and tariff rates would

3
be reduced to levels of between 20 and 40 percent by 2000. Though most cotton fabrics
and about half of the apparel tariff lines were omitted from the treaties, the EU/US
agreements constituted, for India, a major commitment towards liberalization of textiles
imports.
Turning now to the other international pressure mentioned above, since 1955,
India had used the GATT balance of payments provision (Article VIII(B)) to justify her
routine use of QRs. Soon after the Uruguay Round agreements became effective, India’s
unconstrained use of the balance of payments provision was challenged by the US, EU
and other developed countries (Pursell and Sattar, 2003). It became difficult for India to
justify QRs on grounds of balance of payments since there was a strong current account,
substantial capital inflow and large foreign exchange reserves. In 1999-00, 2134 items (at
8-digit or 10-digit HS classification or sub-groups) were subject to QRs, of which 1589
items (1429 at 6-digit HS level) had QR on imports, being maintained under the balance
of payments provision (Mehta and Mohanty, 1999). India reached mutual agreement with
Australia, Canada, EU, New Zealand, Switzerland and Japan for elimination of QRs on
these products in a phased manner by March 31, 2003. The US, however, did not agree to
this plan, and persisted in the Dispute Settlement Body. The US won the case, and India
had to eliminate QRs on all commodities (except the 600 odd items mentioned above).1
QRs on imports were removed for 715 items at 6-digit HS level (or 772 items at 8 or 10
digit level) in Export-Import Policy of 2000/01, and for another 714 items on April 1,
2001.
1 There is a perception in some quarters that India had to shed the balance of payments cover because of an obligation taken during the Uruguay Round. This is not correct. The cover was a derogation from the obligation under GATT 1947 itself and since the objective conditions for the grant of the derogation had disappeared, it would have necessary for India to give up the cover whether or not the new organization had come into existence. It is, of course, true that an Understanding on BOP was negotiated in the Uruguay Round, but that did not in any way materially change the core disciplines of Article XVIII of the GATT and would have made no difference in the outcome of the consideration of India’s case for continued justification of the cover. Nonetheless, it seems reasonable to argue that if India’s use of the BOP cover was not challenged, India might have continued with the QRs on the 1429 item for a longer period. Hence, the removal of QR on these items in 2000 and 2001 may be regarded an outcome of India’s commitments under WTO.

4
The object of this paper is to examine how Indian industry has been impacted by
India’s commitments on tariff and quantitative restrictions under WTO. Assessment of
the impact is made on the basis of the increases in imports of industrial products that took
place as a result of import liberalization that India had to do because of her commitments
under WTO. The increases in exports of the products freed from trade restrictions are
also studied because import liberalization is expected to lead to increases in exports
(removal of anti-export bias, pro-competitive effects, etc), and therefore the net exports
need not fall and domestic production may not decline in spite of increased import
penetration.
The rest of the paper is organized as follows. Section 2 discusses India’s tariff
reforms in the 1990s and later, and its impact on domestic industry. Sections 3 and 4
respectively deal with the impact of India’s commitments for liberalizing imports of
textiles, and the impact of removal of QRs on 1429 items at 6-digit HS (mostly consumer
goods) in 2000 and 2001. The main findings are summarizes and some concluding
remarks are made in Section 5.
2. Tariff Reform
India’s customs tariff rates have been declining since 1991. The “peak” rate came
down from 150% in 1991-92 to 40% in 1997-98. The downward momentum was
reversed the next year with the imposition of a surcharge. This momentum resumed with
the reduction of the “peak” rate to 35% in 2001-02 and 30% in 2002-03. “Peak” rate
(applicable to all manufactured and mineral products except alcoholic beverages and
automobiles) was reduced to 20% at the end of 2003-04.
The simple average tariff rate has accordingly declined from 81.8% in 1990 to
32.4% in 1999 and to 29% in 2002 (Virmani, et al. 2003). For industrial products, the
import weighted average tariff has declined from about 91% in 1987-88 to 30% in 1997-
98 (Nauroz, 2001). According to the estimates of Mehta (2003), the import weighted
average tariff for Indian industries declined from 84% in 1993-94 to 30% in 1999-00 and
5
further to 27% in 2001-02. Thus, both studies report a substantial fall in the average tariff
for industrial goods in the post-reforms period.
A comparison of applied tariff rates for industrial products with the bound rates of
duty for 2001-02 done by Mehta (2003) brings out that the applied rates in that year were
significantly lower than the bound rates for a large number of items. Out of 3298 lines for
which India has bound the rates of duty (mostly at 40% or 25%), 1040 lines had applied
rate equal to the bound rate (for five lines, applied rate exceeded bound rate). In other
cases, the applied rate was lower than the bound rate. For 588 items or lines, i.e. about
18% of bound lines, the applied rate was less than the bound rate by 15 percentage points
or more. Between 2001-02 and 2004-05, the peak rate of duty has been brought down
from 35% to 20%. Thus, at present, only a small proportion of items (if any) have
applied rate equal to the bound rate. It seems therefore that for a majority of industrial
products the current applied rate is significantly lower than the bound rate.
It is evident from the above that India has drastically reduced the level of tariff,
particularly industrial tariff, in the period since 1991. This reduction should not, however,
be attributed to India’s commitment under WTO because the tariff rates have in most
cases been brought down to a level well below the rates committed. It seems reasonable
to argue that the tariff reform undertaken by India in the last 14 years was mostly done at
India’s own initiative (induced by the benefits expected from such reforms) and had little
to do with India’s commitment under WTO.
In a number of empirical studies, the impact of India’s trade reforms, particularly
tariff reforms, on domestic industry has been examined. To highlight the findings of
some of the studies, Das (2003) finds that, on an average, the import penetration ratio in
Indian industries did not increase in the period 1991-95 as compared to the period 1986-
90, and there was only a marginal increase in the import penetration ratio in the period
1996-2000 despite marked reduction in the tariff and non-tariff barriers. Goldar and
Kumari (2003) and Topalova (2003) find a significant favourable effect of tariff reforms
on industrial productivity. Virmani et al. (2003, 2004) find that tariff reductions had a

6
significant favourable effect on exports in a number of industrial sub-sectors, which is
attributed to pro-competitive effects of tariff reform. It appears therefore that tariff
reforms did not lead to a general surge in imports of industrial goods adversely affecting
domestic industry.2 On the other hand, there is some evidence to indicate that tariff
reform contributed to higher industrial productivity and better export performance. But,
these effects noted in the studies cited above cannot be ascribed to India’s tariff
commitments under WTO, since the tariff reform took place largely independent of the
WTO commitments.
3. Liberalization of Textiles Imports
As discussed above, India agreed to remove quantitative restrictions on imports of
textiles (also reduce tariff) as quid pro quo for the ATC, and in exchange for increased
MFA quotas in the US and EU markets. This process began from 1995, and continued in
subsequent years. In 2000 and 2001, QRs were removed on 1429 items (discussed further
in Section 4) and these included a large number of textile items. Thus, by 2001, QRs on
textile imports were completely (or almost completely) removed.
The estimates of QRs on textiles made in an NCAER study reveal that the extent
of QR on imports of textiles in 1995-96 was substantially lower than that in1988-89 (see
Table 2), and it declined further in subsequent years. The import coverage ratio for
cotton textiles was 100% in 1988-89. It fell to 45% in 1995-96, and 39% in 1999-00. For
readymade garments, the relevant proportion was 100% in 1988-89, 94% in 1995-96, and
62% in 1999-00.3
2 Nambiar et al. (1999), however, hold a different view. According to them, since liberalisation, trade has shrunk India’s manufacturing base in terms of value addition and employment. The intermediate and capital goods industries have suffered more than consumer goods. Manufacturing has shifted from high-skilled, capital intensive production to low-skilled labour intensive production. 3 If adjustment is done for SIL, the extent of QRs on readymade garments was 70% in 1995-96 and 51% in 1999-00.

7
Table 2: Extent of QR (%) on Textiles Imports, 1988-89 to 1999-00
Sectors 1988-89 1995-96 1997-98 1998-99 1999-00
Khadi, cotton textiles
100.00 45.11 44.69 44.69 39.29
Woolen textiles 100.00 27.27 27.27 27.27 27.27
Silk textiles 100.00 73.33 73.33 73.33 73.33
Art silk, synthetic fibre textiles
100.00 41.93 41.75 41.75 37.69
Jute, hemp, mesta textiles
100.00 60.71 60.71 60.71 57.14
Carpet weaving 100.00 100.00 100.00 97.22 83.33
Readymade garments
100.00 93.90 90.99 85.95 61.59
Miscellaneous textiles products
100.00 65.37 64.29 57.18 43.18
Source: NCAER (2000).
How have these changes in trade policy impacted the domestic textiles industry?
To find an answer to this question, it may be useful to examine the trends in imports and
exports of textiles in second half of the 1990s and later, and also take a look at trends in
domestic production.
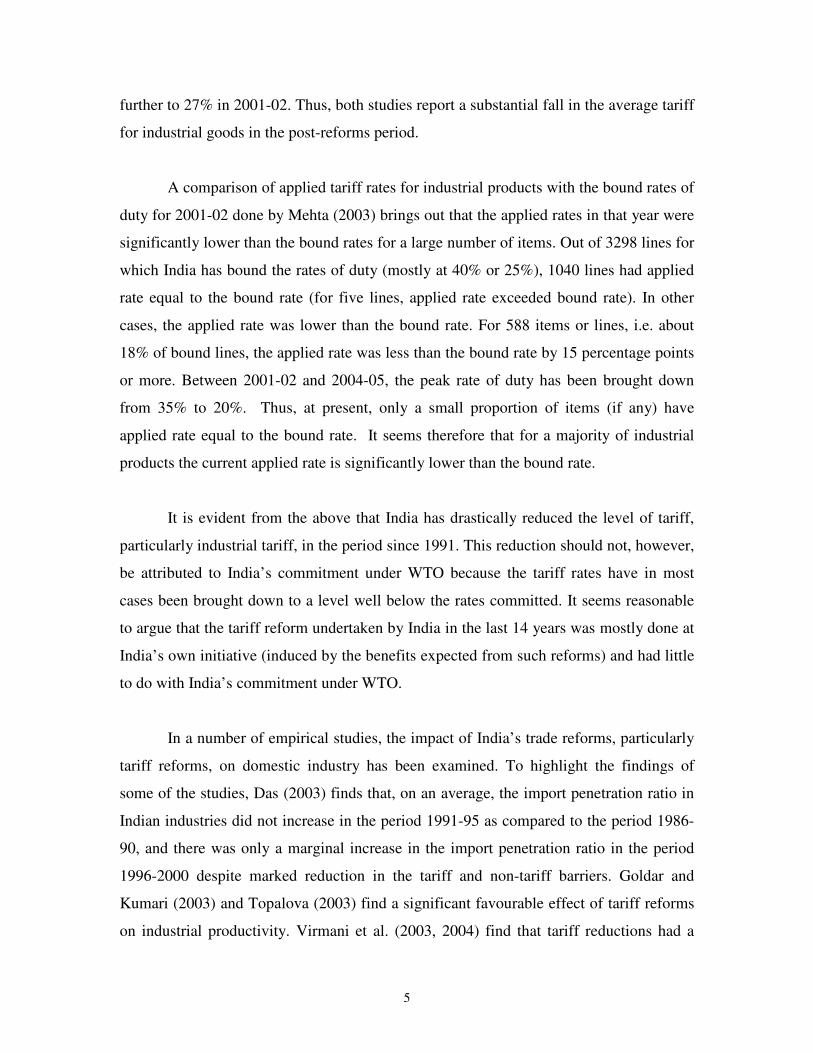
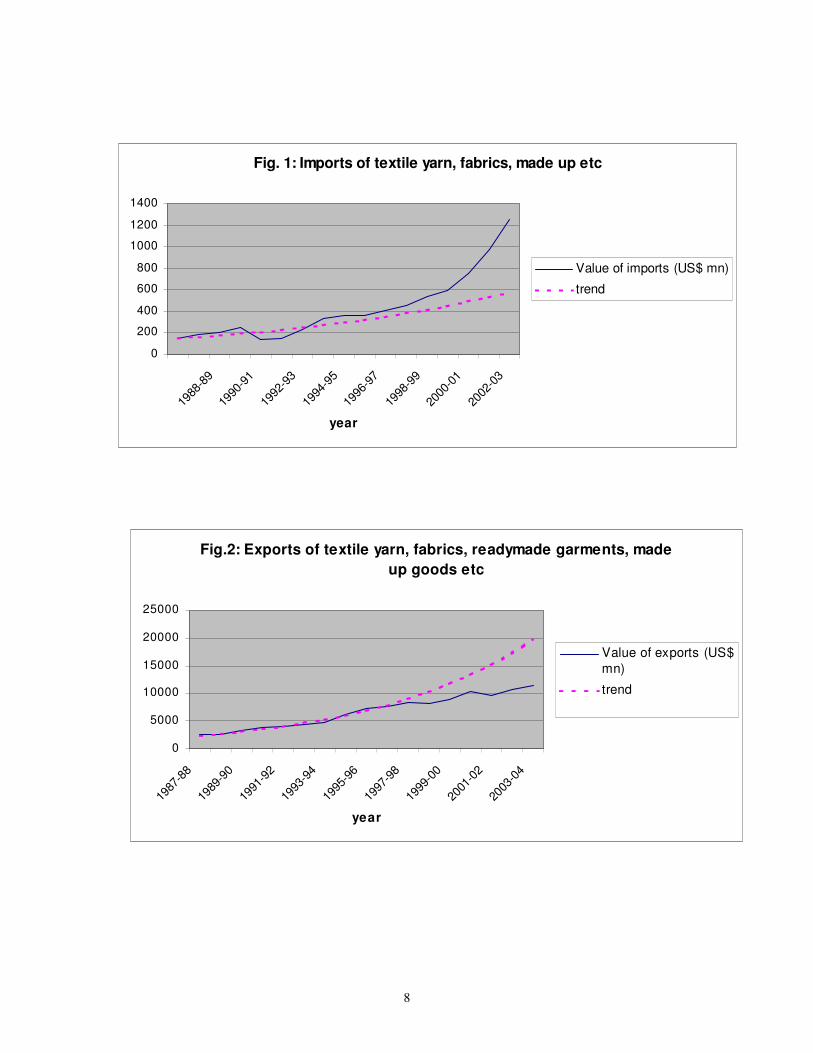
Data on exports and imports of textiles in the period 1987-88 to 2003-04 are given
in Table 3. A graphic presentation of the data is made in Figures 1 and 2. The actual
values of imports and exports are compared with the trend value based on an exponential
trend equation fitted to the data for the period 1987-88 to 1995-96.
Table 3: Exports and Imports of Textiles, 1987-88 to 2003-04 (million $)
Year Exports Imports Year Exports Imports
1987-88 2696 144 1996-97 8026 359
1988-89 2689 186 1997-98 8487 409
1989-90 3373 203 1998-99 8303 457
1990-91 3969 247 1999-00 9126 538
1991-92 4192 137 2000-01 10657 597
1992-93 4448 149 2001-02 9665 748
1993-94 4891 229 2002-03 11036 970
1994-95 6533 330 2003-04 11909 1250
1995-96 7448 359
Source: Reserve Bank of India, Handbook of Statistics of the Indian Economy, 2003-04
8
Fig. 1: Imports of textile yarn, fabrics, made up etc
0
200
400
600
800
1000
1200
1400
1988
-89
1990
-91
1992
-93
1994
-95
1996
-97
1998
-99
2000
-01
2002
-03
year
Value of imports (US$ mn)
trend
Fig.2: Exports of textile yarn, fabrics, readymade garments, made
up goods etc
0
5000
10000
15000
20000
25000
1987
-88
1989
-90
1991
-92
1993
-94
1995
-96
1997
-98
1999
-00
2001
-02
2003
-04
year
Value of exports (US$mn)
trend

9
Analysis of import data reveals that textile imports in the second half of the 1990s
did not deviate much from the trend, but in more recent years there has been a sharp
increase in textile imports.4 This sharp increase in imports of textiles in the years 2000-01
to 2003-04 seems to be attributable in the main to India’s commitments under WTO.
India’s exports of textiles on the other hand have lagged behind trend (see Figure 2). The
explanation may lie partly in a slow growth in the global textile exports. While global
textile exports grew at the rate of about 14 per cent per annum during 1985 to 1995, the
growth rate in the period 1995 to 2001 was only about 2 per cent per annum (based on
data on World Exports given in Economic Survey, 2003-04).
In absolute value, the recent increase in aggregate imports of textiles is small in
relation to that in exports and the total value of textiles production,5 and therefore the
effect of these increases in imports on domestic industry must have been modest. At the
same time it needs to be recognized that in some products, the increase in imports may
have been quite large in relation to the increase in exports and the size of domestic
industry, and this might have adversely affected capacity utilization of domestic firms
producing those products, compelling them to restructure.
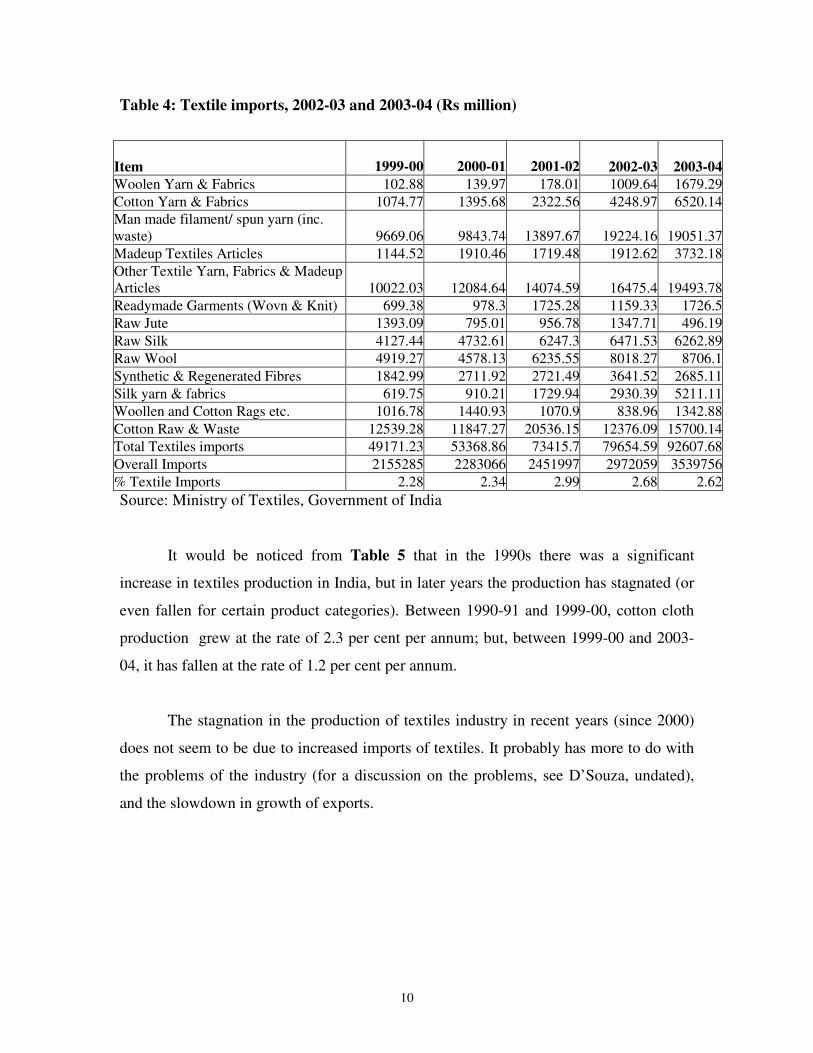
Disaggregate data on textile imports (Table 4) reveal that in recent years there has
been a substantial increase in imports of cotton yarn and fabrics, silk yarn and fabrics,
manmade filament/spun yarn (including waste), textile yarn and fabrics of material other
than cotton, silk, wool, and manmade filament, and madeup textile articles. By
comparison, there has been much smaller increase in imports of readymade garments.
4 This contradicts the conclusion drawn by Verma (2001) on the basis of analysis of trade data for the 1990s. Verma concluded that the growth rate of imports of textiles into India has been more rapid before the WTO came into existence than after India’s commitment to reduce tariff came into effect. 5 The increase in imports of textiles between 1999-00 and 2003-04 was about US$ 700 million, while the increase in textile exports was about US$ 2800 million. Total domestic production of textiles in 1999-00 was about US$ 26,000. Contrast this to increase in imports and exports in the period 1994-95 to 1999-00. The increase in imports was about US$ 200 million and that in exports about US$2600 million.
10
Table 4: Textile imports, 2002-03 and 2003-04 (Rs million)
Item 1999-00
2000-01 2001-02 2002-03 2003-04Woolen Yarn & Fabrics 102.88 139.97 178.01 1009.64 1679.29
Cotton Yarn & Fabrics 1074.77 1395.68 2322.56 4248.97 6520.14
Man made filament/ spun yarn (inc. waste) 9669.06 9843.74 13897.67 19224.16 19051.37
Madeup Textiles Articles 1144.52 1910.46 1719.48 1912.62 3732.18
Other Textile Yarn, Fabrics & Madeup Articles 10022.03 12084.64 14074.59 16475.4 19493.78
Readymade Garments (Wovn & Knit) 699.38 978.3 1725.28 1159.33 1726.5
Raw Jute 1393.09 795.01 956.78 1347.71 496.19
Raw Silk 4127.44 4732.61 6247.3 6471.53 6262.89
Raw Wool 4919.27 4578.13 6235.55 8018.27 8706.1
Synthetic & Regenerated Fibres 1842.99 2711.92 2721.49 3641.52 2685.11
Silk yarn & fabrics 619.75 910.21 1729.94 2930.39 5211.11
Woollen and Cotton Rags etc. 1016.78 1440.93 1070.9 838.96 1342.88
Cotton Raw & Waste 12539.28 11847.27 20536.15 12376.09 15700.14
Total Textiles imports 49171.23 53368.86 73415.7 79654.59 92607.68
Overall Imports 2155285 2283066 2451997 2972059 3539756
% Textile Imports 2.28 2.34 2.99 2.68 2.62
Source: Ministry of Textiles, Government of India
It would be noticed from Table 5 that in the 1990s there was a significant
increase in textiles production in India, but in later years the production has stagnated (or
even fallen for certain product categories). Between 1990-91 and 1999-00, cotton cloth
production grew at the rate of 2.3 per cent per annum; but, between 1999-00 and 2003-
04, it has fallen at the rate of 1.2 per cent per annum.
The stagnation in the production of textiles industry in recent years (since 2000)
does not seem to be due to increased imports of textiles. It probably has more to do with
the problems of the industry (for a discussion on the problems, see D’Souza, undated),
and the slowdown in growth of exports.

11
Table 5: Production of Textiles
Production of cotton yarn
Production of cotton cloth
Production of manmade fibre fabrics
Production of cloth
(mn KG) mn sq. meters mn sq. meters mn sq. mt
1990-91 1510 15431 4874
1991-92
1992-93 1569 16343 5099
1993-94 1697 17790 5928
1994-95 1696 17019 6400
1995-96 1894 18900 7316 31460
1996-97 2148 19841 8253 34298
1997-98 2213 19992 9376 36896
1998-99 2022 17948 10897 35543
1999-00 2204 18989 11528 38626
2000-01 2267 19718 13370 40333
2001-02 2212 19769 13950 41390
2002-03 2177 19296 41462
2003-04 2121 18062 42109
Source: Textile commissioner, Ministry of Textiles, Government of India
It may be mentioned in this context that Indian exports of textiles have been
facing a number of problems. These concerns find reflection in the ‘Report of the Indian
Government’ in the WTO’s Trade Policy Review for India, 2002. It has been pointed out
that quantitative restrictions, especially in the textiles area, are one of the most important
of the non-tariff barriers affecting India’s trade. The major trading partners of India have
not made any industrial adjustment nor have accorded any meaningful access to
developing countries like India. The integration program implemented by the importing
countries has not been in line with the spirit of the ATC. The major importing countries
have continued to back load the integration process, and the bulk of integration would
take place only at the conclusion of the transition period.
Some other problems faced by textiles exports are: (1) unilateral changes
introduced by certain trading partners in their rules of origin, which have adversely
affected exports of textiles, (2) repeated anti-dumping investigations on the textile
products like cotton fabrics and cotton bed-linen, in which India enjoys a measure of
comparative advantage, (3) adverse effect on export of textile because of ban on use of

12
Azo dyes, and (4) growing regionalization of textile trade on account of formation of
Free Trade Areas and Preferential Trading Arrangements, and such localization of world
textile trade adversely affecting India’s textile trade.
4. Removal of QRs in 2000 and 2001
The impact of the QR removal for 1429 items in 2000 and 2001 is taken up for
discussion next. In the list of these items published by the Ministry of Commerce at 8-
digit or 10-digit HS, there are 1522 items. Out of these items, about 27% belong to
textiles.
Total value of imports of the 1522 items in 1999-00 was about Rs 600 billion,
constituting about 30% of the total value of imports of all commodities in that year. Due
to a change in trade classification, some problem of incomparability arise in respect of
import data for some of the items, making it is difficult to assess accurately the growth in
imports in these items after the QRs were removed. However, taking into consideration
the items for which data on imports could be obtained for 2003-04 and 1999-00, it is
found that aggregate imports of those items grew by about 70%. The growth in total
imports of all commodities in this period was by about 64 %. Thus, imports of the items
freed from QR in 2000/2001 did not grow at a rate much faster than the growth rate of
aggregate imports.
For a large number of items out of the 1522, the imports were nil or negligible in
1999-00 and there has been little increase in imports between 1999-00 and 2003-04 in
spite of removal of QR. From a comparison of import data for the years 1999-00 and
2003-04, about 100 items could be identified, the value of imports of which increased by
more than Rs 50 million between the two years. This is discussed further later in the
paper.
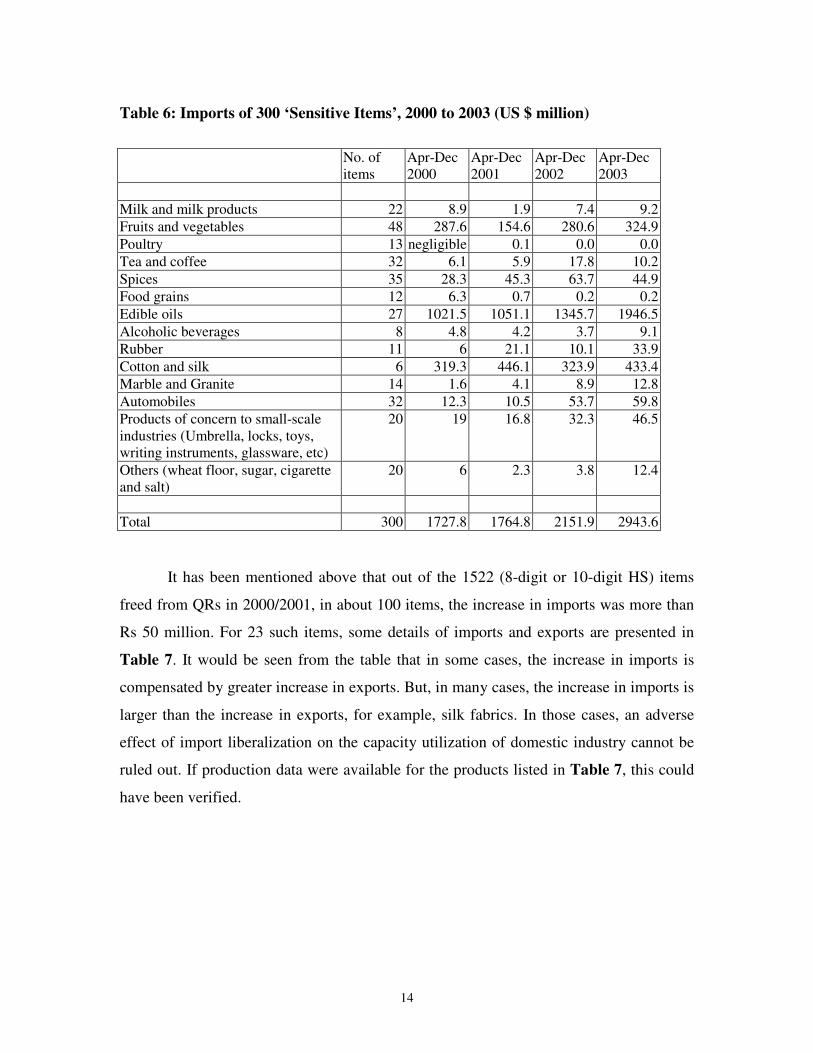
Following the removal of QRs on imports in 2000/2001, the Indian government
has been monitoring imports of 300 sensitive items. Table 6 presents data on imports of

13
these items for four years. In all the cases, the value of imports during April to December
is considered.
It would be noticed from Table 6 that in 2001 the increase in overall imports of
the 300 items was 2.1% only. But, in 2002, the rate of increase was 22% and in 2003, it
accelerated to 37%. Bulk of the increase was in edible oils, and fruits and vegetables.
Leaving out edible oils, and fruits and vegetables from the 300 items, the imports of other
items increased by about 250 million US dollar between 2000 and 2003 (April-
December). This is only about one per cent of the increase in value of imports at the
aggregate level.
Between 2000 and 2003, the increase in imports of automobiles and products of
concern to small-scale industries (umbrella, locks, toys, writing instruments, glassware
etc) was only by about 76 million US dollars. For cotton and silk, the import figures
fluctuate from year to year. Between 2000 and 2003 there was an increase in imports by
about 114 million US dollars. The six items of cotton and silk chosen for monitoring
includes raw silk and silk yarn. But, this group does not show the sharp increase that has
taken place in the imports of textiles in recent years. Analysis of import data for 1522
items mentioned above brings out that the imports of textile items belonging to the list
increased from about Rs 600 million in 1999-00 to about Rs 7000 million in 2003-04. In
terms of US dollar, the increase was by about 140 million US dollars. This is consistent
with the estimates presented in Table 3 and Table 4 above.
14
Table 6: Imports of 300 ‘Sensitive Items’, 2000 to 2003 (US $ million)
No. of items
Apr-Dec 2000
Apr-Dec 2001
Apr-Dec 2002
Apr-Dec 2003
Milk and milk products 22 8.9 1.9 7.4 9.2
Fruits and vegetables 48 287.6 154.6 280.6 324.9
Poultry 13 negligible 0.1 0.0 0.0
Tea and coffee 32 6.1 5.9 17.8 10.2
Spices 35 28.3 45.3 63.7 44.9
Food grains 12 6.3 0.7 0.2 0.2
Edible oils 27 1021.5 1051.1 1345.7 1946.5
Alcoholic beverages 8 4.8 4.2 3.7 9.1
Rubber 11 6 21.1 10.1 33.9
Cotton and silk 6 319.3 446.1 323.9 433.4
Marble and Granite 14 1.6 4.1 8.9 12.8
Automobiles 32 12.3 10.5 53.7 59.8
Products of concern to small-scale industries (Umbrella, locks, toys, writing instruments, glassware, etc)
20 19 16.8 32.3 46.5
Others (wheat floor, sugar, cigarette and salt)
20 6 2.3 3.8 12.4
Total 300 1727.8 1764.8 2151.9 2943.6
It has been mentioned above that out of the 1522 (8-digit or 10-digit HS) items
freed from QRs in 2000/2001, in about 100 items, the increase in imports was more than
Rs 50 million. For 23 such items, some details of imports and exports are presented in
Table 7. It would be seen from the table that in some cases, the increase in imports is
compensated by greater increase in exports. But, in many cases, the increase in imports is
larger than the increase in exports, for example, silk fabrics. In those cases, an adverse
effect of import liberalization on the capacity utilization of domestic industry cannot be
ruled out. If production data were available for the products listed in Table 7, this could
have been verified.

15
Table 7: Imports and Exports of Select Items freed from QR in 2000/2001 (Rs million)
Value of Imports HS Description
1997-98 1999-00 2003-04
Increase in imports between 1999 and 2003
exports 1999-00
Increase in exports between 1999 and 2003
230650 01 Oil cake and oil cake meal expeller variety of coconut or copra.
0.0 1.1 397.3 396.3 0.1 2.0
291739 01 Dibutyl phthalate 0.0 10.1 290.0 279.9 9.5 -9.5
291739 02 Di-octyl phthalate 33.1 53.7 404.0 350.3 0.7 -0.7
400121 00 Natural rubber in smoked sheets
194.8 162.6 702.2 539.6 2.7 1711.0
500710 00 Fabrics of noil silk. 0.0 0.0 597.4 597.4 521.4 28.4
500790 00.90 Other woven fabric of silk (excluding sarees)
0.0 0.0 1706.0 1706.0 1953.0 517.7
600122 00 Looped pile fabrics of manmade fibres.
9.5 11.9 247.7 235.8 1.0 51.2
600210 00 Other knitted/croachted fabrics of a width not exceeding 30 cm, containing by weight 5% or more of elastomeric yarn or rubber thread.
0.9 14.4 338.1 323.7 12.1 628.9
630900 00 Worn clothing and other worn articles.
0 0 2786.2 2786.2 13.0 212.0
680221 01 Marble blocks /slab/ tiles, polished
1.9 8.5 421.1 412.6 1142.1 4.7
690810 01 Ceramic mosaic cubes 0 0.3 111.7 111.4 12.8 102.2
690810 02 Ceramic mosaic tiles 0.09 0.42 76.25 75.8 223.0 134.9
690890 01 Ceramic mosaic cubes 0 1.4 107.1 105.7 6.1 26.3
690890 02 Ceramic mosaic tiles 0.02 3.2 60.1 56.8 8.7 278.1
820790 01 Metal working hand tools. 10.5 315.7 496.9 181.2 6.9 19.3
851310 04.10 Other electric portable lamps. 7.0 32.1 91.0 59.0 4.8 48.2
851650 00 Micro wave ovens 29.6 181.7 346.0 164.2 3.3 47.7
851672 00 Toasters 0.4 19.8 71.2 51.4 16.1 -14.4
851711 01 Line telephone set with cordless handsets, Push button type
2.0 32.2 405.6 373.4 57.6 370.4
851840 00 Audio frequency electric amplifiers.
59.6 87.9 237.4 149.6 212.9 354.2
852712 00 Pocket size radio cassette players
0.8 2.5 125.5 123.0 0.0 2.9
852721 00 Radio broadcasting receivers combined with sound recording or reproducing apparatus.
1.8 6.6 175.6 169.0 0.2 7.9
900410 00 Sunglasses 21.4 35.5 124.0 88.5 42.4 -38.6

16
5. Concluding Remarks
In this paper, an attempt has been made to assess how Indian industry has been
impacted by India’s commitments on tariff and quantitative restriction under WTO. It has
been argued that while a large reduction has been made in the level of tariff between
1991and 2004, this cannot be considered an outcome of India’s commitments under
WTO since the tariff reforms has been largely independent of India’s commitments. The
tariff reform did have a significant effect on Indian industry (as some studies have
shown), but these effects cannot be attributed to India’s commitments.
Two major components of trade liberalization that may be traced to India’s
commitments are (a) removal of quantitative restrictions on textile imports, and (b)
removal or quantitative restrictions on 1429 items (at 6-digit HS) in 2000/2001 after India
had to give up the BOP cover. The liberalization of textile imports seems to have led to a
sharp increase in imports of textiles in the period 2000 to 2003. But, the increase in
imports of textiles is small in relation to the increase in exports in this period, so that the
overall effect of import increase on domestic industry must have been modest. As regards
the removal of QR on 1429 items (6-digit HS) in 2000/2001, the imports increased
substantially in a small number of them, uncompensated by export increase, and this may
have adversely affected capacity utilization in such industries. But, overall, there has
been only a limited increase in the imports of the 1429 items (mostly consumer goods)
recently freed from QR.6
Three reasons can be given for the absence of any large-scale across-the-board
increase in imports of items recently freed from QR. First, a number of them (nearly half)
were already importable by the SIL route (Mehta 2000), and the removal of QR is
unlikely to have led to any large increase in imports. Second, a number of agricultural
6 There was an expectation that the removal of QRs would lead to a large increase in imports. Mehta (2000a), for instance, estimated that the removal of QRs would lead to an increase in India’s imports by 8.7 per cent. The actual experience has, however, been different.

17
items in the list have been canalized.7 Third, a number of ‘trade defensive measures’
were put in place to provide ‘adequate protection and a level playing field to domestic
players vis-à-vis import’ as a result of phasing out of QR (Economic Survey, 2002). For
instance, in November 2000, a list of 133 products and product groups for which
standards had previously been voluntary or which had been compulsory but not enforced
against imports, were made compulsory (Pursell and Sattar, 2003).
The defensive measures had the intended effect of containing imports of the
products freed from QR. But, in that process, the gains expected from a liberalized trade
regime in terms of higher efficiency and structural adjustment to market driven pattern of
comparative advantage were not realized (Wacziarg, 2003).
7 As many as 27 items out of the 715 freed from QR in 2000 were put on the special list. These could be imported only by designated state trading enterprises.

18
References Das, D.K. (2003), “Quantifying Trade Barriers: Has Protection Declined Substantially in Indian Manufacturing?” Working Paper No. 105, Indian Council for Research on International Economic Relations, New Delhi. D’Souza, Errol (undated), The WTO and the Politics of India’s Textile Sector: From Inefficient Redistribution to Industrial Upgradation. Goldar, Bishwanath and Anita Kumari (2003), “Import Liberalization and Productivity Growth in Indian Manufacturing Industries in the 1990s”, Developing Economies, December, 41(4): 436-60. Mehta, Rajesh (1999), Tariff and Non-Tariff Barriers to Indian Economy: A Profile, Research and Information System for the Non-Aligned and Other Developing Countries, New Delhi. Mehta, Rajesh and S.K. Mohanty (1999), WTO and Industrial Tariff: An Empirical Analysis for
India, Research and Information System for the Non-Aligned and Other Developing Countries, New Delhi. Mehta, Rajesh (2000a), “Removal of QRs and its Impact on India’s Imports”, Economic and
Political Weekly, May. Mehta, Rajesh (2000b), QR removal and India’s Import: The Case of India’s Unilateral Offer for
SAARC Countries, Research and Information System for the Non-Aligned and Other Developing Countries, New Delhi. Mehta, Rajesh (2001), WTO, Liberalisation and Industrial Sector: The case of market access, Research and Information System for the Non-Aligned and Other Developing Countries, New Delhi. Mehta, Rajesh (2003), India’s Industrial Tariffs: Towards WTO Development Round
Negotiations, Research and Information System for the Non-Aligned and Other Developing Countries, New Delhi. Nouroz, H. (2001), Protection in Indian Manufacturing: An Empirical Study, MacMillan India Ltd, New Delhi. Nambiar, R.G., Mumgekar, B.L., Tadas, G.A., 1999, “Is Import Liberalization Hurting Domestic Industry and Employment?”, Economic and Political Weekly, February 13, 34, 417-424. NCAER (2000), Protection in Indian Industry, National Council of Applied Economic Research, New Delhi. Pursell, Garry (1996), Indian Trade Policies since the 1991/92 Reforms, World Bank, mimeo. Pursell, Garry and Zaidi Sattar (2003), Trade Policies in South Asian Countries, Report, World Bank.
19
Topalova, Petia (2003), “Trade Liberalization and Firm Productivity: the Case of India”, Yale university, available on line at: www.econ.yale.edu/seminars/NEUDC03/topalova1.pdf. Verma, Samar (2001), WTO Agreement on Textiles and Clothing: Impact on India’s Textiles and Clothing Industry”, in G.K. Chadha (ed), WTO and the Indian Economy. Virmani, A., B. Goldar, and C. Veeramani (2003), Impact of Tariff Policy Changes on the Indian Industry, Report prepared for the Ministry of Industry, Government of India. Virmani, A., B. Goldar, C. Veeramani and V. Bhatt (2004), “Impact of Tariff Reforms on Indian industry: Assessment based on a Multi-sector Econometric Model”, Working Paper (forthcoming), Indian Council for Research on International Economic Relations, New Delhi. Wacziarg, Ramain (2003), “India in the World Trading System”, Revised version of the paper presented at CREDPR Third Annual Conference on Indian Policy Reform, Stanford University, June 2-4, 2002.