Embed Size (px)
Citation preview
Impact of Working Capital Management on Firms Profitability in
Different Business Cycles: Evidence from Pakistan
Nida Shah ∗
Abstract: This study investigates the influence of working capital management on firms’ prof-itability under different business cycles in 65 non-financial firms listed on Karachi stock exchangeof Pakistan by using the annual panel data for 10 years from the period of 2004 to 2013. We usePedroni panel co-integration and Kao residual panel co-integration approaches to confirm the validlong run relationship between considered variables. The result of regression analysis indicates thatthe significant negative relationship exists between cash conversion cycle and its components withfirms’ profitability. Moreover, the business cycle affects the working capital management and firms’profitability relationship. It can be concluded that efficient working capital management mattersand hence should be included in financial planning.
Keywords: Working capital management, profitability, business cycles, non-financial firms.
Introduction
In today’s business world, the firms are enjoying good revenues, but their survival is uncertainbecause of the two facts. One is the inability of the companies to meet the short-term debts andthe other is poor economic conditions (Javid, 2014). The firms, in order to earn good profits,make corporate financial decisions related to capital structure, capital budgeting and workingcapital management (Addae & Nyarko-Baasi, 2013) and mainly much attention is given to capitalstructure and capital budgeting which are long term capital decisions (Kandpal & Kavidayal,2013). However, the working capital management is also very important because of its significanteffect on firm’s liquidity and profitability (Raheman & Nasr, 2007; Nazir & Afza, 2009).
Every firm’s core objective is to maximize the shareholders’ value and profits (Nimalathasan& Brabete, 2010) but maintaining sufficient liquidity position is another important objective.Therefore, these two objectives involve a trade-off between risk and return. When the firms decideto invest more money in currents assets, this reduces the risk of illiquidity but the profitabilityhinders since the excess investment in current assets lost the opportunity for the firms to earnmore money. On the other end, if the firms don’t focus on maintaining liquidity, it may resultin bankruptcy. These facts highlight the importance of efficient management of working capitalmanagement.
Working capital Management ensures the availability of sufficient cash to ensure uninterruptedfunctioning of the business in day-to-day operations (Gul et al., 2013). The two major componentsof working capital management are current assets and current liabilities (Harris, 2005). Currentassets are those which can be turned into cash within one year and current liabilities are those which
∗Research Associate, Deaprtment of Management Sciences, IQRA University, Karachi, Pakistan, 75300.E-mail: [email protected]
58
Journal of Finance & Economics ResearchVol. 1(1): 58-70, 2016DOI 10.20547/jfer1601106
Journal of Finance & Economics Research
are intended to pay within one year (Nunn, 2007). Efficient working capital management involvesplanning and controlling of current assets and current liabilities in such a way that eliminates therisk of default of payment without having excessive cash in hand. Every firm needs to maintainthe optimal level of working capital in order to maximize the value of a firm (Nimalathasan &Brabete, 2010).
Working capital management is highly depended on how well the company is managing its cashconversion cycle. Cash conversion cycle includes the time period, which starts with the purchase ofraw material and ends up on the receipt of cash or payments to suppliers (Nimalathasan & Brabete,2010). At one end larger inventory, lenient trade credit terms may lead to higher profitability andreduces the risk of the stock out, but on the other hand so much money is locked up in workingcapital which lengthen the cash conversion cycle. However, delayed payments to suppliers providethe firms flexible source of financing and reduce the cash conversion cycle, but at the same timecash discounts for early payment may compromise.
Fluctuations in economic conditions affect the firms operating and short term financing de-cisions. During business cycles, the success of the firms depends on the effective planning andmanagement of working capital. So, the firms in order earn profits in every business cycle forecastthe economic condition in advance and its impact over inventory management, account receivablesmanagement and account payables management, and prepare plan when to invest /disinvest inworking capital and when to finance the working capital internally or externally.
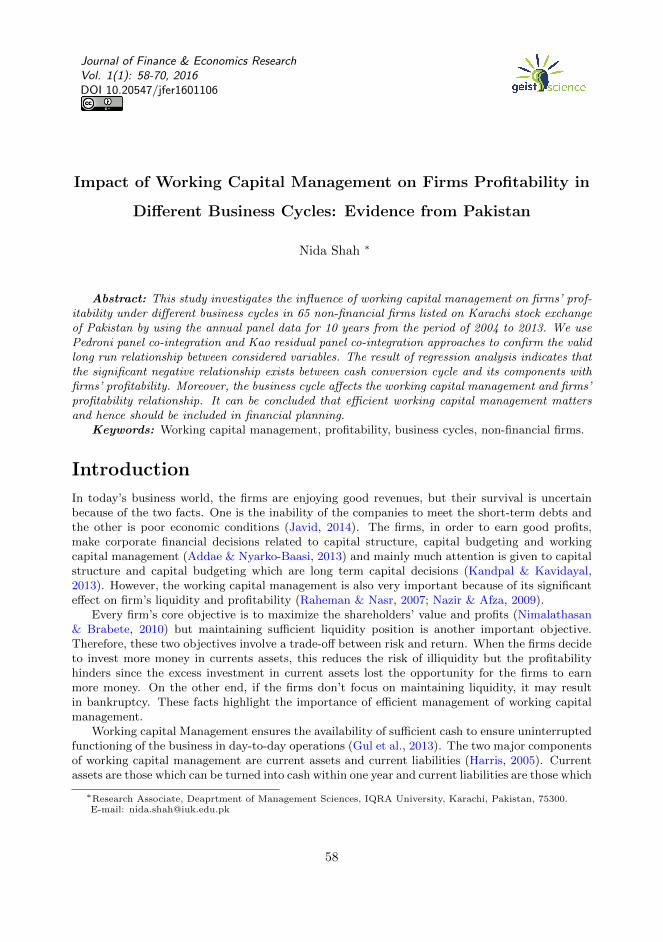
In Pakistan economy, the firms, finance in 4 ways (i) taking loans from the banks, (ii) issuanceof shares (iii) issuance of bonds or debentures (iv) retain earnings. For meeting the working cap-ital requirement, the firms take loans from the banks and the rest of the options are used whenmedium to long term finance is needed. So, the economic conditions play a significant role inmaking these decisions. Moreover, the growth of the Pakistan economy is dependent on its firmsoperating in different sectors. They are a major source of revenue for government and job oppor-tunities. According to the Economic survey of Pakistan (2015) the industrial sector share in GDPwas 22.1% in 2007 which decline to 20.9 in 2008, and become stagnant in the years 2009, 2010 and2011 at 21.0%, 21.2%, 21.0% and then decline to 20.3% in 2012, whereas, in 2013 it contributes20.4% to the GDP. In last five years, the unemployment rate of Pakistan is also stagnant at 5.1%(World Bank , 2014). As seen from the graph below the close relationship exists between the twovariables (GDP and industrial growth) the appreciation or depreciation in one variable directlyinfluences the other variable.
Figure 1Trend between GDP growth and Industry Growth
59
Journal of Finance & Economics Research
Thus, the impact of working capital management on profitability under different businesscycles is highly important in Pakistan perspective and no empirical study has been carried outtherefore, this study investigates the impact of the cash conversion cycle on the firm?s profitabilityunder different business cycles by using the sample of 65 non-financial sectors of Pakistan fromthe period 2004-2013.
The present research is arranged in 5 sections. Section 2 presents the literature review. Section3 discusses the methodology; section 4 presents the empirical results and section 5 presents theconclusion.
Literature Review
Developed Countries
Shin and Soenen (1998) examine the relationship between working capital management and firms’profitability by using the dataset of American firms for the period of 1975-1994 and find a neg-ative relationship between the cash conversion cycle and firms profitability. Wang (2002) usedthe Japanese and Taiwanese firms’ data to examine the relationship between CCC and firms’performance and reported that firms can increase its performance by reducing its cash conversioncycle. Deloof (2003) investigates the association of companies’ profitability and WCM by using thesample of 1,009 Belgian non-financial firms for the period of 1992-1996. The result indicate thatthe significant negative relationship exists between gross operating income, accounts receivable,inventories and accounts payable in days. Juan Garcıa-Teruel and Martinez-Solano (2007) studythe effect of working capital management on profitability of Spanish SMEs by using the dataset of8,872 firms for the period comprising of 1996-2002. The results show that the significant negativerelationship exists between the variables. Rehn (2012) also investigates the relationship of workingcapital management and firms’ profitability by using the data of Finnish and Swedish corporationsand reported that the profitability of the firms increases when the cash conversion cycle decreases.Enqvist, Graham, and Nikkinen (2014) also examine the same relationship, but added the impactof the business cycles on this relationship by using the 18-years data of non-financial Finnishcompanies. The results indicate that business cycles affect the working capital management andprofitability relationship, and the effect of efficient inventory management and account receivablemanagement on firms’ profitability increases in recession periods.
Developing Countries
In the specific case of Pakistan, Shah and Sana (2005) investigate the impact of working capital onthe firms’ profitability by using the dataset of listed companies on Oil and Gas sector of Pakistanfor the period of 2001-2005. They reported that a negative relationship exists between inventory,account receivable, cash conversion cycle, sales growth and gross profit, whereas, a positive relationbetween exists between account payables and gross profit. Raheman and Nasr (2007) also examinethe relationship between working capital management, liquidity and profitability of the firms byusing the data of 94 Pakistani firms comprising of 6 years from 1999-2004. The results indicatethat cash conversion cycles, and its components, liquidity, debts have a negative association withthe profitability of the firms and positive relationship exists between the size of the firms andprofitability.Usman, Saleem, and Aziz (2012) uses the data of manufacturing firms of Pakistan andconcluded that a negative association exists between CCC and profitability whereas, a positiveassociation exists between current ratio, firm size and current assets to total assets with the
60
Journal of Finance & Economics Research
firm’s performance. Tariq, Mumtaz, and Rehan (2013) use the panel technique to conclude thesignificant positive relationship between receivables, net trading cycle, CCC and performancewhereas, negative insignificant relationship exists between inventory turnover, payable turnoverand performance. Nasreen, Khanam, and Pirzada (2014) uses the dataset of 45 listed companies inthe food sectors of Pakistan for the period 2008-2012 and reported that strong positive associationexists between working capital management and firm’s profitability.
Zariyawati, Annuar, Taufiq, and Rahim (2009) applied the Pooled OLS regression on thedataset of 1628 Malaysian firms comprising of years 1996-2006 and reported that a significantrelationship exists between the firms’ profitability and the cash conversion cycle. Nimalathasanand Brabete (2010) also explores the linkage between firms’ profitability and working capitalmanagement by using the dataset of manufacturing firms of Sri Lanka and confirms that negativeassociation exists between CCC and ROA. Niresh (2012) also reports that an inverse relationshipexists between CCC and profitability in Sri Lankan firms.Takon (2013)uses the dataset of 46 listedNigerian firms for the periods 2000-2009 and indicate the significantly negative association existsbetween profitability and the cash conversion cycle. Addae and Nyarko-Baasi (2013) applied theregression and correlation analysis on the data of non-listed Ghanaian firms comprising of years2004-2009 and reported that inverse association exists between the profitability of the firms andthe cash conversion cycle. Ukaegbu (2014) uses the dataset of Egypt, Kenya, Nigeria, and SouthAfrica manufacturing firms for the period 2005-2009 and reported that an inverse relationshipexists between CCC and firms’ profitability. (Ofunya, 2015) also confirms the existence of aninverse relationship between the cash conversion cycle and profitability.
Methodology
In this study, we use 10 years’ annual panel data from the period of 2004 to 2013 of 65 non-financialfirms listed on KSE-100 index of Pakistan. All data are acquired from the financial statementsmanaged by State Bank of Pakistan (SBP). After reviewing the empirical studies, the model toanalyze the relationship between working capital management and non-financial firms profitabilityin different business cycles is determined by following functions:
ROAi,t = β0 + β1CCCi,t + β2CRi,t + β3SALi,t + β4BY Ci,t + εi,t
ROAi,t = β0 + β1INVi,t + β2CRi,t + β3SALi,t + β4BY Ci,t + εi,t
ROAi,t = β0 + β1AARi,t + β2CRi,t + β3SALi,t + β4BY Ci,t + εi,t
ROAi,t = β0 + β1APi,t + β2CRi,t + β3SALi,t + β4BY Ci,t + εi,t
Where, εt is the error term, i represent the number of firms in the panel and t represents thenumber of observations over time. ROA is the return on assets and expressed in percentage (%),CCC is the cash conversion cycle which is measured in days, INV is the inventories in days, AARis the accounts receivable in days, AP is the Account payable in days, CR is the current ratioand expressed in percentage (%), BYC is the business cycle which is used as a proxy for recessionperiod and boom period. The detailed description of all variables is presented in Table 1.
61
Journal of Finance & Economics Research
The present study also employs the Hadri panel unit root test has been used to scrutinize thestationary properties of variables. Pedroni (1999) panel co-integration technique to analyze thelong run relationship among variables. In this study, we use regression analysis to analyze thelong-run coefficients. Moreover, in this research we also use different interaction terms of the cashconversion cycle, inventory, accounts receivable and account payable to more validate their impacton the profitability of the non-financial firms in different business cycles.
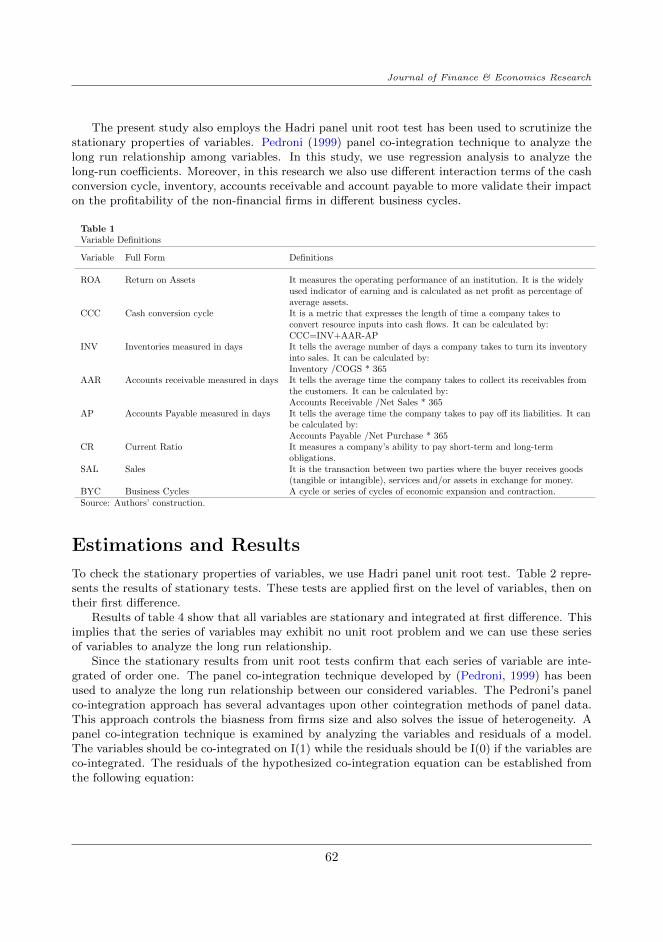
Table 1Variable Definitions
Variable Full Form Definitions
ROA Return on Assets It measures the operating performance of an institution. It is the widelyused indicator of earning and is calculated as net profit as percentage ofaverage assets.
CCC Cash conversion cycle It is a metric that expresses the length of time a company takes toconvert resource inputs into cash flows. It can be calculated by:CCC=INV+AAR-AP
INV Inventories measured in days It tells the average number of days a company takes to turn its inventoryinto sales. It can be calculated by:Inventory /COGS * 365
AAR Accounts receivable measured in days It tells the average time the company takes to collect its receivables fromthe customers. It can be calculated by:Accounts Receivable /Net Sales * 365
AP Accounts Payable measured in days It tells the average time the company takes to pay off its liabilities. It canbe calculated by:Accounts Payable /Net Purchase * 365
CR Current Ratio It measures a company’s ability to pay short-term and long-termobligations.
SAL Sales It is the transaction between two parties where the buyer receives goods(tangible or intangible), services and/or assets in exchange for money.
BYC Business Cycles A cycle or series of cycles of economic expansion and contraction.Source: Authors’ construction.
Estimations and Results
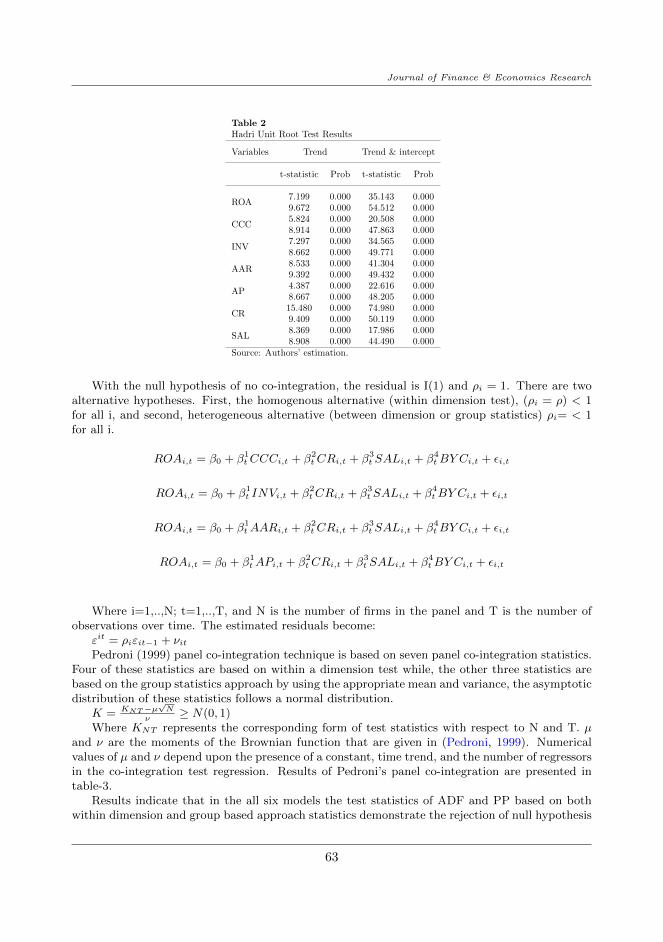
To check the stationary properties of variables, we use Hadri panel unit root test. Table 2 repre-sents the results of stationary tests. These tests are applied first on the level of variables, then ontheir first difference.
Results of table 4 show that all variables are stationary and integrated at first difference. Thisimplies that the series of variables may exhibit no unit root problem and we can use these seriesof variables to analyze the long run relationship.
Since the stationary results from unit root tests confirm that each series of variable are inte-grated of order one. The panel co-integration technique developed by (Pedroni, 1999) has beenused to analyze the long run relationship between our considered variables. The Pedroni’s panelco-integration approach has several advantages upon other cointegration methods of panel data.This approach controls the biasness from firms size and also solves the issue of heterogeneity. Apanel co-integration technique is examined by analyzing the variables and residuals of a model.The variables should be co-integrated on I(1) while the residuals should be I(0) if the variables areco-integrated. The residuals of the hypothesized co-integration equation can be established fromthe following equation:
62
Journal of Finance & Economics Research
Table 2Hadri Unit Root Test Results
Variables Trend Trend & intercept
t-statistic Prob t-statistic Prob
ROA7.199 0.000 35.143 0.0009.672 0.000 54.512 0.000
CCC5.824 0.000 20.508 0.0008.914 0.000 47.863 0.000
INV7.297 0.000 34.565 0.0008.662 0.000 49.771 0.000
AAR8.533 0.000 41.304 0.0009.392 0.000 49.432 0.000
AP4.387 0.000 22.616 0.0008.667 0.000 48.205 0.000
CR15.480 0.000 74.980 0.0009.409 0.000 50.119 0.000
SAL8.369 0.000 17.986 0.0008.908 0.000 44.490 0.000
Source: Authors’ estimation.
With the null hypothesis of no co-integration, the residual is I(1) and ρi = 1. There are twoalternative hypotheses. First, the homogenous alternative (within dimension test), (ρi = ρ) < 1for all i, and second, heterogeneous alternative (between dimension or group statistics) ρi= < 1for all i.
ROAi,t = β0 + β1tCCCi,t + β2
tCRi,t + β3t SALi,t + β4
tBY Ci,t + εi,t
ROAi,t = β0 + β1t INVi,t + β2
tCRi,t + β3t SALi,t + β4
tBY Ci,t + εi,t
ROAi,t = β0 + β1tAARi,t + β2
tCRi,t + β3t SALi,t + β4
tBY Ci,t + εi,t
ROAi,t = β0 + β1tAPi,t + β2
tCRi,t + β3t SALi,t + β4
tBY Ci,t + εi,t
Where i=1,..,N; t=1,..,T, and N is the number of firms in the panel and T is the number ofobservations over time. The estimated residuals become:
εit = ρiεit−1 + νitPedroni (1999) panel co-integration technique is based on seven panel co-integration statistics.
Four of these statistics are based on within a dimension test while, the other three statistics arebased on the group statistics approach by using the appropriate mean and variance, the asymptoticdistribution of these statistics follows a normal distribution.
K = KNT−µ√N
ν≥ N(0, 1)
Where KNT represents the corresponding form of test statistics with respect to N and T. µand ν are the moments of the Brownian function that are given in (Pedroni, 1999). Numericalvalues of µ and ν depend upon the presence of a constant, time trend, and the number of regressorsin the co-integration test regression. Results of Pedroni’s panel co-integration are presented intable-3.
Results indicate that in the all six models the test statistics of ADF and PP based on bothwithin dimension and group based approach statistics demonstrate the rejection of null hypothesis
63
Journal of Finance & Economics Research
of no co-integration in the favor of alternative that all considered variables are co-integrated innon-financial firms. Gutierrez (2003) argues that group statistics has the best power to judgethe co-integration among the test statistics of (Pedroni, 1999). It is concluded that our selectedvariables exhibit a valid long run relationship.
Table 3Pedroni (Engle-Granger based) Panel Cointegration
Estimates Stats. Prob.
ROA= f (CCC+CR+SAL)Panel v-statistic -4.172 1.000Panel rho-statistic 4.449 1.000Panel PP statistic -6.337 0.000Panel ADF statistic -2.949 0.002
Alternative Hypothesis: Individual AR Coefficient
Group rho-statistic 8.39 1.000Group PP statistic -10.782 0.000Group ADF statistic -2.658 0.004
ROA= f (INV+CR+SAL)
Panel v-statistic -3.533 1.000Panel rho-statistic 3.798 1.000Panel PP statistic -10.407 0.000Panel ADF statistic -4.546 0.000
Alternative Hypothesis: Individual AR Coefficient
Group rho-statistic 7.459 1.000Group PP statistic -16.58 0.000Group ADF statistic -3.935 0.000
ROA= f (AAR+CR+SAL)
Panel v-statistic -3.036 0.999Panel rho-statistic 4.263 1.000Panel PP statistic -7.101 0.000Panel ADF statistic -3.585 0.000
Alternative Hypothesis: Individual AR Coefficient
Group rho-statistic 7.926 1.000Group PP statistic -11.623 0.000Group ADF statistic -2.392 0.008
ROA= f (AP+CR+SAL)
Panel v-statistic -3.975 1.000Panel rho-statistic 4.082 1.000Panel PP statistic -7.43 0.000Panel ADF statistic -2.876 0.002
Alternative Hypothesis: Individual AR Coefficient
Group rho-statistic 8.001 1.000Group PP statistic -12.924 0.000Group ADF statistic -2.896 0.002Source: Authors’ estimation.
64
Journal of Finance & Economics Research
Table 4Kao Residual (Engle-Granger based) Panel Co-integration
Estimates Stats. Prob.
ROA= f (CCC+CR+SAL)Panel ADF statistic -4.578 0.000
ROA= f (INV+CR+SAL)Panel ADF statistic -3.709 0.000
ROA= f (AAR+CR+SAL)Panel ADF statistic -4.07 0.000
ROA= f (AP+CR+SAL)Panel ADF statistic - 4.686 0.000The null hypothesis of Kao Residual Co-integration panelco-integration procedure is no co-integrationSource: Authors’ estimation.
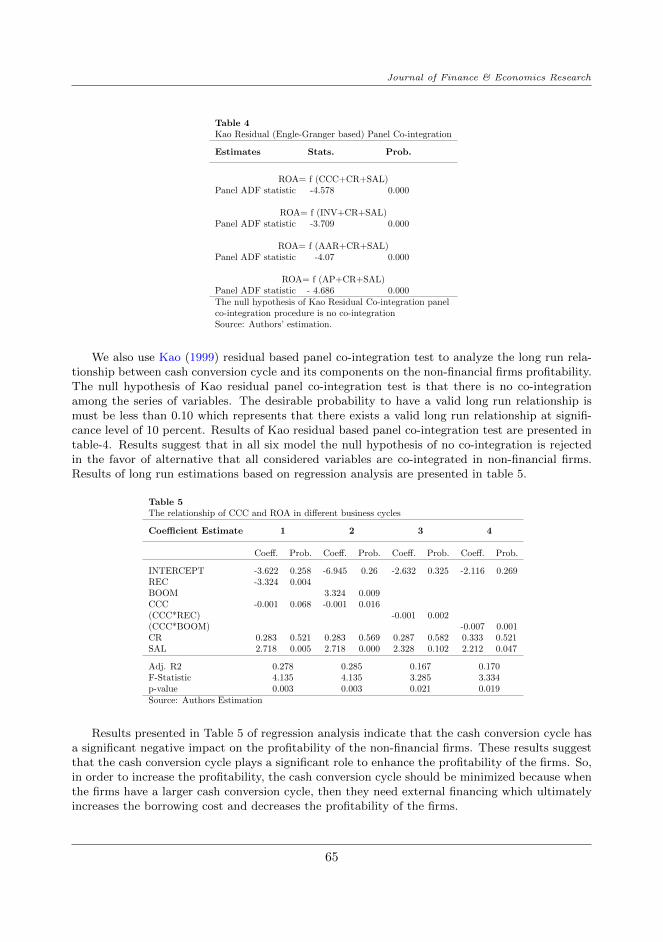
We also use Kao (1999) residual based panel co-integration test to analyze the long run rela-tionship between cash conversion cycle and its components on the non-financial firms profitability.The null hypothesis of Kao residual panel co-integration test is that there is no co-integrationamong the series of variables. The desirable probability to have a valid long run relationship ismust be less than 0.10 which represents that there exists a valid long run relationship at signifi-cance level of 10 percent. Results of Kao residual based panel co-integration test are presented intable-4. Results suggest that in all six model the null hypothesis of no co-integration is rejectedin the favor of alternative that all considered variables are co-integrated in non-financial firms.Results of long run estimations based on regression analysis are presented in table 5.
Table 5The relationship of CCC and ROA in different business cycles
Coefficient Estimate 1 2 3 4
Coeff. Prob. Coeff. Prob. Coeff. Prob. Coeff. Prob.
INTERCEPT -3.622 0.258 -6.945 0.26 -2.632 0.325 -2.116 0.269REC -3.324 0.004BOOM 3.324 0.009CCC -0.001 0.068 -0.001 0.016(CCC*REC) -0.001 0.002(CCC*BOOM) -0.007 0.001CR 0.283 0.521 0.283 0.569 0.287 0.582 0.333 0.521SAL 2.718 0.005 2.718 0.000 2.328 0.102 2.212 0.047
Adj. R2 0.278 0.285 0.167 0.170F-Statistic 4.135 4.135 3.285 3.334p-value 0.003 0.003 0.021 0.019Source: Authors Estimation
Results presented in Table 5 of regression analysis indicate that the cash conversion cycle hasa significant negative impact on the profitability of the non-financial firms. These results suggestthat the cash conversion cycle plays a significant role to enhance the profitability of the firms. So,in order to increase the profitability, the cash conversion cycle should be minimized because whenthe firms have a larger cash conversion cycle, then they need external financing which ultimatelyincreases the borrowing cost and decreases the profitability of the firms.
65
Journal of Finance & Economics Research
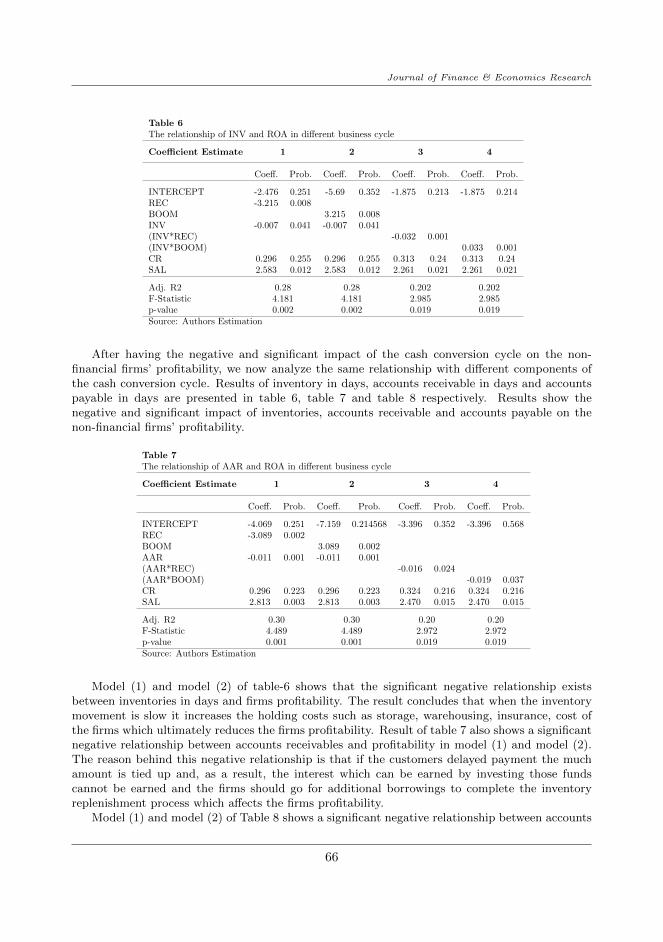
Table 6The relationship of INV and ROA in different business cycle
Coefficient Estimate 1 2 3 4
Coeff. Prob. Coeff. Prob. Coeff. Prob. Coeff. Prob.
INTERCEPT -2.476 0.251 -5.69 0.352 -1.875 0.213 -1.875 0.214REC -3.215 0.008BOOM 3.215 0.008INV -0.007 0.041 -0.007 0.041(INV*REC) -0.032 0.001(INV*BOOM) 0.033 0.001CR 0.296 0.255 0.296 0.255 0.313 0.24 0.313 0.24SAL 2.583 0.012 2.583 0.012 2.261 0.021 2.261 0.021
Adj. R2 0.28 0.28 0.202 0.202F-Statistic 4.181 4.181 2.985 2.985p-value 0.002 0.002 0.019 0.019Source: Authors Estimation
After having the negative and significant impact of the cash conversion cycle on the non-financial firms’ profitability, we now analyze the same relationship with different components ofthe cash conversion cycle. Results of inventory in days, accounts receivable in days and accountspayable in days are presented in table 6, table 7 and table 8 respectively. Results show thenegative and significant impact of inventories, accounts receivable and accounts payable on thenon-financial firms’ profitability.
Table 7The relationship of AAR and ROA in different business cycle
Coefficient Estimate 1 2 3 4
Coeff. Prob. Coeff. Prob. Coeff. Prob. Coeff. Prob.
INTERCEPT -4.069 0.251 -7.159 0.214568 -3.396 0.352 -3.396 0.568REC -3.089 0.002BOOM 3.089 0.002AAR -0.011 0.001 -0.011 0.001(AAR*REC) -0.016 0.024(AAR*BOOM) -0.019 0.037CR 0.296 0.223 0.296 0.223 0.324 0.216 0.324 0.216SAL 2.813 0.003 2.813 0.003 2.470 0.015 2.470 0.015
Adj. R2 0.30 0.30 0.20 0.20F-Statistic 4.489 4.489 2.972 2.972p-value 0.001 0.001 0.019 0.019Source: Authors Estimation
Model (1) and model (2) of table-6 shows that the significant negative relationship existsbetween inventories in days and firms profitability. The result concludes that when the inventorymovement is slow it increases the holding costs such as storage, warehousing, insurance, cost ofthe firms which ultimately reduces the firms profitability. Result of table 7 also shows a significantnegative relationship between accounts receivables and profitability in model (1) and model (2).The reason behind this negative relationship is that if the customers delayed payment the muchamount is tied up and, as a result, the interest which can be earned by investing those fundscannot be earned and the firms should go for additional borrowings to complete the inventoryreplenishment process which affects the firms profitability.
Model (1) and model (2) of Table 8 shows a significant negative relationship between accounts
66
Journal of Finance & Economics Research
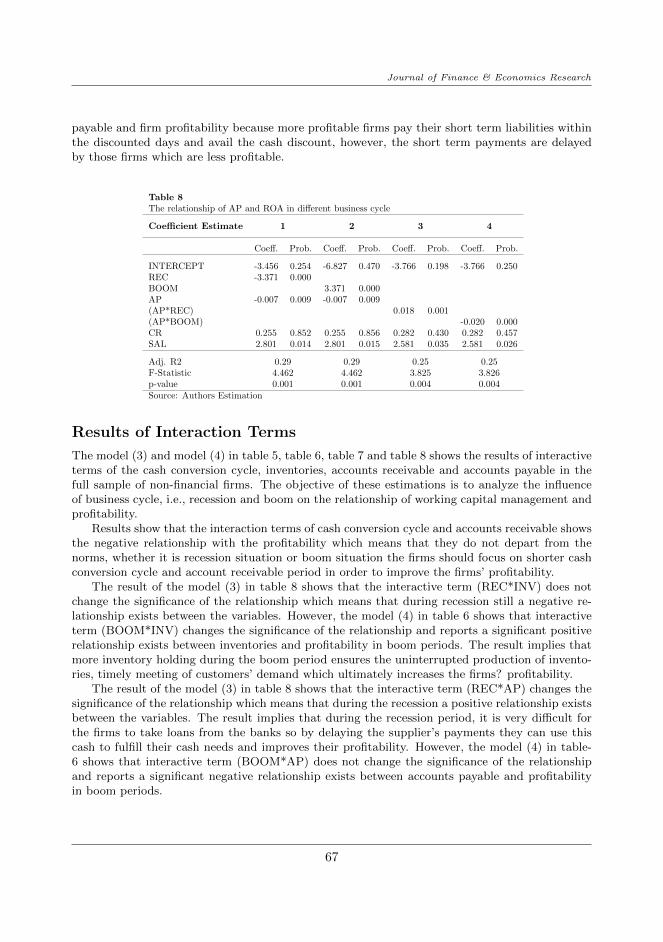
payable and firm profitability because more profitable firms pay their short term liabilities withinthe discounted days and avail the cash discount, however, the short term payments are delayedby those firms which are less profitable.
Table 8The relationship of AP and ROA in different business cycle
Coefficient Estimate 1 2 3 4
Coeff. Prob. Coeff. Prob. Coeff. Prob. Coeff. Prob.
INTERCEPT -3.456 0.254 -6.827 0.470 -3.766 0.198 -3.766 0.250REC -3.371 0.000BOOM 3.371 0.000AP -0.007 0.009 -0.007 0.009(AP*REC) 0.018 0.001(AP*BOOM) -0.020 0.000CR 0.255 0.852 0.255 0.856 0.282 0.430 0.282 0.457SAL 2.801 0.014 2.801 0.015 2.581 0.035 2.581 0.026
Adj. R2 0.29 0.29 0.25 0.25F-Statistic 4.462 4.462 3.825 3.826p-value 0.001 0.001 0.004 0.004Source: Authors Estimation
Results of Interaction Terms
The model (3) and model (4) in table 5, table 6, table 7 and table 8 shows the results of interactiveterms of the cash conversion cycle, inventories, accounts receivable and accounts payable in thefull sample of non-financial firms. The objective of these estimations is to analyze the influenceof business cycle, i.e., recession and boom on the relationship of working capital management andprofitability.
Results show that the interaction terms of cash conversion cycle and accounts receivable showsthe negative relationship with the profitability which means that they do not depart from thenorms, whether it is recession situation or boom situation the firms should focus on shorter cashconversion cycle and account receivable period in order to improve the firms’ profitability.
The result of the model (3) in table 8 shows that the interactive term (REC*INV) does notchange the significance of the relationship which means that during recession still a negative re-lationship exists between the variables. However, the model (4) in table 6 shows that interactiveterm (BOOM*INV) changes the significance of the relationship and reports a significant positiverelationship exists between inventories and profitability in boom periods. The result implies thatmore inventory holding during the boom period ensures the uninterrupted production of invento-ries, timely meeting of customers’ demand which ultimately increases the firms? profitability.
The result of the model (3) in table 8 shows that the interactive term (REC*AP) changes thesignificance of the relationship which means that during the recession a positive relationship existsbetween the variables. The result implies that during the recession period, it is very difficult forthe firms to take loans from the banks so by delaying the supplier’s payments they can use thiscash to fulfill their cash needs and improves their profitability. However, the model (4) in table-6 shows that interactive term (BOOM*AP) does not change the significance of the relationshipand reports a significant negative relationship exists between accounts payable and profitabilityin boom periods.
67
Journal of Finance & Economics Research
Results of control Variables:
In all the models, current ratio shows an insignificant impact on non-financial firms’ profitabilitywhereas, sales have a significant impact on non-financial firms’ profitability.
Conclusion and Policy Implications
This study investigates the influence of working capital management on firms’ profitability underdifferent business cycles in 65 non-financial firms by using the annual panel data for 10 years fromthe period of 2004 to 2013. We use cash conversion cycle and its 3 components, i.e., inventoriesin days, accounts receivables in days and accounts payable in days to analyze their impact on theprofitability of the non-financial firms. We also form the interaction terms to analyze the impactof the business cycle on the working capital management and profitability relationship.
Pedroni panel co-integration and Kao residual panel co-integration approaches are used toconfirm the long run relationship between considered variables. Results of regression analysis onthe complete sample indicate that the cash conversion cycle and its components have a significantnegative impact on the non-financial firms’ profitability. Results also indicate that the controlvariable current ratio has an insignificant impact on firms’ profitability whereas, sales have asignificant positive impact on firms’ profitability.
Results show that the interaction terms of cash conversion cycle and accounts receivables showthe same negative relationship with firms’ profitability in different business cycles, whereas theinteraction term of inventory shows a significant positive relationship with firms’ profitability inthe boom period. Moreover, the interaction term of accounts payable shows a significant positiverelationship with firms’ profitability in the recession period.
It can be concluded that firms’ profitability can be improved by managing the working capitalin an efficient manner. Moreover, the value of the shareholders can be improved by minimizing theaccount receivables in days and by maximizing the creditor’s terms. This excessive cash shouldbe reinvested in the short term funds to earn profits.
During the recession period, the companies should focus on delaying their payments as thiswill help them to improve their liquidity and should choose those suppliers which provide lenientcredit terms and should shift their selves to JIT concept because this lead to minimum inventoryholding and results in profitability. On the contrary, during boom period, the firms should paytheir liabilities as soon as possible because the long cash holding will have a negative effect on theirprofitability and the companies should have a sufficient inventory available all the time as this willensure the uninterrupted supply of the goods and enhances the performance of the companies.
Moreover, the companies should hire the financial experts who can guide them in efficientmanagement of working capital.
68
Journal of Finance & Economics Research
References
Addae, A. A., & Nyarko-Baasi, M. (2013). Working Capital Management and Profitability:An empirical Investigation in an Emerging Market. Research Journal of Finance andAccounting , 4 (15), 143–152.
Deloof, M. (2003). Does working capital management affect profitability of Belgian firms?Journal of Business Finance & Accounting , 30 (3-4), 573–588.
Economic survey of Pakistan. (2015). Retrieved from http://finance.gov.pk/survey/
chapters 15/01 Growth.pdf
Enqvist, J., Graham, M., & Nikkinen, J. (2014). The impact of working capital man-agement on firm profitability in different business cycles: Evidence from Finland.Research in International Business and Finance, 32 , 36–49.
Gul, S., Khan, M. B., Rehman, S. U., Kahn, M., Khan, M., & Khan, W. (2013). Workingcapital management and performance of SME sector. European Journal of Businessand Management , 5 (1), 60–68.
Gutierrez, L. (2003). On the power of panel cointegration tests: a Monte Carlo comparison.Economics Letters, 80 (1), 105-111.
Harris, A. (2005). Working capital management: difficult, but rewarding. FinancialExecutive, 21 (4), 52–54.
Javid, S. (2014). Effect of Working Capital Management on SME’s Performance in Pak-istan. European Journal of Business and Management , 6 (12), 206-220.
Juan Garcıa-Teruel, P., & Martinez-Solano, P. (2007). Effects of working capital man-agement on SME profitability. International Journal of Managerial Finance, 3 (2),164–177.
Kandpal, V., & Kavidayal, P. (2013). Implication of working capital management on theprofitability: A case of ongc ltd, India. Indian Journal of Commerce and ManagementStudies, 4 (2), 49-59.
Kao, C. (1999). Spurious regression and residual-based tests for cointegration in paneldata. Journal of Econometrics, 90 (1), 1–44.
Nasreen, S., Khanam, F., & Pirzada, S., Shahzaib. (2014). Impact of Working CapitalManagement on Firm’S Profitability. Research Journal of Finance and Accounting ,5 (11), 210-222.
Nazir, M. S., & Afza, T. (2009). Impact of aggressive working capital management policyon firms’ profitability. IUP Journal of Applied Finance, 15 (8), 19-27.
Nimalathasan, B., & Brabete, V. (2010). Capital structure and its impact on profitabil-ity: A study of listed manufacturing companies in Sri lanka. Young EconomistsJournal/Revista Tinerilor Economisti , 8 (15-29).
Niresh, J. A. (2012). Working Capital Management & Financial Performance of Manufac-turing Sector in Sri Lanka. European Journal of Business and Management , 4 (15),23–30.
Nunn, L. (2007). Financial Essentials for Successful Business: The Accounting End ofRunning a Successful Company. iUniverse Publishing.
Ofunya, A. (2015). Relationship between working capital management and profitability
69
Journal of Finance & Economics Research
of cement companies in Kenya. Research Journal of Finance and Accounting , 6 (7),154-183.
Pedroni, P. (1999). Critical values for cointegration tests in heterogeneous panels withmultiple regressors. Oxford Bulletin of Economics and Statistics, 61 (1), 653-670.
Raheman, A., & Nasr, M. (2007). Working capital management and profitability-case ofPakistani firms. International Review of Business Research, 3 (1), 279–300.
Rehn, M.-E. (2012). Effects of Working Capital Management on Company Profitability-Anindustry-wise study of Finnish and Swedish public companies (Available on Internet).
Shah, S. A., & Sana, A. (2005). Impact of working capital management on the pofitabilityof oil and gas sector of Pakistan. Editor-In-chief or e, 15 (3), 301–307.
Shin, H.-H., & Soenen, L. (1998). Efficiency of working capital management and corporateprofitability. Financial Practice and Education, 8 , 37–45.
Takon, S. M. (2013). Does Cash Conversion Cycle Have Impact on Return on Assets ofNigerian Firms? Research Journal of Finance and Accounting , 4 (14), 34-42.
Tariq, H., Mumtaz, R., & Rehan, M. F. (2013). Working Capital Management andFirm Performance: Evidence from Pakistan. European Journal of Business andManagement , 5 (20), 86–91.
Ukaegbu, B. (2014). The significance of working capital management in determining firmprofitability: Evidence from developing economies in Africa. Research in Interna-tional Business and Finance, 31 , 1–16.
Usman, M., Saleem, H. M. N., & Aziz, T. (2012). Impact of working capital management onPakistani firm’s performance. In 9th International Conference on Statistical Sciences(p. 289-297).
Wang, Y.-J. (2002). Liquidity management, operating performance, and corporate value:evidence from Japan and Taiwan. Journal of Multinational Financial Management ,12 (2), 159–169.
World Bank. (2014). Retrieved from http://databank.worldbank.org/data/reports
.aspx?source=2&country=PAK&series
Zariyawati, M., Annuar, M., Taufiq, H., & Rahim, A. A. (2009). Working capital manage-ment and corporate performance: Case of Malaysia. Journal of Modern Accountingand Auditing , 5 (11), 47-56.
70


![A sustainable omeba Belgian bank pro tability since the ...€¦ · A: Belgian Bank performance – DuPont-analysis 2010-2015 [%] Source: Roland Berger Assets Equity Fees and commissions](https://img.pdfslide.us/doc/110x75/5fa2e890418793642b3834d0/a-sustainable-omeba-belgian-bank-pro-tability-since-the-a-belgian-bank-performance.jpg)