Embed Size (px)
Citation preview

ENV
IRO
NM
ENTA
LSC
IEN
CES
SUST
AIN
ABI
LITY
SCIE
NCE
Impact of transnational land acquisitions on local foodsecurity and dietary diversityMarc F. Mullera,1 , Gopal Pennya , Meredith T. Nilesb,c , Vincent Ricciardid , Davide Danilo Chiarellie ,Kyle Frankel Davisf,g , Jampel Dell’Angeloh, Paolo D’Odoricoi, Lorenzo Rosai , Maria Cristina Rullie ,and Nathaniel D. Muellerj,k
aDepartment of Civil and Environmental Engineering and Earth Sciences, University of Notre Dame, Notre Dame, IN 46556; bDepartment of Nutrition andFood Sciences, University of Vermont, Burlington, VT 05405; cFood Systems Program, University of Vermont, Burlington, VT 05405; dThe Institute forResources, Environment, and Sustainability, University of British Columbia, Vancouver, BC V6T 1Z4 Canada; eDepartment of Civil and EnvironmentalEngineering, Politecnico di Milano, 20133 Milano, Italy; fDepartment of Geography and Spatial Sciences, University of Delaware, Newark, DE 19716;gDepartment of Plant and Soil Sciences, University of Delaware, Newark, DE 19716; hInstitute for Environmental Studies, Vrije Univeristeit Amsterdam,1081 HV Amsterdam, The Netherlands; iDepartment of Environmental Science, Policy, and Management, University of California, Berkeley, CA 94720;jDepartment of Ecosystem Science and Sustainability, Colorado State University, Fort Collins, CO 80523; and kDepartment of Soil and Crop Sciences,Colorado State University, Fort Collins, CO 80523
Edited by B. L. Turner, Arizona State University, Tempe, AZ, and approved December 16, 2020 (received for review September 30, 2020)
Foreign investors have acquired approximately 90 million hectaresof land for agriculture over the past two decades. The effects ofthese investments on local food security remain unknown. Whileadditional cropland and intensified agriculture could potentiallyincrease crop production, preferential targeting of prime agri-cultural land and transitions toward export-bound crops mightaffect local access to nutritious foods. We test these hypothesesin a global systematic analysis of the food security implicationsof existing land concessions. We combine agricultural, remotesensing, and household survey data (available in 11 sub-SaharanAfrican countries) with georeferenced information on 160 landacquisitions in 39 countries. We find that the intended changes incultivated crop types generally imply transitions toward energy-rich, but nutrient-poor, crops that are predominantly destinedfor export markets. Specific impacts on food production andaccess vary substantially across regions. Deals likely have littleeffect on food security in eastern Europe and Latin America,where they predominantly occur within agricultural areas withcurrent export-oriented crops, and where agriculture would haveboth expanded and intensified regardless of the land deals. Thiscontrasts with Asia and sub-Saharan Africa, where deals are asso-ciated with both an expansion and intensification (in Asia) ofcrop production. Deals in these regions also shift productionaway from local staples and coincide with a gradually decreasingdietary diversity among the surveyed households in sub-SaharanAfrica. Together, these findings point to a paradox, where landdeals can simultaneously increase crop production and threatenlocal food security.
cropland | agriculture | land deals | nutrition | food systems
An estimated 90 million hectares of arable land (approxi-mately the surface area of Venezuela) have been purchased
or leased by foreign investors since the early 2000s (1). Fueled,in part, by the 2008 global food crisis, these transnational large-scale land acquisitions (LSLAs, here also referred to as “landdeals”) predominantly target agricultural land in sub-SaharanAfrica, Asia, eastern Europe, and Latin America, where prevail-ing yield gaps and land commodification allow foreign corpora-tions or joint ventures to profit by increasing crop production (2).By replacing traditional farming with intensified agriculture, thisglobal land rush is fueling a new agrarian transition, and leaves alasting mark on rural landscapes and livelihoods (3, 4). Despitetheir potential to increase agricultural production, the overallimplications of LSLAs on food systems in targeted countries aredebated (4–7).
Traditional smallholder agriculture has often struggled to alle-viate poverty. Chronic underinvestment in agriculture has keptyields low (8), while competition from underpriced and sub-
sidized imports has often limited agricultural development inmany of the regions that are targeted by land investors (9).However, areas that were able to adopt modern agriculturaltechnologies experienced improvements in health outcomes (10,11). In that context, it has been argued that LSLAs mightfacilitate technology transfers, intensify agricultural production,achieve economies of scale, and contribute to closing the yieldgap (12), thus reducing greenhouse gas emissions (13). Efficientagricultural practices can also, theoretically, spill over to sur-rounding communities, along with increased access to income,capital, and global markets (14), although the capacity and capi-tal necessary for adoption varies widely across smallholders (15).However, closing yield gaps might not necessarily alleviate small-holder farmer poverty or increase food security (6, 7). A growingnumber of studies in agroecology and related fields have alsochallenged the narrative that higher yields can only be attainedby displacing and replacing smallholder farming with large-scalecommercial agriculture (16–20). In addition, LSLAs are associ-ated with a number of social and environmental consequencesthat can further hinder poverty alleviation and contribute toenvironmental damage (4, 21). For example, land deals might
Significance
Foreign investors have acquired vast tracts of land globallysince the early 2000s, yet the food security implications of thisphenomenon are poorly understood. The ability to close cropyield gaps through commercial agriculture must be weighedagainst local impacts on food access. We combine agricultural,remote sensing, and household survey data with georefer-enced information on land deals to examine their implicationson food production and access. Results point to a paradoxwhere land deals simultaneously contribute to closing theglobal yield gap by increasing crop production, while threat-ening local food security by redirecting key dietary nutrientstoward the export market. This trade-off between food pro-duction and food security calls into question the sustainabilityof current land investment practices.
Author contributions: M.F.M., G.P., M.T.N., V.R., and N.D.M. designed research; M.F.M.,G.P., M.T.N., V.R., D.D.C., K.F.D., J.D., P.D., L.R., M.C.R., and N.D.M. performed research;M.F.M., G.P., M.T.N., V.R., and N.D.M. analyzed data; and M.F.M. wrote the paper.y
The authors declare no competing interest.y
This article is a PNAS Direct Submission.y
Published under the PNAS license.y1 To whom correspondence may be addressed. Email: [email protected]
This article contains supporting information online at https://www.pnas.org/lookup/suppl/doi:10.1073/pnas.2020535118/-/DCSupplemental.y
Published January 18, 2021.
PNAS 2021 Vol. 118 No. 4 e2020535118 https://doi.org/10.1073/pnas.2020535118 | 1 of 9
Dow
nloa
ded
by g
uest
on
Nov
embe
r 29
, 202
1

cause agricultural production to expand and encroach on naturalecosystems, common-pool land resources, or smallholder agri-culture, causing substantial losses in forest cover, wildlife habitat,ecosystem services, and rural livelihoods (22–25). Deals mightalso preferentially target prime land with high potential yields(26), which could exacerbate both their effect on local liveli-hoods and their potential to close the yield gap. However, manyland investments have failed, and, in many cases, the acquiredland has been left fallow, leading to no increase in production,while still displacing local users (4). Finally, local food securitymay be compromised by appropriating scarce water resources(27, 28), or by displacing food crops destined for local marketswith biofuel production (4) or with less nutritious (and oftenexport-bound) cash crops (5, 29).
Overall, no clear consensus emerges from the literature on therelative salience of these effects and their aggregate impact onfood production and local dietary intake. A recent global anal-ysis estimated that 300 million to 550 million people could besupported by improved yields on the acquired land, against 190million to 370 million on the same land under current yield con-ditions (5). However, these estimates were based on reporteddeal characteristics (intended crops) and hypothesized scenarios(achievable yields), rather than empirical observations. Further-more, the aggregate nature of the analysis (country level) over-looks the food security concerns that arise at the local level. Atthe level of individual deals, case studies have found decreases inthe quantity and productivity of land available for food produc-tion (30), sometimes forcing farmers to encroach on previouslyforested land (31, 32). In other cases, small positive spillovers tolocal communities have been estimated in terms of technology,efficient agricultural practices, job opportunities, and access toinput and output markets (14, 33). Overall, it is not clear whetherand to what extent LSLAs contribute to agricultural intensifica-tion and/or expansion, and the associated impacts on local foodproduction, rural livelihoods, and food security remain poorlyunderstood.
To fill this gap, we consider a sample of 160 land dealsobtained from the Land Matrix dataset (1), and covering anapproximate area of 4.1 million hectares in 39 countries andfour continents (Fig. 1A). All deals are georeferenced and wereconcluded or put in production after 2000, which allows themto be spatially and temporally matched with recent global grid-ded datasets on food production and (for a subset of 28 dealsin 11 sub-Saharan African countries) with local survey data onhousehold dietary diversity. We leverage this information toevaluate the implications of LSLAs on the supply and demandsides of food systems along three important dimensions. First,we test whether LSLAs preferentially target prime agriculturalland. Second, we investigate whether land deals caused an expan-sion and/or intensification of crop production in the concernedareas, and whether these effects spilled over to the surround-ing regions. Third, we assess whether land deals are associatedwith significant shifts toward export-bound and less nutritiouscrops, and the extent to which these effects have altered localdiets. Although a robust literature has examined the impactof specific land deals on local food security (see, e.g., refs. 32and 34–37), to the best of our knowledge, this is the mostcomprehensive global systematic evaluation of the effect oflarge (>200 ha) transnational agricultural land deals on localfood systems.
Targeting of Prime LandTo evaluate the possibility that LSLAs preferentially target spe-cific land characteristics, we calculate targeting ratios which com-pare the agricultural suitability within LSLA locations to that ofcountry-averaged cropland (see Materials and Methods). Resultsreveal a nuanced portrait of land deals, with mixed evidence insupport of the idea that LSLAs preferentially target prime agri-
cultural lands (Fig. 1C). Overall, we find no compelling evidencethat deals preferentially target areas with above-average biophys-ical crop suitability [as revealed through a climate- and soil-basedsuitability index (38)] or historical yields of major crops (from ref.39). Similarly, land deals do not appear to target areas with sig-nificantly higher yield gaps (from ref. 40), where the potential forprofits from improved crop production would have presumablybeen the largest.
In fact, we find that deal areas in Asia and Latin America tendto occur in more remote areas with lower than average marketaccess (from ref. 41), crop suitability, and relative historical yields(Fig. 1C). This finding is consistent with the idea that land com-petition might affect the location of land deals in these regions,where a comparatively lower amount of land is available for newagricultural development (see ref. 42 and SI Appendix, Table S1).Our land use analysis (below) reveals that a substantial frac-tion of the surrounding land in Asia (25% of B1; SI Appendix,Table S1) and Latin America (32%) was already cultivated priorto the deals, despite a lower average proximity to market com-pared to other regions. This contrasts with sub-Saharan Africa,where we observe lower prior cultivation rates (8%). The com-paratively weaker land property rights (e.g., refs. 43 and 44) insub-Saharan Africa might have allowed deals to target land withhigher-than-average access to markets, although not statisticallysignificantly so (Fig. 1C).
We do, however, find clear evidence that deals target com-paratively wetter regions that are more suitable to rain-fedagriculture (from ref. 45) than country-average cropland, partic-ularly in Asia and sub-Saharan Africa, where the difference withcountry-level average is statistically significant. Crucially, how-ever, green water resources are not necessarily sufficient to sus-tain the intended crops in all deal areas. In fact, previous studieshave consistently associated land deals with increased irrigationrequirements (27, 46, 47). For deals taking place in water-limitedregions, existing irrigation infrastructure may be attractive toinvestors, either to be used directly or as an indication of thepotential for additional irrigation development. Among sub-Saharan African deals that occur within water-limited areas(from ref. 45), we find that preexisting irrigation infrastructure(from ref. 48) is 4 times more prevalent in the deal area thanin comparable water-limited croplands (Fig. 1C). In contrast,Latin American deals in water-limited regions tend to occur inareas with lower-than-average prevalence of irrigation infras-tructure, which is consistent with our previous discussion on landcompetition.
Cropland ExpansionOur analysis suggests that cropland expanded by about 25%(from 832,000 to 1,037,000 hectares) in the considered landdeals between 2005 and 2015, with substantial regional patterns.Deals in Asia experienced a marked (45%) relative increase incrop cover (Fig. 1B and SI Appendix, Table S1). In contrast,cropland expansion was more modest in sub-Saharan Africa(16%), where increases in heavily cultivated land (red in Fig. 1B)were compensated by transitions from moderate to lightly cul-tivated land elsewhere (blue to green in Fig. 1B). This lattertransition is indicative of an abandonment of agricultural landand is predominantly associated with large sub-Saharan Africandeals (SI Appendix, Table S2). This finding is consistent withan increasing academic (49, 50) and journalistic (51, 52) liter-ature documenting speculative deals that displaced local farm-ers without developing the land. A recent study (4) suggestedthat not all of the acquired land (<5% in sub-Saharan Africa,and about 20% globally) is actually put under production. Ofnote is that this contraction of cropland mainly concerns par-ticularly large sub-Saharan African deals, which drive regionaldisparities in cropland expansion. These disparities vanish whencontrolling for deal sizes, and all regions exhibit a comparable
2 of 9 | PNAShttps://doi.org/10.1073/pnas.2020535118
Muller et al.Impact of transnational land acquisitions on local food security and dietary diversity
Dow
nloa
ded
by g
uest
on
Nov
embe
r 29
, 202
1

ENV
IRO
NM
ENTA
LSC
IEN
CES
SUST
AIN
ABI
LITY
SCIE
NCE
A Considered Land Deals by Country
Number of Deals
1 5 10 15 20 103
Median Deal Size [ha]
104 105N=160
Surface Area [x1000 ha]
<20% Cultivated
BCrop Cover Change within Land Deals
Estimated Crop Cover 20-70% Cultivated >70% Cultivated
C Cropland Targeting Ratio
0 1/2 1 1.5 2
1/16 1/4 1 4 16
Africa
Asia
Eastern Europe
Latin America
Green Water Availability
Market Access
Relative Yield
Crop Suitability
Yield Gap
Irrig. Infrastructure(Water-limited deals)
Mean
95%CI
158
AsiaN=43
584 kha
300
600
107
2005 2015
550 kha
Latin America, N=11
2005 2015
239276
500
100
Eastern Europe, N=33
2005 2015
536 kha
500
100
301
391
2000
1000
Africa, N=73
2005 2015
185 212
2397 kha
Fig. 1. (A) Number and median size of the considered LSLA deals by country. (B) Crop cover change within the considered land deals. Colored classesare given as ranges of crop cover percentages (<20%, green; 20 to 70%, blue; >70%, red) per 200-m grid cell. Numbers on top of each chart representthe aggregated surface area of the considered deals by region (in 1,000 ha). Numbered horizontal lines on the bar charts represent estimated croplandsurface areas within the deals for each region in 2005 and 2015. (C) Preferential targeting of LSLAs. The land characteristics of LSLAs are compared toaverage characteristics across croplands within targeted countries using a targeting ratio. A ratio larger than one indicates that deals are targeting loca-tions with higher values of each attribute (e.g., market access in sub-Saharan Africa). Error bars indicate bootstrapped 95% CIs around the mean (1,000repetitions).
Muller et al.Impact of transnational land acquisitions on local food security and dietary diversity
PNAS | 3 of 9https://doi.org/10.1073/pnas.2020535118
Dow
nloa
ded
by g
uest
on
Nov
embe
r 29
, 202
1
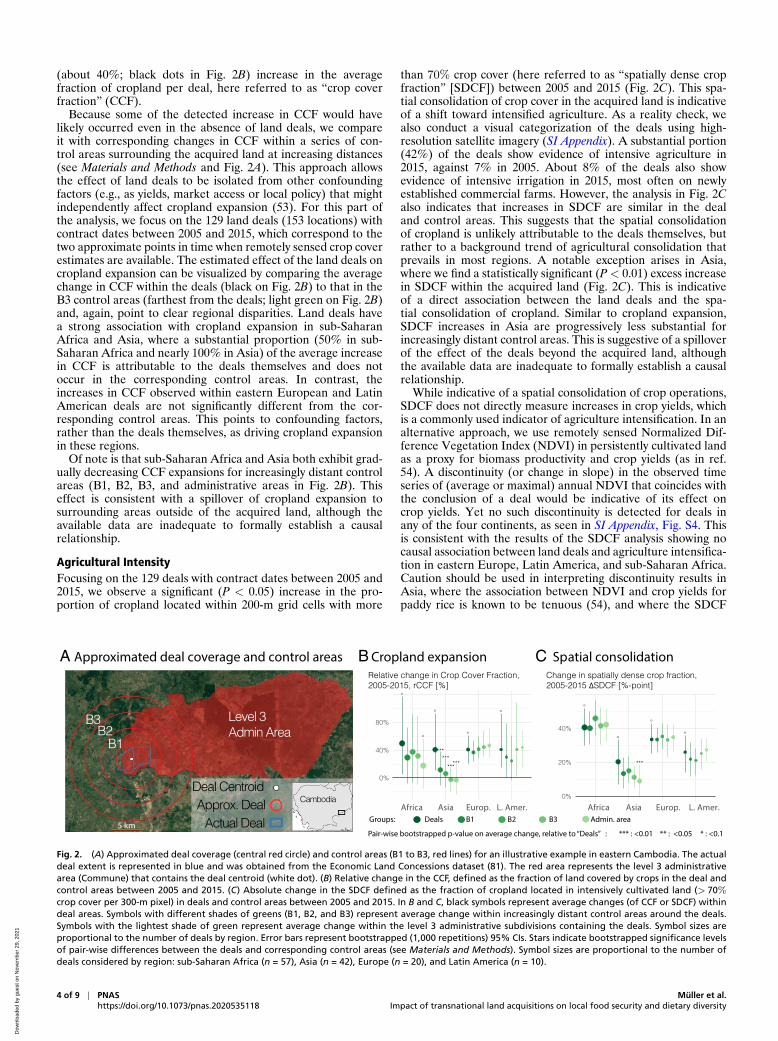
(about 40%; black dots in Fig. 2B) increase in the averagefraction of cropland per deal, here referred to as “crop coverfraction” (CCF).
Because some of the detected increase in CCF would havelikely occurred even in the absence of land deals, we compareit with corresponding changes in CCF within a series of con-trol areas surrounding the acquired land at increasing distances(see Materials and Methods and Fig. 2A). This approach allowsthe effect of land deals to be isolated from other confoundingfactors (e.g., as yields, market access or local policy) that mightindependently affect cropland expansion (53). For this part ofthe analysis, we focus on the 129 land deals (153 locations) withcontract dates between 2005 and 2015, which correspond to thetwo approximate points in time when remotely sensed crop coverestimates are available. The estimated effect of the land deals oncropland expansion can be visualized by comparing the averagechange in CCF within the deals (black on Fig. 2B) to that in theB3 control areas (farthest from the deals; light green on Fig. 2B)and, again, point to clear regional disparities. Land deals havea strong association with cropland expansion in sub-SaharanAfrica and Asia, where a substantial proportion (50% in sub-Saharan Africa and nearly 100% in Asia) of the average increasein CCF is attributable to the deals themselves and does notoccur in the corresponding control areas. In contrast, theincreases in CCF observed within eastern European and LatinAmerican deals are not significantly different from the cor-responding control areas. This points to confounding factors,rather than the deals themselves, as driving cropland expansionin these regions.
Of note is that sub-Saharan Africa and Asia both exhibit grad-ually decreasing CCF expansions for increasingly distant controlareas (B1, B2, B3, and administrative areas in Fig. 2B). Thiseffect is consistent with a spillover of cropland expansion tosurrounding areas outside of the acquired land, although theavailable data are inadequate to formally establish a causalrelationship.
Agricultural IntensityFocusing on the 129 deals with contract dates between 2005 and2015, we observe a significant (P < 0.05) increase in the pro-portion of cropland located within 200-m grid cells with more
than 70% crop cover (here referred to as “spatially dense cropfraction” [SDCF]) between 2005 and 2015 (Fig. 2C). This spa-tial consolidation of crop cover in the acquired land is indicativeof a shift toward intensified agriculture. As a reality check, wealso conduct a visual categorization of the deals using high-resolution satellite imagery (SI Appendix). A substantial portion(42%) of the deals show evidence of intensive agriculture in2015, against 7% in 2005. About 8% of the deals also showevidence of intensive irrigation in 2015, most often on newlyestablished commercial farms. However, the analysis in Fig. 2Calso indicates that increases in SDCF are similar in the dealand control areas. This suggests that the spatial consolidationof cropland is unlikely attributable to the deals themselves, butrather to a background trend of agricultural consolidation thatprevails in most regions. A notable exception arises in Asia,where we find a statistically significant (P < 0.01) excess increasein SDCF within the acquired land (Fig. 2C). This is indicativeof a direct association between the land deals and the spa-tial consolidation of cropland. Similar to cropland expansion,SDCF increases in Asia are progressively less substantial forincreasingly distant control areas. This is suggestive of a spilloverof the effect of the deals beyond the acquired land, althoughthe available data are inadequate to formally establish a causalrelationship.
While indicative of a spatial consolidation of crop operations,SDCF does not directly measure increases in crop yields, whichis a commonly used indicator of agriculture intensification. In analternative approach, we use remotely sensed Normalized Dif-ference Vegetation Index (NDVI) in persistently cultivated landas a proxy for biomass productivity and crop yields (as in ref.54). A discontinuity (or change in slope) in the observed timeseries of (average or maximal) annual NDVI that coincides withthe conclusion of a deal would be indicative of its effect oncrop yields. Yet no such discontinuity is detected for deals inany of the four continents, as seen in SI Appendix, Fig. S4. Thisis consistent with the results of the SDCF analysis showing nocausal association between land deals and agriculture intensifica-tion in eastern Europe, Latin America, and sub-Saharan Africa.Caution should be used in interpreting discontinuity results inAsia, where the association between NDVI and crop yields forpaddy rice is known to be tenuous (54), and where the SDCF
Pair-wise bootstrapped p-value on average change, relative to “Deals” : *** : <0.01 ** : <0.05 * : <0.1
Groups: Deals B1 B2 B3 Admin. area Africa Asia Europ. L. Amer.
B Cropland expansion C Spatial consolidationChange in spatially dense crop fraction, 2005-2015 ΔSDCF [%-point]
Africa Asia Europ.
Relative change in Crop Cover Fraction, 2005-2015, rCCF [%]
L. Amer.Cambodia
Level 3Admin Area
B3B2
B1
Approx. DealActual Deal
Deal Centroid
5 km
A Approximated deal coverage and control areas
°
*
°
******
******
°
°
0%
40%
80%
°
°
***
°
°
0%
20%
40%
Fig. 2. (A) Approximated deal coverage (central red circle) and control areas (B1 to B3, red lines) for an illustrative example in eastern Cambodia. The actualdeal extent is represented in blue and was obtained from the Economic Land Concessions dataset (81). The red area represents the level 3 administrativearea (Commune) that contains the deal centroid (white dot). (B) Relative change in the CCF, defined as the fraction of land covered by crops in the deal andcontrol areas between 2005 and 2015. (C) Absolute change in the SDCF defined as the fraction of cropland located in intensively cultivated land (> 70%
crop cover per 300-m pixel) in deals and control areas between 2005 and 2015. In B and C, black symbols represent average changes (of CCF or SDCF) withindeal areas. Symbols with different shades of greens (B1, B2, and B3) represent average change within increasingly distant control areas around the deals.Symbols with the lightest shade of green represent average change within the level 3 administrative subdivisions containing the deals. Symbol sizes areproportional to the number of deals by region. Error bars represent bootstrapped (1,000 repetitions) 95% CIs. Stars indicate bootstrapped significance levelsof pair-wise differences between the deals and corresponding control areas (see Materials and Methods). Symbol sizes are proportional to the number ofdeals considered by region: sub-Saharan Africa (n = 57), Asia (n = 42), Europe (n = 20), and Latin America (n = 10).
4 of 9 | PNAShttps://doi.org/10.1073/pnas.2020535118
Muller et al.Impact of transnational land acquisitions on local food security and dietary diversity
Dow
nloa
ded
by g
uest
on
Nov
embe
r 29
, 202
1
ENV
IRO
NM
ENTA
LSC
IEN
CES
SUST
AIN
ABI
LITY
SCIE
NCE
analysis suggests an association between land deals and agricul-ture intensification (Fig. 2C).
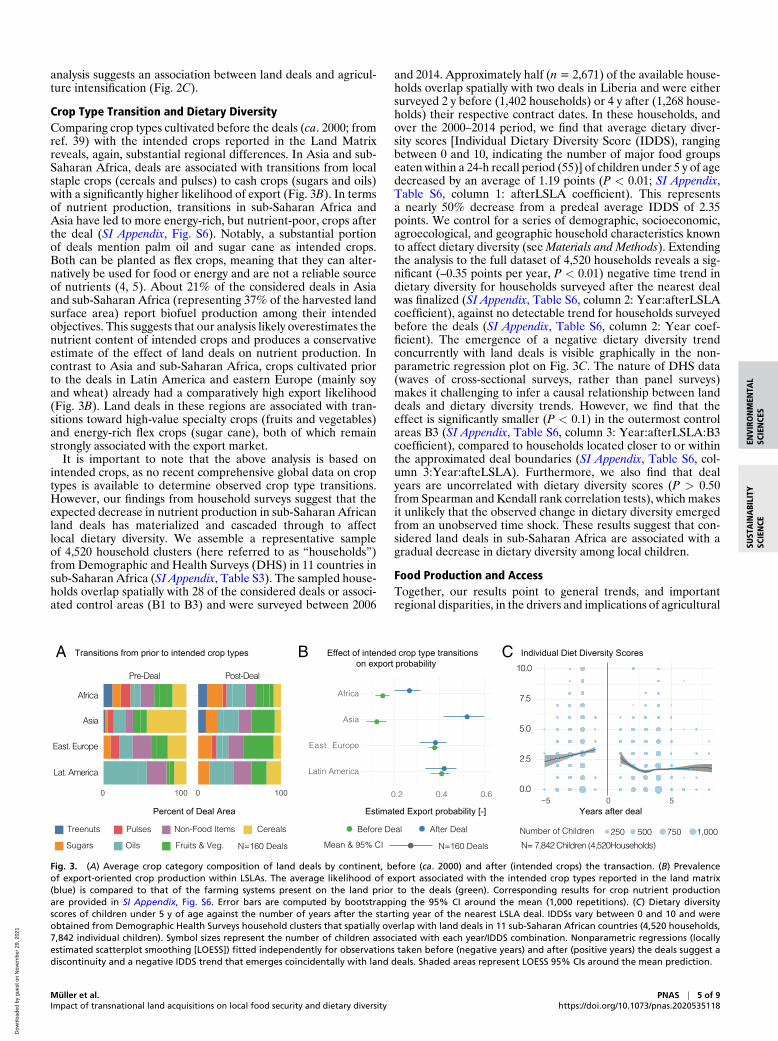
Crop Type Transition and Dietary DiversityComparing crop types cultivated before the deals (ca. 2000; fromref. 39) with the intended crops reported in the Land Matrixreveals, again, substantial regional differences. In Asia and sub-Saharan Africa, deals are associated with transitions from localstaple crops (cereals and pulses) to cash crops (sugars and oils)with a significantly higher likelihood of export (Fig. 3B). In termsof nutrient production, transitions in sub-Saharan Africa andAsia have led to more energy-rich, but nutrient-poor, crops afterthe deal (SI Appendix, Fig. S6). Notably, a substantial portionof deals mention palm oil and sugar cane as intended crops.Both can be planted as flex crops, meaning that they can alter-natively be used for food or energy and are not a reliable sourceof nutrients (4, 5). About 21% of the considered deals in Asiaand sub-Saharan Africa (representing 37% of the harvested landsurface area) report biofuel production among their intendedobjectives. This suggests that our analysis likely overestimates thenutrient content of intended crops and produces a conservativeestimate of the effect of land deals on nutrient production. Incontrast to Asia and sub-Saharan Africa, crops cultivated priorto the deals in Latin America and eastern Europe (mainly soyand wheat) already had a comparatively high export likelihood(Fig. 3B). Land deals in these regions are associated with tran-sitions toward high-value specialty crops (fruits and vegetables)and energy-rich flex crops (sugar cane), both of which remainstrongly associated with the export market.
It is important to note that the above analysis is based onintended crops, as no recent comprehensive global data on croptypes is available to determine observed crop type transitions.However, our findings from household surveys suggest that theexpected decrease in nutrient production in sub-Saharan Africanland deals has materialized and cascaded through to affectlocal dietary diversity. We assemble a representative sampleof 4,520 household clusters (here referred to as “households”)from Demographic and Health Surveys (DHS) in 11 countries insub-Saharan Africa (SI Appendix, Table S3). The sampled house-holds overlap spatially with 28 of the considered deals or associ-ated control areas (B1 to B3) and were surveyed between 2006
and 2014. Approximately half (n = 2,671) of the available house-holds overlap spatially with two deals in Liberia and were eithersurveyed 2 y before (1,402 households) or 4 y after (1,268 house-holds) their respective contract dates. In these households, andover the 2000–2014 period, we find that average dietary diver-sity scores [Individual Dietary Diversity Score (IDDS), rangingbetween 0 and 10, indicating the number of major food groupseaten within a 24-h recall period (55)] of children under 5 y of agedecreased by an average of 1.19 points (P < 0.01; SI Appendix,Table S6, column 1: afterLSLA coefficient). This representsa nearly 50% decrease from a predeal average IDDS of 2.35points. We control for a series of demographic, socioeconomic,agroecological, and geographic household characteristics knownto affect dietary diversity (see Materials and Methods). Extendingthe analysis to the full dataset of 4,520 households reveals a sig-nificant (–0.35 points per year, P < 0.01) negative time trend indietary diversity for households surveyed after the nearest dealwas finalized (SI Appendix, Table S6, column 2: Year:afterLSLAcoefficient), against no detectable trend for households surveyedbefore the deals (SI Appendix, Table S6, column 2: Year coef-ficient). The emergence of a negative dietary diversity trendconcurrently with land deals is visible graphically in the non-parametric regression plot on Fig. 3C. The nature of DHS data(waves of cross-sectional surveys, rather than panel surveys)makes it challenging to infer a causal relationship between landdeals and dietary diversity trends. However, we find that theeffect is significantly smaller (P < 0.1) in the outermost controlareas B3 (SI Appendix, Table S6, column 3: Year:afterLSLA:B3coefficient), compared to households located closer to or withinthe approximated deal boundaries (SI Appendix, Table S6, col-umn 3:Year:afteLSLA). Furthermore, we also find that dealyears are uncorrelated with dietary diversity scores (P > 0.50from Spearman and Kendall rank correlation tests), which makesit unlikely that the observed change in dietary diversity emergedfrom an unobserved time shock. These results suggest that con-sidered land deals in sub-Saharan Africa are associated with agradual decrease in dietary diversity among local children.
Food Production and AccessTogether, our results point to general trends, and importantregional disparities, in the drivers and implications of agricultural
Before Deal After Deal
Mean & 95% CI
Years after deal
Individual Diet Diversity Scores
Number of Children 250 500 750 1,000
N= 7,842 Children (4,520Households)
Effect of intended crop type transitions on export probability
Percent of Deal Area
Pre-Deal Post-Deal
Fruits & Veg.
Cereals
Sugars Oils
PulsesTreenuts Non-Food Items
0 100 100
Transitions from prior to intended crop types
0.0
2.5
5.0
7.5
10.0
−5 0 50.2 0.4 0.6
Latin America
East. Europe
Asia
Africa
Lat. America
East. Europe
Asia
Africa
0
Estimated Export probability [-]
N=160 Deals N=160 Deals
A B C
Fig. 3. (A) Average crop category composition of land deals by continent, before (ca. 2000) and after (intended crops) the transaction. (B) Prevalenceof export-oriented crop production within LSLAs. The average likelihood of export associated with the intended crop types reported in the land matrix(blue) is compared to that of the farming systems present on the land prior to the deals (green). Corresponding results for crop nutrient productionare provided in SI Appendix, Fig. S6. Error bars are computed by bootstrapping the 95% CI around the mean (1,000 repetitions). (C) Dietary diversityscores of children under 5 y of age against the number of years after the starting year of the nearest LSLA deal. IDDSs vary between 0 and 10 and wereobtained from Demographic Health Surveys household clusters that spatially overlap with land deals in 11 sub-Saharan African countries (4,520 households,7,842 individual children). Symbol sizes represent the number of children associated with each year/IDDS combination. Nonparametric regressions (locallyestimated scatterplot smoothing [LOESS]) fitted independently for observations taken before (negative years) and after (positive years) the deals suggest adiscontinuity and a negative IDDS trend that emerges coincidentally with land deals. Shaded areas represent LOESS 95% CIs around the mean prediction.
Muller et al.Impact of transnational land acquisitions on local food security and dietary diversity
PNAS | 5 of 9https://doi.org/10.1073/pnas.2020535118
Dow
nloa
ded
by g
uest
on
Nov
embe
r 29
, 202
1
land deals in relation to local food systems. Three notableconclusions stand out.
First, land deals do not appear to target locations based ontheir biophysical suitability to crop production, with the excep-tion of rain water availability. This finding is in line with pre-vious results (27, 42) suggesting that water rather than landtends to drive LSLAs, but points to important regional nuances.Targeting of irrigation infrastructure is most significant in sub-Saharan Africa, where LSLAs have consistently taken advantageof property law to manipulate customary tenure property rightsand legalize land dispossession and eviction of traditional andindigenous users (56). Cropland contraction observed in largesub-Saharan African deals also points to opportunistic and spec-ulative investments. In contrast, in Asia and Latin America,where antecedent crop cover is higher and traditional land prop-erty rights are less vulnerable (43), land competition appears toaffect deal locations, as seen in lower-than-average market access(both regions) and irrigation infrastructure (Latin America) indeal locations.
Second, agricultural land deals do not always stimulate anexpansion or intensification of crop production, particularly inregions where both processes are already prominent. In LatinAmerica and eastern Europe, our analysis suggests that crop pro-duction would have both expanded and intensified, regardlessof the land deals. However, our results in Asia also show thatLSLAs can have a substantial effect on both the extent and inten-sity of agricultural land use, and that, when either of these effectsarises, it often spills over to regions outside of the acquiredland. When weighing purported benefits and pitfalls of LSLAs,sub-Saharan Africa stands out. There, land deals have increasedthe prevalence of cultivated land, with the associated social andenvironmental displacements that have been documented in theregion. However, with little evidence of cropland intensificationspecifically associated with land deals, their potential to close theyield gap in the continent is unclear. This is particularly true inlight of the abandonment of agricultural land that our analysissuggests is taking place in large sub-Saharan African land deals(SI Appendix, Table S2).
Third, by affecting the types of crops grown on the tar-geted land, deals can influence the production of importantdietary nutrients and their availability for local consumption.The latter effect is likely minimal for eastern Europe and LatinAmerica, where deals are predominantly located in intensivelycultivated areas with crops already destined for the export mar-ket. However, crop types associated with land deals in Asiaand sub-Saharan Africa signal a significant transition away fromlocal staples and toward energy-rich, but nutrient-poor, export-bound flex crops. These transitions have significant implicationsfor local populations. Although limited to 11 countries (28deals) in sub-Saharan Africa, where overlapping survey data areavailable (SI Appendix, Table S3), the household survey anal-ysis that we present provides an examination of the effect ofland deals on local dietary diversity within a large-scale cross-country study.
While providing a unique vantage point, the global scaleof our analysis cannot fully account for the complex featuresand variability among individual land deals. For example, werely on agricultural censuses that enumerate a finite numberof crops and therefore overlook some food sources associatedwith traditional hunting or foraging practices, as well as the roleof subsistence farming and backyard livestock production thatnever reaches the market. Although wild and traditional foodsare included in the dietary diversity scores that we use, their rela-tionship to the food security of households affected by LSLAs iscomplex and cannot be fully captured by standardized householdsurveys. As an illustration, households partly relying on foragedfood will be more resilient to land deals causing a shift towardexport-bound cash crops. However, they will be less resilient to
deals causing an expansion of cropland that encroaches onto for-aging grounds. Documenting these secondary effects is criticaland relies on the meticulous collection of (often qualitative) pri-mary field data. This grueling effort has produced a rich casestudy literature on the context-specific relationship between landdeals and food security (see, e.g., refs. 32 and 34–37), to which thelarge-scale statistical analysis that we present is a complement,rather than substitute.
In conclusion, the above caveat notwithstanding, our resultspoint to a trade-off between food production and access as anessential consequence of how and where land deals are currentlyexecuted. Deals in regions where cultivated crops were alreadyexport oriented (eastern Europe, Latin America) have a min-imal effect on the already rapidly expanding and intensifyingcrop production. Conversely, deals in other regions (Asia andsub-Saharan Africa) can cause a significant expansion and inten-sification of crop production. The implications of the transitiontoward industrialized commercial agriculture in terms of closingthe yield gap are uncertain. Recent findings (20, 57, 58) havecast doubts on the long-standing assumption that transitioningaway from smallholder agriculture might substantially improveyields. However, we do find that the contemporary agrarian tran-sition associated with LSLAs generally entails a displacement oftraditional agriculture and a shift away from staple crops. This,according to our analysis, has dramatic repercussions on localdietary diversity. These findings suggest a fundamental paradoxwhere LSLAs can increase crop production while simultaneouslythreatening local food security. This perverse contradiction hap-pens because key dietary nutrients are taken away from localcommunities toward the export markets. This evident trade-offraises an urgent academic and policy question on the food secu-rity implications of large-scale land investments and calls intoquestion the ethical grounds of current foreign land investmentglobal patterns.
Materials and MethodsDeals and Control Areas. The location and basic characteristics of theconsidered land deals were obtained from the Land Matrix (1), a jointinternational initiative collecting data on transnational land deals since2000. To our knowledge, this is the largest and most comprehensive exist-ing database on the global land rush. Relying on large-scale standardizeddatabases such as the Land Matrix invariably misses important contextualinformation on individual land deals, and the circumstances in which therelevant information was collected (see, e.g., refs. 59–62). Nevertheless, theLand Matrix is a unique source of vetted and codified information to eval-uate the relationship between land deals and food systems at the globalscale. The approximately 1,900 land deals of the Land Matrix database werefiltered using the following criteria (see SI Appendix for details): 1) havingits status updated to “contracted,” “in startup phase,” or “in production”after 2000; 2) being greater than 200 ha and intended for agricultural use;3) entailing a transfer of user rights from smallholders and communitiesto foreign commercial users and involving either the sale, lease, or conces-sion of land; and 4) having accurate coordinates of the corresponding deallocations.
This procedure resulted in a final sample of 160 deals, for which thecentroid coordinates, surface area, contract date, and intended crops wereobtained from the Land Matrix. The final sample comprises 197 distinct loca-tions (a land deal can focus on several locations) and represents a totalsurface area of 4.06 million hectares in 39 countries. Geographically, thesample has 43 deals (0.58 Mha) in Asia, 11 deals (0.55 Mha) in Latin Amer-ica, 33 deals (0.54 Mha) in eastern Europe, and 73 deals (2.40 Mha) insub-Saharan Africa. The selected deals are either marked as “in produc-tion” (139 deals), “in startup phase” (18 deals), or “contracted” (3 deals).Note that the land cover analysis was performed on the subset of 129deals (153 locations) with contract dates between 2005 and 2015, whichcorrespond to the two approximate points in time when crop cover dataare available. Deal sizes range between 200 and 470,000 ha, and investorintentions reported in the land matrix include “food crops” (58% of deals),“nonfood” or “unspecified” agriculture (38% of deals), “biofuels” (17% ofdeals), “timber plantations” (11%), and “livestock” (12%). Note that 36%of the selected deals report more than one intention. These characteristics
6 of 9 | PNAShttps://doi.org/10.1073/pnas.2020535118
Muller et al.Impact of transnational land acquisitions on local food security and dietary diversity
Dow
nloa
ded
by g
uest
on
Nov
embe
r 29
, 202
1

ENV
IRO
NM
ENTA
LSC
IEN
CES
SUST
AIN
ABI
LITY
SCIE
NCE
and the data associated with all analyses below are openly available athttps://doi.org/10.7274/r0-ycpf-qh53.
The actual coverage of the deals is not provided by the Land Matrixdataset and was approximated for each deal location as a disk of equivalentarea and centroid (Fig. 2A). Validation against shapefile data for a subsetof deals with known coverage is described in SI Appendix. Control areas Bi
(i∈ [1, 3]) were defined as encompassing the area between distances of r · iand r · (i + 1) from the deal centroid, where r is the radius of the disk cor-responding to the relevant deal (Fig. 2A). Areas of the controls that overlapwith other known deals were removed. It is possible that the approximateddeal areas include land that lies outside the deal’s boundaries. It is similarlypossible that the control areas include land from deals that are not includedin our sample. While both issues raise concerns of potential sample contam-ination, we show, in SI Appendix, that they are unlikely to have a significantimpact on the results.
Targeting of Prime Land. To determine whether deals target prime agricul-tural lands, we compared the characteristics of each deal location to theaverage characteristics across all cropland areas (from ref. 63) within thecountry containing the deal. This comparison defines a “targeting ratio”describing the extent to which the deal is located in an area exhibiting moreor less of each land characteristic examined. Land characteristics examinedinclude market access (from ref. 41), crop suitability (from ref. 38), rela-tive crop yield for 17 major crops, average yield gaps for 17 major crops(from ref. 40), green water availability (from ref. 45), and existing irriga-tion infrastructure circa year 2000 (from ref. 48). Green water availabilitydescribes the location’s suitability for non water-stressed rain-fed agricul-ture and is defined using an index varying from zero to three, adapted fromref. 45. An index of zero indicates that the pixel experiences three or moremonths of green water scarcity during the growing season, while an indexof three indicates that the pixel experiences zero months of green waterscarcity during the growing season. Irrigation infrastructure targeting is onlyassessed for water-limited deals, that is, in areas where the green wateravailability index equals zero. We compare local irrigation infrastructurein these areas to the average prevalence of irrigation infrastructure acrosswater-limited croplands in each country. Relative crop yields are definedby normalizing crop yields circa 2000 (39) to their country averages, thenconstructing an area-weighted average across all crops examined. Majorcrops analyzed include maize, wheat, rice, soybean, barley, sorghum, mil-let, cotton, rapeseed, groundnut, sunflower, sugarcane, potato, cassava, oilpalm, rye, and sugar beet. For each land characteristic X, we calculated themean targeting ratio (MTR) as the ratio between the mean characteristicacross deals to the (weighted) mean characteristic across the correspondingcountries,
MTRX =
∑dealsi Xi∑Countries
j NjXj,
where Nj is the number of deals included for country j. The CI on the MTR isgenerated through nonparametric bootstrap resampling (1,000 repetitions).
Cropland Expansion and Intensification. Crop cover estimates for 2005 and2015 were obtained from two distinct datasets. The European Space Agency2005 Global Land Cover Product (Globcover2005) (64) has a resolution of300 m, with four crop intensity categories indicating the percentage of eachpixel covered by crops in 2005 (< 20%, 20 to 50%, 50 to 70%, and > 70%).The NASA Global Food Security-support Analysis dataset (65–69) (GFSAD30)has 30-m-resolution binary pixels indicating cultivation status in 2015 (cropvs. noncrop). Since all selected deals were completed between 2005 and2015, the two datasets provide an estimate of crop cover before andafter the land deals, albeit using distinct methodological approaches. Theseintrinsic methodological differences might cause systematic differences inestimated cropland that are important to consider when interpreting over-all trends. However, we do not expect them to affect our results, whichrely on a difference-and-difference identification strategy that explicitlycontrols for systematic shifts. Crop intensities in 2015 were computed byaggregating the 30-m GFSAD30 dataset to match the 300-m Globcover2005grid. Crop coverage fractions at 300-m resolution were then computedfrom each group of 100 binary GFSAD30 pixels and segmented into thesame categories as Globcover2005. Crop coverage in 2005 was computedby multiplying each Globcover2005 category by a coefficient correspond-ing to the average CCF obtained for this category for each continent, whenaggregating the GFSAD30 dataset. We replicated the analysis using global(instead of regional) average crop intensities, with nearly identical estimatesof fractional crop cover for each deal (see discussion in SI Appendix, Textand Fig. S2).
The relative change in the fraction of the deal area covered by crops (i.e.,the CCF) for each group g (deal or control areas) and each land deal i wasthen computed as
rCCFig =CCFig,2015
CCFig,2005− 1.
The change in the fraction of crop cover located in heavily cultivate land(SDCF) was computed as
∆SDCFig =C(70)
ig,2015
CCFig,2015−
C(70)ig,2005
CCFig,2005,
where C(70)ig,2015 indicates the area fraction of group g for deal i covered by
heavily cultivated land, defined as > 70% crop cover by 300-m pixel. Theexpected values of rCCFig and ∆SDCFig for each group g, and the associatedCIs, were obtained through nonparametric bootstrap (1,000 repetitions).The effect of each deal i on the extent or spatial consolidation of crop coverwas evaluated as
δi = Xi,DEAL−Xi,CONTROL,
where Xi,DEAL and Xi,CONTROL designate either rCCFig or ∆SDCFig for the deal(g = DEAL) and each of the three considered control groups (g = CONTROL):B1, B2, and B3. The expectation of δi across deals was finally estimatedthrough nonparametric bootstrap (1,000 repetitions), along with the P valuesassociated with the hypothesis H0 : E[δ] = 0. Accordingly, E[δ] can be inter-preted as the expected excess relative change (in percentage points) in thedeal area, compared to the baseline relative change in the control area.
Of note is that individual deals are weighted equally in the anal-ysis, meaning that estimates should be interpreted as the effect of amarginal deal (no matter its size) on the considered outcome. An alter-native approach, where the contribution of each deal is weighted by itssurface area, is discussed in SI Appendix. Outcomes can then be interpretedas the effect of a marginal unit area of acquired land (no matter into howmany LSLA deals it is partitioned). Results are qualitatively similar to theunweighted analysis, but are affected by a small number of large outlierdeals (SI Appendix, Fig. S3).
A potential shortcoming of our approach lies in its inability to account forthe temporal dimension of the agrarian transition. In reality, the conclusionof land deals and the expansion and subsequent intensification of crop-land occur sequentially, and possibly over a substantial period. By comparingtwo snapshots taken a decade apart, the analysis conflates deals situated atdifferent stages of that process. By confounding the expansion and intensi-fication of cropland, this may dilute both estimated effects. To investigatethis artifact, we replicated the analysis independently for the subsets ofdeals concluded in the first (2005–2010) and second (2010–2015) halves ofthe study period. The expectation was that the subsamples would bettertarget the intensification (old deals) and expansion (recent deals) effects ofLSLA, respectively. However, results (SI Appendix, Fig. S5) are nearly identicalto the full sample analysis, suggesting that the weak association betweenLSLAs and intensified agriculture did not emerge from unaccountedtime lags.
Crop Type Transitions. We identified crops that were in the area prior tothe deal using the dataset described in ref. 39, which contains crop areafor 175 crops at a 5-min spatial resolution in circa the year 2000. For eachdeal location, we calculated the fractional harvested area of the most preva-lent crops, which, together, met or exceeded 75% of the total harvestedarea. Intended crops were identified for each deal based on the crop inten-tions reported in the Land Matrix dataset, assuming equal area coverage foreach intended crop. The average crop compositions of deals by continent(Fig. 3A) were computed as the (unweighted) mean of the crop compositionof individual deals,
Fct =1
Nd
∑i
Fcit ,
where Fcit = Acit/Ait is the fraction of the harvested area Ait of deal i occu-pied by crop c on period t (i.e., ca. 2005 with observed crop types, or ca.2015 with intended crop types). Nd is the number of considered deals. Forthe crop transitions displayed in Fig. 3A, the approximately 120 individualcrop types from the constructed dataset were aggregated into seven cropcategories, following the Indicative Crop Classification system from the Foodand Agriculture Organization (70). We computed average crop outcome Cvt
across deals for each period by weighing crop-specific outcomes Xciv by thecorresponding crop fraction area Fcit ,
Cvt =1
Nd
∑c,i
FcitXciv .
Muller et al.Impact of transnational land acquisitions on local food security and dietary diversity
PNAS | 7 of 9https://doi.org/10.1073/pnas.2020535118
Dow
nloa
ded
by g
uest
on
Nov
embe
r 29
, 202
1

Each crop-specific outcome Xciv represents a value associated with out-come v and crop c at deal location i and was determined as followsfor the different considered outcome. The likelihood of export for eachcrop type and each country was determined by computing country-levelratios between export and production tonnages. Temporally averaged(2009–2013) crop production data were obtained for each relevant cropand country from the Food and Agriculture Data (FAOSTAT) platform(https://www.fao.org/faostat/en/#home) of the Food and Agriculture Orga-nization. We obtained crop-specific nutrient contents (in mass of nutrientper mass of harvested crop) for each country for seven key macronutrientsand micronutrients (folate, calcium, calories, plant-derived proteins, iron,zinc, and vitamin A) from FAOSTAT’s food balance sheets. We assumed con-stant yields across all locations per crop and constructed a deal-level scorefor each nutrient by weighing crop-specific nutrient contents by the cor-responding harvested area fractions, as shown in the equation. Note that,because some edible crops (e.g., maize, sugar cane, palm oil) have both foodand nonfood (e.g., biofuel) applications, this overestimates the nutrientsactually available to human consumption. Given the documented associ-ation between land deals and flex crops, we are likely to overestimatenutrient production after the land acquisition, hence producing a conser-vative estimate of the effect of land deals. Lastly, the relative change incrop diversity was computed in terms of mean number of distinct crop typesper deal. For all outcomes, a nonparametric bootstrap (1,000 repetition) wasrun to estimate 95% CIs around Cvt for each region.
Similar to the land use analysis, individual deals are weighted equally inthe analysis, meaning that estimates should be interpreted as the effect of amarginal deal (no matter its size) on the considered outcome. An alternativeapproach weighs the contribution of each deal by its surface area. Resultsof this alternate approach could be interpreted as the effect of a marginalsurface area of acquired land and are presented in SI Appendix, Figs. S7 andS8, with qualitatively similar results.
Household Dietary Diversity. We obtained dietary diversity outcomes for4,520 households from DHS that overlap spatially with the considered landdeals or their respective control areas. The considered households were sur-veyed in one of 17 cross-sectional DHS waves administered in 11 countries insub-Saharan Africa between 2006 and 2014 (SI Appendix, Table S3). Approxi-mately half of the households were surveyed before (after) the contract yearof the nearest land deal. We estimated an IDDS (55) for each child basedon reported intake from 10 food groups during the previous 24 h: cerealgrains, white tubers and root foods, dark leafy greens, vitamin A-rich veg-etables/tubers, vitamin A-rich fruits, other fruits and vegetables, meat andfish foods, eggs, legumes/nuts/seeds, and milk and milk products. The IDDSof each child ranged between 0 and 10, depending on whether their dietaryintake over the previous 24 h included at least one food item belonging tonone (IDDS = 0) or to all (IDDS = 10) of these 10 groups. As a robustnesscheck, we replicated all analyses using an alternative dietary diversity score(the minimum dietary diversity score) that is based on seven food groups(71), with nearly identical results (SI Appendix, Table S7). The mean IDDS
across all children below 5 y old was computed for each household. As afurther robustness check, we repeated the regression analyses using theminimum IDDS for each household, with comparable results (SI Appendix,Table S6, columns 4 and 5). DHS households were spatially joined with sev-eral geographic and agroecological variables known to potentially affectdietary diversity (e.g., refs. 72–74), including tree cover (from ref. 75), live-stock density (from ref. 76), distances to the nearest road (from ref. 77) andurban center (from ref. 78), and population density (from ref. 79). Addi-tional covariates obtained directly from DHS data include travel time towater source, age of youngest child, gender and education level of house-hold head, access to improved sanitation or water supply, and whether thehousehold lies in the lowermost or uppermost wealth quintiles of theircommunity. A comprehensive list of the considered covariates is given inSI Appendix, Table S4, along with summary statistics of the sampled house-holds in SI Appendix, Table S5. To estimate the effect of land deals on IDDS,we regressed household-level IDDS against a “postdeal” dummy variableindicating whether the household was surveyed before or after the con-tract date of the closest land deal. This specification was carried out on thesubset of 2,671 households corresponding to two Liberian deals with sur-veys taken both before and after the deal contracts. (Most other deals havetheir associated households surveyed either before or after their implemen-tation; see SI Appendix, Table S3.) Regression coefficients were estimatedthrough ordinary least squares with standard errors clustered by land deal.To evaluate the effect of land deals on time trends of dietary diversity,we interacted the postdeal dummy variable with the year of the survey.To avoid colinearity issues between the postdeal dummy and the surveyyear (Liberian households were sampled in two waves: one before and oneafter the deals), we carried out the analysis on the full sample all 4,520households. Regression coefficients were estimated through restricted max-imum likelihood, controlling for deal-level random effects. A statisticallysignificant regression coefficient for the interaction term indicates that thedeals are associated with a change in the temporal trend of dietary diver-sity. Further methodological details and robustness checks are discussed inSI Appendix.
Data Availability. Table of land deals and characteristics has been depositedin CurateND (https://doi.org/10.7274/r0-ycpf-qh53) (80).
ACKNOWLEDGMENTS. We thank Dr. Sandra Eckert and MokganediTatlhego for their help in the visual analysis. We also thank Taylor Rickettsand Brendan Fisher for their assistance with the dietary diversity dataset.We acknowledge financial support from the US NSF under Grant ICER1824951 (M.F.M and G.P.) and the National Socio-Environmental Synthe-sis Center under funding received from the NSF (Grants DBI-1639145 andDBI-1052875). The dietary diversity data and analysis was made possiblethrough funding from the US Department of Agriculture Hatch Program(Grant VT-H02303, Accession no. 1010486), and from the Biodiversity Resultsand Integrated Development Gains Enhanced Program of the USAID, andthe Luc Hoffman Institute at WWF International under funding from theMava Foundation.
1. International Land Coalition; Centre de Cooperation Internationale en RechercheAgronomique pour le Developpement; Centre for Development and Environment;German Institute of Global and Area Studies; Deutsche Gesellschaft fur InternationaleZusammenarbeit, The Land Matrix. https://landmatrix.org. Accessed 16 January2020.
2. P. D’Odorico, M. C. Rulli, The fourth food revolution. Nat. Geosci. 6, 417–418 (2013).3. S. M. Borras, Questioning market-led agrarian reform: Experiences from Brazil,
Colombia and South Africa. J. Agrar. Change 3, 367–394 (2003).4. P. D’Odorico, M. C. Rulli, J. Dell’Angelo, K. F. Davis, New frontiers of land and water
commodification: Socio-environmental controversies of large-scale land acquisitions.Land Degrad. Dev. 28, 2234–2244 (2017).
5. M. C. Rulli, P. D’Odorico, Food appropriation through large scale land acquisitions.Environ. Res. Lett. 9, 064030 (2014).
6. O. de Schutter, How not to think of land-grabbing: Three critiques of large-scaleinvestments in farmland. J. Peasant Stud. 38, 249–279 (2011).
7. S. Narula, The global land rush: Markets, rights, and the politics of food. Stanford J.Int. Law 49, 101–175 (2013).
8. P. Collier, S. Dercon, African agriculture in 50 years: Smallholders in a rapidly changingworld?World Dev. 63, 92–101 (2014).
9. H. Friedmann, The political economy of food: A global crisis. N. Left Rev. 197, 29(1993).
10. P. Bharadwaj, J. Fenske, N. Kala, R. A. Mirza. The green revolution and infantmortality in India. J. Health Econ. 71, 102314 (2020).
11. J. von der Goltz et al., Health impacts of the green revolution: Evidence from 600,000births across the developing world. J. Health Econ. 74, 102373 (2020).
12. F. Schiffman. Hunger, food security, and the African land grab. Ethics Int. Aff. 27,239–249 (2013).
13. J. A. Burney, S. J. Davis, D. B. Lobell, Greenhouse gas mitigation by agriculturalintensification. Proc. Natl. Acad. Sci. U.S.A. 107, 12052–12057 (2010).
14. K. Deininger, F. Xia, Quantifying spillover effects from large land-based investment:The case of Mozambique. World Dev. 87, 227–241 (2016).
15. S. H. Shah et al., Does household capital mediate the uptake of agricultural land,crop, and livestock adaptations? Evidence from the Indo-Gangetic Plains (India).Front. Sustain. Food Syst. 3, 1 (2019).
16. M. Herrero et al., Farming and the geography of nutrient production for human use:A transdisciplinary analysis. Lancet Planet. Health 1, e33–e42 (2017).
17. L. A. Garibaldi et al., Farming approaches for greater biodiversity, livelihoods, andfood security. Trends Ecol. Evol. 32, 68–80 (2017).
18. M. A. Altieri, F. R. Funes-Monzote, P. Petersen, Agroecologically efficient agriculturalsystems for smallholder farmers: Contributions to food sovereignty. Agron. Sustain.Dev. 32, 1–13 (2012).
19. J. N. Pretty et al., Resource-conserving agriculture increases yields in developingcountries. Environ. Sci. Technol. 40, 1114–1119 (2006).
20. N. E. Rada, K. O. Fuglie, New perspectives on farm size and productivity. Food Pol. 84,147–152 (2019).
21. J. Dell’Angelo, P. D’Odorico, M. C. Rulli, Threats to sustainable development posed byland and water grabbing. Curr. Opin. Environ. Sustain. 26, 120–128 (2017).
22. S. Jung, Evidence on land deals’ impacts on local livelihoods. Curr. Opin. Environ.Sustain. 32, 90–95 (2018).
23. K. F. Davis, K. Yu, M. C. Rulli, L. Pichdara, P. D’Odorico, Accelerated deforestationdriven by large-scale land acquisitions in Cambodia. Nat. Geosci. 8, 772–775 (2015).
24. J. Dell’Angelo, P. D’Odorico, M. C. Rulli, P. Marchand, The tragedy of the grabbedcommons: Coercion and dispossession in the global land rush. World Dev. 92, 1–12(2017).
8 of 9 | PNAShttps://doi.org/10.1073/pnas.2020535118
Muller et al.Impact of transnational land acquisitions on local food security and dietary diversity
Dow
nloa
ded
by g
uest
on
Nov
embe
r 29
, 202
1

ENV
IRO
NM
ENTA
LSC
IEN
CES
SUST
AIN
ABI
LITY
SCIE
NCE
25. K. F. Davis et al., Tropical forest loss enhanced by large-scale land acquisitions. Nat.Geosci. 13, 482–488 (2020).
26. K. F. Davis, M. C. Rulli, P. D’Odorico, The global land rush and climate change. Earth.Future 3, 298–311 (2015).
27. J. Dell’Angelo, M. C. Rulli, P. D’Odorico, The global water grabbing syndrome. Ecol.Econ. 143, 276–285 (2018).
28. J. Dell’Angelo, M. C. Rulli, P. D’Odorico, “Global water grabbing and food insecu-rity” in Food Insecurity: A Matter of Justice, Sovereignty, and Survival, T. Mayer,M. D. Anderson, Eds. (Routledge, 2020), pp. 113–128.
29. S. Lisk, The global land rush: Markets, rights, and the politics of food ‘land grab-bing’ or harnessing of development potential in agriculture? East Asia’s land-basedinvestments in Africa. Pac. Rev. 26, 563–587 (2013).
30. P. Bottazzi, D. Crespo, L. O. Bangura, S. Rist, Evaluating the livelihood impacts of alarge-scale agricultural investment: Lessons from the case of a biofuel productioncompany in northern Sierra Leone. Land Use Pol. 73, 128–137 (2018).
31. K. Hermele, The Appropriation of Ecological Space: Agrofuels, Unequal Exchange andEnvironmental Load Displacements (Routledge, 2013).
32. J. G. Zaehringer, A. Atumane, S. Berger, S. Eckert, Large-scale agricultural investmentstrigger direct and indirect land use change: New evidence from the Nacala corridor,Mozambique. J. Land Use Sci. 13, 325–343 (2018).
33. D. Ali, K. Deininger, A. Harris, Does large farm establishment create benefits forneighboring smallholders? Evidence from Ethiopia. Land Econ. 95, 71–90 (2019).
34. A. E. Schneider, What shall we do without our land? Land grabs and resistance inrural Cambodia. https://data.opendevelopmentmekong.net/library record/aaf52a47-ad43-5929-a4ab-5c46229fd841. Accessed 7 January 2021.
35. D. Nally, Governing precarious lives: Land grabs, geopolitics, and ‘food security.’Geogr. J. 181, 340–349 (2015).
36. H. Nyantakyi-Frimpong, R. B. Kerr, Land grabbing, social differentiation, intensifiedmigration and food security in northern Ghana. J. Peasant Stud. 44, 421–444 (2017).
37. P. Hufe, D. F. Heuermann, The local impacts of large-scale land acquisitions: A reviewof case study evidence from sub-Saharan Africa. J. Contemp. Afr. Stud. 35, 168–189(2017).
38. N. Ramankutty, J. A. Foley, J. Norman, K. McSweeney, The global distribution of cul-tivable lands: Current patterns and sensitivity to possible climate change. Global Ecol.Biogeogr. 11, 377–392 (2002).
39. C. Monfreda et al., “Global agricultural land use data for climate change analy-sis” in Economic Analysis of Land Use in Global Climate Change Policy, T. W. Hertel,S. K. Rose, R. S. J. Tol, Eds. (Routledge, 2009), vol. 14, p. 33.
40. N. D. Mueller et al., Closing yield gaps through nutrient and water management.Nature 490, 254–257 (2012).
41. P. H. Verburg, E. C. Ellis, A. Letourneau, A global assessment of market accessibilityand market influence for global environmental change studies. Environ. Res. Lett. 6,034019 (2011).
42. M. C. Rulli, A. Saviori, P. D’Odorico, Global land and water grabbing. Proc. Natl. Acad.Sci. U.S.A. 110, 892–897 (2013).
43. L. A. Wily, ‘The law is to blame’: The vulnerable status of common property rights insub-Saharan Africa. Dev. Change 42, 733–757 (2011).
44. L. A. Wily, The Tragedy of Public Lands: The Fate of the Commons under GlobalCommercial Pressure (International Land Coalition, 2011).
45. L. Rosa, D. D. Chiarelli, M. C. Rulli, J. Dell’Angelo, P. D’Odorico, Global agriculturaleconomic water scarcity. Sci. Adv. 6, eaaz6031 (2020).
46. E. L. Johansson, M. Fader, J. W. Seaquist, K. A. Nicholas, Green and blue waterdemand from large-scale land acquisitions in Africa. Proc. Natl. Acad. Sci. U.S.A. 113,11471–11476 (2016).
47. M. C. Rulli, P. D’Odorico, The water footprint of land grabbing. Geophys. Res. Lett.40, 6130–6135 (2013).
48. S. Siebert et al., A global data set of the extent of irrigated land from 1900 to 2005.Hydrol. Earth Syst. Sci. 19, 1521–1545 (2015).
49. J. F. McCarthy, J. A. C. Vel, S. Afiff, Trajectories of land acquisition and enclosure:Development schemes, virtual land grabs, and green acquisitions in Indonesia’s outerislands. J. Peasant Stud. 39, 521–549 (2012).
50. P. Messerli, A. Heinimann, M. Giger, T. Breu, O. Schonweger, From ‘land grabbing’ tosustainable investments in land: Potential contributions by land change science. Curr.Opin. Environ. Sustain. 5, 528–534 (2013).
51. R. Chandran, T. Gardner, Calls to end Africa’s ’horrific’ land deals after Indian firm’sfallout. Reuters, 28 November 2017. https://www.reuters.com/article/us-ethiopia-landrights-india/calls-to-end-africas-horrific-land-deals-after-indian-firms-fallout-idUSKBN1DS1FK. Accessed 7 January 2021.
52. D. Carrington, UK firm’s failed biofuel dream wrecks lives of Tanzania villagers.The Guardian, 30 October 2011. https://www.theguardian.com/environment/2011/oct/30/africa-poor-west-biofuel-betrayal. Accessed 7 January 2021.
53. M. F. Muller, M. C. Levy, Complementary vantage points: Integrating hydrology andeconomics for sociohydrologic knowledge generation. Water Resour. Res. 55, 2549–2571 (2019).
54. D. M. Johnson, An assessment of pre-and within-season remotely sensed variables forforecasting corn and soybean yields in the United States. Rem. Sens. Environ. 141,116–128 (2014).
55. G. Kennedy, T. Ballard, M. Claude Dop, Guidelines for Measuring Household and Indi-vidual Dietary Diversity (Food and Agriculture Organization of the United Nations,2011).
56. L. A. Wily, Looking back to see forward: The legal niceties of land theft in land rushes.J. Peasant Stud. 39, 751–775 (2012).
57. N. Ramankutty, V. Ricciardi, Z. Mehrabi, V. Seufert, Trade-offs in the performance ofalternative farming systems. Agric. Econ. 50, 97–105 (2019).
58. M. Jain et al., How much can sustainable intensification increase yields across SouthAsia? A systematic review of the evidence. Environ. Res. Lett. 15, 083004 (2020).
59. W. Anseeuw, J. Lay, P. Messerli, M. Giger, M. Taylor, Creating a public tool to assessand promote transparency in global land deals: The experience of the land matrix. J.Peasant Stud. 40, 521–530 (2013).
60. I. Scoones, R. Hall, S. M. Borras, Jr, B. White, W. Wolford, The politics of evidence:Methodologies for understanding the global land rush. J. Peasant Stud. 40, 469–483(2013).
61. M. C. Rulli, P. D’Odorico, The science of evidence: The value of global studies on landrush. J. Peasant Stud. 40, 907–909 (2013).
62. K. Nolte, W. Chamberlain, M. Giger, International Land Deals for Agriculture: FreshInsights from the Land Matrix: Analytical Report II (Land Matrix, 2016).
63. N. Ramankutty, A. T. Evan, C. Monfreda, J. A. Foley, Farming the planet: 1. Geographicdistribution of global agricultural lands in the year 2000. Global Biogeochem. Cycles22, GB1003 (2008).
64. European Space Agency, Globcover2005, due.esrin.esa.int/page globcover.php.Accessed 7 January 2021.
65. J. Xiong et al., NASA Making Earth System Data Records for Use in Research Envi-ronments (MEASURES) Global Food Security-Support Analysis Data (GFSAD) CroplandExtent 2015 Africa 30 m v001 (International Crops Research Institute for the Semi-AridTropics, 2017).
66. A. J. Oliphant et al., NASA Making Earth System Data Records for Use in ResearchEnvironments (MEASURES) Global Food Security-Support Analysis Data (GFSAD) Crop-land Extent 2015 Southeast Asia 30 m v001 (International Crops Research Institute forthe Semi-Arid Tropics, 2017).
67. M. K. Gumma et al., NASA Making Earth System Data Records for Use in ResearchEnvironments (MEASURES) Global Food Security-Support Analysis Data (GFSAD) Crop-land Extent 2015 South Asia, Afghanistan, Iran 30 m v001 (International CropsResearch Institute for the Semi-Arid Tropics, 2017).
68. A. Phalke et al., NASA Making Earth System Data Records for Use in Research Envi-ronments (MEASURES) Global Food Security-Support Analysis Data (GFSAD) CroplandExtent 2015 Europe (International Crops Research Institute for the Semi-Arid Tropics,2017).
69. Y. Zhong et al., NASA Making Earth System Data Records for Use in Research Envi-ronments (MEASURES) Global Food Security-Support Analysis Data (GFSAD) CroplandExtent 2015 South America (International Crops Research Institute for the Semi-AridTropics, 2017).
70. Food and Agriculture Organization, Programme, Concepts and Definitions (WorldProgramme for the Census of Agriculture 2020, Food and Agriculture Organization,2017), vol. 1.
71. World Health Organization, Indicators for Assessing Infant and Young ChildFeedingPpractices: Part 2: Measurement (World Health Organization, 2010).
72. M. T. Niles, M. E. Brown, A multi-country assessment of factors related to smallholderfood security in varying rainfall conditions. Sci. Rep. 7, 1–11 (2017).
73. M. T. Niles, J. D. Salerno, A cross-country analysis of climate shocks and smallholderfood insecurity. PloS One 13, e0192928 (2018).
74. M. T. Niles et al., Climate impacts associated with reduced diet diversity inchildren across nineteen countries. Environ. Res. Lett., 10.1088/1748-9326/abd0ab(2020).
75. M. C. Hansen et al., High-resolution global maps of 21st-century forest cover change.Science 342, 850–853 (2013).
76. G. Fischer H. T. van Velthulzen, M. M. Shah, F. O. Nachtergaele, “Global Agro-Ecological Zones (GAEZ v3. 0)-model documentation” (Rep. RR-02-002, InternationalInstitute for Applied Systems Analysis, 2012).
77. Center for International Earth Science Information Network,Columbia Univer-sity;Information Technology Outreach Services,University of Georgia, Global RoadsOpen Access Data Set, version 1 (GROADSv1). https://doi.org/10.7927/H4VD6WCT.Accessed 7 January 2021.
78. W. V. Reid et al., Ecosystems and Human Well-Being-Synthesis: A Report of theMillennium Ecosystem Assessment (Island, 2005).
79. Center for International Earth Science Information Network CIESIN Columbia Uni-versity and Centro Internacional de Agricultura Tropical CIAT, Gridded Popula-tion of the World, version 3 (GPWV3): Population density grid. https://doi.org/10.7927/H4XK8CG2. Accessed 7 January 2021.
80. M. F. Muller, Data for ‘Impact of transnational land acquisitions on local food securityand dietary diversity.’ curateND. https://curate.nd.edu/show/rv042r40b62. Deposited24 November 2020.
81. OpenDevelopment Cambodia, Data from “Economic land concessions (ELCs).OpenDevelopment Cambodia. https://data.opendevelopmentcambodia.net/dataset/economiclandconcessions?type=dataset. Accessed 7 January 2021.
Muller et al.Impact of transnational land acquisitions on local food security and dietary diversity
PNAS | 9 of 9https://doi.org/10.1073/pnas.2020535118
Dow
nloa
ded
by g
uest
on
Nov
embe
r 29
, 202
1