Embed Size (px)
Citation preview

DOT HS 811 667 August 2012
Impact of Transmission Technologies on Fuel Efficiency – Final Report

This publication is distributed by the U.S. Department of Transportation, National Highway Traffic Safety Administration, in the interest of information exchange. The opinions, findings, and conclusions expressed in this publication are those of the authors and not necessarily those of the Department of Transportation or the National Highway Traffic Safety Administration. The United States Government assumes no liability for its content or use thereof. If trade names or products are mentioned, it is because they are considered essential to the object of the publication and should not be construed as an endorsement. The United States Government does not endorse products or manufacturers.
Suggested APA Format Reference: Moawad, A. and Rousseau, A. (2012, August). Effect of Transmission Technologies on Fuel Efficiency – Final Report. (Report No. DOT HS 811 667). Argonne, IL: Argonne National Laboratory.

i
Technical Report Documentation Page 1. Report No. 2. Government Accession No. 3. Recipient’s Catalog No.
DOT HS 811 667
4. Title and Subtitle 5. Report Date
Effect of Transmission Technologies on Fuel Efficiency – Final Report August 2012
6. Performing Organization Code
7. Author(s) 8. Performing Organization Report No.
Ayman Moawad, Aymeric Rousseau
9. Performing Organization Name and Address 10. Work Unit No. (TRAIS)
Energy Systems Division Argonne National Laboratory
Argonne, IL 60439
11. Contract or Grant No.
12. Sponsoring Agency Name and Address 13. Type of Report and Period Covered
National Highway Traffic Safety Administration 1200 New Jersey Avenue SE. Washington, DC 20590
External Technical Report
14. Sponsoring Agency Code
15. Supplementary Notes
16. Abstract
In developing Corporate Average Fuel Economy (CAFE) standards, DOT/NHTSA makes use of the CAFE Compliance and Effects Modeling System (the "CAFE model"), which was developed by DOT’s Volpe National Transportation Systems Center. The Volpe model uses numerous engineering and economic inputs in its analysis of potential CAFE standards. Some of the most significant engineering inputs are the incremental fuel-savings estimates and synergy factors associated with new technology applications. Vehicle simulation results are used by the Volpe Center to update the model’s technology effectiveness estimates found in the model’s decision trees. The decision trees are designed and configured to allow the Volpe model to apply technologies in a cost-effective, logical order that also considers ease of implementation. The decision trees are created such that each technology step is represented by an incremental effectiveness, the actual fuel consumption improvement in moving from one step to another, as well as an absolute value of effectiveness, which signifies the overall improvement starting from the reference baseline vehicle. The objectives of the present study were to: (1) Update the current decision tree structure based on the latest transmission technologies, and (2) Quantify the impact of each technology option as both an incremental improvement from the previous technology and absolute improvement over the baseline vehicle in each of the vehicle classes. ANL used its vehicle simulation tool, Autonomie, to provide DOT/NHTSA with fuel-efficiency improvement results for different technologies within the decision trees. The technologies considered included the following: Automatic transmissions (up to 8 speeds), Dual clutch transmissions (DCTs) up to 8 speeds, High-efficiency transmissions, and early torque converter lockup.
The results from each are summarized for the various vehicle classes, including the incremental effectiveness values used by the CAFE model decision trees.
17. Key Words 18. Distribution Statement
Document is available to the public from the National Technical Information Service www.ntis.gov
19 Security Classif. (of this report) 20. Security Classif. (of this page) 21 No. of Pages 22. Price
Unclassified Unclassified 129
Form DOT F 1700.7 (8-72) Reproduction of completed page authorized

Page | 0
ANL/ESD/12-6
Impact of Transmission
Technologies on Fuel Efficiency
Energy Systems Division

ANL/ESD/12-6 – Impact of Transmission Technology on Fuel Efficiency
Page | 1
About Argonne National Laboratory Argonne is a U.S. Department of Energy laboratory managed by UChicago Argonne, LLC
under contract DE-AC02-06CH11357. The Laboratory’s main facility is outside Chicago,
at 9700 South Cass Avenue, Argonne, Illinois 60439. For information about Argonne
and its pioneering science and technology programs, see www.anl.gov.
Availability of This Report This report is available, at no cost, at http://www.osti.gov/bridge. It is also available on paper to the U.S. Department of Energy and its contractors, for a processing fee, from:
U.S. Department of Energy Office of Scientific and Technical Information P.O. Box 62 Oak Ridge, TN 37831-0062 phone (865) 576-8401 fax (865) 576-5728 [email protected]
Disclaimer This report was prepared as an account of work sponsored by an agency of the United States Government. Neither the United States
Government nor any agency thereof, nor UChicago Argonne, LLC, nor any of their employees or officers, makes any warranty, express or
implied, or assumes any legal liability or responsibility for the accuracy, completeness, or usefulness of any information, apparatus, product, or
process disclosed, or represents that its use would not infringe privately owned rights. Reference herein to any specific commercial product,
process, or service by trade name, trademark, manufacturer, or otherwise, does not necessarily constitute or imply its endorsement,
recommendation, or favoring by the United States Government or any agency thereof. The views and opinions of document authors expressed
herein do not necessarily state or reflect those of the United States Government or any agency thereof, Argonne National Laboratory, or
UChicago Argonne, LLC.
ANL/ESD/12-6

ANL/ESD/12-6 – Impact of Transmission Technology on Fuel Efficiency
Page | 2
Impact of Transmission
Technologies on Fuel Efficiency
by Ayman Moawad and Aymeric Rousseau Energy Systems Division, Argonne National Laboratory August 2012

ANL/ESD/12-6 – Impact of Transmission Technology on Fuel Efficiency
Page | 3
Energy Systems Division Argonne National Laboratory 9700 South Cass Avenue, Bldg. 362 Argonne, IL 60439-4815 www.anl.gov
Argonne National Laboratory is a U.S. Department of Energy
laboratory managed by UChicago Argonne, LLC

ANL/ESD/12-6 – Impact of Transmission Technology on Fuel Efficiency
Page | 4
Contents
Acronyms ...................................................................................................................................................... 9
Acronyms and Abbreviations .................................................................................................................... 9
Units of Measure..................................................................................................................................... 10
Acknowledgments ....................................................................................................................................... 11
1. Introduction ........................................................................................................................................ 12
2. Autonomie .......................................................................................................................................... 16
2.1. Overview ..................................................................................................................................... 16
2.2. Structure ..................................................................................................................................... 18
3. Study Assumptions .............................................................................................................................. 22
4. Baseline Assumptions ......................................................................................................................... 25
4.1. Reference Vehicle ....................................................................................................................... 25
4.2. Engine .......................................................................................................................................... 26
4.3. Transmission ............................................................................................................................... 28
4.4. Accessory Loads .......................................................................................................................... 31
4.5. Control Algorithm ....................................................................................................................... 31
4.5.1. Shifting Control Algorithms ................................................................................................. 31
4.5.2. Torque Converter ................................................................................................................ 41
4.6. Vehicle Simulation Conditions .................................................................................................... 43
5. Simulation Results ............................................................................................................................... 44
5.1. Reference Vehicle ....................................................................................................................... 44
5.1.1. Engine Operating Conditions .............................................................................................. 44
5.1.2. Gear Shifting ........................................................................................................................ 47
5.2. Advanced Automatic Transmissions ........................................................................................... 51
5.2.1. Impact of Early Torque Converter Lockup .......................................................................... 51
5.2.2. Impact of Higher Gear Number........................................................................................... 55
5.2.3. Fuel Consumption Benefits ................................................................................................. 65
5.3. Dual Clutch Transmission ............................................................................................................ 66
5.3.1. Impact of Transmission Technology ................................................................................... 66
5.3.2. Impact of Higher Gear Number........................................................................................... 70

ANL/ESD/12-6 – Impact of Transmission Technology on Fuel Efficiency
Page | 5
5.3.3. Fuel Consumption Benefits ................................................................................................. 75
5.4. Shift Event Comparison with Vehicle Test Data .......................................................................... 76
6. Transmission Decision Tree from Simulations .................................................................................... 78
6.1. Uncertainty Analysis ................................................................................................................... 81
6.1.1. Impact of Engine Technology .............................................................................................. 81
6.1.2. Expert and Literature Analysis ............................................................................................ 88
7. Simulation Results for Additional Vehicle Classes .............................................................................. 92
7.1. Compact Car Class ....................................................................................................................... 92
7.2. Small SUV Class ......................................................................................................................... 100
7.3. Mid-Size SUV Class .................................................................................................................... 105
7.4. Pickup Truck Class ..................................................................................................................... 110
8. Summary ........................................................................................................................................... 116
9. References ........................................................................................................................................ 118
APPENDIX 1 – Peer Review Comments and Responses ............................................................................ 120
Tables
TABLE 1 – MAIN VEHICLE SPECIFICATIONS............................................................................................................................. 25
TABLE 2 – MAIN ENGINE SPECIFICATIONS ............................................................................................................................. 27
TABLE 3 – TRANSMISSION RATIOS ....................................................................................................................................... 29
TABLE 4 – FINAL DRIVE RATIOS AND VEHICLE PERFORMANCE ................................................................................................... 31
TABLE 5 – PERCENTAGE TIME TORQUE CONVERTER IS LOCKED (FTP CYCLE) ................................................................................ 53
TABLE 6 – PERCENTAGE TIME TORQUE CONVERTER IS LOCKED (HFET CYCLE) ............................................................................. 55
TABLE 7 – FUEL CONSUMPTION (L/100 KM) COMPARISON UNDER NORMAL AND AGGRESSIVE LOCKUP STRATEGIES ........................... 55
TABLE 8 – PERCENTAGE TIME SPENT IN EACH GEAR (FTP CYCLE) .............................................................................................. 58
TABLE 9 – SUMMARY OF FTP CYCLE EFFICIENCIES AND SPEEDS FOR AUTOMATIC TRANSMISSIONS ................................................... 60
TABLE 10 – PERCENTAGE TIME SPENT IN EACH GEAR (HFET CYCLE).......................................................................................... 63
TABLE 11 – SUMMARY OF HFET CYCLE EFFICIENCIES AND SPEEDS FOR AUTOMATIC TRANSMISSIONS CONSIDERED ............................. 64
TABLE 12 – FUEL CONSUMPTION RESULTS (L/100 KM) AND PERCENTAGE IMPROVEMENT FOR AUTOMATIC TRANSMISSIONS ............... 65
TABLE 13 – FUEL ECONOMY RESULTS (MPG) AND PERCENTAGE IMPROVEMENT FOR AUTOMATIC TRANSMISSIONS ............................. 66
TABLE 14 – PERCENTAGE TIME SPENT IN EACH GEAR, FTP CYCLE .............................................................................................. 72
TABLE 15 – PERCENTAGE OF TIME SPENT IN EACH GEAR, HFET CYCLE ....................................................................................... 72
TABLE 16 – SUMMARY OF FTP CYCLE EFFICIENCIES AND SPEEDS FOR DCTS ................................................................................ 74
TABLE 17 – SUMMARY OF HFET CYCLE EFFICIENCIES AND SPEEDS FOR DCTS .............................................................................. 74
TABLE 18 – FUEL CONSUMPTION RESULTS (L/100 KM) AND PERCENTAGE IMPROVEMENT FOR DCTS; AUTOMATIC TRANSMISSION/DCT
COMPARISON .......................................................................................................................................................... 75

ANL/ESD/12-6 – Impact of Transmission Technology on Fuel Efficiency
Page | 6
TABLE 19 – FUEL ECONOMY RESULTS (MPG) AND PERCENTAGE IMPROVEMENT FOR DCTS; AUTOMATIC TRANSMISSION/DCT
COMPARISON .......................................................................................................................................................... 76
TABLE 20 – FUEL CONSUMPTION RESULTS (L/100 KM) AND PERCENTAGE IMPROVEMENT FOR AUTOMATIC TRANSMISSIONS WITH
ADVANCED ENGINE .................................................................................................................................................. 81
TABLE 21 – FUEL ECONOMY RESULTS (MPG) AND PERCENTAGE IMPROVEMENT FOR AUTOMATIC TRANSMISSIONS WITH ADVANCED
ENGINE .................................................................................................................................................................. 82
TABLE 22 – FUEL CONSUMPTION RESULTS (L/100 KM) AND PERCENTAGE IMPROVEMENT FOR AUTOMATIC TRANSMISSIONS WITH
ADVANCED ENGINE .................................................................................................................................................. 85
TABLE 23 – FUEL ECONOMY RESULTS (MPG) AND PERCENTAGE IMPROVEMENT FOR AUTOMATIC TRANSMISSIONS WITH ADVANCED
ENGINE .................................................................................................................................................................. 86
TABLE 24 – FUEL CONSUMPTION IMPROVEMENT SUMMARY, AUTOMATIC TRANSMISSION PATH ..................................................... 88
TABLE 25 – FUEL CONSUMPTION IMPROVEMENT SUMMARY – DCT PATH .................................................................................. 89
TABLE 26 – COMPACT CAR SPECIFICATIONS .......................................................................................................................... 94
TABLE 27 – COMPACT CAR GEARBOX RATIOS ........................................................................................................................ 94
TABLE 28 – COMPACT CAR COMPARISON OF FUEL CONSUMPTION (L/100 KM) UNDER NORMAL AND AGGRESSIVE LOCKUP STRATEGIES 95
TABLE 29 – COMPACT CAR TORQUE CONVERTER EFFICIENCY .................................................................................................... 96
TABLE 30 – COMPACT CAR SUMMARY OF FTP EFFICIENCIES AND SPEEDS FOR AUTOMATIC ............................................................ 96
TABLE 31 – COMPACT CAR FUEL CONSUMPTION RESULTS (L/100 KM) AND PERCENTAGE IMPROVEMENT ........................................ 97
TABLE 32 – COMPACT CAR FUEL ECONOMY RESULTS (MPG) AND PERCENTAGE IMPROVEMENT ...................................................... 98
TABLE 33 – SMALL SUV SPECIFICATIONS ............................................................................................................................ 101
TABLE 34 – SMALL SUV GEARBOX RATIOS .......................................................................................................................... 101
TABLE 35 – SMALL SUV COMPARISON OF FUEL CONSUMPTION (L/100 KM) UNDER NORMAL AND AGGRESSIVE LOCKUP STRATEGIES . 102
TABLE 36 – SMALL SUV FUEL CONSUMPTION RESULTS (L/100 KM) AND PERCENTAGE IMPROVEMENT .......................................... 102
TABLE 37 – SMALL SUV FUEL ECONOMY RESULTS (MPG) AND PERCENTAGE IMPROVEMENT ........................................................ 102
TABLE 38 – MID-SIZE SUV VEHICLE SPECIFICATIONS ............................................................................................................ 106
TABLE 39 – MIDSIZE SUV GEARBOX RATIOS ....................................................................................................................... 106
TABLE 40 – MIDSIZE SUV COMPARISON OF FUEL CONSUMPTION (L/100 KM) UNDER NORMAL AND AGGRESSIVE LOCKUP STRATEGIES
.......................................................................................................................................................................... 107
TABLE 41 – MID-SIZE SUV FUEL CONSUMPTION RESULTS (L/100 KM) AND PERCENTAGE IMPROVEMENT ...................................... 107
TABLE 42 – MID-SIZE SUV FUEL ECONOMY RESULTS (MPG) AND PERCENTAGE IMPROVEMENT .................................................... 108
TABLE 43 – PICKUP TRUCK VEHICLE SPECIFICATIONS ............................................................................................................. 111
TABLE 44 – PICKUP TRUCK GEARBOX RATIOS ...................................................................................................................... 111
TABLE 45 – PICKUP TRUCK COMPARISON OF FUEL CONSUMPTION (L/100 KM) UNDER NORMAL AND AGGRESSIVE LOCKUP STRATEGIES
.......................................................................................................................................................................... 112
TABLE 46 – PICKUP TRUCK FUEL CONSUMPTION RESULTS (L/100 KM) AND PERCENTAGE IMPROVEMENT ....................................... 113
TABLE 47 – PICKUP TRUCK FUEL ECONOMY RESULTS (MPG) AND PERCENTAGE IMPROVEMENT ..................................................... 113
Figures
FIGURE 1 – ORIGINAL DECISION TREE (JUNE 24, 2011; VOLPE) .............................................................................................. 14
FIGURE 2 – SIMULATION MANAGEMENT CONCEPTS ................................................................................................................ 18
FIGURE 3 – CLASS DIAGRAM OF CONTAINER AND TERMINATING SYSTEMS ................................................................................... 19
FIGURE 4 – TOP-LEVEL VEHICLE LAYOUT ............................................................................................................................... 20

ANL/ESD/12-6 – Impact of Transmission Technology on Fuel Efficiency
Page | 7
FIGURE 5 – MODELS ARE AUTOMATICALLY BUILT ................................................................................................................... 21
FIGURE 6 – MODIFIED DECISION TREE .................................................................................................................................. 23
FIGURE 7 – CONVENTIONAL VEHICLE MODEL ......................................................................................................................... 26
FIGURE 8 – SPARK-IGNITION DIRECT-INJECTION (SIDI) 2.2-L ENGINE MAP (ARGONNE TEST DATA) ................................................ 28
FIGURE 9 – AVERAGE GEAR SPAN AND TOP GEAR RATIOS FROM A COUPLE OF TRANSMISSIONS ON THE MARKET CURRENT MARKET .......... 30
FIGURE 10 - AVERAGE GEAR SPAN AND TOP GEAR RATIOS FROM ARGONNE SELECTION REPRESENTING THE POTENTIAL FUTURE MARKET ... 30
FIGURE 11 – SHIFTING CONTROLLER SCHEMATIC .................................................................................................................... 32
FIGURE 12 – UPSHIFTING GEAR MAP (LEFT), UPSHIFTING VEHICLE SPEEDS (RIGHT) ...................................................................... 33
FIGURE 13 – EXAMPLE OF ENGINE SPEED RANGE IN ECONOMICAL DRIVING, AND ECONOMICAL SHIFT.............................................. 34
FIGURE 14 – MAXIMUM ENGINE TORQUE AT WHEELS AND PERFORMANCE UPSHIFT SPEEDS .......................................................... 36
FIGURE 15 – DESIGN OF UPSHIFTING AND DOWNSHIFTING SPEED CURVES FOR TWO ADJACENT GEARS ............................................ 37
FIGURE 16 – SHIFTING SPEED CURVES FOR A DEFAULT LIGHT-DUTY VEHICLE IN AUTONOMIE ......................................................... 37
FIGURE 17 – GENERIC SHIFT PROCESS FOR AUTOMATIC TRANSMISSION [17] .............................................................................. 38
FIGURE 18 – TORQUE HOLE IN AUTONOMIE DURING SHIFTING EVENT ........................................................................................ 39
FIGURE 19 - 5-SPEED AUTOMATIC UP (PLAIN LINES) AND DOWN (DOTTED LINES) SHIFTING MAP ....................................................... 40
FIGURE 20 - 6-SPEED AUTOMATIC UP (PLAIN LINES) AND DOWN (DOTTED LINES) SHIFTING MAP ....................................................... 40
FIGURE 21 - 8-SPEED AUTOMATIC UP (PLAIN LINES) AND DOWN (DOTTED LINES) SHIFTING MAP ....................................................... 41
FIGURE 22 – TORQUE CONVERTER EFFICIENCY ....................................................................................................................... 42
FIGURE 23 – TORQUE CONVERTER LOCKUP CONTROL ALGORITHM ............................................................................................ 42
FIGURE 24 – FTP DRIVE CYCLE – VEHICLE SPEED (MPH) .......................................................................................................... 43
FIGURE 25 – HFET DRIVE CYCLE – VEHICLE SPEED (MPH) ....................................................................................................... 43
FIGURE 26 – ENGINE OPERATING DENSITY PLOT (FTP CYCLE) .................................................................................................. 45
FIGURE 27 – ENGINE OPERATING DENSITY PLOT (HFET CYCLE) ................................................................................................ 46
FIGURE 28 – VEHICLE SPEED AND SHIFTING LOGIC (FTP CYCLE) ................................................................................................ 47
FIGURE 29 - NORMAL TORQUE CONVERTER LOCKUP STRATEGIES (FTP CYCLE) ............................................................................. 48
FIGURE 30 – VEHICLE SPEED AND SHIFTING LOGIC (HFET CYCLE).............................................................................................. 49
FIGURE 31 – NORMAL TORQUE CONVERTER LOCKUP STRATEGIES (HFET CYCLE) ......................................................................... 50
FIGURE 32 - NORMAL AND AGGRESSIVE TORQUE CONVERTER LOCKUP STRATEGIES (FTP CYCLE) .................................................... 51
FIGURE 33 – 150–300 SECONDS OF NORMAL AND AGGRESSIVE TORQUE CONVERTER LOCKUP STRATEGIES (FTP CYCLE)................... 52
FIGURE 34 – NORMAL AND AGGRESSIVE TORQUE CONVERTER LOCKUP STRATEGY (HFET CYCLE) .................................................... 53
FIGURE 35 – FIRST 60 SECONDS OF NORMAL AND AGGRESSIVE TORQUE CONVERTER LOCKUP STRATEGY (HFET CYCLE) .................... 54
FIGURE 36 – SHIFTING LOGIC ON FTP CYCLE FOR AUTOMATIC TRANSMISSIONS ............................................................................ 56
FIGURE 37 – SHIFTING LOGIC ON FTP CYCLE FOR 5-SPEED VERSUS 6-SPEED ............................................................................... 57
FIGURE 38 – SHIFTING LOGIC ON FTP CYCLE FOR 6-SPEED VERSUS 8-SPEED ............................................................................... 57
FIGURE 39 – GEARBOX RATIOS ON FTP CYCLE FOR ALL AUTOMATIC TRANSMISSIONS CONSIDERED ................................................. 58
FIGURE 40 – ENGINE SPEED ON FTP CYCLE FOR THE 5–SPEED AND 6-SPEED AUTOMATIC TRANSMISSIONS ....................................... 59
FIGURE 41 – ENGINE SPEED ON FTP CYCLE FOR THE 6-SPEED AND 8-SPEED AUTOMATIC TRANSMISSIONS ........................................ 60
FIGURE 42 – SHIFTING LOGIC ON HFET CYCLE FOR ALL AUTOMATIC TRANSMISSIONS ................................................................... 61
FIGURE 43 – GEARBOX RATIOS ON HFET CYCLE FOR ALL AUTOMATIC TRANSMISSIONS ................................................................. 63
FIGURE 44 – ENGINE SPEED ON HFET CYCLE FOR ALL AUTOMATIC TRANSMISSIONS ..................................................................... 64
FIGURE 45 – GEAR NUMBER ON FTP CYCLE FOR THE 6-SPEED AUTOMATIC VERSUS 6-SPEED DCT .................................................. 67
FIGURE 46 – ENGINE SPEED ON FTP CYCLE FOR 6-SPEED AUTOMATIC VERSUS 6-SPEED DCT ......................................................... 68
FIGURE 47 – GEAR NUMBER ON HFET CYCLE FOR THE 6-SPEED AUTOMATIC VERSUS 6-SPEED DCT................................................ 69
FIGURE 48 – ENGINE SPEED ON HFET CYCLE FOR 6-SPEED AUTOMATIC VERSUS 6-SPEED DCT ...................................................... 70
FIGURE 49 – SHIFTING LOGIC ON FTP CYCLE FOR ALL DCTS ..................................................................................................... 71
FIGURE 50 – SHIFTING LOGIC ON HFET CYCLE FOR ALL DCTS ................................................................................................... 71

ANL/ESD/12-6 – Impact of Transmission Technology on Fuel Efficiency
Page | 8
FIGURE 51 – ENGINE SPEED ON FTP CYCLE FOR ALL DCTS ....................................................................................................... 73
FIGURE 52 – ENGINE SPEED ON HFET CYCLE FOR ALL DCTS ..................................................................................................... 74
FIGURE 53 – TRANSMISSION DECISION TREE RESULTING FROM SIMULATIONS .............................................................................. 79
FIGURE 54 – TRANSMISSION DECISION TREE WITH ADVANCED ENGINE....................................................................................... 83
FIGURE 55 – LAUNCH RESPONSE COMPARISON BETWEEN AT AND DCT WITH TURBO-BOOSTING [25] ............................................. 84
FIGURE 56 – TRANSMISSION DECISION TREE WITH ADVANCED ENGINE....................................................................................... 87
FIGURE 57 – LOW-RANGE ESTIMATES DECISION TREE ............................................................................................................. 90
FIGURE 58 – HIGH-RANGE ESTIMATES DECISION TREE ............................................................................................................ 91
FIGURE 59 – COMPACT CAR DECISION TREE DEFINITION ......................................................................................................... 93
FIGURE 60 – COMPACT CAR NORMAL AND AGGRESSIVE TORQUE CONVERTER LOCKUP STRATEGIES ON FTP CYCLE ............................ 95
FIGURE 61 – COMPACT CAR TRANSMISSION DECISION TREE ..................................................................................................... 99
FIGURE 62 – SMALL SUV DECISION TREE DEFINITION ........................................................................................................... 100
FIGURE 63 – SMALL SUV TRANSMISSION DECISION TREE ...................................................................................................... 104
FIGURE 64 – MID-SIZE SUV DECISION TREE DEFINITION ....................................................................................................... 105
FIGURE 65 – MID-SIZE SUV TRANSMISSION DECISION TREE .................................................................................................. 109
FIGURE 66 – PICKUP TRUCK DECISION TREE DEFINITION ........................................................................................................ 110
FIGURE 67 – PICKUP TRUCK TRANSMISSION DECISION TREE ................................................................................................... 115

ANL/ESD/12-6 – Impact of Transmission Technology on Fuel Efficiency
Page | 9
Acronyms
Acronyms and Abbreviations
2-d two-dimensional 6SPD 6-speed transmission 8SPD 8-speed transmission APRF Advanced Powertrain Research Facility AU Automatic transmission CAFE Corporate Average Fuel Economy CVT continuously variable transmission DCT dual clutch transmission DOT U.S. Department of Transportation EPA U.S. Environmental Protection Agency EVS International Electric Vehicle Symposium FTP Federal Test Procedure HETRANS high-efficiency 8-speed automatic HEV hybrid electric vehicle HFET Highway Fuel Economy Test HIL hardware-in-the-loop I/O input/output IATC aggressive torque converter lockup INC incremental MY model year NAUTO 5- to 6-speed automatic NHTSA Highway Traffic Safety Administration PHEV plug-in hybrid electric vehicle PSAT Powertrain System Analysis Toolkit RCP rapid-control prototyping SAE Society of Automotive Engineers SHIFTOP shifting optimizer algorithm SIDI spark-ignition direct-injection SIL software-in-the-loop SUV sport utility vehicle

ANL/ESD/12-6 – Impact of Transmission Technology on Fuel Efficiency
Page | 10
Volpe model CAFE Compliance and Effects Modeling System VPA vehicle powertrain architecture XML extendible markup language
Units of Measure
gal gallon(s) kg kilogram(s) kW kilowatt(s) L liter(s) m2 square meter(s) mm millimeter(s) mpg mile(s) per gallon mph mile(s) per hour N m Newton meter(s) rpm rotation(s) per minutes sec second(s)

ANL/ESD/12-6 – Impact of Transmission Technology on Fuel Efficiency
Page | 11
Acknowledgments
We would like to express special thanks to Argonne System Modeling and Control Group and
especially Dominik Karbowski for his contributions to this report.
Thanks are also extended to those who have patiently reviewed the report, including Ann
Schlenker, Ryan Harrington, John Whitefoot, Lixin Zhao and Rebecca Yoon.

ANL/ESD/12-6 – Impact of Transmission Technology on Fuel Efficiency
Page | 12
1. Introduction
The U.S. Department of Transportation (DOT’s) National Highway Traffic Safety Administration
(DOT/NHTSA), in coordination with the U.S. Environmental Protection Agency (EPA), recently issued a
final rulemaking to establish Corporate Average Fuel Economy (CAFE) standards for model year (MY)
2012–2016 passenger cars and light trucks. The standards were established pursuant to the
amendments made by the Energy Independence and Security Act of 2007 to the Energy Policy and
Conservation Act.
In developing the standards, DOT/NHTSA made use of the CAFE Compliance and Effects Modeling
System (the "Volpe model"), which was developed by DOT’s Volpe National Transportation Systems
Center. The Volpe model uses numerous engineering and economic inputs in its analysis of potential
CAFE standards. Some of the most significant engineering inputs are the incremental fuel-savings
estimates and synergy factors associated with new technology applications, which have come under
increased scrutiny over the past several rulemakings. The automotive industry, other government
agencies, and non-governmental organizations have been comparing the effectiveness estimates,
synergy factors, and CAFE model outputs with estimates and results obtained from physics-based full
vehicle simulation tools (software programs). In addition, in a report [1] to DOT/NHTSA, the National
Academies of Sciences recommended that DOT/NHTSA use full vehicle simulations tools to develop
effectiveness estimates and synergy factors for rulemaking analyses. DOT/NHTSA, in coordination with
EPA, has recently issued a Notice of Proposed Rulemaking (NPRM) for CAFE standards to cover MYs
2017 and beyond and is currently working on the final rule. The analysis requires numerous updates to
the Volpe model and to a number of the inputs listed above.
Manufacturers have been considering various technology options for improving vehicle fuel economy;
DOT/NHTSA has typically categorized these technology options into several groups, including engine
technologies, transmission technologies, hybrid and electrification technologies, and what the agency
calls “vehicle” technologies (e.g., weight reduction, aerodynamic drag improvement). To provide more
fuel-efficient vehicles to customers, manufacturers have introduced a number of transmission
improvements over the past couple of years, including incorporating a higher number of gears and new
technologies such as the dual clutch transmission (DCT).

ANL/ESD/12-6 – Impact of Transmission Technology on Fuel Efficiency
Page | 13
Since the MY 2005-2007 CAFE rulemaking, DOT/NHTSA has relied on the Volpe model to evaluate
potential CAFE standards. In fact, the model is the primary tool used by the agency to evaluate potential
CAFE stringency levels by applying technologies incrementally until the desired stringency is met. The
Volpe model relies on numerous technology-related and economic inputs such as a market forecasts,
technology cost, and effectiveness estimates; these inputs are categorized by vehicle classification,
technology synergies, phase-in rates, cost learning curve adjustments, and technology “decision trees”.
Vehicle simulation results are used by the Volpe Center to update the model’s technology effectiveness
estimates found in the model’s decision trees. The decision trees are designed and configured to allow
the Volpe model to apply technologies in a cost-effective, logical order that also considers ease of
implementation. In recent rulemakings the decision trees have been expanded so that DOT/NHTSA is
better able to track the incremental and net/cumulative cost and effectiveness associated with each
technology, which substantially improves the “accounting” of costs and effectiveness for CAFE
rulemakings. A detailed description of the Volpe model can be found in NHTSA’s upcoming Final
Regulatory Impact Analysis for the MYs 2017 and beyond CAFE standards, which will be available with
the model itself and its inputs at http://www.nhtsa.gov/fuel-economy [2].
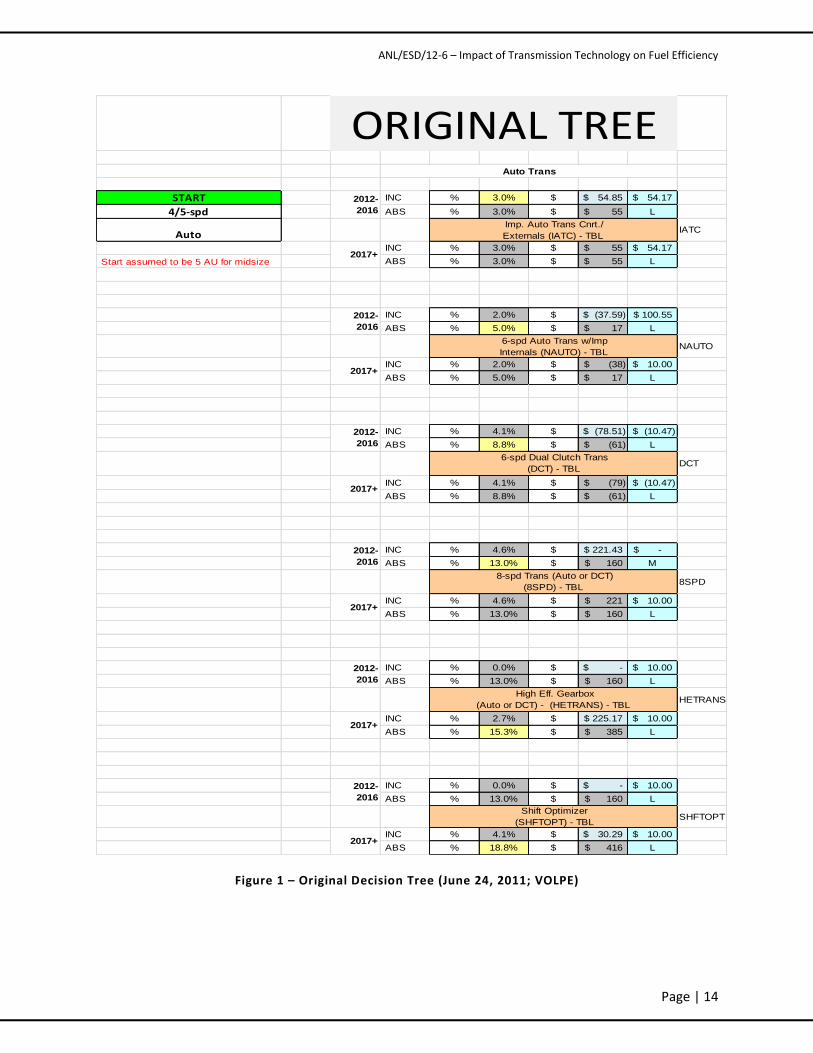
Figure 1 shows an original transmission decision tree provided by DOT/NHTSA. This original tree, for a
midsize conventional vehicle, was used in the NPRM analysis. Starting from a 5-speed-automatic-
transmission as the baseline, step-by-step improvements are made incrementally. For each technology
step, the incremental effectiveness estimate represents the actual fuel consumption improvement of
moving from one step from the previous step, whereas the absolute value signifies the overall fuel
consumption improvement starting from the reference baseline transmission/vehicle. The original
incremental improvement values used in the Volpe model’s decision tree for the transmission
technologies estimated a maximum absolute fuel consumption reduction of 18.8% once the final
technology (Shift Optimizer) was reached. These values were based upon simulation results generated
by Ricardo and then incorporated into EPA’s lumped parameter model (LPM). A detailed description of
the Ricardo simulation work and how it was incorporated into the LPM can be found in the Draft
Technical Support Document found at http://www.nhtsa.gov/fuel-economy [2].
ANL/ESD/12-6 – Impact of Transmission Technology on Fuel Efficiency
Page | 14
Figure 1 – Original Decision Tree (June 24, 2011; VOLPE)
START INC % 3.0% $ 54.85$ 54.17$
4/5-spd ABS % 3.0% $ 55$ L
AutoIATC
INC % 3.0% $ 55$ 54.17$
Start assumed to be 5 AU for midsize ABS % 3.0% $ 55$ L
INC % 2.0% $ (37.59)$ 100.55$
ABS % 5.0% $ 17$ L
NAUTO
INC % 2.0% $ (38)$ 10.00$
ABS % 5.0% $ 17$ L
INC % 4.1% $ (78.51)$ (10.47)$
ABS % 8.8% $ (61)$ L
DCT
INC % 4.1% $ (79)$ (10.47)$
ABS % 8.8% $ (61)$ L
INC % 4.6% $ 221.43$ -$
ABS % 13.0% $ 160$ M
8SPD
INC % 4.6% $ 221$ 10.00$
ABS % 13.0% $ 160$ L
INC % 0.0% $ -$ 10.00$
ABS % 13.0% $ 160$ L
HETRANS
INC % 2.7% $ 225.17$ 10.00$
ABS % 15.3% $ 385$ L
INC % 0.0% $ -$ 10.00$
ABS % 13.0% $ 160$ L
SHFTOPT
INC % 4.1% $ 30.29$ 10.00$
ABS % 18.8% $ 416$ L
ORIGINAL TREE
2012-
2016
6-spd Auto Trans w/Imp
Internals (NAUTO) - TBL
Auto Trans
2012-
2016
Imp. Auto Trans Cnrt./
Externals (IATC) - TBL
2017+
Shift Optimizer
(SHFTOPT) - TBL
2017+
2017+
2012-
2016
2012-
2016
8-spd Trans (Auto or DCT)
(8SPD) - TBL
2017+
2012-
2016
2017+
2017+
2012-
2016
6-spd Dual Clutch Trans
(DCT) - TBL
High Eff. Gearbox
(Auto or DCT) - (HETRANS) - TBL

ANL/ESD/12-6 – Impact of Transmission Technology on Fuel Efficiency
Page | 15
The objectives of this study were to:
Update the current decision tree structure to reflect the latest transmission technologies; and
Quantify the impact of each technology option as both an incremental improvement from the
previous technology and absolute improvement over the baseline.
Argonne used its vehicle simulation tool, Autonomie, to provide DOT/NHTSA with fuel-efficiency
improvement results for different technologies within the decision trees. The following technologies
were evaluated:
Automatic transmissions (up to 8 speeds),
DCTs (up to 8 speeds),
High-efficiency transmissions, and
Early torque converter lockup.
This report and the analysis herein was peer-reviewed by independent experts in the field. The
comments from the peer reviewers were used to modify and improve the analysis and this report. These
peer-reviewer comments and the responses to them are summarized in Appendix 1.

ANL/ESD/12-6 – Impact of Transmission Technology on Fuel Efficiency
Page | 16
2. Autonomie
2.1. Overview
Autonomie [3, 4] is a MATLAB©-based software environment and framework for automotive control-
system design, simulation, and analysis. The tool, sponsored by the U.S Department of Energy Vehicle
Technologies Program, is designed for rapid and easy integration of models with varying levels of detail
(low to high fidelity), abstraction (from subsystems to systems to entire architectures), and processes
(e.g., calibration, validation). Developed by Argonne in collaboration with General Motors, Autonomie
was designed to serve as a single tool that can be used to meet the requirements of automotive
engineers throughout the development process — from modeling to control. Autonomie was built to
accomplish the following:
Support proper methods, from model-in-the-loop, software-in-the-loop (SIL), and hardware-in-
the-loop (HIL) to rapid-control prototyping (RCP);
Integrate math-based engineering activities through all stages of development — from
feasibility studies to production release;
Promote re-use and exchange of models industry-wide through its modeling architecture and
framework;
Support users’ customization of the entire software package, including system architecture,
processes, and post-processing;
Mix and match models with different levels of abstraction to facilitate execution efficiency with
higher-fidelity models, for which analysis and high-detail understanding are critical;
Link with commercial off-the-shelf software applications, including GT-Power©, AMESim©, and
CarSim©, for detailed, physically based models;
Provide configuration and database management; and
Protect proprietary models and processes.
By building models automatically, Autonomie allows the simulation of a very large number of
component technologies and powertrain configurations. Autonomie offers the following capabilities:
Simulate subsystems, systems, or entire vehicles;
Predict and analyze fuel efficiency and performance;

ANL/ESD/12-6 – Impact of Transmission Technology on Fuel Efficiency
Page | 17
Perform analyses and tests for virtual calibration, verification, and validation of hardware
models and algorithms;
Support system hardware and software requirements;
Link to optimization algorithms; and
Supply libraries of models for propulsion architectures of conventional powertrains, as well as
electric-drive vehicles.
Autonomie is used in this study to assess the fuel consumption of advanced powertrain technologies.
Autonomie has been validated for several powertrain configurations and vehicle classes using vehicle
test data from Argonne’s Advanced Powertrain Research Facility (APRF) [5, 6, 7, 8].
With more than 400 different pre-defined powertrain configurations, Autonomie is an ideal tool to
analyze the advantages and drawbacks of the different options within each vehicle category, including
conventional, parallel, series, and power-split hybrid vehicles.
Autonomie allows users to evaluate the impact of component sizing on fuel consumption for different
powertrain technologies [9, 10], as well as to define the component requirements (e.g., power, energy)
to maximize fuel displacement for a specific application [11, 12]. This is important for the current study
because the use of validated plant models, vehicle controls, and complete vehicle models is critical to
properly evaluating the benefit of any specific technology. The vehicle-level control algorithms (e.g.,
engine ON/OFF logic, component operating conditions algorithm) are critical to properly evaluating any
powertrain configuration or component-sizing impact, especially for electric drives. Argonne has
extensive experience in developing shifting algorithms for conventional vehicles based on the different
component characteristics (e.g., engine fuel rate, gear ratios).
The ability to simulate a large number of powertrain configurations, component technologies, and
vehicle-level controls over numerous drive cycles has been used to support a large number of studies,
focusing on fuel efficiency [13, 14, 15, 16], cost-benefit analysis, or greenhouse gases [17, 18].
More than 150 companies and research entities, including major automotive companies and suppliers,
are also using Autonomie to support advanced vehicle development programs.

ANL/ESD/12-6 – Impact of Transmission Technology on Fuel Efficiency
Page | 18
2.2. Structure
Autonomie was designed for full plug-and-play support. Models in the standard format create building
blocks, which are assembled at run time into a simulation model of a vehicle, system, or subsystem. All
parts of the user interface are designed to be flexible to support architectures, systems, subsystems, and
processes not yet envisioned. The software can be molded to individual uses, so it can grow as
requirements increase and technical knowledge expands. This flexibility also allows for implementation
of legacy models, including plant and controls.
Autonomie is based on standardized modeling architecture, on-demand model building, associated
extendible markup language (XML) definition files, and user interfaces for managing models, including a
file-versioning database (Figure 2).
Figure 2 – Simulation Management Concepts
All systems in the vehicle architecture can be logically categorized as either a “containing system” or a
“terminating system” (Figure 3). Containing systems consist of one or more subsystems, as well as
optional files to define that system. They do not contain models; they only describe the structure of the
interconnections among systems and subsystems. Terminating systems consist of a model that defines
the behavior of the system and any files needed to provide inputs or calculate outputs. Terminating
system models contain the equations that describe the mathematical functions of a system or
subsystem.

ANL/ESD/12-6 – Impact of Transmission Technology on Fuel Efficiency
Page | 19
Both types of systems are arranged in a hierarchical fashion to define the vehicle to be simulated. To
avoid confusion, it is a best practice to mimic the structure of the hardware as much as possible. For
example, low-level component controllers should be grouped with the components that they control, at
different levels of the hierarchy (where applicable). Only systems that actually appear in the vehicle
should be represented; in other words, there is no need for unused components or empty controllers. In
addition to simplifying the architecture, this philosophy will allow for easy transfer of systems among
users and will fully support HIL, SIL, and RCP.
Figure 3 – Class Diagram of Container and Terminating Systems
At the top level is a vehicle system containing the following systems: environment; driver; vehicle
propulsion controller for advanced powertrain vehicles such as hybrid electric vehicles (HEVs) or plug-in
hybrid electric vehicles (PHEVs), which require a vehicle level controller; and vehicle propulsion
architecture (VPA) (Figure 4). The VPA system will contain the powertrain components that are required
to simulate the vehicle, such as engine, battery, and wheels.

ANL/ESD/12-6 – Impact of Transmission Technology on Fuel Efficiency
Page | 20
Figure 4 – Top-Level Vehicle Layout
The model files created for the terminating systems need to be combined in a way that allows
simulation in Simulink. One option is to create every possible combination of the systems and save each
complete vehicle as a separate model file. Because of the staggering number of possible combinations,
this option is not feasible. Combinations involve not only many different components, but also different
levels of fidelity and model versions for each component. Changing the version of a single component
model would result in a new version of the entire vehicle. This method is clearly storage intensive and
impractical.
A second option is to save every model in its own file and manage a library of the models. This would be
an improvement over the first option; however, it still presents some difficulties. When users wish to
create a new vehicle, they must select all of the appropriate models from the library and connect them
by hand into a vehicle context. Not only is this manual process time consuming, but it introduces many
opportunities for error. Consider an engine control unit model for auto code generation that can have
more than 2,000 inputs and outputs (I/Os). Manually connecting all I/Os almost guarantees errors. It

ANL/ESD/12-6 – Impact of Transmission Technology on Fuel Efficiency
Page | 21
also requires some outside solution for model library management (e.g., searching, versioning, and
ensuring compatibility).
Autonomie uses a novel approach that combines the second option with an automated building process,
giving the user the flexibility of saving and versioning models independently without the potential
pitfalls of manual connections. Users select the correct files in a user interface, and the automatic
building uses metadata associated with the models to create the correct connections, as shown in Figure
5.
Figure 5 – Models are Automatically Built

ANL/ESD/12-6 – Impact of Transmission Technology on Fuel Efficiency
Page | 22
3. Study Assumptions
The transmission decision tree, as described in section 1, is linear. However in reality, there are
technically two paths. The first path is for vehicle classes where the assumed transmission of choice is
the dual clutch transmission (DCT). The second path is for vehicle classes where the assumed
transmission of choice is an automatic transmission because of launch and/or towing requirements that
could benefit from the torque converter’s torque multiplication. For this second path, the DCT step is
disabled and the transmission progresses from a 6-spd automatic to an 8-spd automatic. In essence,
there are two paths in one and the path taken is determined by the class of vehicle being evaluated. For
purposes of this study and to make it easier to follow progressions down the decision tree, the two
paths are shown explicitly as shown in Figure 6.

ANL/ESD/12-6 – Impact of Transmission Technology on Fuel Efficiency
Page | 23
Imp. Auto Trans Cnrt./
Externals (IATC) - TBL
6-spd Auto Trans w/Imp
Internals (NAUTO) - TBL
8-spd Trans (Auto)(8SPD) - TBL
6-spd Dual Clutch Trans
(DCT) - TBL
8-spd Trans (DCT)(8SPD) - TBL
High Eff. Gearbox (+4%)(DCT)
Reference 5spd
High Eff. Gearbox (+4%)
(Auto) - (HETRANS) - TBL
DCTAutomatic
Figure 6 – Modified Decision Tree
The reference vehicle used is a midsize conventional vehicle with a 5-speed automatic transmission and
current (non-aggressive) lockup strategy. All of the following transmission steps have an early lockup
strategy, meaning the torque converter will be locked once it is in second gear.
The transmission decision tree steps are as follow:
Step 1: Using aggressive torque converter lockup strategy for 5 speed transmission
Step 2: Going from 5-speed improved transmission with early lockup, with 92% constant efficiency, to 6-
speed transmission with 92% constant efficiency.
Step 2
Step 3
Step 4
Step 5 Step 4
Step 3
Step 1

ANL/ESD/12-6 – Impact of Transmission Technology on Fuel Efficiency
Page | 24
Step 3: Going from 6-speed automatic transmission with 92% constant efficiency to either:
6-speed DCT with 92% constant efficiency; or
8-speed (8SPD) automatic transmission with 92% constant efficiency.
Step 4:
Going from 6-speed DCT with 92% constant efficiency to 8-speed DCT with 92% constant
efficiency.
Going from 8-speed (8SPD) automatic transmission with 92% constant efficiency to 8-speed
automatic transmission with 96% constant efficiency (HETRANS).
Step 5: Going from 8-speed automatic transmission with 92% constant efficiency to 8-speed DCT with
96% constant efficiency.
It should be noted that the shift optimizer (SHFTOPT) technology, the last step in the original decision
tree, was not included in this study. In an attempt to replicate the shift optimizer technology, we
removed all drivability constraints from the shifting control algorithm (i.e., number of shifting events,
torque reserve…). However, even when the algorithm allowed for more frequent shifts, we could find
any significant fuel consumption reductions for a shift optimizer type technology once all the other
preceding technologies had been added. For this reason, the shift optimizer technology was not
included in this study.
Constant efficiency values were used in the study to facilitate comparison among transmission
technologies. The reference value was selected to match the average efficiency of the current gearbox,
which was derived from proprietary information.

ANL/ESD/12-6 – Impact of Transmission Technology on Fuel Efficiency
Page | 25
4. Baseline Assumptions
4.1. Reference Vehicle
The reference vehicle selected is a conventional midsize vehicle, characterized in Table 1
Table 1 – Main Vehicle Specifications
Component Value
Engine power (kW) 115
Transmission ratios [2.56 1.55 1.02 0.72 0.52]
Final drive ratio 4.7
Test weight (kg) 1,580
Drag coefficient 0.3
Frontal area (m²) 2.25
Rolling-resistance coefficient 1 0.008
Rolling-resistance coefficient 2 (speed term) 0.00012
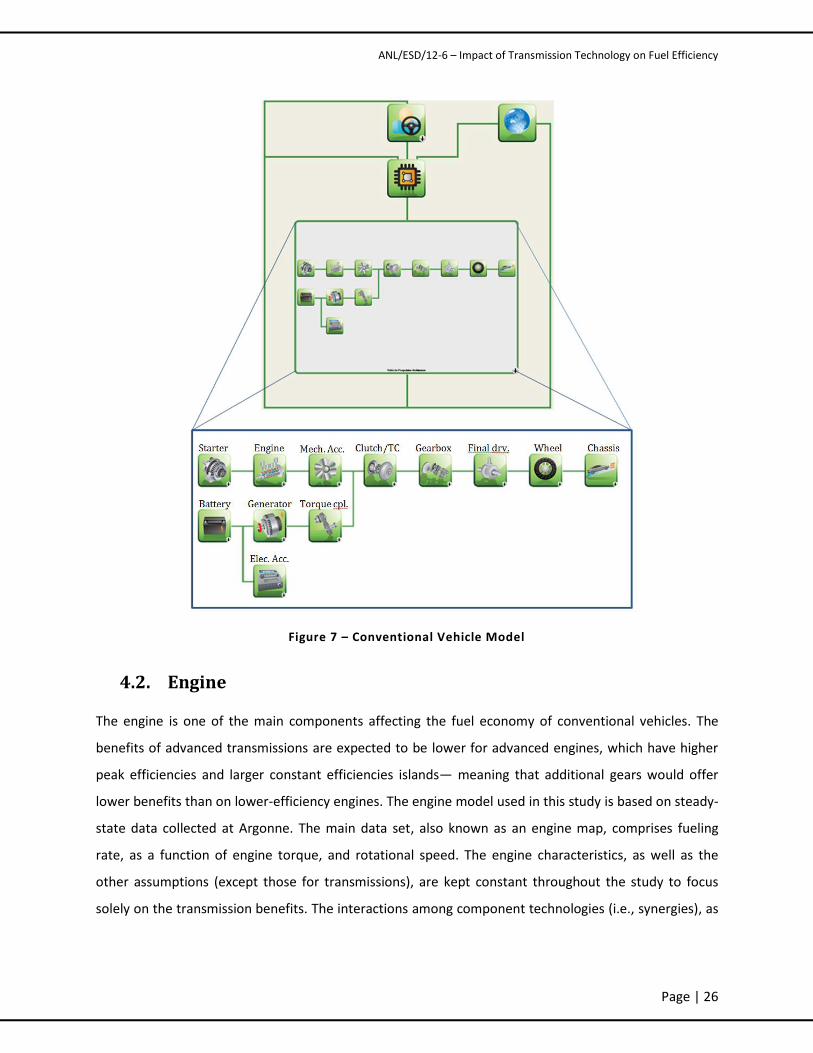
Figure 7 shows a schematic of the different component models of the conventional vehicle in
Autonomie.
ANL/ESD/12-6 – Impact of Transmission Technology on Fuel Efficiency
Page | 26
Figure 7 – Conventional Vehicle Model
4.2. Engine
The engine is one of the main components affecting the fuel economy of conventional vehicles. The
benefits of advanced transmissions are expected to be lower for advanced engines, which have higher
peak efficiencies and larger constant efficiencies islands— meaning that additional gears would offer
lower benefits than on lower-efficiency engines. The engine model used in this study is based on steady-
state data collected at Argonne. The main data set, also known as an engine map, comprises fueling
rate, as a function of engine torque, and rotational speed. The engine characteristics, as well as the
other assumptions (except those for transmissions), are kept constant throughout the study to focus
solely on the transmission benefits. The interactions among component technologies (i.e., synergies), as

ANL/ESD/12-6 – Impact of Transmission Technology on Fuel Efficiency
Page | 27
well as the impact of the reference technologies (i.e., engine technologies), will be addressed at a later
date.
The engine selected is a dual-overhead-camshaft, four-cylinder engine equipped with direct fuel
injection and exhaust gas recirculation; Table 2 lists the major specifications.
Table 2 – Main Engine Specifications
Engine Type 2.2-L Ecotec Direct
Cylinders 4
Displacement (L) 2.198
Bore (mm) 86
Stroke (mm) 94.6
Connecting rod length (mm) 145.5
Compression ratio 12:1
Maximum power (kW) 114 at 5,600 rpm
Maximum torque (N m) 220 at 3,800 rpm
The engine map (Figure 8) used to generate the results is based on experimental data collected at
Argonne Advanced Powertrain Research Facility.

ANL/ESD/12-6 – Impact of Transmission Technology on Fuel Efficiency
Page | 28
Figure 8 – Spark-Ignition Direct-Injection (SIDI) 2.2-L Engine Map (Argonne Test Data)
4.3. Transmission
On the basis of the reference 5-speed automatic transmission, the following technology options were
selected:
DCT technology,
Increased gear number (6 and 8 gears), and
Lower transmission losses (4% efficiency percentage point increase).
As a result, six transmissions were selected, in addition to the reference transmission:
1. 6-speed automatic transmission, base efficiency of 92% for the gearbox;
2. 8-speed automatic transmission, base efficiency;
3. 8-speed automatic transmission, improved efficiency;
4. 6-speed DCT, base efficiency;
5. 8-speed DCT, base efficiency; and
6. 8-speed DCT, improved efficiency.
0 100 200 300 400 500 6000
50
100
150
200
250
3.77417e-006 3.77417e-0062.52 2.525.03 5.037.55 7.5510 10 1013 13 1315 15 1518 18 1820 20 2023 23 2325 25 25
28 28 28
3030 30
33
33 33
35
35
35
35
Engine Hot Efficiency Map (Torque) - Points - Overall
Speed (rad/s)
To
rqu
e (
N.m
)
Max Trq
Eff. Map

ANL/ESD/12-6 – Impact of Transmission Technology on Fuel Efficiency
Page | 29
An efficiency for the gearbox (i.e., not including the torque converter) of 92% was selected for the study.
This value was selected after running simulations using several proprietary detailed transmission data
(i.e., losses as a function of rotational speed and torque for each gear) to provide transparent results. As
for all the other models, the study assumed that all components are fully warmed-up. As a result, the
potential difference in warm-up between all the different transmission technologies is not considered.
For each technology, numerous transmission ratios could be selected. For this study, we did not
consider optimizing the gear ratios for each case. Rather, the gear span (ratio between minimum and
maximum gear) was increased for transmissions with a higher number of gears. For consistency within
the study, both the automatic transmission and DCT have the same gear ratios. The gear ratios were
selected based on transmissions currently in the market. Table 3 lists the gear ratio for each technology.
Table 3 – Transmission Ratios
1 2 3 4 5 6 7 8
Reference 5-speed automatic 2.56 1.55 1.02 0.72 0.52
6-speed transmissions 4.15 2.37 1.56 1.16 0.86 0.52
8-speed transmissions 4.6 2.72 1.86 1.46 1.23 1 0.82 0.52
Figure 9 shows the average gear span and total top gear ratios (final drive ratio included) of selected 5,
6, and 8 speed transmissions currently on the market. One notices that the gear span increases with the
higher number of gears in a transmission while the top gear ratio decreases with higher transmission
gear number. The transmissions were selected from similar vehicles (class, engine power, etc…) using
same technology but different gear number; for example the V6 charger 2011 has a 5 speed
transmission whereas the V6 charger 2012 has an 8 speed transmission.

ANL/ESD/12-6 – Impact of Transmission Technology on Fuel Efficiency
Page | 30
Figure 9 – Average gear span and top gear ratios from a couple of transmissions on the market
current market
The values selected for this study are shown in Figure 10. The same trend is followed with gear span
increasing and the top gear ratio decreasing with the number of gears. The values for the total top gear
ratios are similar between the average from the current market and the study. Maintaining the same
top gear across all transmissions would significantly limit the benefits of the technologies and does not
represent the current market trends. The gear span is however slightly higher in the study to be able to
maintain the same vehicle performance with the same engine regardless of the transmission selected.
Figure 10 - Average gear span and top gear ratios from Argonne selection representing the potential
future market

ANL/ESD/12-6 – Impact of Transmission Technology on Fuel Efficiency
Page | 31
In order to properly compare the different transmission technologies and control options, the vehicles
need to have the same vehicle performance specifications (i.e., 0–60 mph in 9.5 sec). Because the focus
of this study is the transmissions, all the other components have been maintained constant (i.e., same
engine power). As a result, we decided that the final drive ratios would be modified to maintain the
same vehicle performances.
Table 4 shows the final drive ratios and the vehicle performance values. A constant value of 97.5% is
used to represent the final drive ratio efficiency.
Table 4 – Final Drive Ratios and Vehicle Performance
5-speed 6-speed 8-speed
Final drive ratio (auto/DCT) 4.7/- 3.8/3.69 3.3/3.3
0–60 mph performance 9.5 sec 9.5 sec 9.5 sec
4.4. Accessory Loads
Electrical and mechanical accessory base loads were assumed constant over the drive cycles, with a
value of 200 W. The value, based on measured data from Argonne’s APRF, is used to represent the
average accessory load consumed during standard urban (Federal Test Procedure [FTP]) and highway
(Highway Fuel Economy Test [HFET]) drive cycle testing on a dynamometer.
4.5. Control Algorithm
4.5.1. Shifting Control Algorithms
The transmission shifting logic has a significant impact on vehicle fuel economy and should be carefully
designed to maximize the powertrain efficiency while maintaining acceptable drive quality. The logic
used in the simulated conventional light-duty vehicle models relies on two components:
The shifting controller, which provides the logic to select the appropriate gear during the
simulation; and
The shifting initializer, the algorithm that defines the shifting maps (i.e., values of the
parameters of the shifting controller) specific to a selected set of component assumptions.

ANL/ESD/12-6 – Impact of Transmission Technology on Fuel Efficiency
Page | 32
4.5.1.1. Shifting Controller
The shifting controller determines the appropriate gear command at each simulation step. A simplified
schematic of the controller is shown in Figure 11. The letters and numbers in the discussion that follows
correspond to those shown in the figure.
Figure 11 – Shifting Controller Schematic
The controller is based on two main shifting maps — one for upshifting (a), moving from a lower gear to
a higher gear, and another one for downshifting (b), moving from a higher gear to a lower gear — as
well as a state-machine (c) that defines the status of the system (e.g., no shifting, upshifting). Each
shifting map outputs a next-gear command and based on the current accelerator pedal
position a(t) and vehicle speed V(t). The state machine is composed of different states, of which only
one is active at any time step; a change in state occurs whenever a transition condition from the active
state becomes true (i.e., an upshift will occur only if a set of conditions is true). The state that is active
most of the time is the hold-gear state (d), which makes sense because, most of the time, the vehicle
should be in gear and not shifting for drivability reasons. An upshift occurs when the upshifting gear
is strictly higher than the current gear (1) (e.g., . For all vehicles,
the shift does not necessarily happen instantly when the command to shift is given, depending on the
ANL/ESD/12-6 – Impact of Transmission Technology on Fuel Efficiency
Page | 33
current pedal position. In aggressive driving, i.e., at high accelerator-pedal positions (5), the shift
happens as soon as the gear transition (1) becomes true, ensuring optimal performance. In contrast, in
“normal” driving, i.e., at low pedal positions (2), there is an intermediate state (e) that allows the shift
only when the gear condition (1) is true for a minimum time τ. This constraint is imposed to avoid an
excessive number of shifting events, which would lead to unacceptable drive quality and increased fuel
consumption. The upshifting itself is executed in state (f), in which the shift command is
incremented (i.e., the next upper gear is selected); once the shifting is completed (6), the state machine
comes back to the hold-gear state (d). Downshifting occurs in a similar way.
Currently, in Autonomie, a shifting event can only result in moving one gear up or one gear down: there
is no gear-skipping. Gear skipping is usually used under very specific conditions that are not encountered
during the standard FPT and HFET drive cycles considered in the study. As an additional level of
robustness in the Autonomie control algorithm, an upshift or downshift cannot occur if the resulting
engine speed would be too low or too high, respectively. This approach ensures that the engine is not
operated below idle or above its maximum rotational speed.
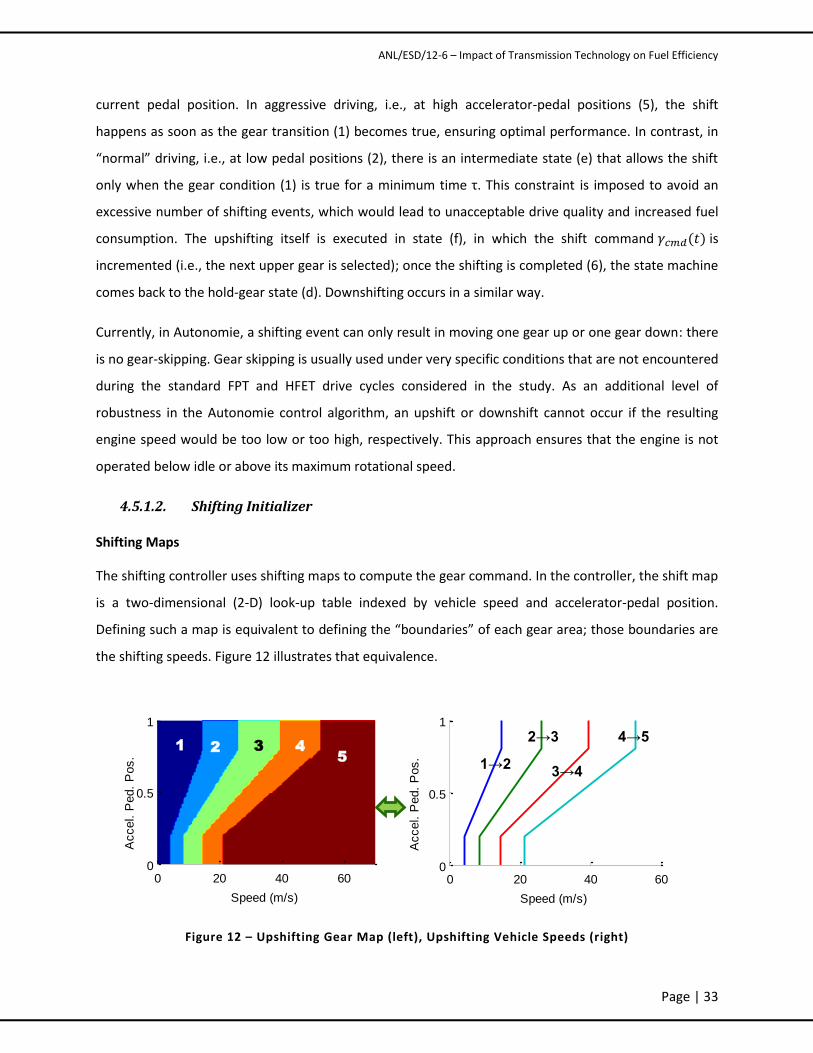
4.5.1.2. Shifting Initializer
Shifting Maps
The shifting controller uses shifting maps to compute the gear command. In the controller, the shift map
is a two-dimensional (2-D) look-up table indexed by vehicle speed and accelerator-pedal position.
Defining such a map is equivalent to defining the “boundaries” of each gear area; those boundaries are
the shifting speeds. Figure 12 illustrates that equivalence.
Figure 12 – Upshifting Gear Map (left), Upshifting Vehicle Speeds (right)
Speed (m/s)
Accel. P
ed.
Pos.
0 20 40 600
0.5
1
0 20 40 600
0.5
1
Speed (m/s)
Accel. P
ed.
Pos.
1 2 3 4 5
1→2
2→3
3→4
4→5

ANL/ESD/12-6 – Impact of Transmission Technology on Fuel Efficiency
Page | 34
For each shifting curve, there are two key points: the “economical” shifting speed (at very low pedal
position) and the “performance” shifting speed (at high pedal position). The objective of the control
engineer is to combine both goals of the shifting control to fulfill the driver expectations: minimization
of fuel consumption on the one hand and maximization of vehicle performance on the other.
Economical Shifting Speeds
The economical shifting speed for an upshift or a downshift is the speed at which the upshift/downshift
occurs when the accelerator pedal position is very lightly pressed. is the economical vehicle
speed for upshifting from gear k to gear k+1. is the downshifting speed for this same set of
gears. The vehicle speed shift points are computed from the engine shift points and
.
Figure 13 shows the engine speed shift points for an engine associated with a 5-speed transmission.
Figure 13 – Example of Engine Speed Range in Economical Driving, and Economical Shift
The initializing algorithm for the shifting controller computes the up- and downshifting speeds at zero
pedal position based on the four “extreme” shift points: upshifting from lowest gear ( ), upshifting
into highest gear ( ), downshifting into lowest gear (
), and downshifting from highest gear
( ). N is the number of gears. The speeds can be set by the user or left at their default values.
Below is a description of their default values in Autonomie:
= [ engine idle speed; : speed margin, ≈50–100 rpm]
[k1,k2: gear ratios for gears 1,2; : margin to avoid overlap, ≈ 0.05–
0.1]
500 1000 1500 2000 2500 3000 35000
1
2
3
4
5
6
engine speed [rpm]
Engine speed operating range (acc=0) for each gear
1st gear
2nd gear
3rd gear
4th gear
5th gear𝝎𝒆𝒄𝒐𝟏 𝟐
𝜔𝑒𝑐𝑜 3
𝜔𝑒𝑐𝑜3 4
𝝎𝒆𝒄𝒐𝟒 𝟓
𝝎𝒆𝒄𝒐𝟐 𝟏
𝜔𝑒𝑐𝑜3
𝜔𝑒𝑐𝑜4 3
𝝎𝒆𝒄𝒐𝟓 𝟒
Engine Speed (RPM)
Gear

ANL/ESD/12-6 – Impact of Transmission Technology on Fuel Efficiency
Page | 35
: Engine speed at which best efficiency can be achieved
[
Once those four speeds are computed, the remaining ones are computed by linear interpolation to
allow consistent shifting patterns that are acceptable to the drivers. For example, any upshifting speed is
given by Equation 1: (1)
In a shifting map, the vehicle upshifting speed from gear i to i+1 shall be strictly higher than the
downshifting speed from gear i+1 to i. Otherwise, the downshifting speed will always request gear i
while gear i+1 is engaged and vice-versa, resulting in oscillations between gears that would be
unacceptable to the driver. For this study, the algorithm in the initialization file prevents that by making
sure the following relation is true:
(2)
The values of the engine economical shifting speeds at lowest and highest gears are automatically
defined on the basis of the engine and transmission characteristics.
Finally, the vehicle economical up- and downshifting speeds can be computed using the engine up- and
downshifting speeds, the gear ratio, the final drive ratio and the wheel radius:
(3)
,
where kFD is the final drive ratio and is the wheel radius.

ANL/ESD/12-6 – Impact of Transmission Technology on Fuel Efficiency
Page | 36
Performance Shifting
During performance, the gears are automatically selected to maximize the torque at the wheel. Figure
14 illustrates that gear selection, which consists of finding the point where the engine peak torque
(reported at the wheels) curve at gear k falls under the one at gear k+1.
Figure 14 – Maximum Engine Torque at Wheels and Performance Upshift Speeds
The performance downshifting speed is given by the performance upshifting speed and the
difference between the economical shifting speeds (see Figure 9):
(4)
Final Shifting Curves
The definition of the final shifting curves is critical to properly evaluating the benefits of transmission
technologies while maintaining acceptable performance. Figure 15 shows how a set of upshifting and
downshifting curves for two adjacent gears is built, based on selected vehicle speeds and accelerator
pedal positions. At low pedal positions (i.e., below
), the upshifting speed is the economical
upshifting speed. Similarly, below , the downshifting speed is the economical downshifting speed.
This approach ensures optimal engine operating conditions under gentle driving conditions. At high
0 20 40 60 800
500
1000
1500
2000
2500
3000
3500
Speed (m/s)
Torq
ue @
Whl (N
m)
Gear 1
Gear 2
Gear 3
Gear 4
Gear 5
𝑽𝒑𝒆𝒓𝒇𝟏 𝟐 𝑽𝒑𝒆𝒓𝒇
𝟐 𝟑 𝑽𝒑𝒆𝒓𝒇𝟑 𝟒 𝑽𝒑𝒆𝒓𝒇
𝟒 𝟓

ANL/ESD/12-6 – Impact of Transmission Technology on Fuel Efficiency
Page | 37
pedal positions (i.e., above ), the shifting speed is the performance shifting speed, ensuring
maximum torque at the wheels under aggressive driving conditions.
Figure 15 – Design of Upshifting and Downshifting Speed Curves for Two Adjacent Gears
Figure 16 shows an example of a complete set of shifting curves for a light-duty vehicle. Two curves of
the same color (i.e., upshifting and downshifting curves) never intersect, thus ensuring that there are no
shift oscillations, which is important for drivability.
Figure 16 – Shifting Speed Curves for a Default Light -Duty Vehicle in Autonomie
0 10 20 30 40 50 600
0.2
0.4
0.6
0.8
1
Speed (m/s)
Accel. P
edal
Upshift 12
Downshift 21
Upshift 23
Downshift 32
Upshift 34
Downshift 43
Upshift 45
Downshift 54
𝑎𝑝𝑒𝑟𝑓
𝑎𝑒𝑐𝑜𝑑𝑛
𝑎𝑒𝑐𝑜𝑢𝑝
𝑉𝑒𝑐𝑜𝑑𝑛 𝑉𝑒𝑐𝑜
𝑢𝑝 𝑉𝑝𝑒𝑟𝑓𝑢𝑝 𝑉𝑝𝑒𝑟𝑓
𝑑𝑛
Δ𝑉𝑒𝑐𝑜
Δ𝑉𝑝𝑒𝑟𝑓𝑜
Upshifting
Downshifting

ANL/ESD/12-6 – Impact of Transmission Technology on Fuel Efficiency
Page | 38
4.5.1.3. Torque Control during Shifting Events
Figure 17 shows the transmission clutch pressure, output torque, and engine speed curves during a
change from 1st to 2nd gear. The output torque experienced both a trough period (lower than the
torque in the original gear) and a crest period (higher than the torque in the original gear). The trough
period is called a torque hole, while the crest period is called a torque overshoot. The torque hole is
defined by depth and width, where the depth is the difference between minimum torque and the
torque in previous gear, and the width is the half value of the maximum width of the torque hole.
Figure 17 – Generic Shift Process for Automatic Transmission [17]
The bigger the torque hole, the larger the decrease of torque in torque phase, which results in a more
significant reduction in acceleration. Because the decrease in acceleration causes discomfort for both
the driver and passengers, the torque hole should be as shallow and narrow as possible. Torque
reduction behavior is a well-known phenomenon, observed during vehicle testing and referenced in
several papers and presentations [20].
Autonomie integrates a low-level control algorithm that reproduces the torque hole phenomenon.
Figure 18 illustrates, in detail, the behavior of the vehicle model for a short period of time [205 sec to
205.8 sec]. The area highlighted by the grey circle indicated the torque hole during a shifting event.

ANL/ESD/12-6 – Impact of Transmission Technology on Fuel Efficiency
Page | 39
Figure 18 – Torque Hole in Autonomie during Shifting Event
4.5.1.4. Shifting Maps
All shifting maps used for the simulations are presented below. The shifting maps have been developed
to ensure minimum fuel consumption across all transmissions while maintaining an acceptable
driveability. While plant models with higher degree of fidelity would be necessary to accurately model
the impact of each technology on the driveability, using such models was not appropriate for the current
study. As a result, the work related to the drive quality was focused on number of shifting events, time
in between shifting events, engine time response and engine torque reserve.
204.2 204.4 204.6 204.8 205 205.2 205.4 205.6 205.8
2000
3000
4000
5000
6000
7000
8000
9000
10000
seconds
vehicle speed*100 mph
gear*1000
engine torque*100 N.m
engine speed rpm

ANL/ESD/12-6 – Impact of Transmission Technology on Fuel Efficiency
Page | 40
Figure 19 - 5-speed automatic up (plain lines) and down (dotted lines) shifting map
Figure 20 - 6-speed automatic up (plain lines) and down (dotted lines) shifting map
100100
100
200200
200
300
300
300
300
400
400
400
400
500
500
500
500
Upshift and downshift Table
Normalized Accel Demand (%)
Ve
hic
le S
pe
ed
(m
ile/h
)
100 100
100
100
200 200
200
200
300 300
300
300
400 400
400
400
500 500
500
500
0 20 40 60 80 1000
50
100
150UpSft Gear Map
DnSft Gear Map
100.0001
100.0001100.0001
200200
200
300
300
300300
400
400
400
400
500
500
500
500
600
600
600
600
Upshift and downshift Table
Normalized Accel Demand (%)
Ve
hic
le S
pe
ed
(m
ile/h
)
100.0001 100.0001
100.0001
200 200200
300 300
300
300
400 400
400
400
500 500
500
500
600 600
60
0
600
0 20 40 60 80 1000
50
100
150UpSft Gear Map
DnSft Gear Map

ANL/ESD/12-6 – Impact of Transmission Technology on Fuel Efficiency
Page | 41
Figure 21 - 8-speed automatic up (plain lines) and down (dotted lines) shifting map
4.5.2. Torque Converter
A torque converter is a hydrodynamic fluid coupling used to transfer rotating power from a prime
mover, such as an internal combustion engine, to a rotating driven load. It is composed of an impeller
(drive element); a turbine (driven component); and a stator, which assist the torque converter function.
The torque converter is filled with oil and transmits the engine torque by means of the flowing force of
the oil. The device compensates for speed differences between the engine and the other drivetrain
components and is therefore ideally suited for start-up function.
The torque converter is modeled as two separate rigid bodies when the coupling is unlocked and as one
rigid body when the coupling is locked. The downstream portion of the torque converter unit is treated
as being rigidly connected to the drivetrain. Therefore, there is only one degree of dynamic freedom,
and the model has only one integrator. This integrator is reset when the coupling is locked, which
corresponds to the loss of the degree of dynamic freedom. Figure 22 shows the efficiency of the torque
converter used for the study.
The effective inertias are propagated downstream until the point where actual integration takes place.
When the coupling is unlocked, the engine inertia is propagated up to the coupling input, where it is
used for calculating the rate of change of the input speed of the coupling. When the coupling is locked,
the engine inertia is propagated all the way to the wheels.
100.0001
100.0001100.0001
200200
200
300
300
300
300
400
400
400
400
500
500
500
500
600
600
600
600
700
700
700
700
800
800
800
800
Upshift and downshift Table
Normalized Accel Demand (%)
Ve
hic
le S
pe
ed
(m
ile/h
)
100.0001 100.0001
100.0001
200 200 200
200
300 300
300
300
400 400
400
400
500 500
50
0
500
600 600
60
0
600
700 700
70
0
700
800 800
80
0
80
0
800
0 20 40 60 80 1000
50
100
150UpSft Gear Map
DnSft Gear Map

ANL/ESD/12-6 – Impact of Transmission Technology on Fuel Efficiency
Page | 42
The torque converter model is based on a lookup table, which determines the output torque depending
on the lockup command. The upstream acceleration during slip and the downstream acceleration are
taken into account in calculating the output speed.
Figure 22 – Torque Converter efficiency
Figure 23 describes the conditions under which the torque converter will be locked. The same algorithm
is used to represent current torque converter lockup logic, as well as future aggressive lockup logic. In
today’s vehicles, the torque converter locks at vehicle speeds between 30 and 40 mph under most
driving conditions. In the future, it is expected that it can be locked as soon as the second gear is
engaged. Different sets of parameters were developed in the algorithm to represent both current and
future lock-up conditions.
Figure 23 – Torque Converter Lockup Control Algorithm
0 0.2 0.4 0.6 0.8 10.5
1
1.5
2
2.5
3
Output/Input Speed Ratio
Ou
tpu
t/In
pu
t T
orq
ue
Ra
tio
0 0.2 0.4 0.6 0.8 10
0.2
0.4
0.6
0.8
1
Effic
ien
cy (
%)
Vehicle Speed
Pedal Position
Gear Number
Lockup Signal If the shifting is not in progress, the torque converter
is locked (1) at a specific gear number and (2) pedal
position for a given vehicle speed.

ANL/ESD/12-6 – Impact of Transmission Technology on Fuel Efficiency
Page | 43
4.6. Vehicle Simulation Conditions
All the vehicle simulations were performed under hot conditions (i.e., 20°C ambient temperature
with warm components). This approach was selected on the basis of the assumption that all the
transmission technologies would have similar warm-up characteristics. A two-cycle test procedure,
based on the standard urban (FTP) and highway (HFET) drive cycles was used. Combined values are
calculated on the basis of a 55% city and 45% highway cycle based on the standard test procedure.
Figure 24 and Figure 25 show both drive cycles used in the simulations.
Figure 24 – FTP Drive Cycle – Vehicle Speed (mph)
Figure 25 – HFET Drive Cycle – Vehicle Speed (mph)
0 200 400 600 800 1000 1200 14000
10
20
30
40
50
60
time (sec)
chas_plant_lin_spd_out_simu [mile/h] x 1
0 100 200 300 400 500 600 700 8000
10
20
30
40
50
60
time (sec)
chas_plant_lin_spd_out_simu [mile/h] x 1

ANL/ESD/12-6 – Impact of Transmission Technology on Fuel Efficiency
Page | 44
5. Simulation Results
In this section, we will first present the results of the vehicle simulations performed using Autonomie for
the reference vehicle, followed by a discussion of the impact of advanced automatic transmissions and
DCTs. On the basis of the vehicle fuel consumption results, the decision tree used as input to the Volpe
model will be presented, along with a brief discussion of the associated uncertainties based on
component assumptions and vehicle class selection.
5.1. Reference Vehicle
The following sections address the reference vehicle simulation results and present the operating
conditions for the primary components.
5.1.1. Engine Operating Conditions
Because the engine is the propulsion source of the vehicle, its operating conditions have a significant
impact on overall fuel consumption.

ANL/ESD/12-6 – Impact of Transmission Technology on Fuel Efficiency
Page | 45
FTP Drive Cycle
Figure 26 shows the engine operating points for the reference vehicle during the FTP cycle. The figure
shows that the engine mostly operates at low-load conditions (i.e., low torque, low speed), which is
equivalent to a low-engine-efficiency area. Despite having a peak efficiency of 36%, the engine only
achieves an average efficiency of 24% on the FTP drive cycle.
Figure 26 – Engine Operating Density Plot (FTP Cycle)
0.1
0.10.1
0.1
0.1
0.1
0.2
0.2
0.2
0.2
0.2
0.3
0.3
0.3
0.4
0.4
0.4
0.4
0.4
0.5
0.5
0.50.50.6
0.6
0.6
0.7
0.7
0.7
0.8
0.8
0.8
0.9
0.2
0.30.8
0.9
0
0.098765
0.19753
0.2963
0.39506
0.49383
0.59259
0.69136
0.79012
0.88889
0.98765
0 100 200 300 400 500 600 700-50
0
50
100
150
200
250
3.77417e-006 3.77417e-0062.52 2.525.03 5.037.55 7.5510 10 1013 13 1315 15 1518 18 1820 20 2023 23 2325 25 25
28 28 28
3030 30
3333 33
35
3535
35
Speed (rad/s)
To
rqu
e (
N.m
)
Max Trq
Eff. Map
Simulation

ANL/ESD/12-6 – Impact of Transmission Technology on Fuel Efficiency
Page | 46
HFET Drive Cycle
Figure 27 shows the engine operating points for the baseline vehicle during simulation on the HFET
cycle. The average efficiency of the engine ranges from 25 to 30%. The figures show that, as on the FTP
cycle, the engine mostly operates on the bottom left-hand side of the engine map, but the red/high-
density “island” is slightly shifted up, indicating a slight improvement in engine efficiency for the HFET
cycle compared with the FTP cycle.
Figure 27 – Engine Operating Density Plot (HFET Cycle)
0.1
0.1
0.1
0.1
0.1
0.1
0.1
0.2
0.2
0.2
0.2
0.2
0.20.3
0.3
0.3
0.3
0.3
0.3
0.4
0.4
0.4
0.4
0.4
0.5
0.5
0.5
0.5
0.5
0.5
0.6
0.60.6
0.6
0.70.7
0.70.8
0.8
0.9
0.1
0.6
0.6
0.2
0.7
0.2
0.7
0.3
0.8
0.1
0
0.10526
0.21053
0.31579
0.42105
0.52632
0.63158
0.73684
0.84211
0.94737
0 100 200 300 400 500 600 700-50
0
50
100
150
200
250
3.77417e-006 3.77417e-0062.52 2.525.03 5.037.55 7.5510 10 1013 13 1315 15 1518 18 1820 20 2023 23 2325 25 25
28 28 28
30 30 30
3333 33
35
35 35
35
Speed (rad/s)
To
rqu
e (
N.m
)
Max Trq
Eff. Map
Simulation

ANL/ESD/12-6 – Impact of Transmission Technology on Fuel Efficiency
Page | 47
5.1.2. Gear Shifting
Figure 28 shows the vehicle speed and the shifting gear number on an FTP cycle for the reference
vehicle. The top gear is reached only on the second hill of the cycle. Note that the shifting algorithm
used in Autonomie considers a limited number of shifting events to provide acceptable drive quality to
the drivers. The logic and the parameters were tuned based on vehicle test data collected at Argonne
National Laboratory APRF. An example of number of “acceptable” shifting events from measured data
are provided later in the report.
Figure 28 – Vehicle Speed and Shifting Logic (FTP Cycle)
0 200 400 600 800 1000 1200 14000
10
20
30
40
50
60
Time (sec)
chas_plant_lin_spd_out_simu (Vehicle Speed) [mile/h] x 1
gb_plant_gear_simu (Gear number) [] x 10

ANL/ESD/12-6 – Impact of Transmission Technology on Fuel Efficiency
Page | 48
Figure 29 shows the torque converter lockup signal on an FTP cycle. Note that the lockup occurs only
twice during the entire cycle. This is because the lockup conditions are met at vehicle speeds above 40
mph, which do not frequently occur on the FTP cycle.
Figure 29 - Normal Torque Converter Lockup Strategies (FTP cycle)
0 200 400 600 800 1000 1200 1400
0
20
40
60
80
100
time (sec)
chas_plant_lin_spd_out_simu (simulation1) [mile/h] x 1
cpl_ctrl_cmd_simu (simulation1) [%] x 1
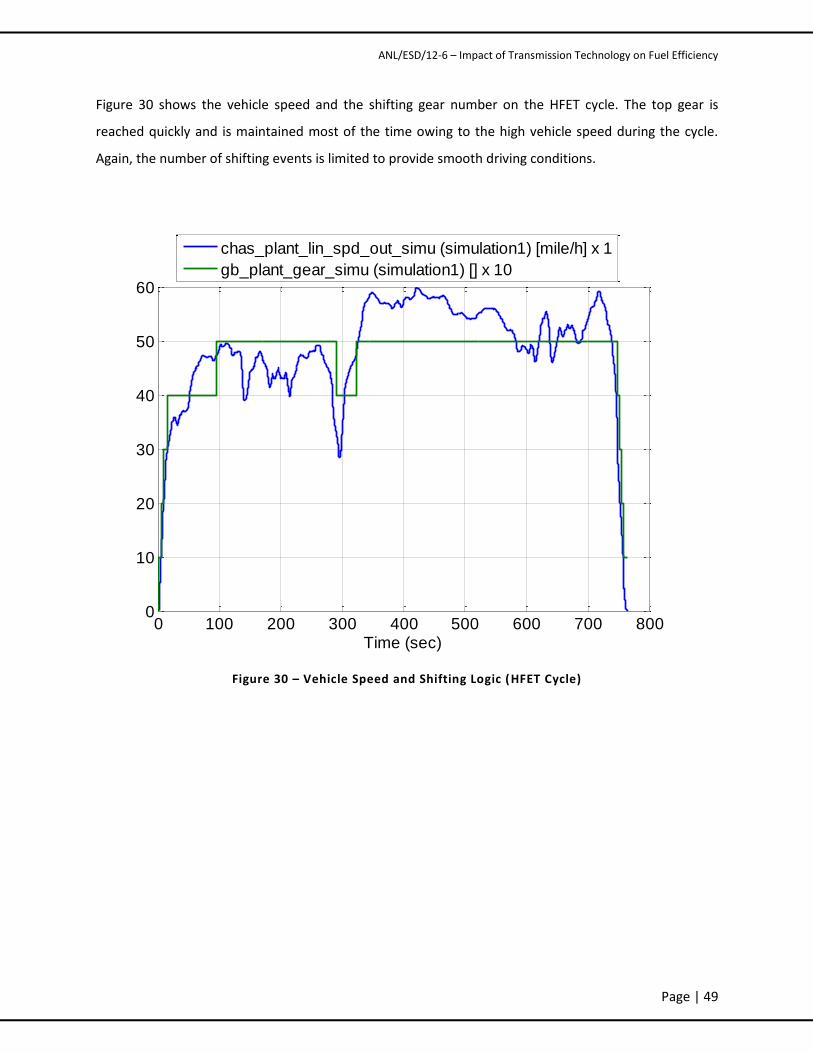
ANL/ESD/12-6 – Impact of Transmission Technology on Fuel Efficiency
Page | 49
Figure 30 shows the vehicle speed and the shifting gear number on the HFET cycle. The top gear is
reached quickly and is maintained most of the time owing to the high vehicle speed during the cycle.
Again, the number of shifting events is limited to provide smooth driving conditions.
Figure 30 – Vehicle Speed and Shifting Logic (HFET Cycle)
0 100 200 300 400 500 600 700 8000
10
20
30
40
50
60
Time (sec)
chas_plant_lin_spd_out_simu (simulation1) [mile/h] x 1
gb_plant_gear_simu (simulation1) [] x 10

ANL/ESD/12-6 – Impact of Transmission Technology on Fuel Efficiency
Page | 50
Figure 31 shows the torque converter lockup signal on an HFET cycle. Unlike on the FTP cycle, the
reference torque converter logic leads to the device being locked most of the time because of the high
vehicle speeds.
Figure 31 – Normal Torque Converter Lockup Strategies (HFET Cycle)
0 100 200 300 400 500 600 700 800
0
20
40
60
80
100
time (sec)
chas_plant_lin_spd_out_simu (Vehicle Speed) [mile/h] x 1
cpl_ctrl_cmd_simu (Lockup Signal) [%] x 1

ANL/ESD/12-6 – Impact of Transmission Technology on Fuel Efficiency
Page | 51
5.2. Advanced Automatic Transmissions
5.2.1. Impact of Early Torque Converter Lockup
FTP Drive Cycle
Figure 32 and Figure 33 show the torque converter lockup events resulting from the aggressive torque
converter strategy (described earlier) compared with the reference strategy on the FTP cycle. The
reference lockup strategy is represented by the full line, while the aggressive lockup strategy is
illustrated by the dashed line. Note that the aggressive logic results in a much higher number of locking
events on the FTP cycle, leading to lower system losses.
Figure 32 - Normal and Aggressive Torque Converter Lockup Strategies (FTP Cycle)
0 200 400 600 800 1000 1200 1400
0
20
40
60
80
100
time (sec)
cpl_ctrl_cmd_simu (Aggressive lockup) [%] x 1
cpl_ctrl_cmd_simu (Normal Lockup) [%] x 1
chas_plant_lin_spd_out_simu (Vehicle Speed) [mile/h] x 1

ANL/ESD/12-6 – Impact of Transmission Technology on Fuel Efficiency
Page | 52
Figure 33 is a close-up of the area between 150 sec and 350 sec in Figure 32. The figures confirms that,
for low vehicle speed, the aggressive strategy locks the torque converter (blue line), whereas in the
normal lockup strategy, the torque converter is unlocked in low vehicle speeds (green line). It is
expected that drive quality issues due to early torque converter lockup would be solved as part of the
technology implementation.
Figure 33 – 150–300 Seconds of Normal and Aggressive Torque Converter Lockup
Strategies (FTP Cycle)
150 200 250 300 350
0
20
40
60
80
100
time (sec)
cpl_ctrl_cmd_simu (Aggressive lockup) [%] x 1
cpl_ctrl_cmd_simu (Normal Lockup) [%] x 1
chas_plant_lin_spd_out_simu (Vehicle Speed) [mile/h] x 1

ANL/ESD/12-6 – Impact of Transmission Technology on Fuel Efficiency
Page | 53
Table 5 shows that with the reference lockup strategy, the torque converter is locked 8.3% of the cycle
time (FTP cycle), whereas the aggressive strategy allows the converter to lock 67.6% of the time.
Because of the low efficiency of the torque converter when unlocked, the aggressive lockup strategy is
expected to reduce fuel consumption on the FTP cycle.
Table 5 – Percentage Time Torque Converter is Locked (FTP Cycle)
FTP Normal Strategy Aggressive Strategy
Percentage of time torque converter is locked up
8.3% 67.6%
HFET Drive Cycle
As might be expected, the different lockup strategies have less effect on the HFET drive cycle because of
the higher vehicle speed. As shown in Figure 34, the lock and unlock signals between the reference and
aggressive lock up logic are similar.
Figure 34 – Normal and Aggressive Torque Converter Lockup Strategy (HFET Cycle)
0 100 200 300 400 500 600 700 800
0
20
40
60
80
100
time (sec)
cpl_ctrl_cmd_simu (Aggresive Lockup) [%] x 1
cpl_ctrl_cmd_simu (Normal Lockup) [%] x 1
chas_plant_lin_spd_out_simu (simulation1) [mile/h] x 1

ANL/ESD/12-6 – Impact of Transmission Technology on Fuel Efficiency
Page | 54
Figure 35 is a close-up of the first 60 seconds of Figure 28, illustrating that the aggressive/early lockup
strategy locks up the torque converter more often than the normal lockup strategy only during the first
seconds of the HFET cycle period. The rest of the cycle shows a similar behavior because of the high
vehicle speed.
Figure 35 – First 60 Seconds of Normal and Aggressive Torque Converter Lockup
Strategy (HFET Cycle)
10 20 30 40 50 60
0
10
20
30
40
50
60
70
80
90
100
time (sec)
cpl_ctrl_cmd_simu (Aggresive Lockup) [%] x 1
cpl_ctrl_cmd_simu (Normal Lockup) [%] x 1
chas_plant_lin_spd_out_simu (simulation1) [mile/h] x 1

ANL/ESD/12-6 – Impact of Transmission Technology on Fuel Efficiency
Page | 55
Table 6 shows that, for the normal lockup strategy, the torque converter is locked 89.3% of the cycle
time (HFET cycle), whereas the aggressive strategy allows the converter to lock 97.7% of the time. The
difference is not as large as for the FTP cycle.
Table 6 – Percentage Time Torque Converter is Locked (HFET Cycle)
HFET Normal Strategy Aggressive Strategy
Percentage of time torque converter is locked up 89.3% 97.7%
Because of the different impacts of the locked-up times, the aggressive strategy for the torque converter
will affect the FTP and HFET cycles differently. Table 7 shows the fuel consumption improvement of an
aggressive torque converter lockup strategy on the FTP, HFET, and combined drive cycles. As expected,
the FTP drive cycle shows a greater improvement than the HFET (2.1% versus 0.8%). Overall, a gain of
1.4% can be expected on the combined drive cycle.
Table 7 – Fuel Consumption (L/100 km) Comparison under Normal and Aggressive Lockup Strategies
FTP HFET Combined
Normal lockup 7.8 5.55 6.6
Aggressive lockup 7.65 5.5 6.5
Improvement (%) 2.1 0.84 1.44
5.2.2. Impact of Higher Gear Number
This section evaluates the impact of higher gear number on automatic transmissions. All future results
assume an aggressive torque converter lockup strategy.

ANL/ESD/12-6 – Impact of Transmission Technology on Fuel Efficiency
Page | 56
FTP Behavior
Figure 36 shows the gear number for the three automatic transmissions selected (5-, 6- and 8-speeds).
As expected, higher gear ratios are consistently used for the 8-speed transmission compared with the
other technologies. By lowering the engine rotational speed, the engine operating torque is expected to
increase, leading to lower fuel consumption. Note that the number of shifting events is limited to
maintain drive quality as drivers would not accept too frequent gear shifting. Not including driver
expectations would lead to higher reductions in fuel consumption due to unrealistic high number of
shifting events.
Figure 36 – Shifting Logic on FTP cycle for Automatic Transmissions
0 200 400 600 800 1000 1200 14000
1
2
3
4
5
6
7
8
9
time (sec)
gb_plant_gear_simu (5spd auto 92eff) x 1
gb_plant_gear_simu (6spd auto 92eff) x 1
gb_plant_gear_simu (8spd auto 92eff) x 1

ANL/ESD/12-6 – Impact of Transmission Technology on Fuel Efficiency
Page | 57
Figure 37 and Figure 38 compare the shifting events of the 5-speed automatic versus the 6-speed
automatic transmission and the 6-speed automatic versus the 8-speed automatic transmission.
Figure 37 – Shifting Logic on FTP Cycle for 5-Speed versus 6-Speed
Figure 38 – Shifting Logic on FTP Cycle for 6-Speed versus 8-Speed
Table 8 shows the percentage of time spent in each gear during a FTP cycle.
0 200 400 600 800 1000 1200 14000
1
2
3
4
5
6
7
8
9
time (sec)
gb_plant_gear_simu (5spd auto 92eff) x 1
gb_plant_gear_simu (6spd auto 92eff) x 1
0 200 400 600 800 1000 1200 14000
1
2
3
4
5
6
7
8
9
time (sec)
gb_plant_gear_simu (6spd auto 92eff) x 1
gb_plant_gear_simu (8spd auto 92eff) x 1

ANL/ESD/12-6 – Impact of Transmission Technology on Fuel Efficiency
Page | 58
Table 8 – Percentage Time Spent in Each Gear (FTP Cycle)
Percentage of time spent in each gear 5-speed 6-speed 8-speed
Gear 1 29.9% 28.4% 28.6%
Gear 2 8.3% 5.9% 5.1%
Gear 3 42.7% 15.6% 7%
Gear 4 11.1% 34% 17.7%
Gear 5 7.9% 8.5% 24.5%
Gear 6 - 7.5% 8.1%
Gear 7 - - 2.7%
Gear 8 - - 6.2%
Figure 39 shows the gear ratio of the different transmission considered.
Figure 39 – Gearbox Ratios on FTP Cycle for All Automatic Transmissions Considered
Figure 40 and Figure 41 show the engine rotational speeds for the different automatic transmissions.
The engine speeds decrease as the gear number increases when the final drive adjustment is taken into
0 200 400 600 800 1000 1200 14000
0.5
1
1.5
2
2.5
3
3.5
4
4.5
5
time (sec)
gb_plant_ratio_simu (5psd auto 92eff) [] x 1
gb_plant_ratio_simu (6psd auto 92eff) [] x 1
gb_plant_ratio_simu (8psd auto 92eff) [] x 1

ANL/ESD/12-6 – Impact of Transmission Technology on Fuel Efficiency
Page | 59
account. Because the engine has to provide the same power at the wheel to follow the vehicle speed
trace, a lower engine speed would lead to a higher engine torque and overall higher efficiency.
Figure 40 – Engine Speed on FTP Cycle for the 5–Speed and 6-Speed Automatic Transmissions
0 200 400 600 800 1000 1200 14000
50
100
150
200
250
300
350
400
time (sec)
eng_plant_spd_out_simu (5spd auto 92eff) [rad/s] x 1
eng_plant_spd_out_simu (6spd auto 92eff) [rad/s] x 1

ANL/ESD/12-6 – Impact of Transmission Technology on Fuel Efficiency
Page | 60
Figure 41 – Engine Speed on FTP cycle for the 6-Speed and 8-Speed Automatic Transmissions
Table 9 summarizes the engine and transmission average efficiencies, as well as the average engine
speeds for each automatic transmission on the FTP cycle. For the three cases with the same
transmission efficiency (92%), a decrease in average engine speed with a higher gear numbers leads to
higher average engine efficiencies. The average transmission efficiency is slightly lower than the gearbox
constant efficiency (92% or 96%) due to losses during shifting events. Finally, an increase in the
transmission efficiency (92% to 96% for the 8-speed) leads to slightly lower average engine efficiency
because the engine has to provide less power to the wheel and, consequently, operates at lower loads.
Table 9 – Summary of FTP Cycle Efficiencies and Speeds for Automatic Transmissions
5-speeds, 92% efficiency
6-speeds, 92% efficiency
8-speeds, 92% efficiency
8-speeds, 96% efficiency
Average engine efficiency (%) 23.5 23.6 24.1 23.7
Average transmission efficiency (%)
91.3 91.1 91.2 95.1
Average engine speed (rpm) 1419 1403 1342 1335
0 200 400 600 800 1000 1200 14000
50
100
150
200
250
300
350
400
time (sec)
eng_plant_spd_out_simu (6spd auto 92eff) [rad/s] x 1
eng_plant_spd_out_simu (8spd auto 92eff) [rad/s] x 1

ANL/ESD/12-6 – Impact of Transmission Technology on Fuel Efficiency
Page | 61
HFET Drive Cycle
Figure 42 shows the gear-number evolution over the HFET drive cycle. Top gears are reached at a similar
time regardless of transmission gear numbers. As a consequence, additional shifting events are required
for higher-speed transmissions, which could lead to drive quality issues.
Figure 42 – Shifting Logic on HFET Cycle for All Automatic Transmissions
0 100 200 300 400 500 600 700 8000
1
2
3
4
5
6
7
8
9
time (sec)
gb_plant_gear_simu (5spd auto 92eff) [] x 1
gb_plant_gear_simu (6spd auto 92eff) [] x 1
gb_plant_gear_simu (8spd auto 92eff) [] x 1

ANL/ESD/12-6 – Impact of Transmission Technology on Fuel Efficiency
Page | 62
Table 10 shows the percentage of time spent in each gear during the HFET cycle. The most time is spent
in the top gear: 81% of the time for the 5-speed, 57% for the 6-speed, and 54% for the 8-speed.
Note that the higher the number of gears, the less time is spent in the top gear because of the
intermediate gear ratios.

ANL/ESD/12-6 – Impact of Transmission Technology on Fuel Efficiency
Page | 63
Table 10 – Percentage Time Spent in Each Gear (HFET Cycle)
Percentage of time spent in each gear 5-speed 6-speed 8-speed
Gear 1 1.6% 1.6% 1.6%
Gear 2 0.6% 0.5% 0.4%
Gear 3 1.5% 0.7% 0.3%
Gear 4 15.3% 1.9% 0.5%
Gear 5 81% 38.5% 1.2%
Gear 6 - 56.9% 4.7%
Gear 7 - - 37.8%
Gear 8 - - 53.4%
Figure 43 shows the gear ratio for each automatic transmission
Figure 43 – Gearbox Ratios on HFET Cycle for All Automatic Transmissions
0 200 400 600 8000
1
2
3
4
5
time (sec)
gb_plant_ratio_simu (5spd auto 92 eff) [] x 1
gb_plant_ratio_simu (6spd auto 92 eff) [] x 1
gb_plant_ratio_simu (8spd auto 92 eff) [] x 1

ANL/ESD/12-6 – Impact of Transmission Technology on Fuel Efficiency
Page | 64
Figure 44 shows the engine speeds for the various automatic transmissions studied. For the FTP cycle,
the engine operating speed consistently decreases as the number of gears increases.
Figure 44 – Engine Speed on HFET Cycle for All Automatic Transmissions
Table 11 summarizes the results presented above. The average engine speed decreases as the number
of gears increases.
Table 11 – Summary of HFET Cycle Efficiencies and Speeds for Automatic Transmissions Considered
5-speeds, 92% efficiency
6-speeds, 92% efficiency
8-speeds, 92% efficiency
8-speeds, 96% efficiency
Average engine efficiency (%) 28.1 28.6 29.4 29.1
Average transmission efficiency (%) 92 91.9 91.9 95.9
Average engine speed (rpm) 1790 1707 1492 1489
0 100 200 300 400 500 600 700 8000
50
100
150
200
250
300
time (sec)
eng_plant_spd_out_simu (5spd auto 92eff) [rad/s] x 1
eng_plant_spd_out_simu (6spd auto 92eff) [rad/s] x 1
eng_plant_spd_out_simu (8spd auto 92eff) [rad/s] x 1

ANL/ESD/12-6 – Impact of Transmission Technology on Fuel Efficiency
Page | 65
5.2.3. Fuel Consumption Benefits
Table 12 summarizes the output fuel consumption results. Overall, the fuel consumption is lower on
HFET cycles than on FTP cycles because of the lower transients and higher vehicle speeds. The results
show that fuel consumption decreases by 0.77% from 5 to 6-speeds and 1.9% from 6 to 8-speeds. As a
result, one additional speed provides a fuel consumption decrease ranging from 0.77% to 0.95%. In
comparison, a 4% increase in transmission efficiency leads to a 3% fuel consumption improvement. This
is due to the fact that increased transmission efficiency leads to lower engine power requirements and
consequently lower engine efficiency.
Table 12 – Fuel Consumption Results (L/100 km) and Percentage Improvement for Automatic
Transmissions
Fuel Consumption Results
Conventional – Automatic Transmission FTP HFET Combined
5-speed – 92% efficiency 7.64 5.50 6.50
6-speed – 92% efficiency 7.62 5.44 6.45
Improvement (%) 0.38 1.11 0.77
6-speed – 92% efficiency 7.62 5.44 6.45
8-speed – 92% efficiency 7.53 5.29 6.33
Improvement (%) 1.08 2.61 1.90
8-speed – 92% efficiency 7.53 5.29 6.33
8-speed – 96% efficiency 7.31 5.13 6.14
Improvement (%) 2.92 3.05 2.99

ANL/ESD/12-6 – Impact of Transmission Technology on Fuel Efficiency
Page | 66
Table 13 – Fuel Economy Results (mpg) and Percentage Improvement for Automatic Transmissions
Fuel Economy Results
Conventional – Automatic Transmission FTP HFET Combined
5-speed – 92% efficiency 30.75 42.76 35.19
6-speed – 92% efficiency 30.87 43.24 35.43
Improvement (%) 0.39 1.12 0.66
6-speed – 92% efficiency 30.87 43.24 35.43
8-speed – 92% efficiency 31.21 44.4 36.02
Improvement (%) 1.1 2.68 1.67
8-speed – 92% efficiency 31.21 44.4 36.02
8-speed – 96% efficiency 32.15 45.8 37.13
Improvement (%) 3.01 3.15 3.06
5.3. Dual Clutch Transmission
Although automatic transmissions currently dominate the U.S. market, numerous manufacturers are
offering vehicles with DCTs and are continuing to fund considerable research and development to
increase their efficiencies.
5.3.1. Impact of Transmission Technology
This section presents vehicle parameters and results of our comparison of the 6-speed automatic
transmission with a DCT with the same number of gears.

ANL/ESD/12-6 – Impact of Transmission Technology on Fuel Efficiency
Page | 67
FTP Drive Cycle
Figure 45 shows the shifting logic comparison on the FTP cycle between the 6-speed automatic and the
DCT. The shifting control behaves similarly for both transmissions. The main difference occurs between
804 sec and 834 sec due to different final drive ratios.
Figure 45 – Gear Number on FTP Cycle for the 6-Speed Automatic versus 6-Speed DCT
0 200 400 600 800 1000 1200 14000
1
2
3
4
5
6
7
Time (sec)
6spd au 92eff
6spd DCT 92eff

ANL/ESD/12-6 – Impact of Transmission Technology on Fuel Efficiency
Page | 68
Figure 46 shows the engine speed of the automatic compared with the DCT on the FTP cycle. The
difference in operating conditions is due to the different final drive ratios (3.8 is used for the automatic
case and 3.69 for the DCT). The final drive ratios are different because of the gear ratio selection process
adopted for the study, in which we decided to maintain a constant gearbox ratio and only change the
final drive ratio to achieve similar vehicle performance. Selecting different gear ratios and final drive
ratios would certainly impact the component operating conditions and the overall results, but such a
sensitivity analysis was not considered in the current study.
Figure 46 – Engine Speed on FTP Cycle for 6-Speed Automatic versus 6-Speed DCT
0 200 400 600 800 1000 1200 14000
50
100
150
200
250
300
350
400
time (sec)
engine speed (6spd au 92eff) [rad/s] x 1
engine speed (6spd DCT 92eff) [rad/s] x 1

ANL/ESD/12-6 – Impact of Transmission Technology on Fuel Efficiency
Page | 69
HFET Drive Cyle
Figure 47 compares the shifting logic on the HFET cycle for the 6-speed automatic versus the DCT.
Similar to the FTP, the gear numbers selected are similar for both technologies on the HFET.
Figure 47 – Gear Number on HFET Cycle for the 6-Speed Automatic versus 6-Speed DCT
0 100 200 300 400 500 600 700 8000
1
2
3
4
5
6
7
time (sec)
6spd au 92eff
6spd DCT 92eff

ANL/ESD/12-6 – Impact of Transmission Technology on Fuel Efficiency
Page | 70
Figure 48 shows the engine speeds of the 6-speed automatic and DCT on the HFET cycle. As previously
mentioned, the difference comes from our selection of different final drive ratios.
Figure 48 – Engine Speed on HFET Cycle for 6-Speed Automatic versus 6-Speed DCT
5.3.2. Impact of Higher Gear Number
Figure 49 and Figure 50 confirm the same trend seen in the automatic transmission comparison for FTP
and HFET driving cycles: transmissions that have a higher number of gears operate in the higher gears to
reduce engine operating speed and increase efficiency. A higher number of shifting events naturally
occurs but, in all cases, the shifting algorithm limited the number of shifting events to provide
acceptable drive quality.
0 100 200 300 400 500 600 700 8000
50
100
150
200
250
300
time (sec)
eng_plant_spd_out_simu (6spd au 92eff) [rad/s] x 1
eng_plant_spd_out_simu (6spd DCT 92eff) [rad/s] x 1

ANL/ESD/12-6 – Impact of Transmission Technology on Fuel Efficiency
Page | 71
Figure 49 – Shifting Logic on FTP Cycle for all DCTs
Figure 50 – Shifting Logic on HFET Cycle for all DCTs
0 200 400 600 800 1000 1200 14000
1
2
3
4
5
6
7
8
9
Time (sec)
6spd DCT 92eff
8spd DCT 92eff
0 100 200 300 400 500 600 700 8000
1
2
3
4
5
6
7
8
9
Time (sec)
6spd DCT 92eff
8spd DCT 92eff

ANL/ESD/12-6 – Impact of Transmission Technology on Fuel Efficiency
Page | 72
Table 14 and Table 15 list the percentage of time spent in each gear during the FTP and HFET cycles,
respectively. Again, the behavior is similar to that of the automatic transmission. In the DCT case, the
most time is spent on the top gear: 73% for the 6-speed and 81% for the 6-speed on the HFET.
In the next section, the number of shifting events will be discussed.
Table 14 – Percentage Time Spent in each Gear, FTP Cycle
Percentage of time spent in each gear 6-speed 8-speed
Gear 1 9.1% 6%
Gear 2 6.512% 5.2%
Gear 3 19.713% 6.712%
Gear 4 30% 12.214%
Gear 5 5.513% 22.914%
Gear 6 7.412% 16.613%
Gear 7 – 1.2%
Gear 8 – 7.713%
Table 15 – Percentage of Time Spent in each Gear, HFET Cycle
Percentage of time spent in each gear 6-speed 8-speed
Gear 1 0.813% 0.5%
Gear 2 0.5% 0.4%
Gear 3 0.514% 0.4%
Gear 4 2 % 0.4%
Gear 5 22.4% 0.7%
Gear 6 72.5% 3.6%
Gear 7 – 11.5%
Gear 8 – 81.3%

ANL/ESD/12-6 – Impact of Transmission Technology on Fuel Efficiency
Page | 73
As expected, and similar to the automatic-transmission case, a higher gear number helps keep the
engine operating in a higher-efficiency area by lowering its speed and increasing its torque. Indeed,
Figure 51 and Figure 52 show lower engine speeds for the 8-speed transmission than for the 6-speed
transmission.
Figure 51 – Engine Speed on FTP Cycle for all DCTs
Engine speed on the HFET cycle shows less variation. Overall, the 8-speed DCT shows lower engine load
in Figure 52, except when the top gear is reached.
0 200 400 600 800 1000 1200 14000
100
200
300
400
500
600
Time (sec)
eng_plant_spd_out_simu (6spd DCT 92eff) [rad/s] x 1
eng_plant_spd_out_simu (8spd DCT 92eff) [rad/s] x 1
chas_plant_lin_spd_out_simu (Vehicle Speed) [mile/h] x 10

ANL/ESD/12-6 – Impact of Transmission Technology on Fuel Efficiency
Page | 74
Figure 52 – Engine Speed on HFET Cycle for all DCTs
Table 16 and Table 17 summarize the results presented in Figures 45 and 46. For the automatic
transmission case, the average engine speed decreases as the number of gears increases, and the
average speed remains the same for the two 8-speed transmissions with different efficiencies.
Table 16 – Summary of FTP Cycle Efficiencies and Speeds for DCTs
6-speed, 92% efficiency
8-speed, 92% efficiency
8-speed, 96% efficiency
Average engine efficiency (%) 23.4 23.4 23.1
Average transmission efficiency (%) 92 92 96
Average engine speed (rpm) 1,382 1,354 1350
Table 17 – Summary of HFET Cycle Efficiencies and Speeds for DCTs
6-speed, 92% efficiency
8-speed, 92% efficiency
8-speed, 96% efficiency
Average engine efficiency (%) 28.75 29.5 29.2
Average transmission efficiency (%) 92 92 96
Average engine speed (rpm) 1,604 1,425 1,425
0 100 200 300 400 500 600 700 8000
50
100
150
200
250
300
time (sec)
eng_plant_spd_out_simu (6spd DCT 92eff) [rad/s] x 1
eng_plant_spd_out_simu (8spd DCT 92eff) [rad/s] x 1

ANL/ESD/12-6 – Impact of Transmission Technology on Fuel Efficiency
Page | 75
5.3.3. Fuel Consumption Benefits
Table 18 and Table 19 summarize the output fuel consumption and fuel economy results. Like other
conventional vehicles, the fuel consumption is lower on the HFET cycle than on the FTP cycle.
Simulations demonstrate that fuel consumption can be improved by 2.1% on the combined cycle by
increasing the number of gears from 6 to 8 (an increase of 1% per additional gear). A 4% increase in
gearbox efficiency leads to a 2.78% reduction in fuel consumption (or 0.7% for each additional efficiency
point).
Table 18 – Fuel Consumption Results (L/100 km) and Percentage Improvement for DCTs; Automatic
Transmission/DCT Comparison
DCT
Conventional – DCT FTP HFET Combined
6-speed – 92% efficiency 7.35 5.22 6.21
8-speed – 92% efficiency 7.23 5.09 6.08
Improvement (%) 1.63 2.51 2.10
8-speed – 92% efficiency 7.23 5.09 6.08
8-speed – 96% efficiency 7.05 4.94 5.91
Improvement (%) 2.49 3.04 2.78
Comparison of automatic transmission (Table 9) with DCT FTP HFET Combined
6-speed automatic – 92% efficiency 7.62 5.44 6.45
6-speed DCT – 92% efficiency 7.35 5.22 6.21
Improvement (%) 3.47 3.91 3.70

ANL/ESD/12-6 – Impact of Transmission Technology on Fuel Efficiency
Page | 76
Table 19 – Fuel Economy Results (mpg) and Percentage Improvement for DCTs; Automatic
Transmission/DCT Comparison
DCT
Conventional – DCT FTP HFET Combined
6-speed – 92% efficiency 31.98 45 36.76
8-speed – 92% efficiency 32.51 46.16 37.5
Improvement (%) 1.65 2.57 1.99
8-speed – 92% efficiency 32.51 46.16 37.5
8-speed – 96% efficiency 33.34 47.61 38.53
Improvement (%) 2.55 3.14 2.76
Comparison of automatic transmission (Table 9) versus DCT FTP HFET Combined
6-speed automatic – 92% efficiency 30.87 43.24 35.43
6-speed DCT – 92% efficiency 31.98 45 36.76
Improvement (%) 3.59 4.07 3.77
5.4. Shift Event Comparison with Vehicle Test Data
This section provides a comparison of the simulation results with different vehicle test data collected at
Argonne’s APRF.
The number of shifting events is a critical factor in properly estimating fuel consumption. The main
objective of transmissions is to allow the engine to operate at high efficiency, so a higher number of
shifting events would certainly lead to lower fuel consumption. However, such a control approach
would provide unacceptable drive quality. This problem is well documented for continuously variable
transmissions (CVTs); when engineers decided to continuously change the ratios of the CVT to optimize
engine operating conditions, the resulting vehicle drive quality could be very poor. Automakers must be
very careful to properly balance the fuel efficiency offered by a higher number of shifting events with
consideration of drive quality.

ANL/ESD/12-6 – Impact of Transmission Technology on Fuel Efficiency
Page | 77
It is reasonable to expect that the number of shifts will increase for an 8-speed transmission compared
with a 6-speed transmission, but the increase needs to be within reasonable constraints.
Numerous conventional vehicles were tested on the FTP cycle at Argonne’s APRF, including the Ford
F150 (4-speed), Crown Victoria (4-speed), and Fusion (6-speed); the Toyota Echo (5-speed); the
Mercedes Benz S400 (7-speed); and the Volkswagen Jetta (7-speed DCT). The number of shifting events
was calculated on the basis of measured engine and vehicle speeds; a range was developed (+/-5
shifting) to estimate the variation of vehicles with the same number of gears. The results are listed
below:
4-speed automatic: 100 to 110
5-speed automatic: 110 to 120
6-speed automatic: 110 to 120
7-speed automatic: 130 to 140
7-speed DCT: 130 to 140
In general, on the FTP cycle, the driver will notice an average of 10 additional shifting events per
additional transmission gear number. This can be explained by the number of hills in the FTP drive cycle
(total of 18), considering that several of them are too short and low speed to provide the transmission
enough time to reach a higher gear. Autonomie baseline 6-speed simulation yielded 115 shifts on the
FTP cycle, which is within the range estimated from vehicle test data.
For reference, Autonomie simulation results show the following number of shifting events on the FTP
cycle:
5-speed automatic: around 89
6-speed automatic: around 115
8-speed automatic: around 149
6-speed DCT: approximately 130 (112 if the neutral position is skipped)
8-speed DCT: approximately 170 (152 if the neutral position is skipped )
Note: DCTs naturally have more gear shifts than automatic transmissions because they have to go to an
additional neutral position at low vehicle speeds; automatic transmissions stay in first gear. To make the
counting comparison valid, this additional neutral “gear” has to be taken out of the counting. Basically a
6-speed DCT/manual has 7 gears, including the neutral.

ANL/ESD/12-6 – Impact of Transmission Technology on Fuel Efficiency
Page | 78
6. Transmission Decision Tree from Simulations
Figure 53 shows the decision tree resulting from the Autonomie simulation runs. All percentage
increases represent fuel consumption improvements. The incremental value represents the actual
improvement achieved by moving from one step to another, whereas the absolute value signifies the
overall improvement starting from the reference baseline vehicle.
Absolute values are multiplicatively calculated as follows:
(5)
))
This equation makes the final absolute value, calculated multiplicatively, lower than the straight
summation of the absolute improvement numbers.
The two paths shown in Figure 53 are the automatic transmission and DCT paths. These two paths were
selected to compare the advances offered by each technology.
The two steps of the common pathway preceding the split are described as follows:
IATC: This step shows the percentage improvement gained by aggressive torque converter
lockup for a 5-speed automatic transmission (1.4%).
NAUTO: This step provides the fuel consumption improvement of a 6-speed automatic
transmission compared with a 5-speed transmission. The fuel consumption improvement
resulting from that step is 0.77%; the absolute value is the multiplicative sum of the previous
step and the current step: 1.4% + 0.8% = 2.2%.
The following steps occur after the tree splits into the two paths (i.e., automatic transmission and DCT).
As discussed above the shift optimizer (SHFTOPT) technology was not evaluated as part of this study so
the HETRANS technology is the last step in these paths.

ANL/ESD/12-6 – Impact of Transmission Technology on Fuel Efficiency
Page | 79
Automatic Transmission Path
8SP: This step provides the incremental fuel consumption of an 8-speed automatic transmission
compared to a 6-speed automatic: 1.9%, with a resulting absolute value of 4%.
HETRANS: This step provides the incremental fuel consumption of an 8-speed automatic
transmission due to a 4% higher efficiency. This efficiency increase yields a 3% incremental fuel
consumption improvement
The overall absolute improvement — from the baseline to the final step — is 6.9%.
Figure 53 – Transmission Decision Tree Resulting from Simulations
IATC
INC % 1.4% $
ABS % 1.4% $
NAUTO
INC % 0.8% $
ABS % 2.2% $
6SPD DCT
INC % 3.7% $
ABS % 5.8% $
8SPD 8SPD DCT
INC % 1.9% $ INC % 2.1% $
ABS % 4.0% $ ABS % 7.8% $
HETRANS HETRANS
INC % 3.0% $ INC % 2.8% $
ABS % 6.9% $ ABS % 10.3% $
SHFTOPT SHFTOPT
INC % 0.0% $ INC % 0.0% $
ABS % 0.0% $ ABS % 0.0% $
Shift Optimizer
(SHFTOPT) - TBL
6-spd Dual Clutch Trans
(DCT) - TBL
8-spd Trans (DCT)
(8SPD) - TBL
High Eff. Gearbox (+4%)
(DCT)
Imp. Auto Trans Cnrt./
Externals (IATC) - TBL
6-spd Auto Trans w/Imp
Internals (NAUTO) - TBL
8-spd Trans (Auto)
(8SPD) - TBL
Shift Optimizer
(SHFTOPT) - TBL
SIMULATIONAuto Trans
High Eff. Gearbox (+4%)
(Auto) - (HETRANS) - TBL
AUTOMATIC DCT

ANL/ESD/12-6 – Impact of Transmission Technology on Fuel Efficiency
Page | 80
DCT Path
DCT (6-speed DCT): This step shows the benefit of a 6-speed DCT compared with an automatic
transmission with the same number of gears. The simulation results show that applying this new
transmission technology produces a 3.7% incremental fuel consumption improvement and a
5.8% absolute improvement.
8SPD (8-speed DCT): In this step, moving to an 8-speed DCT yields a 2.1% incremental fuel
consumption improvement.
HETRANS: This is the last step of the DCT path in the tree. It represents the high-efficiency
version of the 8-speed DCT. In this case, the 4% increase in transmission efficiency leads to a
2.8% incremental fuel consumption improvement.
The overall absolute improvement — from the baseline to the final step — is 10.3%.
The automatic transmission path provides a total fuel consumption improvement of 6.9%; the DCT
path provides a 10.3% fuel consumption improvement.

ANL/ESD/12-6 – Impact of Transmission Technology on Fuel Efficiency
Page | 81
6.1. Uncertainty Analysis
6.1.1. Impact of Engine Technology
6.1.1.1. Port Fuel Injected Engine
In this section, to evaluate the impact of this trend on the transmission decision tree results, we
replaced the naturally aspirated 2.2L Ecotec engine with a port fuel injected engine technology. In order
to maintain the same performance as the reference direct injection engine with the initial gear and final
drive ratios, the new engine was scaled to 115 kW. All other vehicle parameters are the same as the
above evaluation with the 2.2L Ecotec engine.
Table 20 and Table 21 list the fuel consumption and fuel economy results for the advanced
turbocharged engine.
Table 20 – Fuel Consumption Results (L/100 km) and Percentage Improvement for Automatic
Transmissions with Port Fuel Injected Engine
Fuel Consumption Results
Conventional – Automatic Transmission FTP HFET Combined
5-speed – 92% efficiency 8.71 5.68 7.02
6-speed – 92% efficiency 8.71 5.62 6.98
Improvement (%) 0 1.03 0.53
6-speed – 92% efficiency 8.71 5.62 6.98
8-speed – 92% efficiency 8.54 5.38 6.76
Improvement (%) 1.85 4.23 3.20
8-speed – 92% efficiency 8.54 5.38 6.76
8-speed – 96% efficiency 8.33 5.23 6.58
Improvement (%) 2.48 2.78 2.65

ANL/ESD/12-6 – Impact of Transmission Technology on Fuel Efficiency
Page | 82
Table 21 – Fuel Economy Results (mpg) and Percentage Improvement for Automatic Transmissions
with Port Fuel Injected Engine
Fuel Economy Results
Conventional – Automatic Transmission FTP HFET Combined
5-speed – 92% efficiency 27.1 48.23 41.44
6-speed – 92% efficiency 27.1 48.73 41.58
Improvement (%) 0 1.04 0.35
6-speed – 92% efficiency 27.0 41.9 32.1
8-speed – 92% efficiency 27.5 43.7 33.0
Improvement (%) 1.9 4.4 2.7
8-speed – 92% efficiency 27.5 43.7 33.0
8-speed – 96% efficiency 28.2 45.0 33.9
Improvement (%) 2.5 2.9 2.7
Figure 54 shows the updated decision tree based on the new engine. The fuel consumption
improvement due to advanced transmission, combined with port injected engine, is 9.0%. This value is
higher than the 6.9% previously simulated for the reference engine.

ANL/ESD/12-6 – Impact of Transmission Technology on Fuel Efficiency
Page | 83
Figure 54 – Transmission Decision Tree with Port Fuel Injected Engine
6.1.1.2. Downsized Turbocharged Engine
The transmission performance characteristics that most influence consumer preferences are launch
quality, shift quality, and acceleration.
IATC
INC % 2.9% $
ABS % 2.9% $
NAUTO
INC % 0.5% $
ABS % 3.4% $
6SPD DCT
INC % 4.5% $
ABS % 7.8% $
8SPD 8SPD DCT
INC % 3.2% $ INC % 3.4% $
ABS % 6.5% $ ABS % 10.9% $
HETRANS HETRANS
INC % 2.7% $ INC % 2.9% $
ABS % 9.0% $ ABS % 13.5% $
SHFTOPT SHFTOPT
INC % 0.0% $ INC % 0.0% $
ABS % 0.0% $ ABS % 0.0% $
8-spd Trans (Auto)
(8SPD) - TBL
SIMULATIONAuto Trans
Shift Optimizer
(SHFTOPT) - TBL
High Eff. Gearbox (+4%)
(Auto) - (HETRANS) - TBL
Shift Optimizer
(SHFTOPT) - TBL
6-spd Dual Clutch Trans
(DCT) - TBL
8-spd Trans (DCT)
(8SPD) - TBL
High Eff. Gearbox (+4%)
(DCT)
Imp. Auto Trans Cnrt./
Externals (IATC) - TBL
6-spd Auto Trans w/Imp
Internals (NAUTO) - TBL
AUTOMATIC DCT
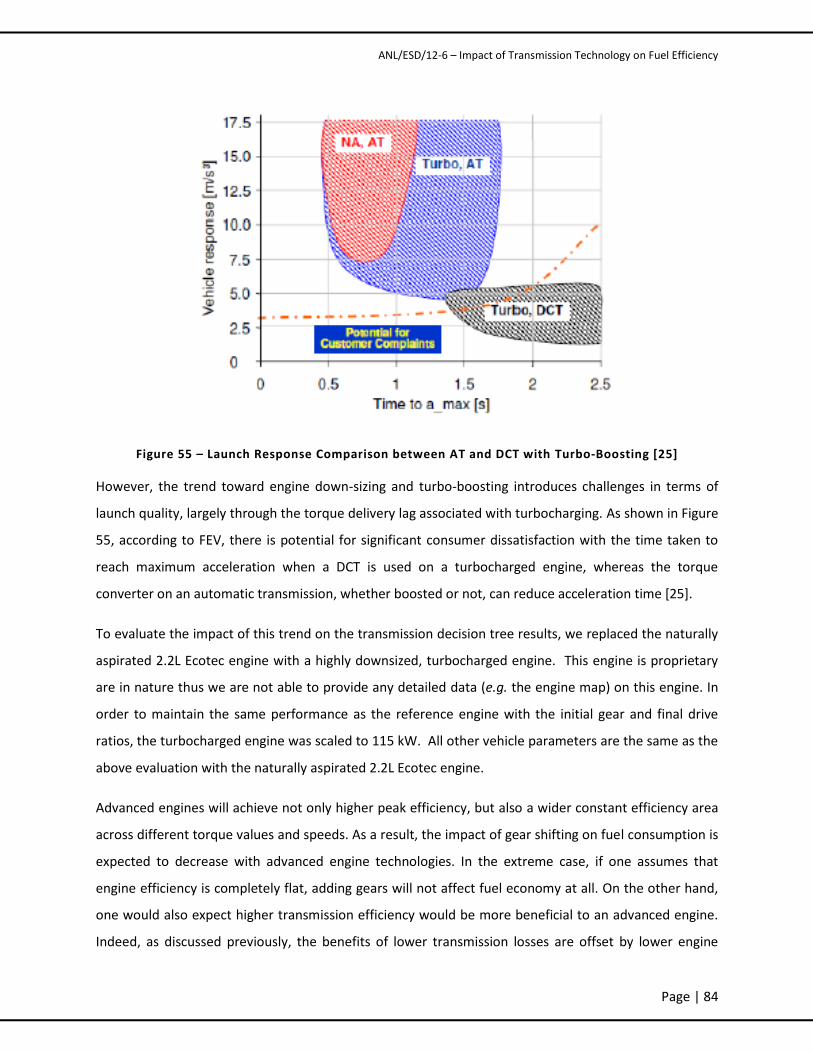
ANL/ESD/12-6 – Impact of Transmission Technology on Fuel Efficiency
Page | 84
Figure 55 – Launch Response Comparison between AT and DCT with Turbo-Boosting [25]
However, the trend toward engine down-sizing and turbo-boosting introduces challenges in terms of
launch quality, largely through the torque delivery lag associated with turbocharging. As shown in Figure
55, according to FEV, there is potential for significant consumer dissatisfaction with the time taken to
reach maximum acceleration when a DCT is used on a turbocharged engine, whereas the torque
converter on an automatic transmission, whether boosted or not, can reduce acceleration time [25].
To evaluate the impact of this trend on the transmission decision tree results, we replaced the naturally
aspirated 2.2L Ecotec engine with a highly downsized, turbocharged engine. This engine is proprietary
are in nature thus we are not able to provide any detailed data (e.g. the engine map) on this engine. In
order to maintain the same performance as the reference engine with the initial gear and final drive
ratios, the turbocharged engine was scaled to 115 kW. All other vehicle parameters are the same as the
above evaluation with the naturally aspirated 2.2L Ecotec engine.
Advanced engines will achieve not only higher peak efficiency, but also a wider constant efficiency area
across different torque values and speeds. As a result, the impact of gear shifting on fuel consumption is
expected to decrease with advanced engine technologies. In the extreme case, if one assumes that
engine efficiency is completely flat, adding gears will not affect fuel economy at all. On the other hand,
one would also expect higher transmission efficiency would be more beneficial to an advanced engine.
Indeed, as discussed previously, the benefits of lower transmission losses are offset by lower engine

ANL/ESD/12-6 – Impact of Transmission Technology on Fuel Efficiency
Page | 85
efficiency (because the current engines would operate at lower efficiency to provide a lower load). But
the wider constant efficiency area of advanced engines would not penalize higher-efficiency
transmissions (because advanced engine efficiency would remain very close despite operating at lower
loads).
Table 22 and Table 23 list the fuel consumption and fuel economy results for the advanced
turbocharged engine.
Table 22 – Fuel Consumption Results (L/100 km) and Percentage Improvement for Automatic
Transmissions with Downsized Turbocharged Engine
Fuel Consumption Results
Conventional – Automatic Transmission FTP HFET Combined
5-speed – 92% efficiency 6.33 4.88 5.58
6-speed – 92% efficiency 6.33 4.83 5.55
Improvement (%) 0 1.03 0.49
6-speed – 92% efficiency 6.33 4.83 5.55
8-speed – 92% efficiency 6.33 4.81 5.54
Improvement (%) 0 0.31 0.17
8-speed – 92% efficiency 6.33 4.81 5.54
8-speed – 96% efficiency 6.10 4.65 5.35
Improvement (%) 3.63 3.38 3.50

ANL/ESD/12-6 – Impact of Transmission Technology on Fuel Efficiency
Page | 86
Table 23 – Fuel Economy Results (mpg) and Percentage Improvement for Automatic Transmissions
with Downsized Turbocharged Engine
Fuel Economy Results
Conventional – Automatic Transmission FTP HFET Combined
5-speed – 92% efficiency 37.16 48.23 41.44
6-speed – 92% efficiency 37.13 48.73 41.58
Improvement (%) 0 1.04 0.35
6-speed – 92% efficiency 37.13 48.73 41.58
8-speed – 92% efficiency 37.14 48.88 41.64
Improvement (%) 0 0.31 0.13
8-speed – 92% efficiency 37.14 48.88 41.64
8-speed – 96% efficiency 38.54 50.59 43.17
Improvement (%) 3.77 3.50 3.67
Figure 56 shows the updated decision tree based on the advanced engine technology. The fuel
consumption improvement due to advanced transmission, combined with an advanced engine, is 5.2%.
This value is lower than the 6.9% previously simulated for the reference engine.

ANL/ESD/12-6 – Impact of Transmission Technology on Fuel Efficiency
Page | 87
Figure 56 – Transmission Decision Tree with Downsized Turbocharged Engine
IATC
INC % 1.1% $
ABS % 1.1% $
NAUTO
INC % 0.5% $
ABS % 1.6% $
6SPD DCT
INC % 3.7% $
ABS % 5.2% $
8SPD 8SPD DCT
INC % 0.2% $ INC % 2.1% $
ABS % 1.8% $ ABS % 7.2% $
HETRANS HETRANS
INC % 3.5% $ INC % 2.8% $
ABS % 5.2% $ ABS % 9.8% $
SHFTOPT SHFTOPT
INC % 0.0% $ INC % 0.0% $
ABS % 0.0% $ ABS % 0.0% $
Shift Optimizer
(SHFTOPT) - TBL
SIMULATIONAuto Trans
High Eff. Gearbox (+4%)
(Auto) - (HETRANS) - TBL
6-spd Auto Trans w/Imp
Internals (NAUTO) - TBL
8-spd Trans (Auto)
(8SPD) - TBL
Imp. Auto Trans Cnrt./
Externals (IATC) - TBL
Shift Optimizer
(SHFTOPT) - TBL
6-spd Dual Clutch Trans
(DCT) - TBL
8-spd Trans (DCT)
(8SPD) - TBL
High Eff. Gearbox (+4%)
(DCT)
AUTOMATIC DCT

ANL/ESD/12-6 – Impact of Transmission Technology on Fuel Efficiency
Page | 88
6.1.2. Expert and Literature Analysis
Because numerous assumptions have been made in the study, ranging from component technology
(e.g., engine efficiency, gearbox and final drive ratio selection) to sizing and control (i.e., shifting), it is
important to consider the uncertainties associated with these results. Because too much additional time
would be required to quantify the uncertainty associated with each assumption, we turned to literature
reviews [19, 20, 21, 22], as well as discussions with experts, to provide low and high values.
Table 24 and Table 25 summarize the fuel consumption improvement ranges for each step in the
automatic-transmission and DCT paths of the decision tree shown in Figure 53. The associated decision
trees are presented in Figure 57 and Figure 58.
Table 24 – Fuel Consumption Improvement Summary, Automatic Transmission Path
Patha Low Simulation High
IATC Incremental 1.0% 1.4% 3.0%
Absolute 1.0% 1.4% 3.0%
NAUTO Incremental 0.5% 0.8% 0.8%
Absolute 1.5% 2.2% 3.8%
8-speed Incremental 0.2% 1.9% 3.5%
Absolute 1.7% 4% 7.1%
HETRANS Incremental 3.0% 3.0% 3.1%
Absolute 4.6% 6.9% 10.0%
a ITAC: Aggressive torque converter lockup
NAUTO: 5- to 6-speed automatic
8-speed: 6 -to 8-speed automatic
HETRANS: High-efficiency 8-speed automatic

ANL/ESD/12-6 – Impact of Transmission Technology on Fuel Efficiency
Page | 89
Table 25 – Fuel Consumption Improvement Summary – DCT Path
Patha Low Simulation High
IATC Incremental 1.0% 1.4% 3.0%
Absolute 1.0% 1.4% 3.0%
NAUTO Incremental 0.5% 0.8% 0.8%
Absolute 1.5% 2.2% 3.8%
6-speed DCT Incremental 3.0% 3.7% 4.4%
Absolute 4.5% 5.8% 8.0%
8-speed DCT Incremental 1.0% 2.1% 3.3%
Absolute 5.4% 7.8% 11%
HETRANS Incremental 2.5% 2.8% 3.3%
Absolute 7.8% 10.3% 14.0%
a ITAC: Aggressive torque converter lockup
NAUTO: 5 to 6-speed automatic
6-speed DCT: 6-speed automatic to 6-speed DCT
8-speed DCT: 6 to 8-speed DCT
HETRANS: High-efficiency 8-speed DCT

ANL/ESD/12-6 – Impact of Transmission Technology on Fuel Efficiency
Page | 90
IATC
INC % 1.0% $
ABS % 1.0% $
NAUTO
INC % 0.5% $
ABS % 1.5% $
6SPD DCT
INC % 3.0% $
ABS % 4.5% $
8SPD 8SPD DCT
INC % 0.2% $ INC % 1.0% $
ABS % 1.7% $ ABS % 5.4% $
HETRANS HETRANS
INC % 3.0% $ INC % 2.5% $
ABS % 4.6% $ ABS % 7.8% $
SHFTOPT SHFTOPT
INC % 0.0% $ INC % 0.0% $
ABS % 0.0% $ ABS % 0.0% $
High Eff. Gearbox (+4%)
(Auto) - (HETRANS) - TBL
Shift Optimizer
(SHFTOPT) - TBL
Shift Optimizer
(SHFTOPT) - TBL
High Eff. Gearbox (+4%)
(DCT)
LOW RANGEAuto Trans
Imp. Auto Trans Cnrt./
Externals (IATC) - TBL
6-spd Auto Trans w/Imp
Internals (NAUTO) - TBL
6-spd Dual Clutch Trans
(DCT) - TBL
8-spd Trans (Auto)
(8SPD) - TBL
8-spd Trans (DCT)
(8SPD) - TBL
AUTOMATIC DCT
Figure 57 – Low-Range Estimates Decision Tree

ANL/ESD/12-6 – Impact of Transmission Technology on Fuel Efficiency
Page | 91
IATC
INC % 3.0% $
ABS % 3.0% $
NAUTO
INC % 0.8% $
ABS % 3.8% $
6SPD DCT
INC % 4.4% $
ABS % 8.0% $
8SPD 8SPD DCT
INC % 3.5% $ INC % 3.3% $
ABS % 7.1% $ ABS % 11.0% $
HETRANS HETRANS
INC % 3.1% $ INC % 3.3% $
ABS % 10.0% $ ABS % 14.0% $
SHFTOPT SHFTOPT
INC % 0.0% $ INC % 0.0% $
ABS % 0.0% $ ABS % 0.0% $
8-spd Trans (Auto)
(8SPD) - TBL
HIGH RANGEAuto Trans
Imp. Auto Trans Cnrt./
Externals (IATC) - TBL
6-spd Auto Trans w/Imp
Internals (NAUTO) - TBL
6-spd Dual Clutch Trans
(DCT) - TBL
8-spd Trans (DCT)
(8SPD) - TBL
High Eff. Gearbox (+4%)
(Auto) - (HETRANS) - TBL
Shift Optimizer
(SHFTOPT) - TBL
Shift Optimizer
(SHFTOPT) - TBL
High Eff. Gearbox (+4%)
(DCT)
AUTOMATIC DCT
Figure 58 – High-Range Estimates Decision Tree

ANL/ESD/12-6 – Impact of Transmission Technology on Fuel Efficiency
Page | 92
7. Simulation Results for Additional Vehicle Classes
Previous sections of the report focused solely on the mid-size car class. Because the effectiveness of the
technology depends on the vehicle class, this section focuses on additional vehicle classes. Because of
the high number of potential simulations, we did not simulate all vehicle classes, but rather evaluated
the following four major options: compact car, small sport utility vehicle (SUV), mid-size SUV, and pickup
truck.
The same two transmission technologies (automatic transmission and DCT) were considered as potential
options for each additional vehicle class. Because of the high input transmission torque for the mid-size
SUV and the pickup truck, only automatic transmissions were considered for those classes. We
employed the same process used for the mid-size car to evaluate the other vehicle classes.
For all the other classes, the study process consists of starting from a reference vehicle and changing the
transmission technology and/or efficiency step by step. The baseline does not change except for the
transmission properties. In addition, the final drive ratio was adjusted to produce similar performance
for all the transmissions. The performance target (0 to 60 mph in 9.5 sec) is maintained constant for all
the vehicles. For the mid-size car, the main goal is to make all the steps comparable and consistent.
The main difference resides in the assumptions used (e.g., vehicle weight, engine power, vehicle losses,
tire losses), as well as the transmission and final drive ratios.
7.1. Compact Car Class
Figure 59 shows the transmission steps for the compact class. Because of the low transmission input
torque, Argonne researchers decided that most transmissions are likely to be DCT in the near future. As
a result, the following steps were implemented:
Step 1: Going from 5-speed transmission with aggressive lockup to 6-speed transmission with
the same efficiency.
Step 2: Going from 6-speed automatic transmission to 6-speed DCT with the same efficiency.
Step 3: Going from 6-speed DCT to 8-speed DCT with the same efficiency.
Step 4: Going from 8-speed DCT to 8-speed DCT with higher efficiency (+4% efficiency).

ANL/ESD/12-6 – Impact of Transmission Technology on Fuel Efficiency
Page | 93
Imp. Auto Trans Cnrt./
Externals (IATC) - TBL
6-spd Auto Trans w/Imp
Internals (NAUTO) - TBL
6-spd Dual Clutch Trans
(dry DCT)
8-spd Trans (dry DCT)
Reference 5spd
Dry DCT
High Eff. Gearbox (+4%)(DCT)
Figure 59 – Compact Car Decision Tree Definition
Vehicle Assumptions/Specifications
The baseline vehicle chosen is a conventional compact vehicle with an automatic 5-speed gearbox and a
test weight of 1,356 kg. The engine power was sized to meet vehicle performance targets. Table 26
provides other specifications.

ANL/ESD/12-6 – Impact of Transmission Technology on Fuel Efficiency
Page | 94
Table 26 – Compact Car Specifications
Component Value
Final Drive Ratio 4.7
Engine Power (kW) 98
Test Weight (kg) 1356
Drag coefficient 0.31
Frontal area (m²) 2.193
Rolling-resistance coefficient 1 0.0075
Rolling-resistance coefficient 2 (speed term) 0.00012
Transmission Selection
Table 27 shows the transmission and final ratios for the different gear numbers considered. Note that
the same ratios are used for the 8-speed automatic transmission and the DCT.
Table 27 – Compact Car Gearbox Ratios
Transmission Ratio Final Drive Ratio
5-speed [0, 2.56, 1.55, 1.02, 0.72, 0.52] 4.7
6-speed [0, 4.15, 2.37, 1.56, 1.16, 0.86, 0.52] 3.8 (Automatic) / 3.6 (DCT)
8-speed [0, 4.6, 2.72, 1.86, 1.46, 1.23, 1, 0.82, 0.52] 3.3
For the compact car, aggressive/early torque-convertor lockup was applied. Figure 60 shows the torque
converter lockup strategy on the FTP cycle for the compact vehicle class. The blue line represents the
normal lockup strategy; note that the lockup occurs only twice during the entire cycle. The reason is
that, as in the mid-size car anlysis, the normal strategy locks the torque converter around 40 mph only,
something that happens rarely on the FTP cycle. On the other hand, the green line illustrates how often
the torque converter is locked up using an aggressive-lockup logic (i.e., lockup occurs as soon as the
second gear is engaged). Because the other vehicle classes show similar patterns, only the overall fuel
consumption benefits are shown.
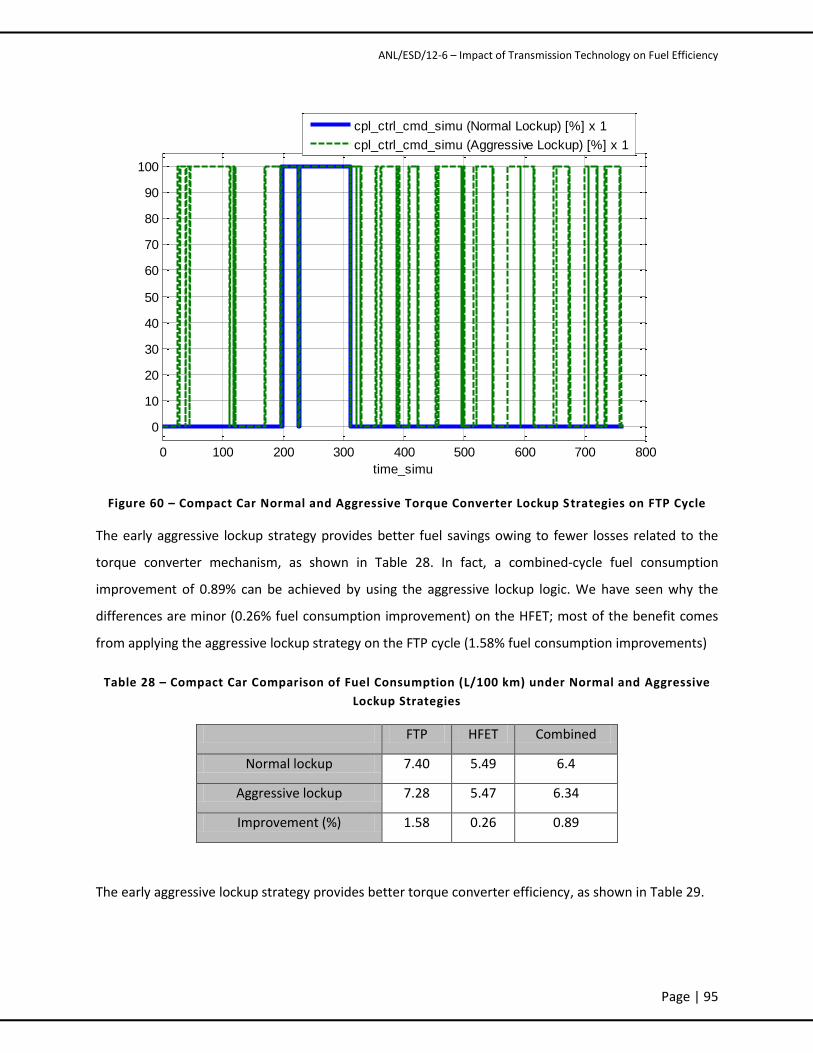
ANL/ESD/12-6 – Impact of Transmission Technology on Fuel Efficiency
Page | 95
Figure 60 – Compact Car Normal and Aggressive Torque Converter Lockup Strategies on FTP Cycle
The early aggressive lockup strategy provides better fuel savings owing to fewer losses related to the
torque converter mechanism, as shown in Table 28. In fact, a combined-cycle fuel consumption
improvement of 0.89% can be achieved by using the aggressive lockup logic. We have seen why the
differences are minor (0.26% fuel consumption improvement) on the HFET; most of the benefit comes
from applying the aggressive lockup strategy on the FTP cycle (1.58% fuel consumption improvements)
Table 28 – Compact Car Comparison of Fuel Consumption (L/100 km) under Normal and Aggressive
Lockup Strategies
FTP HFET Combined
Normal lockup 7.40 5.49 6.4
Aggressive lockup 7.28 5.47 6.34
Improvement (%) 1.58 0.26 0.89
The early aggressive lockup strategy provides better torque converter efficiency, as shown in Table 29.
0 100 200 300 400 500 600 700 800
0
10
20
30
40
50
60
70
80
90
100
time_simu
cpl_ctrl_cmd_simu (Normal Lockup) [%] x 1
cpl_ctrl_cmd_simu (Aggressive Lockup) [%] x 1

ANL/ESD/12-6 – Impact of Transmission Technology on Fuel Efficiency
Page | 96
Table 29 – Compact Car Torque Converter Efficiency
FTP HFET
Normal lockup torque converter efficiency 87.7% 92.5%
Aggressive lockup torque converter efficiency 89.7% 92.9%
Simulation Results
Detailed signals will not be illustrated in the following sections because the behavior of the compact car
class is quite similar to that of the mid-size car.
Table 30 summarizes the main simulation results. The average engine speed decreases with an increase
in the number of gears. Average transmission efficiencies are very close to the defined efficiency
because some losses occur during shifting.
Table 30 – Compact Car Summary of FTP Efficiencies and Speeds for Automatic
5-speed, 92%
efficiency
6-speed, 92%
efficiency
6-speed DCT, 92% efficiency
8-speed DCT, 92% efficiency
8-speed DCT, 96% efficiency
FTP Average engine efficiency (%)
23.45 23.47 21.61 21.68 21.33
Average transmission efficiency (%)
91.18 91.12 92 92 96
Torque converter/clutch
efficiency (%)
89.76 90.37 97.25 98.17 98.12
Average engine speed (rpm)
1,462 1,464 1,434 1,416 1,412
HFET Average engine efficiency (%)
26.49 27.16 26.04 26.67 26.34
Average transmission efficiency (%)
91.93 91.93 92 92 96
Torque converter/clutch
efficiency (%)
92.91 93.76 99.91 99.92 99.89
Average engine speed (rpm)
1,965 1,750 1,910 1,761 1,757

ANL/ESD/12-6 – Impact of Transmission Technology on Fuel Efficiency
Page | 97
Table 31 and Table 32 summarize the output fuel consumption and fuel economy results for the
compact car.
Table 31 – Compact Car Fuel Consumption Results (L/100 km) and Percentage Improvement
Fuel Consumption Results
Conventional – Automatic Transmission FTP HFET Combined
5-speed – 92% AU 7.28 5.47 6.34
6-speed – 92% AU 7.25 5.29 6.21
Improvement (%) 0.52 3.39 2.04
6-speed – 92% AU 7.25 5.29 6.21
6-speed – 92% DCT 6.79 5.20 5.97
Improvement (%) 6.29 1.68 3.91
6-speed – 92% DCT 6.79 5.20 5.97
8-speed – 92% DCT 6.71 5.07 5.86
Improvement (%) 1.20 2.46 1.85
8-speed – 92% DCT 6.71 5.07 5.86
8-speed – 96% DCT 6.54 4.92 5.70
Improvement (%) 2.53 2.95 2.75

ANL/ESD/12-6 – Impact of Transmission Technology on Fuel Efficiency
Page | 98
Table 32 – Compact Car Fuel Economy Results (mpg) and Percentage Improvement
Fuel Economy Results
Conventional – Automatic Transmission FTP HFET Combined
5-speed – 92% AU 32.29 42.97 36.36
6-speed – 92% AU 32.46 44.48 36.95
Improvement (%) 0.53 3.51 1.64
6-speed – 92% AU 32.46 44.48 36.95
6-speed – 92% DCT 34.64 45.24 38.72
Improvement (%) 6.72 1.71 4.79
6-speed – 92% DCT 34.64 45.24 38.72
8-speed – 92% DCT 35.06 46.38 39.39
Improvement (%) 1.21 2.52 1.71
8-speed – 92% DCT 35.06 46.38 39.39
8-speed – 96% DCT 35.97 47.79 40.47
Improvement (%) 2.60 3.04 2.76
The values in these fuel consumption tables are inputs for the decision tree provided in the introduction
of this section. Each improvement value represents a predefined step in the tree.
Transmission Decision Tree
Figure 61 shows the decision tree resulting from the Autonomie simulation values. All percentage
increases represent fuel consumption improvements. The incremental value represents the actual
improvement achieved by moving from one step to another; the absolute value signifies the overall
improvement compared with the reference baseline vehicle.
The transmission path gives a total fuel consumption improvement of 11% for a compact car.

ANL/ESD/12-6 – Impact of Transmission Technology on Fuel Efficiency
Page | 99
Figure 61 – Compact Car Transmission Decision Tree
INC % 0.9% $
ABS % 0.9% $
INC % 2.0% $
ABS % 2.9% $
INC % 3.9% $
ABS % 6.7% $
INC % 1.9% $
ABS % 8.4% $
INC % 2.7% $
ABS % 11.0% $
High Eff. Gearbox (+4%)
(DCT)
6-spd Dual Clutch Trans
(DCT) - TBL
8-spd Trans (DCT)
(8SPD) - TBL
Imp. Auto Trans Cnrt./
Externals (IATC) - TBL
6-spd Auto Trans w/Imp
Internals (NAUTO) - TBL
Compact

ANL/ESD/12-6 – Impact of Transmission Technology on Fuel Efficiency
Page | 100
7.2. Small SUV Class
Figure 62 shows the transmission steps for the small SUV class.
Step 1: Going from 5-speed transmission with aggressive lockup to 6-speed transmission with
the same efficiency.
Step 2: Going from 6-speed automatic transmission to 6-speed DCT with the same efficiency.
Step 3: Going from 6-speed DCT to 8-speed DCT with the same efficiency.
Step 4: Going from 8-speed DCT to 8-speed DCT with higher efficiency (+4% efficiency).
Imp. Auto Trans Cnrt./
Externals (IATC) - TBL
6-spd Auto Trans w/Imp
Internals (NAUTO) - TBL
6-spd Dual Clutch Trans
( wet DCT) - TBL
8-spd Trans (DCT)(8SPD) – (wet DCT)
High Eff. Gearbox (+4%)(DCT)
Reference 5spd
DCT
Figure 62 – Small SUV Decision Tree Definition
Vehicle Assumptions/Specifications
The baseline vehicle chosen is a conventional small SUV vehicle with an automatic 5-speed gearbox and
a test weight of 1,684 kg. The engine was sized to meet the vehicle performance targets. Other
specifications are given in Table 33.

ANL/ESD/12-6 – Impact of Transmission Technology on Fuel Efficiency
Page | 101
Table 33 – Small SUV Specifications
Component Value
Final Drive Ratio 4.7
Engine Power (kW) 98
Test Weight (kg) 1,684
Drag coefficient 0.4
Frontal area (m²) 2.57
Rolling-resistance coefficient 1 0.0084
Rolling-resistance coefficient 2 (speed term) 0.00012
Transmission Control
Table 34 shows the transmission and final ratios for the different gear numbers considered. Note that
the same ratios are used for the 8-speed automatic transmission and the DCT.
Table 34 – Small SUV Gearbox Ratios
Transmission Ratio Final Drive Ratio
5-speed [0, 2.56, 1.55, 1.02, 0.72, 0.52] 4.7
6-speed [0, 4.15, 2.37, 1.56, 1.16, 0.86, 0.52] 3.8 (Au) / 3.6 (DCT)
8-speed [0, 4.6, 2.72, 1.86, 1.46, 1.23, 1, 0.82, 0.52] 3.3
Again, aggressive/early torque-convertor lockup is applied (i.e., the lockup occurs as soon as the second
gear is engaged).
Torque Converter/Early Lockup
The early aggressive lockup strategy provides better fuel savings owing to fewer losses related to the
torque converter mechanism, as shown in Table 35. In fact, a combined-cycle fuel consumption
improvement of 0.88% can be achieved by using aggressive lockup logic. We have seen why the
differences are minor (0.21% fuel consumption improvement) on the HFET cycle; most of the benefit
comes from applying the aggressive lockup strategy on the FTP cycle (1.58% fuel consumption
improvements).
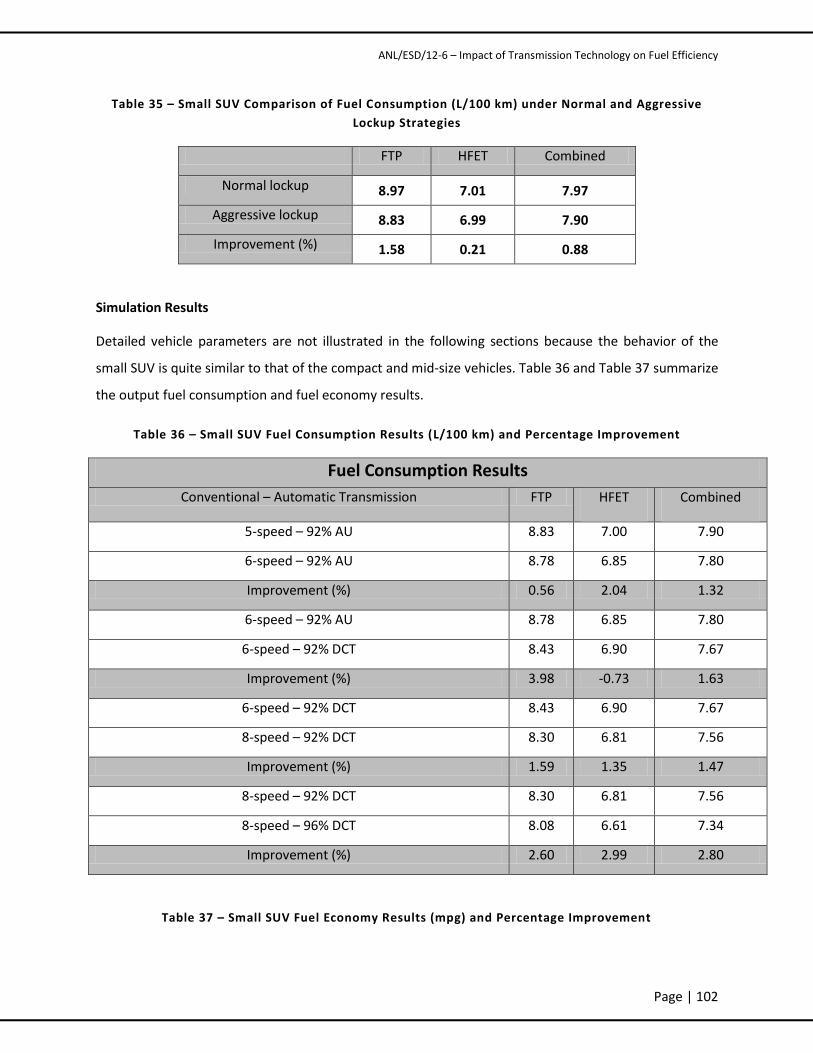
ANL/ESD/12-6 – Impact of Transmission Technology on Fuel Efficiency
Page | 102
Table 35 – Small SUV Comparison of Fuel Consumption (L/100 km) under Normal and Aggressive
Lockup Strategies
FTP HFET Combined
Normal lockup 8.97 7.01 7.97
Aggressive lockup 8.83 6.99 7.90
Improvement (%) 1.58 0.21 0.88
Simulation Results
Detailed vehicle parameters are not illustrated in the following sections because the behavior of the
small SUV is quite similar to that of the compact and mid-size vehicles. Table 36 and Table 37 summarize
the output fuel consumption and fuel economy results.
Table 36 – Small SUV Fuel Consumption Results (L/100 km) and Percentage Improvement
Fuel Consumption Results
Conventional – Automatic Transmission FTP HFET Combined
5-speed – 92% AU 8.83 7.00 7.90
6-speed – 92% AU 8.78 6.85 7.80
Improvement (%) 0.56 2.04 1.32
6-speed – 92% AU 8.78 6.85 7.80
6-speed – 92% DCT 8.43 6.90 7.67
Improvement (%) 3.98 -0.73 1.63
6-speed – 92% DCT 8.43 6.90 7.67
8-speed – 92% DCT 8.30 6.81 7.56
Improvement (%) 1.59 1.35 1.47
8-speed – 92% DCT 8.30 6.81 7.56
8-speed – 96% DCT 8.08 6.61 7.34
Improvement (%) 2.60 2.99 2.80
Table 37 – Small SUV Fuel Economy Results (mpg) and Percentage Improvement

ANL/ESD/12-6 – Impact of Transmission Technology on Fuel Efficiency
Page | 103
Fuel Economy Results
Conventional – Automatic Transmission FTP HFET Combined
5-speed – 92% AU 26.63 33.62 29.38
6-speed – 92% AU 26.78 34.32 29.72
Improvement (%) 0.56 2.08 1.16
6-speed – 92% AU 26.78 34.32 29.72
6-speed – 92% DCT 27.89 34.07 30.37
Improvement (%) 4.14 -0.72 2.19
6-speed – 92% DCT 27.89 34.07 30.37
8-speed – 92% DCT 28.34 34.54 30.83
Improvement (%) 1.61 1.36 1.51
8-speed – 92% DCT 28.34 34.54 30.83
8-speed – 96% DCT 29.10 35.60 31.70
Improvement (%) 2.67 3.09 2.84
These fuel consumption tables are inputs for the decision tree defined in the introduction of this
section. Each improvement value represents a predefined step in the tree.
Transmission Decision Tree
Figure 63 shows the decision tree resulting from the Autonomie simulation values. All percentage
increases represent fuel consumption improvements. The incremental value represents the actual
improvement achieved by moving from one step to another; the absolute value signifies the overall
improvement compared with the reference baseline vehicle.
The transmission path gives a total fuel consumption improvement of 8.5% for a small SUV.

ANL/ESD/12-6 – Impact of Transmission Technology on Fuel Efficiency
Page | 104
Figure 63 – Small SUV Transmission Decision Tree
INC % 1.1% $
ABS % 1.1% $
INC % 1.2% $
ABS % 2.2% $
INC % 2.2% $
ABS % 4.3% $
INC % 1.5% $
ABS % 5.8% $
INC % 2.8% $
ABS % 8.5% $
High Eff. Gearbox (+4%)
(DCT)
6-spd Dual Clutch Trans
(DCT) - TBL
8-spd Trans (DCT)
(8SPD) - TBL
Imp. Auto Trans Cnrt./
Externals (IATC) - TBL
6-spd Auto Trans w/Imp
Internals (NAUTO) - TBL
Small SUV

ANL/ESD/12-6 – Impact of Transmission Technology on Fuel Efficiency
Page | 105
7.3. Mid-Size SUV Class
Figure 64 shows the transmission steps for the mid-size SUV class. The steps are slightly different
compared with the three previous classes studied (compact, midsize, small SUV). DCTs have not been
considered for mid-size SUVs or pickups because of the high torque at the input shaft. As a result, the
following steps were implemented:
Step 1: Going from 5-speed transmission with aggressive lockup to 6-speed transmission with
the same efficiency.
Step 2: Going from 6-speed automatic transmission to 8-speed automatic with the same
efficiency.
Step 3: Going from 8-speed automatic to 8-speed automatic with higher efficiency (+4%
efficiency).
Imp. Auto Trans Cnrt./
Externals (IATC) - TBL
6-spd Auto Trans w/Imp
Internals (NAUTO) - TBL
8-spd Trans (Auto)(8SPD) - TBL
Reference 5spd
High Eff. Gearbox (+4%)
(Auto) - (HETRANS) - TBL
Automatic
Figure 64 – Mid-Size SUV Decision Tree Definition

ANL/ESD/12-6 – Impact of Transmission Technology on Fuel Efficiency
Page | 106
Vehicle Assumptions/Specifications
The baseline vehicle chosen is a conventional mid-size SUV vehicle with an automatic 5-speed gearbox
and a test weight of 1,876 kg. The engine was sized to meet the vehicle performance targets. Other
specifications are given in Table 38.
Table 38 – Mid-Size SUV Vehicle Specifications
Component Value
Final Drive Ratio 4.7
Engine Power (kW) 132
Test Weight (kg) 1,876
Drag coefficient 0.41
Frontal area (m²) 2.94
Rolling-resistance coefficient 1 0.0084
Rolling-resistance coefficient 2 (Speed term) 0.00012
Transmission and Control
Table 39 shows the transmission and final ratios for the different gear numbers considered. Note that
the same ratios are used for the 8-speed automatic transmission and the DCT.
Table 39 – Midsize SUV Gearbox Ratios
Trans. Ratio Final Drive Ratio
5-speed [0, 2.56, 1.55, 1.02, 0.72, 0.52] 4.7
6-speed [0, 4.15, 2.37, 1.56, 1.16, 0.86, 0.52] 3.8 (Automatic) / 3.6 (DCT)
8-speed [0, 4.6, 2.72, 1.86, 1.46, 1.23, 1, 0.82, 0.52] 3.3
Torque Converter/Early Lockup
The early aggressive lockup strategy provides better fuel savings owing to fewer losses related to the
torque converter mechanism, as shown in Table 40. In fact, a combined-cycle fuel consumption
improvement of 1.18 % can be achieved by using aggressive lockup logic. We have seen why the
differences are minor (0.23% fuel consumption improvement) on the HFET cycle; most of the benefit

ANL/ESD/12-6 – Impact of Transmission Technology on Fuel Efficiency
Page | 107
comes from applying the aggressive lockup strategy on the FTP cycle (2.13 % fuel consumption
improvement)
Table 40 – Midsize SUV Comparison of Fuel Consumption (L/100 km) under Normal and Aggressive
Lockup Strategies
FTP HFET Combined
Normal lockup 10.37 8.34 9.34
Aggressive lockup 10.15 8.32 9.23
Improvement (%) 2.13 0.23 1.18
Simulation Results
Detailed vehicle parameters will not be illustrated in the following sections because the behavior of the
mid-size SUV is quite similar to that of the compact and mid-size car and the small SUV. Table 41 and
Table 42 summarize the output fuel consumption and fuel economy results.
Table 41 – Mid-Size SUV Fuel Consumption Results (L/100 km) and Percentage Improvement
Fuel Consumption Results
Conventional – Automatic Transmission FTP HFET Combined
5-speed – 92% AU 10.15 8.32 9.24
6-speed – 92% AU 10.14 8.20 9.16
Improvement (%) 0.12 1.53 0.83
6-speed – 92% AU 10.14 8.20 9.16
8-speed – 92% AU 10.02 8.14 9.07
Improvement (%) 1.20 0.69 0.94
8-speed – 92% AU 10.02 8.14 9.07
8-speed – 96% AU 9.76 7.95 8.85
Improvement (%) 2.59 2.29 2.44

ANL/ESD/12-6 – Impact of Transmission Technology on Fuel Efficiency
Page | 108
Table 42 – Mid-Size SUV Fuel Economy Results (mpg) and Percentage Improvement
Fuel Economy Results
Conventional – Automatic Transmission FTP HFET Combined
5-speed – 92% AU 23.18 28.26 25.22
6-speed – 92% AU 23.20 28.70 25.39
Improvement (%) 0.12 1.55 0.69
6-speed – 92% AU 23.20 28.70 25.39
8-speed – 92% AU 23.48 28.90 25.65
Improvement (%) 1.21 0.70 1.01
8-speed – 92% AU 23.48 28.90 25.65
8-speed – 96% AU 24.11 29.57 26.30
Improvement (%) 2.66 2.35 2.53
These fuel consumption tables are inputs for the decision tree defined in the introduction of this
section. Each improvement value represents a predefined step in the tree.
Transmission Decision Tree
Figure 65 shows the decision tree resulting from the Autonomie simulation values. All percentage
increases represent fuel consumption improvements. The incremental value represents the actual
improvement achieved by moving from one step to another; the absolute value signifies the overall
improvement compared with the reference baseline vehicle.
The transmission path gives a total fuel consumption improvement of 5.5% for a mid-size SUV.

ANL/ESD/12-6 – Impact of Transmission Technology on Fuel Efficiency
Page | 109
Figure 65 – Mid-Size SUV Transmission Decision Tree
INC % 1.4% $
ABS % 1.4% $
INC % 0.7% $
ABS % 2.1% $
INC % 1.0% $
ABS % 3.1% $
INC % 2.5% $
ABS % 5.5% $
8-spd Auto Trans (Auto)
(8SPD) - TBL
High Eff. Gearbox (+4%)
(Auto) - (HETRANS) TBL
Imp. Auto Trans Cnrt./
Externals (IATC) - TBL
6-spd Auto Trans w/Imp
Internals (NAUTO) - TBL
Midsize SUV

ANL/ESD/12-6 – Impact of Transmission Technology on Fuel Efficiency
Page | 110
7.4. Pickup Truck Class
Figure 66 shows the transmission steps for the midsize SUV class. The steps are slightly different
compared with those for the compact and mid-size car and the small SUV but mirror the midsize SUV.
DCTs have not been considered for mid-size SUVs or pickups because of the high torque at the input
shaft. As a result, the following steps were implemented:
Step 1: Going from 5-speed transmission with aggressive lockup to 6-speed transmission with
the same efficiency.
Step 2: Going from 6-speed automatic transmission to 8-speed automatic with the same
efficiency.
Step 3: Going from 8-speed automatic to 8-speed automatic with higher efficiency (+4%
efficiency).
Imp. Auto Trans Cnrt./
Externals (IATC) - TBL
6-spd Auto Trans w/Imp
Internals (NAUTO) - TBL
8-spd Trans (Auto)(8SPD) - TBL
Reference 5spd
High Eff. Gearbox (+4%)
(Auto) - (HETRANS) - TBL
Automatic
Figure 66 – Pickup Truck Decision Tree Definition

ANL/ESD/12-6 – Impact of Transmission Technology on Fuel Efficiency
Page | 111
Vehicle Assumptions/Specifications
The baseline vehicle chosen is a conventional pickup truck with an automatic 5-speed gearbox and a test
weight of 2,141 kg. The engine was sized to meet the vehicle performance targets. Other specifications
are given in Table 43.
Table 43 – Pickup Truck Vehicle Specifications
Component Value
Final Drive Ratio 4.7
Engine Power (kW) 152
Test Weight (kg) 2141
Drag coefficient 0.45
Frontal area (m²) 3.27
Rolling-resistance coefficient 1 0.009
Rolling-resistance coefficient 2 (speed term) 0.00012
Transmission Selection
Table 44 shows the transmission and final ratios for the different gear numbers considered. Note that
the same ratios are used for the 8-speed automatic transmission and the DCT.
Table 44 – Pickup Truck Gearbox Ratios
Transmission Ratio Final Drive Ratio
5-speed [0, 2.56, 1.55, 1.02, 0.72, 0.52] 4.7
6-speed [0, 4.15, 2.37, 1.56, 1.16, 0.86, 0.52] 3.8 (Automatic) / 3.6 (DCT)
8-speed [0, 4.6, 2.72, 1.86, 1.46, 1.23, 1, 0.82, 0.52] 3.3
Again, aggressive/early torque-convertor lockup is applied (i.e., the lockup occurs as soon as the second
gear is engaged).

ANL/ESD/12-6 – Impact of Transmission Technology on Fuel Efficiency
Page | 112
Torque Converter/Early Lockup
The early aggressive lockup strategy provides better fuel savings owing to fewer losses related to the
torque converter mechanism, as shown in Table 45. In fact, a combined-cycle fuel consumption
improvement of 1.64 % can be achieved by using aggressive lockup logic. We have seen why the
differences are minor (0.29% fuel consumption improvement) on the HFET cycle; most of the benefit
comes from applying the aggressive lockup strategy on the FTP cycle (2.57 % fuel consumption
improvement).
Table 45 – Pickup Truck Comparison of Fuel Consumption (L/100 km) under Normal and Aggressive
Lockup Strategies
FTP HFET Combined
Normal lockup 19.58 23.62 21.21
Aggressive lockup 20.08 23.69 21.55
Improvement (%) 2.57 0.29 1.64
Simulation Results
Detailed vehicle parameters will not be illustrated in the following sections because the behavior of the
mid-size pickup truck is quite similar to that of the compact and mid-size car and small and mid-size SUV.
Table 46 and Table 47 summarize the output fuel consumption and fuel economy results. For this
vehicle, it is more beneficial to raise the transmission efficiency than to increase the number of gears, as
shown by considering the 0.49% fuel consumption improvement gained in moving from 5 to 6 speeds
(with the same transmission efficiency) compared with the almost 2.86% fuel consumption
improvement gained by increasing the transmission efficiency by 4%.

ANL/ESD/12-6 – Impact of Transmission Technology on Fuel Efficiency
Page | 113
Table 46 – Pickup Truck Fuel Consumption Results (l/100 km) and Percentage Improvement
Fuel Consumption Results
Conventional – Automatic Transmission FTP HFET Combined
5-speed – 92% AU 11.71 9.93 10.84
6-speed – 92% AU 11.70 9.84 10.78
Improvement (%) 0.14 0.85 0.49
6-speed – 92% AU 11.70 9.84 10.78
8-speed – 92% AU 11.56 9.66 10.62
Improvement (%) 1.15 1.89 1.52
8-speed – 92% AU 11.56 9.66 10.62
8-speed – 96% AU 11.25 9.37 10.32
Improvement (%) 2.71 3.02 2.86
Table 47 – Pickup Truck Fuel Economy Results (mpg) and Percentage Improvement
Fuel Economy Results
Conventional – Automatic Transmission FTP HFET Combined
5-speed – 92% AU 20.08 23.69 21.56
6-speed – 92% AU 20.11 23.89 21.65
Improvement (%) 0.14 0.86 0.43
6-speed – 92% AU 20.11 23.89 21.65
8-speed – 92% AU 20.34 24.35 21.97
Improvement (%) 1.17 1.93 1.47
8-speed – 92% AU 20.34 24.35 21.97
8-speed – 96% AU 20.91 25.11 22.61
Improvement (%) 2.78 3.11 2.92
These fuel consumption tables are inputs for the decision tree defined in the introduction of this
section. Each improvement value represents a predefined step in the tree.

ANL/ESD/12-6 – Impact of Transmission Technology on Fuel Efficiency
Page | 114
Transmission Decision Tree
Figure 67 shows the decision tree resulting from the Autonomie simulation values. All percentage
increases represent fuel consumption improvements. The incremental value represents the actual
improvement achieved by moving from one step to another; the absolute value signifies the overall
improvement starting compared with the reference baseline vehicle.
The transmission path gives a total fuel consumption improvement of 6.3% for a pickup truck.

ANL/ESD/12-6 – Impact of Transmission Technology on Fuel Efficiency
Page | 115
Figure 67 – Pickup Truck Transmission Decision Tree
INC % 1.6% $
ABS % 1.6% $
INC % 0.4% $
ABS % 2.1% $
INC % 1.5% $
ABS % 3.5% $
INC % 2.9% $
ABS % 6.3% $
8-spd Auto Trans (Auto)
(8SPD) - TBL
High Eff. Gearbox (+4%)
(Auto) - (HETRANS) TBL
Imp. Auto Trans Cnrt./
Externals (IATC) - TBL
6-spd Auto Trans w/Imp
Internals (NAUTO) - TBL
Pickup

ANL/ESD/12-6 – Impact of Transmission Technology on Fuel Efficiency
Page | 116
8. Summary
The objective of the study was to estimate the fuel consumption benefits offered by several advanced
transmissions. A full vehicle simulation tool was used to build and simulate different technologies. As
part of the process, Argonne researchers made a number of assumptions regarding the component
technologies (e.g., engine fuel rate map, transmission gear ratio), control (e.g., shifting, torque converter
lockup), and component sizing. As for any simulation study, the results are valid for the set of
assumptions considered. The transmission benefits for the different vehicle classes are summarized
below.
For the mid-size car, the automatic transmission provides a total fuel consumption improvement
of up to 6.9%; the DCT path provides a fuel consumption improvement of up to 10.3%.
For the compact car, the transmission provides a total fuel consumption improvement of up to
11%.
For a small SUV, the transmission provides a total fuel consumption improvement of up to 8.5%.
For a mid-size SUV, the transmission provides a total fuel consumption improvement of up to
5.5%
For a pickup truck, the transmission provides a total fuel consumption improvement of up to
6.3%
Different approaches were used to try to quantify the impact of uncertainties. A review of the literature,
combined with discussions with experts, was used to generate uncertainties for the mid-size car decision
tree. Advanced engine technologies (i.e., turbocharger) were also simulated for the mid-size car to
demonstrate the impact of future technologies. The uncertainties associated with transmission benefits
are summarized below:
When considering uncertainties based on experts and literature, the automatic transmission
benefits range from 5 to 11%, and the DCT benefits range from 7.5 to 13.5%.
Advanced engine technologies tend to decrease the transmission benefits, with a fuel
consumption improvement of 5.2% for the automatic transmission and 9.8% for the DCT. Both
of these values are within the ranges provided by the experts and in the literature.

Page | 117
INC % 0.9% $ INC % 1.4% $ INC % 1.1% $ INC % 1.4% $ INC % 1.6% $
ABS % 0.9% $ ABS % 1.4% $ ABS % 1.1% $ ABS % 1.4% $ ABS % 1.6% $
INC % 2.0% $ INC % 0.8% $ INC % 1.2% $ INC % 0.7% $ INC % 0.4% $
ABS % 2.9% $ ABS % 2.2% $ ABS % 2.2% $ ABS % 2.1% $ ABS % 2.1% $
INC % 3.9% $ INC % 3.7% $ INC % 2.2% $ INC % 1.0% $ INC % 1.5% $
ABS % 6.7% $ ABS % 5.8% $ ABS % 4.3% $ ABS % 3.1% $ ABS % 3.5% $
INC % 1.9% $ INC % 2.1% $ INC % 1.5% $ INC % 2.5% $ INC % 2.9% $
ABS % 8.4% $ ABS % 7.8% $ ABS % 5.8% $ ABS % 5.5% $ ABS % 6.3% $
INC % 2.7% $ INC % 2.8% $ INC % 2.8% $
ABS % 11.0% $ ABS % 10.3% $ ABS % 8.5% $
Small SUV Midsize SUV Pickup
High Eff. Gearbox (+4%)
(Auto) - (HETRANS) TBL
6-spd Auto Trans w/Imp
Internals (NAUTO) - TBL
8-spd Auto Trans (Auto)
(8SPD) - TBL
Imp. Auto Trans Cnrt./
Externals (IATC) - TBL
High Eff. Gearbox (+4%)
(DCT)
High Eff. Gearbox (+4%)
(DCT)
High Eff. Gearbox (+4%)
(Auto) - (HETRANS) TBL
Imp. Auto Trans Cnrt./
Externals (IATC) - TBL
6-spd Auto Trans w/Imp
Internals (NAUTO) - TBL
6-spd Dual Clutch Trans
(DCT) - TBL
8-spd Trans (DCT)
(8SPD) - TBL
8-spd Trans (DCT)
(8SPD) - TBL
Imp. Auto Trans Cnrt./
Externals (IATC) - TBL
6-spd Auto Trans w/Imp
Internals (NAUTO) - TBL
8-spd Auto Trans (Auto)
(8SPD) - TBL
6-spd Auto Trans w/Imp
Internals (NAUTO) - TBL
6-spd Dual Clutch Trans
(DCT) - TBL
Imp. Auto Trans Cnrt./
Externals (IATC) - TBL
Midsize Car
High Eff. Gearbox (+4%)
(DCT)
6-spd Dual Clutch Trans
(DCT) - TBL
8-spd Trans (DCT)
(8SPD) - TBL
Imp. Auto Trans Cnrt./
Externals (IATC) - TBL
6-spd Auto Trans w/Imp
Internals (NAUTO) - TBL
Compact

Page | 118
9. References
1. National Academies of Sciences “Assessment of Fuel Economy Technologies for Light Duty
Vehicles”, National Research Council, 2010
2. “Ricardo Computer Simulation of Light-Duty Vehicle Technologies for Greenhouse Gas Emission
Reduction in the 2020-2025 Timeframe (PDF)” can be found at
http://www.epa.gov/otaq/climate/publications.htm#vehicletechnologies
3. www.autonomie.net
4. Halbach, S., P. Sharer, P. Pagerit, C. Folkerts, and A. Rousseau, 2010, “Model Architecture,
Methods, and Interfaces for Efficient Math-Based Design and Simulation of Automotive Control
Systems,” Society of Automotive Engineers (SAE) 2010-01-0241, SAE World Congress, Detroit,
MI, April.
5. Kim, N., A. Rousseau, and E. Rask, 2012, “Autonomie Model Validation with Test Data for 2010
Toyota Prius,” SAE 2012-01-1040, SAE World Congress, Detroit, MI, April 12.
6. Kim, N., R. Carlson, F. Jehlik, and A. Rousseau, 2009, “Tahoe HEV Model Development in
Powertrain System Analysis Toolkit (PSAT),” SAE paper 2009-01-1307, SAE World Congress,
Detroit, MI, April.
7. Cao, Q., S. Pagerit, R. Carlson, and A. Rousseau, 2007, "PHEV Hymotion Prius Model Validation
and control improvements," 23rd International Electric Vehicle Symposium (EVS23), Anaheim,
CA, (Dec. 2007).
8. Rousseau, A., P. Sharer, S. Pagerit, and M. Duoba, 2006, "Integrating Data, Performing Quality
Assurance, and Validating the Vehicle Model for the 2004 Prius Using PSAT," SAE paper 2006-01-
0667, SAE World Congress, Detroit, MI April.
9. Moawad, A., N. Kim, and A. Rousseau, 2012, "Impact of Technology on Electric Drive Fuel
Consumption and Cost,” SAE 2012-01-1011, SAE World Congress, Detroit, MI, April 12.
10. Fellah, M., G. Singh, A. Rousseau, and S. Pagerit, 2009, “Impact of Real-World Drive Cycles on
Plug-In Hybrid Electric Vehicle (PHEV) Battery Requirements,” SAE paper 2009-01-1383, SAE
World Congress, Detroit, MI, April.
11. Sharer, P., A. Rousseau, S. Pagerit, and P. Nelson, 2007, "Midsize and SUV Vehicle Simulation
Results for Plug-in HEV Component Requirements," SAE paper 2007-01-0295, SAE World
Congress, Detroit, MI, April.
12. Sharer, P., A. Rousseau, P. Nelson, and S. Pagerit, 2006, "Vehicle Simulation Results for PHEV
Battery Requirements," 22nd International Electric Vehicle Symposium (EVS22), Yokohama,
Japan, Oct.
13. Ward, J., A. Moawad, N. Kim, and A. Rousseau, 2012, “Light-Duty Vehicle Fuel Consumption,
Cost and Market Penetration Potential by 2020,” EVS26, Los Angeles, CA, May.
14. Da Costa, A., N. Kim, F. Le Berr, N. Marc, F. Badin, and A. Rousseau, 2012, “Fuel Consumption
Potential of Different Plug-in Hybrid Vehicle Architectures in the European and American
Contexts,” EVS26, Los Angeles, CA, May.

ANL/ESD/12-6 – Impact of Transmission Technology on Fuel Efficiency
Page | 119
15. Moawad, A., N. Kim, and A. Rousseau, 2012, "Impact of Technology on Electric Drive Fuel
Consumption and Cost,” SAE 2012-01-1011, SAE World Congress, Detroit, MI, April 12.
16. Moawad, A., and A. Rousseau, 2011, “Impact of Vehicle Performance on Cost Effective Way to
Meet CAFE 2017–2025,”Vehicle Power and Propulsion Conference, 2011, Chicago, IL, Sept.
17. Elgowainy, A., A. Burnham, M. Wang, J. Molburg, and A. Rousseau, 2009, “Well-To-Wheels
Energy Use and Greenhouse Gas Emissions of Plug-in Hybrid Electric Vehicles,” SAE 2009-01-
1309, SAE World Congress, Detroit, MI, April.
18. Gaines, L., A. Burnham, A. Rousseau, and D. Santini, 2007, "Sorting through the Many Total-
Energy-Cycle Pathways Possible with Early Plug-In Hybrids," EVS23, Anaheim, CA, Dec.
19. World Academy of Science, 2011, “Simulation and Analysis of the Shift Process for an Automatic
Transmission,” Engineering and Technology 76, April.
20. Kulkarni et al., 2007, “Shift Dynamics and Control of Dual-Clutch Transmissions,” Mechanism
and Machine Theory, 42, pp. 168–182
21. Moawad, A., 2011, How to Meet CAFE 2017–2025, DOE Report, Feb.
22. The National Academies Press, Assessment of Fuel Economy Technologies for Light-Duty
Vehicles, available at www.nap.edu/catalog/12924.html, accessed June 2012.
23. Duleep, K.G., 2007, Technologies to Improve Light-Duty Fuel Economy, Report for the National
Academies of Science, Sept.
24. AutoSector Research, Transmissions Report, 2012 Edition.
25. FEV, 2011, 6th International CTI Symposium and Exhibition, “Innovative Automotive
Transmissions and Hybrid & Electric Drive, North America,” May.

Page | 120
APPENDIX 1 – Peer Review Comments and Responses
Comment # Reviewer Comment summary Response Related Report Section(s)
1 Midlam-Mohler
Show the impact of running simulation with the same top gear ratio & how it impacts results
Modified report. The transmissions currently on the market all have a lower top gear ratio with higher gear number. Running simulations with the same top gear would not only significantly limit the benefits of transmissions with higher gear number but also does not represent the technology currently in the market
p29-30
2 Midlam-Mohler
Show impact of using a complete transmission efficiency map vs. using a constant value
Modified report. An efficiency for the gearbox (i.e., not including the torque converter) of 92% was selected for the study. A constant value was selected after running simulations using several proprietary detailed transmission data to provide transparent results.
p29
3 Midlam-Mohler
Is transmission warm-up considered?
Modified report. As for all the other models, the study assumed that all components are fully warmed-up. As a result, the potential difference in warm-up between all the different transmission technologies is not considered.
p29
4 Midlam-Mohler
In moving from a 92% efficiency transmission to a 96% efficient transmission you are cutting the internal heat generation in two. This will have an impact of warm-up time and thus efficiency potentially costing you significant fuel consumption on the first bag of the FTP.
All the simulations are performed under hot conditions p29
5 Midlam-Mohler
Describe torque converter model and data
Modified report. p42-43

ANL/ESD/12-6 – Impact of Transmission Technology on Fuel Efficiency
Page | 121
Comment # Reviewer Comment summary Response Related Report Section(s)
6 Midlam-Mohler
List final drive ratio efficiency Modified report. A constant value of 97.5% is used to represent the final drive ratio efficiency.
p31
7 Midlam-Mohler
Prove that improvements made do not lead to drivability issues
The shifting maps have been developed to ensure minimum fuel consumption across all transmissions while maintaining an acceptable drivability. While plant models with higher degree of fidelity would be necessary to accurately model the impact of each technology on the drivability, using such models was not appropriate for the current study. As a result, the work related to the drive quality was focused on number of shifting events, time in between shifting events, engine time response and engine torque reserve.
p40-42
8 Midlam-Mohler
Point to other sources to explain drivability in terms of comparisons made on p.73
Modified report by adding section 4.5.1.4. The shifting maps have been developed to ensure minimum fuel consumption across all transmissions while maintaining an acceptable drivability. While plant models with higher degree of fidelity would be necessary to accurately model the impact of each technology on the drivability, using such models was not appropriate for the current study. As a result, the work related to the drive quality was focused on number of shifting events, time in between shifting events, engine time response and engine torque reserve.
p40-42

ANL/ESD/12-6 – Impact of Transmission Technology on Fuel Efficiency
Page | 122
Comment #
Reviewer Comment summary Response Related Report
Section(s)
9 Midlam-Mohler
Try to get other publications, esp. for DCT While additional publications and references would have been desirable, due the time constraints placed on the publication of the report, additional references were not able to be researched.
10 Midlam-Mohler
Looks like the 5 speed auto has 89 shifts while current vehicles have 100 to 110 --> what is the impact of being more aggressive?
The impact of adding 10 shifts on the UDDS (which has 18 segments) would be minimal on the fuel consumption.
11 Midlam-Mohler
Explain why DCT and auto trans have same avg. efficiency (or if not, explain assumptions/modeling of this)
The gearboxes have the same efficiency but this does not include the torque converter losses of the automatic transmissions.
12 Midlam-Mohler
Explain that additional/different sim would be required for more fine analysis of launch performance and drivability.
Modified report by adding section 4.5.1.4. While plant models with higher degree of fidelity would be necessary to accurately model the impact of each technology on the drivability, using such models was not appropriate for the current study. As a result, the work related to the drive quality was focused on number of shifting events, time in between shifting events, engine time response and engine torque reserve.
p40-42
13 Midlam-Mohler
Additional validation data should be presented to give full confidence in the tool's ability to predict fuel economy gains.
The plant models and control strategies used for all the powertrain configurations considered have been validated based on vehicle test data. Detailed information can be found at http://www.autonomie.net/overview/papers_validation.html

ANL/ESD/12-6 – Impact of Transmission Technology on Fuel Efficiency
Page | 123
Comment #
Reviewer Comment summary Response Related Report
Section(s)
14 Midlam-Mohler
Limiting DCTs to smaller vehicles may not be valid; they've been applied to larger trucks, too.
The scope of this report was predicated by the joint, NHTSA and EPA, technology related assumptions that were made for each agencies respective MYs 2017-2025 Fuel Economy/GHG standards. The agencies made the determination that based on current data and technology projections there is a high likelihood that large vehicles with towing requirements may still require the torque multiplication found in automatic transmissions with torque converters. While it is possible that DCTs can be used on larger vehicles the agencies have assumed that a majority of these vehicles will still use automatic transmissions.
15 Bell Run several BSFC maps for two cases (i.e., 5 and 6 speeds) to show the range of benefits
Modified report by adding section 6.1.1.1 with one more bsfc map for final report (total: 2 maps).
p83-84
16 Bell Is vehicle weight impacted by the type of transmission?
The vehicle weight is calculated based on all the other component weights (i.e., clutch, torque converter, gearbox in the case of the transmission). However, due to the small change of the total transmission weight compared to the vehicle weight, the impact on the fuel consumption and performance is not significant.
17 Bell Impact of lower firing frequency and vibration levels not addressed in the simulation.
While Noise, Vibration and Harshness (NVH) evaluations and the implementation of subsequent mitigation solutions can impact the effectiveness of technologies, NVH analyses are more appropriate when evaluating specific vehicles. Given that these results are used to inform fleet modeling and thus applied to numerous vehicles, detailed NVH analyses are likely not to improve the accuracy of the results.
18 Bell Omitting multi-gear downshifts because they did not occur on the FTP could lead to real world acceptability issues.
Only FTP and HFET drive cycles were simulated for this report because these are the only cycles used for CAFE compliance testing.

ANL/ESD/12-6 – Impact of Transmission Technology on Fuel Efficiency
Page | 124
Comment # Reviewer Comment summary Response Related Report
Section(s)
19 Bell Additional validation test data could have been presented.
The plant models and control strategies used for all the powertrain configurations considered have been validated based on vehicle test data. Detailed information can be found at http://www.autonomie.net/overview/papers_validation.html

DOT HS 811 667 August 2012