Embed Size (px)
Citation preview
Impact of the Quality of First Food on the Digestive Enzymes and Development of the Anterior
Intestine, Liver and Pancreas of Genetically Male Nile Tilapia (GMT),
Oreochromis niloticus L.
Evangeline E. JaravataAnnabelle A. Herrera
Jose S. Abucay

INTRODUCTIONINTRODUCTION
Aquaculture is the fastest animal production sector in the world
It has been dedicated in finding and answering the continuous demands for quality “aqua”foods for human consumptions
Malnutrition is the no.1 cause of deaths
Tilapias are emerging as one of the important cultured food fish
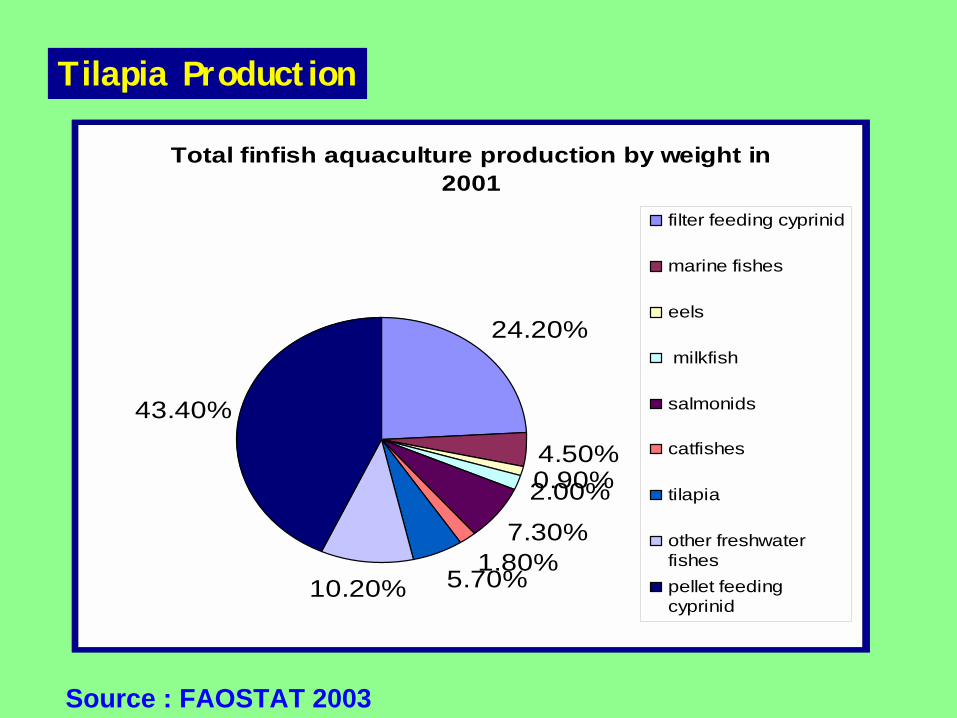
Tilapia Production
Total finfish aquaculture production by weight in 2001
4.50%0.90%2.00%
7.30%1.80%
5.70%10.20%
43.40%
24.20%
filter feeding cyprinid
marine fishes
eels
milkfish
salmonids
catfishes
tilapia
other freshwaterfishespellet feedingcyprinid
Source : FAOSTAT 2003

GMT Production
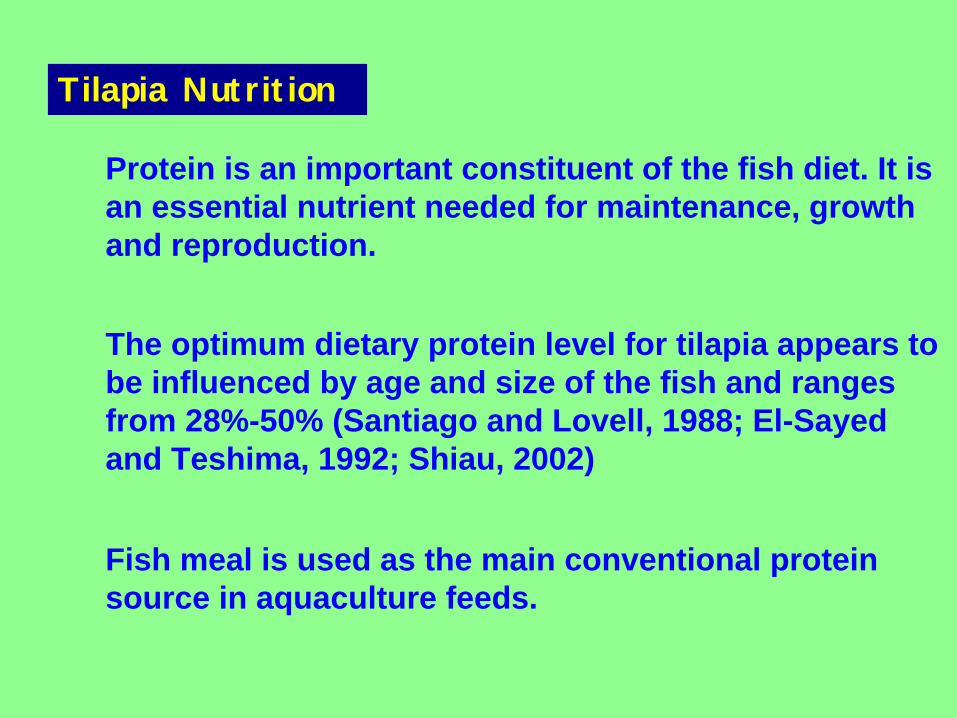
Tilapia Nutrition
Protein is an important constituent of the fish diet. It is an essential nutrient needed for maintenance, growth and reproduction.
The optimum dietary protein level for tilapia appears to be influenced by age and size of the fish and ranges from 28%-50% (Santiago and Lovell, 1988; El-Sayedand Teshima, 1992; Shiau, 2002)
Fish meal is used as the main conventional protein source in aquaculture feeds.
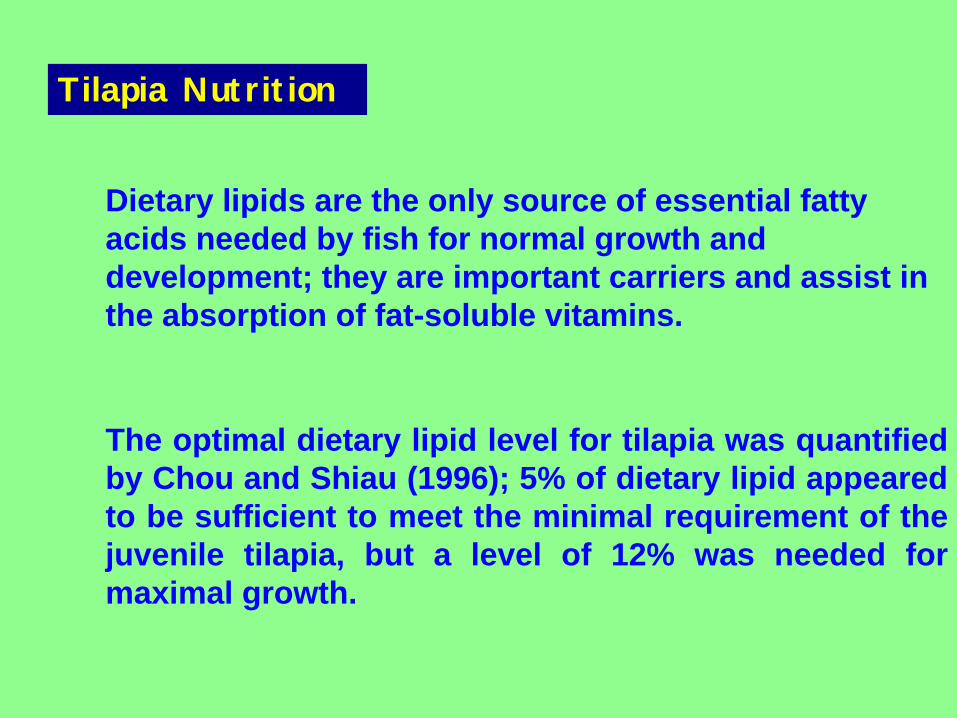
Tilapia Nutrition
Dietary lipids are the only source of essential fatty acids needed by fish for normal growth and development; they are important carriers and assist in the absorption of fat-soluble vitamins.
The optimal dietary lipid level for tilapia was quantified by Chou and Shiau (1996); 5% of dietary lipid appeared to be sufficient to meet the minimal requirement of the juvenile tilapia, but a level of 12% was needed for maximal growth.

Tilapia Nutrition
Carbohydrates are poorly utilized by fish and the main sources of energy in fish appear to be protein and lipids, in contrast to mammals in which carbohydrates and lipids are more important (Ogunji and Wirth, 2000).
Cereal grain products are generally used as carbohydrate source in feed formulation.
Tilapia Nutrition
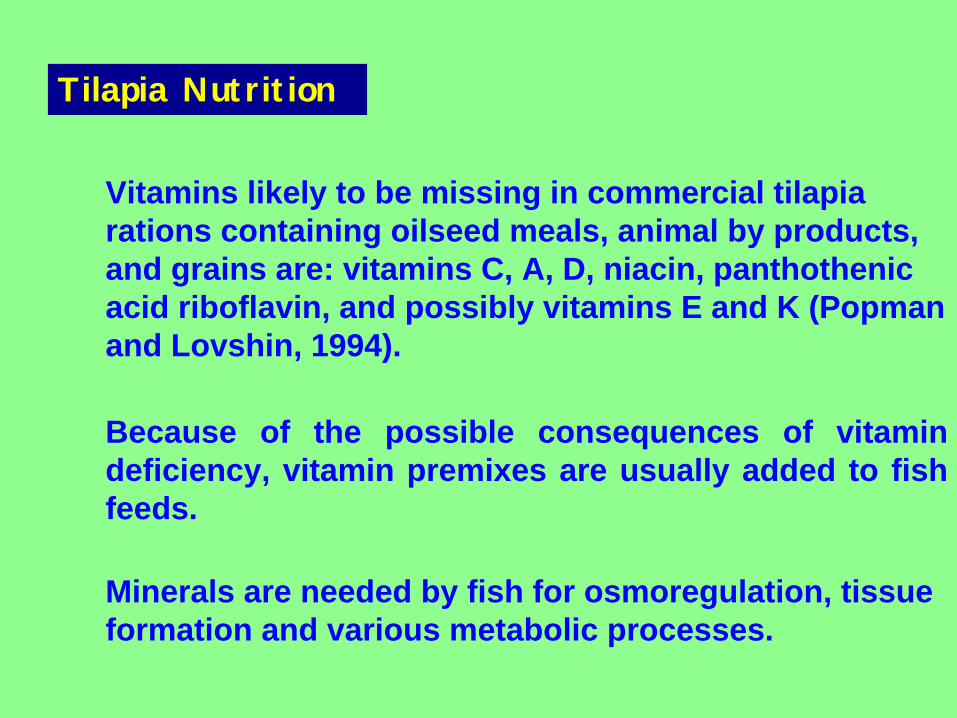
Vitamins likely to be missing in commercial tilapia rations containing oilseed meals, animal by products, and grains are: vitamins C, A, D, niacin, panthothenicacid riboflavin, and possibly vitamins E and K (Popmanand Lovshin, 1994).
Because of the possible consequences of vitamin deficiency, vitamin premixes are usually added to fish feeds.
Minerals are needed by fish for osmoregulation, tissue formation and various metabolic processes.

OBJECTIVESOBJECTIVES
This study was undertaken to:
! present the development of the gut (primarily anterior intestine) and associated organs – liver and pancreas Nile tilapia fed with different first food diets through light, scanning and transmission electron microscopy.
! investigate the effects of the different first food diets on some enzymes – lipase, esterase, amylase andphosphatase in 150-day old Nile tilapia.
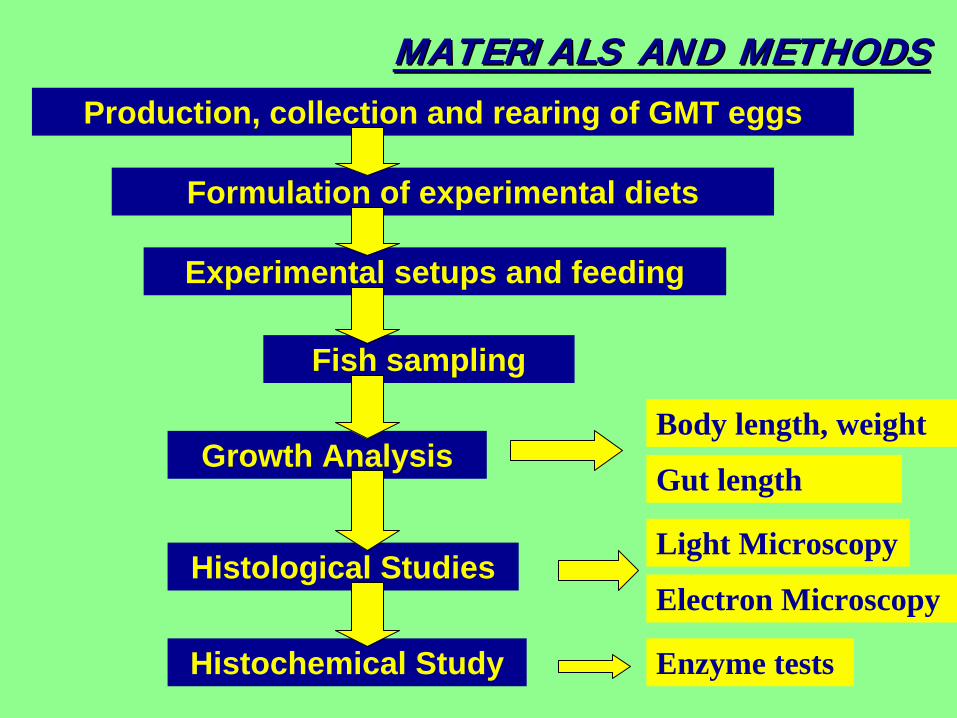
MATERIALS AND METHODSMATERIALS AND METHODSProduction, collection and rearing of GMT eggs
Formulation of experimental diets
Experimental setups and feeding
Fish sampling
Growth Analysis
Histochemical Study Enzyme tests
Histological StudiesLight Microscopy
Electron Microscopy
Body length, weight
Gut length

Production, collection and rearing of GMT eggs
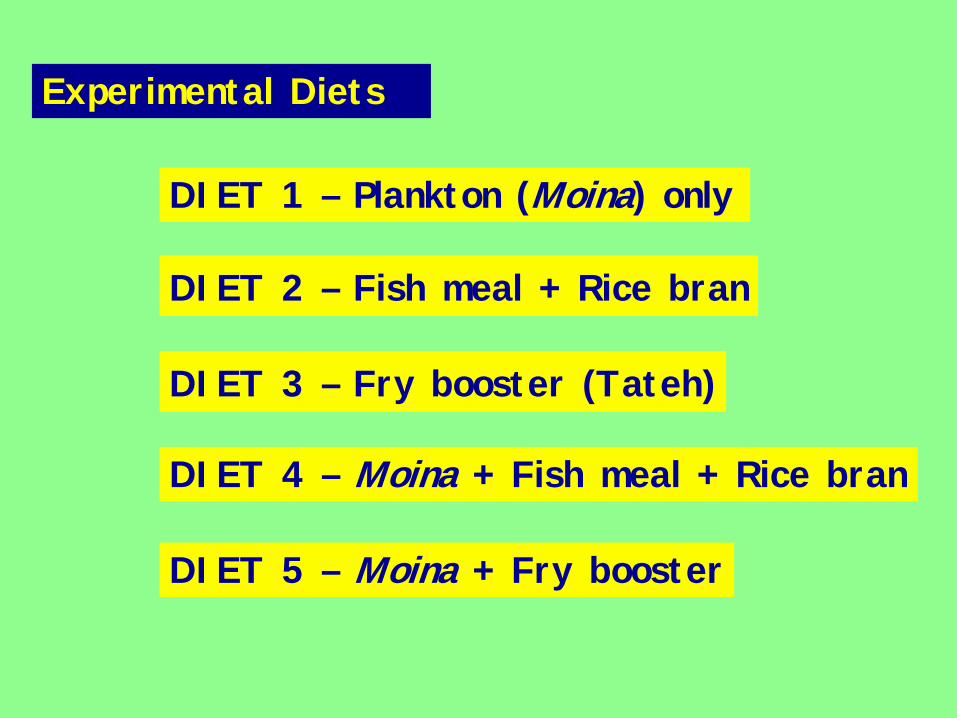
Experimental Diets
DIET 1 – Plankton (Moina) only
DIET 2 – Fish meal + Rice bran
DIET 3 – Fry booster (Tateh)
DIET 4 – Moina + Fish meal + Rice bran
DIET 5 – Moina + Fry booster
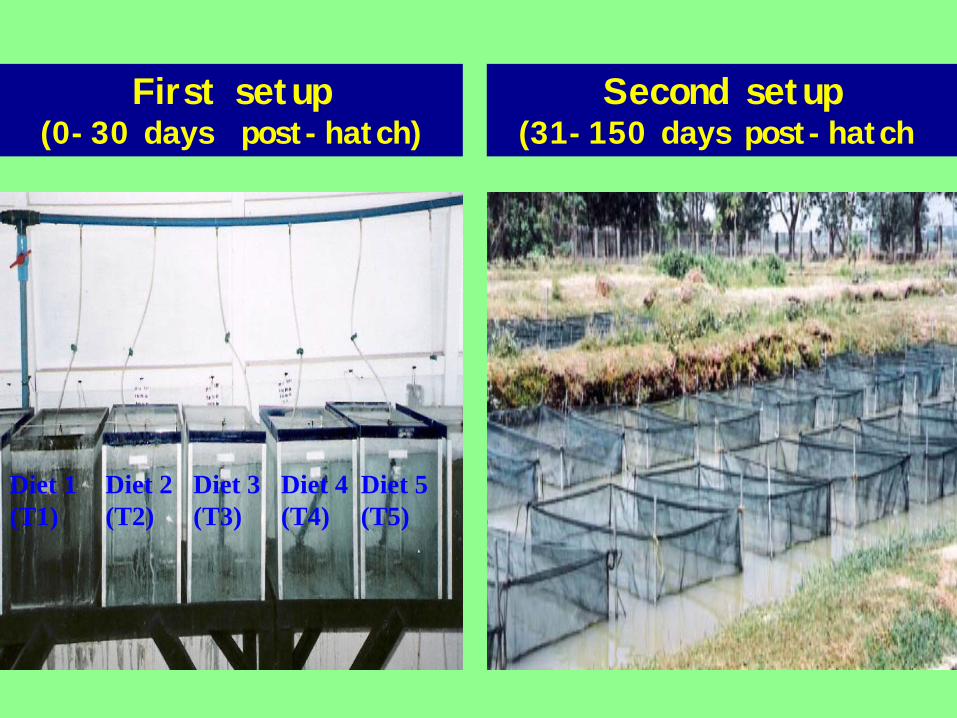
Diet 1 (T1)
Diet 2 (T2)
Diet 3 (T3)
Diet 4 (T4)
Diet 5 (T5)
First setup(0-30 days post-hatch)
Second setup(31-150 days post-hatch)
fish mealMoina + fry boosterT5
fish mealMoina + fish meal + rice bran
T4
fish mealfry boosterT3
fish mealfish meal + rice bran
T2
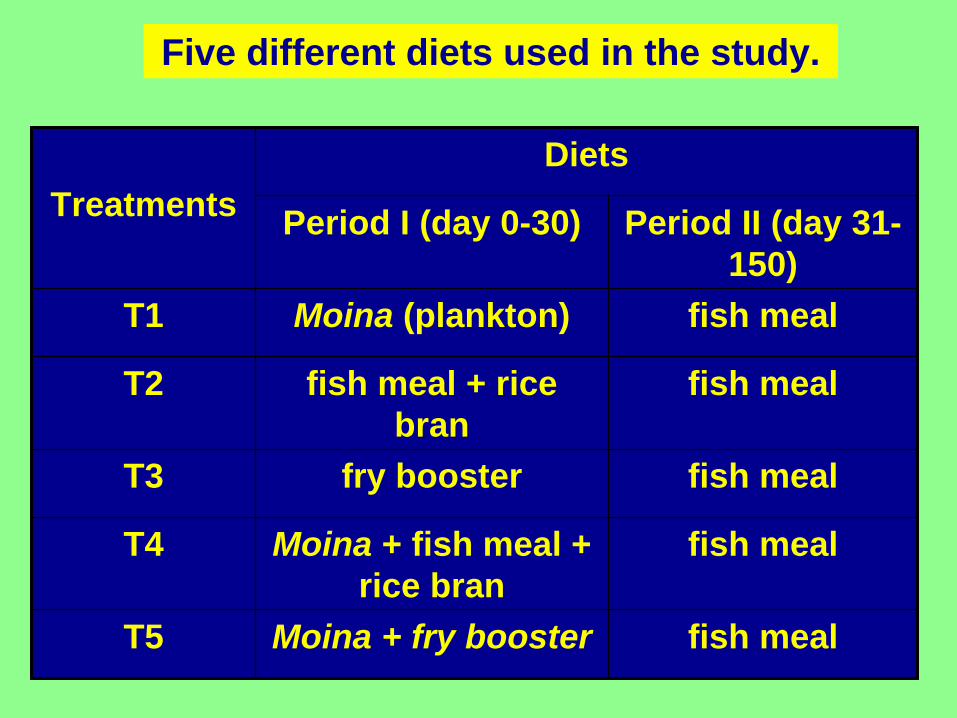
fish mealMoina (plankton)T1
Period II (day 31-150)
Period I (day 0-30)
DietsTreatments
Five different diets used in the study.
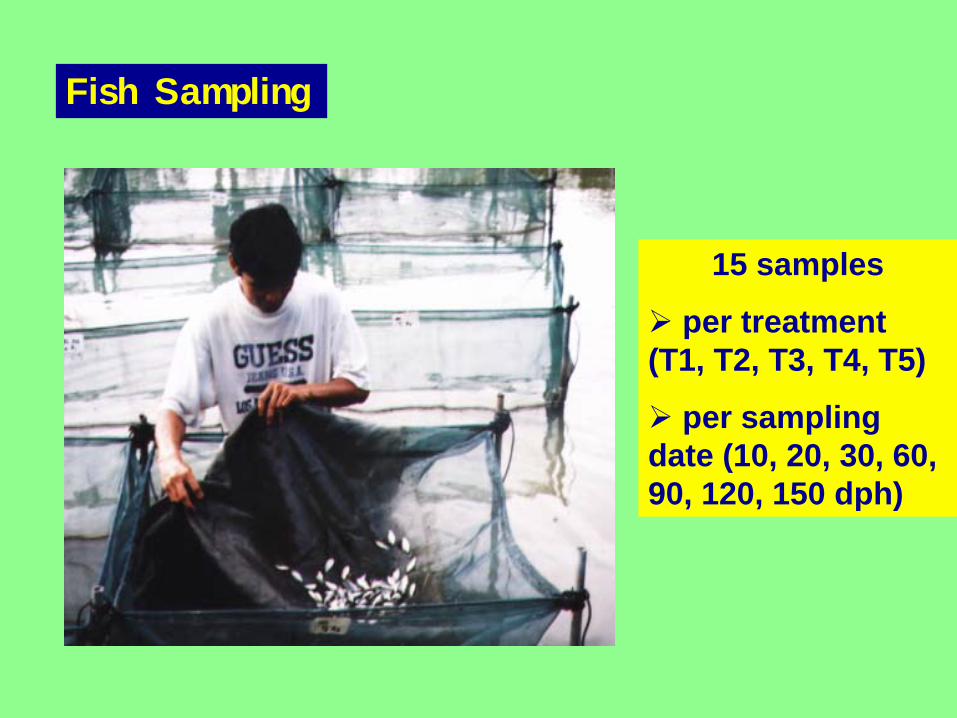
Fish Sampling
15 samples
! per treatment (T1, T2, T3, T4, T5)
! per sampling date (10, 20, 30, 60, 90, 120, 150 dph)
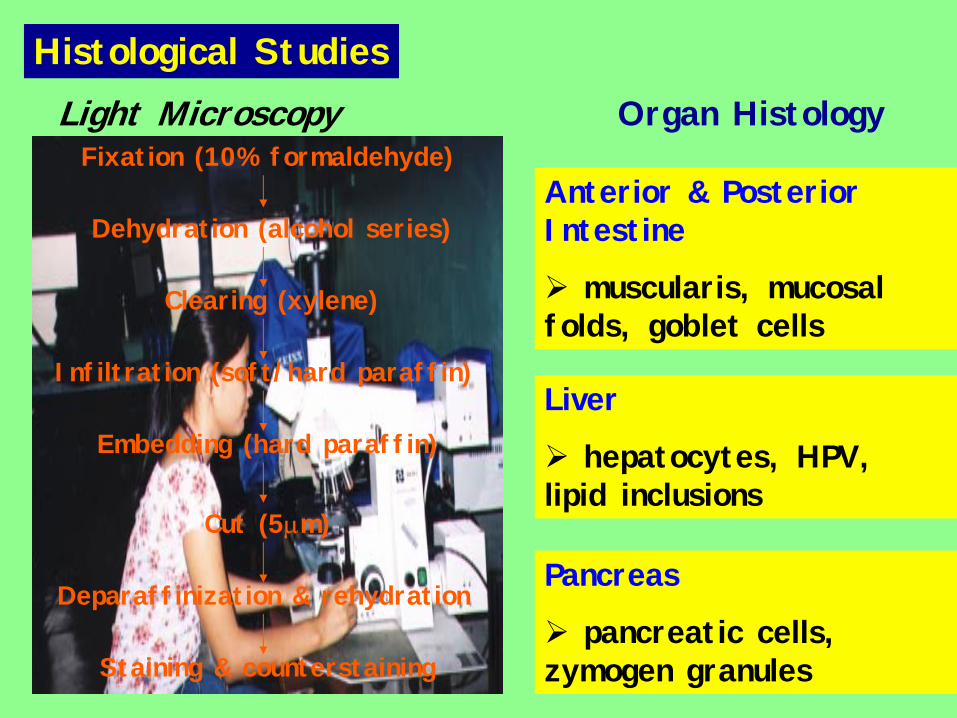
Histological StudiesLight Microscopy Organ Histology
Anterior & Posterior Intestine
! muscularis, mucosal folds, goblet cells
Liver
! hepatocytes, HPV, lipid inclusions
Fixation (10% formaldehyde)
Dehydration (alcohol series)
Clearing (xylene)
Infiltration (soft/hard paraffin)
Embedding (hard paraffin)
Cut (5µm)
Deparaffinization & rehydration
Staining & counterstaining
Pancreas
! pancreatic cells, zymogen granules

Ultrastructure StudiesScanning Electron Microscopy
Anterior Intestine
! 1 cm long, approximately most anterior part
!mucosal folds, microvilli
Aldehyde fixation
Buffer washing
Post-fixation (OsO4)
Buffer washing
Dehydration (ethanol/acetone series)
Infiltration (iso-amyl acetate)
Critical point drying
Ion coating
viewing

Ultrastructure Studies
Transmission Electron MicroscopyAldehyde fixation
Buffer washing
Post-fixation (OsO4)
Buffer washing
Dehydration (ethanol/acetone series)
Infiltration (resin) & embedding
Sectioning (ultrathin)
Double staining technique
viewing
Anterior Intestine
!1 cm long, approximately most anterior part
!microvilli, goblet cell, mitochondria

Enzyme Histochemistry
Cryostat cutting
Fresh samples of anterior intestine (1 cm long) and pancreas of 150-day old Nile tilapia were brought to National Kidney Institute for cryostat cutting
Enzyme tests were done at the Developmental Biology Thesis Room of Institute of Biology

Azo-Coupling Technique for Alkaline PhosphataseEnzyme Tests
Incubation Medium
0.05M Tris buffer, pH 10.0 – 10ml
Sodium salt – 10mg
MgCl2 – 10mg
Fast blue RR salt – 10mg
Mount cryostat sections on slides
Wash sections
Incubate (20mins)
Transfer to H2O (1min)
Transfer to acetic acid (1min)
Rinse in water
Mount and cover Result: colored purple to black
(Kiernan, 1990)

Enzyme TestsSimultaneous Coupling Method for Non-specific Esterases
Mount cryostat sections on slides
Air dry
Incubate (1-15mins)
Wash in running H2O (2mins)
Counterstain (4-6 mins)
Wash (4-6 mins)
Mount and cover
Incubation Medium
0.1M phosphate buffer, pH 7.4 – 20ml
α-naphthyl acetate – 0.25ml
Fast blue B – 50-100mg
Result: black
(After Gomori, 1952; Burstone 1962 in P.J. Stoward and A.G.E. Pearse, eds., 1980)

Enzyme TestsTween Method for Lipase
Incubation Medium
0.5M Tris-HCl buffer, pH 7.4 – 5ml
10% CaCl2 – 2ml
Tween 60 – 2ml
Distilled H2O – 40ml
Mount cryostat sections on slides
Air dry
Incubate (3-12hrs)
Wash in distilled H2O
Immerse in 1% lead nitrate (15mins)
Wash in running H2O (1-2mins)
Immerse in 1% sodium sulphide (1-2mins)
Wash and counterstain w/ eosin (5 min)
Wash, mount and coverResult: brownish-black
(After Gomori, 1945 in Kiernan, 1990)

Enzyme TestsStarch Film Method for α-Amylase
Mount cryostat sections on slides
Air dry
Fix in 50;10:50 (by vol) methanol, acetic acid and water (1h)
Rinse in tap H2O
Immerse in 1% Lugol’s iodine sol (1min)
Rinse in H2O
Mount and cover
Starch film
5% sol’n of starch in 0.02M borate- 0.01M NaOH buffer, pH 9.2, warm in water bath
Dip clean slides in the sol’n for 15 s, redip for 30s and air dry
Result: unstained
(Smith and Frommer, 1973 in P.J. Stoward and A.G.E. Pearse, eds., 1980)

Enzyme Tests
Qualitative analysis (visual analysis) was done through the intensity of the color reactions under LPO. Subsequent color ranking scheme, quantitative analysis was employed by assigning numerical values representing the intensity of color reactions. Cells with color reaction were likewise counted by concentrating on the lower right quadrant of every section under HPO.
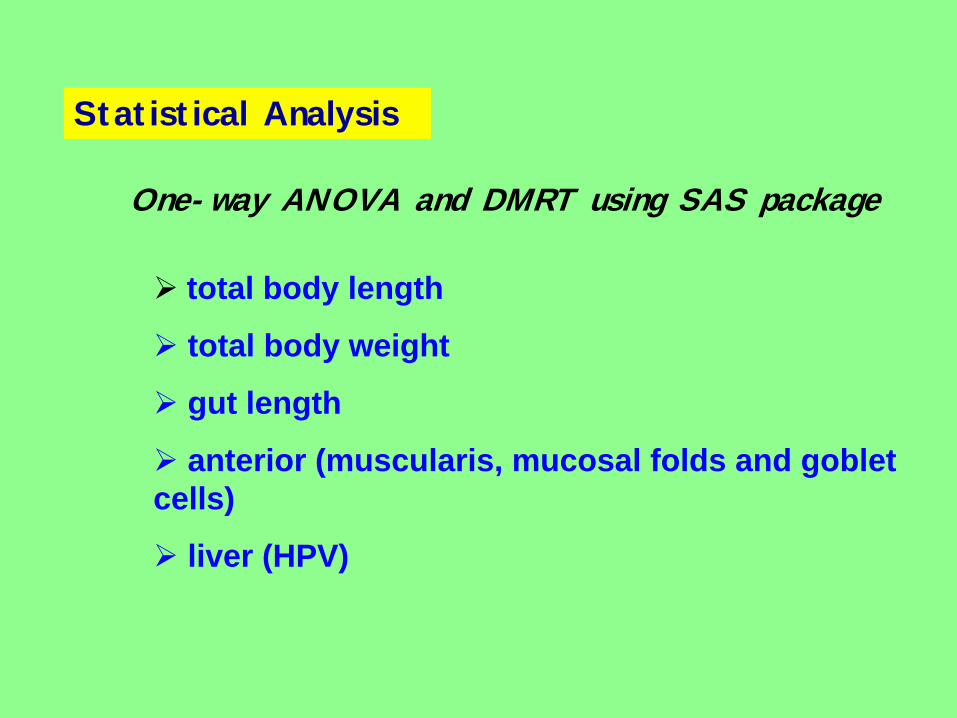
Statistical Analysis
One-way ANOVA and DMRT using SAS package
! total body length
! total body weight
! gut length
! anterior (muscularis, mucosal folds and goblet cells)
! liver (HPV)
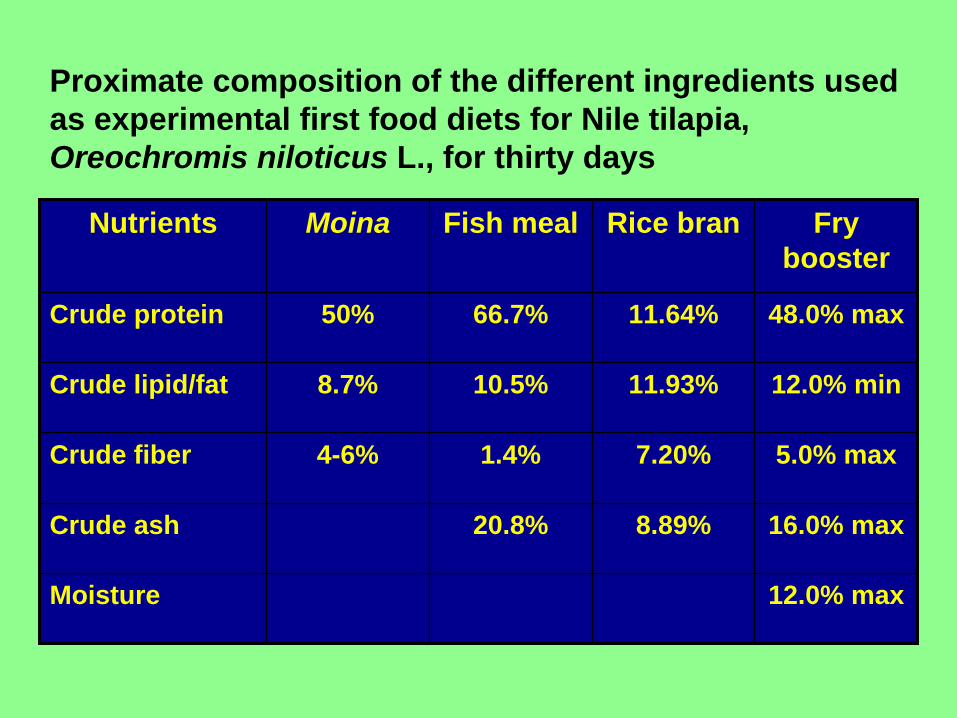
12.0% maxMoisture
16.0% max8.89%20.8%Crude ash
5.0% max7.20%1.4%4-6%Crude fiber
12.0% min11.93%10.5%8.7%Crude lipid/fat
48.0% max11.64%66.7%50%Crude protein
Fry booster
Rice branFish mealMoinaNutrients
Proximate composition of the different ingredients used as experimental first food diets for Nile tilapia,Oreochromis niloticus L., for thirty days

Total body length of developmental stages of Oreochromis niloticus L. (GMT) fed with
different first food diets.
02468
10
0 10 20 30 60 90 120 150
days post-first feeding (dpff)
leng
th (c
m) D1
D2
D3
D4
D5
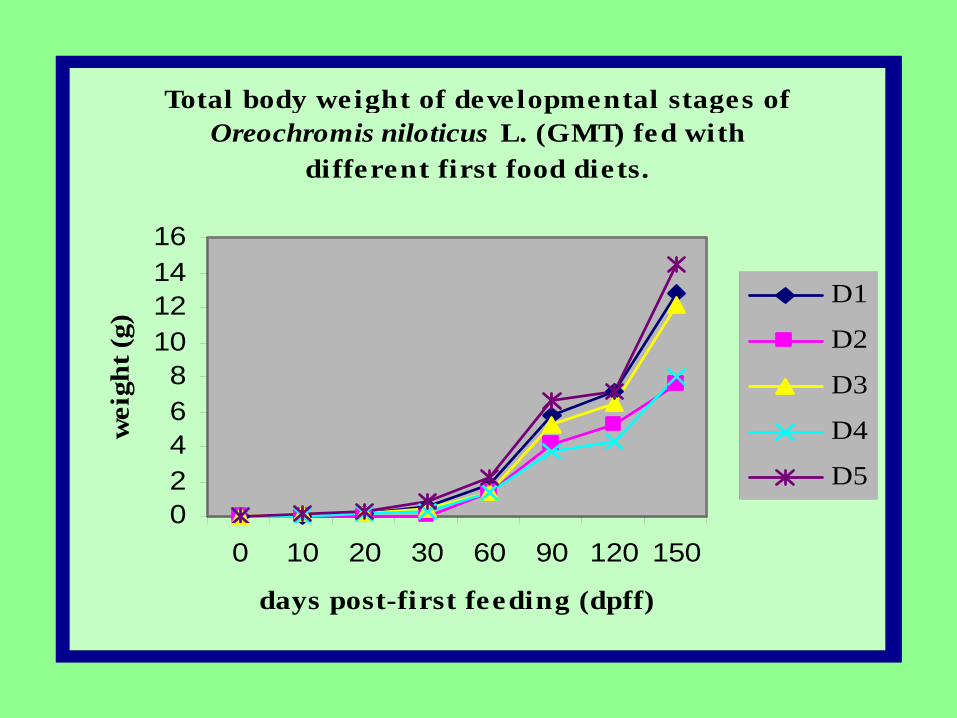
Total body weight of developmental stages of Oreochromis niloticus L. (GMT) fed with
different first food diets.
02468
10121416
0 10 20 30 60 90 120 150
days post-first feeding (dpff)
wei
ght (
g)
D1
D2
D3
D4
D5

Gut length of developmental stages of Oreochromis niloticus L. (GMT) fed with
different first food diets.
0
50
100
150
200
250
0 10 20 30 60 90 120 150
days post-first feeding (dpff)
leng
th (c
m) D1
D2
D3
D4
D5
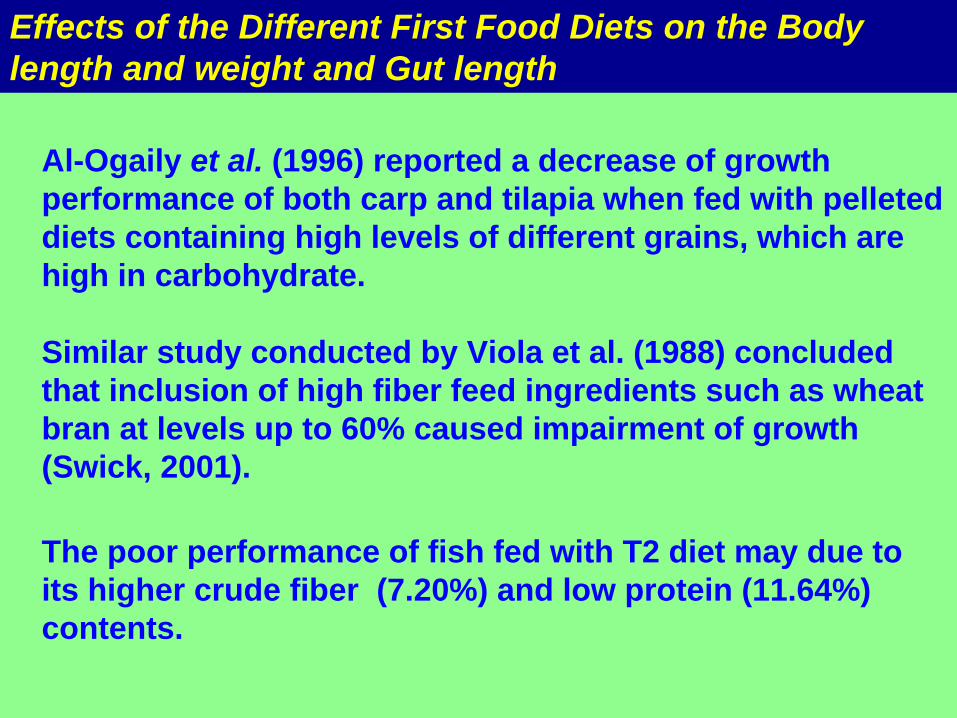
Effects of the Different First Food Diets on the Body length and weight and Gut length
Al-Ogaily et al. (1996) reported a decrease of growth performance of both carp and tilapia when fed with pelleteddiets containing high levels of different grains, which are high in carbohydrate.
Similar study conducted by Viola et al. (1988) concluded that inclusion of high fiber feed ingredients such as wheat bran at levels up to 60% caused impairment of growth (Swick, 2001).
The poor performance of fish fed with T2 diet may due to its higher crude fiber (7.20%) and low protein (11.64%) contents.

In general, plant proteins are low in some essential and limiting (methionine, cystine and lysine) amino acids (Akiyama, 2001) and contain antinutritional components that have adverse effect on the growth performance.
Effects of the Different First Food Diets on the Body length and weight and Gut length
Protein level of the diet is the most important consideration especially during the fry stage (0.5 – 10g). T2 (Fishmeal, 66.7%; Rice bran, 11.64%), T4 (Moina,50% ; Fishmeal, 66.7%; Rice bran, 11.64%) and T5 (Fry booster, 48%; Rice bran, 11.64%) diets have higher protein level.

Effects of the Different First Food Diets on the Body length and weight and Gut length
Ahlgren et al. (1999) found that increased total fat concentration in the diets seemed to have beneficial effects on both growth and survival of grayling raised in aquaculture systems. Lipids have protein-sparing effect.
Moreover, the good growth performance of the T1, T3 and T5 fish may due to the increased total fat concentration in the diets: T1 (Moina, 8.7%), T3 (Fry booster, 12.0%) and T5 (Moina, 8.7% and Fry booster, 12.0%).
Best growth performance of T5 fish was due to high nutrient content (high protein content – Moina, 50%; fry booster, 48% and high fat content - (Moina, 8.7% and Fry booster, 12.0%), good digestibility (low fiber content –Moina, 4-6%; fry booster, 5%) and palatability.
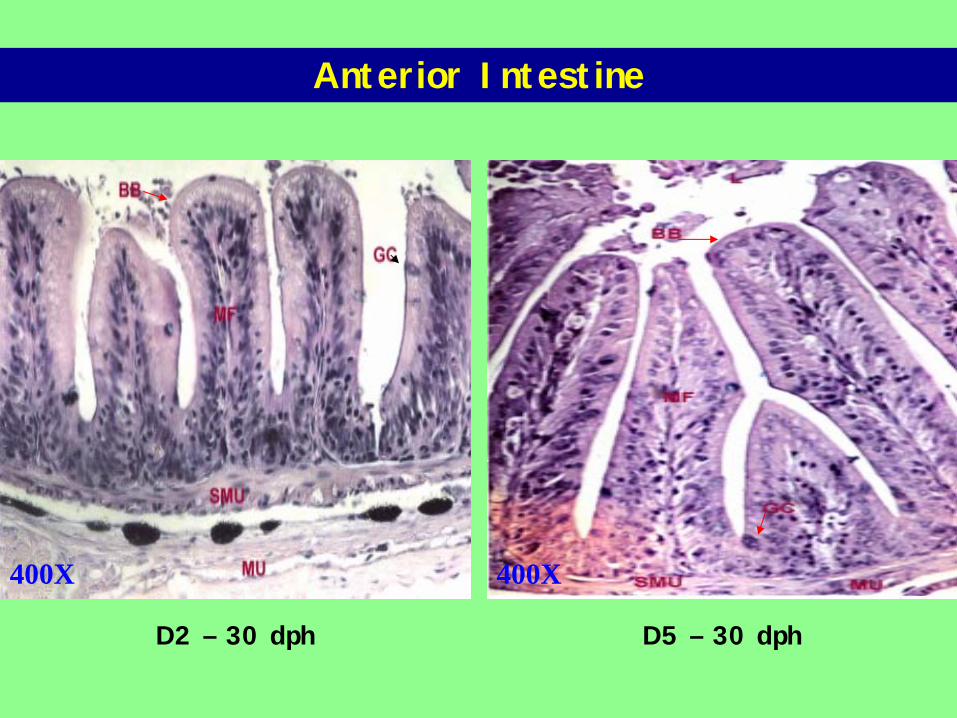
D5 – 30 dph
Anterior Intestine
D2 – 30 dph
400X 400X

D5 – 150 dph
Anterior Intestine
D2 – 150 dph
200X 200X
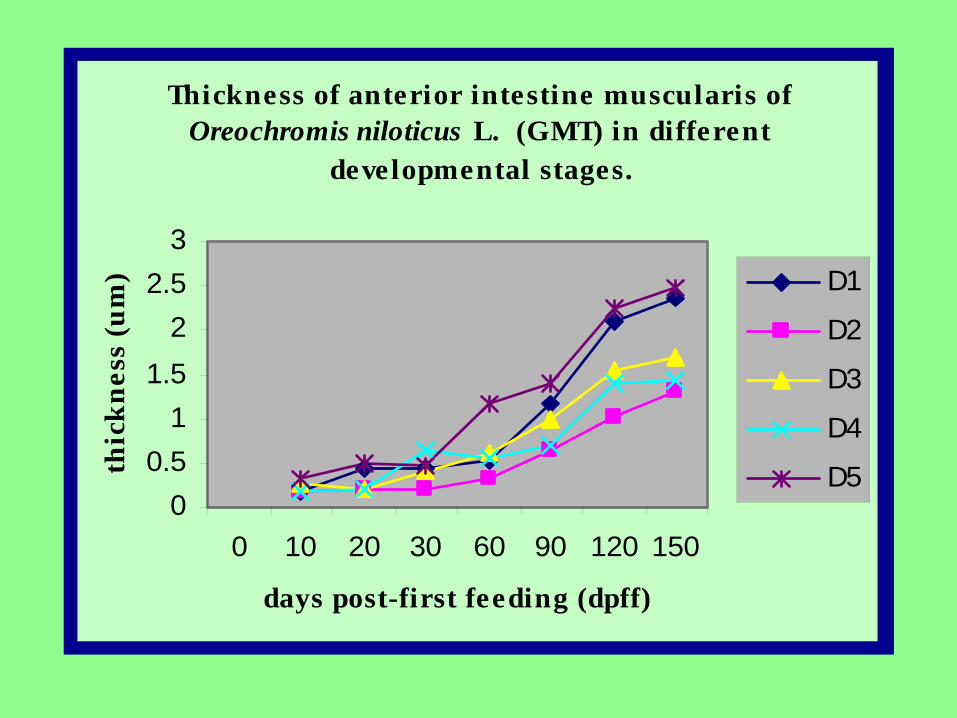
Thickness of anterior intestine muscularis of Oreochromis niloticus L. (GMT) in different
developmental stages.
00.5
11.5
22.5
3
0 10 20 30 60 90 120 150
days post-first feeding (dpff)
thic
knes
s (u
m) D1
D2
D3
D4
D5

Height of anterior intestine mucosal folds of Oreochromis niloticus L. (GMT) in different
development stages.
02468
1012
0 10 20 30 60 90 120 150
days post-first feeding (dpff)
heig
ht (u
m) D1
D2
D3
D4
D5
c

Number of goblet cells seen in the tallest section of a mucosal fold in the anterior
intestine of Oreochromis niloticus L. (GMT) in different developmental stages.
0
5
10
15
20
0 10 20 30 60 90 120 150
days post-first feeding (dpff)
num
ber
of g
oble
t ce
lls
D1
D2
D3
D4
D5
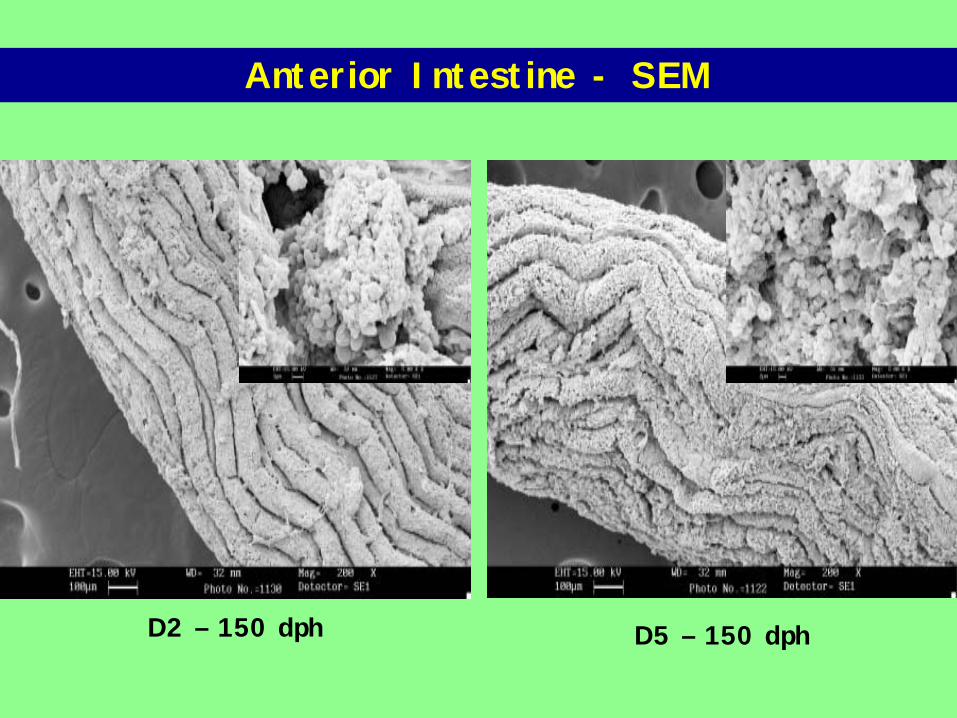
Anterior Intestine - SEM
D2 – 150 dph D5 – 150 dph

Anterior Intestine - TEM
D2 – 150 dph D5 – 150 dph
Goblet Cell
21,600X 27,000X
MG MG

Anterior Intestine - TEM
D2 – 150 dph
MicrovilliD5 – 150 dph
54,000X 54,000X
MvMv

Anterior Intestine - TEM
108,000X 108,000X
D2 – 150 dph
Mitochondria D5 – 150 dph
Mt
Mt
Effects of the Different First Food Diets on the Anterior Intestine
Histological changes include a reduction in the height and number of mucosal folds in winter floundersPseudopleoronectes americanus, smaller and fewer mucous cells in rainbow trout Oncorhynchus mykiss, and a loose, fragile submucosa in the bluegill sunfish Lepomis macrochinus (Hall and Bellwood, 1995).
The mechanism involving these changes are well documented in mammals where it is believed that the decreased luminal concentration of nutrients, and lack of direct stimulation by food, is responsible, at least in part, for the atrophy of the intestinal mucosa (Hall and Bellwood, 1995).

Effects of the Different First Food Diets on the Anterior Intestine
The atrophy of the epithelium demonstrated in both stomach and intestine during starvation, is due to the use of the atrophied tissue for nourishment (Hall and Bellwood, 1995)
In fish fed with T2 diet, there was a reduced intake of food and less absorbed nutrients as shown in the marked decrease of growth performance. This may due to marginal level of nutrients of rice bran, poor digestibility and palatability.
Possibly, decrease of food intake, poorer digestion and absorption affected the intestine by inhibiting maximal development of gut tissues.
Effects of the Different First Food Diets on the Anterior Intestine
Goblet cells are responsible for the secretion of mucus coating the intestine. Secretion of mucus is elicited primarily by irritating stimuli rather than in response to hormones (Cross and Mercer, 1993).
Mucus serves an important role in mitigating shear stresses on the epithelium and contributes to barrier function in several ways (Cross and Mercer, 1993)

Liver
D2 – 30 dph D5 – 30 dph
400X 400X

D2 – 150 dph D5 – 150 dph
Liver
200X 200X

Diameter of hepatic portal vein of Oreochromis niloticus L. in different developmental stages fed with different
first food diets.
01234567
0 10 20 30 60 90 120 150days post-first feeding (dpff)
diam
eter
(um
)
D1D2D3D4D5

Effects of the Different First Food Diets on the Liver
The hepatocytes contain glycogen and the amount of which in the liver cells depends upon the nutritional state of the animal. They are few in number in the normal liver but are dramatically increased after consumption ofhepatotoxic substances (Junqueira et al., 1995).
Fish hepatocytes are good indicator of dietary quality (Kugler and Pequignot, 1988).
Bigger hepatocytes of fish fed with T5 diet may be due to the increased glycogen inclusion.

Effects of the Different First Food Diets on the Liver
Lipid vacuolations were prominent and abundant in fish fed with T2 diet especially during the early developmental stages (10-30 dph).
Increased liver lipid deposits may indicate diet of insufficient vitamin content, carbohydrate-rich diet and high-unsaturated fatty acids (Kugler and Pequignot, 1988).
High lipid infiltration revealed in the liver of fish with T2 diet was probably due to the high carbohydrate and unsaturated fatty acids and low vitamin content of the rice bran used.

Effects of the Different First Food Diets on the Liver
Dietary protein deficiency may have contributed to the lipid accumulation in the liver.
Apolipoprotein deficiency results in impaired secretion of lipid from the liver, causing accumulation of lipids in the liver (Ogunji and Wirth, 2000).
Very low-density lipoproteins (VLDL) are the transport vehicle of triglycerides in the bloodstream and are synthesized from the triglycerides and apolipoproteins in the liver, and secreted as triglycerides-rich lipoprotein (Ogunji and Wirth, 2000).

Effects of the Different First Food Diets on the Liver
Although fry booster contains fishmeal and rice bran, the incorporation of zooplankton (Moina) in the mixed food diet (T5) may have counteracted the disturbed lipid metabolism caused by feeding a diet rich in carbohydrate.
Bigger hepatic portal vein diameter was revealed in fish with T5 diet suggesting more blood supply in the liver.
The major contribution of natural food organisms to the nutrition of commercially cultured fish may be from nutrients that are required in trace amounts such as vitamins, minerals, and essential fatty acids (Robinson, 2003)

Pancreas
D5 – 30 dphD2 – 30 dph
400X 400X

Pancreas
D5 – 150 dphD2 – 150 dph
200X 200X
Effects of the Different First Food Diets on the Pancreas
Proenzymes, stored within zymogen granules, are inactive precursors of digestive enzymes that become active within the duodenum (Cross and Mercer, 1993), anterior intestine in Nile tilapia.
Each zymogen granule appears to contain all the pancreatic enzymes; however, the concentration of individual enzymes varies between granules and is sensitive to changes in diet (Cross and Mercer, 1993).
zymogen – an inactive protein that can be activated by specific hydrolysis of peptide bonds

Effects of the Different First Food Diets on the Pancreas
High-protein diets result in a high concentration of proteases, whereas high-carbohydrate and fat diets are reflected in high levels of amylase and lipase respectively (Fawcett, 1994).
In this study, abundance of these granules in acinar cells suggest active production and secretion of pancreatic enzymes like protease, lipase, amylase esterase and phosphates indispensable for the digestion of macromolecules – protein, carbohydrates, and lipids/fats.
T5 (fry booster plus Moina) fish had bigger acinar cells (3-7 µm). This may be due to the abundant zymogen granules in the pancreatic acinar cells.

Enzyme Histochemistry- Anterior Intestine
D2 – 150 dph D5 – 150 dph
Alkaline Phosphatase
200X 200X

Enzyme Histochemistry- Anterior Intestine
D2 – 150 dph D5 – 150 dph
Esterase
200X 200X
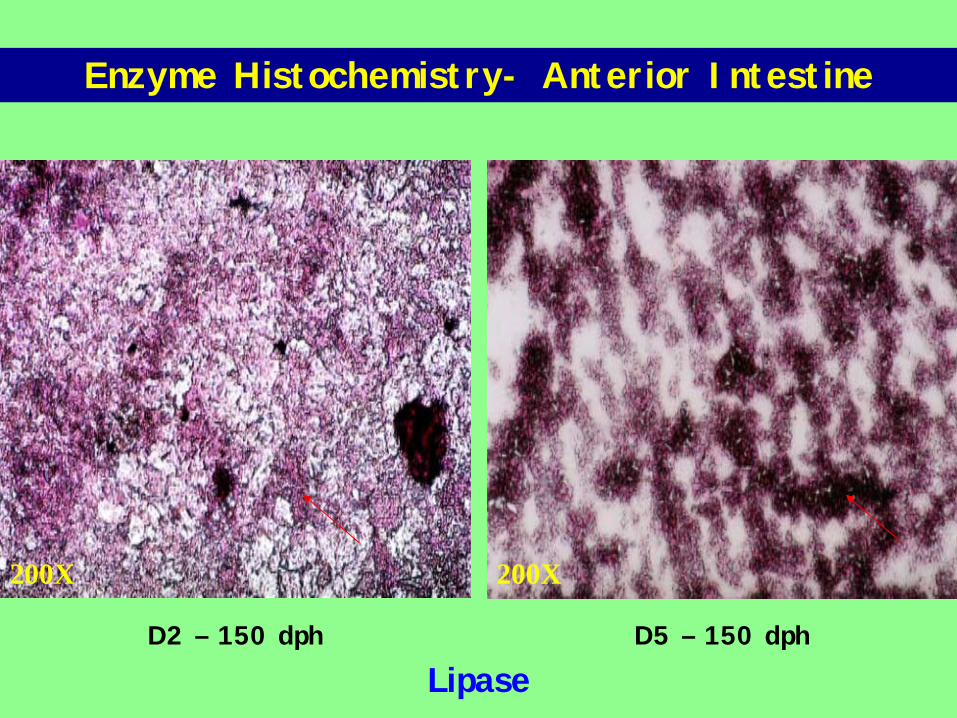
Enzyme Histochemistry- Anterior Intestine
D2 – 150 dph D5 – 150 dph
Lipase
200X200X

Enzyme Histochemistry- Anterior Intestine
D2 – 150 dph D5 – 150 dph
Amylase
200X200X
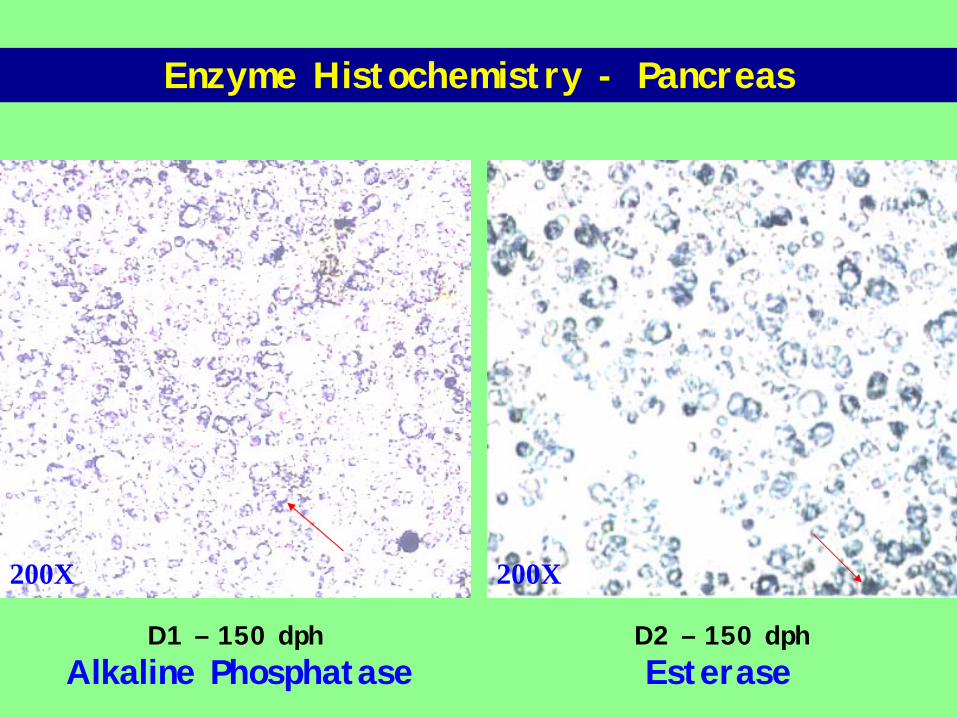
Enzyme Histochemistry - Pancreas
D1 – 150 dph D2 – 150 dphAlkaline Phosphatase Esterase
200X200X
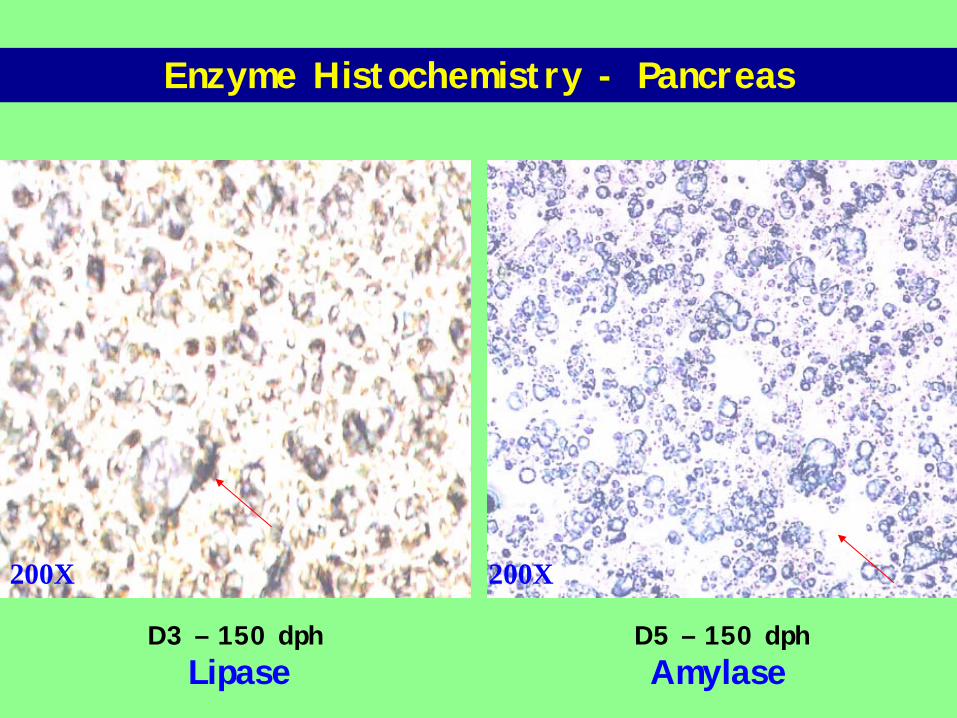
Enzyme Histochemistry - Pancreas
D3 – 150 dph D5 – 150 dphLipase Amylase
200X 200X
Effects of the Different First Food Diets on the Some Enzymes
More intense ( > 300 cells stained) activity of alkalinephosphatase, non-specific esterase, lipase, and amylase were exhibited in fish with T5 diet while T2 (> 200 cells stained) diet showed weak enzymatic activity.
In freshwater teleosts, digestive enzyme activity is affected by feeding behaviour and biochemical composition of the food (Kumar and Chakrabarti, 1998).
Aside from high nutrient content of the diet, increased food intake of fish fed with T5 diet may have accounted for the strong enzymatic activities.
Abundant zymogen granules in the pancreas of T5 fish may have accounted for the strong intestinal enzymatic activities.
Effects of the Different First Food Diets on the Some Enzymes
Alkaline phosphatase has a wide distribution in developing tissues and consistent localization is found within intestinal segments in several fish species (Baglole et al., 1998).
It is found primarily in cell membranes where active transport takes place (Baglole et al., 1998).
In this study, presence of this enzyme in the intestinal brush borders of mucosa of Nile tilapia Oreohromis niloticus identifies this tissue as a site of active nutrient absorption.

Effects of the Different First Food Diets on the Some Enzymes
Esterase activity in several fish species has been correlated with fat digestion and lipid absorption (Bagloleet al., 1998).
High crude fat content (Moina, 8.7%; fry booster, 12.0%) of the T5 diet suggests more fat digestion and abundant lipid vacuoles in the anterior intestine suggest greater lipid absorption.
The digestion of fats occurs completely in the intestine, under the action of pancreatic lipase.
Effects of the Different First Food Diets on the Some Enzymes
Amylase is a widely distributed enzyme in the plant and animal kingdom.
High enzyme activity may be closely related to the ability of digesting carbohydrates occurring in microalgae, which are used as food for zooplankton (Kumar and Chakrabarti, 1998).
High amylase activity in the gut of different fish species (C.punctuatus and carps) and also in sea bass larvae feeding on carbohydrate-rich diet suggest extensive amylase synthesis (Sarkar et al., 1999).

Effects of the Different First Food Diets on the Some Enzymes
The digestibility of starch (carbohydrate) is affected not only by the source and nature of carbohydrate but also by the level of its incorporation.
Wheat and other grains contain albumins, which inhibit the α-amylase activity in fish (Al-Ogaily et al., 1996). This may suggest the weak amylolytic activity in Nile tilapia fed with T2 diet.
Weak enzymatic activites may be due to poor nutrition. In conditions of extreme malnutrition, pancreatic acinar cells and other active protein-secreting cells undergo atrophy and lose much of their endoplasmic reticulum and the production of digestive enzymes is hindered (Junqueira et al., 1995).

CONCLUSIONSCONCLUSIONS
! Fish fed with Moina + fry booster (T5)showed better growth results supported by organ histology, electron microscopy and enzyme histochemistry.
! Fish fed with fish meal + rice bran showed poorest growth performance and development.

RECOMMENDATIONSRECOMMENDATIONS
" other enzyme tests
" other organ systems
" other supplemental diets

THANK YOU and
GOOD DAY!