Embed Size (px)
Citation preview

Impact of the Poverty Alleviation Fund program in Nepal
Atul Nepal∗
University of Illinois
November 12, 2015
Abstract
Using a panel dataset from an anti-poverty program in Nepal, the paper investigates the causal im-
pact of income-generating activities on remittances, migration, and welfare measures. The unique dataset
from a quasi-experimental design provides a setting to understand the causal effects of a development
program on remittances and migration. I show that policy makers should be aware that community-
driven development programs have unintended consequences for migration and remittances, which are
distinct from the primary goals of the program: alleviating poverty and improving food security. The
Poverty Alleviation Fund (PAF) program, which is a social fund program, has been providing its services
to marginalized communities in Nepal through various income-generating activities since 2006. Unlike
previous research that has used conditional cash transfer programs (CCTs) to study the role of a develop-
ment program on migration and remittances, I employ the data from the community-driven anti-poverty
program that provides income-generating activities to participants. The program results in a decrease
of approximately Rs.6000 (approximately six percent of total household consumption) in remittances
received, crowding out private transfers in the presence of public transfers. The paper shows an increase
in domestic migration, but no change in international migration due to the program.
JEL classification: I38, J61, I30
Keywords: Remittances, Migration, Impact evaluation, Poverty Alleviation Fund
∗The author would like to thank PAF Nepal for providing access to the dataset for this study. I would also like to thank ACES
Office of International Programs at the University of Illinois for supporting this research through the Bill and Mary Lee Dimond
Scholarship. email: [email protected]
1
1
1 Introduction
This paper asks two important but less asked questions related to the anti-poverty programs in develop-
ing countries: (a) Do anti-poverty programs affect existing private transfers such as remittances? (b) What is
the effect of anti-poverty programs on migration? The first question relates to the effect of the anti-poverty
programs on private transfers of households. Cox and Jimenez (1990) show that private transfers account
for a sizable share of household income and expenditures in developing countries. Unlike social welfare
programs, such as social pension programs and conditional cash transfer programs (CCTs), which provide
subsidies to households, the anti-poverty program is designed to help households in marginalized com-
munities by providing sustainable income-generating activities. The income-generating activities include
livestock transfers, better seeds for agriculture, vocational training that are supposed to improve the income
of household members. The income-generating activities can have a direct impact on economic outcomes
of the recipients by creating sustainable employment opportunities locally. The improvement in income can
affect the existing private transfers of the program recipient households. As clearly stated by Cox (1987),
from a theoretical perspective, there are various reasons to expect public transfers to affect private transfers.
However, from an empirical point of view, it is difficult to assess the presence of the effect due to the absence
of appropriate counterfactual groups (Albarran and Attanasio, 2002). This paper addresses the question by
using a community-driven development program in Nepal where private transfers from migrant workers are
common.
The second question focuses on the effects of anti-poverty programs on migration in the communities
that receive the program. Understanding the impact of anti-poverty programs on migration is useful be-
cause most of the countries where such programs are implemented also happen to have a long tradition of
international labor migration (Angelucci, 2013). The Gallup World Poll finds that more than 40 percent
of adults from the poorest quartile of the countries want to migrate permanently (Clemens, 2011). Hence,
understanding the impact of the income-generating activities on migration can provide good insight into
policies related to migration in developing countries.

2
In addition to the indirect effects of the program, this paper analyzes direct impact of the program on
welfare outcomes such as per capita consumption, per capita food consumption, and a food security measure
at various quantiles. The welfare outcomes are the intended effect of the anti-poverty program.
I address these questions using data from the Nepal Poverty Alleviation Fund (henceforth PAF) program.
PAF is a social fund program, which provides income-generating activities to marginalized communities in
Nepal. Social fund programs mainly focus on a community-driven development approach to identify and
implement the most feasible income-generating activities for the poor and marginalized population. These
income-generating activities are placed with the goal of increasing earning potential, improving food se-
curity, providing public support and creating social harmony. PAF finances income-generating activities
by providing livestock, better seeds for agriculture, and in some cases vocational training. Most of these
income-generating activities have short turnover rates that tend to show results faster. The improvement
in household income due to the income-generating activities can provide resources for labor migration and
decrease the need for remittances from individuals abroad. I use the panel data from 6 program districts of
Nepal collected in 2007 and 2010. The data have several advantages. Nepal has a different socio-cultural and
migration setting than other developing countries. Most of the micro-studies performed to date (24 studies)
have used cross-sectional data and 10 of the 24 study use data from Mexico (Clemens, 2014). Nepalese la-
bor migration is different from Mexico’s case as international migrant workers are documented and recorded
with the Department of Labor of the Nepalese Government before they travel for work1. Although Nepalese
national are allowed to work and travel to India without restriction, the opportunity to work in a third coun-
try that can have better wages have attracted Nepalese workers to choose these destinations. The dataset
provides a unique setting to understand labor migration in presence of multiple work-related opportunities.
Besides, the dataset contains information on both randomly selected treatment and control groups providing
us an ideal setting to understand the effect of the program on migration and remittances.
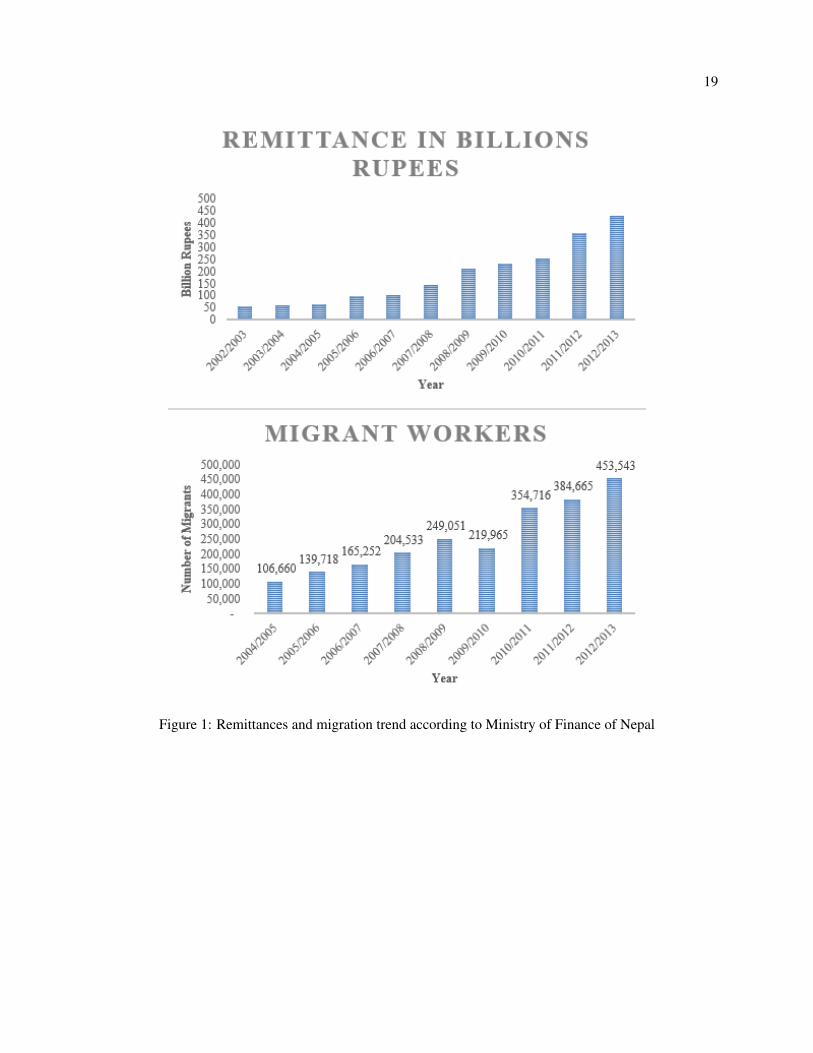
In Nepal, migration among young adults (aged 18-40) is increasing, with more than 1,500 young
Nepalese going abroad every day seeking employment (The Ministry of Finance, 2013). Approximately1The international migration referred to in this paper would be to a third country that requires a passport and travel documents.

3
453,000 Nepalese migrated in 2012-2013 alone for employment opportunities (The Ministry of Finance,
2013). There is a large number of Nepalese immigrants in countries like Saudi Arabia, UAE, Qatar, Kuwait,
and Malaysia. The majority of Nepalese migrant workers employed in these countries are either unskilled
or semi-skilled laborers, mostly working in construction, manufacturing or domestic jobs. The increasing
trend in migration has led to increased remittances as demonstrated by Figure 1. Remittances comprise
nearly 25% of Nepalese GDP (The Ministry of Finance, 2013, 2014). This means the role of remittances in
Nepal is extremely important for the economic development of the country.
Migration can be considered as a way to mitigate shocks or as a way to enhance opportunities for indi-
viduals. Youth migration is common in regions and countries where there is a lack of public sector support,
job opportunities, and insufficient access to basic facilities such as healthcare or education. Previous studies
have shown the net benefits from migration are substantial for unskilled workers, landless and relatively
deprived workers (Angelucci, 2013; Bhandari, 2004). These workers have the lowest opportunity cost to
migrate, and the benefits of migration can be highest for these individuals when similar jobs have higher
wages at the destination. The private transfer, these migrants send to their families provides a sizable ele-
ment of household income. Migration, however, is a costly and risky investment for the poor and unskilled.
Costs associated with migration are both monetary and non-monetary. Migrants are usually the younger,
more productive members of the households. The absence of younger and most productive household mem-
bers can increase the disutility of the migrants and the household alike. Non-monetary costs associated with
migration are the disutility of being away from home and physical and emotional stress to both family mem-
bers and migrant at the destination. For monetary costs, liquidity constraints may be a factor that prevents
potential migration opportunities (Bryan, Chowdhury, and Mobarak, 2014).
Financing migration can be difficult for the poor. Angelucci (2013) argues that poverty can be inversely
correlated with skills, and financial constraints are more likely to prevent low-skilled than high-skilled in-
dividuals from migrating. If these constraints are relaxed for some low-skilled individuals, their rate of
migration is likely to increase. Previous studies have mostly focused on CCTs and social welfare benefits
programs. Angelucci (2013), looking at labor-related migrations, finds that Oportunidades, Mexico’s anti-

4
poverty program, increases low-skilled Mexican migration to the USA by relaxing the financial constraints
for the poor. Similarly, Oliver (2009) shows that conditional cash transfer programs in Mexico have im-
proved human capital outcomes such as nutrition, health, and schooling level, which increased migration
from fully-covered program villages between 1995 and 2005.
Unlike CCTs, PAF program is designed to positively affect household income in rural, marginalized,
and conflict-affected communities by providing income-generating activities. The introduction of income-
generating activities at the local level can affect the occupational choices, particularly migration decisions
of households. As mentioned earlier, the countries where anti-poverty programs are implemented also hap-
pen to be countries with histories of international migration. In addition to international migration, almost
all of these countries experience large flows of domestic, rural-to-urban migration. Domestic migration in
the longer run can result in increased international migration as most of the domestic migration is to the
cities, where there are manpower agencies, which send individuals abroad. Therefore, anti-poverty pro-
grams might also affect the size and composition of domestic migration in the short run and international
migration in the longer run. Contrary to the finding of Angelucci (2013) and Oliver (2009), Stecklov, Win-
ters, Stampini, and Davis (2005) using 1997, 1998 and 1999 waves shows that Oportunidades slows down
international migration to the USA, although it did not slow down domestic migration for households in the
treatment communities even when migration levels were increasing during the time period. Stecklov, Win-
ters, Stampini, and Davis (2005) use the whole sample consisting of work, education, and marriage-related
migration. Bazzi (2014), using data from Indonesia, finds an increase in international emigration due to
positive income shocks in places where there are smaller landholders. This suggests that the anti-poverty
program may have a sizable effect on migration incentives and abilities.
I have the following main findings. First, I find a decrease in remittances among program recipients
compared to non-recipients. The results show a decrease of Rs. 6,000, accounting for six percent of to-
tal household consumption, which is consistent with the hypothesis that public transfers crowd out private
transfers and aligns with Jensen (2004)’s finding in a pension context. Second, I find an increase in do-
mestic migration by 11 percent. However, there is no change in international migration, which is similar

5
to Stecklov, Winters, Stampini, and Davis (2005) findings2. The reason behind the result can be attributed
to lower costs and lower risk of domestic migration compared to international migration. Furthermore,
individuals receiving the anti-poverty program may postpone the risky decision of international migration
with expectation of returns from the programs. To confirm the results, I estimate the impacts distinguishing
labor-specific migration and other types of migration3. The result suggests that the program has a statis-
tically significant and positive effect on non-labor-specific migration, but not on labor-specific migration.
Third, the evidence suggests that the program induced an increase in welfare measures such as per capita
consumption, per capita food consumption and number of food-secure months per year. Assessing the pro-
gram effect at various quantiles show positive effects of the program at all the distribution levels.
This paper contributes to the literature in several ways. First, it tests the hypothesis that PAF, an anti-
poverty program, affects existing private transfers such as remittances in the context of Nepal. As mentioned
earlier, the challenge to assess the effect of the public transfers on the private transfers is difficult empirically
due to the lack of proper comparison group. The presence of comparable treatment and control groups in
this dataset provides an ideal setting for causal inference. Second, the paper studies the effects of an anti-
poverty program on domestic as well as international migration in the context of Nepal. While most of
the studies in the literature explore the relationship between economic resources and emigration rates at a
macro level, this paper contributes to the micro studies where the unit of analysis is the household. Third,
the paper contributes to the effect of the program on actual household welfare measures such as per capita
consumption (food and overall) and food-secure months.
2 Setting
PAF is a social fund program that has been providing various income-generating activities to marginal-
ized communities of Nepal. Social fund programs are designed to place less stress on government line
agencies by using community actors to plan decisions and invest resources. The programs are approaches2Labor related migration did not increase contrasting the results in Angelucci (2013)3Other types of migration includes: marriage, education, family reasons, and other
6
adopted by several governments and development agencies in conflict-affected developing nations4 (The
World Bank, 2006; Wong, 2012). In Nepal, the PAF was established towards the later years of the civil
conflict. The civil conflict extended between 1996 and was ended by the peace deal in 2006 5. The PAF
programs mainly focus on community-driven development approaches to identify and implement feasible
income-generating activities to poor and marginalized populations with a goal of increasing earning poten-
tial, providing public support, and creating social harmony.
The Nepal Poverty Alleviation Fund (PAF), established in 2004, is a specially-targeted program to im-
prove the economic situation of the lower strata of the society with particular attention to groups that have
traditionally been excluded due to reasons of gender, ethnicity, caste, and location. It is an autonomous, pro-
fessional organization of the government of Nepal. Initially established through “Poverty Alleviation Fund
Ordinance 2004”, PAF has been governed by the Poverty Alleviation Fund Act since 2006. The Act allows
it to implement special and targeted program to bring poor and marginalized groups into development ef-
forts. (The Poverty Alleviation Fund, 2013). PAF focuses on enhancing an area’s potential strength by direct
community involvement. It uses local NGOs, and other private-sector organizations (Partner Organizations
(POs)) to facilitate poor and vulnerable groups in communities to implement the program components. PAF
has partnered with various organizations that are working at the village, district, and national levels to ensure
holistic development intervention to create a visible impact on poverty reduction. The main interventions
implemented by PAF are (i) income-generating activities (IGA), and (ii) small-scale village and community
infrastructure (The Poverty Alleviation Fund, 2013).
A pure randomized control trial (RCT) is difficult to implement because the program is targeted to poor
and excluded communities. The budget restrictions for any particular year and implementation capacity
constraints of particular NGOs allow for a randomized phase-in design, which assigns certain communi-
ties for early phase-in. A two-stage stratified sampling is adopted. First, six districts representing different4Afghanistan National Solidarity Program, Angola Social Action Fund, Colombia Peace and Development Project, Indonesia
Program Nasional Pemberdayaan Masyarakat, Kosovo Community Development Fund II Project, Rwanda Decentralization andCommunity Development Project, Nepal Poverty Alleviation Fund are few examples of such programs.
5Various studies have documented income poverty, relative deprivation, exclusion of development assistance to poor and remotecommunities for conflicts. Deraniyagala (2005), Williams (2013), Sharma (2006) are literature on civil conflicts in Nepal.
7
geographical regions are randomly selected from 25 PAF-targeted districts. Second, the sampling frame
consists of those wards/villages (Primary Sampling Units (PSUs)) in six selected districts that are not yet
included but represent a potential pool to be included in the future because of their poverty ranking (Parajuli,
Acharya, Chaudhury, and Thapa, 2012). Of approximately 1000 potential villages in six districts, 200 vil-
lages are randomly selected for the program. Initially, 100 villages are randomly assigned to the treatment
group while the remaining 100 villages are randomly assigned to the control group. The program alloca-
tion across each district is based on the district size (number of wards). The randomization is stratified by
district to maintain equal proportions of treatment and control primary sampling units (PSUs) in each dis-
trict. The decision to select one village over another for early phase-in cannot be enforced by lottery alone
as implementation readiness of the community organizations (COs), geography, socio-economic conditions
and other factors contribute towards inability to comply with random selection. Hence, the most ready are
phased in first.
The PAF intervention is implemented as follows 6: PAF chooses a partner organization (PO) -local
NGO- in a village in the targeted district. The PO’s village-selection depends on qualitative and quantitative
assessments based on need and feasibility. In the selected village, the PO carries out community mobiliza-
tion on possible PAF interventions by inviting household to form a CO consisting of 25 to 30 households as
CO members. The CO proposes income-generating activities for each household in the CO. PAF evaluates
the income-generating activities proposal, which, if endorsed, is funded through a grant to the community.
Communities establish and regulate a revolving fund from which households can borrow for their income-
generating activities (The Poverty Allevaiation Fund, 2014). Member households implement the approved
income-generating activities. On average, PAF provides 20,000 rupees (US$ 185) per income-generating
activities per household.
6The details of the program evaluation design are adopted from Parajuli, Acharya, Chaudhury, and Thapa (2012)
8
3 Data
The data for this study came from PAF. The baseline survey of this longitudinal data was conducted
in 2007. The baseline involved conducting a census of all households in 200 selected villages, followed by
administration of a multi-module detailed household survey to 15 randomly-sampled households in each vil-
lage. Overall 3,000 households were surveyed in six districts. The six districts are Rautahat, Rolpa, Dailekh,
Doti, Humla and Jumla. The survey questionnaire was adapted from the Nepal Living Standard Survey
(NLSS) and included detailed information on consumption and income, socio-economic and demographic
issues including education, health and nutrition, physical assets, migration and remittances, employment,
social employment, community relationship, voice, and participation. For comparability with the national
household survey-based welfare measures, the PAF survey included a similar consumption module and fol-
lowed the same aggregation method. A follow-up survey was performed in 2010, more than two years after
the baseline, which included the same questionnaires from the baseline survey. In addition, the follow-up
survey gathered information on the actual treatment status (PAF intervention) and non-treatment (control)
at both household and the village/PSU level. Twenty-five villages, in which only one household received
the treatment, are dropped from the analysis. In two districts Humla and Jumla, all the villages received the
treatment. Pooling these districts with the remaining four districts is not appropriate as these districts have
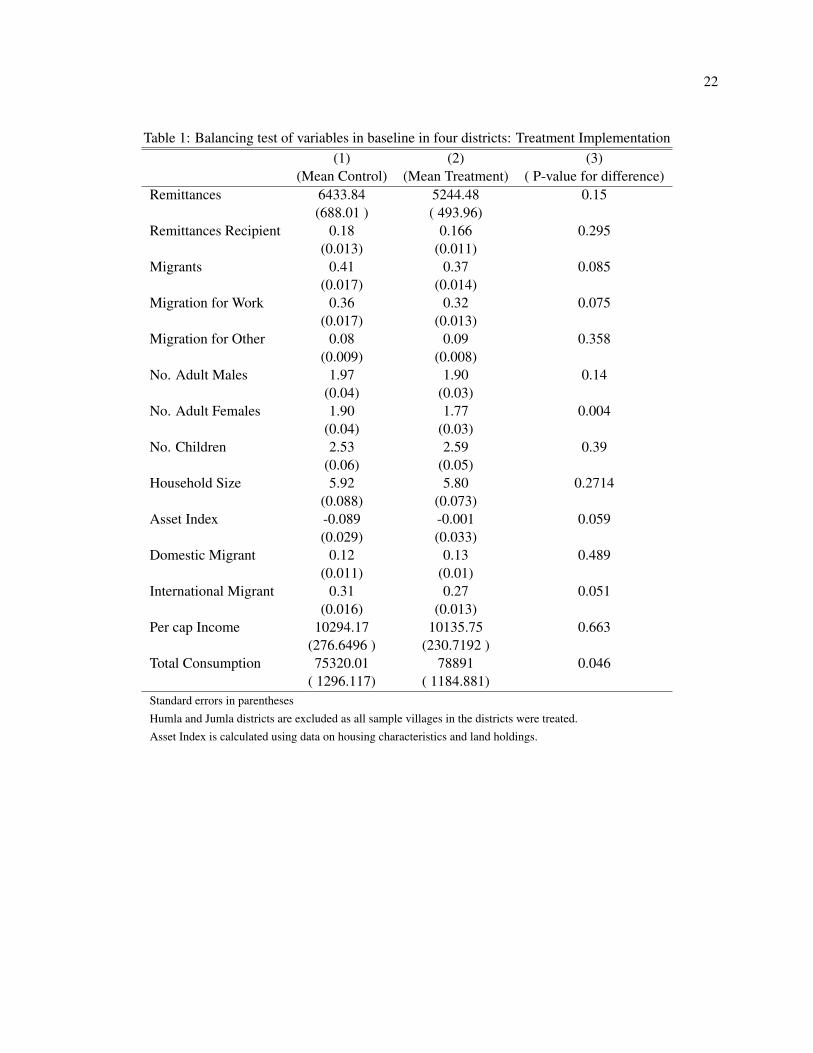
limited or no access to roads. Table 1 demonstrate summary statistics and p-values for mean differences
between treatment and control groups of important variables used in the analysis for the remaining four
districts.
4 Identification Strategy
The program is randomly placed in six districts out of 25 PAF targeted districts representing different
geographic regions. I take advantage of the random program placement to understand the impact of pro-
gram intervention on remittances and migration in four of the six districts. The effect of the program is
based on the assumption that households that get treatment have improved income, which provides addi-
tional resources to buy food and other household needs compared to the control households. The increase
9
in income should be reflected in the household welfare measures such as per capita food consumption, food
security measures or migration. One of the identifying assumptions is that in the absence of the program,
the households in treatment villages and control villages would not have significant differences in welfare
measures, remittances, and migration.
To assess the impact of the program, I perform difference-in-differences estimates using various outcome
variables. To test for the absence of differences in the baseline, I perform balance tests on remittance recip-
ient status, migrant status, remittance amount, total consumption, and per capita income among treatment
and control villages. Table 1 show the balancing test for major variables used in the analysis. Proportion
of migrants, proportion of migrants for work, number of adult females, proportion of international migrant,
asset index and total consumption are variables that do not satisfy balancing test at 10 percent significance
level. However, the variables are not different significantly. Alternatively, a Bonferroni multiple comparison
correction for 14 independent test requires a significant threshold α = 0.004 for each test to recover overall
significance of 0.05. Using this criterion, only number of adult female would be statistically different. The t-
test for number of adult females in treatment and control group shows statistically significant difference with
p-value of 0.004. The difference is not meaningful statistically. Additionally, the difference-in-differences
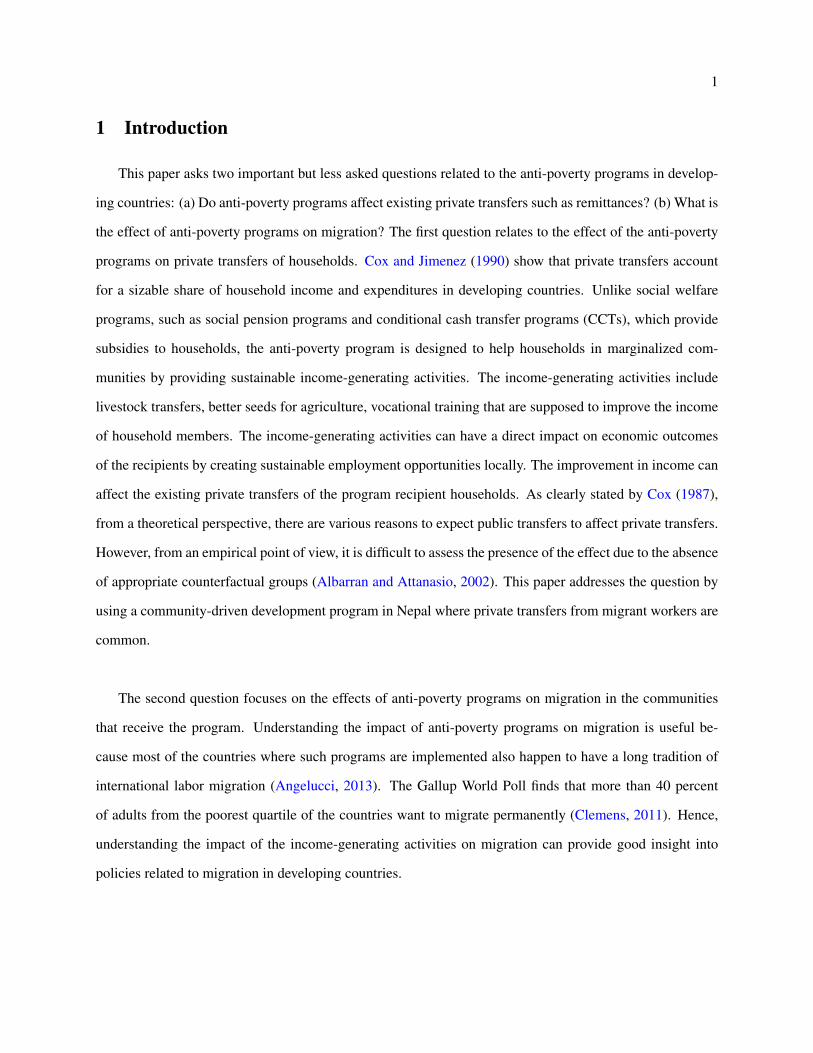
method controls for the different levels in the estimation. Figure 2 shows the distribution of remittances
among treatment and control group. The remittances distribution is more spread for control villages in 2010
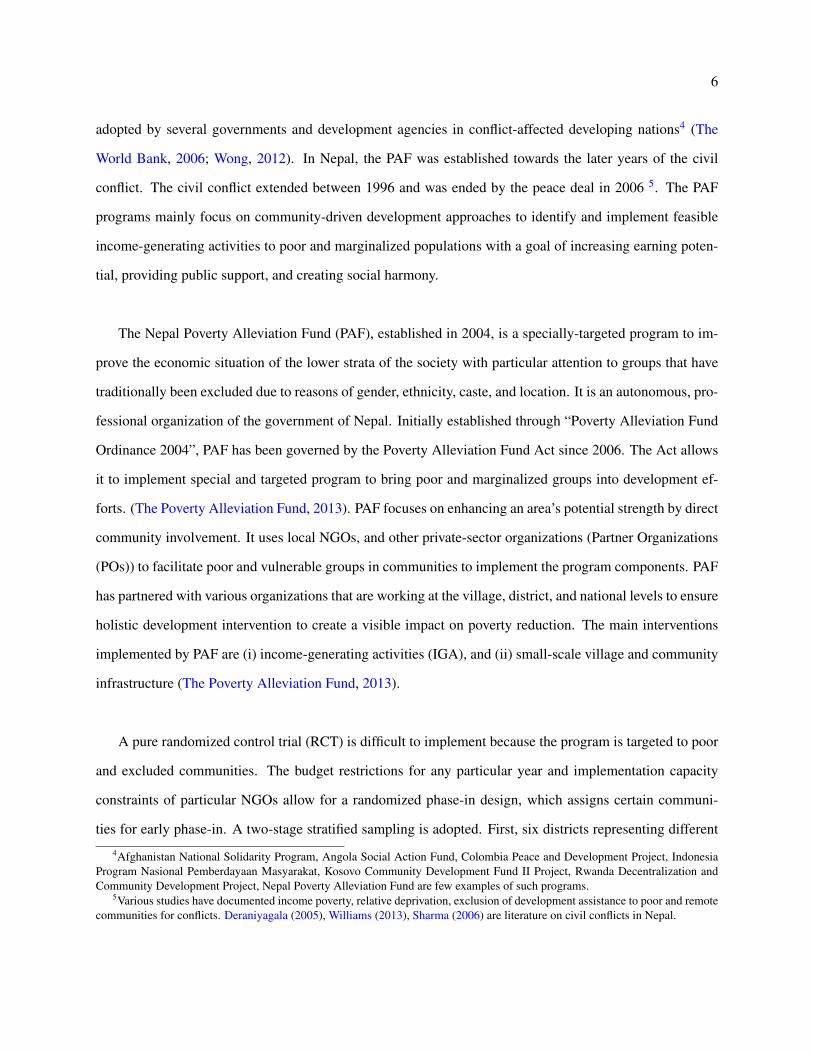
while the distribution for treatment villages shows similar distribution as 2007. Figure 3 shows the propor-
tion of migrants between treatment and control villages across time is increasing comparatively more in the
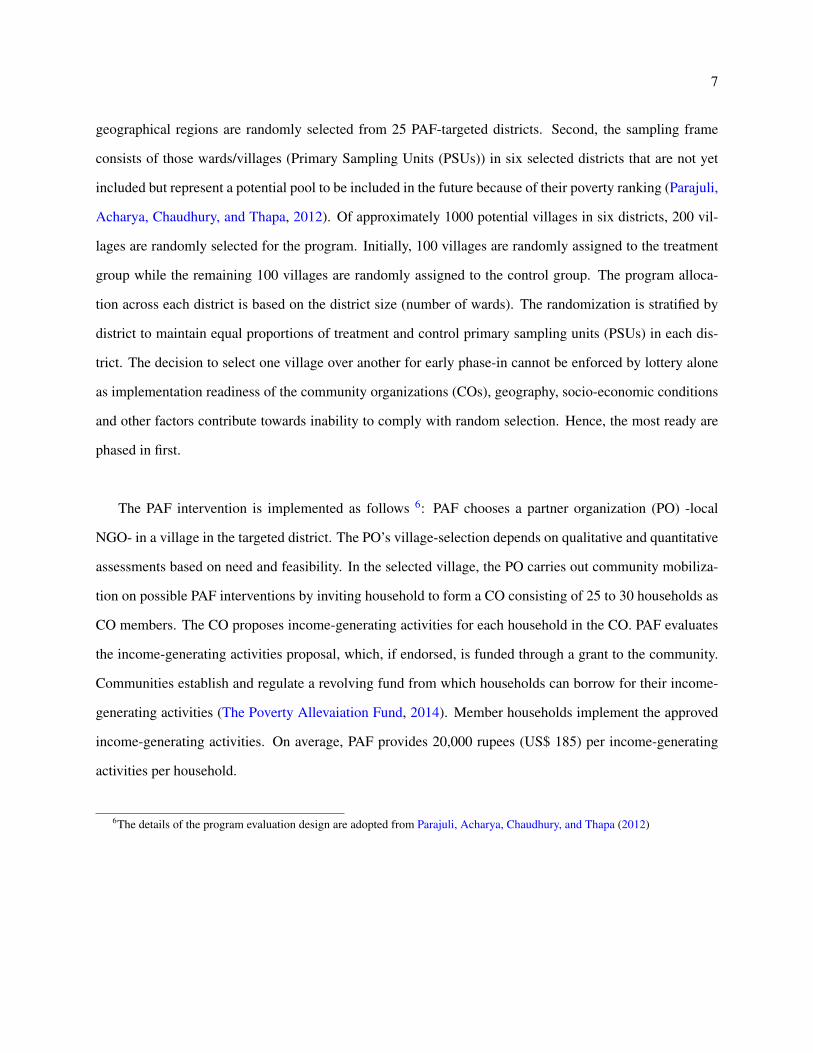
control villages. The proportion of households receiving remittances is higher for the control villages as
compared to treatment villages. Figure 4 demonstrates the proportion.
Yijt = µ+ γDj + πTt + βDjTt + θXijt + eijt (1)
where i- household, j- village, t-time.
10
Equation 1 shows the difference-in-differences regression where β is the variable of interest -the pro-
gram effect. Next, I estimate the effect of program on the welfare measures of households receiving the
program. To assess the impact of the program on per capita consumption, food-secure month, and per capita
food consumption I perform two-stage-least squares estimates. 2SLS can be defined as follows:
First stage equation
Treatmentjt = θAssignmentjt + πXijt + ωijt (2)
Yijt = δ ˆTreatmentjt + βXit + εijt (3)
The anti-poverty program can have differential effect across households. In order to assess the distri-
butional impact, I perform a quantile instrumental variable approach at (5, 25, 50, 75, 95)th quantile using
ivqte in STATA (Frlich and Melly, 2010). I apply the Abadie, Angrist and Imbens approach in the quantile
estimation approach (Abadie, Angrist, and Imbens, 2002). Two districts Humla and Jumla, 7 in mountainous
region of the country have only treatment villages; I therefore perform before-after treatment to access the
impact of the program.
5 Results
This section quantifies the impact of the PAF program on the amount of remittances, whether household
receives remittances, and whether household has a migrant. In addition to these indirect effect of the pro-
gram, this section also estimates the distributional effect of the program on welfare measures. The primary
outcome variables used in the analyses are the amount of remittances, household receiving remittances, and
whether a household member migrated. I employ clustered standard errors at the primary sampling unit
following Bertrand, Duflo, and Mullainathan (2004). I estimate the impact of the program by employing
difference-in-differences estimates. I perform the balance test, reported in Table 1, on the aggregate sample7These two districts have very limited access to transportation. The limited access to roads can have an affect on prices of goods
and services, which can further affect the disposable income of the households.
11
to perform the difference-in-differences estimate. Since two of the six districts do not have control groups, I
perform balance tests for remaining four districts. Balance tests are valid for amount of remittances, remit-
tances recipient status, and household migrant status as shown in Table 1.
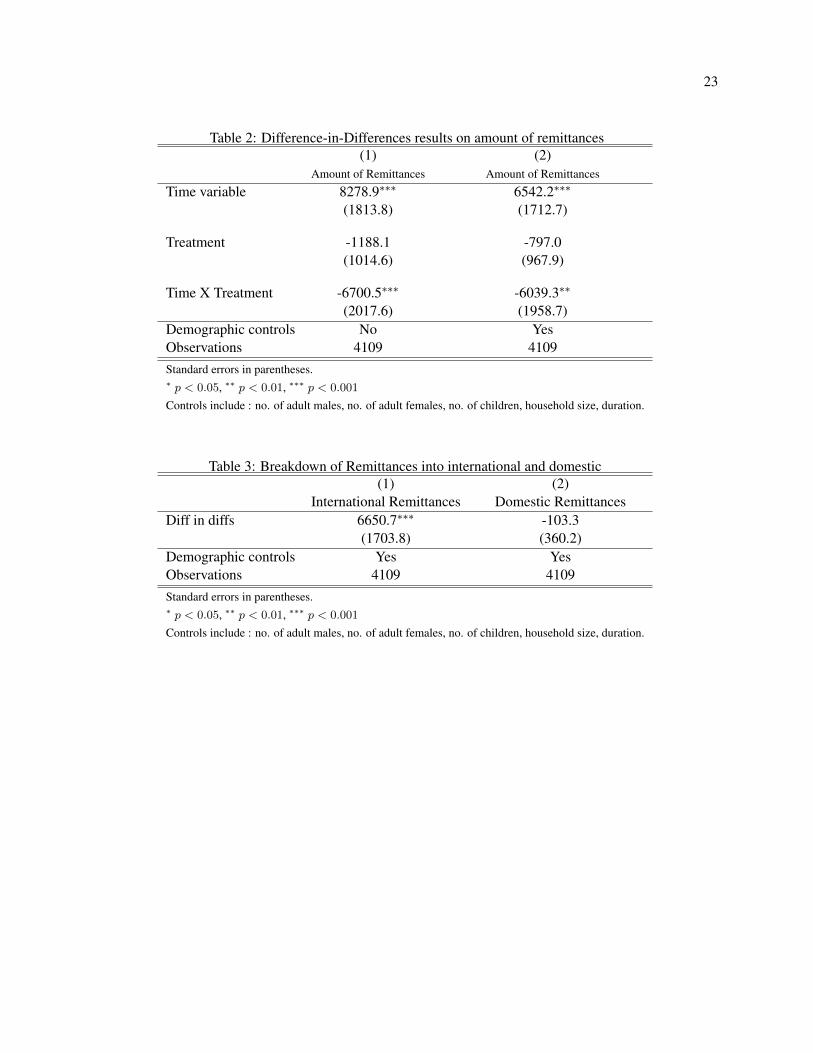
The estimates in Table 2 presents three specifications. Column 1 is the base specification without de-
mographic controls and village level fixed effect. Column 2 reports the result for specification with only the
demographic controls. The demographic controls used in the analyses are number of adult males, number of
adult females, number of children, household size, and duration of time in months a migrant has been away.
Column 3 reports the result with both demographic controls and village fixed effect. In all three specifica-
tions, the program decreases remittances by approximately 6000 rupees a year among program participants.
The result shows public transfers crowd out private transfers similar to the findings in the previous literature.
The amount of crowd out is equal to six percent of total household consumption on average. To understand
the impact of the program on domestic and international remittances, I perform the difference-in-differences
by separating the remittances into both domestic and international remittances. Due to the presence of higher
wage differentials in international labor markets, I would expect higher international remittances than do-
mestic remittances. There is a statistically significant decrease in international remittances but no difference
in domestic remittances as shown in Table 3.
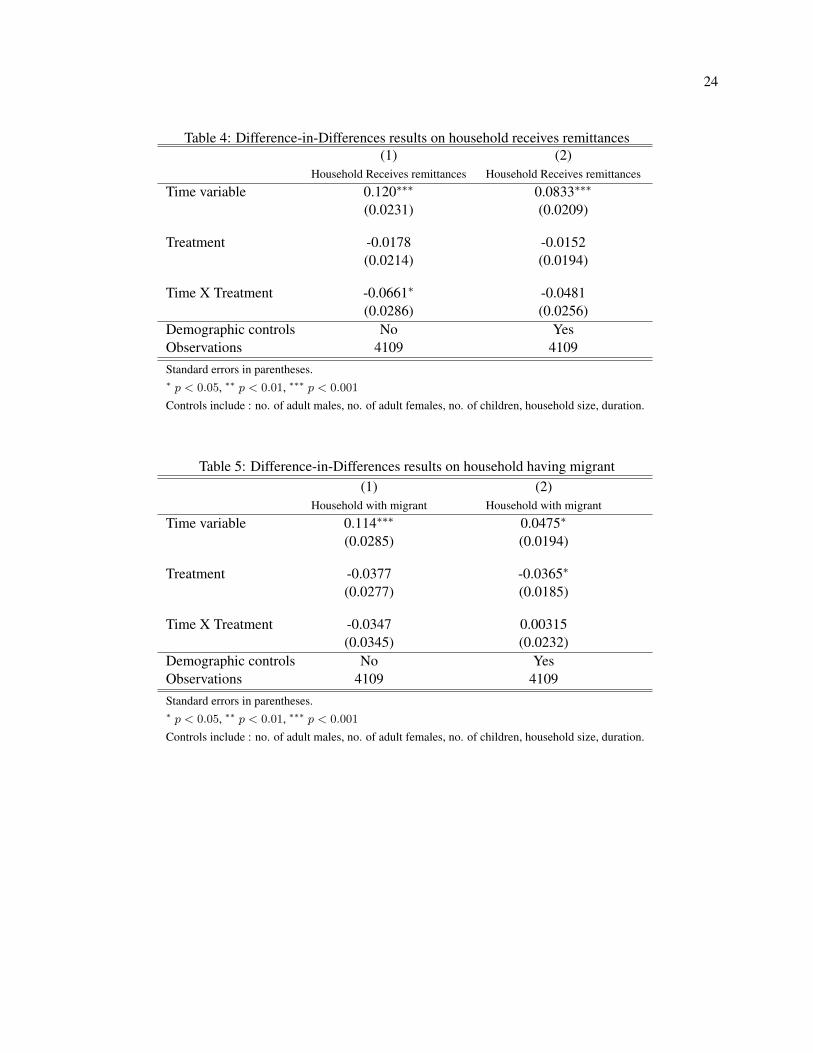
Table 4 shows the effect of program on household receiving remittances. The program effect is signif-
icant at 0.05 level for specification with no demographic controls and fixed effect. There is a six percent
decrease in the probability of household receiving remittances. However, after including the demographic
controls and village level fixed effects (specifications in column 2 and 3 of Table 4), the program causes
decrease in the probability that a household will receive remittances by 4.8 percent, although the estimates
in both specifications are not statistically significant. Table 5 presents the effect of the program on the pro-
portion of migrants in the household. Column 1 shows the decrease in migrant due to the program effect but
it is not statistically different from zero. Including demographic controls and village level fixed effect in the
specification shows the change in sign but the estimates are not statistically different from zero. In addition
to the difference-in-differences, I also perform the local average treatment effect (LATE) estimate of the

12
program on amount of remittances, household with migrants, and household receiving remittances. Table 6
presents the LATE effect of the program. LATE estimates for amount of remittances, household with mi-
grants, and household receiving remittances are not statistically significant showing that there is no effect of
the program on compliers. The LATE results indicate that the always-takers or never-takers are driving the
difference-in-differences results atleast for amount of remittances received. The difference-in-differences
results are relevant considering it shows the effect on the whole sample rather than LATE estimate, which
only focuses on the compliers.
To explore the breakdown by type of migration, I separate the migrants into domestic and international
categories. Domestic migration can be considered less costly than international migration both emotionally
and monetarily. To avoid potential endogeneity, I perform IV estimation of the program effects on interna-
tional and domestic migration. The local average treatment effect (LATE) estimate in Table 7 shows an 11.1
percent increase in domestic migrants while the probability that the household has at least one international
migrants decreases, but is not statistically significant. The result can be the short-run effect of the program
as shown by Stecklov, Winters, Stampini, and Davis (2005) in case of Mexico. Angelucci (2013) using the
data from the same program shows the Stecklov, Winters, Stampini, and Davis (2005) result might result
from treating both labor related and non-labor migration as same. To address the pooling issue, I further di-
vide the migration into labor-related and non-labor related migration and perform the LATE estimate. Table
8 shows that migration other reasons besides labor increases by 8 percent while impact on the labor related
migration is not statistically significant8. The result is consistent with the notion that the increase in the
income level of an extremely poor household helps it to finance job search for the domestic labor market.
Finding work in domestic labor market tends to be relatively cheaper than finding a job in another country’s
labor market. Over time the domestic labor migration allows a household to finance international migration
in presence wage differentials in domestic and international labor market for similar skills. Even for those
households that are not extremely poor, international migration in the context of Nepal is a costly process .
Considering the cost difference of domestic and international migration, the increase in domestic migration
can be associated with households postponing the costly decision of international migration in the presence8Migration other includes migration due to education, health, social reasons such as wedding.
13
of income-generating activities of PAF.
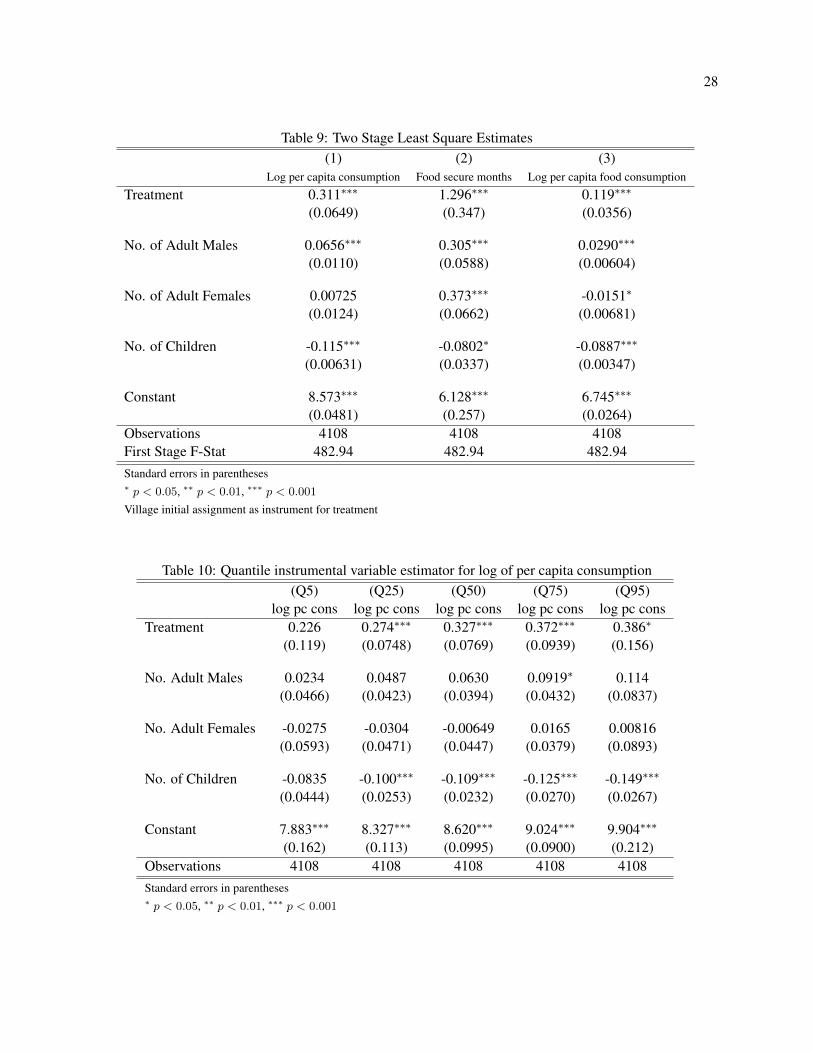
Next, I assess the effect of the program on welfare measures, I perform the intent-to-treat effect of the
program on the log of real per capita consumption, food sufficiency in months, and log of per capita food
consumption. The program has a positive and statistically significant effect on welfare measures of the
households as shown in the first row of Table 9. Column 1 of Table 9 presents the effect of the program on
log of per capita consumption. The program has 31 percent increase in per capita consumption. Column 2
shows the effect of program on food-secure month. The program increases the food-secure month by 1.29
months. In case of per capita food consumption, the program causes 11.9 percent increase as shown in
column 3. Considering the anti-poverty program to have a distributional effect, I assess treatment effects at
the 5, 25, 50, 75 and 95 quantiles of log of real per capita consumption, food sufficiency in months, and log
of per capita food consumption. The results of the analyses are presented in Tables 10, 11, and 12.
Table 10 shows significant positive effects of the program on real per capita consumption ranging from
27 percent to 38 percent. The result is statistically significant at 25, 50, 75 and 95 quantile of the log of real
per capita consumption distribution. The number of children significantly decreases the per capita consump-
tion by 10 to 15 percent in 25 to 95 quantile of consumption distribution. Table 11 shows that food-secure
months are only significant at the 25 and 50 quantiles. The program increases the number of food-secure
month by 1.4 to 2.3 months per year. The demographic controls are not statistically significant at all the
distribution of food-secure month. For real per capita food consumption, I find positively significant effects
at the 25, 50, and 75 quantiles of food consumption distribution. The per capita food consumption increases
by 11 to 14 percent as shown in Table 12. The number of children decreases the per capita food consumption
between 8.6 to 9 percent at all food consumption distribution. The results shows the statistically significant
welfare effect at the middle of the consumption distribution and not at the tails of the distribution. The
results shows that the program may not have effect especially at the lower quantile.
For the two remaining districts, Humla and Jumla, I perform before and after analysis to access the
effect of the program. Table 13 shows the before and after effect of the program on all the variables that

14
were studied in the remaining four districts. The trend in these districts shows the outcome variables are
increasing except for log of real per capita food consumption. Table 13 column 3 shows p values for before
and after comparison of variables. Remittances, household receiving remittances recipient and per capita
consumptions are statistically different in means before and after treatment.
6 Conclusion and Discussion
This paper analyzes the role of an anti-poverty program on migration, private transfers, and welfare mea-
sures. The findings show the crowd out of private transfers in the presence of public transfers. The program
causes an increase in domestic migration and no change in international migration unlike the existing trend
of increased international migration in Nepal. The program has a positive effect on per capita consumption,
and food security measures. The effect is significant at the middle of the welfare distribution. The program
may not have effect especially at the lowest quantile of the consumption distribution.
This study fills the gap in the literature by investigating the causal impact of income-generating activities
on remittances and migration. Remittances and migration have vital roles in developing economies. The pa-
per provides results consistent with short-run behavior as shown by Stecklov, Winters, Stampini, and Davis
(2005) in the case of Mexico. Findings from this paper can help to understand the role of community-driven
development programs for issues such as youth migration and remittances (distinct from primary goals such
as poverty and nutritional outcomes).
Most of these programs are placed in conflict-affected countries. The countries are traditionally agricul-
tural economies with mostly semi-skilled and unskilled labor force. Such income-generating interventions
can create economic growth at a local level. Economic growth in the least developing countries is likely to
increase emigration, as increased income allows people to afford migration. Increased income also allows
households to invest in the better education of youth. Educated youth are more likely to migrate to places
with better working conditions and higher pay for the same skill-set of jobs.

15
International migration is often a risky process. Scores of anecdotal evidence suggest this fact from
Nepali migrants abroad. The issues related to violence against migrants at destination countries, unsafe liv-
ing and working conditions, breach of initial contracts related to wage and duties, risk of being incarcerated
trying to break the contracts, and loss of right to return to the home country without employers consent put
added risks that can cause potential migrants to postpone the international migration. One of the factors that
drive international labor migration is wage differentials and aspiration to better life. Having public informa-
tion about the risk of migration to popular destination countries can discourage the potential migrants with
relaxed financial constraints to postpone international migration until credible information concerning jobs
are obtained. Presence of a large number of recruitment agencies in the major cities of Nepal can motivate
potential migrants to move domestically from the rural villages to obtain information on international mi-
gration. Results in this paper showing the increase in domestic non-labor related migration support the fact.
The time-frame used in the paper can be considered as a short-run effect of the anti-poverty program. The
results are consistent with a postponement of the risky international migration decision in the expectation
of credible information and factoring in the cost-benefit effect of international migration at the household
level. In a longer run, most of the semi-skilled and unskilled individuals are likely to migrate to global labor
markets in the absence of sizable domestic industrial sectors or predominance of service sectors that are
human capital intensive as suggested by various demographic researchers.
Youth involvement is important to the success of most features of community-driven programs. One
of the implications of this analysis is that potential migrants, if given appropriate income-generating ac-
tivities, will stay at home. However, this may be a short-term effect. In the longer run, the programs can
lead to increase in international migration due to wage differentials. The impact of such programs provides
a new direction for employment creation and entrepreneurship at the village level in developing countries.
Programs like PAF can make the households self-sufficient and hence fulfill the main goal of sustainable
poverty alleviation and empowerment of marginalized communities.
16
References
ABADIE, A., J. ANGRIST, AND G. IMBENS (2002): “Instrumental Variables Estimates of the Effect of
Subsidized Training on the Quantiles of Trainee Earnings,” Econometrica, 70(1), 91–117. 10
ALBARRAN, P., AND O. P. ATTANASIO (2002): “Do Public Transfers Crowd Out Private Transfers? Evi-
dence from a Randomized Experiment in Mexico,” Working Paper Series UNU-WIDER Research Paper,
World Institute for Development Economic Research (UNU-WIDER). 1
ANGELUCCI, M. (2013): “Migration and Financial Constraints: Evidence from Mexico,” IZA Discussion
Papers 7726, Institute for the Study of Labor (IZA). 1, 3, 4, 5, 12
BAZZI, S. (2014): “Wealth Heterogeneity and the Income Elasticity of Migration,” . 4
BERTRAND, M., E. DUFLO, AND S. MULLAINATHAN (2004): “How Much Should We Trust Differences-
in-Differences Estimates?,” The Quarterly Journal of Economics, MIT Press, 119(1), 249–275. 10
BHANDARI, P. (2004): “Relative Deprivation and Migration in an Agricultural Setting of Nepal,” Popula-
tion and Environment, 25(5), 475–499. 3
BRYAN, G., S. CHOWDHURY, AND A. M. MOBARAK (2014): “Underinvestment in a Profitable Technol-
ogy: The Case of Seasonal Migration in Bangladesh,” Econometrica, 82(5), 1671–1748. 3
CLEMENS, M. (2014): “Does Development Reduce Migration?,” . 2
CLEMENS, M. A. (2011): “Economics and Emigration: Trillion-Dollar Bills on the Sidewalk?,” Journal of
Economic Perspectives, 25(3), 83–106. 1
COX, D. (1987): “Motives for Private Income Transfers,” Journal of Political Economy, 95(3), 508–46. 1
COX, D., AND E. JIMENEZ (1990): “Achieving Social Objectives through Private Transfers: A Review,”
World Bank Research Observer, 5(2), 205–18. 1
DERANIYAGALA, S. (2005): “The Political Economy of Civil Conflict in Nepal,” Oxford Development
Studies, 33(1), 47–62. 6
17
FRLICH, M., AND B. MELLY (2010): “Estimation of quantile treatment effects with Stata,” Stata Journal,
10, 423–457. 10
JENSEN, R. T. (2004): “Do private transfers ’displace’ the benefits of public transfers? Evidence from
South Africa,” Journal of Public Economics, 88(1-2), 89–112. 4
OLIVER, A. (2009): “Does poverty alleviation increase migration? evidence from Mexico,” MPRA Paper
35076, University Library of Munich, Germany. 4
PARAJULI, D., G. ACHARYA, N. CHAUDHURY, AND B. B. THAPA (2012): “Impact of Social Fund on
the Welfare of Rural Household: Evidence from the Nepal Poverty Alleviation Fund,” Discussion paper,
World Bank. 7
SHARMA, K. (2006): “The political economy of civil war in Nepal,” World Development, 34(7), 1237 –
1253. 6
STECKLOV, G., P. WINTERS, M. STAMPINI, AND B. DAVIS (2005): “Do Conditional Cash Transfers Influ-
ence Migration? A Study Using Experimental Data from the Mexican Progresa Program,” Demography,
42(4), pp. 769–790. 4, 5, 12, 14
THE MINISTRY OF FINANCE (2013): “Economic Survey FY 2012-2013,” Discussion paper, Government
of Nepal, Ministry of Finance. 2, 3
(2014): “Economic Survey FY 2013-2014,” Discussion paper, Government of Nepal, Ministry of
Finance. 3
THE POVERTY ALLEVAIATION FUND (2014): “Poverty Alleviation Fund, Nepal,” Discussion paper,
Poverty Alleviation Fund, Poverty Alleviation Fund, Nepal (PAF, Nepal), Tahachal, Kathmandu, P.O.Box
9985, Kathmandu, Nepal. 7
THE POVERTY ALLEVIATION FUND (2013): “Poverty Alleviation Fund Annual Progress Report
2012/2013,” Discussion paper, Poverty Alleviation Fund, Nepal. 6
THE WORLD BANK (2006): “Community-Driven Development in the Context of Conflict-Affected Coun-
tries: Challenges and Opportunities,” Discussion paper, The World Bank. 6

18
WILLIAMS, N. E. (2013): “How community organizations moderate the effect of armed conflict on migra-
tion in Nepal.,” Population Studies, 67(3), 353 – 369. 6
WONG, S. (2012): “What Have Been the Impacts of World Bank Community-Driven Development Pro-
grams?,” Discussion paper, The World Bank. 6
19
Figure 1: Remittances and migration trend according to Ministry of Finance of Nepal

20
Figure 2: Remittances distribution in 2007 and 2010
Figure 3: Migrants proportion in 2007 and 2010

21
Figure 4: Remittances recipient proportion in 2007 and 2010
22
Table 1: Balancing test of variables in baseline in four districts: Treatment Implementation(1) (2) (3)
(Mean Control) (Mean Treatment) ( P-value for difference)Remittances 6433.84 5244.48 0.15
(688.01 ) ( 493.96)Remittances Recipient 0.18 0.166 0.295
(0.013) (0.011)Migrants 0.41 0.37 0.085
(0.017) (0.014)Migration for Work 0.36 0.32 0.075
(0.017) (0.013)Migration for Other 0.08 0.09 0.358
(0.009) (0.008)No. Adult Males 1.97 1.90 0.14
(0.04) (0.03)No. Adult Females 1.90 1.77 0.004
(0.04) (0.03)No. Children 2.53 2.59 0.39
(0.06) (0.05)Household Size 5.92 5.80 0.2714
(0.088) (0.073)Asset Index -0.089 -0.001 0.059
(0.029) (0.033)Domestic Migrant 0.12 0.13 0.489
(0.011) (0.01)International Migrant 0.31 0.27 0.051
(0.016) (0.013)Per cap Income 10294.17 10135.75 0.663
(276.6496 ) (230.7192 )Total Consumption 75320.01 78891 0.046
( 1296.117) ( 1184.881)Standard errors in parentheses
Humla and Jumla districts are excluded as all sample villages in the districts were treated.
Asset Index is calculated using data on housing characteristics and land holdings.
23
Table 2: Difference-in-Differences results on amount of remittances(1) (2)
Amount of Remittances Amount of Remittances
Time variable 8278.9∗∗∗ 6542.2∗∗∗
(1813.8) (1712.7)
Treatment -1188.1 -797.0(1014.6) (967.9)
Time X Treatment -6700.5∗∗∗ -6039.3∗∗
(2017.6) (1958.7)Demographic controls No YesObservations 4109 4109Standard errors in parentheses.∗ p < 0.05, ∗∗ p < 0.01, ∗∗∗ p < 0.001
Controls include : no. of adult males, no. of adult females, no. of children, household size, duration.
Table 3: Breakdown of Remittances into international and domestic(1) (2)
International Remittances Domestic RemittancesDiff in diffs 6650.7∗∗∗ -103.3
(1703.8) (360.2)Demographic controls Yes YesObservations 4109 4109Standard errors in parentheses.∗ p < 0.05, ∗∗ p < 0.01, ∗∗∗ p < 0.001
Controls include : no. of adult males, no. of adult females, no. of children, household size, duration.
24
Table 4: Difference-in-Differences results on household receives remittances(1) (2)
Household Receives remittances Household Receives remittances
Time variable 0.120∗∗∗ 0.0833∗∗∗
(0.0231) (0.0209)
Treatment -0.0178 -0.0152(0.0214) (0.0194)
Time X Treatment -0.0661∗ -0.0481(0.0286) (0.0256)
Demographic controls No YesObservations 4109 4109Standard errors in parentheses.∗ p < 0.05, ∗∗ p < 0.01, ∗∗∗ p < 0.001
Controls include : no. of adult males, no. of adult females, no. of children, household size, duration.
Table 5: Difference-in-Differences results on household having migrant(1) (2)
Household with migrant Household with migrant
Time variable 0.114∗∗∗ 0.0475∗
(0.0285) (0.0194)
Treatment -0.0377 -0.0365∗
(0.0277) (0.0185)
Time X Treatment -0.0347 0.00315(0.0345) (0.0232)
Demographic controls No YesObservations 4109 4109Standard errors in parentheses.∗ p < 0.05, ∗∗ p < 0.01, ∗∗∗ p < 0.001
Controls include : no. of adult males, no. of adult females, no. of children, household size, duration.

25
Table 6: LATE estimator for amount of remittances, household with migrants, and household receivingremittances
(1) (2) (3)Amount of Remittances Household Receives remittances Household with migrant
Treatment Status -2195.3 -0.0435 0.0333(2659.9) (0.0388) (0.0454)
No. Adult Males 4100.1∗∗∗ 0.0792∗∗∗ 0.154∗∗∗
(450.7) (0.00658) (0.00769)
No. Adult Females 2275.8∗∗∗ 0.0197∗∗ 0.014(507.8) (0.00741) (0.00866)
No. Children 207.7 0.00622 -0.00343(258.6) (0.00377) (0.00441)
Constant -3743.1 0.0293 0.0903∗∗
(1969.2) (0.0287) (0.0336)Observations 4108 4108 4108First Stage F-Stat 482.94 482.94 482.94Standard errors in parentheses∗ p < 0.05, ∗∗ p < 0.01, ∗∗∗ p < 0.001
Village initial assignment as instrument for treatment

26
Table 7: Two Stage Least Square Estimates(1) (2)
International migrant(0,1) Domestic migrant(0,1)Treatment Status -0.0363 0.111∗∗
(0.0436) (0.0348)
No. Adult Males 0.111∗∗∗ 0.0778∗∗∗
(0.00739) (0.00589)
No. Adult Females 0.00264 0.0265∗∗∗
(0.00833) (0.00664)
No. Children 0.00809 -0.0139∗∗∗
(0.00424) (0.00338)
Constant 0.0881∗∗ -0.0750∗∗
(0.0323) (0.0257)Observations 4108 4108First Stage F-Stat 482.94 482.94Standard errors in parentheses∗ p < 0.05, ∗∗ p < 0.01, ∗∗∗ p < 0.001
Village initial assignment as instrument for treatment

27
Table 8: Two Stage Least Square Estimates(1) (2)
Migration Labor(0,1) Migration Other(0,1)Treatment Status -0.028 0.08∗∗
(0.0446) (0.0297)
No. Adult Males 0.14∗∗∗ 0.06∗∗∗
(0.00756) (0.005)
No. Adult Females 0.01∗∗∗ 0.04∗∗∗
(0.009) (0.01)
No. Children 0.01∗∗∗ -0.013∗∗∗
(0.004) (0.003)
Constant 0.08∗∗ -0.08∗∗
(0.03) (0.02)Observations 4108 4108First Stage F-Stat 482.94 482.94Standard errors in parentheses∗ p < 0.05, ∗∗ p < 0.01, ∗∗∗ p < 0.001
Village initial assignment as instrument for treatment
28
Table 9: Two Stage Least Square Estimates(1) (2) (3)
Log per capita consumption Food secure months Log per capita food consumption
Treatment 0.311∗∗∗ 1.296∗∗∗ 0.119∗∗∗
(0.0649) (0.347) (0.0356)
No. of Adult Males 0.0656∗∗∗ 0.305∗∗∗ 0.0290∗∗∗
(0.0110) (0.0588) (0.00604)
No. of Adult Females 0.00725 0.373∗∗∗ -0.0151∗
(0.0124) (0.0662) (0.00681)
No. of Children -0.115∗∗∗ -0.0802∗ -0.0887∗∗∗
(0.00631) (0.0337) (0.00347)
Constant 8.573∗∗∗ 6.128∗∗∗ 6.745∗∗∗
(0.0481) (0.257) (0.0264)Observations 4108 4108 4108First Stage F-Stat 482.94 482.94 482.94Standard errors in parentheses∗ p < 0.05, ∗∗ p < 0.01, ∗∗∗ p < 0.001
Village initial assignment as instrument for treatment
Table 10: Quantile instrumental variable estimator for log of per capita consumption(Q5) (Q25) (Q50) (Q75) (Q95)
log pc cons log pc cons log pc cons log pc cons log pc consTreatment 0.226 0.274∗∗∗ 0.327∗∗∗ 0.372∗∗∗ 0.386∗
(0.119) (0.0748) (0.0769) (0.0939) (0.156)
No. Adult Males 0.0234 0.0487 0.0630 0.0919∗ 0.114(0.0466) (0.0423) (0.0394) (0.0432) (0.0837)
No. Adult Females -0.0275 -0.0304 -0.00649 0.0165 0.00816(0.0593) (0.0471) (0.0447) (0.0379) (0.0893)
No. of Children -0.0835 -0.100∗∗∗ -0.109∗∗∗ -0.125∗∗∗ -0.149∗∗∗
(0.0444) (0.0253) (0.0232) (0.0270) (0.0267)
Constant 7.883∗∗∗ 8.327∗∗∗ 8.620∗∗∗ 9.024∗∗∗ 9.904∗∗∗
(0.162) (0.113) (0.0995) (0.0900) (0.212)Observations 4108 4108 4108 4108 4108Standard errors in parentheses∗ p < 0.05, ∗∗ p < 0.01, ∗∗∗ p < 0.001

29
Table 11: Quantile instrumental variable estimator for food security(Q5) (Q25) (Q50) (Q75) (Q95)
Food secure months Food secure months Food secure months Food secure months Food secure months
Treatment 1 1.417∗ 2.333∗∗∗ 1.000 -3.98e-15(0.901) (0.604) (0.545) (0.917) (0.0985)
No. of Adult Males 0.352 0.333 0.333 3.61e-16 -4.44e-16(0.451) (0.350) (0.216) (0.0886) (0.0526)
No. of Adult Females 0.0370 0.333 0.333 -9.95e-17 1.44e-15(0.383) (0.356) (0.252) (0.101) (0.0537)
No. of Children 0.130 0.0833 4.02e-16 -8.95e-16 -1.55e-15(0.291) (0.171) (0.152) (0.0492) (0.0323)
[1em] Constant 0.481 3.500∗∗∗ 6.000∗∗∗ 11∗∗∗ 12∗∗∗
(1.077) (0.881) (0.681) (0.935) (0.142)Observations 4108 4108 4108 4108 4108Standard errors in parentheses∗ p < 0.05, ∗∗ p < 0.01, ∗∗∗ p < 0.001

30
Table 12: Quantile instrumental variable estimator for log of per capita food consumption(Q5) (Q25) (Q50) (Q75) (Q95)
log pc food cons log pc food cons log pc food cons log pc food cons log pc food cons
Treatment 0.0804 0.105∗ 0.118∗∗ 0.135∗∗ 0.112(0.0742) (0.0449) (0.0450) (0.0491) (0.0801)
No. of Adult Males 0.0138 0.0119 0.0286 0.0253 0.0647(0.0339) (0.0200) (0.0215) (0.0280) (0.0543)
No. of Adult Females -0.0326 -0.0167 -0.0220 -0.0224 -0.0374(0.0496) (0.0257) (0.0216) (0.0289) (0.0550)
No. of Children -0.0912∗∗∗ -0.0898∗∗∗ -0.0887∗∗∗ -0.0872∗∗∗ -0.0865∗∗
(0.0263) (0.0144) (0.0160) (0.0169) (0.0296)
Constant 6.294∗∗∗ 6.583∗∗∗ 6.784∗∗∗ 7.014∗∗∗ 7.342∗∗∗
(0.0921) (0.0661) (0.0631) (0.0756) (0.116)Observations 4108 4108 4108 4108 4108Standard errors in parentheses∗ p < 0.05, ∗∗ p < 0.01, ∗∗∗ p < 0.001
Table 13: Before-After analysis for Jumla and Humla Districts(1) (2) (3)
(Mean Before Treatment) (Mean After Treatment) (p values for difference)Remittances(Rs) 408.25 1707.90 0.01
(122.56 ) (495.31)Remittances Recipient 0.026 0.06 0.005
(0.007) (0.01)Migrants 0.244 0.286 0.11
(0.018) (0.019)Per capita cons. (log) 8.56 8.88 0.00
(0.024) (0.028)Food secure(months) 8.11 8.20 0.56
(0.12) (0.11)Per capita food cons. (log) 6.91 6.87 0.20
(0.017) (0.02)Standard errors in parentheses