Embed Size (px)
Citation preview

IMPACT OF THE ECONOMIC CRISIS ON THE EU’S
INDUSTRIAL ENERGY CONSUMPTION
Francis Altdorfer
ECONOTEC, Belgium
1st December 2017
1
Odyssee-Mure webinar series on Energy Efficiency
Organised by Leonardo Energy

KEY QUESTIONS
1. To what extent is the decrease in the EU’s
industrial energy consumption after the economic
crisis due to energy efficiency improvements (as
measured through the ‘unit consumption’ of
industrial branches)?
2. What has been the impact of changes in
production level of industrial branches?
2

METHODOLOGY
• This policy brief analyses the relative importance
of:
– an ‘activity’ effect,
– a ‘structural’ effect,
– a ‘unit consumption’ effect
on the variation of the industrial energy consumption
in the EU since 2007, based on ODYSSEE data
(www.odyssee-mure.eu).
3

DECOUPLING OF ENERGY CONSUMPTION FROM
ECONOMIC GROWTH
4
80
85
90
95
100
105
2007 2008 2009 2010 2011 2012 2013 2014
GDP, primary energy consumption and CO2 emissions in EU28 (2007=100)
GDP
Primary energy consumption
Primary energy consumption (with climate correction)
Combustion CO2 emissions

INDUSTRY’S ENERGY CONSUMPTION HAS BEEN THE
MOST AFFECTED BY THE CRISIS
5
75
80
85
90
95
100
105
110
2007 2008 2009 2010 2011 2012 2013 2014
Final energy consumption in EU28 (2007=100)
Industry
Transport
Residential, tertiary and agricultural (with climate correction)

STRUCTURAL EFFECT
ON THE ENERGY CONSUMPTION VARIATION
• Two conditions:
– A diversity of energy intensities (toe/€ of value
added) across branches
– A diversity of activity variation across branches
6

STRUCTURAL EFFECT: DIVERSITY OF ENERGY INTENSITIES
7
0
200
400
600
800
1 000
1 200
2007 2008 2009 2010 2011 2012 2013 2014
Final energy intensity in EU28 (toe/M€2005)
Chemical industry Primary metals
Non-metallic minerals Paper and printing industry
Food industry Textile and leather industry
Machinery Transport equipment industry
STRUCTURAL EFFECT: DIVERSITY OF ACTIVITY VARIATION
8
65
70
75
80
85
90
95
100
105
110
2007 2008 2009 2010 2011 2012 2013 2014
Production index by industrial branch in EU28 (2007=100)
Chemical industry Primary metals
Non-metallic minerals Wood industry
Paper and printing industry Food industry
Textile and leather industry Machinery
Transport equipment industry Manufacturing industries

DIVERSITY OF UNIT CONSUMPTION VARIATIONS
9
70
80
90
100
110
120
130
140
150
2007 2008 2009 2010 2011 2012 2013 2014
Unit consumption index by branch for EU28 (2007=100)
Chemical industry Primary metals
Non-metallic minerals Wood industry
Paper and printing industry Food industry
Textile and leather industry Machinery
Transport equipment industry Other industries

BREAKDOWN OF THE VARIATION IN ENERGY
CONSUMPTION SINCE 2007
• Three components:
– Activity effect
• Proportional to the production index of
manufacturing industry as a whole
– Unit consumption effect
• Difference between the observed energy
consumption and the one that would have taken
place had the unit consumption of each branch
stayed at is level of 2007
– Structural effect
• Calculated by difference
10

BREAKDOWN OF THE VARIATION IN ENERGY
CONSUMPTION SINCE 2007
– The Structural effect is equal to the variation in
energy consumption that would have taken place
if the unit consumption of each branch had stayed
at its level of 2007, minus the activity effect
11

ILLUSTRATION OF THE BREAKDOWN
FOR A SINGLE BRANCH
12
2007 2014
Energy
consumption
0

ILLUSTRATION OF THE BREAKDOWN
FOR A SINGLE BRANCH
13
2007 2014
Energy
consumption
Structural effect
Unit consumption effect
Activity
effect
Energy consumption
variation
0
-20%
-15%
-10%
-5%
0%
2007 2008 2009 2010 2011 2012 2013 2014
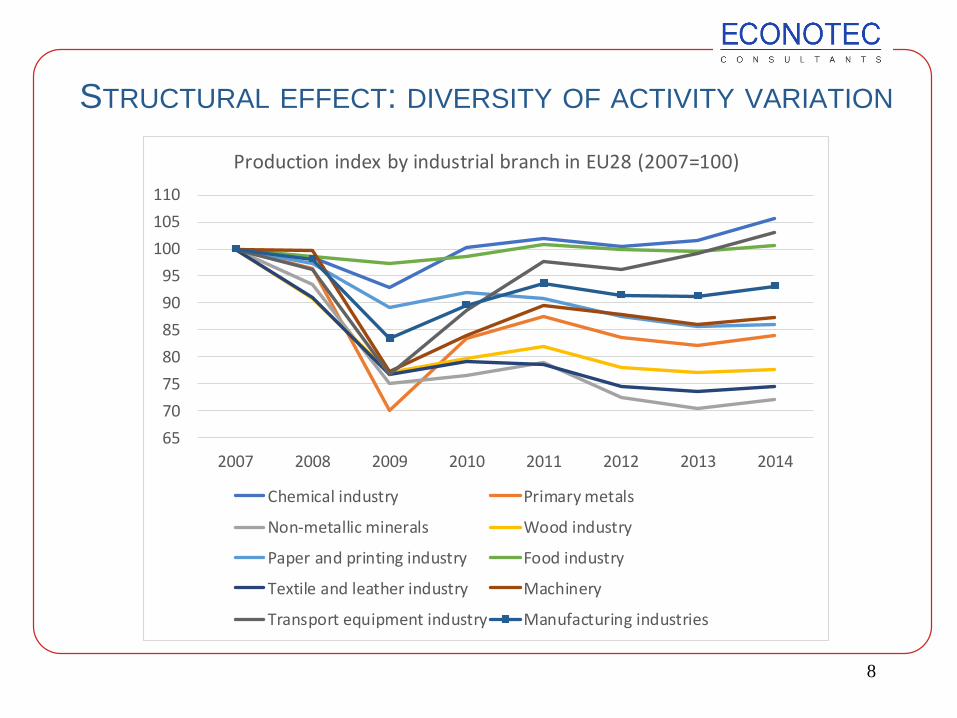
Breakdown of the energy consumption variation 2007-
2014 in EU28 manufacturing industry (% of the energy consumption in 2007)
Activity effect Structural effect Unit consumption effect Total
ENERGY CONSUMPTION VARIATION = ACTIVITY EFFECT
+ STRUCTURAL EFFECT + UNIT CONSUMPTION EFFECT
14

-20%
-15%
-10%
-5%
0%
2007 2008 2009 2010 2011 2012 2013 2014
Breakdown of the energy consumption variation 2007-
2014 in EU28 manufacturing industry (% of the energy consumption in 2007)
Activity effect Structural effect Unit consumption effect Total
IN 2009 AND 2010, THE DECREASE IN ENERGY
CONSUMPTION IS ESSENTIALLY AN ACTIVITY EFFECT
15

-20%
-15%
-10%
-5%
0%
2007 2008 2009 2010 2011 2012 2013 2014
Breakdown of the energy consumption variation 2007-
2014 in EU28 manufacturing industry (% of the energy consumption in 2007)
Activity effect Structural effect Unit consumption effect Total
IN 2011-2014, THE STRUCTURAL AND UNIT EFFECTS
ALSO HAVE A SIGNIFICANT CONTRIBUTION
16
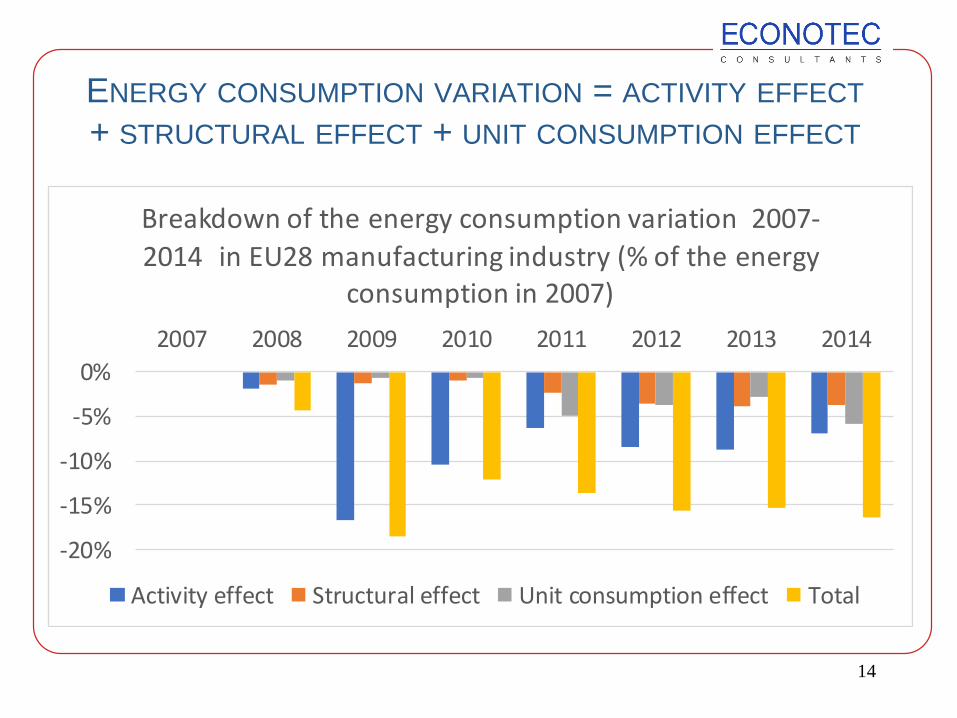
OBSERVATIONS
• In 2014, the activity, structural and unit
consumption effects represent a reduction of
respectively 7%, 4% and 6% of the consumption in
2007.
• In absolute terms, this is respectively 22 Mtoe,
12 Mtoe and 18 Mtoe.
17

UNIT CONSUMPTION EFFECT
• The unit consumption effect gives an indication of
the level of energy savings (energy efficiency
improvement).
• It comprises not only the impact of energy
efficiency policies but also that of ‘natural’ energy
efficiency improvements (i.e. those due to technical
progress and investments in new equipment).
• However, this indicator remains imperfect, mainly
because of the structural effects taking place inside
each of the branches.
18

INTRA-BRANCH STRUCTURAL EFFECTS
Examples:
• Product shifts between energy-intensive and less
energy-intensive products (e.g. in chemical
industry, comprising pharmaceuticals as well as
energy intensive petrochemicals)
• Shifts in types of raw material (e.g. replacement of
clinker by blast furnace slag in the cement industry)
• Process shifts (replacement of oxygen steel with
electric steel)
19

INTRA-BRANCH STRUCTURAL EFFECTS
• Some of these structural effects may or may not be
considered as energy savings, depending on the
definition of energy savings.
– Example:
• Replacing oxygen steel with electric steel may be
considered either as an energy saving or a
structural effect.
• These intra-branch structural effects may be either
positive or negative. Hence, energy savings may
be underestimated or overestimated.
20

LARGE DISPARITY ACROSS INDIVIDUAL COUNTRIES
21
-40%
-20%
0%
20%
40%
EU28 DE FR UK IT ES PL
Breakdown of energy consumption variation 2007-2014
for 6 countries (% of energy consumption of manufacturing industry in 2007)
Activity effect Structural effect Unit consumption effect Total

LARGE DISPARITY ACROSS INDIVIDUAL COUNTRIES
• The 6 countries are the largest energy consumers,
totalling 69% of the total EU28 primary energy
consumption.
• Among these countries, the unit consumption effect
over the 2007-2014 period extends from 0% in
Germany (where there is actually an increase for
‘chemical industry’ and ‘wood industry’) up to -31%
in Poland.
• The structural effect ranges from +2 % in Italy to -
11 % in Poland for the same period.
• The activity effect reaches +31% in Poland.
22

BREAKDOWN BY
BRANCH
Breakdown of the EU28
energy consumption
variation 2007-2014 by
branch (% of energy
consumption of
manufacturing industry
in 2007)
23
-20% -15% -10% -5% 0% 5%
Chemical industry
Primary metals
Non-metallic minerals
Wood industry
Paper and printing
Food industry
Textile and leather
Machinery
Transport equipment
Other industries
Manufacturing industry
Activity effect Structural effect Unit consumption effect Total

BREAKDOWN BY BRANCH
• The structural effect is mainly due to ‘non-metallic
minerals’ (-3.0%) and ‘primary metals’ (-2.1%), and
is partly compensated by ‘chemical industry’
(+2.3%).
• The unit consumption effect is mainly due to the
chemical industry.
N.B.: for a same branch, energy savings in countries
with a negative unit consumption effect may be
hidden by increases in unit consumption (due to a
shift in products for example) in other countries.
24

CONCLUDING REMARKS
• The analysis, for EU28, tends to show that:
– The reduction in industrial energy consumption in
2009-2010 can almost entirely be attributed to the
decline in production.
– The later evolution of energy consumption is due not
only to industrial activity, but also to a reduction in
branch unit consumptions (a proxy for energy
efficiency improvement) and to a structural effect (a
smaller weight of energy intensive branches), hence
a decoupling of energy consumption from activity.
– Significant disparities do exist across branches and
countries.25

THANK YOU FOR YOUR ATTENTION
26
• For further information: www.odyssee-mure.eu
• Contact: [email protected]