Embed Size (px)
Citation preview

1
Impact of the economic and financial crisis on the skills and employability of young people in the Arab region
Mary Kawar
ILO regional office for Arab States 2010

2
Introduction While recognizing the variety of challenges facing individual countries, the common problem identified across the Arab region is that investments in education and training are not yet resulting in satisfactory levels of productive employment. Young people face uncertainty in moving from education into decent work. Enterprises often have trouble finding enough people with the skills they need to be able to expand their business or adopt new technologies. Also, the opportunities for employment growth due to industrial diversification and trade patterns may be jeopardized because skills development systems are not oriented towards preparing the workforce for the labour market of the future. Thus we see cases of high unemployment among workers, or employment concentrated in work of low productivity in the informal economy, coinciding with labour shortages for enterprises. Skill gaps are not the only likely explanation, of course. Labour market conditions, especially prevailing wages, the industrial structure of the economy and population growth are other key explanatory factors. Indeed, it is important to acknowledge that skills development is a critical element in achieving the economic goals which countries set for themselves. Many Arab countries are aware if this fact but have not fully succeeded in taking advantage of emerging opportunities by matching the demand for labour with new skills and by creating an adaptable workforce that can adjust to changing labour market conditions. The current financial and economic crisis has brought this to the fore front.1 While we do not know what shape the recovery will take we do know that the recovery in employment will be slower.2 In a situation where there might be low demand for jobs, if not job losses, it is essential to focus policy attention to the need to re-think approaches to skills development and employability in the region. One international framework for this is the adoption of the Global Jobs Pact by the International Labour Conference in June 2009, and which responds to the twin objectives of: “(1) mitigating the impact of the crisis on workers and enterprises, and speeding up labour market recovery; and (2) addressing the structural problems, the jobs and decent work deficit, or the “crisis before the crisis”. It is important to note here, however, that the Arab region which includes 22 countries in the Middle East and North Africa is quite diverse in terms of political, social and economic conditions and perspectives on development, employment and social inclusion. This diversity ranges from demographic parameters (countries with a large population and an abundant labour force versus those with a small population and a minority domestic labour force) to the criteria of income (the region includes some of the richest and the poorest countries) as well as the specific constraints of countries affected by crises and conflicts (such as Iraq, occupied Palestinian territory and Sudan). This also means a different impact of the economic and financial crisis on the different countries. As such, this paper will try as much as possible to reflect the reality of this diverse region. This paper is structured in two parts; the first part provides an analytical review of main skills and employability challenges and recent trends which relate to existing conditions prior to the crisis. The second part relates specifically to the impact of the crisis on the issue of skills and employability and it will attempt to identify solutions such as avoiding job losses supporting enterprises and workers in adjustment.
1 For updated information on employment trends, please refer to ILO’s Global Employment Trends for Youth, August 2010, available at: http://www.ilo.org/empelm/what/pubs/lang--en/docName--WCMS_143349/index.htm 2 Employment recovery lags behind financial recovery with a time lag of around 5 years. This is learned from previous crisis. This was Keynes fundamental insight regarding demand management from the Great Depression. And there were also many lessons from the Asian Crisis of 1997-98.

3
1. PRE-EXISITNG REGIONAL TRENDS AND CHALLENEGS IN S KILLS AND EMPLOYABILITY 1.1 Youth employment and unemployment Unemployment in the Arab countries is first and foremost the problem of youth unemployment. In fact unemployment among Arab youth is the highest in the World. Youth unemployment represents 50%, on average, of all unemployment and it is higher among females.3 Over and above, youth unemployment in the Arab world has recently reached high levels. For instance, the Palestinian Occupied Territories has seen the highest increase in youth unemployment from 22% in 2000 to 41.2% in 2008. Most countries have witnessed an increase in youth unemployment except for Bahrain whose rates plunged from 8.1% in 2000 to 4.1% in 2007. (Figure1) Figure 1. Youth unemployment rate for some Arab cou ntries
Source: ILO, Key Indicators of the Labour Market 6t h edition, Geneva 2009 ILO, LABORSTA Youth unemployment is mostly concentrated among the educated as a result of the incapability of the Arab economies to create enough jobs to sustain the annual increase in the labour force which is mostly composed of youth. Additionally, the gap between the educational system and the needs and requirements of the labour market in terms of skills, the absence of effective systems of public and private employment agencies and employment programmes are factors in the increase of youth unemployment.
3 ILO (2009) Growth, employment and decent work in the Arab Region: Key policy issues. Paper presented at the Arab Employment Forum, Beirut, October 19-21, 2009. ILO Regional Office. Beirut.
2005
2007
2007
2007
2008
2008
2008
Youth unemployment rate
0.0 10.0 20.0 30.0 40.0 50.0
Bahrain
Egypt
Morocco
Palestinian Occupied Territories
Saudi Arabia
Tunisia
United Arab Emirates
Latest year
2000

4
Figure 2: Youth Inactivity Rate (age 15-24) in the MENA Region for the years 2000 and 2008
Source: ILO, Key Indicators of the Labour Market 6th edition, Geneva 2009 Figure 2 shows that in most countries in the MENA region the youth inactivity rate has increased from 2000 to 2008. The largest increase was seen in Morocco where the youth inactivity rate increased from 53.3% in 2000 to 58.9% in 2008. However, some improvements were visible in a few countries. For instance, the most prominent improvement was seen in Qatar where the youth inactivity rate decreased from 68.8% in 2000 to 46.9% in 2008. This low inactivity rate is largely due to women whose labour force participation in Arab countries is the lowest among all other regions in the world. Promotion of opportunities for youth employment is a priority concern in most countries. Young people in the countries under study however are not a homogeneous group and their employment and employability prospects vary considerably. Many amongst the unemployed could become discouraged workers and stop seeking work with its potentially destructive effects on social cohesion. Yet, young women and men in the region are also making important contributions to their countries as productive workers and entrepreneurs when provided with opportunities. Their energy and capacity for innovation has been demonstrated in several sectors and need to be more fully unleashed.
1.2 Education and vocational training The region has improved access to education at all levels, with the data showing significant improvements over time in terms of enrolment rates, average years of schooling and literacy rates. The majority of Arab States have been able to achieve almost universal enrolment in primary education. On average across the Arab States, two thirds of secondary-age children are enrolled in secondary school. This share has increased the most for girls, from 56.5 per cent in 1999 to 65 per cent in 2006. However, girls’ enrolment still lags other regions, for example, compared to 75 per cent in East Asia and 90 per cent in Central Asia (Source: UNESCO website).

5
0
5
10
15
20
25
1999 2000 2001 2002 2003 2004 2005 2006 2007
Arab States Central and Eastern EuropeCentral Asia East Asia and the PacificLatin America and the Caribbean North America and Western EuropeSouth and West Asia
Availability of data on vocational education and training is more limited, and is more difficult to compare across countries. Data collected by UNESCO (Figure 3) show that the share of students in ISCED 2 and 3 enrolled in vocational training in the Arab States decreased from 14.5% in 1999 to 12.1% in 2007. The 14.5% rate that formerly matched those of the North America and European region (14.6%) and East Asia and the Pacific (14.2%) is now significantly below the 2007 rates of 13.8% and 14.2% respectively. Figure 3. Technical/Vocational education enrolment in ISCED 2 and 3 as a percentage of total enrolment in ISCED 2 and 3
Note: The UNESCO regions are not identical to the regions used in the ILO data bases. Source: UNESCO, http://stats.uis.unesco.org . However, this data must be treated with caution – both as an indicator of training within the Arab region and in comparison to other regions. Other sources estimate vocational training in the Arab region at significantly lower shares of secondary education, suggesting that typically less then 10 per cent of secondary students receive vocational or technical training.4 Across sources,
4 Kabbani and Kothari, 2005, Youth Employment in the MENA Region: A Situational Assessment, World Bank Social Policy Discussion Paper No. 0534.

6
data do not systematically capture apprenticeship-based training, and may not cover private training institutions as extensively as public ones.5 It is also difficult to draw conclusions from the data. Is the 12.1 per cent share of secondary education in vocational training too low or too high? The relatively large share of academic secondary education may reflect a social preference for academic pathways of education, or a perception that vocational training is synonymous with academic failure rather than an alternative path to productive and decent work. Or it could be an indicator of low quality of vocational training or of training that is above the financial means of students. If general and vocational education had consistently been of good quality and relevant to labour market needs, then we would expect to see lower unemployment rates at higher education levels. The data available for some countries in the Arab region show a different trend: workers with secondary education are the most likely to be unemployed. Workers with little or no education cannot afford to remain unemployed and so have no option but to accept low-paid jobs in the informal economy. At the other end of the spectrum, high unemployment rates may reflect a preference by educated young people to wait for jobs in the formal and public sectors. But as shown in Table 1, data for a handful of countries in the region show that unemployment rates are highest among those with secondary education. In fact, most of the unemployed are either semiskilled or have intermediate or secondary education. This raises questions about the quality or relevance of the training received. It also raises questions on how to deliver training better (e.g. vocational orientation instead of formal TVET, shorter modules of relevant training, work based training, etc). Table 1. Unemployment rates (%) by educational leve l for the working-age population (15-64 years) in selected countries in the Arab region Country Year Primary Secondary Tertiary
Algeria 2004 19.00 22.40 22.80
Morocco 2003 8.80 24.00 30.30 Palestinian Occupied Territories 2006 24.70 20.80 21.00
United Arab Emirates 2005 2.40 3.90 4.00 Source : ILO, Key Indicators of the Labour Market 6th editi on, Geneva 2009 Averaging across all age groups and education levels, the Arab region has consistently ranked number one in terms of overall unemployment rates, from 11.8 per cent in 1997 to 9.9 per cent in 2007. Unemployment rates for women in the region were significantly higher: in 1998, 16.1 and 18.3 in the Middle East and North Africa respectively; whereas in 2008, it decreased to 13.4 and 16.1. (ILO, Trends Econometric Models, January 2009) Education does not seem to explain the lower labour force participation by women. The data for secondary education, vocational training, and tertiary education show no significant disparities between male and female enrolment rates. And yet the differential in employment-to-population ratios between women and men in the MENA is the highest in the world: 52.6 and 24.7 per cent for women in the Middle East and North Africa compared to 81.7 per cent for men in the MENA region as a whole (ILO, Trends Econometric Models, January 2009). The implication would seem to be that countries interested in increasing employment opportunities for women would need to focus on issues other than basic and vocational education to catalyze that change. 5 For example, the share of vocational and technical training out of total secondary enrolment has been estimated by UNESCO at 27% in Egypt, 22% in Libya, 12% in Algeria, 8% in Tunisia, and 6% in Morocco (UNESCO Global Education Digest, 2007).

7
1.3 Labour productivity Figure 4 shows that most countries in the MENA region have seen an increase in productivity for the 2000-2008 period especially Qatar which witnessed the highest change among MENA countries and reached 236.8 (1990=100) or 30328 in constant 1990 US$. However, Syria, UAE and Yemen have experienced slight decreases. Figure 4 Productivity measured as output per person employed (1990=100)
Source: ILO. Key Indicators of the Labour Market 6t h edition, Geneva, 2009 Of more importance than nominal productivity is that productivity growth has been modest, at best, across the Arab region: a 1.8 per cent annual growth rate for the Middle East and 1.4 per cent annual growth rate for North Africa. Both these rates are lower than the average annual growth rate of the world at 2.1 per cent. The Middle East and North Africa region exceed only the growth pace of the Latin American and Caribbean region of 1.1 per cent (Figure 5).

8
Figure 5. Productivity level and growth rate, 2000- 2008
Source ILO, Trends Econometric Models, May 2009 Achievements in education across the Arab region have not led to satisfactory growth in employment and productivity. Low productivity growth is particularly ominous because it is productivity growth that provides the possibility for improved wages and living standards. Low growth in productivity is related to low demand for skills and this creates a vicious circle. On the labour supply side high unemployment rates among graduates may reduce the incentives to job seekers to invest in education. In turn under-investing in education causes productivity losses that reduce economic growth. On the demand side overall economies in the region are still biased towards low productivity investments (including real estate) which in the end result that the majority of the new jobs being crated are in low skilled Low wage jobs.6 While education and skills development are necessary factors to improve productivity and employment, they are not sufficient. Other critical factors include pro-employment macroeconomic policies; an enabling environment for sustainable enterprise; respect for workers’ rights, gender equality, and health and safety standards; social dialogue; and fundamental investments in health and physical infrastructure.7 6 Tzannatos Z. (2009). The Global Financial, Economic and Social Crisis in the Arab Countries: A Review of the Evidence and Policies for Employment Creation and Social Protection. Paper presented at the Arab Employment Forum, Beirut, October 19-21, 2009. ILO Regional Office. Beirut. 7 ibid
2.1
1.3
5.1
7.8
3.3
4.9
1.1
1.8
1.4
2.4
0
7,500
15,000
22,500
30,000
37,500
45,000
52,500
60,000
67,500
75,000
World DevelopedEconomies
&European
Union
Central &South
EasternEurope
(non-EU) &CIS
East Asia South EastAsia & the
Pacific
South Asia LatinAmerica &
theCaribbean
Middle East NorthAfrica
Sub-Saharan
Africa
Pro
duct
ivity
leve
l (co
nsta
nt 2
005
PPP U
S$)
0.5
1.5
2.5
3.5
4.5
5.5
6.5
7.5
8.5
Productivity grow
th rate (%)
Productivity level, constant 2005 PPP$ Productivity growth rate, 2000-2008

9
1.4 Barriers to meeting labour demand When addressing skills issues it is usually assumed that it is an issue related to labour supply and that efforts in better preparation of young people for the labour market and linking them with employment opportunities will have dramatic effects. Nevertheless, a significant barrier which faces the region is the inability of the economy to create jobs. Without a demand for jobs no human resources development strategy can succeed. Prior to the global financial crisis, and since 2000, the Arab region has experienced a relatively strong and sustained growth of around 5 to 6 per cent, mostly driven by the oil boom and the rise in energy prices. This pattern represents a significantly higher average growth than in the 1990s, estimated at about 3.5 to 4 per cent. The growth has been stronger in resource-rich countries of the region. Another characteristic feature of growth in the region is the fluctuating nature of oil revenues, as the recent sharp decline in the international prices of oil in the midst of the current financial crisis has once again shown. The oil sector is not an employment-intensive sector, per se, and for oil exports- led economic growth to result in job creation, deliberate policies are needed – policies that utilize the high revenues for investment in infrastructure for knowledge and skills development, and for economic policies that boost job creation and increase productivity.8 The impact of growth on employment has been extremely uneven across countries and across different segments of the population. Unemployment rates have been decreasing in the Arab region on average since 2003 in spite of rapid population growth. Unemployment increased in some GCC countries and to a larger extent in the conflict-affected countries of Iraq and the occupied Palestinian territory. Prior to the financial crisis, other GCC countries were at the higher end of employment growth (United Arab Emirates, Bahrain and Qatar), with a relatively high growth in some of the labour-abundant countries such as Algeria followed by Morocco and Tunisia.9 This situation indicates that in the Arab Region, there are a number of limitations that tend to undermine the potential for labour demand. This is related to the nature of labour markets and economies which are either not producing new jobs for the new entrants or are producing low skilled jobs which do not provide a value added in terms of skills development. Indeed, several countries who are investing heavily in human resources development are choosing economic growth paths which require low skills (e.g. construction and export industry). With an increasingly educated labour force, this is likely to increase the mismatch between supply and demand and end up importing unskilled and semi skilled workers. This provides an example where economic planning focusing on growth, and especially export-led growth, is actually separated from the investments in human resources development that aim at creating an educated and skilled labour force.
2. IMPACT OF THE FIANANCIAL AND ECONOMIC CRISIS ON SKILLS AND EMPLOYABILITY IN THE ARAB REGION 2.1 A brief overview of the impact of the crisis o n employment in the Arab Region The global economic crisis has not left the Middle East and North Africa region unaffected. Its impact, however, has been relatively milder than elsewhere in the world, and a widely-shared opinion is that the region will recover soon, unless the crisis deepens. The extent to which the countries have been affected differs widely among the energy-producing and non-energy-producing countries. The losses in revenue from oil exports in some countries have resulted in GDP contraction by as much as a quarter. However, the substantial financial reserves accumulated over the boom years by most of the Gulf countries should allow them to weather the crisis. The situation does not look as optimistic for the emirate of Dubai, Iraq, Yemen and 8 ILO (2009) Growth, employment and decent work in the Arab Region: Key policy issues. Paper presented at the Arab Employment Forum, Beirut, October 19-21, 2009. ILO Regional Office. Beirut. 9 ibid

10
Oman, which have significantly fewer energy reserves and/or a larger population. On the other hand, energy-importing countries10 that have suffered from high commodity prices over recent years are now able to save 5-10 per cent of their GDP due to low energy prices.11 This, however, is balanced by the decline in industrial exports, tourism and remittances.12 The energy-importing countries of the Arab region have been spared the severe impact of the global recession owing to their more limited integration in international trade and global financial markets. Focusing solely on the financial effects of the crisis, however, downplays the much more significant real economic effect the crisis has had in the region. In 2009, Egypt’s growth dropped to 3.6 per cent, 13a 50 per cent decline compared to 2008. Along with Tunisia and Morocco, Egypt is strongly linked to Europe in the areas of trade and tourism, which partly explains the severity of the impact of the crisis on their real economies. Significant for these economies is the anticipated decline in the remittances these countries receive from labour migrants in Europe. Remittances represent an important source of income and play a huge role in the national economies of labour-donor countries. The largest migrant receivers, such as the emirate of Dubai, witnessed a large wave of layoffs of migrant workers and a mass outflow of labour due to the cancellation or suspension of large construction projects. In a situation of paucity of labour market data, the absence of regular updates and the evolving nature of the crisis, the impact of the crisis on the real economy is difficult to appraise. Efforts to monitor and respond need to be increased. Nevertheless, if compared with the structural characteristics of labour markets in the region reviewed in the preceding section, a more proactive approach is required to protect the most vulnerable and to support the economic and productive capacity of enterprises and workers. Responses to crisis need to take into account the needs of workers to be able to adapt in the evolving nature of the labour market, on the one hand, and the need of enterprises, to be able to retain workers , on the other. 2.2 Global responses: The ILO Jobs Pact and skills and youth employment The ILO Global Jobs Pact can provide a useful framework for developing national and regional initiatives that would address, not only the crisis effect, but would also help the longer-term development agenda of the Arab countries. The Pact is designed to guide policies aimed at stimulating economic recovery, generating jobs and providing a social protection floor to workers and their families. It seeks to support economic recovery and reduce the risk that the crisis spreads further across countries, and ultimately paves the way for a more sustainable, fairer globalization. Such a pact would not only develop short-term crisis response strategies, but also tackle the transmission mechanisms of the crisis, and lay the foundation for more sustainable economies. The Pact is not about how much more governments can spend, but how they spend. It calls on governments and organizations representing workers and employers to work together to collectively tackle the global jobs crisis through policies in line with the ILO’s Decent Work Agenda. It urges governments to consider options such as public infrastructure investment, special employment programmes and the broadening of social protection and minimum wages. Particularly in developing countries, such measures can reduce poverty and contribute to economic stability. The challenge is to translate the measures in the Pact into action at the national level. This would require effective social dialogue and strong labour market institutions that are found only in varying degrees in the Arab region.
10 Jordan, occupied Palestinian territory (oPt), Morocco, Tunisia and Lebanon 11 It is to note that energy prices have come up significantly since the beginning of the year. 12 J. Brach and M. Loewe (2009) Getting Off Lightly? The Impact of the International Financial Crisis on the Middle East and North Africa, available at http://www.giga-hamburg.de/dl/download.php?d=/content/publikationen/pdf/gf_international_0901.pdf . 13 IMF: World Economic Outlook (April 2009).

11
The Jobs Pact addresses the issue of skills development and the ability of enterprises to retain jobs. It provides a framework for averting layoffs and promoting business retention by communities, enterprises and workers’ associations. It calls for limiting the risk of long-term unemployment through ‘implementing effective, properly targeted active labour market policies; enhancing the competence and increasing resources available to public employment services so that jobseekers receive adequate support.’ The Pact also calls for ‘implementing vocational and entrepreneurial skills programmes; investing in workers’ skills development, skills upgrading and re-skilling to improve employability, in particular for those having lost or at risk of losing their job and vulnerable groups. The Pact also addresses the issue avoiding job losses and supporting enterprises in retaining their workforce through well-designed schemes. The ILO has also developed a tool to specifically address the rising worker retrenchment.14 This guide identifies 6 different stages of the cycle of losing a job until finding a job. These are: the pre-payoff stage; the layoff; acquiring new skills; intensive job search ; running out of benefits and/or savings; adjusting to a new job. The guide highlights that it is very important for progammres to continue peer support and counseling after workers start new jobs. Part of this cycle is the retraining which is a transitional stage in the cycle of unemployment. Retraining carries with it the possibility of better employment prospects, but it may also place a great strain on the displaced workers and their families. For many dislocated workers this is their first encounter with a classroom situation in a decade or more. After all that time, it is not surprising that most workers are nervous about going back into a classroom. Those who had bad school experiences may have a real crisis of self-confidence. Workers usually need a lot of support to get through a retraining program. A hidden issue that can surface with retraining is the worker’s basic literacy skills. Some displaced workers may have enough reading, writing, and math skills to get by in their daily lives, and in their old jobs, but not in the classroom unless they receive additional help. Some workers may not be able to read and write in the national language, or not at all. Retraining is a much more difficult option for them to choose. If workers are worried about their ability to read or write or use numbers, this may show up as not wanting to enroll in a retraining program. Transition centers can start formal or informal skills upgrading classes to help workers overcome that barrier. They can also make sure that the training programs provided address the workers’ basic skill needs. 2.3 Regional responses related to skills and employ ability In response to the crisis, many governments in the region took measures to mitigate its effects. Most of the emphasis seems to have been on the financial sector aiming to reduce the systemic effect arising from lack of credit. Many countries introduced fiscal and monetary measures to maintain economic activity at the macro level. While many projects have been abandoned, increases in public spending, if not rescue packages as such, have been introduced.15 Labour market programmes and especially related to skills development have received a more modest attention in the crisis response. The matrix below provides a compilation of such programmes. Bahrain The labor unions began a "right at work" campaign to reinstate workers who lost their jobs. The Ministry of Labour indicates close relations with Bahrain Chamber of Commerce and the Federation of Bahrain Trade Unions in addressing the crisis effects: Issues related to the protection of workers and the improvement of working conditions are discussed in tripartite social dialogues through various channels such as joint committees, tripartite boards and ad-hoc 14 Hansen G. (2009) A guide to worker displacement. International Labour Organisation, Geneva. Also on http://www.ilo.org/skills/what/pubs/lang--en/docName--WCMS_103594/index.htm 15 For a detailed review see Tzannatos, opt cit.

12
meetings. The Ministry of Labour is preparing a new program to enhance the employability of unemployed university graduates, which includes retraining, income support and on the job training. Supplementary measures to facilitate the crisis response include (a) upgraded jobs bank at Ministry of Labour; (b) job orientation to be included in range of training programmes; (c) first-time job seekers included in unemployment insurance scheme; and (d) expansion of training opportunities for job seekers. Iraq With the contribution from nine banks, short and middle term loans will be provided to the unemployed to help them launch investment projects. The loan’s amount varies between 5,000 to 250,000 Dinar with a maximum interest up to 10 percent. Jordan The Ministry of Labor will start assessing the vocational, technical and technological skills needed in new and emerging industries/mega projects with the view to customizing training jointly with employers. A company for the recruitment and training of workers in the agricultural sector was created to recruit initially 1,000 residents of the Jordan Valley who will also receive social security, health insurance and monthly salaries in accordance with the minimum wage system. Other measures will offer incentives to employers who hire Jordanians instead of expatriate workers, support to the General Federation of Trade Unions and consultations with concerned parties regarding labour legislation. The National Training and Employment project (NTEP) aims to reduce unemployment in Jordan, especially amongst young men and women. A law to “Combat Trafficking in Human Beings” was passed in 2009 accompanied by a relevant section in the Ministry of Labor and the planned creation of a shelter is to protect the victims of trafficking. Jordan A committee was formed to encourage employment in the agriculture sector and job insertion of those with less than high school education. Mauritania The government is working on the training and insertion to employment of 4 000 unemployed youth and strengthening the youth-job-promotion fund. A strategy was developed to fight the consequences of slavery to follow up the on slavery practices that were outlawed in 2008. Morocco The Emergency Plan II focuses on "Morocco's world jobs," (i.e. fields where Morocco holds competitive advantages, such as off-shoring, automobile industry, aeronautics and electronics). The government is in the process of creating 22 integrated industrial platforms and numerous "host sites" for investors with a view to creating 220,000 new jobs by 2015. The major actors involved in the emergency plan were official authorities (Government and Central Bank), political parties, labor unions and the civil society. Oman The upcoming Plan and economic reform program aims to diversify the economy away from its reliance on hydrocarbons and to create employment opportunities for the young and rapidly growing population. The government intends to intensify efforts for the private sector to meet targets for the employment opportunities for Omani citizens. Saudi Arabia The Labor Ministry will open employment offices at universities and secondary schools. It will also prepare an actionable program to implement a recently developed employment strategy that will encourage, among others, Saudis to take up jobs offered by the mega economic cities in Rabigh, Hail, Madinah and Jazan. The new strategy includes supporting productive family programs and the establishment of women’s units at the Human Resource Development Fund and.

13
Tunisia The parliament put forward a new law in June 2009 that would allow early retirement (before the age of 60) for public employees so that to free up jobs for young people. In addition, to reduce particularly graduate unemployment, the government will offer loans to help launch small businesses. 3. Conclusions The paper has reviewed the pre-existing trends to skills and employability in the region and then attempted to demonstrate the impact of the crisis on these pre-existing challenges. What transpires is that the current financial and economic crisis provides an opportunity to Arab countries to address pre-exiting challenges. The challenges in skills formation and employability have been that it was not producing a competitive and adaptable labour force. Right now it is essential to avoid job losses and support enterprises in retaining their staff. This can be achieved through targeted investment workers’ retraining, skills upgrading and re-skilling to improve employability, in particular for those having lost or at risk of losing their job and vulnerable groups. A low skills, low productivity and low wage economy can not be sustainable in the long term, and is not consistent with the goal of poverty alleviation. This vicious circle of inadequate education, poor training, low productivity and poor quality jobs and low wages, the burden of which mostly falls upon the working poor, and excludes workers who do not have the appropriate skills to participate in economic growth and social development. This also has a negative impact on the competitiveness of enterprises and their ability to contribute to economic and social development. A regional strategy based on improving the quality of education and training could, instead, create a virtuous cycle that improves the development of skills, the ability to innovate and increase productivity and growth of enterprises, technological change and investment, economic diversification and competitiveness. All these are necessary to sustain and accelerate the creation of more and better jobs in the context of the path to decent work. Within the current economic crisis, a focus on youth and skills development as part of the response to the current economic crisis would be appropriate. There are 2 facets to mitigate the negative effects of the crisis: ensuring that workers have a positive transition to a new work and mitigating the social and economic costs that change imposes on workers, enterprises and countries. For workers, a smooth transition to a new work requires a certain set of mechanisms to exist, including:
- Systems or skills recognition to approve and ratify previous education and experience gained in the workplace, such that workers who have transferable skills are able to transition easily into new jobs within the enterprise as well as to other jobs and other industries,
- The availability of re-training and upgrading of skills by governments or employers through the commitment of workers to continuous learning through the use of these opportunities,
- Access to labour market information in a timely manner and career guidance and employment services.
- Investment in retraining programs for workers to ensure that workers are able to upgrade their existing qualifications as well as acquiring new skills.
- Empowerment of institutions of vocational training and higher education to the recognition of education and practical experience as a tool that helps in entering into vocational education and higher education.

14
Annex: Statistical Annex Table A1: Total working-age population and youth population, by region
Change between
1998 2008
1998 and 2008 (%)
Total working-age population (‘000)
4,170,917 4,991,468 19.7 World
810,056 883,267 9.0
Developed Economies & European Union
284,814 306,797 7.7 Central & South-Eastern Europe (non-EU) & CIS
983,803 1,148,638 16.8 East Asia
344,103 423,799 23.2
South-East Asia & the Pacific
856,592 1,084,512 26.6
South Asia
344,993 418,967 21.4 Latin America & the Caribbean
339,585 448,349 32.0
Sub-Saharan Africa
170,156 228,453 34.3
Arab Region
98,489 136,346 38.4
Middle East
108,482 140,792 29.8
North Africa
Adult population
(‘000)
3,114,375 3,782,996 21.5
World
680,163 754,386 10.9
Developed Economies & European Union
223,114 242,461 8.7
Central & South-Eastern Europe (non-EU) & CIS
771,705 904,875 17.3
East Asia
243,747 314,741 29.1
South-East Asia & the Pacific
593,200 770,660 29.9
South Asia
246,432 314,184 27.5
Latin America & the Caribbean
219,028 289,981 32.4
Sub-Saharan Africa
113,317 158,203 39.6
Arab Region
64,343 93,568 45.4
Middle East
72,643 98,141 35.1
North Africa

15
Youth population
(‘000)
1,056,542 1,208,472 14.4
World
129,894 128,881 -0.8
Developed Economies & European Union
61,700 64,335 4.3
Central & South-Eastern Europe (non-EU) & CIS
212,097 243,763 14.9
East Asia
100,357 109,059 8.7
South-East Asia & the Pacific
263,392 313,853 19.2
South Asia
98,560 104,783 6.3
Latin America & the Caribbean
120,557 158,368 31.4
Sub-Saharan Africa
56,839 70,250 23.6
Arab Region
34,147 42,779 25.3
Middle East
35,839 42,651 19.0
North Africa
Source: ILO: Growth, Employment and Decent Work in the Arab Region: Key Policy Issues. Paper presented at the Arab Employment Forum, Beirut, 19-21 October, 2009.
Table A2: Gross enrolment ratios, world regions
Secondary Secondary Secondary Tertiary Gross enrolment ratios Tertiary total Tertiary male
total male female female
Year 1999 2006 1999 2006 1999 2006 1999 2006 1999 2006 1999 2006
60.1 67.8 63.5 70.4 56.5 65.1 19.1 22.0 21.8 22.0 16.2 22.0
Arab States
Central and Eastern 87.4 87.7 88.1 89.4 86.7 86.0 37.8 59.6 34.6 53.0 41.0 66.4
Europe
83.4 91.4 84.3 93.3 82.4 89.6 18.4 24.7 19.1 23.5 17.8 25.8
Central Asia
64.8 75.2 .. 75.0 .. 75.5 13.8 24.6 15.7 25.3 11.7 23.9
East Asia and the Pacific
Latin America and the 80.3 89.4 77.7 86.3 83.1 92.6 21.5 31.3 20.3 29.1 22.7 33.6
Caribbean
North America and 100.4 100.7 100.8 100.9 100.0 100.6 61.2 69.7 54.9 60.1 67.8 79.9
Western Europe
44.5 .. 50.5 .. 38.0 .. .. 10.9 .. 12.3 .. 9.4
South and West Asia
23.8 31.8 26.1 35.4 21.4 28.2 3.7 5.2 4.4 6.2 2.9 4.2
Sub-Saharan Africa
Source: ILO: Growth, Employment and Decent Work in the Arab Region: Key Policy Issues. Paper presented at the Arab Employment Forum, Beirut, 19-21 October, 2009.

16
Table A3: Youth employment and youth employment-to-population ratios
Youth Employment-to-
Youth Employment (‘000)
Population Ratio
Total Youth 1998 2008 1998 2008 47.6 44.6 519,059 557,941
World 45.8 43.9 59,467 56,555
Developed Economies & European Union 34.7 33.3 21,387 21,427
Central & South-Eastern Europe (non-EU) & CIS 61.6 53.0 130,701 129,235
East Asia 47.2 45.2 47,352 49,293
South-East Asia & the Pacific 44.4 42.0 116,828 131,897
South Asia 46.6 45.2 45,931 47,343
Latin America & the Caribbean 51.0 50.1 61,451 79,281
Sub-Saharan Africa 28.3 26.8 16,095 18,850
Arab Region 29.2 30.0 9,987 12,842
Middle East 27.5 26.3 9,861 11,218
North Africa
Male youth 54.9 51.4 293,515 315,142
World 48.4 45.3 32,108 29,896
Developed Economies & European Union 39.4 38.2 12,319 12,477
Central & South-Eastern Europe (non-EU) & CIS 58.3 48.7 63,709 62,282
East Asia 53.2 52.0 26,914 28,777
South-East Asia & the Pacific 60.5 58.6 82,520 95,536
South Asia 59.4 55.0 29,405 29,017
Latin America & the Caribbean 57.3 55.0 34,487 43,640
Sub-Saharan Africa 41.6 37.7 12,054 13,518
Arab Region 43.4 42.5 7,595 9,291
Middle East 39.2 35.9 7,117 7,765
North Africa
Female youth 40.0 37.5 205,697 218,740
World 43.0 42.4 27,359 26,659
Developed Economies & European Union 29.8 28.3 9,068 8,950
Central & South-Eastern Europe (non-EU) & CIS East Asia 65.2 57.8 66,991 66,953

17
41.1 38.2 20,438 20,516
South-East Asia & the Pacific 27.0 24.1 34,309 36,361
South Asia 33.7 35.2 16,526 18,326
Latin America & the Caribbean 44.7 45.1 26,964 35,641
Sub-Saharan Africa 14.5 15.5 4,041 5,332
Arab Region 14.4 17.0 2,392 3,551
Middle East 15.5 16.4 2,744 3,453 North Africa
Source: ILO: Growth, Employment and Decent Work in the Arab Region: Key Policy Issues. Paper presented at the Arab Employment Forum, Beirut, 19-21 October, 2009.
Table A4: Youth unemployment and youth unemployment rates
Youth unemployment (‘000) Youth unemployment rate (%)
Total 1998 2008 1998 2008
64,810 69,194 12.3 12.3
World
9,591 8,532 13.9 13.1
Developed Economies & European Union
6,236 4,857 22.6 18.5
Central & South-Eastern Europe (non-EU) & CIS
13,760 12,997 9.5 9.1
East Asia
6,880 9,375 12.7 16.0
South-East Asia & the Pacific
11,594 14,797 9.0 10.1
South Asia
8,534 8,499 15.7 15.2
Latin America & the Caribbean
8,215 10,139 11.8 11.3
Sub-Saharan Africa
4,877 5,362 23.3 22.1
Arab Region
2,415 2,972 19.5 18.8
Middle East
3,545 3,613 26.4 24.4
North Africa
Male youth
37,378 39,892 12.2 12.1
World
5,142 4,833 13.8 13.9
Developed Economies & European Union
3,520 2,751 22.2 18.1
Central & South-Eastern Europe (non-EU) & CIS
8,058 7,528 11.2 10.8
East Asia

18
3,799 5,122 12.4 15.1
South-East Asia & the Pacific
8,171 10,308 9.0 9.7
South Asia
4,317 3,987 12.8 12.1
Latin America & the Caribbean
4,371 5,363 11.2 10.9
Sub-Saharan Africa
3,270 3,266 21.3 19.5
Arab Region
1,607 1,861 17.5 16.7
Middle East
2,241 2,016 23.9 20.6
North Africa
Female youth unemployment
(‘000)
27,433 29,302 12.5 12.7
World
4,449 3,698 14.0 12.2
Developed Economies & European Union
2,717 2,107 23.1 19.1
Central & South-Eastern Europe (non-EU) & CIS
5,702 5,469 7.8 7.6
East Asia
3,082 4,253 13.1 17.2
South-East Asia & the Pacific
3,422 4,489 9.1 11.0
South Asia
4,217 4,511 20.3 19.8
Latin America & the Caribbean
3,845 4,776 12.5 11.8
Sub-Saharan Africa
1,606 2,096 28.4 28.2
Arab Region
808 1,112 25.2 23.8
Middle East
1,304 1,597 32.2 31.6 North Africa
Source: ILO: Growth, Employment and Decent Work in the Arab Region: Key Policy Issues. Paper presented at the Arab Employment Forum, Beirut, 19-21 October, 2009.

19
Table A5: Productivity measured as output per person employed (constant 2000 US$, PPP adjusted)
Change between
1998 2008
1998 and 2008 (%)
17,013 21,022 23.6
World
61,005 71,102 16.6
Developed Economies & European Union
15,009 24,652 64.2
Central & South-Eastern Europe (non-EU) & CIS
5,246 10,920 108.2
East Asia
6,807 9,222 35.5
South-East Asia & the Pacific
4,054 6,341 56.4
South Asia
19,857 21,377 7.7
Latin America & the Caribbean
4,128 5,028 21.8
Sub-Saharan Africa
18,416 22,358 21.4
Arab Region
28,129 32,319 14.9
Middle East
12,703 16,117 26.9 North Africa
Source: ILO, Trends Econometric Models, September 2 009 Table A6 Literacy rates for adults (15 and over) and youth (15-24), by sex, selected countries,

20
2005-07, percentages of corresponding total population
Adult (15 and over) literacy rate Youth (15-24) literacy rate Country MF M F MF M F Algeria 75 84 66 93 94 91 Egypt 66 75 58 85 88 82 Jordan 91 95 87 99 99 99 Lebanon 90 93 86 99 98 99 Libya 87 95 78 99 99 98 Morocco 56 69 43 75 84 67 OPTerritories 94 97 90 99 99 99 Syria 83 90 77 94 95 92 Tunisia 78 86 69 96 97 94 Source: UNESCO Institute for Statistics, Global Education Digest 2009
Source : European Commission, Skills development for the inf ormal economy: issues and options in vocational education and training in the Souther n partner countries of the European Neighbourhood Policy 2009
Table A7 Number of secondary school students in general and vocational education, % of female students in each, and % of vocational in total students, selected countries, 2005
Country students in women in students in women in vocational
general general vocational vocational (m/f) in secondary secondary secondary secondary secondary Algeria 3 291 971 39% 463 850 52% 12.4% Jordan 594 733 35% 30 949 50% 4.9% Lebanon 313 729 41% 48 637 53% 13.4% Morocco 1 834 766 39% 117 690 45% 6.0% OPTerritories 651 518 30% 5 279 50% 0.8% Syria 2 267 027 43% 122 356 48% 5.1% Tunisia 1 136 657 39% 102 811 52% 8.3% Source: World Bank, World Development Indicators
Source : European Commission, Skills development for the inf ormal economy: issues and options in vocational education and training in the Souther n partner countries of the European Neighbourhood Policy 2009
21
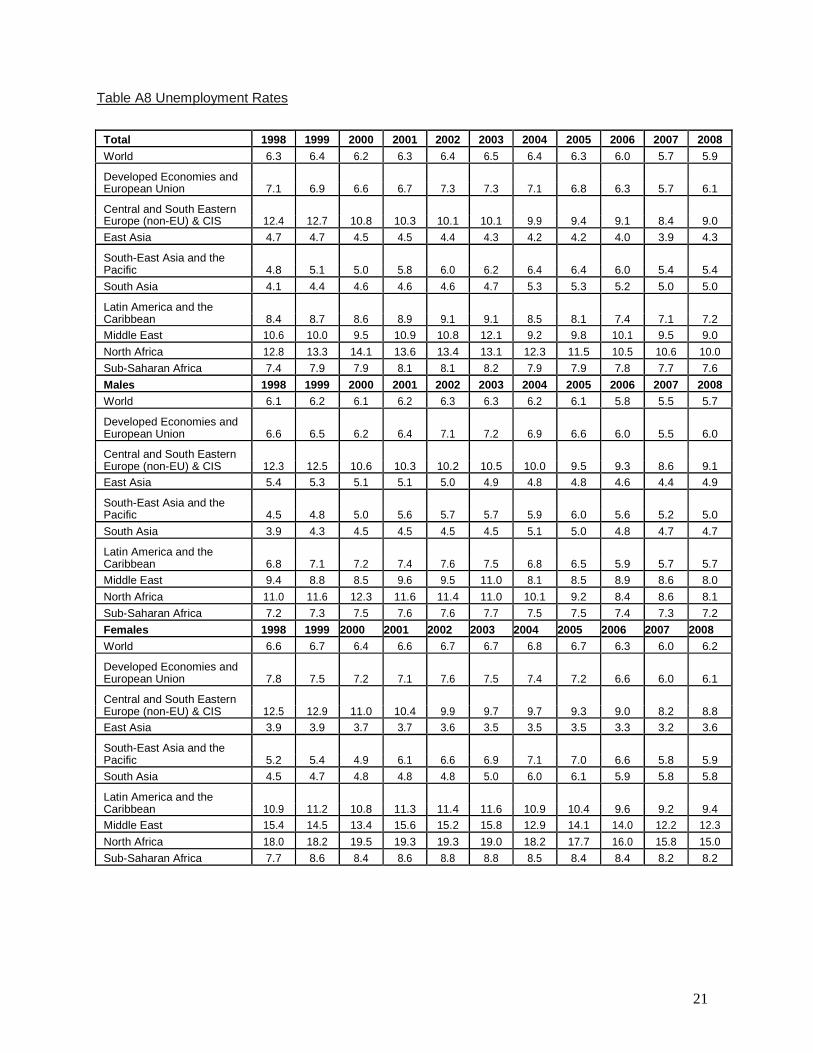
Table A8 Unemployment Rates
Total 1998 1999 2000 2001 2002 2003 2004 2005 2006 2007 2008 World 6.3 6.4 6.2 6.3 6.4 6.5 6.4 6.3 6.0 5.7 5.9 Developed Economies and European Union 7.1 6.9 6.6 6.7 7.3 7.3 7.1 6.8 6.3 5.7 6.1 Central and South Eastern Europe (non-EU) & CIS 12.4 12.7 10.8 10.3 10.1 10.1 9.9 9.4 9.1 8.4 9.0 East Asia 4.7 4.7 4.5 4.5 4.4 4.3 4.2 4.2 4.0 3.9 4.3 South-East Asia and the Pacific 4.8 5.1 5.0 5.8 6.0 6.2 6.4 6.4 6.0 5.4 5.4 South Asia 4.1 4.4 4.6 4.6 4.6 4.7 5.3 5.3 5.2 5.0 5.0 Latin America and the Caribbean 8.4 8.7 8.6 8.9 9.1 9.1 8.5 8.1 7.4 7.1 7.2 Middle East 10.6 10.0 9.5 10.9 10.8 12.1 9.2 9.8 10.1 9.5 9.0 North Africa 12.8 13.3 14.1 13.6 13.4 13.1 12.3 11.5 10.5 10.6 10.0 Sub-Saharan Africa 7.4 7.9 7.9 8.1 8.1 8.2 7.9 7.9 7.8 7.7 7.6 Males 1998 1999 2000 2001 2002 2003 2004 2005 2006 2007 2008 World 6.1 6.2 6.1 6.2 6.3 6.3 6.2 6.1 5.8 5.5 5.7 Developed Economies and European Union 6.6 6.5 6.2 6.4 7.1 7.2 6.9 6.6 6.0 5.5 6.0 Central and South Eastern Europe (non-EU) & CIS 12.3 12.5 10.6 10.3 10.2 10.5 10.0 9.5 9.3 8.6 9.1 East Asia 5.4 5.3 5.1 5.1 5.0 4.9 4.8 4.8 4.6 4.4 4.9 South-East Asia and the Pacific 4.5 4.8 5.0 5.6 5.7 5.7 5.9 6.0 5.6 5.2 5.0 South Asia 3.9 4.3 4.5 4.5 4.5 4.5 5.1 5.0 4.8 4.7 4.7 Latin America and the Caribbean 6.8 7.1 7.2 7.4 7.6 7.5 6.8 6.5 5.9 5.7 5.7 Middle East 9.4 8.8 8.5 9.6 9.5 11.0 8.1 8.5 8.9 8.6 8.0 North Africa 11.0 11.6 12.3 11.6 11.4 11.0 10.1 9.2 8.4 8.6 8.1 Sub-Saharan Africa 7.2 7.3 7.5 7.6 7.6 7.7 7.5 7.5 7.4 7.3 7.2 Females 1998 1999 2000 2001 2002 2003 2004 2005 2006 2007 2008 World 6.6 6.7 6.4 6.6 6.7 6.7 6.8 6.7 6.3 6.0 6.2 Developed Economies and European Union 7.8 7.5 7.2 7.1 7.6 7.5 7.4 7.2 6.6 6.0 6.1 Central and South Eastern Europe (non-EU) & CIS 12.5 12.9 11.0 10.4 9.9 9.7 9.7 9.3 9.0 8.2 8.8 East Asia 3.9 3.9 3.7 3.7 3.6 3.5 3.5 3.5 3.3 3.2 3.6 South-East Asia and the Pacific 5.2 5.4 4.9 6.1 6.6 6.9 7.1 7.0 6.6 5.8 5.9 South Asia 4.5 4.7 4.8 4.8 4.8 5.0 6.0 6.1 5.9 5.8 5.8 Latin America and the Caribbean 10.9 11.2 10.8 11.3 11.4 11.6 10.9 10.4 9.6 9.2 9.4 Middle East 15.4 14.5 13.4 15.6 15.2 15.8 12.9 14.1 14.0 12.2 12.3 North Africa 18.0 18.2 19.5 19.3 19.3 19.0 18.2 17.7 16.0 15.8 15.0 Sub-Saharan Africa 7.7 8.6 8.4 8.6 8.8 8.8 8.5 8.4 8.4 8.2 8.2

22
Source: ILO, Global Employment Trends may 2009 Update
Adults 1998 1999 2000 2001 2002 2003 2004 2005 2006 2007 2008 World 4.7 4.7 4.6 4.7 4.8 4.8 4.8 4.7 4.5 4.2 4.4 Developed Economies and European Union 6.0 5.8 5.6 5.6 6.2 6.2 6.1 5.8 5.3 4.8 5.0 Central and South Eastern Europe (non-EU) & CIS 10.4 10.8 9.2 8.7 8.4 8.3 8.2 7.8 7.4 6.8 7.4 East Asia 3.5 3.6 3.4 3.4 3.4 3.3 3.2 3.2 3.1 2.9 3.3 South-East Asia and the Pacific 2.5 2.5 2.5 3.5 3.1 3.4 3.5 3.4 3.2 3.0 2.8 South Asia 2.4 2.6 2.7 2.7 2.8 3.0 3.7 3.7 3.6 3.5 3.5 Latin America and the Caribbean 5.9 6.3 6.3 6.6 6.7 6.7 6.1 5.8 5.3 5.2 5.3 Middle East 6.9 6.4 6.3 7.1 7.0 8.2 6.1 6.4 6.8 6.8 6.1 North Africa 8.3 8.8 9.4 8.8 8.9 8.6 7.7 6.7 6.4 6.6 6.3 Sub-Saharan Africa 5.9 6.2 6.3 6.5 6.5 6.6 6.4 6.4 6.4 6.2 6.2 Youth 1998 1999 2000 2001 2002 2003 2004 2005 2006 2007 2008 World 12.3 12.7 12.5 12.7 13.1 13.1 13.0 13.0 12.5 11.9 12.2 Developed Economies and European Union 13.9 13.8 13.1 13.4 14.3 14.5 14.2 13.9 13.0 12.2 13.1 Central and South Eastern Europe (non-EU) & CIS 22.6 22.3 19.4 18.9 19.1 19.7 19.1 18.5 18.9 17.5 18.1 East Asia 9.5 9.5 9.3 9.3 9.2 9.0 9.0 8.9 8.7 8.4 9.2 South-East Asia and the Pacific 12.7 13.7 13.3 13.9 16.2 16.2 17.0 17.9 17.2 14.8 15.6 South Asia 9.0 10.0 10.4 10.4 10.2 9.9 10.5 10.6 10.2 10.1 10.1 Latin America and the Caribbean 15.6 15.8 15.8 16.3 17.0 17.4 16.6 16.1 15.1 14.4 14.8 Middle East 21.6 20.3 18.9 21.9 21.7 23.5 18.7 20.2 20.4 18.3 18.8 North Africa 26.3 26.4 28.8 29.2 28.1 27.7 27.5 27.9 25.0 25.2 24.1 Sub-Saharan Africa 11.2 11.8 11.7 11.9 12.1 12.1 11.8 11.6 11.5 11.4 11.3