Embed Size (px)
Citation preview
PP. 26-58
Published by: Department of Marketing Management, University of Kelaniya, Sri Lanka
ISSN 1800 – 4989 Vol 3 No 1: January - June 2017
ABSTRACT
Along with globalization, new technologies are introduced to the mobile telecommunication industry
in order to enhance service quality which is consequential to attract and retain rational customers.
Empirical evident is available between service quality and customer satisfaction of mobile
telecommunication industry in Sri Lanka. However, researchers saw that measurements of service
quality are different from country to country. Hence, research findings of different other countries
could not be generalized to Sri Lankan context. Thus, there is a requirement to research the impact of
service quality on customer satisfaction in mobile telecommunication industry in Sri Lanka in order to
enhance the customer satisfaction. Data were collected from 388 customers of mobile
telecommunication industry. Convenient sampling method was used to select the sample. Data were
collected through a structural questionnaire and SERVPERF model was used. Results revealed that the
major dimensions of service quality which impact to customer satisfaction are empathy, tangible and
reliability. Other dimensions are responsiveness, assurance and technical quality do not impact on
customer satisfaction. And, perceived value doesn’t moderate the relationship between service quality
and customer satisfaction in mobile telecommunication industry in Sri Lanka.
Keywords: Customer Satisfaction, Mobile Telecommunication, Perceived Value, Service Quality,
Technical Quality,
S A Dharmadasa Senior Software Engineer
Nisal Gunawardane Lecturer, University of Kelaniya, Sri Lanka
Impact of Service Quality on Customer Satisfaction with Special
Reference to Mobile Telecommunication Industry of Sri Lanka

PP. 26-58
Published by: Department of Marketing Management, University of Kelaniya, Sri Lanka
ISSN 1800 – 4989 Vol 3 No 1: January - June 2017
1. INTRODUCTION
1.1. Background of the Study
Parasuraman et al. (1988) defined service quality as “the overall evaluation of a specific service firm
that results from comparing that firm’s performance with the customers’ general expectations of how
firms in that industry should perform”. Customer satisfaction is usually defined as a customer's sense
or assessment of goods or services after use (Gupta & Bansal, 2012; Jamal & Anastasiadou,2009; Quan,
2010)
Studies argue that quality becomes increasingly important and it act as the major role in order to have
competitive advantage and it’s a critical success factor for any contemporary service company (Alhkami
& Alarussi, 2016; Bahadori, 2015). Service quality is the crucial theme of this research, so it important
to understand what the service quality is, what are the benefits and why it is needed to measure service
quality. There has been extensive literature available on service quality in its measurement in various
private and public sectors across the globe. Most of the literature is available on either banking,
education, airlines, hotels and restaurant sectors. Customer satisfaction, service quality and loyalty are
most important factors in today global economic downturn for retention, profitability and productivity
of the business as a whole. Service quality contribution is the most important factor to investigate the
outcome of the customer expected and perceived service attributes of any business. Whether
manufacturing, service or retail firm’s quality of service is of great importance to both customers and
companies.
One of the most contributions in the field of service quality is by Parasuraman et al. (1998), which is
one of the most popular scales which introduced in order to measure the service quality. Service quality
has been described by Parasuraman et al. (1985,) where the companies need to use the technology for
gathering data form customer demand and improve service quality, according to the way they want to
be competitive.
Scholars recommend to investigate on the impact of service quality on customer satisfaction in various
industries since existing empirical evidence is limited to few sectors (Shafei & Tabaa, 2016).
Telecommunication Industry is highly competitive and on the front line of technological changes
adaptation where it can make a considerable influence on other industries, Accordingly, it is an
important context to research about the impact of service quality on customer satisfaction in MTI (Jeng
and Bailey, 2012; Sur, 2012 as cited by Nawafleh 2017). MTI is one of the rapidly changing and
expanding industries in the country as well as around the globe. This is mainly due to the introduction
of new technology and the increasing demand (Nawafleh et al., 2017).
In consideration of the available historical data, telecommunication plays a dominant role in the
expansion of the internet and borderless communication across the globe while engaging in fierce

PP. 26-58
Published by: Department of Marketing Management, University of Kelaniya, Sri Lanka
ISSN 1800 – 4989 Vol 3 No 1: January - June 2017
market competition to secure their positions, the sector plays a crucial role in today’s social, cultural
and economic life, generating 4.2% of global GDP, amounting to more than $3.1 trillion of economic
value-added (GSMA, 2016). Just over the past 5 years, the sheer number of mobile-broadband
subscriptions has grown more than 20% annually to reach 4.3 billion worldwide accounting for at least
3.6 billion internet users (ITU, 2017). In comparison of telecommunication companies with companies
in other industries, the companies in telecommunication industry use the same equipment and set-ups.
Therefore, customer satisfaction is a crucial factor due to high competition and rivalry in the market
(Shafei and Tabaa, 2016).
1.2. Research Problem
Telecommunication industry has recorded 11.1% growth during 2017 in comparison to the first quarter
in 2017 (Department of Census and Statistics, 2017). The mobile telecommunication sector leads the
telecommunication industry in Sri Lanka whilst the government is heading the fixed line business. The
annual report of Telecommunication Regulatory Commission of Sri Lanka (TRCSL. 2017) shows that
the mobile telecommunication companies make the major contribution to the tax income of the
government, which stands at 67%. Unit price of call, Data and SMS are same in all companies in MTI
(TRC, 2016). But, the mother companies’ trend to sale Sri Lankan business units as such Etisalat UAE
merged their Sri Lankan business operation with Hutchison telecommunication Lanka to provide better
service to the customer (Operator’s official Websites, 2017). Further, in reference to literature, mobile
telecommunication service providers have mostly same equipment and setup. Therefore, there is an
issue why companies are going to merge and sale developed business. A lack of empirical evident is
available between service quality and customer satisfaction of MTI in Sri Lanka as well as
measurements of service quality show differences from country to country (Hanaysha, 2017). Hence,
research findings of other countries could not be generalized in Sri Lanka. Due to this situation of MTI,
there is a requirement to research on the service quality aspect in order to enhance the customer
satisfaction. Majid (2016) argues that perceived values is stronger on the relationship between service
quality and customer satisfaction. Hence this study investigates service quality and customer
satisfaction whilst addressing to perceived value as another requirement to examining with reference to
mobile telecommunication sector in Sri Lanka. Above explanation justify the need of new knowledge
to be gathered referring to MTI of Sri Lanka addressing the empirical and practical research gap.
Therefore, this research attempts to address the research problem of “To what extent the service quality
impacts on customer satisfaction in mobile telecommunication industry of Sri Lanka”. Also this
research study is going to explore the role of perceived value as a moderator within the relationship
between service quality and customer satisfaction.

PP. 26-58
Published by: Department of Marketing Management, University of Kelaniya, Sri Lanka
ISSN 1800 – 4989 Vol 3 No 1: January - June 2017
1.3. Research Objectives
The main objectives of this study are to investigate the impact of service quality on customer satisfaction
in MTI. Further, the following objectives are also established to facilitate the achievement of the main
objective.
i. To investigate the major elements of service quality that are influencing on customer
satisfaction in mobile telecommunication industry in Sri Lanka.
ii. To examine perceived value as a moderator among the relationship between service
qualities and customer satisfaction.
2. LITERATURE REVIEW
2.1. SERVQUAL & SERVPERF Model
It can be said that the origin of SERVQUAL Model is derived from the study of Parasuraman, ZeithamI,
and Berry (1985) based on expectation – perception gap model. Parasuraman, ZeithamI, and Berry
(1985) illustrated that consumers’ quality perceptions are influenced by a series of four distinct gaps
occurring in organizations. These gaps on the service provider’s side, which can block delivery of
services those consumers, perceive to be of high quality, which are:
Gap1: Difference between consumer expectations and management perceptions of consumer
expectations.
Gap2: Difference between management perceptions of consumer expectations and service
quality specifications.
Gap3: Difference between service quality specifications and the service actually delivered.
Gap4: Difference between service delivery and what is communicated about the service to
consumers.
Gap5: Difference between service expectation and perceived service quality.
PP. 26-58
Published by: Department of Marketing Management, University of Kelaniya, Sri Lanka
ISSN 1800 – 4989 Vol 3 No 1: January - June 2017
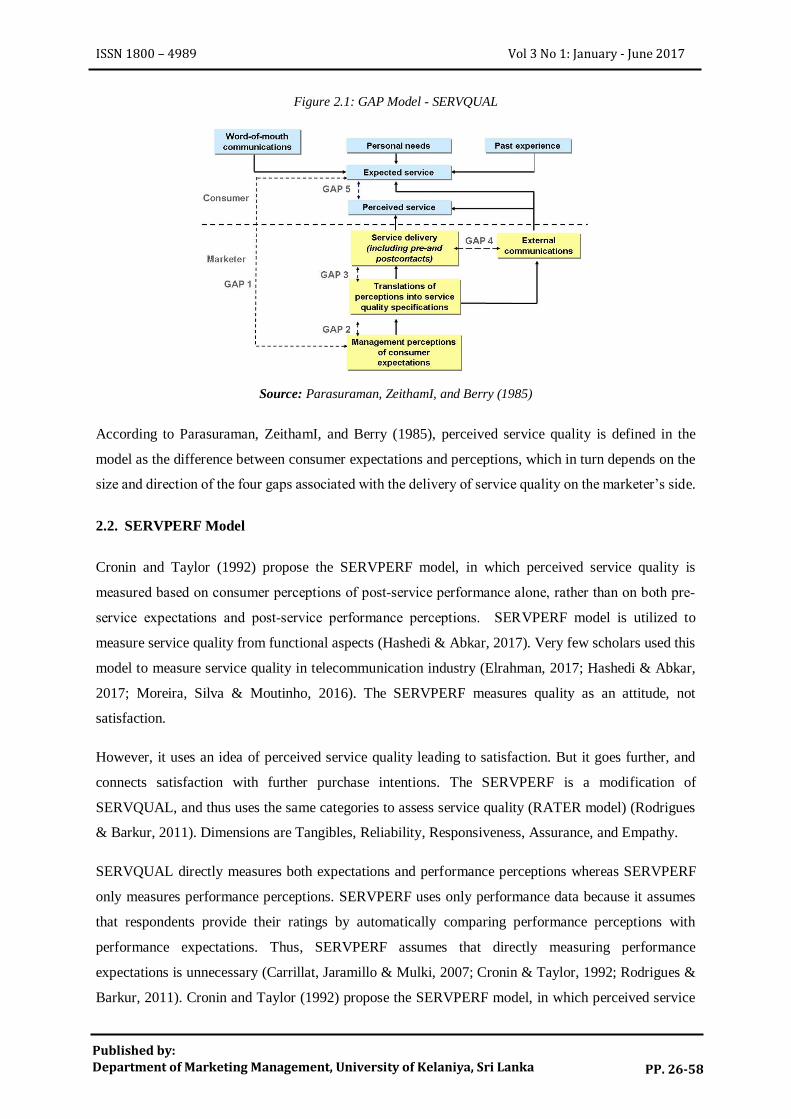
Figure 2.1: GAP Model - SERVQUAL
Source: Parasuraman, ZeithamI, and Berry (1985)
According to Parasuraman, ZeithamI, and Berry (1985), perceived service quality is defined in the
model as the difference between consumer expectations and perceptions, which in turn depends on the
size and direction of the four gaps associated with the delivery of service quality on the marketer’s side.
2.2. SERVPERF Model
Cronin and Taylor (1992) propose the SERVPERF model, in which perceived service quality is
measured based on consumer perceptions of post‐service performance alone, rather than on both pre‐
service expectations and post‐service performance perceptions. SERVPERF model is utilized to
measure service quality from functional aspects (Hashedi & Abkar, 2017). Very few scholars used this
model to measure service quality in telecommunication industry (Elrahman, 2017; Hashedi & Abkar,
2017; Moreira, Silva & Moutinho, 2016). The SERVPERF measures quality as an attitude, not
satisfaction.
However, it uses an idea of perceived service quality leading to satisfaction. But it goes further, and
connects satisfaction with further purchase intentions. The SERVPERF is a modification of
SERVQUAL, and thus uses the same categories to assess service quality (RATER model) (Rodrigues
& Barkur, 2011). Dimensions are Tangibles, Reliability, Responsiveness, Assurance, and Empathy.
SERVQUAL directly measures both expectations and performance perceptions whereas SERVPERF
only measures performance perceptions. SERVPERF uses only performance data because it assumes
that respondents provide their ratings by automatically comparing performance perceptions with
performance expectations. Thus, SERVPERF assumes that directly measuring performance
expectations is unnecessary (Carrillat, Jaramillo & Mulki, 2007; Cronin & Taylor, 1992; Rodrigues &
Barkur, 2011). Cronin and Taylor (1992) propose the SERVPERF model, in which perceived service

PP. 26-58
Published by: Department of Marketing Management, University of Kelaniya, Sri Lanka
ISSN 1800 – 4989 Vol 3 No 1: January - June 2017
quality is measured based on consumer perceptions of post‐service performance alone, rather than on
both pre‐service expectations and post‐service performance perceptions.
SERVPERF is a SERVQUAL change and therefore utilizes the same dimensions to evaluate the quality
of service (RATER model) (Cronin & Taylor, 1992; Rodrigues & Barkur, 2011).
SERVQUAL has criticisms because it is based on the difference between the expectations and
performance (Buttle, 1995; Cronin & Taylor, 1992). Hence, this study used dimensions of SERVPERF
model as functional dimensions of service quality to measure their impact on customer satisfaction in
Sri Lankan mobile telecom companies.
2.3. Customer Satisfaction
Previous research strongly advocates that service quality leads to customer satisfaction and in turn
affects their behavioral intentions (Clemes, Shu & Gan, 2014; Lee, 2013; Bhatti, Abareshi &
Pittayachawan, 2016; Dabholkar, Thorpe, & Rentz , 2000 ; Kotler ,2003;Davis & Heineke, 1998 ).
Dabholkar, Thorpe, and Rentz (2000) ; Kotler (2003) advocated that satisfaction was a broader concept
which had two parts cognitive and affective whereas service quality was only cognitive, Satisfaction is
the overall evaluation of a service by a customer against his expectations, It may or may not include
service quality. Eboli and Mazzulla (2007) found that both cognitive andeffective components together
leads to customer satisfaction, they identified that higher satisfaction is the result of improvements in
both service planning and service reliability. According to Angelova and Zekiri (2011) if organizations
want to ensure higher satisfaction of customers they must know how customers perceive their service
quality and how they can measure it.
Oliver (1980) introduced expectancy theory of disconfirmation, the author shows that satisfaction level
is an outcome between perceived performance and expected performance by consumers, positive
disconfirmation occurs when companies provide better products and services than expected, If the
performance of service or product is worse than expected results then it will lead to dissatisfaction
(Negative disconfirmation). Most researchers use the concept of overall customer satisfaction with the
firm (Gupta & Zeithmal, 2006; Busacca & Padula, 2005; Mittal,Katrichis & Kumar,2001), further
reflecting the more global perspective, to be considered satisfaction as “overall evaluation based on the
total purchase and consumption experience”.Kant and Jaiswal (2017) shows that customer satisfaction
is one of key performance measures in a company of highly competitive industry.
Winning in market place needs to builds customer relationship not only to build the products but also
delivering superior value to target customers. Through customer’s feedback on satisfaction it be
analyzed that whether the company is providing qualitative service or not (Kotler & Keller, 2009).

PP. 26-58
Published by: Department of Marketing Management, University of Kelaniya, Sri Lanka
ISSN 1800 – 4989 Vol 3 No 1: January - June 2017
2.4. Network Quality
Gronroos (1982) identified two service quality dimensions, which are the technical aspect (“what”
service is provided) and the functional aspect (“how” the service is provided). The customers perceive
what they receive as the outcome of the process by using resources, that is the technical or outcome
quality of the process, but customers perceives how the process itself functions, that is the functional or
process quality, for some services the “what” (or technical quality) might be difficult to evaluate (Kang
& James, 2004). As an example, a bank is technically good, when customer pays a bill from his bank
account. The payment happened immediately, may be difficult for a customer to evaluate technical
quality, consumers depend on other measures of quality attributes associated with the process (the
“how”). Parasuraman et al. (1985) suggested that quality evaluations are not made especially on the
outcome of service; they also involve evaluations of the service delivery process. The measurement of
service quality (SERVQUAL) does not explicitly reflect both dimensions, but a functional dimension
only. The focus on a functional dimension is one criticism of SERVQUAL (Baker & Lamb, 1994;
Mangold & Babakus, 1991; Richard & Allaway, 1993). Therefore, this study considers the technical
aspect by using technical quality as a technical dimension.
When consider the GSM (Global System for Mobile Communications) network which is composed as
BTS (Base Transceiver Station connected to MSC (Mobile Switching Centre) via BSC (Base station
control), basically the BSC handles radio resource management and handovers of the calls from one
BTS (or cell/sector) to another BTS (Mishra, 2004). BTSs connect with devices such as mobile phone,
tabs, dongles etc, the cellular network operates based on the frequency concept, which Offers very high
capacity in a limited spectrum allocation.
Figure 2.2: Cellular Network Diagram
Source: Mtaho and Ishengoma, (2014)

PP. 26-58
Published by: Department of Marketing Management, University of Kelaniya, Sri Lanka
ISSN 1800 – 4989 Vol 3 No 1: January - June 2017
The BTS is then used within a small geographic area called a cell. This process is to giving the network
coverage and connecting customer to customer (Mtaho & Ishengoma, 2014). When the demand for
service increases, the number of BTSs may be increased, this is to provide additional quality network
coverage (Mishra, 2004). Hence, network quality falls under technical quality.
Currently telecommunication especially mobile devices are a part of life. Mobile phones and devices
such as laptops, tabs are used service given by MTI. Therefore, the demand for the mobile services has
continues to grow strongly. Hence, companies in MTI are required to set up a quality network
(Munyanti & Masrom, 2017). Network quality is represented by network coverage area, call clarity
(Shafei & Tabaa, 2016). It is important to remain connected to a solid mobile signal at all times. Recent
businesses are not just confined to the office. Therefore, it is important to have excellent mobile
coverage across the board, regardless of whether the customer is on the move or stationary. When
consider the network coverage of service providers in Sri Lankan MTI, all provide same category of
services (VOICE, SMS, DATA).
2.5. Perceived Value
Zeithaml (1988) identified four consumer definitions of product value for which supporting literature
can be identified, these are:
(1) Value is low price
(2) Value is whatever I want in a product
(3) Value is the quality I get for the price I pay
(4) Value is what I get for what I give
These four definitions have been brought together and perceived value has been defined as the
consumers' overall assessment of the utility of a product based on perceptions of what is received and
what is given. There has been a general consensus that customer value involves a trade-off between
benefits and costs (Chen & Dubinsky, 2003; Lee, 2013). Further Lee (2010) defined perceived value as
outcomes or benefits customers gain relative to the total costs customers pay. Perceived value has been
identified in marketing as an important concept in influencing preference, satisfaction, loyalty, and other
important outcomes (Wang, 2011). According to Caruana (2000) customer satisfaction is not just
depended on service quality but it is moderated by perceived value, further, the author suggested for
future researches to confirm the moderation effect of perceived value on relationship between service
quality and customer satisfaction. Raza et al. (2012) indicate that perceived value acts a moderating role
in the relation of service quality and satisfaction in hotel industry.

PP. 26-58
Published by: Department of Marketing Management, University of Kelaniya, Sri Lanka
ISSN 1800 – 4989 Vol 3 No 1: January - June 2017
3. CONCEPTUALIZATION AND OPERATIONALIZATION
Since the study is followed as the deductive approach, the conceptual framework has been developed
in line with the theoretical justification and empirical contribution. According to the derived conceptual
framework, Service quality is the independent variable while customer satisfaction is the problem
(dependent) and Perceived value moderates the relationship between independent and dependent
variables.
Figure 3.1: Conceptual Framework
Source: Author Developed
3.1. Development of Hypotheses
Reliability is the ability to perform the promised service accurately and dependably (Rodrigues et al.,
2011). Researcher shows that Reliability is one of strongest indicators of service quality (Narteh, 2017,
Abdullah & Hilmi, 2014). Further, Narteh (2017) argue that there should be accuracy in billing, keeping
accurate of records and performing the service at the designed time. Author Cui et al., (2003) noted that
reliability is positively influence on customer satisfaction in banking, hotel and retailer sector
respectively. Hence, below hypothesis can be formulated.
H1: There is a positive impact of reliability on customer satisfaction.
Assurance is knowledge and courtesy of employees and their ability to inspire trust and confidence,
Assurance contains competence, courtesy, credibility and security (Parasuraman et al., 1988; Famiyeh,

PP. 26-58
Published by: Department of Marketing Management, University of Kelaniya, Sri Lanka
ISSN 1800 – 4989 Vol 3 No 1: January - June 2017
Darko & Kwarteng, 2017; Padma, Rajendran and Sai, 2009). Kumar et al. (2009) shows that assurance
is an indicator which influences service quality in bank sector and that it also influenced customer’s
judgment of employee competence which is crucial in building customer trust. Petridou et al. (2007)
shows that assurance is highly significant in service quality while Siddiqi (2011) confirmed that
assurance is highly positively influenced on customer satisfaction in banking sector. Hence, below
hypothesis can be formulated.
H2: There is a positive impact of assurance on customer satisfaction.
Tangibles are physical facilities, equipment, and appearance of personnel (Parasuraman et al., 1988).
Further Mukherjee et al., (2003) shows that tangibles are less effective to solve customer’s issues and
influence of tangibles are less on service quality perception in bank sector (Landhari et al., 2011). Yet
petridou et al., (2007) shows that tangibles are significant to predict customer satisfaction in bank sector.
Hence, below hypothesis can be formulated.
H3: There is a positive impact of tangibility on customer satisfaction.
Empathy refers to caring, individualized attention the firm provides its customers (Parasuraman et al.,
1988). According to AbuKhalifeh and Som (2012) that customers should be treated personalized basis
and desired service need to be provided.Further according to Tsoukatos and Rand (2006) argued that
firms should shows the empathy towards customer as firms giving individual attention towards
customers. Siddiqi (2011) confirmed that empathy highly predicts customer satisfaction in bank sector.
Based on the above justifications it developed the below hypothesis.
H4: There is a positive impact of empathy on customer satisfaction.
Responsiveness refers to willingness to help customers and provide prompt service (Parasuraman et
al., 1988). Responsiveness is a main factor in customer satisfaction for banking sector (El Saghier, N.,
& Nathan, D., 2013; Lau, M. M. et al., 2013). Moreover, responsiveness is a significant predictor of
overall customer satisfaction (Krishnamurthy, R., et al., 2010).
In banking perspective, customer satisfaction in banks is directly affected by the responsiveness (El
Saghier, N., & Nathan, D., 2013; Lau, M. M. et al., 2013), and has a significant predictor of overall
satisfaction in Indian banking services (Krishnamurthy, R., et al., 2010). On the other hand, Banerjee,
N. and Sah, S. (2012) found that weak responsiveness in Public sector banks was a major source for
customers’ dissatisfaction, as such banks fail to provide prompt service and, employees are busy and
unwilling to help the customers. Hence, the above statements can be argued that the Responsiveness
dimension of service quality will strongly influence the customer satisfaction in banking sector and
therefore, the research proposed the following hypotheses.
H5: There is a positive impact of Responsiveness on customer satisfaction

PP. 26-58
Published by: Department of Marketing Management, University of Kelaniya, Sri Lanka
ISSN 1800 – 4989 Vol 3 No 1: January - June 2017
Network Quality The researchers consider the network quality dimension from technical aspect
because the models SERVQUAL and SERVPERF considered only functional aspect (Parasuraman et
al., 1985; Baker & Lamb, 1994; Mangold & Babakus, 1991; Richard & Allaway, 1993). In reference to
literature, network quality is considerably affected to customer satisfaction. Therefore, hypothesis H6
is formulated as below.
H6: There is a positive impact of network quality on customer satisfaction
The interaction path (Service quality X Perceived value) should be significant to support moderator
hypothesis. As well, there may be significant main effects for the independent variable (Perceived
service quality) and moderator (Perceived value), but these are not directly relevant conceptually to
testing the moderator hypothesis (Baron and Kenney, 1986). In reference to literature, there is strong
relationship between perceived service quality and customer satisfactions, but do not show direct link
to customer satisfaction, shows an effect on relationship between perceived service quality and
customer satisfaction and therefore, below hypotheses are formulated.
H1a: Perceived value moderates the relationship between reliability and customer satisfaction.
H2b: Perceived value moderates the relationship between assurance and customer satisfaction.
H3c: Perceived value moderates the relationship between tangibility and customer satisfaction.
H4d: Perceived value moderates the relationship between empathy and customer satisfaction
H5e: Perceived value moderates the relationship between responsiveness and customer
satisfaction
H6f: Perceived value moderates the relationship between network quality and customer
satisfaction
4. RESEARCH STRATEGY AND METHODOLOGY
Quantitative study defined as a systematic investigation of a particular objective with quantifying and
analyzing data to get the results (Apuke, 2017). Creswell (1994) defines quantitative research as an
enquiry into social or human problem based on testing a hypothesis or a theory composed of variables,
measured with numbers, and analyzed with statistical procedures in order to determine whether the
hypothesis or the theory holds true.
4.1. Target Population and Sampling Frame
The population refers to the entire group of people, events, or things of interest that the researcher
wishes to investigate; Target population is the group of people where researcher is interested in
analyzing to get relevant information for research purpose (Sekaran&Bougie, 2009). The population of
this study is the mobile telecommunication customers in MTI of Sri Lanka.

PP. 26-58
Published by: Department of Marketing Management, University of Kelaniya, Sri Lanka
ISSN 1800 – 4989 Vol 3 No 1: January - June 2017
The sampling frame is a representation of all elements in the population from which the sample drawn
(Sekaran&Bougie, 2009). In this research, the sampling frame is the customers of mobile
telecommunication industry who visit any customer care center within last 3 months. Total population
is the customers who are in between 18 to 55 years old. The Sample Size for 95.46% Confidence
Interval for Proportion is 384(Cochran, 1977). Therefore, total of 500 questionnaires were distributed.
5. DATA ANALYSIS AND DISCUSSION
In order to collect data, 500 questionnaires distributed among mobile users of work force. And collected
407. Among these 19 questionnaires were rejected due to six respondents didn’t visit to a customer care
center of the service provider and thirteen were rejected due to missing values. The accepted number of
questionnaires was 388 which are enough to do the analyses (Krejcie and Morgan, 1970).
5.1. Reliability Test
Table 5.1: Reliability Statistics
Source: Survey Data 2017
According to Sekaran (2010), the reliability of a measure is an indication of the stability and consistency
with which the instrument measures the concept and helps to assess the goodness of a measure. All the
alpha values are above the rule of thumb of 0.6 for a reliable scale, which suggests the internal validity
of each instrument is satisfactory.
5.2. Validity Testing
According to Joppe (2000), validity in a quantitative research determines whether the research truly
measures what it intended to measure or how truthful the results actually are. For testing the validity of
the current study, the KMO (Kaise-Meyer-Olkin) & Bartlett’s test was used.
Variable Cronbach's Alpha No of Items
Reliability 0.768 5
Assurance 0.703 4
Tangibles 0.700 4
Empathy 0.766 5
Responsiveness 0.763 4
Network Quality 0.635 2
Customer satisfaction 0.717 3
Perceived value 0.724 4

PP. 26-58
Published by: Department of Marketing Management, University of Kelaniya, Sri Lanka
ISSN 1800 – 4989 Vol 3 No 1: January - June 2017
Table 5.2: KMO and Bartlett's Test
Kaiser-Meyer-Olkin Measure of Sampling Adequacy. .889
Bartlett's Test of Sphericity Approx. Chi-Square 1315.480
Df 15
Sig. .000
Source: Survey Data 2017
According to the rule of thumb, the sample is said to be adequate if the KMO value is greater than 0.7
and the sig value is lesser than 0.05.
5.3. Univariate Analysis - Descriptive Statistics on Service Quality
The main variable service quality was categorized into six variables according to the literature. Under
each dimensions, there are several items included in the questionnaire. Following section summarized
customer responses into the frequencies percentage as well as measurements mean and standard
deviation.
The mean and standard deviation of the sample, basically, mean is the average value of the sample.
Standard deviation is the measurement of dispersion of scores from the mean value. The frequency
distribution analysis was made for each the items of dimensions in order to compare means and other
frequency statistics.
Table 5.3: Descriptive Statistics
Construct Mean Std. Deviation
Reliability 4.8258 .97819
Assurance 4.9111 .94665
Tangibles 4.9491 .92280
Empathy 4.8428 .92718
Responsiveness 4.3911 .67454
Network Quality 4.8054 1.20781
Source: Survey Data 2017
Table 5.3 contains means and dispersion of variables from the mean. Highest and lowest Standard
deviations exist for network quality and responsiveness variables respectively. The respondent attitudes
towards network quality in Sri Lanka are highly different but attitudes about responsiveness are highly
closed.

PP. 26-58
Published by: Department of Marketing Management, University of Kelaniya, Sri Lanka
ISSN 1800 – 4989 Vol 3 No 1: January - June 2017
Table 5.4: Testing of Hypotheses
Hypotheses Status Justification
H1: There is a positive impact of reliability on customer
satisfaction
Accepted F sig<0.05 and t.
sig<0.05
H2: There is a positive impact of Assurance on customer
satisfaction
Rejected Not linear
H3: There is a positive impact of Tangibility on customer
satisfaction
Accepted F sig<0.05 and t.
sig<0.05
H4: There is a positive impact of Empathy on customer
satisfaction
Accepted F sig<0.05 and t.
sig<0.05
H5: There is a positive impact of Responsiveness on
customer satisfaction
Rejected Not linear
H6: There is a positive impact of network quality on
customer satisfaction
Rejected Not linear
Source: Survey Data 2017
5.4. Moderating Effect
As per the regression analysis, perceived value doesn’t moderate any dimension of service quality.
Ismail et al., (2009) indicate that perceived values don’t moderate the relationships between
responsiveness and assurance with customer satisfaction in education filed. Thus the results provide
partial support for the hypothesis of the study. Caruana, Money and Berthon (2000) confirmed that
direct link between service quality and satisfaction is moderated partially by perceived value in audit
firms.
Reliability
Table 5.6: Moderation effect - Summary
Summary
R R-sq MSE F df1 df2 p
.6859 .4705 .6093 113.7308 3.0000 384.0000 .0000
coefficient se T p LLCI ULCI
Reliability .5116 .1585 3.2276 .0014 .2000 .8233
Perceived value .8143 .1848 4.4053 .0000 .4508 1.1777
Perceived value x
Reliability -.0525 .0372 -1.4096 .1595 -.1257 .0207

PP. 26-58
Published by: Department of Marketing Management, University of Kelaniya, Sri Lanka
ISSN 1800 – 4989 Vol 3 No 1: January - June 2017
Moderator
IV Low Mod High
Low 3.8833 4.4981 5.1129
Mod 4.2768 4.8286 5.3805
High 4.5391 5.049 5.5588
Figure 5.1: Moderation effect
According to the graph of perceived value doesn’t moderate the relationship between reliability and
customer satisfaction. Therefore, hypothesis H1a: Perceived value moderates that influence made by
reliability on customer satisfaction is rejected.
Assurance
Relationships between Assurance (independent variable) and customer satisfaction (dependent
variable) are linear. Therefore, hypothesis H2b: Perceived value moderates that influence made by
assurance on customer satisfaction is rejected.
Tangibles
Table 5.7: Moderation effect - Summary
Summary
R R-sq MSE F df1 df2 p
.6859 .4705 .6093 113.7308 3.0000 384.0000 .0000
coeff. se t p LLCI ULCI
Reliability .5116 .1585 3.2276 .0014 .2000 .8233
Perceived value .8143 .1848 4.4053 .0000 .4508 1.1777
Perceived value x Reliability -.0525 .0372 -1.4096 .1595 -.1257 .0207
0
2
4
6
Low Mod High

PP. 26-58
Published by: Department of Marketing Management, University of Kelaniya, Sri Lanka
ISSN 1800 – 4989 Vol 3 No 1: January - June 2017
Moderator
IV Low Mod High
Low 3.854 4.4314 5.0088
Mod 4.2488 4.7908 5.3329
High 4.5448 5.0604 5.576
Figure 5.2: Moderation effect
According to the graph perceived value doesn’t moderate the relationship between tangibles and
customer satisfaction. Therefore, hypothesis H3c: Perceived value moderates that influence made by
tangibility on customer satisfaction is rejected.
Empathy
Table 5.8: Moderation effect - Summary
Summary
R R-sq MSE F df1 df2 p
.7327 .5368 .5330 148.3365 3.0000 384.0000 .0000
coeff se T p LLCI ULCI
Empathy .5862 .1505 3.8959 .0001 .2904 .8821
Perceived value .5860 .1830 3.2031 .0015 .2263 .9458
Perceived value x
Empathy
-.0263 .0359 -.7324 .4644 -.0969 .0443
Moderator
IV Low Mod High
Low 3.7995 4.2856 4.7717
Mod 4.3925 4.8471 5.3016
High 4.7879 5.2214 5.6549
0
2
4
6
Low Mod High

PP. 26-58
Published by: Department of Marketing Management, University of Kelaniya, Sri Lanka
ISSN 1800 – 4989 Vol 3 No 1: January - June 2017
Figure 5.3: Moderation effect
According to the graph perceived value doesn’t moderate the relationship between Empathy and
customer satisfaction. Therefore, hypothesis H4d: Perceived value moderates that influence made by
empathy on customer satisfaction is rejected.
Responsiveness
Relationships between Assurance (independent variable) and customer satisfaction (dependent
variable) are linear. Therefore, hypothesis H5e: Perceived value moderates that influence made by
responsiveness on customer satisfaction is rejected.
Network Quality
Relationships between Assurance (independent variable) and customer satisfaction (dependent
variable) are linear. Therefore, hypothesis H6f: Perceived value moderates that influence made by
network quality on customer satisfaction is rejected.
6. CONCLUSION AND RECOMMENDATIONS
6.1. Conclusion
The research focused on impact of service quality on customer satisfaction telecommunication industry
in Sri Lanka. According to telecommunication industry information, all service providers are in trouble
to be in the industry. As a result of this, some has exit from the business. This situation influence to
raise the question to find what the major dimensions of service quality that are involved to customer
satisfaction in mobile telecommunication industry of Sri Lanka and determine impact of service quality
on customer satisfaction as well as how perceived value moderates the relationship service quality and
customer satisfaction. The present study focused on the impact of service quality on customer
satisfaction as a whole as well as the impact of its constructs individually. According to the regression
0
1
2
3
4
5
6
Low Mod High

PP. 26-58
Published by: Department of Marketing Management, University of Kelaniya, Sri Lanka
ISSN 1800 – 4989 Vol 3 No 1: January - June 2017
analysis, it was revealed that service quality had a statistically significant, positive relationship with
customer satisfaction.
The study used SERVPERF model to measure service quality. According to the model, Reliability,
Tangibles, Assurance, Responsiveness, Empathy are the Service quality dimensions and Network
quality was added as a technical dimension. As well as, this research checked the moderating effect of
the perceived value to the relationship between service quality and customer satisfaction. According to
the analyses of the results, derived framework could be denoted as below.
Figure 6.1: Derived Model
Source: Author Developed
In Sri Lanka, the major dimensions of service quality which impact to customer satisfaction are
Empathy, Tangible and Reliability because the hypotheses regarding these dimensions are accepted. R
squared is the proportion of the variance in the dependent variable that is predictable from the
independent variable. Empathy has the highest value for R squared which is 40.2%. This means,
Empathy acquired 40.2% proposition from the total satisfaction. In telecommunication industry of Sri
Lanka. Other service quality dimensions that Tangible and Reliability hold second and third largest
respectively.
This study aimed to check sees whether any influence by perceived value towards relationship between
service quality and customer satisfaction. As rejecting hypotheses regarding moderating effect. It can
be concluded as perceived value doesn’t moderate the relationship between service quality and
customer satisfaction in mobile telecommunication industry in Sri Lanka.

PP. 26-58
Published by: Department of Marketing Management, University of Kelaniya, Sri Lanka
ISSN 1800 – 4989 Vol 3 No 1: January - June 2017
6.2. Recommendations
According to findings few recommendations are available for service providers in mobile
telecommunication industry in Sri Lanka. Firms in telecommunication industry should look into
Tangible, Empathy and Reliability of service quality dimensions.
i. Empathy refers to provide caring individualized attention the firm provides its customers.
Therefore, it is essential to provide individual attention to show to the customer that the
company does best to satisfy his needs.
ii. Tangible consist of the physical facilities, equipment and appearance of personnel. Clients often
trust the tangible evidence that surrounds the service when making their assessment.
iii. Reliability refers to the performance of a promised service in an accurate and timely manner
and to the delivery of intact and correct products (or services) at times convenient to customers.
7. REFERENCES
[1] Abd-Elrahman, A. (2017). A Review of Telecommunications Service Quality Dimensions. Sch J
ApplSci Res, 1(1), 10-18.
[2] Abdullah, H., & Sanad, A. (2017). The Impact of Service Quality Dimensions on Customer
Satisfaction in Telecom Mobile Companies in Yemen. American Journal of Economics, 7(4), 186-
193.
[3] Adam, B., & Fredrick, R. (2014). Factors Affecting QoS in Tanzania Cellular Networks, School of
Informatics and Virtual Education. The University of Dodoma, Tanzania
[4] Moreira, A. C., Silva, P. M., & Moutinho, V. F. (2016). Differences between stayers, switchers, and
heavy switchers. Marketing Intelligence & Planning, 34(6), 843–862. doi: 10.1108/mip-07-2015-
0128
[5] Anwar. A., & Ali Saleh, A. (2016). Service Quality Dimensions and Customer Satisfaction in
Telecommunication Companies in Yemen. Asian Journal of Business and Management, 04(03).
[6] Baker, J., & Lamb, W. (1994). Measuring Architectural Design Service Quality. Journal of
Professional Services Marketing, 10(1), 89–106.
PP. 26-58
Published by: Department of Marketing Management, University of Kelaniya, Sri Lanka
ISSN 1800 – 4989 Vol 3 No 1: January - June 2017
[7] Biljana, A., &Jusuf, Z. (2011). Measuring Customer Satisfaction with Service Quality Using
American Customer Satisfaction Model (ACSI Model). International Journal of Academic
Research in Business and Social Sciences, 1(3).
[8] Bruno, B., & Giovanna, P,. (2005). Understanding the relationship between attribute performance
and overall satisfaction. Marketing Intelligence & Planning, 23(6), 543–561.
[9] Buttle, F. (1996). SERVQUAL: review, critique, research agenda. European Journal of Marketing,
30(1), 8–32
[10] Carrillat, F., Jaramillo, F., & Mulki, J. (2007). The validity of the SERVQUAL and SERVPERF
scales. International Journal of Service Industry Management, 18(5), 472-490.
[11] Caruana, A., Money, A., & Berthon, P. (2000). Service quality and satisfaction – the moderating
role of value. European Journal of Marketing, 34(11/12),1338-1353.
[12] Chen, Z., & Dubinsky, A. J. (2003). A conceptual model of perceived customer value in e-
commerce: A preliminary investigation. Psychology and Marketing, 20(4), 323–347
[13] Cochran, W. G. (1977). Sampling techniques (3rd ed.). New York: John Wiley & Sons.
[14] Cronbach, L. J. (1946). Response Sets and Test Validity. Educational and Psychological
Measurement, 6(4), 475–494
[15] Cronin, J. J., & Taylor, S. A. (1992). Measuring Service Quality: A Reexamination and Extension.
Journal of Marketing, 56(3), 55.
[16] Cronin, J.J., Brady, M.K., & Tomas, H.G. (2000). Assessing the effects of quality, value, and
customer satisfaction on consumer behavioral intentions in service environments. Journal of
Retailing, 76(2), 193-218.
[17] Dabholkar, P. A., Shepherd, C. D., & Thorpe, D. I. (2000). A comprehensive framework for service
quality: an investigation of critical conceptual and measurement issues through a longitudinal study.
Journal of Retailing, 76(2), 139–173

PP. 26-58
Published by: Department of Marketing Management, University of Kelaniya, Sri Lanka
ISSN 1800 – 4989 Vol 3 No 1: January - June 2017
[18] Danish, R.Q., Ahmad, F., Ateeq, A., Ali, H.Y., & Humayon, A.A. (2015). Factors affecting
customer retention in telecom sector of Pakistan. American Journal of Marketing Research, 1(2),
28-36.
[19] Eboli, L., & Mazzulla, G. (2007). Service Quality Attributes Affecting Customer Satisfaction for
Bus Transit. Journal of Public Transportation, 10 (3), 21-34.
[20] Famiyeh, S., Asante-Darko, D., & Kwarteng, A. (2017). Service quality, customer satisfaction,
and loyalty in the banking sector. International Journal of Quality & Reliability Management,
35(8), 1546–1567
[21] Glaveli, N., Petridou, C., & Spathis, C. (2006). Bank service quality: Evidence from five Balkan
countries. Managing Service Quality,16(4)380-94.
[22] Glynn Mangold, W., & Babakus, E. (1991). Service Quality: the Front‐stage vs. the Back‐stage
Perspective. Journal of Services Marketing, 5(4), 59–70.
[23] Gronroos, C. (1982). An Applied Service Marketing Theory. European Journal of Marketing,
16(7), 30–41.
[24] Gronroos, C. (1990). Service Management and Marketing, Lexington Books, Lexington, MA.
[25] Gronroos, C. (2001). The perceived service quality concept – a mistake?. Managing Service
Quality, 11(3).
[26] Harry, M., Roger, M., Andi, S., & Paul, B. (2007). Customer satisfaction and service quality in
UK financial services. International Journal of Operations and Production Management, 27(9),
999-1019.
[27] HaslynNasuha, A., & MohdFaiz, H., (2014). Service Quality as Determinant of Customer Loyalty.
International Journal of Business and Innovation, 1(6).
[28] Ingy, S. (2016). Factors affecting customer loyalty for mobile telecommunication industry.
EuroMed Journal of Business,11(3).
[29] Ishfaq, A., Muhammad, M., Ahmad, U., Muhammad, Z., Naveed, A., & Wasim, R. (2010). A
mediation of customer satisfaction relationship between service quality and repurchase intentions

PP. 26-58
Published by: Department of Marketing Management, University of Kelaniya, Sri Lanka
ISSN 1800 – 4989 Vol 3 No 1: January - June 2017
for the telecom sector in Pakistan: A case study of university students. African Journal of Business
Management, 4(16), 3457-3462.
[30] Ismail, A., Alli, N., Abdullah, M. M., & Parasuraman, B. (2009). Perceive Value as a Moderator
on the Relationship between Service Quality Features and Customer Satisfaction. International
Journal of Business and Management, 4(2)
[31] Jamal, A., & Anastasiadou, K. (2009). Investigating the effects of service quality dimensions and
expertise on loyalty. European Journal of Marketing, 43(3/4), 398-420.
[32] Kang, G., & James, J. (2004). Service quality dimensions: an examination of Gronroos’s service
quality model. Managing Service Quality: An International Journal, 14(4), 266-277.
[33] Kant, R., & Jaiswal, D. (2017). The impact of perceived service quality dimensions on customer
satisfaction. International Journal of Bank Marketing, 35(3), 411–430
[34] Karin A., Pervez N. (2004). Service quality and customer retention: building long term
relationships. European Journal of Marketing, 38(11/12), 1577-1598. https://
doi.org/10.1108/03090560410560254
[35] Kenneth F. (2000). Recognizing deductive processes in qualitative research. Qualitative Market
Research: An International Journal, 3(2), 82 – 90.
[36] Kim, H., Lee, M., Lee, H., & Kim, N. (2010). Corporate Social Responsibility and Employee–
Company Identification. Journal of Business Ethics, 95(4), 557–569.
[37] Kline, R. B. (2011). Principles and Practice of Structural Equation Modeling (5th ed.). New York:
The Guilford Press.
[38] Kotler, P., & Milton, K. (2013). Market Your Way to Growth: Eight Ways to Win. Hoboken, NJ:
John Wiley and Sons, Inc.
[39] Kumar, M.., & Manshor, A. (2009). Determining the relative importance of critical factors in
delivering service quality of banks. Managing Service Quality, 19(2), 211-228.
[40] Lee, H. S. (2013). Major Moderators Influencing the Relationships of Service Quality, Customer
Satisfaction and Customer Loyalty. Asian Social Science, 9(2).

PP. 26-58
Published by: Department of Marketing Management, University of Kelaniya, Sri Lanka
ISSN 1800 – 4989 Vol 3 No 1: January - June 2017
[41] Lewlyn, L., Rodrigues, G., Varambally, F., & Golrooy, M. (2011). Comparison of SERVQUAL
and SERVPERF metrics: an empirical study. The TQM Journal, 23(6), 629 – 643.
[42] Mark, M., & Davis, J. (1998). How disconfirmation, perception and actual waiting times impact
customer satisfaction. International Journal of Service Industry Management, 9(1), 64 – 73.
[43] Mark, S., Philip, L., & Adrian, T. (2016). Research methods for business student (8th ed.).
[44] Mary,B., Bernard, B., & Mary, S. (1990). The Service Encounter: Diagnosing Favorable and
Unfavorable Incidents. Journal of Marketing, 54(1), 71-84.
[45] Michael, D., ClemesXinShu, C. (2014). Mobile communications: a comprehensive hierarchical
modelling approach. Asia Pacific Journal of Marketing and Logistics, 26(1), 114 -146.
[46] Mishra, A.R. (2004). Fundamentals of Cellular Network planning & Optimization. John Willey &
Sons Ltd, the Atrium, Southern Gate, England.
[47] Mukherjee, A., Nath, P., & Pal, M. (2003). Resource, service quality and performance triad: a
framework for measuring efficiency of banking services. Journal of the Operational Research
Society, 54, 723–735.
[48] Narteh, B. (2017). Service quality and customer satisfaction in Ghanaian retail banks: the
moderating role of price. International Journal of Bank Marketing, 36(1), 68–88.
[49] Oberiri, D. (2017), Quantitative Research Methods A Synopsis Approach. Arabian Journal of
Business and Management Review, 6(10)
[50] Oh, H., & Parks, S. (1997). Customer satisfaction and service quality: a critical review of the
literature and research implications for the hospitality industry. Hospitality Research Journal,
20(3), 35-64.
[51] Oliver, R. L. (1980). A Cognitive Model of the Antecedents and Consequences of Satisfaction
Decisions. Journal of Marketing Research, 17(4), 460.
[52] Padma, P., Rajendran, C., & Sai, L. (2009). A conceptual framework of service quality in
healthcare. Benchmarking: An International Journal, 16(2), 157–191.

PP. 26-58
Published by: Department of Marketing Management, University of Kelaniya, Sri Lanka
ISSN 1800 – 4989 Vol 3 No 1: January - June 2017
[53] Parasuraman, A., Zeithaml, V. A., & Berry, L. (1985). A Conceptual Model of Service Quality
and Its Implications for Future Research. Journal of Marketing, 49(4), 41–50.
doi:10.1177/002224298504900403
[54] Parasuraman, A., Zeithaml, V. A., & Berry, L. L. (1988). Servqual: A Multiple-Item Scale for
Measuring Consumer Perceptions of service quality Journal of Retailing, 64(1), 12-40.
[55] Petridou, E., Spathis, C., Glaveli, N., & Liassides, C. (2007). Bank service quality: Empirical
evidence from Greek and Bulgarian retail customers. International Journal of Quality and
Reliability Management, 24(6), 568–85.
[56] Richard, M. & Allaway, A. (1993). Service quality attributes and choice behavior. Journal of
Services Marketing, 7(1), 59-68.
[57] Sekaran, U., & Bougie, R. (2009). Research Methods for Business: A Skill Building Approach. A
John Wiley and Sons, Ltd, Publication.
[58] Siddiqi, K. O. (2011). Interrelations between service quality attributes, customer satisfaction and
customer loyalty in the retail banking sector in Bangladesh. International Journal of Business and
Management, 12–37.
[59] Sigit, P., & Dian, A. (2017). Effect of commitment and customers’ satisfaction on the relationship
between service quality and customer retention in rural banks in Makassar, Indonesia. Journal of
Management Development, 37(1), 53–64
[60] Stefan, M., Oriol, I., JatinderJit, S., & Vicenta, S. (2015). How does the Perceived Ethicality of
Corporate Services Brands Influence Loyalty and Positive Word-of-Mouth? Analyzing the Roles
of Empathy, Affective Commitment, and Perceived Quality. Journal of Business Ethics, 148(4),
721-740.
[61] Sunil, G., & Valarie, Z. (2006). Customer Metrics and Their Impact on Financial Performance.
Marketing Science, 25(6), 718-739.
[62] Valarie A. (1988). Consumer Perceptions of Price, Quality, and Value: A Means-End Model and
Synthesis of Evidence. Journal of Marketing, 52(3), 2-22.

PP. 26-58
Published by: Department of Marketing Management, University of Kelaniya, Sri Lanka
ISSN 1800 – 4989 Vol 3 No 1: January - June 2017
[63] Vikas, M., & KatrichisPankaj, K. (2001). Attribute performance and customer satisfaction over
time: evidence from two field studies. Journal of Services Marketing, 15(5), 343 – 356.
[64] Westfall, P. H., & Henning, K. (2013). Understanding Advanced Statistical Methods. Boca Raton,
FL: Chapman & Hall/CRC Texts in Statistical Science Series.