Embed Size (px)
Citation preview
1
IMPACT OF RISK BASED PML ESTIMATION ON EARTHQUAKE INSURANCE RATES FOR INDUSTRIAL BUILDINGS IN TURKEY
Ceyhun EREN 1 and Hilmi LUŞ 2
ABSTRACT
Estimating earthquake losses is an important issue which affects many areas like insurance applications. Insurers need to know realistic PML (Probable Maximum Loss) values to foresee the possible losses that they would face after a major earthquake happened and also to calculate the right insurance premiums. Insurers generally use fragility curves to manage their portfolio by calculating overall PML values. However, there are serious impacts of risk based PML estimation on the earthquake insurance rates. Therefore, these fragility curves which shows regional loss estimation rather than risk based PML, could lead them making wrong decisions.
In this study, in order to find out the impact of risk based PML estimation on earthquake insurance rates, a rapid earthquake loss estimation methodology has been developed for single-storey reinforced concrete industrial buildings by using the parameters determined after investigating more than 80 industrial building projects in Turkey. 384 analytical structural loss estimation curves were obtained by using non-linear structural performance analysis method proposed in 2007 Turkish Seismic Design Code. Then, the total insurance premiums corresponding to PML values of the buildings within the inventory for each different loss estimation method were calculated by also paying attention to the reinsurance cost, capital cost and profit that will be charged by the insurance companies.
At the end of the study, it was observed that the buildings, which have the same seismic performances according to the existing methods, could correspond to different damage states when this new methodology is used. In addition, it was also concluded that there are major differences among the earthquake insurance rates calculated by using the existing loss estimation methods and the ones calculated by risk based structural loss estimation method developed.
1 Head of Technical UW & Risk Control, Allianz Sigorta A.Ş., İstanbul, [email protected] 2 Assist. Prof. Dr., Boğaziçi University Civil Engineering Department, İstanbul, [email protected]
2
INTRODUCTION
Recent destructive earthquakes of the last two decades have resulted in considerably high economic losses for industrial buildings designed for the “Life Safety” performance similar to ordinary residential buildings. The insured losses of the 1999 Kocaeli Earthquake and the 2011 Tohoku Earthquake were estimated as 1.5-3.5 billion USD (RMS 2000) and 20-30 billion USD (AIR 2011), respectively. Recent earthquakes have demonstrated that industrial buildings are additionally subject to collateral losses such as fire following earthquakes, sprinkler leakage, hazardous materials release, and business interruption, which was the major problem for the most of the industrial facilities. On the other hand, for low-rise industrial facilities, structural damage is still the primary cause for direct and indirect losses in earthquakes.
Site investigations performed after Adana-Ceyhan (1998), Kocaeli (1999) and Düzce (1999) earthquakes have already revealed that seismic performances of precast buildings, which are the predominant structural type for the industrial buildings, are inadequate (Kayhan and Senel 2010). The issue is even more pressing for the Marmara Region, a highly industrialized area with a very high seismic risk measured at 2 % annual probability of occurrence of a magnitude 7+ earthquake on the main Marmara Fault (Durukal et al., 2008).
There is a significant concern for insurers about their potential insolvency due to catastrophic risks (Goda and Yoshikawa 2012). Earthquake risk is placed at the top of these catastrophic, so called Nat Cat (Natural Catastrophes) risks. The first study of earthquake insurance in Turkey dates back to 1978 (Deniz and Yucemen 2009) with the consideration of obligatory earthquake insurance feasibility. But only after the 1999 earthquakes could the obligatory insurance system be put into regulation. In 2000, with the formation of the Turkish Catastrophe Insurance Pool (TCIP) earthquake insurance was made compulsory. Although, it was a major breakthrough for the Turkish Insurance Sector, the coverage was, and still is, limited to residential buildings and industrial buildings were left out.
In this respect, insurance companies have to use well calibrated loss estimation models to be able to foresee possible losses they could face after a major earthquake and also to calculate the optimal premium. This brings about the need for more realistic earthquake PML (Probable Maximum Loss) values, especially for industrial buildings which have very high portion in the overall portfolio in terms of total values insured. PML term can be simply defined as the expected maximum earthquake loss to the building systems in terms of monetary loss, generally expressed in currency or as a percentage of the insured value (Yao 1981). Although the American Society for Testing and Materials (ASTM 2007) has published Standard Guide for the Estimation of Probable Loss to Buildings from Earthquakes (1999, revised in 2007), currently there is no unequivocally accepted standard for the definition of terms and analysis steps in PML estimation.
PML estimates were initially used by the insurance companies to quantify their risks especially after the 1925 Santa Barbara Earthquake, at a time insurance coverage against earthquake was rare and only with considerably high premiums. Historically, the PML is based on a deterministic analysis, using an event on the controlling fault for a site having a magnitude that is not expected to occur more than about once in every 475 years (i.e., 475-year return period). On the way to becoming more systematic, PML estimation studies has received considerable help from structural engineers. One of the first seismic building codes was the by-product of John Freeman’s well known book (Freeman 1932) in which earthquake loss estimation was mentioned possibly for the first time. In the 1980s, two landmark documents were published. Earthquake, Volcanoes, and Tsunamis: An anatomy of Hazards, in which an earthquake PML calculation method was introduced for the first time by Karl Steinbrugge, was published in 1982 (Steinbrugge 1982; Kircher et al., 1997). The second study, Earthquake Damage Evaluation Data for California by the Applied Technology Council, appeared in 1985. This influential study, commonly called ATC-13 (1985), was developed for estimating earthquake losses using Modified Mercalli Intensity (MMI) based (qualitative) damage probability matrices determined
C.Eren and H.Luş 3
via expert opinions for various building and occupational classes (78 existing facility classes in California including 36 building structure classes; Kircher et al., 1997). Following ATC-13, FEMA published the first edition of Rapid Visual Screening of Buildings for Potential Seismic Hazards: A Handbook (FEMA 2002) also known as FEMA-154 or ATC-21; the methodology followed therein was based on a scoring system developed by using the damage probability matrices of ATC-13. In 1989, FEMA published the National Academy of Sciences report Estimating Losses from Future Earthquakes, a valuable contribution listing guidelines for conducting loss estimation studies (Whitman et al., 1997). The last major effort to improve vulnerability assessment was undertaken by the National Institute of Building Sciences. The result was HAZUS, a comprehensive loss assessment software program first released in 1997. It was aimed to reduce the uncertainty, especially in the vulnerability assessment, by replacing MMI with objective measures of ground motion such as spectral displacement and spectral acceleration. For this purpose, fragility curves were constructed for each building type by using the capacity spectrum method similar to NEHRP Guidelines for the Seismic Rehabilitation of Buildings and Seismic Evaluation and Retrofit of Concrete Buildings, known as ATC 40 (1996). This approach classifies buildings in terms of their use (occupancy class) and their structural system (building type). Twenty-eight occupancy classes and 36 model building types are defined (FEMA 2001; Kircher et al., 1997). In 2002, the second edition of FEMA 154 Report, Rapid Visual Screening of Buildings for Potential Seismic Hazards: A Handbook, was published with a new scoring system based on the HAZUS Methodology and fragility curves, replacing the expert-opinion Damage Probability Matrices of ATC-13 (FEMA 2002).
Within the last decade, several earthquake loss estimation methodologies and computer programs based on deterministic or probabilistic approaches have also been developed by third party companies. Such efforts are generally tailored to the insurance sector and governmental programs, aiming to bridge the gap between technical engineering evaluations and non-technical decision-makers. Most of these existing models, however, are focused on regional earthquake loss estimation instead of individual structural analysis, and the structural parameter on which the fragility curves are based is generally the load bearing system, without much significant attention being given to other structural parameters that may adversely affect structural performance.
Another important reason to show interest in individual seismic analysis is that design criteria of industrial buildings in Turkey, most of which are precast reinforced concrete, has changed considerably in parallel with modifications in earthquake design codes. There would be important differences between the seismic performances of the buildings constructed before and after the code publishing dates although they have similar properties. As an example, the earthquake load reduction factor (R) was decreased from 5 to 3 in the existing Turkish Seismic Design Code (2007) (TSDC07) when we compare with the previous version of the Code (1998).
The aim of this study is to discuss a new analytical methodology which provides fast, easy and reliable earthquake loss estimation for reinforced concrete industrial buildings, and to assess its impact in PML estimation and earthquake insurance rates derived from such PML assessments. The structural assessment method used is the nonlinear static pushover analysis as per described in TSDC07.
BUILDING INVENTORY ANALYSES
The building inventory used in this study comprises pin-connected precast and cast-in-place reinforced concrete industrial buildings which have reinforced concrete columns with square cross-sections. This
4
inventory has been determined after investigating the structural projects of more than 80 reinforced concrete industrial buildings in Turkey obtained by the site studies and also by the interviews with the producers of precast structural members in order to find out the representative structural properties. Most of the industrial buildings in Turkey are single-storey precast concrete frame structures or reinforced concrete structures with single columns (precast or cast-in-place) carrying lightweight roof structures because of the short duration of construction period and respectively low investment costs (Karaesmen 2001). There exist comprehensive studies performed after the Adana-Ceyhan (1998), Kocaeli (1999) and Düzce (1999) earthquakes in which structural properties and seismic performances of such precast buildings were documented (Kayhan and Senel 2010). On the other hand, structural properties of these types of buildings that were more recently built are expected to have changed considerably especially after the TSDC07 has published; it is worth mentioning, for example, that the cross-sections of the columns have increased with the new regulations.
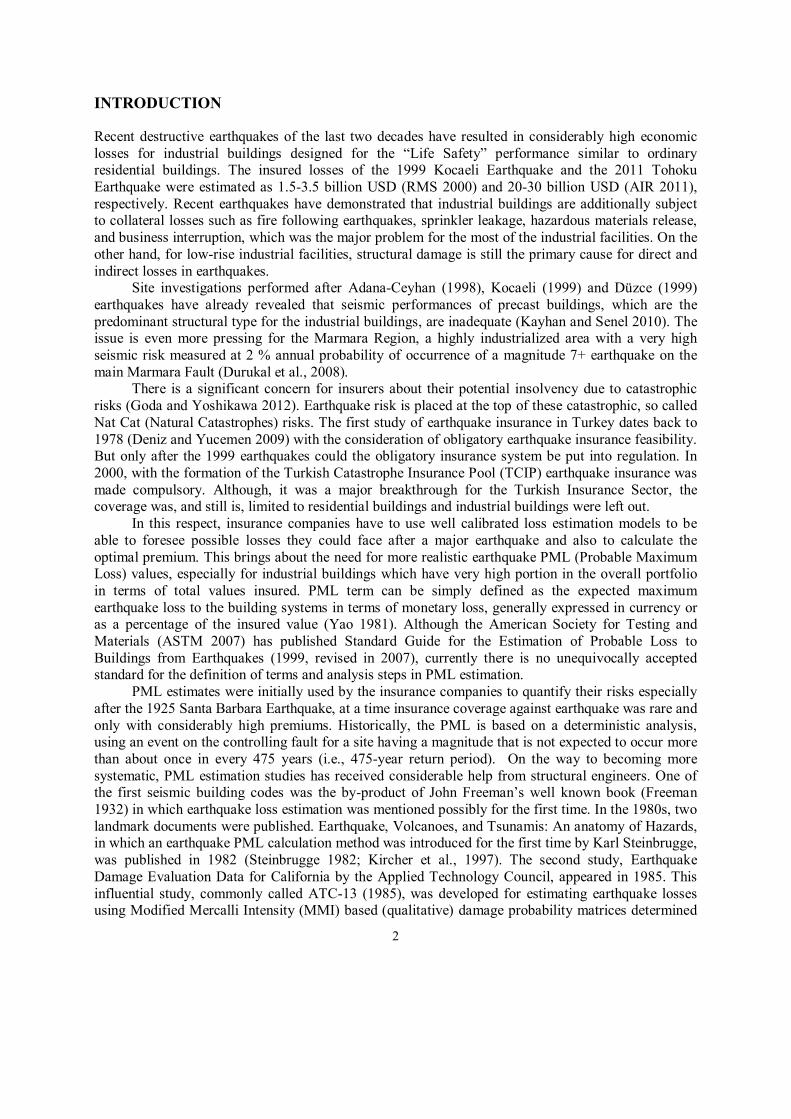
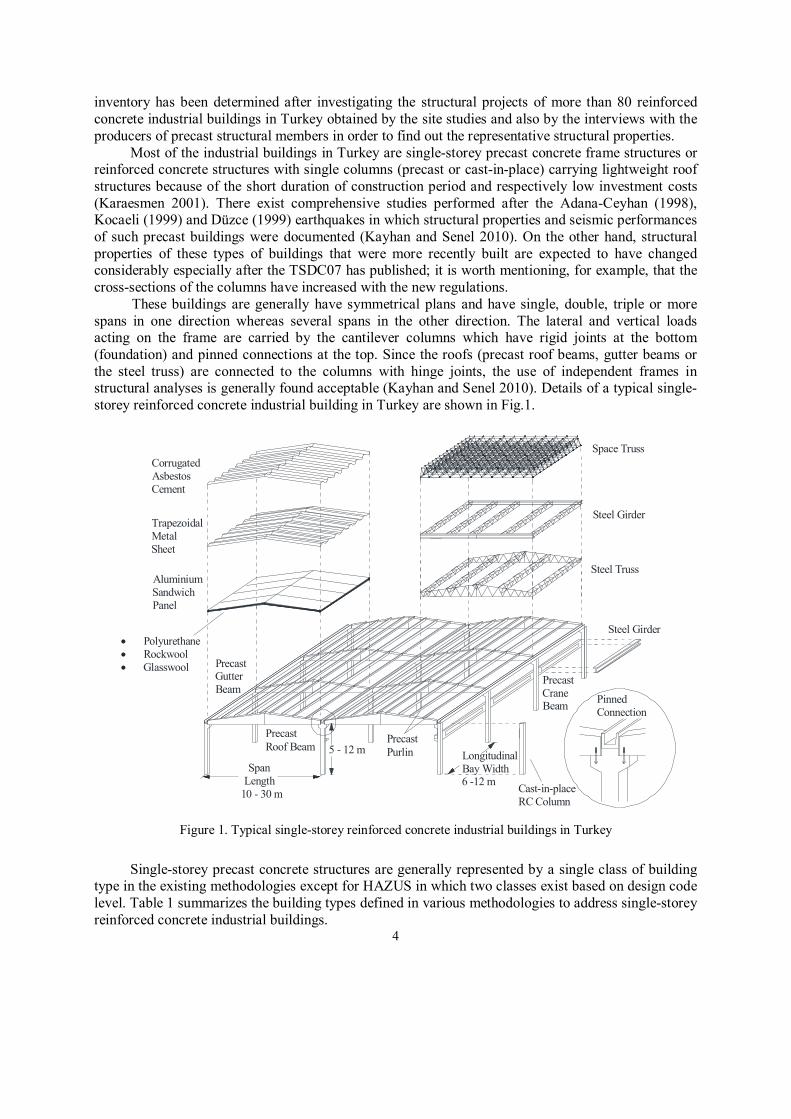
These buildings are generally have symmetrical plans and have single, double, triple or more spans in one direction whereas several spans in the other direction. The lateral and vertical loads acting on the frame are carried by the cantilever columns which have rigid joints at the bottom (foundation) and pinned connections at the top. Since the roofs (precast roof beams, gutter beams or the steel truss) are connected to the columns with hinge joints, the use of independent frames in structural analyses is generally found acceptable (Kayhan and Senel 2010). Details of a typical single-storey reinforced concrete industrial building in Turkey are shown in Fig.1.
SpanLength
10 - 30 m
5 - 12 m
Polyurethane Rockwool Glasswool
AluminiumSandwichPanel
TrapezoidalMetalSheet
CorrugatedAsbestosCement
Steel Truss
Steel Girder
Space Truss
Steel Girder
PrecastCraneBeam
PrecastRoof Beam
PrecastGutterBeam
PrecastPurlin Longitudinal
Bay Width6 -12 m
PinnedConnection
Cast-in-placeRC Column
Figure 1. Typical single-storey reinforced concrete industrial buildings in Turkey
Single-storey precast concrete structures are generally represented by a single class of building type in the existing methodologies except for HAZUS in which two classes exist based on design code level. Table 1 summarizes the building types defined in various methodologies to address single-storey reinforced concrete industrial buildings.
C.Eren and H.Luş 5
Table 1. Building classification according to the existing loss estimation methods corresponding to the building type in this study (Freeman 1932; Steinbrugge 1982; ATC 1985; FEMA 2001; FEMA 2002)
Method Building Class Description
John Freeman 9 Commercial buildings with reinforced concrete
frames and columns Karl V. Steinbrugge 4C Lift-slab, precast
ATC-13 81 Precast concrete (other than tilt-up) – Low rise FEMA 154 PC2 Precast concrete frame
HAZUS PC2L Precast concrete frames (Low rise) (Minimum or High-Code)
Finally, the building inventory has been determined as composed of 80 single-storey reinforced
concrete industrial buildings after taking out the ones which have identical column cross-sections among the buildings of which the projects have been investigated.
STRUCTURAL LOSS ESTIMATION
In order to make a comparison among the PML values calculated by using different PML estimation methods, 4 sample buildings within the building inventory were selected. The structural properties of these buildings are summarized in Table 2. The selected buildings are all located in the 1st Earthquake Zone (PGA = 0.4g), with two of them (1 and 2) were built on Z3 type soil whereas the other two (3 and 4) were built on Z2 type soil according to TSDC07.
Table 2. Architectural and structural properties of the selected industrial buildings
No Column Section (cm)
Span Length (m)
Bay Width (m)
L (m)
Roof System Axial Load (kN) Bearing System Covering
1 60 × 60 (ρ= %1)
(>2) 14 11 6
Steel Beam
IPE550
Steel Purlin
Sandwich Panel
(Rockwool) 89
2 60 × 60 (ρ= %1)
(>2) 25 8 12 Precast
Beam Precast Purlin
Metal Sheet (Rockwool) 313
3 50 × 50 (ρ= %1)
(>2) 15 7.5 7.75 Precast
Beam Precast Purlin
Sandwich Panel
(Polyurethane) 152
4 50 × 50 (ρ= %1)
(>2) 28 10 8 Precast
Beam Precast Purlin
Sandwich Panel
(Polyurethane) 389
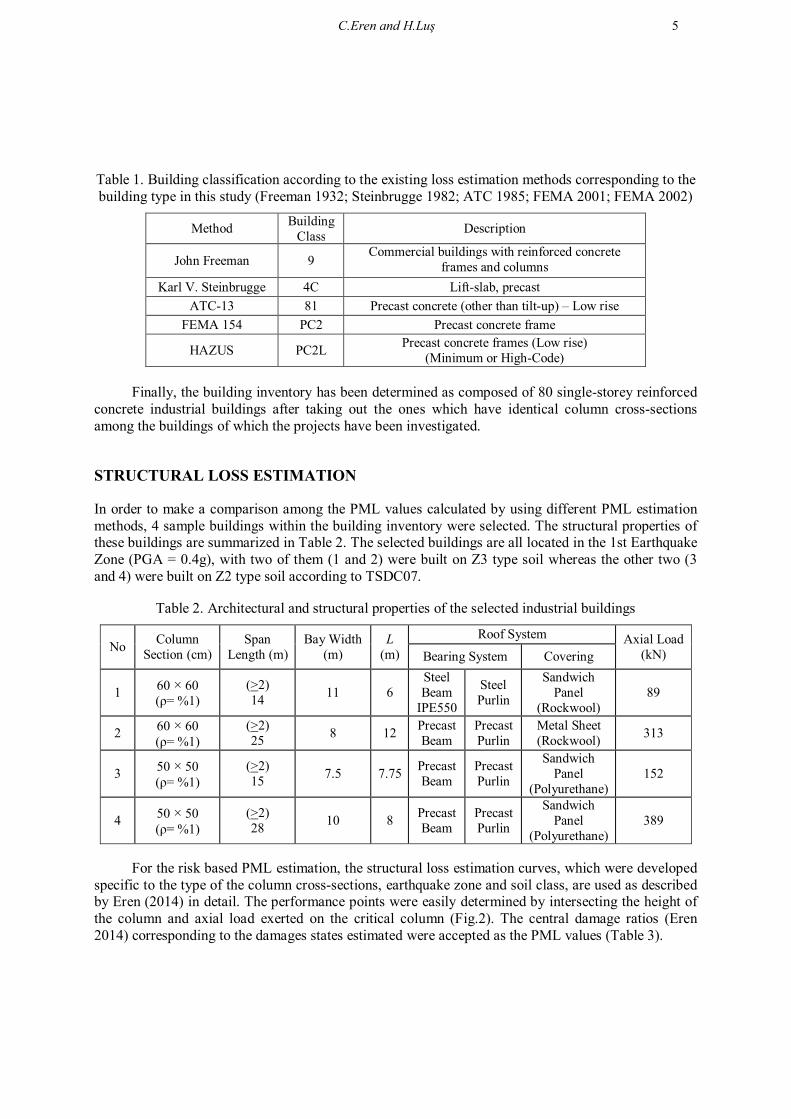
For the risk based PML estimation, the structural loss estimation curves, which were developed specific to the type of the column cross-sections, earthquake zone and soil class, are used as described by Eren (2014) in detail. The performance points were easily determined by intersecting the height of the column and axial load exerted on the critical column (Fig.2). The central damage ratios (Eren 2014) corresponding to the damages states estimated were accepted as the PML values (Table 3).
6
0
200
400
600
800
1000
5 6 7 8 9 10 11 12
W (k
N)
L (m)
0
200
400
600
800
1000
5 6 7 8 9 10 11 12
W (k
N)
L (m) a) Loss Estimation Curve of the column that has 60×60 b) Loss Estimation Curve of the column that has 50×50 cm cross-section with 1% reinforcement ratio (E1 Z3) cm cross-section with 1% reinforcement ratio (E1 Z2)
Figure 2. Demonstration of PML estimation for the sample buildings selected by using analytical structural loss estimation curves developed
For comparison purposes, the following methods, which were previously mentioned, are employed to calculate the PML values for the four selected buildings:
A. According to John Freeman’s (1932) pioneering study of structural loss estimation, PML values change between 10 % and 20 % for reinforced concrete industrial buildings, with 20 % being the conservative proposal.
B. According to the approach proposed by Karl Steinbrugge (1982), PML values of the four selected buildings, all of which would be classified as Class 4C, may be calculated using damage factors as;
PML = 60×[1+(-10+5+10)/100] = 63 %
C. In FEMA 154, the final score of the sample buildings (PC2) selected is calculated as 2.0, with
the decrease of 0.4 caused by soft soil conditions. This score leads to the PML value of 60 %, which is the limit value for “Complete Damage” State (FEMA 2002).
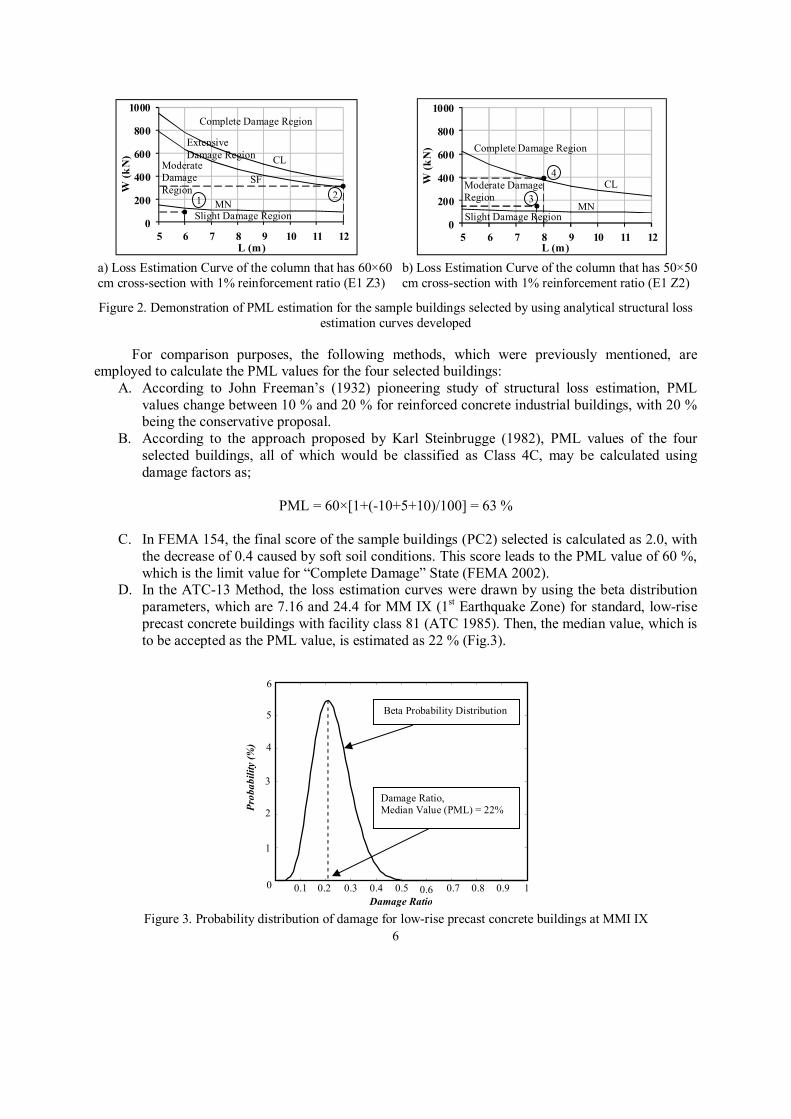
D. In the ATC-13 Method, the loss estimation curves were drawn by using the beta distribution parameters, which are 7.16 and 24.4 for MM IX (1st Earthquake Zone) for standard, low-rise precast concrete buildings with facility class 81 (ATC 1985). Then, the median value, which is to be accepted as the PML value, is estimated as 22 % (Fig.3).
Figure 3. Probability distribution of damage for low-rise precast concrete buildings at MMI IX
0.1 0.2 0.3 0.4 0.5 0.6 0.7 0.8 0.9 10
1
2
3
4
5
6
Damage Ratio
Prob
abili
ty (%
)
Damage Ratio, Median Value (PML) = 22%
Beta Probability Distribution
SF
MN 2 3
4
Complete Damage Region
CL
1 MN Slight Damage Region
Moderate Damage Region
Complete Damage Region
CL
Slight Damage Region
Moderate Damage Region
Extensive Damage Region
C.Eren and H.Luş 7
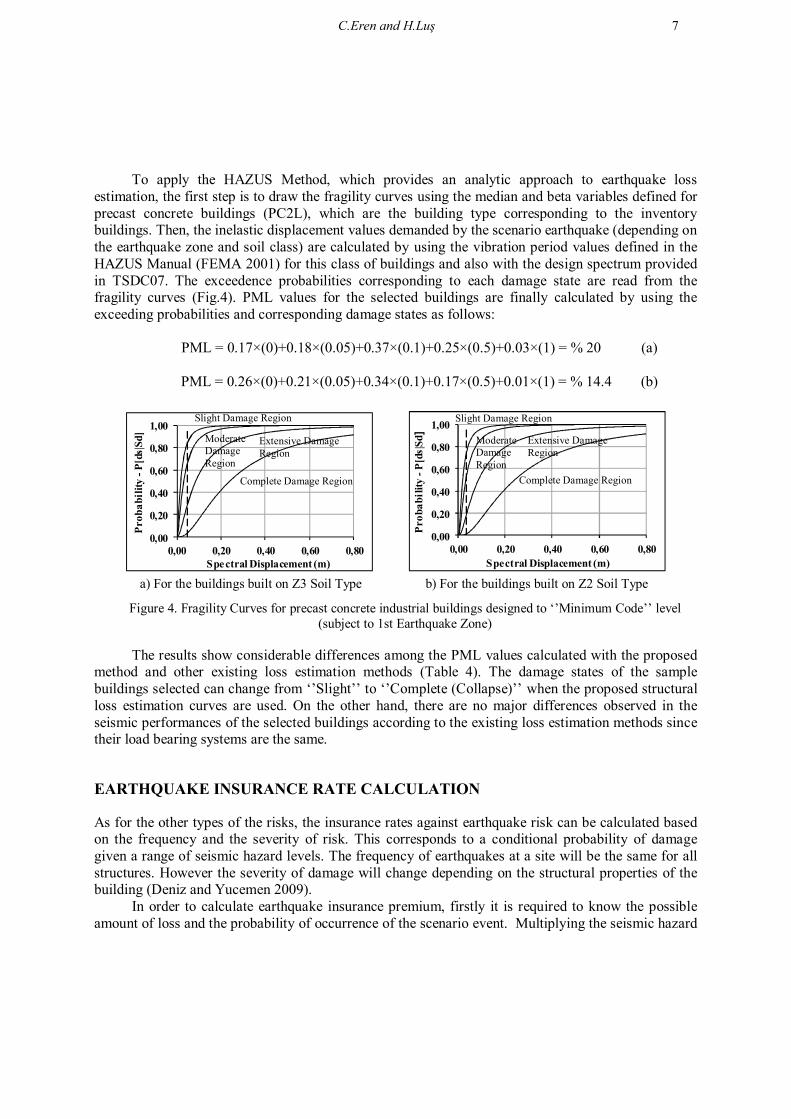
To apply the HAZUS Method, which provides an analytic approach to earthquake loss estimation, the first step is to draw the fragility curves using the median and beta variables defined for precast concrete buildings (PC2L), which are the building type corresponding to the inventory buildings. Then, the inelastic displacement values demanded by the scenario earthquake (depending on the earthquake zone and soil class) are calculated by using the vibration period values defined in the HAZUS Manual (FEMA 2001) for this class of buildings and also with the design spectrum provided in TSDC07. The exceedence probabilities corresponding to each damage state are read from the fragility curves (Fig.4). PML values for the selected buildings are finally calculated by using the exceeding probabilities and corresponding damage states as follows:
PML = 0.17×(0)+0.18×(0.05)+0.37×(0.1)+0.25×(0.5)+0.03×(1) = % 20 (a)
PML = 0.26×(0)+0.21×(0.05)+0.34×(0.1)+0.17×(0.5)+0.01×(1) = % 14.4 (b)
0,00
0,20
0,40
0,60
0,80
1,00
0,00 0,20 0,40 0,60 0,80
Prob
abili
ty -
P[ds
|Sd]
Spectral Displacement (m)
0,00
0,20
0,40
0,60
0,80
1,00
0,00 0,20 0,40 0,60 0,80
Prob
abili
ty -
P[ds
|Sd]
Spectral Displacement (m)
a) For the buildings built on Z3 Soil Type b) For the buildings built on Z2 Soil Type
Figure 4. Fragility Curves for precast concrete industrial buildings designed to ‘’Minimum Code’’ level (subject to 1st Earthquake Zone)
The results show considerable differences among the PML values calculated with the proposed
method and other existing loss estimation methods (Table 4). The damage states of the sample buildings selected can change from ‘’Slight’’ to ‘’Complete (Collapse)’’ when the proposed structural loss estimation curves are used. On the other hand, there are no major differences observed in the seismic performances of the selected buildings according to the existing loss estimation methods since their load bearing systems are the same.
EARTHQUAKE INSURANCE RATE CALCULATION
As for the other types of the risks, the insurance rates against earthquake risk can be calculated based on the frequency and the severity of risk. This corresponds to a conditional probability of damage given a range of seismic hazard levels. The frequency of earthquakes at a site will be the same for all structures. However the severity of damage will change depending on the structural properties of the building (Deniz and Yucemen 2009). In order to calculate earthquake insurance premium, firstly it is required to know the possible amount of loss and the probability of occurrence of the scenario event. Multiplying the seismic hazard
Slight Damage Region
Moderate Damage Region
Extensive Damage Region
Complete Damage Region Complete Damage Region
Extensive Damage Region
Moderate Damage Region
Slight Damage Region
8
(SH) by the structural loss estimate (PML) gives the base rate (BR) (Yücemen 2005; Yücemen et al., 2008; Deniz and Yucemen 2009); BR SH PML (1) where SH = annual probability of an earthquake occurring at the site.
In this study, SH value has taken as equal to the annual probability of an event with a return period of 475 years, which is the seismic demand considered during the PML estimation studies. It was also assumed that the scenario earthquake follows a homogeneous Poisson process (Faber 2007);
1
475ASH P (2)
Then, pure risk premium (PRP) or the amount of annual loss (AL) of a property can be
calculated by multiplying the base rate (BR) with the building insured value (IV) which is equal to the net floor area times the pre-defined reconstruction cost per square meter. In order to provide simplicity, the insured values of the buildings analyzed in the scope of this study have been considered as they are equal to each other with the value of 1.000.000 TL.
Since the pure risk premium reflects only the risk of damage, the total insurance premium (TP) or the commercial insurance premium that will be charged by an insurance company should be determined to allow for recovery of expenses and profit. For this purpose, in classical studies carried out in Turkey, the corresponding factor was taken as 1.67 (Deniz and Yucemen 2009). However, the insurance rate charged by a company is a function of its capital and demand from the public and also reinsurance rates which are generally controlled by the foreign reinsurance firms and market conditions (Deniz and Yucemen 2009). Moreover, the size of the portfolio consists of the same class of buildings is also very important in order to calculate the risk based earthquake insurance premium. Therefore in this study, the reinsurance cost, capital cost and profit are also included to the premium calculations. The formulation used during the earthquake insurance rate calculations can be summarized as the following; AL BR IV (3)
0 ,
A
A APortfolio
AL D PPRC AL D P AL D P
(4)
1 1TRC PRC CCE P (5)
0 ,
A
AA
APortfolio
AL D P
RC AL D PTRC AL D P
AL D P
(6)
C.Eren and H.Luş 9
,
A
A A
AL CCE AL D PCC
D P CCE AL D P
(7)
1TP PRP RC CC P (8)
TPEIRIV
(9)
The steps that were followed during the earthquake insurance rate calculations can be
summarized as the following; Firstly, the amount of annual loss (AL) or pure risk premium was calculated for each building in
the inventory by simply multiplying the insured values and the base rates (BR) by using Eq.(3). Then the total annual loss of the portfolio was calculated by adding up annual loss amounts
which were found separately. Before calculating the reinsurance cost (RC), a deductible amount (D), which means that the
reinsurance company would be responsible to pay the amount of loss above this limit for each and every loss, was determined. The reinsurance cost would be nil for the risks which have smaller amount of annual loss then the amount of deductible.
In order to find out total reinsurance cost, firstly the pure reinsurance cost (PRC) was calculated by subtracting annual loss amounts of each risk which are below the annual deductible amounts from the total annual loss by using Eq.(4). Then, the capital cost (CC) and some profit (P) for the reinsurance company, were applied to find the total reinsurance cost (TRC) as can be seen in Eq.(5). Both capital cost effect (CCE) and profit ratio were taken as 10 % in this study.
Then the total reinsurance cost was distributed for each risk according to the risk based PML values by paying attention to the loss amount (if it is smaller or higher than the deductible of 10 % of insured value or 100,000 TL in this case) as can be seen in Eq.(6).
The capital cost (CC) was calculated by loading certain percentage (CCE), namely 10 % in this study, to the annual loss amount of each risk as can be seen in Eq.(7). During these calculations if the annual loss amount is higher than the reinsurance deductible, this time the deductible amount was used as the annual loss amount which will be loaded by the capital cost effect since the loss amount above deductible would be directly transferred to the reinsurance company.
Finally, the total premium (TP) was calculated for each risk by applying certain amount of profit (P), namely 10 % in this study, after adding both reinsurance cost and capital cost to the base premium by using Eq.(8). Then the earthquake insurance rates (EIR) for each risk were calculated by simply dividing the total premium by the building insured value by using Eq.(9).
It should also be noted that if there exists also accumulation risk in a specific region, special loadings determined by the reinsurance agreements could be made by using the same methodology. Table 3 summarizes the sample calculations conducted by using analytical PML estimation tool
recently developed to find out the earthquake insurance rates for the portfolio consists of 80 different single-storey reinforced concrete industrial buildings in Turkey.
10
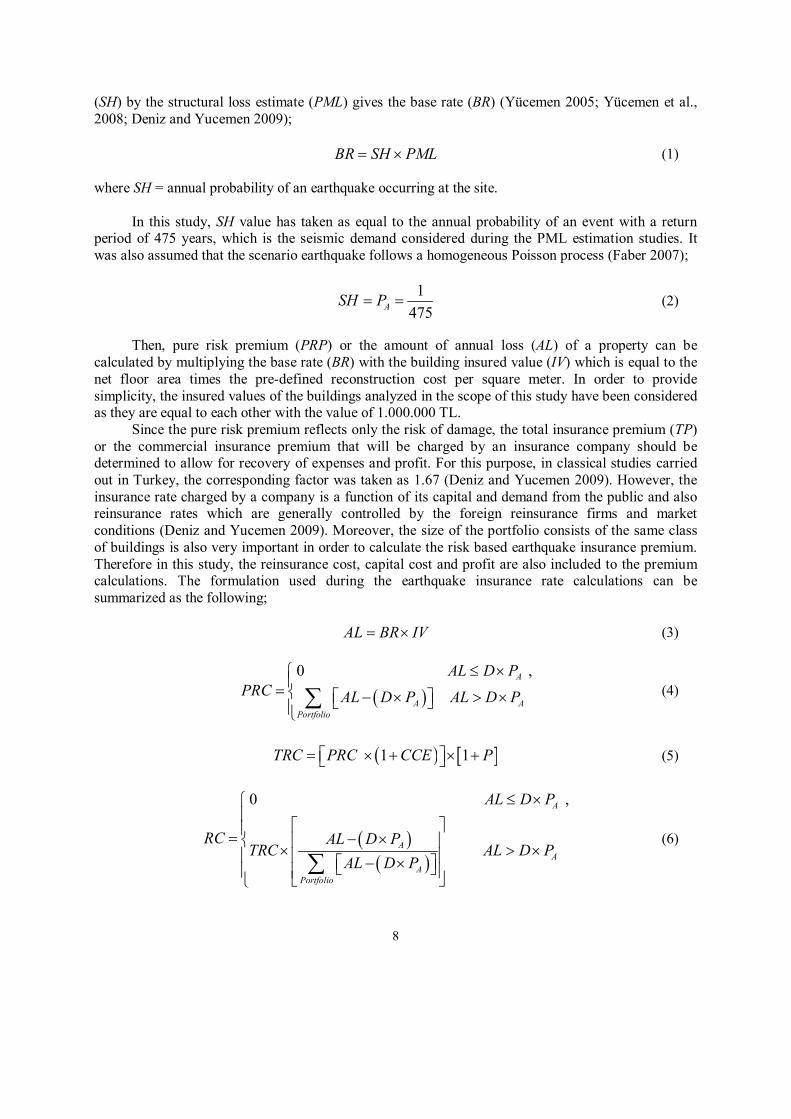
Table 3. Earthquake insurance rate calculation by using risk based PML estimation method for the portfolio consists of 80 different single-storey reinforced concrete industrial buildings in Turkey
Damage State PML
Base Rate (‰)
Annual Loss (TL)
Capital Cost (TL)
Reinsurance Cost (TL)
Total Premium
(TL)
Net Rate (‰)
Slight 5 % 0.11 105.3 10.5 0.00 127.4 0.13 Moderate 30 % 0.63 631.6 21.1 509.5 1,278.3 1.28 Extensive 70 % 1.47 1473.7 21.1 1,528.4 3,325.5 3.33 Complete 100 % 2.11 2105.3 21.1 2,292.6 4,860.8 4.86
Total Portfolio
15.3 mio TL 32,210 1,178.9 24,709.5 63,908.9
As it is obvious, one of the most important inputs for estimating earthquake insurance rate is the structural loss estimates (PML). In order to analyze the impacts of risk based PML estimation versus portfolio based PML estimation on earthquake insurance rate calculation, same methodology has been used for all other PML estimation methods. When the results are compared, it can be stated that although there is no major differences among the average earthquake insurance rates of both risk based and portfolio based PML estimation methods except Karl V. Steinbrugge and FEMA 154 v:2, there is a huge deviation for the risks which have the same seismic performance level. As an example; while the rate of risk based PML estimation is 1.28 ‰ for the risks which are at ‘’Moderate Damage’’ State, the rates of portfolio based PML estimations can change from 0.18 ‰ to 2.97 ‰. Moreover, the rates of the portfolio based PML estimations (0.21 ‰ - 2.97 ‰) for the risks which are at ‘’Complete Damage (Collapse)’’ State are quite low compared to rate of risk based PML estimation (4.86 ‰).
When the results were also compared with the maximum possible insurance rate for the reinforced concrete structures (2.20 per 1000 units of insured property) in Turkish Catastrophe Insurance Pool (TCIP; 2014), it was determined that the earthquake insurance rates defined in TCIP is very low for the buildings which have ‘’Extensive’’ and ‘’Complete’’ damage states according to the risk based loss estimation method, although TCIP was designed only for residential buildings.
Table 4 shows the comparison of the PML values and corresponding earthquake rates for the same four sample buildings selected from the building inventory calculated by using different PML estimation methods.
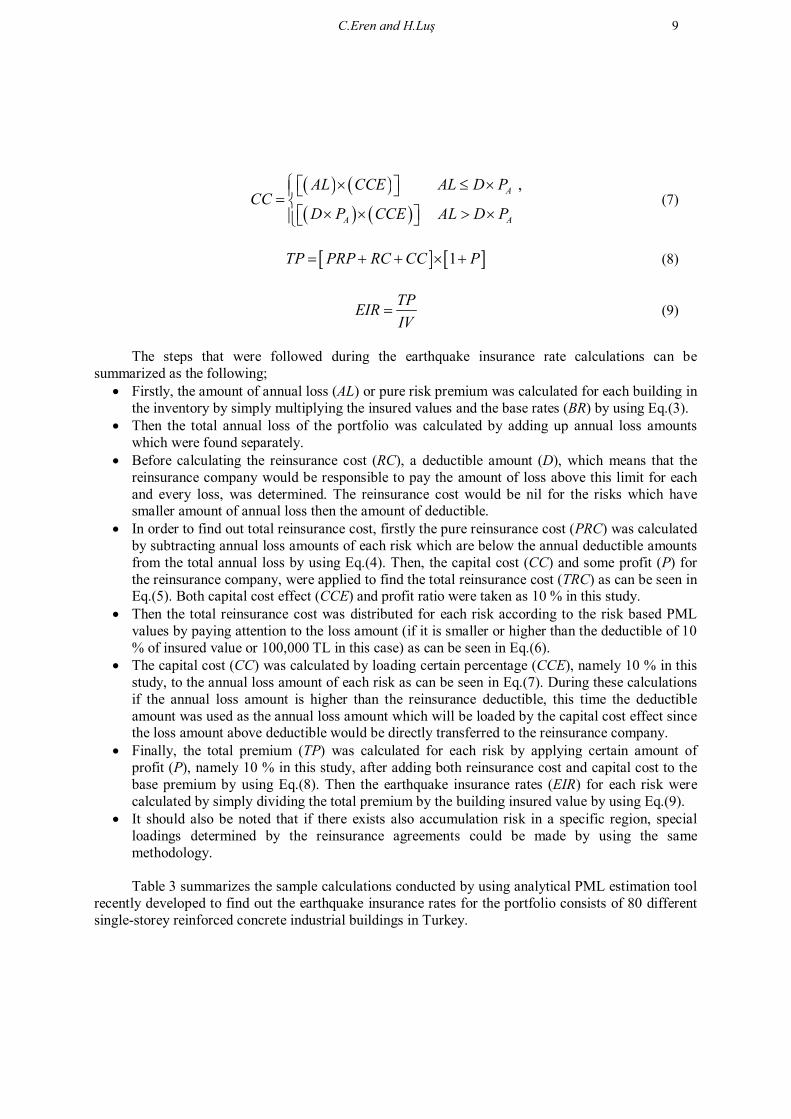
Table 4. Comparison of the PML values and earthquake insurance rates for the sample buildings by using different loss estimation methods
No
Structural Loss Estimation (PML values; %) and Earthquake Insurance Rates (‰)
John Freeman
Karl V. Steinbrugge ATC-13 FEMA
154 v:2 HAZUS Proposed Method
PML Rate PML Rate PML Rate PML Rate PML Rate PML Rate 1 20 0.77 63 2.97 22 0.87 60 2.81 20 0.77 5 0.13 2 20 0.77 63 2.97 22 0.87 60 2.81 20 0.77 70 3.33 3 20 0.77 63 2.97 22 0.87 60 2.81 14.4 0.48 30 1.28 4 20 0.77 63 2.97 22 0.87 60 2.81 14.4 0.48 100 4.86
The other important parameters, such as total reinsurance costs, the average and total values of
PML and earthquake insurance premium of the same building inventory calculated by using all different PML estimation methods are summarized in Table 5.
C.Eren and H.Luş 11
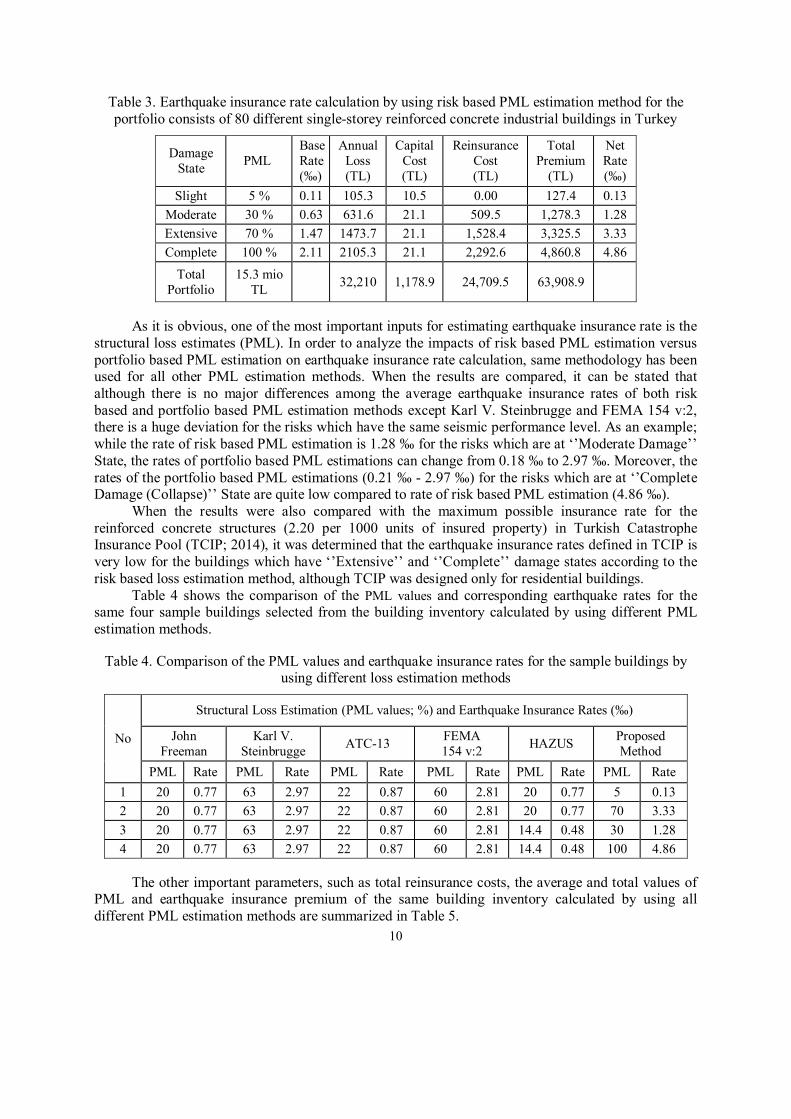
Table 5. Comparison of the earthquake insurance rates for the sample buildings by using different PML estimation methods
CONCLUSIONS
Estimating expected major losses due to a large magnitude earthquake has been a major concern for the insurance sector. Especially, recent destructive earthquakes have forced the insurance companies to obtain reliable estimates of potential seismic losses not only for having sufficient reserves but also for calculating the right premiums to survive in the competitive market.
In this study, a rapid, analytical earthquake loss estimation (PML) methodology, which can be used even by non-experts in earthquake engineering, has been developed for single-storey reinforced concrete industrial buildings. Then, the total insurance premiums corresponding to PML values of the buildings within the inventory for each different loss estimation method were calculated by also paying attention to the reinsurance cost, capital cost and profit that will be charged by the insurance companies in order to find out the impact of risk based PML estimation on earthquake insurance rates.
At the end of the study, it was determined that the PML values of the industrial buildings within the inventory could be totally different when the analysis results of the proposed method and the existing loss estimation methods were compared. Consequently, the earthquake insurance rates are observed to be very much sensitive to the structural loss estimation.
In conclusion, the use of risk based PML estimations rather than regional loss estimations may be expected to have a significant impact in determining the optimum insurance premium. Such an approach would decrease the risk of a potential insolvency by identifying the particular buildings susceptible to high seismic risk and increase the ability of the insurer to compete in the market by identifying those buildings susceptible to low seismic risk by allowing the calculation of optimum insurance premiums in all cases.
REFERENCES
Air Worldwide (AIR) (2011) Damage survey report, Tohoku, Japan Earthquake, http://www.airworldwide.com/Publications/Presentations/AIR-Surveys-Damage-from-the-Tohoku- Earthquake-and-Tsunami-(Summary-and-Slideshow)
Method PML Total
Reinsurance Cost (TL)
Premium
Average (%) Total (TL)
Average (TL)
Total (TL)
John Freeman 20 16,000,000 20,378.9 766.5 61,322.1 Karl V. Steinbrugge 62.14 49,710,000 106,250.7 2,923.1 233,846
ATC-13 13.94 11,150,000 14,061.4 532.4 42,592.5 FEMA 154 v:2 60.5 48,400,000 102,913.7 2,839.3 227,142
HAZUS 12.65 10,119,000 7,219 432.4 34,591.2 Proposed Method 19.1 15,300,000 24,709.5 798.9 63,908.8
12
Applied Technology Council (ATC) (1985) Earthquake damage evaluation for California, ATC 13, Redwood City, California Applied Technology Council (ATC) (1996) Seismic evaluation and retrofit of concrete buildings, ATC 40, Redwood City, California ASTM (2007) ASTM E2026-07, Standard guide for the estimation of probable loss to buildings from earthquakes, American Society for Testing and Materials, West Conshohocken, Pennsylvania Deniz A and Yucemen MS (2009) ‘’Assessment of earthquake rates for the Turkish Catastrophe Insurance Pool’’, Georisk: Assessment and management of risk for engineered systems and geohazards, 3:2, 67-74 Durukal E, Erdik M, Uçkan E (2008) ‘’Earthquake Risk to Industry in İstanbul and its Management’’, Springer, Natural Hazards, 44:199-212 Eren C (2014) ‘’Rapid Loss Estimation Methodology for Single Storey Reinforced Concrete Industrial Buildings’’, Technical Journal of Turkish Chamber of Civil Engineers, Vol.25, No.2. (in Turkish) Faber MH (2007) Lecture Notes: Statistics and Probability Theory, Exercises Tutorial 7, http://www.ibk.ethz.ch/ emeritus/fa/education/ss_statistics/07Statistik/Exercise_tutorial_7_SS07_web.pdf, Swiss Federal Institute of Technology Zurich, EZTH Federal Emergency Management Agency (FEMA) (2001) HAZUS 99, Earthquake loss estimation methodology, technical and user’s manual, Washington, DC Federal Emergency Management Agency (FEMA) (2002), Rapid visual screening of buildings for potential seismic hazards: A handbook, FEMA 154, Second edition, Washington, DC Freeman JR (1932) Earthquake damage and earthquake insurance: Studies of a rational basis for earthquake insurance, also studies of engineering data for earthquake-resisting construction, New York: McGraw- Hill Goda K, Yoshikawa H (2012) ‘’Earthquake insurance portfolio analysis of wood-frame houses in south western British Columbia, Canada’’, Springer Science and Business Media B.V., Earthquake Engineering, 10:615-643 Karaesmen E (2001) Prefabrication in Turkey: Facts and figures, Department of Civil Engineering, Middle East Technical University, Ankara, Turkey Kayhan AH, Senel SM (2010) ‘’Fragility Curves for Single Story Precast Industrial Buildings’’, Technical Journal of Turkish Chamber of Civil Engineers, Vol.21, No.4 (in Turkish) Kircher CA, Reitherman RK, Whitman RV, Arnold C (1997) ‘’Estimation of earthquake losses to buildings’’, Earthquake Spectra Volume 13, No. 4, pp 703-720, Earthquake Research Institute, Oakland, California Kircher CA, Nassar AA, Kustu O, Holmes WT (1997) ‘’Development of building damage functions for earthquake loss estimation’’, Earthquake Spectra Volume 13, No. 4, Earthquake Research Institute, Oakland, California RMS (2000) Event report, Kocaeli, Turkey Earthquake, http://www.rms.com/Publications/Turkey_Event.pdf. Steinbrugge KV (1982) Earthquake, Volcanoes, and Tsunamis: An Anatomy of Hazards, New York: Skandia America Group TCIP, Turkish Catastrophe Insurance Pool (2014), Tariffs and Premium, http://www.tcip.gov.tr/zorunlu-deprem- sigortasi-tarife-ve-primler.html Turkish Seismic Code (1998), Specifications for structures to be built in seismic areas, Ministry of Public Works and Settlement, Ankara (in Turkish) TSDC07, Turkish Seismic Code (2007), Specifications for structures to be built in seismic areas, Ministry of Public Works and Settlement, Ankara (in Turkish) Whitman RV, Anagos T, Kricher CA, Lagorio HJ, Lawson RS, Schneider P (1997) ‘’Development of a national earthquake loss estimation methodology’’, Earthquake Spectra Volume 13, No. 4, Earthquake Research Institute, Oakland, California Yao TPJ (1981) Probabilistic methods for the evaluation of seismic damage of existing structures, Purdue University, West Lafayette Yucemen MS (2005) ‘’Probabilistic assessment of earthquake insurance rates for Turkey’’, Springer Science, Natural Hazards 35: 291–313 Yucemen MS, Yilmaz C, Erdik M (2008) ‘’Probabilistic assessment of earthquake insurance rates for important structures: Application to Gumusova-Gerede Motorway’’, Elsevier Science, Structural Safety 30, 420-435


![A Comparative Study of the Bias Correction Methods for ... · 2020. 3. 2. · mum likelihood estimation method (PML) was originally developedbyDavidFirth[16]inordertoreducethesmall](https://img.pdfslide.us/doc/110x75/610a9b291203454e2e1a4c71/a-comparative-study-of-the-bias-correction-methods-for-2020-3-2-mum-likelihood.jpg)