Embed Size (px)
Citation preview

Impact of Returns on Supply Chain Coordination
Ana MurielDepartment of Mechanical and Industrial Engineering, University of Massachusetts
In collaboration with Rocio Ruiz-Benitez

Outline MotivationModelAnalysisComputational StudyConclusions
MotivationThe value of commercial product returns now exceeds $100 billion annually in the US (Stock, Speck and Shear (2002))
Commercial product returns: Products returned for any reason within 90 days of purchase.Hewlett Packard recently estimated the cost of consumer returns for North America exceeded 2% of their total outbound sales revenue.Returns ~ 6% of sales Reason % of returns
Defective 20%
Could not install
27.5%
Performance 40%
Convenience 12.5%Ferguson, Guide and Souza (2005)
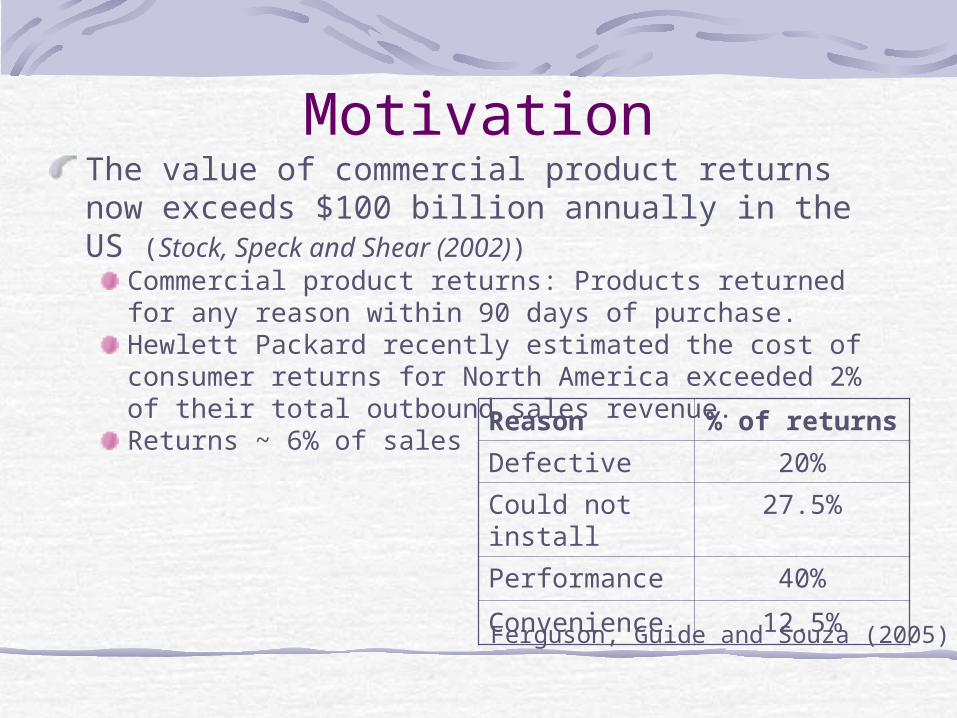
MotivationPolicy of most US retailers:
Full returns no question asked!!Return rates: 6% to 15% (Dekker and Van der Laan (2003))
Mail order companies and e-tailers: as high as 35%
Largely ignored in supply chain coordination and contracts literature
Most research on consumer returns concerns inventory policies, production planning and reverse logistics (Fleischmann and Kuik (2003), Kiesmuller (2003))

Literature ReviewWood (2001), “Remote Purchase Environments: The influence of Return Policy Leniency on Two-Stage Decision Processes”, Journal of Marketing Research 38, 157-169.Dekker and Van der Laan (2003), “Inventory control in reverse logistics”, chapter in Business Aspects of Closed-Loop Supply Chains, V.D. Guide Jr., L.N. Van Wassenhove, editors. Carnegie Mellon University Press, Pittsburgh, PAFleischmann M. and Kuik R. (2003), “On optimal inventory control with independent stochastic items returns”, European Journal of Operational Research 151, 25-37Kiesmuller, G.P. (2003), “Optimal control of a one product recovery system with leadtimes”, International journal of Production Economics 81-82, 333-340Ferguson, Guide and Souza (2005), “Supply Chain Coordination for False Failure Returns”, working paper. Georgia Institute of Technology.Souza, Guide, van Wassenhove and Blackburn (2005), “Time Value of Commercial Product Returns”, working paper. University of Maryland.
Research Questions:What is the profit impact of incorporating consumer returns in our decision models?
Centralized system
Decentralized system
How does it affect retail prices and quantities ordered?
How does this depend on the magnitude of logistics costs?
the relative share between retailer and manufacturer?
the proportion of product that is returned?
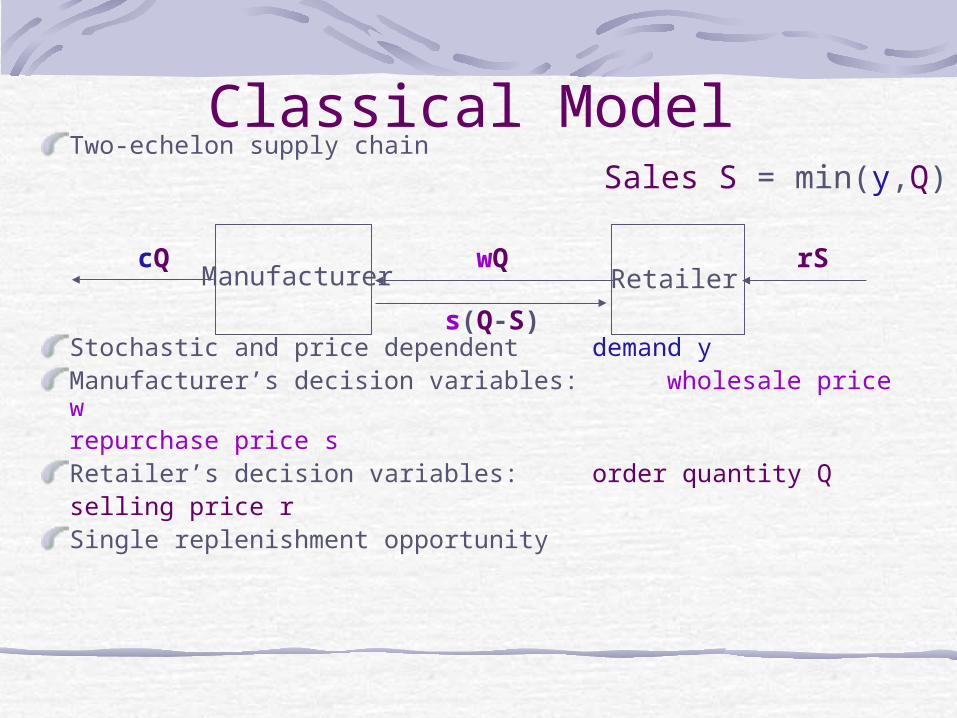
Classical ModelTwo-echelon supply chain
Stochastic and price dependent demand yManufacturer’s decision variables: wholesale price wrepurchase price sRetailer’s decision variables: order quantity Qselling price rSingle replenishment opportunity
Manufacturer RetailerrSwQcQ
Sales S = min(y,Q)
s(Q-S)
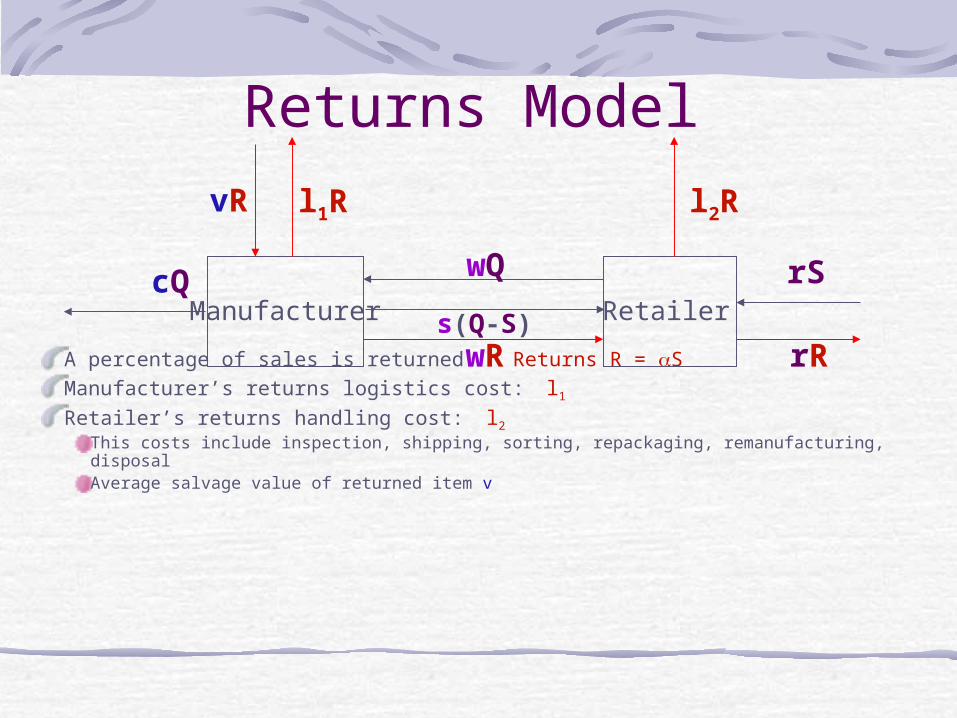
Returns Model
A percentage of sales is returned Returns R = SManufacturer’s returns logistics cost: l1Retailer’s returns handling cost: l2
This costs include inspection, shipping, sorting, repackaging, remanufacturing, disposal Average salvage value of returned item v
Manufacturer Retailer
rR
rSwQcQ
wR
l1R l2RvR
s(Q-S)
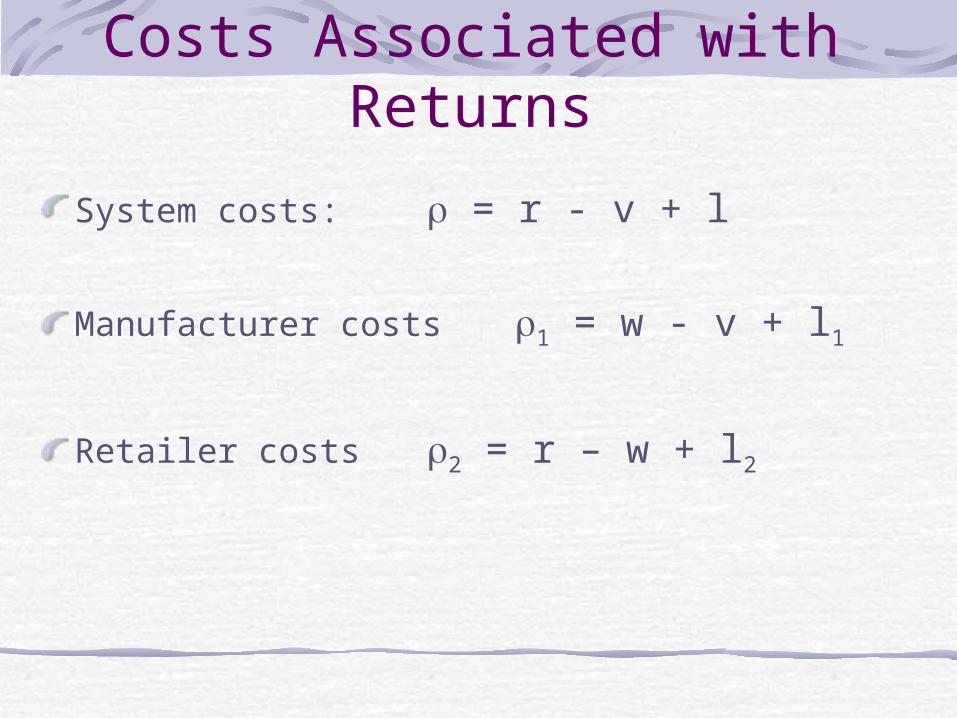
Costs Associated with Returns
System costs: = r - v + l
Manufacturer costs 1 = w - v + l1
Retailer costs 2 = r – w + l2
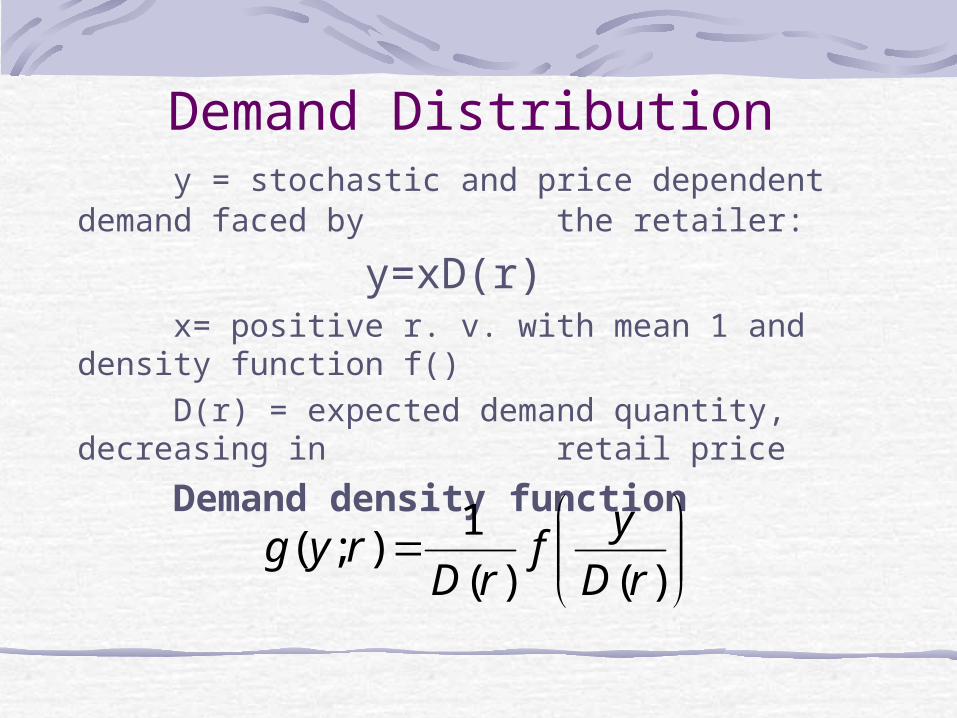
Demand Distributiony = stochastic and price dependent demand
faced by the retailer:
y=xD(r)
x= positive r. v. with mean 1 and density function f()
D(r) = expected demand quantity, decreasing in retail price
Demand density function
)()(
1);(
rD
yf
rDryg
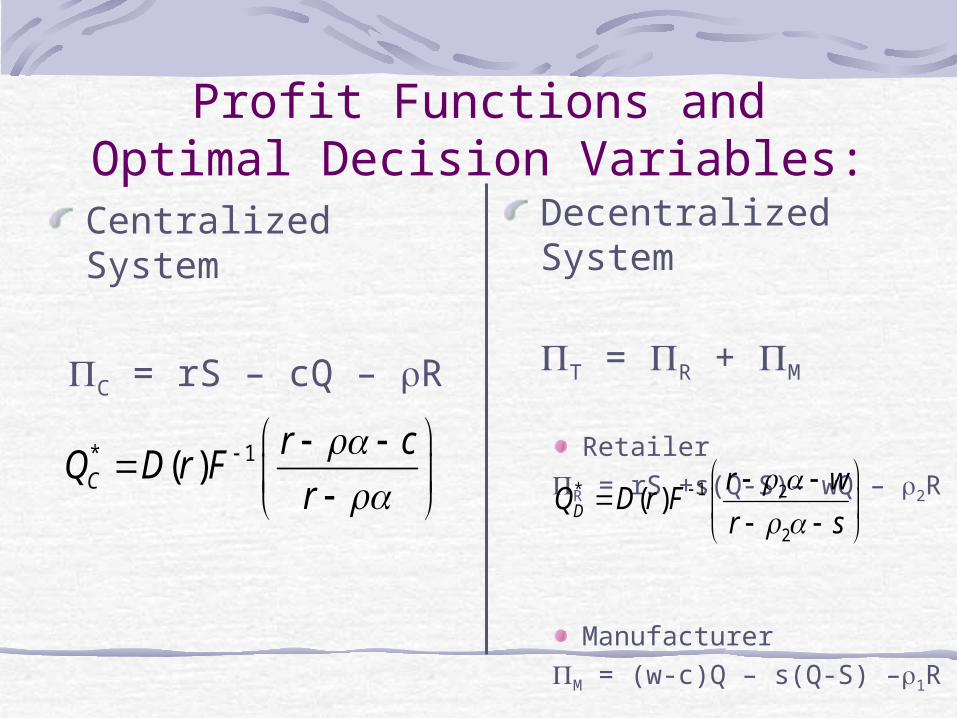
Profit Functions and Optimal Decision Variables:
Centralized System
C = rS – cQ – R
Decentralized System
T = R + M
RetailerR = rS +s(Q-S)– wQ – 2R
ManufacturerM = (w-c)Q – s(Q-S) –1R
* 1( )C
r cQ D r F
r
* 1 2
2
( )D
r wQ D r F
r s
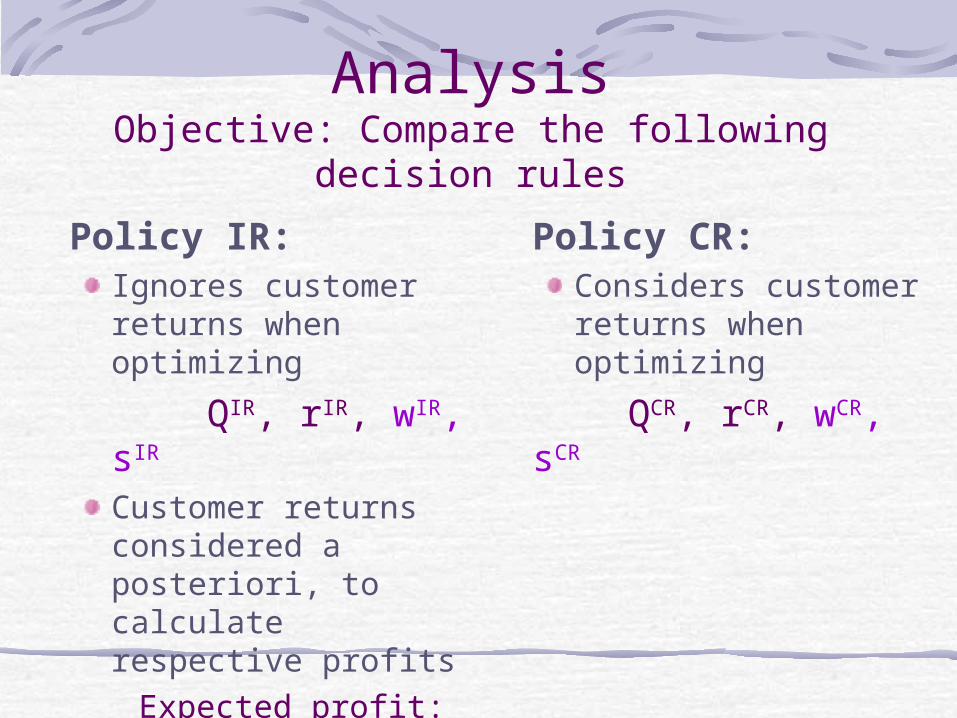
Policy IR: Ignores customer returns when optimizing
QIR, rIR, wIR, sIR
Customer returns considered a posteriori, to calculate respective profits
Expected profit: IR
Policy CR: Considers customer returns when optimizing
QCR, rCR, wCR, sCR
Expected profit: CR
AnalysisObjective: Compare the following decision
rules
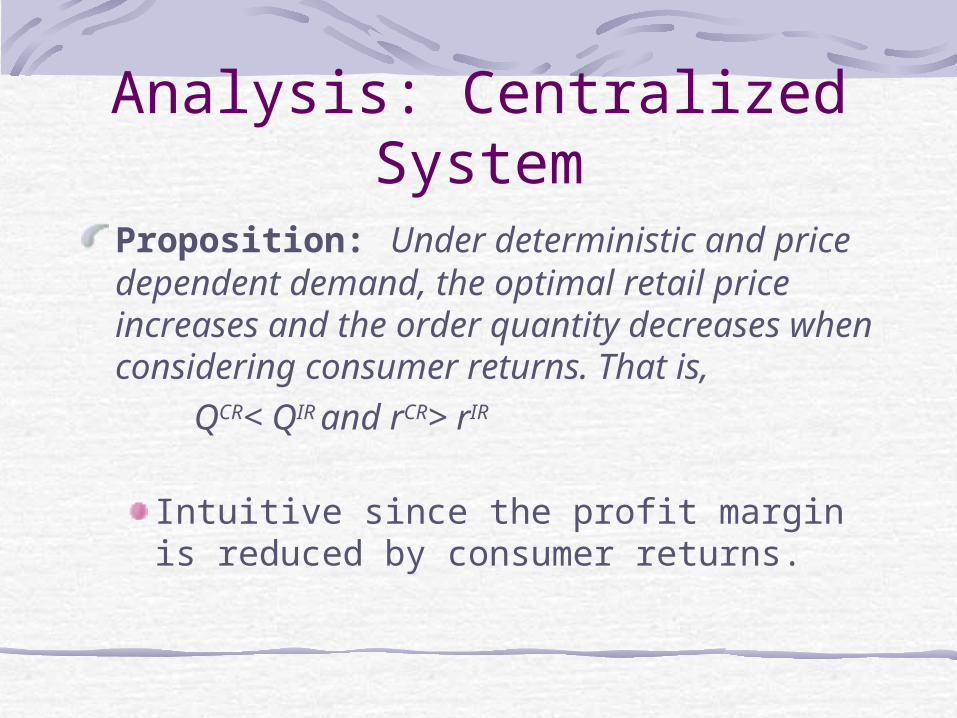
Analysis: Centralized System
Proposition: Under deterministic and price dependent demand, the optimal retail price increases and the order quantity decreases when considering consumer returns. That is,
QCR< QIR and rCR> rIR
Intuitive since the profit margin is reduced by consumer returns.
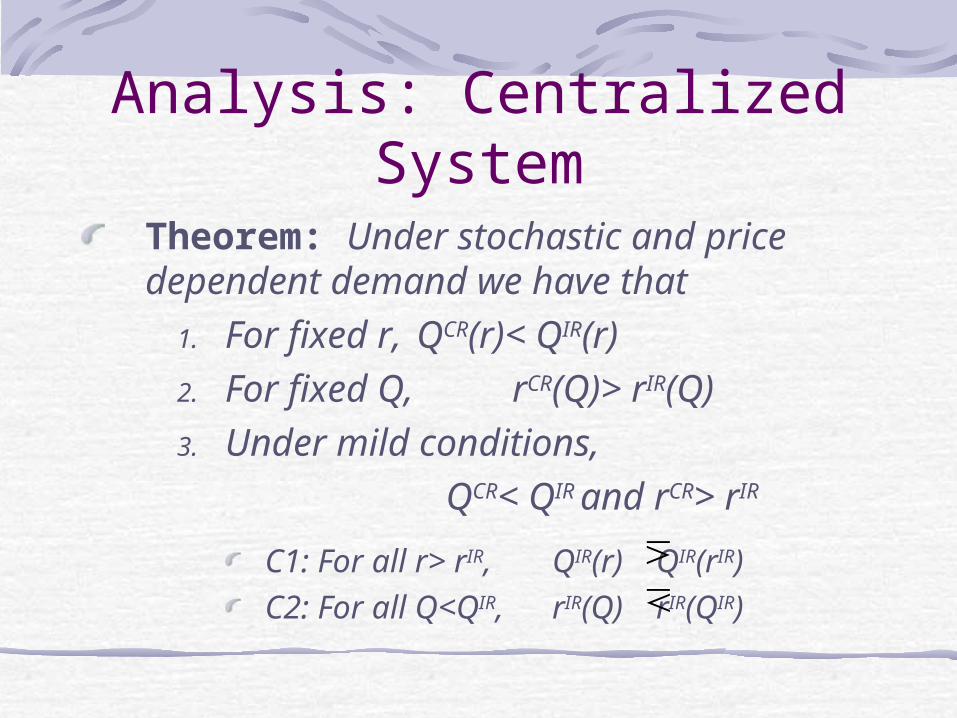
Analysis: Centralized System
Theorem: Under stochastic and price dependent demand we have that
1. For fixed r, QCR(r)< QIR(r)2. For fixed Q, rCR(Q)> rIR(Q)3. Under mild conditions,
QCR< QIR and rCR> rIR
C1: For all r> rIR, QIR(r) QIR(rIR)C2: For all Q<QIR, rIR(Q) rIR(QIR)
Analysis: Decentralized System
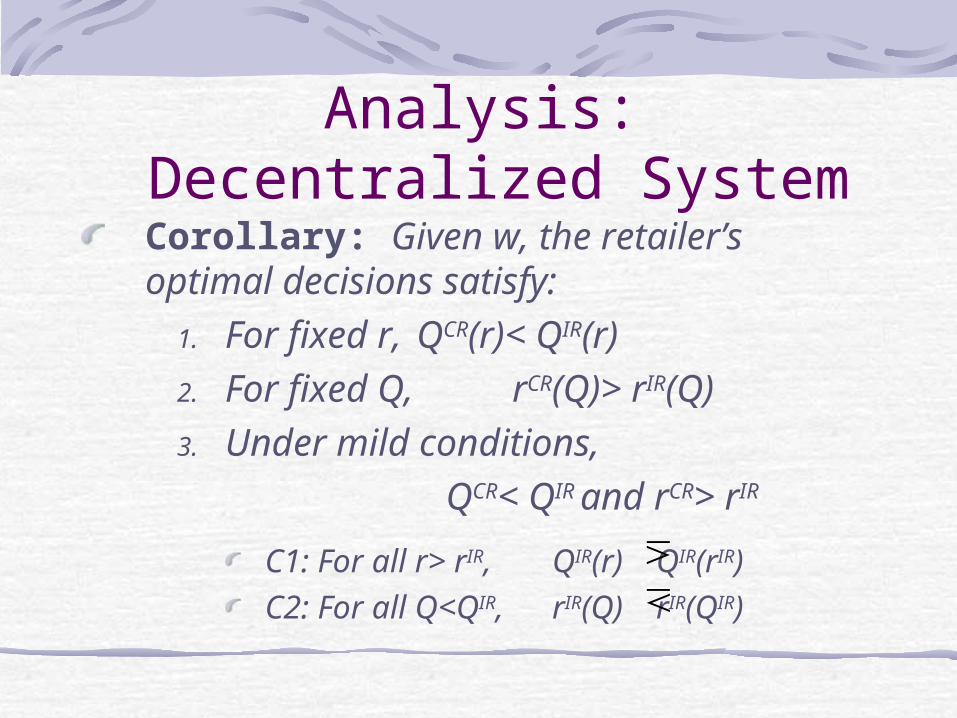
Corollary: Given w, the retailer’s optimal decisions satisfy:
1. For fixed r, QCR(r)< QIR(r)2. For fixed Q, rCR(Q)> rIR(Q)3. Under mild conditions,
QCR< QIR and rCR> rIR
C1: For all r> rIR, QIR(r) QIR(rIR)C2: For all Q<QIR, rIR(Q) rIR(QIR)

QuestionWill consumer returns always result in higher prices and lower quantities in a decentralized supply chain?
Analysis: System Coordination
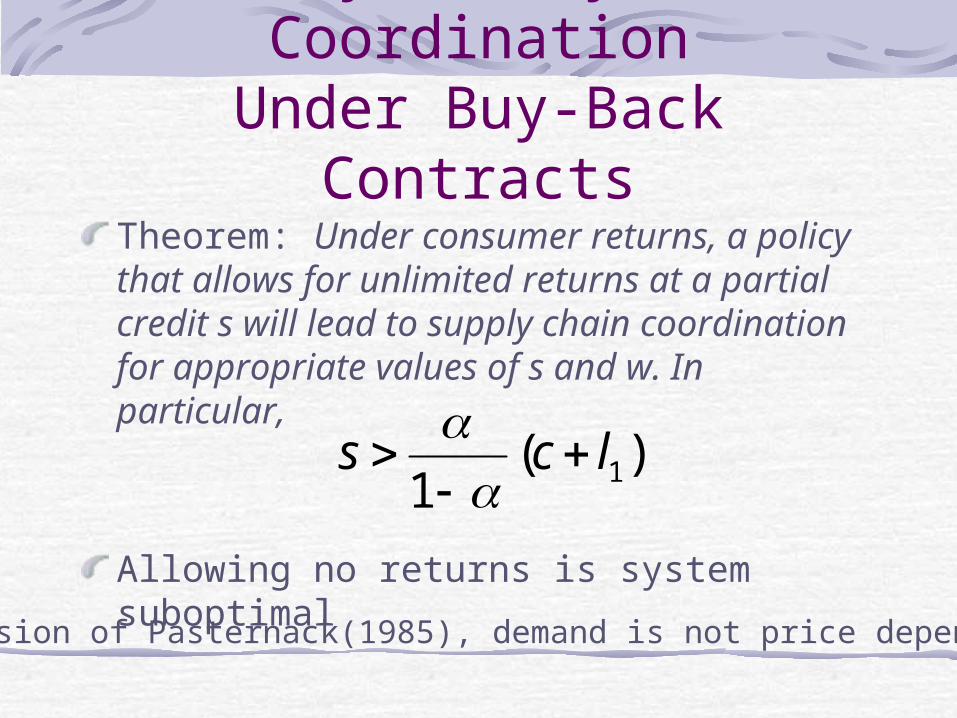
Under Buy-Back ContractsTheorem: Under consumer returns, a policy that allows for unlimited returns at a partial credit s will lead to supply chain coordination for appropriate values of s and w. In particular,
Allowing no returns is system suboptimalExtension of Pasternack(1985), demand is not price dependent
1( )1
s c l

Computational Study
Assumptions:f(x) ~ uniform distribution in [0,2]Linear demand model
D(r)=b(r-k)
where b<0 and k>0 constantsb=-3, k=5
(Emmons and Gilbert (1998))
Centralized System
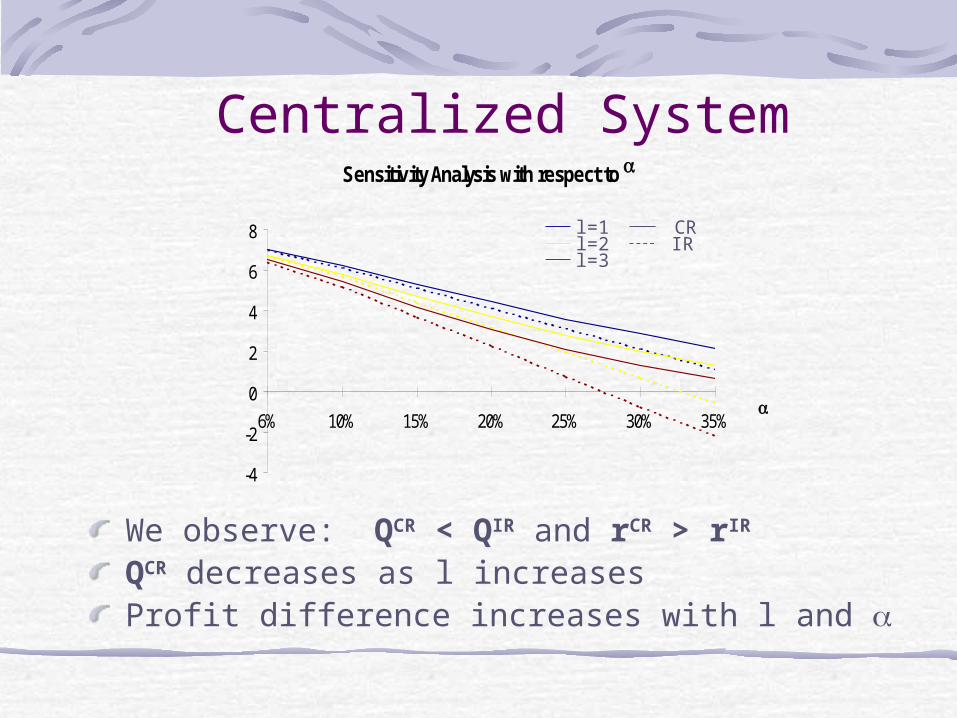
We observe: QCR < QIR and rCR > rIR
QCR decreases as l increasesProfit difference increases with l and
10% returns and l=1, the difference is 6.33% Percent improvement increases with and l
Sensitivity Analysis with respect to
-4
-2
0
2
4
6
8
6% 10% 15% 20% 25% 30% 35%
l=1l=2l=3
CRIR

Decentralized System
Profit functions
-4
-2
0
2
4
6
8
1 1.2 1.4 1.6 1.8 2 2.2 2.4 2.6 2.8 3 3.2 3.4 3.6 3.8 4 4.2 4.4 4.6 4.8
w
We observe:QCR < QIR
rCR > rIR
For fixed value of w,
RCR > R
IR
But for optimal w, R
IR > RCR
Optimal r and Q
012345678
1 1.4 1.8 2.2 2.6 3 3.4 3.8 4.2 4.6
w
Q*r*
CRIR
Manuf.Retail.Total
Profit Functions
0
1
2
3
4
5
6
6% 10% 15% 20% 25% 30% 35%
Retail.Total
Manuf.
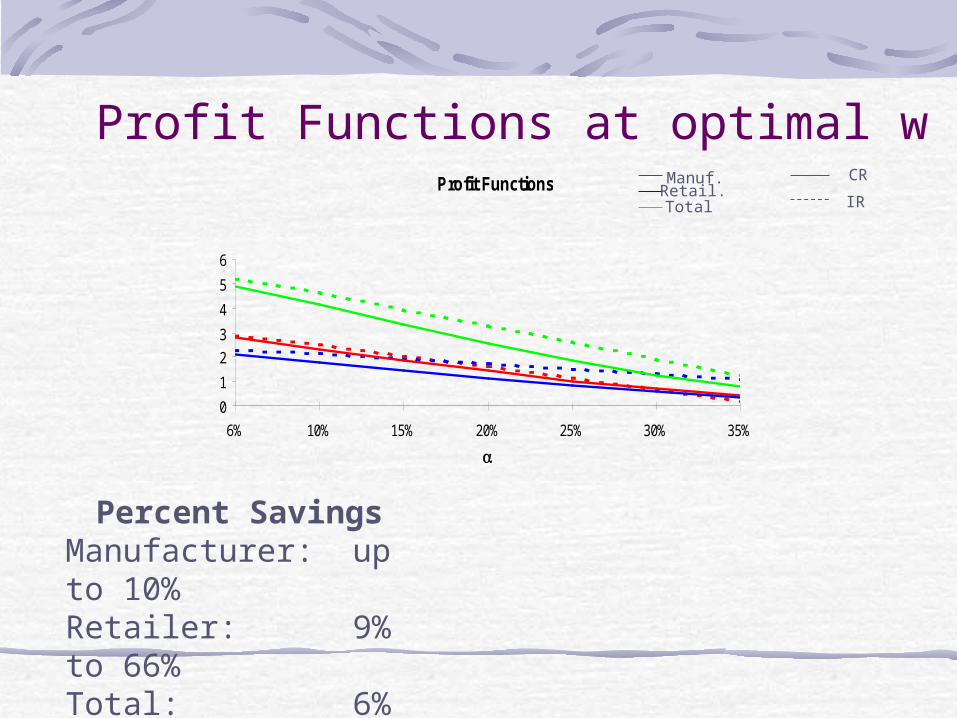
Profit Functions at optimal wCR
IR
Percent SavingsManufacturer: up to 10% Retailer: 9% to 66%Total: 6% to 37%
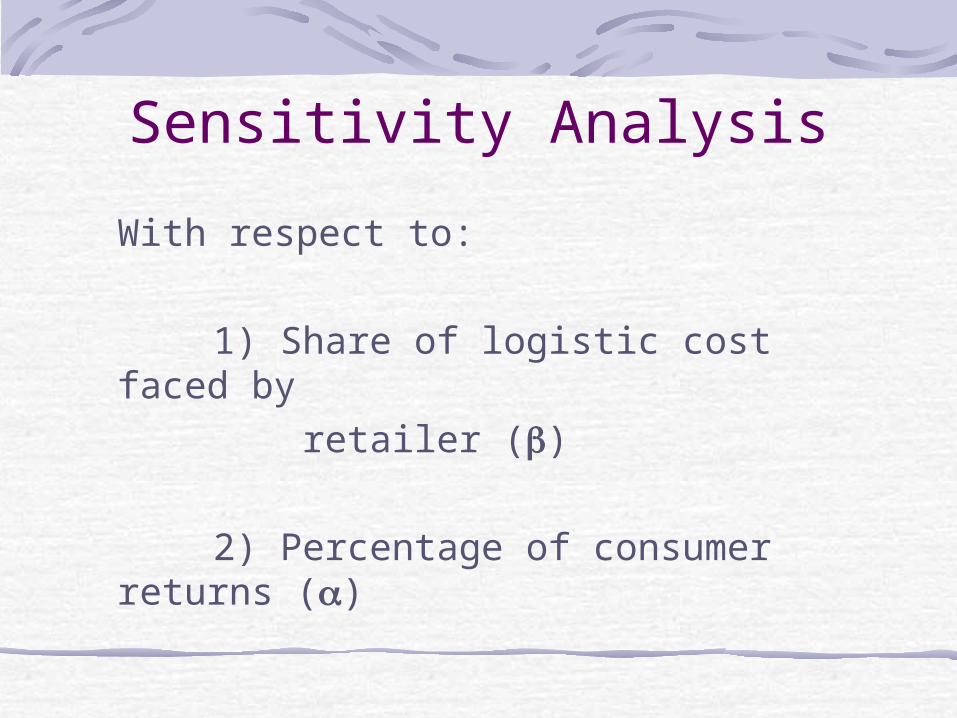
Sensitivity Analysis
With respect to:
1) Share of logistic cost faced by
retailer ()
2) Percentage of consumer returns ()
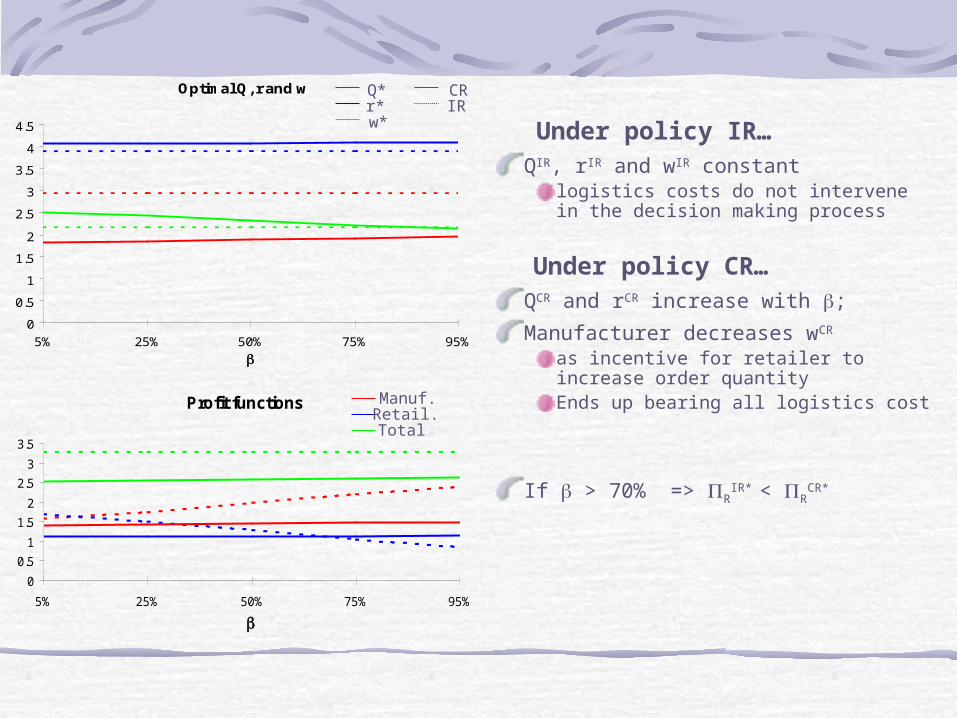
Under policy IR…QIR, rIR and wIR constant
logistics costs do not intervene in the decision making process
Under policy CR…QCR and rCR increase with ;
Manufacturer decreases wCR
as incentive for retailer to increase order quantityEnds up bearing all logistics cost
If > 70% => RIR* < R
CR*
Optimal Q, r and w
0
0.5
1
1.5
2
2.5
3
3.5
4
4.5
5% 25% 50% 75% 95%
Profit functions
0
0.5
1
1.5
2
2.5
3
3.5
5% 25% 50% 75% 95%
Q*r*w*
CRIR
Manuf.Retail.Total
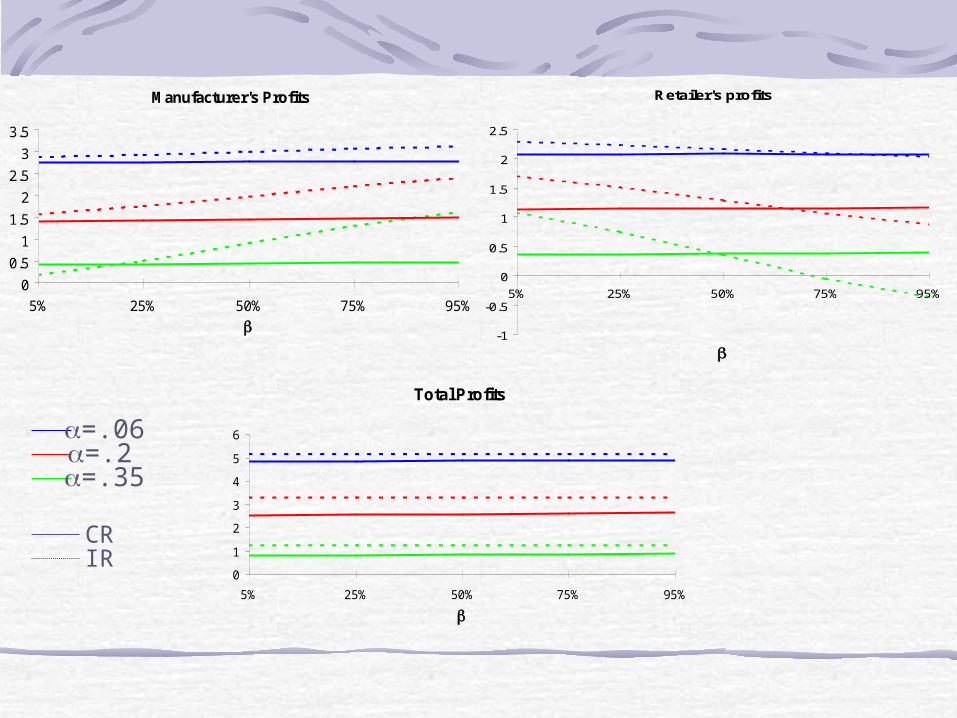
Manufacturer's Profits
0
0.5
1
1.5
2
2.5
3
3.5
5% 25% 50% 75% 95%
Retailer's profits
-1
-0.5
0
0.5
1
1.5
2
2.5
5% 25% 50% 75% 95%
Total Profits
0
1
2
3
4
5
6
5% 25% 50% 75% 95%
=.06=.2=.35
CRIR
ConclusionsWhen considering returns …
Centralized system:1) Lower quantities and higher retail prices2) Significant profit increase
Decentralized system:1) Lower quantities and higher retail prices
2) Poor coordination of the supply chainAll members worse off in generalIgnoring returns reduces double marginalization
3) The manufacturer bears the returns logistics costs: Higher percentage manufacturer decreases
incurred by retailer wholesale price to compensate